Presentation type:
BG – Biogeosciences

EGU26-12627 | ECS | Orals | MAL34-BG | BG Division Outstanding ECS Award Lecture

Flux exchange of a near-natural temperate deciduous forest under drought stress 

Anne Klosterhalfen

Understanding the exchange processes between terrestrial ecosystems and the atmosphere above is crucial for mitigating climate change and promoting ecosystem resilience. Over the past decade, I have investigated the land-atmosphere interactions with regard to energy, water vapor, and CO2 fluxes in various ecosystems, including forests, croplands, and grasslands, at different spatial and temporal scales. In this lecture, I will present recent results of a near-natural mixed-beech forest in the National Park Hainich in central Germany. Based on a comprehensive long-term dataset of eddy covariance flux observations, we conducted statistical time series analysis to investigate the exchange processes of this diverse, near-natural ecosystem. Furthermore, in collaborations with various partner institutions additional observations are being obtained at this flux study site, such as drone imagery, terrestrial laser scans, vegetation optical depth, forest biomass inventory, phenological photos, and on tree-scale records of stem growth, sapflow and leaf water potential. Using this multi-scale dataset, we aim to improve our understanding of the link between forest exchange processes and tree response dynamics, as well as the impact of extreme weather events (e.g., droughts).

The Hainich forest represents a large carbon sink prevailing throughout the past 26 years. However, the ongoing warming trend is altering the start and duration of the growing season of trees and the herbal layer. Tree vitality is being impacted by diseases and recent drought events such as in 2018-2020 have changed the forest’s processes and dynamics. We observed an increase in the canopy gap fraction in 2021 indicating a significant increase in tree mortality. Surviving trees were affected differently by the droughts depending on their species, age, and competition. In particular, the growth of older and larger trees (mostly ash), was impaired during and after the drought period, resulting in a reduction of the overall CO2 uptake strength of the forest ecosystem between 2018 and 2022. However, about half of the observed trees, mostly suppressed, vital beech trees, showed a positive growth trend during and after the drought period. The given structural diversity influences the responses and resilience of individual trees and the entire ecosystem. The comprehensive dataset further provides an opportunity to investigate the influence of climate and soil characteristics and of forest management on flux exchange processes within multi-site comparison studies.

How to cite: Klosterhalfen, A.: Flux exchange of a near-natural temperate deciduous forest under drought stress, EGU General Assembly 2026, Vienna, Austria, 3–8 May 2026, EGU26-12627, https://doi.org/10.5194/egusphere-egu26-12627, 2026.

EGU26-12722 | Orals | MAL34-BG | Vladimir Ivanovich Vernadsky Medal Lecture

Carbon Processing in the Land-to-Ocean Aquatic Continuum (LOAC): Challenges in the 21st Century 

Thomas Bianchi

Roughly 90% of the organic carbon (OC) buried in the global ocean is stored in muddy sediments along continental margins. Estuarine "hotspots" are especially important, with deltas accounting for about 40% of this burial and fjords for around 12%. To understand the sources and fate of OC in aquatic systems, researchers have widely applied molecular biomarkers and bulk geochemical proxies. In my work, I will explore the application of both bulk analytical techniques and molecular biomarkers to investigate how environmental changes across the land–to-ocean aquatic continuum (LOAC) are influencing OC burial and long-term carbon sequestration.  These muds produced by rock weathering play a critical role in the global carbon cycle by binding and shielding OC from degradation. The quantity and characteristics of OC stored in these muds influence the extent, duration, and mechanisms of carbon sequestration.

Human activities, including dam construction, levee building, and climate change, have profoundly reshaped patterns of mud accumulation and organic carbon (OC) storage across diverse environments. I demonstrate that climate warming has generally increased mud–OC fluxes through processes such as glacier melt, enhanced erosion, and dam-driven sediment burial, although these effects vary regionally. From 1950 to 2010, dams reduced global riverine sediment delivery to the oceans by approximately 49%, despite rising upstream sediment loads, trapping an estimated ~60 TgC yr⁻¹ of organic carbon. At the same time, global coastal wetlands experienced a net loss of about 4,000 km² between 1999 and 2019, yet they continue to sequester substantial amounts of carbon (up to ~60 TgC yr⁻¹). In the Arctic, warming has accelerated permafrost erosion, mobilizing roughly 14 TgC yr⁻¹. Together, these examples highlight the complex and often competing influences of human activity and climate change on river systems and the global carbon cycle, with coastal zones emerging as both highly vulnerable and critically important for carbon sequestration. However, whether these changes ultimately enhance or diminish long-term OC storage remains uncertain, given the complexity and variability of the processes and timescales involved.

How to cite: Bianchi, T.: Carbon Processing in the Land-to-Ocean Aquatic Continuum (LOAC): Challenges in the 21st Century, EGU General Assembly 2026, Vienna, Austria, 3–8 May 2026, EGU26-12722, https://doi.org/10.5194/egusphere-egu26-12722, 2026.

EGU26-257 | Posters virtual | VPS5

Long-term peatland ecological assessment in England’s largest national park (Lake District) for restoration under changing climates 

Matthew Adeleye, Helen Essell, Josephine Handley, and Alexis Arizpe

The Cumbrian Wildlife Trust (CWT) is undertaking the most ambitious attempt to revive Britain’s lost temperate rainforest in Skiddaw, northern Lake District, over the next 100 years. This involves the restoration of native Atlantic tree and treeless communities, including peatland in the area. There are ongoing ecological surveys to map the current vegetation and assess peatland status to establish baseline for detailed framework to restore degraded bogs. In collaboration with the CWT, this study employs different lines of palaeoecological evidence to investigate Skiddaw bog’s ecological history, the degree of its degradation over time, and the role of climatic and anthropogenic factors in shaping the landscape. This long-term perspective complements ongoing ecological appraisals by establishing a comprehensive baseline to predict changes in the bog and develop robust restoration and conservation frameworks against future warming climates.

How to cite: Adeleye, M., Essell, H., Handley, J., and Arizpe, A.: Long-term peatland ecological assessment in England’s largest national park (Lake District) for restoration under changing climates, EGU General Assembly 2026, Vienna, Austria, 3–8 May 2026, EGU26-257, https://doi.org/10.5194/egusphere-egu26-257, 2026.

EGU26-644 | ECS | Posters virtual | VPS5

Insights into global carbon cycling using bi-monthly measurements of triple oxygen isotopes in CO₂ from Cape Point 

Sangbaran Ghoshmaulik, Casper Labuschagne, and Vincent Hare

In recent years, the triple-oxygen isotopic composition (Δ′¹⁷O) of CO₂ has emerged as a powerful tracer of atmospheric carbon cycling. The Δ′¹⁷O signature of tropospheric CO₂ is controlled by key processes, including global biosphere-atmosphere CO₂ exchange, tropospheric residence times, and stratosphere-troposphere mixing, each of which modifies CO₂ composition through dynamic isotopic fractionation. High-precision measurement of Δ′¹⁷O is essential for constraining models that predict future changes in atmospheric CO₂, yet current datasets remain limited owing to extreme low abundance of ¹⁷O and the considerable analytical challenges involved for accurate and precise isotopic measurement. A further obstacle is the absence of a well-constrained global background Δ′¹⁷O value for atmospheric CO₂ that restricts proper evaluation of deviations arising from diverse source contributions. As a result, model predictions of tropospheric Δ′¹⁷O(CO₂) often diverge substantially from observational constraints.

To address this gap, we have initiated high-precision measurements of δ¹³C, δ¹⁸O, and Δ′¹⁷O in atmospheric CO₂ using TILDAS (Tunable Infrared Direct Laser Absorption Spectroscopy) at the Stable Light Isotope Laboratory in University of Cape Town, South Africa. Bi-monthly air samples have been collected at the Global Atmospheric Watch (GAW) Cape Point station, South Africa, since December 2024. Given the station’s location, sampling is preferentially conducted under south-easterly wind conditions to minimize local anthropogenic influence. CO₂ is extracted, purified, and analysed with a precision of ±10 ppm (1σ). We will present the Δ′¹⁷O record and evaluate its correspondence with existing predictive models. We will also discuss perturbation of local Δ′¹⁷O values by regional fluxes, such as anthropogenic inputs or seasonal biospheric exchange. This initiative aims to provide the first annual Δ′¹⁷O (CO₂) baseline from the Southern Hemisphere and improve the accuracy of predictive models of the carbon cycle.

How to cite: Ghoshmaulik, S., Labuschagne, C., and Hare, V.: Insights into global carbon cycling using bi-monthly measurements of triple oxygen isotopes in CO₂ from Cape Point, EGU General Assembly 2026, Vienna, Austria, 3–8 May 2026, EGU26-644, https://doi.org/10.5194/egusphere-egu26-644, 2026.

EGU26-1693 | Posters virtual | VPS5

Evaluating different methodological approaches for very high spatial resolution mapping of agricultural areas exploiting UAV data: a case study from Greek agricultural site 

Pileas Charisoulis, George P. Petropoulos, Spyridon E. Detsikas, Eleftheria Volianaki, and Antonis Litke

The rapid technological developments of recent years have enabled new methods for acquiring aerial photographs and high-spectral-resolution imagery. In this context, unmanned aerial vehicles (UAVs) offer significant potential for high-resolution Land Use/Land Cover (LULC) mapping, allowing clear distinction between natural and human-made features. UAV-based approaches provide high accuracy, faster data acquisition, and cost-effective solutions for detailed LULC analyses. However, there is a fertile ground in evaluating different methodological approaches and testing different algorithms for obtaining robust and transferable results. To this end, the present study aims at comparing two advanced classification techniques for mapping agricultural areas using multispectral UAV data over a typical agricultural site. The area selected for the study consists of crops and agricultural land located near the town of Amygdales, in the regional unit of Grevena. The two techniques are SVM (Support Vector Machines) and MLC (Maximum Likelihood Classification). In overall, results showed that the SVM proved to be more accurate with an overall accuracy of 79.45% compared to 78.91% for MLC, while both methods achieved a Kappa coefficient of 0.72. The statistical significance of the findings was further confirmed from the Mc-Nemar statistical significance results which were also computed. The results evidenced the capability of both methods obtaining LULC maps at very high spatial resolution. All in all, the methodological approach presented herein provides potentially a low-cost solution in mapping agricultural areas at very high spatial resolution which may be also fully transferable and reproducible to other locations too, which offer potentially important pathways to be used in precision agriculture applications. Such information can be of practical value to both farmers and decision-makers in reaching the most appropriate decisions for field management.

Keywords: Precision Agriculture, Mapping, UAVs, Classification, Machine Learning, Support Vector Machine, Maximum Likelihood


Acknowledgement

The participation of George P. Petropoulos study is financial supported by supported by the ACCELERATE MSCA SE program of the European Union’s Horizon research and innovation program under grant agreement No. 101182930.

How to cite: Charisoulis, P., Petropoulos, G. P., Detsikas, S. E., Volianaki, E., and Litke, A.: Evaluating different methodological approaches for very high spatial resolution mapping of agricultural areas exploiting UAV data: a case study from Greek agricultural site, EGU General Assembly 2026, Vienna, Austria, 3–8 May 2026, EGU26-1693, https://doi.org/10.5194/egusphere-egu26-1693, 2026.

 Resource Use Efficiency (RUE) serves as a critical indicator of forest ecosystem functionality, reflecting the efficiency of forests in utilizing light, water, and carbon for biomass production. This study investigates the spatiotemporal dynamics of RUE across 14 major Indian forest types from 2014 to 2023 by integrating Light Use Efficiency (LUE), Water Use Efficiency (WUE), and Carbon Use Efficiency (CUE) derived from MODIS satellite products. Using an eco-hydrogeological framework coupled with Random Forest modeling, the study evaluates the influence of climatic, topographic, and hydrological variables on forest productivity. Results reveal considerable spatial heterogeneity and temporal variation in RUE, with the highest efficiencies observed in wet evergreen and semi-evergreen forests and the lowest in dry deciduous and thorn forests. WUE demonstrated substantial variability across forest types and years, particularly impacted by the 2016 drought. CUE was strongly influenced by elevation (R2 = 0.82), and slope emerged as a limiting factor in drier ecosystems. The study highlights that subtropical pine and montane forests exhibit resilience and adaptive efficiency, while arid-zone forests remain vulnerable to climatic stressors. These findings provide actionable insights for sitespecific sustainable forest management and climate resilience planning in India’s diverse forest landscapes. 

How to cite: Raj, A. and Kumar, R.:  Resource Use Efficiency (RUE) Dynamics of Indian Forests Through an Eco-Hydrogeological Approach Using Machine Learning , EGU General Assembly 2026, Vienna, Austria, 3–8 May 2026, EGU26-2734, https://doi.org/10.5194/egusphere-egu26-2734, 2026.

EGU26-3062 | ECS | Posters virtual | VPS5

Synthesis of greenhouse gas emission factors for forest organic soils in the Dfb zone of the Köppen–Geiger climate classification 

Aldis Butlers, Arta Bārdule, Andis Lazdiņš, and Muhammad Kamil-Sardar

Organic soils, especially peat soils, store large amounts of carbon and are therefore considered a significant source of greenhouse gas (GHG) emissions, disproportionately contributing to land-use emission estimates in countries with extensive organic soil areas. When synthesising emission factors (EFs), data are typically stratified by broad climate zones such as temperate and boreal. However, given the spatial distribution of available forest-soil GHG data, such stratification is suboptimal. Temperate forest soils remain less studied than boreal soils, although recent research has expanded the number of temperate estimates from 8 used in the IPCC default EF compilation to at least 91, with the most recent flux data originating from the Baltic states (56 sites). When deriving EFs for specific applications, it is preferable to pool data from regions with similar climatic conditions rather than restricting analyses to unnecessarily small datasets defined by national borders or aggregating data across overly broad and climatically diverse zones.

We reassessed forest-soil GHG emissions in the Baltic states by supplementing regional data with additional sites sharing the same Dfb climate zone under the Köppen–Geiger climate classification. This approach expanded the dataset from 56 to 98 sites, improving EF accuracy and enhancing comparability between neighbouring GHG emission estimates, regardless of whether countries rely solely on domestic data. While such analyses typically focus on drained organic soils, we also included undrained soils to support the establishment of emission baselines for assessing forest management impacts.

Average annual organic-soil emissions in the Dfb climate zone  (mean ± SE, per hectare of forest) were estimated at 0.22 ± 0.18 t CO2-C, 1.17 ± 1.58 kg CH4, and 2.82 ± 0.59 kg N2O for drained soils, and −0.60 ± 0.37 t CO2-C, 92.88 ± 78.05 kg CH4, and 2.81 ± 1.07 kg N2O for undrained soils. Expressed as CO2 equivalents using AR5 GWPs, total emissions were 1.59 ± 0.46 t CO2 eq. for drained and 1.15 ± 6.70 t CO2 eq. for undrained soils. Owing to high natural variability between site-level fluxes, the effect of drainage on GHG emissions remains uncertain. Although the mean difference between drained and undrained soils (0.44 t CO2 eq.) may indicate a long-term drainage effect, this estimate is highly doubtful. The dataset indicated that simple averaging across all sites is not well suited to deriving EFs, as CO₂ emissions from drained organic soils showed dependence on nutrient status and linkage to dominant tree species and stand age. Drained soils in young stands tended to act as emission sources, whereas older stands increasingly functioned as carbon sinks, with a transition at approximately 25 years of stand age. However, additional observations are required to accurately quantify this dynamic across the forest growth cycle. To illustrate the implications for national upscaling, we derived a Latvia-specific drained organic-soil CO₂ EF that accounts for the distribution of dominant tree species and stand types characterising soil nutrient availability, yielding a weighted EF of 0.14 t CO2-C ha⁻1 yr⁻1.

This work was supported by PeatTransform with co-funding from the European Union and the State Budget of Latvia (6.1.1.2/1/25/A/001).

How to cite: Butlers, A., Bārdule, A., Lazdiņš, A., and Kamil-Sardar, M.: Synthesis of greenhouse gas emission factors for forest organic soils in the Dfb zone of the Köppen–Geiger climate classification, EGU General Assembly 2026, Vienna, Austria, 3–8 May 2026, EGU26-3062, https://doi.org/10.5194/egusphere-egu26-3062, 2026.

EGU26-3144 | Posters virtual | VPS5

Assessing the effect of different ground sampling distances for drone-based mapping of fractional cover: a case study from a vineyard field in Northern Greece  

Georgios-Nektarios Tselos, Spyridon E. Detsikas, George P. Petropoulos, Konstantinos Grigoriadis, Vassilios Polychronos, Elisavet-Maria Mamagiannou, Panagiota Balomenou, Dimitrios Ramnalis, and Petros Masouridis

Monitoring the fractional cover of vegetation and bare soil is essential for sustainable land management, soil erosion control, and precision agriculture. However, accurately estimating these fractions from conventional satellite imagery is challenging due to mixed ground cover and limitations such as cloud contamination and coarse spatiotemporal resolution. High-resolution UAV imagery provides an effective solution by capturing fine-scale heterogeneity, enabling the application of spectral mixture modeling techniques to decompose each pixel into proportions of vegetation, bare soil, and other components. Understanding how GSD influences the performance of such mixture models is critical for optimizing UAV-based monitoring strategies and ensuring reliable, quantitative estimates of soil and vegetation fractions for informed land management decisions.

The objective of this study is to evaluate the sensitivity of fractional vegetation estimates to different ground sampling distances (GSDs) derived from unmanned aerial vehicle (UAV) imagery. Multispectral data were acquired using a UAV equipped with RGB, near-infrared, red, and red-edge sensors, flown at altitudes of 40 m, 80 m, and 120 m above ground level. The study area is a heterogeneous vineyard located in Drama, Macedonia, northern Greece. Image acquisition took place on 30 July 2025, under stable atmospheric and illumination conditions.

An object-based image analysis (OBIA) approach was applied to the UAV imagery, and the data were classified into three main land cover classes: photosynthetic vegetation, non-photosynthetic vegetation, and bare soil. Fractional vegetation cover estimates derived at each flight altitude were compared in order to assess the influence of spatial resolution on classification performance and vegetation fraction retrieval. Validation of the classification results was performed using an independent dataset generated through direct photo interpretation, allowing for an objective assessment of accuracy across the different GSDs.

This contribution aims to evaluate the effects of different ground sampling distances (GSDs) on the estimation of fractional vegetation cover (FVC) using multispectral UAV imagery over commercial vineyards in Northern Greece. The study highlights the influence of spatial resolution on canopy representation, particularly in young or sparsely developed vineyards, and supports the development of robust UAV-based tools for precision viticulture

Keywords: UAV, Vineyard, Fractional Vegetation Cover , ACCELERATE

Acknowledgement: This study is supported by ACCELERATE research project which has received funding from the European Union’s Horizon  research and innovation program under grant agreement No.101182930.

How to cite: Tselos, G.-N., Detsikas, S. E., Petropoulos, G. P., Grigoriadis, K., Polychronos, V., Mamagiannou, E.-M., Balomenou, P., Ramnalis, D., and Masouridis, P.: Assessing the effect of different ground sampling distances for drone-based mapping of fractional cover: a case study from a vineyard field in Northern Greece , EGU General Assembly 2026, Vienna, Austria, 3–8 May 2026, EGU26-3144, https://doi.org/10.5194/egusphere-egu26-3144, 2026.

Bamboo expansion constitutes a significant process altering forest ecosystem structure and function. However, quantitative research remains scarce on how its long-term evolution influences the critical relationship between ecosystem productivity and biodiversity. This study aims to evaluate the long-term ecological effects of bamboo expansion in Wuyishan National Park (a biodiversity hotspot in China).

By analysing Landsat time-series imagery (1986–2020) and existing land cover dynamic classification maps, seven land cover types—including bamboo forests and broad-leaved forests—were identified. Analysis of surface classification results revealed an overall upward trend in bamboo forest area, with expansion primarily occurring at the expense of broad-leaved forests. Notably, 48% of the newly added bamboo forest area resulted from the conversion of broad-leaved forests.

To assess ecosystem responses to bamboo expansion, spectral diversity was quantified using Rao's Q index (functional diversity) and Shannon index (species diversity), calculated from NDVI and NDMVI. Ecosystem productivity was characterised via habitat indices (DHIs) derived from NDVI time series. Results indicate that regional ecosystem productivity has steadily increased, whereas spectral diversity has markedly declined, with both Rao's Q and Shannon indices showing significant downward trends. Specifically, bamboo forest patches exhibited higher Cumulative DHI (8.8 ± 0.65) than broadleaf forests, yet lower Rao's Q indices (0.010 ± 0.004), whereas broadleaf forests recorded (8.7 ± 0.69) and (0.011 ± 0.003), respectively. Moreover, farmland and tea plantations exhibited abnormally high Rao's Q values, likely attributable to fragmentation and edge effects (small patches embedded within forest backgrounds) rather than genuine species richness.

The study employed Theil–Sen trend estimation and Mann–Kendall significance testing to investigate correlations between bamboo forest area changes and biodiversity. Results revealed a significant negative correlation between bamboo forest expansion and spectral diversity indices (R²≈−0.36), suggesting bamboo encroachment may diminish biodiversity.

The observed trend of increasing productivity coupled with declining spectral diversity warrants further analysis to elucidate underlying drivers. Future research should integrate additional vegetation indices and morphological parameters for diversity calculations. Furthermore, long-term assessments of animal habitat suitability and ecosystem stability require combined ground-truthing and modelling approaches.

How to cite: Shi, W., Zhang, Q., and Qiu, F.: Bamboo Expansion Drives Divergence in Productivity and Spectral Diversity in Wuyishan National Park over Nearly Four Decades, EGU General Assembly 2026, Vienna, Austria, 3–8 May 2026, EGU26-3212, https://doi.org/10.5194/egusphere-egu26-3212, 2026.

Java Island is experiencing severe degradation of natural mangrove forests due to anthropogenic pressure, particularly in Probolinggo Regency. Although restoration programs have been widely implemented, the success rate remains very limited due to unsuitable planting technique and suboptimal species selection. This study provides the first baseline ecological assessment of vegetation status and estimation of carbon stock to support more effective restoration planning. Using a quantitative random sampling method, data on species identification, vegetation height, and diameter at breast height (DBH) were collected from 33 plots across eight sub-districts. Avicennia marina, Rhizophora mucronata, and Avicennia alba, are the dominant species with relative abundance varied by location. Saplings represented the most abundant growth stage, while trees exhibited the lowest abundance, indicating high past historical degradation. The westernmost sub-district exhibited the lowest Shannon–Wiener diversity index (H' = 0.9), suggesting higher anthropogenic pressures than others. Species richness, evenness, and dominance remain substantially varies across sub-districts. The total estimated carbon stock was 292 Mg C ha⁻¹, comparatively low for Indonesian mangroves ecosystems. The natural mangrove forests in Probolinggo Regency are in early-mid successional stage, reflecting strong past degradation. These findings highlight the urgency of restoration program to improve the total carbon stock across all sub-districts, particularly western areas, with careful consideration of site-species suitability. 

This research was conducted at the Warm-Temperate and Subtropical Forest Research Center, National Institute of Forest Science (Project No. FE-2022-04-2025).

How to cite: Qurani, C. G., Rizal, M., and Sugiana, I. P.: Baseline ecological insights of vegetation assessment and carbon stock estimation in natural mangrove forests of Probolinggo Regency, Indonesia, EGU General Assembly 2026, Vienna, Austria, 3–8 May 2026, EGU26-6317, https://doi.org/10.5194/egusphere-egu26-6317, 2026.

Stable carbon and nitrogen isotopes are widely applied to infer plant water-use efficiency and nutrient dynamics; however, their physiological interpretation remains uncertain when isotopic signals are not supported by functional measurements. Here, we combine elemental and isotopic analysis (EA-IRMS; δ¹³C, δ¹⁵N, %C, %N and C/N ratio) with fast chlorophyll a fluorescence assessed in vivo through the JIP-test (Handy-PEA) to resolve the physiological meaning of isotopic variability across two genotypes and three geographical contexts of typical Italian red chicory.
In December 2024, leaves and roots of two Cichorium intybus cultivars (“Rosso precoce di Chioggia” and “Rosso precoce di Treviso”) were sampled across three sites, resulting in four genotype–site combinations. Plants were collected at their areas of origin, as defined by Protected Geographical Indication (PGI, Chioggia and Treviso), and outside the PGI area in Massenzatica (Ferrara, Italy), where both cultivars are cultivated in a sandy coastal soil. Isotopic and elemental analyses revealed a pronounced site-dependent differentiation. Leaf and root δ¹³C values varied among sites, indicating substantial long-term differences in C discrimination, related to the balance between transpiration and CO₂ assimilation, which seemed more favourable in Chioggia. δ¹⁵N further discriminated sites and cultivars, highlighting marked differences in N dynamics and internal allocation, although without clear attribution to specific sources.
To assess whether isotopic shifts reflected adaptive regulation or functional impairment, chlorophyll fluorescence transients (OJIP) were analysed using JIP-test parameters. All samples exhibited the typical polyphasic OJIP pattern, yet clear differences emerged between cultivars and sites. Across the entire induction curve, the Treviso PGI transient were consistently higher at the J and I steps than the other samples. This pattern was associated with increased light absorption and energy dissipation per photosystem II reaction centre (ABS/RC, DI₀/RC), reduced electron transport efficiency (ET₀/RC), and lower probabilities of electron transfer to photosystem I end acceptors (ψ(RE₀), δ(RE₀)), indicating a tendency to over-reduce the electron transport chain, probably driven by downstream limitations in electron utilisation.
Overall, our results demonstrate that a more negative δ¹³C, while implicating a better water use efficiency, does not necessarily reflect an overall better plant adaptation, which could be affected by  some biochemical photosynthetic constraints. Integrating EA-IRMS with JIP-test fluorescence analysis provides a robust framework to discriminate between stomatal regulation and biochemical limitation, improving the mechanistic interpretation of isotopic markers for geographical fingerprinting and genotypic differentiation in climate-sensitive agroecosystems.


This research was allowed by phD fellowship granted by EUROPEAN SOCIAL FUND P L U S - The ESF+ 2021-2027
Programme of the Regione Emilia Romagna

How to cite: Martina, A., Ferroni, L., and Marrocchino, E.: From isotopic fingerprints to functional diagnosis in Italian red chicory: linking δ¹³C and δ¹⁵N to photosynthetic performance across geography and genotype, EGU General Assembly 2026, Vienna, Austria, 3–8 May 2026, EGU26-8969, https://doi.org/10.5194/egusphere-egu26-8969, 2026.

EGU26-11249 | ECS | Posters virtual | VPS5

How Soil Quality Affects Long-Term Rice Productivity 

Saheed Garnaik, Prasanna Kumar Samant, Mitali Mandal, Ravi H Wanjari, Nishant Kumar Sinha, Monoranjan Mohanty, and Narendra Kumar Lenka

Sustaining rice productivity in intensive rice-rice systems requires comprehensive soil management, with diagnosis of key soil physical, chemical, and biological indicators that need attention. In a 16-year long-term experiment (established in 2005-06 and ongoing) of the irrigated double rice system of Eastern India, we investigated the effect of key soil drivers on rice productivity.

The experiment assessed the effect of control (no N fertilizer application), imbalanced fertilization (N/NP/PK), balanced and recommended NPK and 150% NPK, NPK with lime, micronutrient additions (Zn with/without S or B), and integrated nutrient management with FYM (with/without lime), Composite surface soil samples (0-15cm) were collected after harvest of the 32nd rice season for evaluation of soil physical, chemical, and biological properties. Rice grain yield after the 32nd season was recorded at 14% grain moisture.  

To identify key soil drivers, an interpretable machine learning framework was used, specifically a conditional random forest-based yield model, permutation-based variable importance, and accumulated local effect (ALE) plots. The model described the yield variability very well (mean RMSE 305 kg ha-1, R2 0.88, MAE 254 kg ha-1). Variable importance screening highlighted total K, protease, and urease activities, as well as permanganate-oxidizable carbon (POC), as dominant predictors. ALE-based effect sizes suggested these properties accounted for ~400 (total K), ~250 (protease), ~200 (urease), and ~140 (POC) kg yield variability.

Overall, the results indicate that potassium dynamics are a primary constraint in intensive rice-rice systems, with risks associated with continuous K mining, and emphasize the importance of routine monitoring of biological activity indicators for long-term sustainability.

Keywords: Conditional random forest; Soil quality index (SQI); Long-term fertilizer application; K-dynamics; Soil enzymes; Cattle manure

How to cite: Garnaik, S., Samant, P. K., Mandal, M., Wanjari, R. H., Sinha, N. K., Mohanty, M., and Lenka, N. K.: How Soil Quality Affects Long-Term Rice Productivity, EGU General Assembly 2026, Vienna, Austria, 3–8 May 2026, EGU26-11249, https://doi.org/10.5194/egusphere-egu26-11249, 2026.

EGU26-12087 | ECS | Posters virtual | VPS5

Hyperparameter Sensitivity Analysis of Support Vector Machine for Crop Type Classification Using Sentinel-2 NDVI Time Series 

Fatima Ben zhair, Haytam Elyoussfi, Mouad Alami Machichi, Rahma Azamz, Jada El Kasri, Bouchra Boufous, and Salwa Belaqziz

Support Vector Machine (SVM) classifiers are widely used for satellite-based crop mapping, yet hyperparameter tuning is often treated as a black-box process, with limited insight into how individual parameters influence classification performance. This limitation becomes critical when deploying SVM models across heterogeneous agricultural landscapes, where robustness and transferability are required. This study systematically investigates the sensitivity of SVM hyperparameters for crop type discrimination using Sentinel-2 NDVI time series over the Al Haouz plain in central Morocco, a heterogeneous irrigated agricultural region comprising winter cereals and perennial orchards. An exhaustive grid search was conducted across multiple orders of magnitude for the regularization parameter C (0.01–1000) and the RBF kernel coefficient γ (0.001–10). Model performance was evaluated using F1-score, Recall, and Overall Accuracy for six crop classes with contrasting phenological patterns.

Results reveal a pronounced asymmetry in hyperparameter influence. The regularization parameter C exhibits a high degree of robustness: once a moderate threshold is reached (C ≥ 1), classification performance stabilizes and remains insensitive to further increases. In contrast, γ shows a narrow optimal range (0.1–1.0), beyond which performance rapidly deteriorates. High γ values induce overfitting, particularly among crops with similar seasonal dynamics, as evidenced by persistent confusion between citrus and olive classes. The optimal configuration (C = 1, γ = 1) achieved an F1-score of 0.80 and an Overall Accuracy of 81%. More importantly, sensitivity analysis demonstrates that γ plays a dominant role in model calibration. These findings provide practical guidance for deploying robust SVM classifiers in data-limited agricultural contexts, where extensive hyperparameter tuning is often impractical.

How to cite: Ben zhair, F., Elyoussfi, H., Alami Machichi, M., Azamz, R., El Kasri, J., Boufous, B., and Belaqziz, S.: Hyperparameter Sensitivity Analysis of Support Vector Machine for Crop Type Classification Using Sentinel-2 NDVI Time Series, EGU General Assembly 2026, Vienna, Austria, 3–8 May 2026, EGU26-12087, https://doi.org/10.5194/egusphere-egu26-12087, 2026.

EGU26-12306 | ECS | Posters virtual | VPS5

A computationally efficient framework for modelling estuarine biogeochemistry 

Sarangu Santhoshkumar, Giorgia Verri, Olga Vigiak, Milad Niroumand, Francesco Riminucci, Sonia Silvestri, and Lorenzo Mentaschi

Estuarine systems are crucial in deciphering coastal ocean dynamics and biogeochemistry, including the vital role they play as ecological sequesters of greenhouse gases. We present a modelling framework that combines the Estuary Box Model (EBM) with the Biogeochemical Flux Model (BFM) to simulate the interplay between physical dynamics and biogeochemical processes. The EBM is a robust, yet simplified model that represents estuarine hydrodynamics, addressing salinity, temperature, and freshwater discharge variations. The BFM simulates nutrient cycling, microbial interactions, phytoplankton dynamics, organic matter mineralization and particulate sedimentation across chemical functional families and living functional groups. To realistically simulate estuarine scenarios, the passive tracer transport equation was adapted to include explicit biogeochemical reaction terms within a time-varying estuarine simplified control volume, furthermore, accounting for riverine nutrient inputs, vertical mixing, tidal exchange and various biological feedback. Additional alterations were made to accommodate burial and sequestration parameters better representing estuarine zones.
The coupled framework was applied to the Po di Goro estuary in northern Italy, and the simulations were conducted for the period 2010 to 2023. The results were validated by comparing the Chlorophyll concentration outputs against satellite and in-situ buoy observations. The outcomes show a strong correlation between phytoplankton biomass and residence time during periods of algal blooms, whereas a rapid shift to zooplankton propelled top-down grazing control during prolonged periods of stable conditions. The model effectively replicates the organic matter sedimentation dynamics typical of deltaic environments, offering insights into the scale and factors controlling the burial and sequestration of organic matter in these ecosystems. The coupled EBM-BFM system is a highly computationally efficient and scalable framework for understanding the estuarine ecosystem drivers, with important potential applications in biogeochemical variability, nutrient retention, and climate-driven changes in coastal zones.

How to cite: Santhoshkumar, S., Verri, G., Vigiak, O., Niroumand, M., Riminucci, F., Silvestri, S., and Mentaschi, L.: A computationally efficient framework for modelling estuarine biogeochemistry, EGU General Assembly 2026, Vienna, Austria, 3–8 May 2026, EGU26-12306, https://doi.org/10.5194/egusphere-egu26-12306, 2026.

The European Environment Agency data on nitrates levels gives us a ratio of 8:1 for nitrates in groundwater versus river water, when we analyse the data across 27 countries. The “missing” nitrate, at an average of about 89%, matches the levels of “missing” nitrate due to capture of nitrate on the river bottom, by microbes known as diatoms, which take up 65-95% of the water nitrate load.

Diatoms convert nitrate to ammonium in daily cycles, that are linked to sunlight and Oxygen abundance, encountered in typical river and lake conditions.

We can identify that the major pathway of nitrate into rivers and lakes is through groundwater feeds, which average 25% of surface waterway volumes worldwide -because their nitrate levels dwarf those from any other source. We can also identify that the main mechanism of nitrates removal in river bottoms is diatom capture, where diatoms take up the bulk loads of nitrate arriving in the groundwaters beneath.

Diatoms' virtual monopoly on nitrates conversion may allow us to control N2O and global warming levels, by intercepting the conveyor belt system of nitrates to diatoms in waterways. We can capture and repurpose the nutrient for use as farm fertilizer and harvest diatom ammonium as a carrier for Hydrogen fuel. Diatoms are already farmed commercially for fish food, showing they are amenable to farming, and they are already a source of soil conditioner for farms. Ammonium is harvested in wastewater plants for Hydrogen fuel purposes already, and diatoms offer a low carbon method of ammonium production.

The junction between the UN, EEA and microbial data also allows us to calculate the world processing levels of nitrate in terms of both natural and human produced components. We obtain a range around 300,000 kilotons per annum as being processed by surface waters worldwide from all sources. About 120,000 kilotons of the load comes from human produced sources.

Ammonium nutrient from diatom nitrate conversion is quickly absorbed by aquatic plants and riverside trees, but there is a risk of high levels on hot days in lowered Oxygen conditions. Trees draw up around 1000 litres a day of groundwaters in river basins, so that ammonium and nitrates consumption by trees is additionally a main mechanism of Nitrogen reduction around the riverbed.

How to cite: Hall, C., Smith, D., Munro, A., and Sgroi, A.: Microbial breakthroughs in 2022 now allow us to link United Nations water volumes with EEA nitrates data, to reveal world nitrates processing loads in kilotons, including how much nitrate is from natural sources, and how much is from human activity., EGU General Assembly 2026, Vienna, Austria, 3–8 May 2026, EGU26-13318, https://doi.org/10.5194/egusphere-egu26-13318, 2026.

EGU26-13501 | ECS | Posters virtual | VPS5

Vegetation Dynamics and Atmospheric Glyoxal in Houston, Texas (2018-2022) 

Salma Bibi and Bernhard Rappenglück

Twenty years of MODIS satellite data (2002-2022), TROPOMI glyoxal observations (2018-2022), and ground-based isoprene measurements were used to examine vegetation greenness (NDVI) and atmospheric glyoxal over Houston, Texas. Biogenically produced glyoxal grew by 51% between 2018 and 2022, despite a 2% per decade decrease in summer vegetation greenness and continued urbanization. Ambient mixing ratios of isoprene, the main biogenic glyoxal precursor, paradoxically dropped by 14% within the same time frame. Temperature (+0.68°C/year), ozone (+28%), and photochemical oxidants all significantly increased over this time, according to analysis of concurrent environmental data. The results indicate that higher temperature-driven isoprene emissions (+35%) and accelerated photochemical oxidation (+10%) overcame the declining vegetation signal, resulting in net increases in atmospheric glyoxal. This suggests that Houston's remaining flora is experiencing temperature-driven changes in biogenic volatile organic compound (VOC) emissions per unit area, even while its greenness has reduced.

Keywords: MODIS NDVI; TROPOMI glyoxal; Isoprene emissions; Photochemical oxidation

How to cite: Bibi, S. and Rappenglück, B.: Vegetation Dynamics and Atmospheric Glyoxal in Houston, Texas (2018-2022), EGU General Assembly 2026, Vienna, Austria, 3–8 May 2026, EGU26-13501, https://doi.org/10.5194/egusphere-egu26-13501, 2026.

EGU26-13704 | ECS | Posters virtual | VPS5

Data-driven modelling to quantify soil organic carbon in burnt croplands: An integration of remote sensing and machine learning  

Jayantifull Hoojon, Mukund Narayanan, and Idhayachandhiran Ilampooranan

Stubble burning after harvest is known to degrade soil organic carbon (SOC). However, research on its long-term impacts on SOC is scarce and inconclusive. To address this gap, we introduce a data-driven modeling approach for SOC quantification by integrating remote sensing data with machine learning models to quantify changes in SOC during 2004-2021 across burnt rice areas in Punjab, India. This involved synthesizing literature to obtain SOC values pre- and post-burning, as well as intersecting MODIS burnt areas with rice crop maps to identify stubble burning areas in Punjab from 2004 to 2021. Post synthesis and identification, MODIS satellite band values were extracted for the synthesized experimental plots on pre- and post-burning dates. Further, remote sensing indices, which are sensitive to SOC changes such as NDVI, NBR, RECI, and BSI, were calculated for the pre- and post-burning dates. Using these indices and band values as predictors and literature-derived observed SOC values as response variables, multiple machine learning models were trained, whereby an R2 value of 0.3 was obtained. While further efforts are required to improve model accuracy, our study revealed a significant decline in SOC from 2004 to 2018, ranging from 0.1  to 12.5 %,  whereas from 2019 to 2021, SOC increased by 0.7 to 7 % in various districts in Punjab. More specifically, these districts-Sangrur, Ludhiana, and Kapurthala have had the most significant decline from 2014 to 2018, whereas Rupnagar, Patiala, and Fatehgarh Sahib exhibit the highest increase in SOC from 2019 to 2021. The decline in SOC could be attributed to accelerated mineralization driven by combustion and the loss of SOC in the form of CO2 emissions. Whereas the increase in SOC could be attributed to a reduction in stubble burning and incomplete combustion of residue, leading to the return of unburnt organic matter to the soil. These findings highlight the efficacy of integrating remote sensing frameworks with data-driven machine learning models in monitoring SOC and other aspects of soil health.

How to cite: Hoojon, J., Narayanan, M., and Ilampooranan, I.: Data-driven modelling to quantify soil organic carbon in burnt croplands: An integration of remote sensing and machine learning , EGU General Assembly 2026, Vienna, Austria, 3–8 May 2026, EGU26-13704, https://doi.org/10.5194/egusphere-egu26-13704, 2026.

EGU26-15468 | ECS | Posters virtual | VPS5

Biocrusts mediate seasonal warming effects of soil N transformation in drylands 

Rui Hu and Zhishan Zhang

Drylands are mostly covered by biocrusts and are sensitive to climate change, which will likely affect nitrogen (N) transformation. However, it remains unclear the response of N transformation-related variables (N transformation rates, microbial biomass, and enzyme activity) to warming in biocrust-dominated dryland ecosystems. Here, we examined three soil cover types (bare soil, cyanobacteria- and moss-dominated soil) over a full year as we conducted a warming treatment (open top chambers) in the Tengger Desert. In order to quantify the response of N transformation-related variables to warming, we defined the warming effects (WEs) as the increment of N transformation-related variable per-unit variation of temperature. Our results showed that the presence of biocrusts can significantly increase the WEs of soil N mineralization rates (Rmin), nitrification rates (Rnit), the content of microbial biomass carbon (MBC) and nitrogen (MBN), and the activities of soil nitrate reductase (S-NR) and urease (S-UE). Microbial biomass under biocrusts was more sensitive to warming followed by enzyme activity. Meanwhile, the WEs in spring and fall were higher than those in winter and summer. The cumulative rainfall was the driving factor affecting the seasonal change of WEs. Therefore, the defining and studying warming effects expand our understanding of seasonal dynamics of N transformation, microbial biomass and enzyme activity, and emphasize the important roles of biocrusts as modulators of N cycling under climate change in dryland ecosystems.

How to cite: Hu, R. and Zhang, Z.: Biocrusts mediate seasonal warming effects of soil N transformation in drylands, EGU General Assembly 2026, Vienna, Austria, 3–8 May 2026, EGU26-15468, https://doi.org/10.5194/egusphere-egu26-15468, 2026.

EGU26-15799 | ECS | Posters virtual | VPS5

Peri-urban heat amplification of monsoon drought impacts on grasslands in the Kathmandu Valley 

Prasanna Dahal and Suraj Lamichhane

Kathmandu has undergone significant urbanization over the past decade, resulting in consistently warmer peri-urban regions compared to nearby rural landscapes due to the urban heat island effect. This study examines how baseline warming interacts with monsoon droughts to affect grassland ecosystems.

Using the Kathmandu Valley as a case study, we analyzed monsoon-season (June–October) data from 2000 to 2022, comparing land surface temperature (LST) and Normalized Difference Vegetation Index (NDVI) from MODIS, volumetric soil moisture from ERA5-Land, and reference evapotranspiration (ET₀) from Terra-Climate between peri-urban and rural grasslands. Grasslands were considered instead of agricultural regions to avoid the effects from irrigation. The premises of Tribhuvan University were chosen as the peri-urban location for their closeness to the core-city region and Changunarayan (Bhaktapur) was chosen as a rural location. The Standardized Precipitation Index (SPI-3) was derived from historical precipitation records (1980–2020) and drought years were identified by negative monsoon-mean SPI values.

The results reveal a persistent peri-urban heat penalty throughout the study period. On average, peri-urban grasslands were 0.94°C warmer than their rural counterparts. This contrast increased to 1.15°C during non-drought years but narrowed to 0.5°C during drought years, as rural grasslands experienced sharper warming related to soil moisture depletion and reduced evaporative cooling. Despite the partial thermal convergence, the peri-urban zone experienced greater ecological stress during droughts, with NDVI declining by approximately 4% relative to rural areas as soil in peri-urban region are 1.12% drier during droughts compared to rural grasslands. An average potential evapotranspiration difference of 23.6 mm exists between the region, and during droughts, the evapotranspiration is 2.66% higher in peri-urban region.

These findings demonstrate that monsoon drought reduces spatial thermal contrasts but does not eliminate peri-urban vulnerability. Persistent background heating in peri-urban landscapes results in elevated vegetation stress even when meteorological drought conditions are similar. These results highlight the importance of peri-urban land management and thermal mitigation strategies in reducing ecological stress under increasing climate variability in rapidly growing cities.

How to cite: Dahal, P. and Lamichhane, S.: Peri-urban heat amplification of monsoon drought impacts on grasslands in the Kathmandu Valley, EGU General Assembly 2026, Vienna, Austria, 3–8 May 2026, EGU26-15799, https://doi.org/10.5194/egusphere-egu26-15799, 2026.

The intensive irrigation-linked groundwater abstraction in North China Plain (NCP) is dramatically affecting the hydrological processes and regional climate. Impacts from these anthropogenic groundwater withdrawals are evident in the fluctuation of each component in the terrestrial water cycle, the lack of groundwater sustainability, and regional climate extremes. Ensuring future groundwater security within this context will largely depend on how accurately the human activities in the Human-Earth system model were represented. However, to date, most hydrological models and land surface models either ignore the representation of human intervention or realistically model sophisticated human activity processes. In this study, we incorporated two groundwater-fed irrigation schemes in the Noah-MP model and further used realistic irrigation water use results constraining irrigation water withdrawals. We evaluate the influence of the groundwater pumping representation on the simulation of evapotranspiration and groundwater water table depth using Fluxnet-MTE ET data and observational groundwater well data, respectively. The Noah-MP simulation with groundwater-fed irrigation produced ET that matched the magnitude of observations-based Fluxnet-MTE ET values. Observational well-depth anomaly fluctuations can be reproduced in irrigated areas within the groundwater-fed simulation. In addition, the improvement of groundwater pumping also helps to improve terrestrial water storage estimates in higher resolution. We estimated that, over a seasonal cycle, groundwater-fed irrigation in the model can account for 80% of the declining terrestrial water storage trend from 2003 to 2016. Our approach and results reinforce the importance of parameterizing human activities in the Human-Earth system model and better address the water security challenges under climate change and human interventions.


How to cite: dai, D.: Modelling the groundwater pumping for agriculture in the Noah-MP model to support sustainable water management over the North China Plain, EGU General Assembly 2026, Vienna, Austria, 3–8 May 2026, EGU26-16034, https://doi.org/10.5194/egusphere-egu26-16034, 2026.

EGU26-16677 | ECS | Posters virtual | VPS5

Quantifying N₂O Pulses from Millet Croplands: The Role of Drought-Rewetting Cycles Observed via Remote Sensing and CMIP6 

Pranjal Aarav, Pramit Burman, Gopal Phartiyal, and Sangeeta Sharma

Soil-derived N₂O represents a critical climate feedback in semi-arid agriculture. With a global warming potential (GWP) 298 times greater than CO₂, 6.2 TgN₂O-N is emitted annually from agricultural soils. The atmospheric acceleration with a growth rate >1.0 nmol mol-1 y-1 remains unexplained by fertilizer use alone, suggesting climate change as a critical driver of enhanced emissions, particularly through extreme precipitation and droughts. Rajasthan’s 4.6 million hectares of climate-resilient millet cultivation experience intense droughts and severe monsoon variability. Both these factors lead to drought-rewetting cycles and impact N₂O emissions, which remain unquantified at regional scales.

This study integrates satellite-derived measurements coupled with multi-model ensemble projections to model N₂O emission hotspots in the millet croplands at the district level in this state, which is a major producer of millet in India. Published millet area datasets for spatial distribution and water-filled pore space (WFPS) thresholds (80 - 95%, for optimal denitrification) with soil moisture proxies (NDVI, LST) are integrated to quantify N₂O flux. Standard precipitation index from CMIP6 models (SSP2-4.5, SSP5-8.5) is applied to quantify temporal shifts in wet and dry frequencies. 

The results indicated that the denitrification-dominated pathways have dominated during rewetting phases, with N₂O peaks lagging behind soil moisture recovery by 48–72 hours, consistent with the Birch effect. Meta-analytical synthesis suggests rewetting pulses release 5 - 10 times higher N₂O flux than constant moisture conditions. CMIP6 scenarios project 20 - 35% intensification in drought frequency by 2050, driving 15 - 25% increases in cumulative annual N₂O emissions under high-emission scenarios. The regional assessment enables evidence-based fertilizer timing and supports India’s Nationally Determined Contributions (NDCs) by quantifying emissions, thereby paving the way for more effective mitigation strategies.

How to cite: Aarav, P., Burman, P., Phartiyal, G., and Sharma, S.: Quantifying N₂O Pulses from Millet Croplands: The Role of Drought-Rewetting Cycles Observed via Remote Sensing and CMIP6, EGU General Assembly 2026, Vienna, Austria, 3–8 May 2026, EGU26-16677, https://doi.org/10.5194/egusphere-egu26-16677, 2026.

EGU26-17076 | Posters virtual | VPS5

Apple Flowering Response to Climate Variability along the Himalayan Elevation Gradient 

Yash Shukla, Vivek Gupta, and Sushil Kumar Himanshu

Apple flowering in the Himalayan region depends on winter chill and spring heat, which are changing under a warming climate. These changes have increased uncertainty in flowering intensity and timing across different elevations. In this study, high-resolution UAV imagery and a YOLOv8-based segmentation model were utilized to map tree-level flowering intensity across three apple orchards situated along an elevation gradient in the northwestern Himalayas. The YOLO model was found to reliably detect flower clusters and showed strong agreement with manual counts, with an R² value of 0.85. This allowed consistent comparison of flowering intensity across sites. The winter chill was estimated using the Dynamic Model, expressed as chill portions derived from ERA5 Land hourly temperature data. Spring heat accumulation was quantified using growing degree days. Flowering varied clearly with elevation. Mid-hill orchards bloomed earlier and showed lower visible flowering during UAV surveys. Higher-elevation orchards bloomed later and exhibited higher flowering intensity. The winter chill was sufficient at all sites. Flowering responses were mainly controlled by the combined effects of chill and spring heat. The results demonstrate that integrating UAV-based deep learning with climate indices provides a practical framework to assess climate-driven changes in apple phenology in mountain environments. This approach can support climate risk assessment and adaptive orchard management in the face of continued warming.

How to cite: Shukla, Y., Gupta, V., and Himanshu, S. K.: Apple Flowering Response to Climate Variability along the Himalayan Elevation Gradient, EGU General Assembly 2026, Vienna, Austria, 3–8 May 2026, EGU26-17076, https://doi.org/10.5194/egusphere-egu26-17076, 2026.

EGU26-18092 | Posters virtual | VPS5

Linking soil texture and organic carbon to leaf chlorophyll fluorescence in Pyrus communis orchards: a multi-site study in Emilia-Romagna, Italy  

Marcello Bigoni, Elena Marrocchino, Irene Viola, Marzio Zaccarini, Andrea Farinelli, and Lorenzo Ferroni

Since 2011 in Italy the surface area cultivated with pear tree (Pyrus communis L.) decreased from 35,400 ha to approximately 23,700 ha in 2023, driven by escalating production costs, stagnant market prices, and recurrent phytopathological challenges. Additionally, this decline has been hypothesized to be causally linked to progressively unfavorable climatic conditions, characterized by rising temperatures, frequent summer heatwaves exceeding 35°C, and reduced precipitation. The objective of this study is to identify the most effective soil–plant relationships across Emilia-Romagna, which is the leading Italian region for pear production. We aim at providing a scientific basis for adaptive management strategies linked to regional pedoclimatic variability, so as to support the future of the Italian periculture.
Three experimental orchards were located in the provinces of Ferrara, Modena and Ravenna, which are key districts in Italy for periculture were set up in 2023. Agro-meteorological conditions were continuously monitored through an online automated system. Soil samples were thoroughly characterized with respect to their texture, calcium carbonate content, pH, loss on ignition LOI, multi-element profiling by X-ray fluorescence (XRF). To link soil properties with the plant performance, fast chlorophyll a fluorescence was measured in leaves in June 2025 on BA-29 grafted trees and the PItot (total performance index) was calculated, which represents a synthetic indicator of photosystem II efficiency.

Soils at the Modena site were predominantly sandy, deriving from Apennine sediments, whereas soils from Ferrara and Ravenna sites exhibited a higher clay content resulting in greater, water-holding capacity. XRF analyses indicate that elemental concentrations at all sites were within expected background levels. LOI and calcimetric analyses were higher in Ravenna soils compared to those from Ferrara and Modena, indicating a greater organic matter and carbonate content. At the Modena site, trees exhibited significantly lower PItot values than those observed in  Ferrara and Ravenna sites, This pattern is attributable to the higher sand fraction, which promotes rapid water drainage and reduced nutrient retention in contrast to clay-rich soils where enhanced water and nutrient availability can support improved photosynthetic performance performance. A relationship could also be envisaged found between soil organic carbon content and PItot. Because meteorological conditions were comparable and the germoplasm was uniform across the three sites, the observed differences in photosynthetic performance can be primarily ascribed to soil properties. These location-specific soil–plant correlations can inform precision agriculture practices, rootstock-scion selection, and adaptation strategies to enhance the resilience of pear orchards under changing climate conditions.


Research funded by the European Union – NextGenerationEU, Ministero dell’Università e della Ricerca - Piano Nazionale di Ripresa e Resilienza, D.M. 630/2024.


How to cite: Bigoni, M., Marrocchino, E., Viola, I., Zaccarini, M., Farinelli, A., and Ferroni, L.: Linking soil texture and organic carbon to leaf chlorophyll fluorescence in Pyrus communis orchards: a multi-site study in Emilia-Romagna, Italy , EGU General Assembly 2026, Vienna, Austria, 3–8 May 2026, EGU26-18092, https://doi.org/10.5194/egusphere-egu26-18092, 2026.

Understanding the interactions (synergies and trade-offs) among ecosystem services (ESs) and their driving factors is crucial for sustainable ecosystem management under intensifying climate change and anthropogenic disturbances. In recent years, machine learning approaches have demonstrated strong potential in capturing nonlinear relationships and exploring the driving mechanisms of ES interactions. However, most existing studies provide unified explanations at the global scale and often overlook the spatial heterogeneity and spatial dependence inherent in geographic locations, thereby limiting the ability to reveal the differentiated effects of the same driving factors on ES synergies and trade-offs across regions. This gap becomes particularly critical in large river basins, where pronounced environmental gradients, spatial connectivity, and heterogeneous human activities jointly drive strong spatial differentiation in ecosystem processes and services.

In this study, we develop a geospatially explainable machine learning framework to more explicitly characterize the spatial variability of ES interactions and their formation mechanisms in the Yangtze River Basin, China. Specifically, six key ESs, including food supply (FS), water yield (WY), water purification (WP), soil conservation (SC), carbon sequestration (CS), and habitat quality (HQ), were quantitatively assessed for the period from 2000 to 2023. Spearman correlation analysis and geographically weighted regression (GWR) were then employed to identify the ES relationships and their spatial distribution patterns. Furthermore, the GeoShapley method was introduced to incorporate geographic location into the model interpretation process, thereby enhancing the transparency and interpretability of machine learning decisions. From a spatial interaction perspective, this approach enables the analysis and visualization of the differentiated driving effects of climate conditions, topography, land use, and human activities on ES synergies and trade-offs across different spatial locations.

This study shows that the geospatially explainable framework enhances insights into the formation mechanisms of ES interactions and provides scientific support for implementing zoned ecosystem management and targeted regulation strategies under ongoing global environmental change.

How to cite: Jiang, C., Yao, Y., and Ma, L.: Ecosystem service interactions and their driving factors based on a geospatially explainable framework: A case study in the Yangtze River Basin, China, EGU General Assembly 2026, Vienna, Austria, 3–8 May 2026, EGU26-18238, https://doi.org/10.5194/egusphere-egu26-18238, 2026.

EGU26-18248 | ECS | Posters virtual | VPS5

Role of Water Balance Components in Regulating Vegetation Response to Drought  

Syed Bakhtawar Bilal and Vivek Gupta

Droughts across India exhibit variability arising from the complex interaction between atmospheric forcing and terrestrial hydrological processes. Although precipitation deficits are generally considered the primary trigger for drought, changes in terrestrial water storage dictate how drought evolves and recovers. It is therefore essential to understand how surplus and deficits in water balance governs not only the drought periods across different hydroclimatic zones of India but also the subsequent influence on vegetation health. In this study, we analyze how water balance components regulate vegetation by assessing the elasticity of vegetation to climatic and catchment storage variables. A dominant driver approach is used to evaluate whether vegetation response is mainly controlled by meteorological or terrestrial variability. Furthermore, we analyzed the influence of key drought attributes, including severity, duration, development and recovery speeds, on vegetation elasticity with respect to climate and catchment variables. The results show a shift from precipitation-dominated vegetation control during mild drought conditions to storage-driven regulation under extreme droughts. These findings highlight the role of subsurface water storage in buffering vegetation against severe drought stress across India. Overall, this analysis offers valuable insights into the processes controlling vegetation resilience and susceptibility, allowing for a more refined understanding of vegetation-catchment-climate interactions across diverse drought conditions.

How to cite: Bilal, S. B. and Gupta, V.: Role of Water Balance Components in Regulating Vegetation Response to Drought , EGU General Assembly 2026, Vienna, Austria, 3–8 May 2026, EGU26-18248, https://doi.org/10.5194/egusphere-egu26-18248, 2026.

EGU26-18930 | ECS | Posters virtual | VPS5

Improved Estimation of Gross Primary Productivity in Global Croplands Using a Transpiration-Based uWUE Model 

Sakshi Harde and Eswar Rajasekaran

Accurate estimation of gross primary productivity (GPP) in croplands is essential for quantifying terrestrial carbon uptake and understanding carbon–water coupling under increasing agricultural water stress. Conventional Light Use Efficiency (LUE) models typically rely on evaporative fraction (EF), derived from total evapotranspiration (ET), which does not distinguish between productive transpiration and non-productive evaporation. In contrast, transpiration-based framework explicitly represent the physiological coupling between carbon assimilation and water loss regulated by stomatal conductance. In this study, transpiration is estimated using a Leaf Area Index (LAI)-based approach driven by remotely sensed MODIS data and environmental variables within the underlying Water Use Efficiency (uWUE) framework.

We evaluate the transpiration-based uWUE model against an EF-based LUE model for GPP estimation using eddy covariance observations from 51 globally distributed cropland sites. The dataset includes 6 sites from India (Flux Tower and INCOMPASS networks), 3 sites from Japan (AsiaFlux), 9 sites from Europe, and 33 sites from the United States (FLUXNET), spanning a wide range of hydro-climatic and management conditions. Model performance was assessed using the coefficient of determination (R²), root mean square error (RMSE), and bias.

The transpiration-based uWUE model showed overall better agreement with observed GPP than the EF-based LUE model across the global set of crop sites. Improvements were evident in both the strength of the relationship with observations and the reduction of estimation errors. At the site level, uWUE more frequently achieved higher R² together with lower RMSE, demonstrating consistent performance across multiple evaluation metrics at a larger number of sites. Superior performance was observed at 28 sites, driven by the model’s ability to capture coupled carbon–water dynamics under varying crop types, canopy structures, and climatic conditions. In contrast, the EF-based LUE model showed advantages at a limited number of sites characterized by distinct water stress regimes or vegetation properties.

Overall, the results highlight the critical role of transpiration dynamics in GPP estimation, with higher GPP values associated with dense canopies and favorable environmental conditions. By explicitly isolating transpiration from total evapotranspiration, the uWUE framework provides a more physically meaningful representation of carbon–water interactions than ET-based approaches. These findings demonstrate that incorporating transpiration-based constraints improves GPP estimation in croplands and has important implications for large-scale agricultural carbon cycle assessments under future climate scenarios characterized by increased water stress and drought frequency.

How to cite: Harde, S. and Rajasekaran, E.: Improved Estimation of Gross Primary Productivity in Global Croplands Using a Transpiration-Based uWUE Model, EGU General Assembly 2026, Vienna, Austria, 3–8 May 2026, EGU26-18930, https://doi.org/10.5194/egusphere-egu26-18930, 2026.

EGU26-19408 | Posters virtual | VPS5

Enhancing carbon sequestration in water stressed plant–soil systems through soil amendment with a Superabsorbent Nanocomposite derived from natural materials 

Maria Guarda Reyes, Marcela Calabi Floody, Philippe Biron, Manuel Salvidar, Maria de la Luz Mora, and Cornelia Rumpel

Climate change and intensifying droughts represent a critical challenge to agricultural productivity and soil sustainability. This study evaluated the effect of two superabsorbent amendments with contrasting chemical compositions (polyacrylate-based polymer and a biodegradable polysaccharide nanocomposite) on carbon dynamics in common beans grown under drought conditions. The experimental design included analyses of morphological parameters, elemental composition, 13C allocation, and soil density fractionation. The results showed that drought drastically reduced biomass and nitrogen in leaves and roots, increased C:N ratios, and decreased root-derived carbon (RDC) incorporation, especially in stable soil fractions. The application of superabsorbents reversed these effects, increasing 13C translocation to roots and RDC in soil. NSN stood out for its ability to increase total RDC compared to the drought control parallelling the irrigated control in the heavy fraction associated with minerals, a key indicator of stable carbon sequestration. In contrast, Com mainly promoted flow to labile fractions, with less impact on stabilisation. These findings demonstrate that superabsorbents might be an effective tool for sustaining crop productivity and strengthening carbon sequestration in agroecosystems under conditions of increasing aridity.

How to cite: Guarda Reyes, M., Calabi Floody, M., Biron, P., Salvidar, M., Mora, M. D. L. L., and Rumpel, C.: Enhancing carbon sequestration in water stressed plant–soil systems through soil amendment with a Superabsorbent Nanocomposite derived from natural materials, EGU General Assembly 2026, Vienna, Austria, 3–8 May 2026, EGU26-19408, https://doi.org/10.5194/egusphere-egu26-19408, 2026.

EGU26-20818 | ECS | Posters virtual | VPS5

Agreement measures for continuous, ratio-scale data: cJaccard, cPrecision, cRecall and cF-score 

Katarzyna Krasnodębska, Wojciech Goch, Johannes H. Uhl, Judith A. Verstegen, and Martino Pesaresi

Continuous, spatially explicit estimates of environmental attributes are increasingly provided as gridded data. The accuracy of gridded data, including classifications derived from remotely-sensed data, is typically evaluated using measures based on confusion matrices with site-specific class allocations; however, these measures are defined for categorical variables and are therefore not applicable to ratio-scale attribute estimates representing quantities, such as canopy height or population abundance.

We present an approach that extends commonly used agreement measures, i.e. the Jaccard index, Precision, Recall, and F-score, to non-negative, continuous ratio-scale attributes. The extended measures (cJaccard, cPrecision, cRecall, and cF-score) are viable equivalents to their binary counterparts, invariant to data imbalance and suitable for evaluating the agreement of various types of data representing ratio-scale attribute estimates. The cJaccard measure has proven useful for a range of applications in the geospatial domain, illustrating the broader potential of these measures for evaluating large-scale environmental gridded data products and beyond.

The aim of this contribution is to showcase and discuss the practical application of these continuous agreement measures to real-world gridded datasets representing spatial-environmental variables. Through applied examples, we demonstrate how cPrecision and cRecall enable a directional interpretation of disagreement, disentangling commission and omission errors in the total proportion of misallocated magnitudes. We further illustrate how cJaccard provides a bounded, scale-independent measure of agreement that complements typically used error-based measures (such as Mean Absolute Error or Root Mean Square Error) in the data comparison process.

How to cite: Krasnodębska, K., Goch, W., Uhl, J. H., Verstegen, J. A., and Pesaresi, M.: Agreement measures for continuous, ratio-scale data: cJaccard, cPrecision, cRecall and cF-score, EGU General Assembly 2026, Vienna, Austria, 3–8 May 2026, EGU26-20818, https://doi.org/10.5194/egusphere-egu26-20818, 2026.

Cropland abandonment is a key land-use change process within the human-environment system, shaped by diverse environmental and socio-economic determinants. However, many studies overlook the complex interrelationships among these determinants, which may result in the reconfiguration of agricultural landscapes. Here, we developed an analytic framework based on social-ecological system theory to map cropland abandonment archetypes in Sichuan Province, Southwest China, using a combination of biophysical conditions, proximity characteristics, socio-economic determinants, and the extent, cumulative proportion, and spatial configuration of abandoned croplands. We implemented self-organizing feature maps using a nested clustering approach, which resulted in 25 sub-archetypes and 6 meta-archetypes. We used random forest regressions to quantify the relative importance of explanatory determinants influencing archetype geographies. Our results revealed diverse cropland abandonment archetypes, with meta-archetype area shares ranging from 4.4 % to 48.4 %. The most widespread archetype was characterized by favorable terrain, low cropland per capita, and low cumulative proportions of abandonment. Determinants of meta-archetypes varied in their importance but consistently highlighted the role of environmental determinants (i.e., topography, temperature), as well as productivity-related and socio-economic determinants (i.e., employee wages, pension insurance, high-value crops) as the most important determinants. Our findings argue against one-size-fits-all solutions and are highly relevant to nuance existing regional land-use policies addressing cropland abandonment. They further allow targeting key determinants of cropland abandonment and considering regional and local socio-ecological contexts in decision-making processes.

How to cite: Hong, C.: Revealing nested archetypes of cropland abandonment based on social-ecological system theory, EGU General Assembly 2026, Vienna, Austria, 3–8 May 2026, EGU26-21572, https://doi.org/10.5194/egusphere-egu26-21572, 2026.

EGU26-21818 | ECS | Posters virtual | VPS5

Deciphering Olive Yield Determinants under Contrasting Water Regimes: A Multi-Site Machine Learning Approach in Morocco Agro-Ecosystems 

Rahma Azamz, Haytam Elyoussfi, Fatima Benzhair, Raouaa El Mousadik, and Salwa Belaqziz

Improving olive yield in Moroccan agro-ecosystems requires a better understanding of the interactions between water availability, soil properties, and management practices. The complexity and non-linear nature of these interactions limit the effectiveness of conventional analytical approaches. This study applies machine learning methods to predict olive yield and to assess how the importance of yield determinants varies under contrasting water regimes. A multi-site dataset from Moroccan olive groves, including more than 2,000 observations, was analyzed. Machine learning models showed high predictive accuracy across water regimes. Under rainfed conditions, CatBoost achieved the best performance (R² = 0.845), indicating that yield variability is mainly driven by soil properties and spatial context. Under irrigated conditions, XGBoost provided the highest accuracy (R² = 0.855), highlighting the increasing role of management practices such as planting density and nitrogen fertilization. Under intensive irrigation, fruit-related variables, particularly 100-fruit weight, became the dominant predictors, while the influence of edaphic constraints decreased.

Overall, the results demonstrate that irrigation does not simply increase olive yield but fundamentally alters the hierarchy of factors controlling production. These findings emphasize the need for data-driven, site-specific management strategies to enhance the sustainability and efficiency of olive production in Morocco.

How to cite: Azamz, R., Elyoussfi, H., Benzhair, F., El Mousadik, R., and Belaqziz, S.: Deciphering Olive Yield Determinants under Contrasting Water Regimes: A Multi-Site Machine Learning Approach in Morocco Agro-Ecosystems, EGU General Assembly 2026, Vienna, Austria, 3–8 May 2026, EGU26-21818, https://doi.org/10.5194/egusphere-egu26-21818, 2026.

EGU26-21910 | Posters virtual | VPS5

Performance and optimisation strategy of a multispectral sensor as part of a newly developed low-cost IoT device for forest monitoring (RemoTrees - beta) 

Laura Mihai, Cristina Toma, Razvan Mihalcea, Karolina Sakowska, Loris Vescovo, Luca Belelli Marchesini, Valerio Coppola, and Riccardo Valentini

A new low-cost device based on Internet-of-Things (IoT) communication has been developed within the RemoTrees project to monitor climate-change effects in remote forest ecosystems. One of the key component of this device, referred to as the RemoTrees - beta, is a multispectral chipset composed of four sensors (three AS7265X and one AS7341), providing 26 spectral channels covering the range 410–940 nm. The chipset is equipped with a 1-inch diffuser designed to collect hemispherical solar radiation over incidence angles θ ∈ [−90°, +90°], with an angular response close to the cosine law. Here we present laboratory characterisation and calibration results obtained for 15 replicate RemoTrees - beta units. The spectral performance was highly consistent across devices, with central-wavelength variations below ~2 nm. Full width at half maximum (FWHM) values ranged from 19.17 to 47.93 nm, with standard deviations between 0.32 and 1.74 nm and a maximum relative expanded uncertainty of 0.90%. Because the devices will operate under highly variable illumination conditions (time of day, season, latitude, altitude, cloudiness, and canopy cover), optimisation of integration time (IT) and gain (G) is essential to avoid low digital-number (DN) values and insufficient use of the sensor dynamic range. As commonly applied in field spectrometry, automated IT/G optimisation and scan averaging are recommended to maximise signal-to-noise ratio (SNR) and minimise measurement uncertainty. When IT settings alone are insufficient to reach a satisfactory fraction of the dynamic range (≈65 000 DN; target ≥50%), summing of consecutive readings can be used to effectively increase the integration time while limiting saturation risks under rapidly changing sub-canopy light conditions. Radiometric sensitivity was evaluated by varying G and IT. Under optimised settings, SNR values up to ~5000 were achieved. For AS7265X sensors, gains G > 16 combined with IT optimisation increased SNR by up to ~4×, while for AS7341 gains G > 2 with IT optimisation yielded improvements up to ~5×. Detector nonlinearity contributes an expanded uncertainty of up to ±2.98% (k = 2) if uncorrected, which decreases to ≤±1.24% when nonlinearity correction is applied. The calibration coefficients derived from the tested devices showed moderate inter-device variability, with a maximum variation of approximately 10% for each spectral band. The RemoTrees - beta light sensor demonstrates stable spectral performance, high achievable SNR, and manageable inter-device variability, supporting its suitability for large-scale deployment in forest monitoring networks. Proper optimisation of integration time, gain, and signal averaging is essential to fully exploit the sensor dynamic range and minimise uncertainties under highly variable illumination conditions. Ongoing field deployment will further validate these strategies and refine operational protocols for long-term climate monitoring applications.

How to cite: Mihai, L., Toma, C., Mihalcea, R., Sakowska, K., Vescovo, L., Belelli Marchesini, L., Coppola, V., and Valentini, R.: Performance and optimisation strategy of a multispectral sensor as part of a newly developed low-cost IoT device for forest monitoring (RemoTrees - beta), EGU General Assembly 2026, Vienna, Austria, 3–8 May 2026, EGU26-21910, https://doi.org/10.5194/egusphere-egu26-21910, 2026.

EGU26-23185 | Posters virtual | VPS5

Impact of Water Management and Land Use Practices on Greenhouse Gas Emissions from an Intensively Farmed Bog Grassland in Northwest Germany 

Robert Taube, Daniel Köhn, Heiko Gerken, Arno Krause, and Gerald Jurasinski

Bog peatlands in northwestern Germany release high amounts of greenhouse gas (GHG) emissions. Most of these bogs were drained, resulting in intensively used grasslands primarily for dairy production. While dairy production is economically highly important in the region drained bogs with intensive grassland use show high CO2 emissions. To reduce GHG-emissions from intensively managed grasslands on bogs used for dairy production, the GreenMoor project investigates the effects of different water management approaches, such as such as subsurface irrigation and ditch blocking, as well as different usage practices including different fertilization intensities and pasture or cutting regimes. With a unique and expansive setup, we investigate the full GHG-balance of these different variants using manual chambers. We aim to present preliminary results from the first project phase including preliminary GHG-balances and an outlook on the potential success of different management approaches to reduce GHG-balances from drained intensively used bogs.

How to cite: Taube, R., Köhn, D., Gerken, H., Krause, A., and Jurasinski, G.: Impact of Water Management and Land Use Practices on Greenhouse Gas Emissions from an Intensively Farmed Bog Grassland in Northwest Germany, EGU General Assembly 2026, Vienna, Austria, 3–8 May 2026, EGU26-23185, https://doi.org/10.5194/egusphere-egu26-23185, 2026.

Urbanization, together with increasing global population pressure and climate variability, has introduced heat-related challenges across urban areas, severely impacting humans and the Earth. The rapid population growth has placed India at the top of the global population ranking. Demographic surges concentrate stress on existing urban systems, making Indian metropolises-both inland hubs and rapidly transforming coastal centers-critical laboratories for studying UHI dynamics.

The understanding of patterns and possible causes of the UHI effect due to urbanization-induced anthropogenic activities is a vital area in urban climate research. This study presents an overall multi-decadal day/night spatiotemporal seasonal analysis and trends in LST and UHI for six Indian cities: Ahmedabad, Mumbai, Panjim, Mangalore, Kochi, and Thiruvananthapuram, spanning the last three decades.

MODIS LST and AOD data are used to explain the possible reasons for the change in LST and UHI, focusing on the seasonal thermal behavior of cities under prevailing atmospheric, meteorological, and anthropogenic conditions. The Landsat series datasets are used to develop LULC maps and delineate high-resolution UHI zones, to explain shared trajectories and city-specific patterns that expose complex vulnerabilities within urban ecosystems in India. The findings, which integrate multi-decadal 30-year satellite-derived LST, LULC, and AOD data, demonstrate that greater increases in nighttime LST are associated with a decrease in the diurnal temperature range across all cities. Mumbai consistently showed lower mean LST values compared to Ahmedabad, which exhibited substantially higher values and extreme seasonal amplitudes ranging from 17.23 °C to 50.05 °C. Goa and Mangalore depicted a 1-4 °C increase in seasonal mean LST between 1993 and 2023. Corresponding to a rise in built-up area and a decline in vegetation, Kochi too exhibited a rise in LST. Thiruvananthapuram showed a strong warming, with a mean LST increase of about 3°C. AOD patterns also demonstrated similar spatial and temporal gradients across cities, helping to reinforce land-use change, urban expansion, and inland-coastal climatic contrasts as the significant causes of LST trends.

Collectively, these findings reveal how land-use transition, and climatic variability, significantly alters the thermal environment of Indian cities; making such studies important for climate-responsive planning and better urban management to enhance resilience and thermal comfort.

How to cite: Rai, R. and Murali R, M.: Utilising geospatial data to understand urban heat island and its effect on urban thermal comfort in selected Indian cities using Remote Sensing and GIS, EGU General Assembly 2026, Vienna, Austria, 3–8 May 2026, EGU26-488, https://doi.org/10.5194/egusphere-egu26-488, 2026.

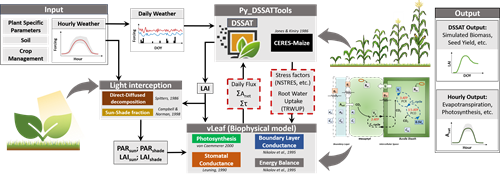
EGU26-984 | ECS | Posters virtual | VPS6

A systematic review of the diverse values of Seagrass Contributions to People (SCP) in Indonesia: A pilot study 

Dzaki Satrio Widanto, Sigit Deni Sasmito, and Nathan Waltham

Seagrass ecosystems in Indonesia provide a diverse array of services and societal benefits that helps to mitigate the impacts of climate change, yet they face complex threats and ongoing declines. Assessing their diverse values through pluralistic lenses can provide important baseline information to guide future conservation and restoration policies. Utilising the Seagrass Ecosystem Contributions to People (SCP) framework, a systematic review was conducted in representative seagrass ecosystem regions—west (Bintan), central (Selayar), and east (Ternate)—to examine the current state of research on their diverse values. Specifically, we identified the presence, perceived worldviews, characteristics, specific values, and their overlaps of SCP categories.

Publications were retrieved from Scopus, Web of Science, and the first ten pages of Google Scholar between February and April 2025. Then, following the Preferred Reporting Items for Systematic Reviews and Meta-Analyses (PRISMA) 2020 Guideline, a thorough literature analysis was conducted using six established inclusion criteria. Present SCPs, perceived worldviews, specific values, and their overlaps were assessed in accordance with core meanings derived from McKenzie and Colleagues, the Intergovernmental Science-Policy Platform on Biodiversity and Ecosystem Services (IPBES) report on the diverse values of nature, and Himes and Colleagues’ publication, respectively.

Overall, 54 publications were included in this review, spanning the years 1989 to 2025 and identifying 25 SCPs across three regions, with a decreasing number of studies for each SCP from west to east. There were imbalances in the SCP perception, with bioindicator and scientific research being perceived in all regions and having twice the number of publications compared to other SCPs. These two prevalent SCPs generally studied the ecological status of seagrasses, their associated biota, and experimental results on their monitoring methods (e.g. remote sensing).  

Biocentric and anthropocentric worldviews were researched more and dominated interchangeably between SCPs, focusing on seagrass conservation values and societal perceptions of its services. Meanwhile, the pluricentric worldview had singular studies limited to several Material and Nonmaterial SCPs. Excluding the east region, all three specific values (intrinsic, instrumental, and relational) were present, with instrumental as the most frequent overlapping value. These value overlaps demonstrated fuzzy boundaries between material and nonmaterial groups, but not with the regulating SCPs, which were all studied with a singular specific value.

Regional differences in seagrass ecosystem management, benefit utilizations, and research focus might reflect the variability of the perceived SCPs, worldviews, and value overlaps. Although these perceptions are still biased towards tangible benefits for human ends. However, most of the reviewed publications were short-term studies and distinct from each other, demonstrating the need for local experts’ knowledge elicitation to further weave the information. Our study further developed the SCP framework by incorporating the concept of nature’s diverse values, which is highly relevant and applicable to the seagrass socio-ecological setting and management initiatives in Indonesia.

How to cite: Widanto, D. S., Sasmito, S. D., and Waltham, N.: A systematic review of the diverse values of Seagrass Contributions to People (SCP) in Indonesia: A pilot study, EGU General Assembly 2026, Vienna, Austria, 3–8 May 2026, EGU26-984, https://doi.org/10.5194/egusphere-egu26-984, 2026.

The EU Nature Restoration Regulation is the first continent-wide, comprehensive law of its kind and is a key component of the EU Biodiversity Strategy. This sets binding targets to restore degraded ecosystems, particularly those with the most potential to capture and store carbon and to prevent, and reduce, the impact of natural disasters. The EU Nature Restoration Regulation contains seven specific targets, including:

‘marine ecosystems – restoring marine habitats such as seagrass beds or sediment bottoms that deliver significant benefits, including for climate change mitigation…….’

The 800 hectares of seagrass meadows in South-West England are rightly regarded as important biodiversity ‘hot spots’, providing habitats for many species of juvenile fish, cuttlefish and sea horses. Many of the meadows in the region have been impacted by a ‘Seagrass Wasting Disease’ in the 1930s and the more recent damage caused by the anchoring of small boats (usually pleasure craft). This damage is being rectified by re-planting of seagrass, but many of those engaged in this work do not appreciate the full story behind the present distribution and development of the meadows.

The oldest seagrasses are known from the Maastrichtian of The Netherlands and are found in the Maastricht Chalk Formation (70 million years’ old). Between that time and the present day there are very few direct records of seagrass fossils, and this is because:

  • Seagrass meadows from the tidal/inter-tidal boundary are not in an environment that is commonly preserved in the geological record; and
  • In modern seagrass meadows, the plants are rarely – if ever – preserved and are rarely found in cores drilled into the meadows below ~30 cm.

In marine cores taken in Plymouth Sound and elsewhere in Southern England there are only low levels of carbon (spores, pollen, dinoflagellates, seeds, and organic debris) and not the high levels that would be required to suggest that sea grasses sequester high levels of ‘blue carbon’ for extended periods of time. The accumulation of low carbon levels can be explained by the enhanced sedimentation created by the seagrass, the so-called allochthonous carbon. The one element of carbon sequestration that is often ignored is that of foraminifera, ostracods and bryozoans, all of which are extremely abundant in meadow sediments. In many cases, the biodiversity of the foraminifera (>100 species) dwarfs the usual biodiversity counts of larger organisms. Such fixed calcium carbonate does have a long-term storage potential.

The other issue that can be ignored by those studying seagrasses is that the marine environment has undergone significant change throughout the 1 million years of the Pleistocene/Holocene and many of the seagrass meadows have only just re-established themselves following the Last Glacial Maximum, when sea levels were 120‒130 m below present-day levels. How seagrass migrated back into the present-day coastal areas is not yet fully understood, including the separation of the inter-tidal and sub-tidal taxa.

How to cite: Hart, M. and Fisher, J.: South-West England seagrasses: ecology, evolution and contribution to biodiversity and carbon sequestration , EGU General Assembly 2026, Vienna, Austria, 3–8 May 2026, EGU26-4468, https://doi.org/10.5194/egusphere-egu26-4468, 2026.

EGU26-4510 | Posters virtual | VPS6

Assessing Long-Term Flood Risk and Elevation Ordinance Comparisons Using a Web-Based Geospatial Decision Tool 

Lakshmi Prasanna Kunku, Carol J Friedland, and Rubayet Bin Mostafiz

To support resilient community planning and informed hazard mitigation decisions, having an effective flood risk evaluation is very important especially in coastal and flood prone areas. This presentation is focused on the development of an interactive web-based decision-making platform designed to analyze future flood risk and elevation ordinance impacts across five parishes in Louisiana, USA. The website allows users to explore long-term flood risk projections and ordinance related costs over multiple future decades from 2030 to 2100. The platform integrates various geospatial datasets including multi-return-period flood depth projections, decadal population forecasts, and building inventories. Flood depth raster datasets are converted from raster to point data using python and then assigned to building data obtained from Coastal Protection and Restoration Authority (CPRA) using spatial join. Then the obtained datasets are used to calculate Average Annual Loss (AAL) for different elevation ordinances. This framework incorporates a range of flood elevation ordinances, including ASCE 24-14, ASCE 24-24, and freeboard-based standards (BFE +1’, +2’, and +3’), with ordinance costs and risk outcomes by decade. ArcGIS Pro is used for spatial analysis and 3D geospatial visualization, while interactive webpages and different elevation ordinance scenario comparisons are implemented with react vita app. To improve accessibility for non-technical users, the website integrates AI-driven features that assist users in navigating the tool, interpreting results, and comparing ordinance scenarios. The platform supports hotspot analysis, side-by-side visualization of present and future flood risks, and iterative refinement through user feedback sessions. Overall, this tool provides planners, homeowners, and policymakers with a forward-looking environment to assess flood mitigation strategies, ordinance performance, and population-driven risk changes over time by combining advanced spatial analytics with interactive and user-centered design.

How to cite: Kunku, L. P., Friedland, C. J., and Mostafiz, R. B.: Assessing Long-Term Flood Risk and Elevation Ordinance Comparisons Using a Web-Based Geospatial Decision Tool, EGU General Assembly 2026, Vienna, Austria, 3–8 May 2026, EGU26-4510, https://doi.org/10.5194/egusphere-egu26-4510, 2026.

EGU26-5322 | ECS | Posters virtual | VPS6

Selective pressure of atrazine on bacterial pattern in a hypersaline lake environment  

Yolanda Espín Montoro, Gustavo Martínez Couque, José Antonio Fernández Pérez, Manuel Álvarez Ortí, and Juan José Gómez Alday

The attenuation of atrazine in the saline water of the hypersaline Pétrola lake from a natural reserve (SE Spain) was studied to get more insight into the processes governing the fate of the contaminant in highly saline environments. In microcosms, the water column was spiked with 15.4 mg/L of atrazine for 24 days. Before atrazine amendment, the initial distribution of bacterial community was mostly composed of Proteobacteria (25.5 %), Cyanobacteria (25.2 %), Actinobacteriota (18.5 %), Verrucomicrobiota (11.5 %) and Bacteroidota (10.1 %). Within the mayor phyla, the most abundant families were identified as Cyanobiaceae (25 %), Rhodobacteraceae (10 %), Alcaligenaceae (9.9 %), Microbacteriaceae (7.3 %) and a poorly described PeM15 (6.2 %).

The reduction of atrazine concentration in the water column reaches 86.9 %, which means a reduction of dissolved atrazine mass of 98.1 %. Parallel to the decrease in atrazine, the amount of its intermediate degradation metabolite, desethylatrazine, increased. Desethylatrazine was the major short-term metabolite within the first 8-12 days, indicating the potential activity by atrazine-degrading bacteria. No deisopropylatrazine was detected in the saline water above detection limit. Microbiology results showed that atrazine can be removed from the saline lake environment. After atrazine amendment, the taxonomic bacterial composition at phylum level shifted to Proteobacteria (60.8 %), Patescibacteria (9.7 %), Bacteroidota (7.3 %), Campylobacterota (6.4 %) and Actinobacteriota (2.1 %). Atrazine supplementation suggested a selective pressure on bacterial structure morphology through the emergence of different dominant groups (i.e., Campylobacterota) or even the eradication of those phyla of bacteria capable of photosynthesis (i.e., Cyanobacteria). At family level, Rhodobacteraceae (16.7 %), Burkholderiaceae (11.7 %), Thiomicrospiraceae (7.9 %), Methylophagaceae (6.7 %), Sulfurimonadaceae (4.4 %) and Solimonadaceae (3.3 %) were the most abundant in the water column at the end of the experiment.

Related atrazine-degrading families established at the end of the experiment were Rhodobacteraceae, Solimonadaceae, Pseudomonadaceae, Rhizobiaceae, Chromatiaceae, Bacillaceae, Xanthomonadaceae, Caulobacteraceae, Moraxellaceae, Streptomycetaceae, Microbacteriaceae and Nannocystaceae. Related candidates such as Pseudomonas paralactis, Microbacterium sp., or Arthrobacter sp., among others, were isolated in water samples from previous studies. The bacterial candidates for atrazine degradation identified in the water column indicate that the herbicide acted as a selective pressure factor, altering the composition of the bacterial pattern. The water column would constitute a reactive environment which may govern the fate of pesticides in saline surface water bodies.

How to cite: Espín Montoro, Y., Martínez Couque, G., Fernández Pérez, J. A., Álvarez Ortí, M., and Gómez Alday, J. J.: Selective pressure of atrazine on bacterial pattern in a hypersaline lake environment , EGU General Assembly 2026, Vienna, Austria, 3–8 May 2026, EGU26-5322, https://doi.org/10.5194/egusphere-egu26-5322, 2026.

EGU26-6116 | ECS | Posters virtual | VPS6

Spatial Variation in Sediment Bacterial Communities Along a Salinity Gradient in a Northern Gulf of Mexico Coastal Ecosystem 

Sarah G. Parker, Beau Tryzbiak, Arya Patel, Gabriel Pereira, Lisa Chambers, and Melanie Beazley

Microorganisms in estuarine and coastal ecosystems are subject to changes in salinity and nutrient loads as well as threats from emerging contaminants, sea level rise, extreme weather patterns, and human encroachment. These ecosystems are of economic and ecological importance due to their biological diversity as well as their role in carbon sequestration, flood protection, and erosion prevention. However, the microbial community structure in the sediment of estuarine systems remains under researched despite the abundant ecosystem services they provide. In this study, we surveyed 25 sites within Econfina River State Park located in the eastern portion of the Northern Gulf of Mexico along a salinity gradient from freshwater upstream to coastal seagrass beds downstream. DNA extracted from the top 10 cm of sediment were 16S rRNA amplicon sequenced to determine microbial community structure. Results contribute to the understanding of microbial ecology of coastal ecosystems in the Northern Gulf of Mexico.

How to cite: Parker, S. G., Tryzbiak, B., Patel, A., Pereira, G., Chambers, L., and Beazley, M.: Spatial Variation in Sediment Bacterial Communities Along a Salinity Gradient in a Northern Gulf of Mexico Coastal Ecosystem, EGU General Assembly 2026, Vienna, Austria, 3–8 May 2026, EGU26-6116, https://doi.org/10.5194/egusphere-egu26-6116, 2026.

EGU26-8273 | ECS | Posters virtual | VPS6

Magnetic Disturbances to Cetaceans in Isafjörðurdjup 

Asit Rahman

Evidence suggests cetaceans utilise magnetoreception to navigate using magnetic fields. However, disturbances in the geomagnetic field from solar storms and anthropogenic activity can lead to beachings. Previous studies indicate fluctuations around 50 nT are large enough to influence strandings. Ísafjarðardjúp is home to a large humpback whale population in the summer, but marine activity, including fish farms, vessel traffic and coastal structures such as the Bolafjall radar station, makes the fjord prone to magnetic interference, potentially intefering with magnetoreception.  

To study the extent of disruption in the marine environment, a marine magnetic survey was conducted using a proton-spin magnetometer to map magnetically unstable regions of the fjord, which coincided with frequent whale sightings. This would highlight areas of the fjord where interference with magnetoreception is likely to occur, potentially leaving cetaceans vulnerable to disorientation, which could lead to navigational errors and beaching.
 
Areas of instability that were prone to magnetic disturbances were located in the middle of the fjord near Vigur Island and at the entrance. Instability in these regions show a 0.58 point-biserial correlation coefficient for creating fluctuations of 10 to 50nT within a 7km radius of the fish farms, and creating regions of 'extreme instability' with fluctuations above 50 nT located within 5 km of the farms. Bolafjall radar station situated near the entrance of the fjord is hypothesised to be responsible for extreme disturbances fluctuating as high as 230 nT.
 
Approximately 20% of cetacean sighting hotspots overlap with these unstable regions, and instability at the entrance of the fjord can potentially cause disorientation to cetaceans attempting to enter and exit. Therefore, policies, such as shielding submarine cables and restricted use of radar in vulnerable areas, are suggested in this study to reduce the risk of cetacean strandings.

How to cite: Rahman, A.: Magnetic Disturbances to Cetaceans in Isafjörðurdjup, EGU General Assembly 2026, Vienna, Austria, 3–8 May 2026, EGU26-8273, https://doi.org/10.5194/egusphere-egu26-8273, 2026.

EGU26-12529 | ECS | Posters virtual | VPS6

Modelling Tropical Dry Forest Phenology from a Plant Hydraulic Perspective 

Yuzuo Zhu, Thomas A. M. Pugh, and Minchao Wu

Plant responses to dry environments are shaped by diverse adaptive strategies linked to plant hydraulic traits, as reflected by the coexistence of deciduous and evergreen tree species in tropical seasonally dry forests. Empirical evidence suggests that leaf shedding is associated with declining leaf water potential, while leaf flushing depends on xylem rehydration. However, these physiological mechanisms are rarely incorporated into Dynamic Global Vegetation Models (DGVMs), which typically represent drought deciduous phenology using highly-simplified, threshold-based schemes with fixed rates of leaf phenological change. Here, we develop a stress–gradient based phenology scheme in which leaf shedding and leaf flushing are driven by the temporal gradients of leaf water potential and xylem water potential, respectively. This gradient–driven phenology mechanism was implemented in the LPJ-GUESS DGVM and validated with in-situ observations of phenological responses along hydraulic gradients. The new model has successfully reproduced phenological dynamics for the 7 selected locations and substantially improves model performance in simulating plant transpiration. We provide evidence that plant hydraulics are key controls for the phenological dynamics of tropical dry forests. The proposed stress-gradient phenological mechanism, linking phenology to plant hydraulic status, is an efficient approach to represent landscape phenology and improve simulations of water and carbon cycling over the tropical drylands. It may also help improve our understanding of forest response to drought stress, which remains largely unknown under warming climates.

How to cite: Zhu, Y., Pugh, T. A. M., and Wu, M.: Modelling Tropical Dry Forest Phenology from a Plant Hydraulic Perspective, EGU General Assembly 2026, Vienna, Austria, 3–8 May 2026, EGU26-12529, https://doi.org/10.5194/egusphere-egu26-12529, 2026.

EGU26-14857 | ECS | Posters virtual | VPS6

Canada’s forests shifting from a recovery-driven carbon sink to a disturbance-driven carbon source 

Salvatore Curasi, Joe Melton, Elyn Humphreys, Vivek Arora, Jason Beaver, Alex Cannon, Jing Chen, Txomin Hermosilla, Sung-Ching Lee, and Michael Wulder

Canada’s terrestrial ecosystems play a critical role in the global carbon cycle and are being affected by unprecedented climate change and wildfire disturbance. However, we have an incomplete understanding of Canada’s historical carbon cycle. Existing assessments, conducted at varying spatial scales, use a wide range of data sources and methodologies, which lead to significant differences in the estimated strength of Canada’s land carbon sink over recent decades. Moreover, many approaches (e.g., inversions and data-driven estimates) have a limited ability to disentangle the relative contributions of different processes to the carbon sink over the recent past (1700 - 2022). We addressed this gap using a land surface model recently tailored to Canada and the most comprehensive information depicting wildfire disturbance and timber harvest available to make, to our knowledge, the first physically coherent wall-to-wall estimates of all major carbon pools and fluxes for Canada. We show that Canada’s terrestrial ecosystems have been a carbon sink since the mid-20th-century, due to the influence of wildfire and timber harvest before 1940. Since the early 2000s, wildfire disturbance has been driving Canadian forests towards becoming a carbon source. Based on our findings from a purely process-oriented perspective, projected increases in wildfire activity will further impact the strength and direction of Canada's terrestrial carbon sink.

How to cite: Curasi, S., Melton, J., Humphreys, E., Arora, V., Beaver, J., Cannon, A., Chen, J., Hermosilla, T., Lee, S.-C., and Wulder, M.: Canada’s forests shifting from a recovery-driven carbon sink to a disturbance-driven carbon source, EGU General Assembly 2026, Vienna, Austria, 3–8 May 2026, EGU26-14857, https://doi.org/10.5194/egusphere-egu26-14857, 2026.

EGU26-15259 | ECS | Posters virtual | VPS6

Landward Migration of Coastal Wetlands under Land-Use Constraints in Australia 

Nipuni Perera, Melissa Wartman, Siegmund Nuyt, Peter Macreadie, and Micheli Duarte de Paula Costa

Sea level rise (SLR) is a key driver in altering spatial boundaries, species distribution, and functioning of coastal wetlands in the 21st century. Wetland adaptation to SLR depends on vertical accretion and landward migration; however, the magnitude and rate of these processes remain uncertain and are constrained by factors such as sediment supply and the availability of inland accommodation space. To enhance adaptive capacity, spatially explicit assessments are critical for identifying areas suitable for wetland migration. Nevertheless, much of the existing literature emphasises global-scale analyses with coarse spatial resolution and limited use of local SLR projections, which reduces their applicability for regional and local decision-making.

We conducted a scenario-based assessment of the potential extent of landward migration for mangroves and saltmarshes in Victoria, Australia, using high-resolution (10 m) regional spatial data under two socio-economic pathways (SSP2 and SSP5) for 2070 and 2090. The results indicate that, for both ecosystems, potential area gains from landward migration exceed losses from seaward inundation. For saltmarshes, ecosystem losses are driven more by mangrove encroachment (53%) than by inundation (47%). Land tenure emerges as a key factor shaping wetland migration capacity. Future accommodation space for mangroves is largely under public ownership (56%), primarily within protected areas and nature reserves (56.2%), providing a relatively secure buffer for inland migration. In contrast, most accommodation space for saltmarshes is privately owned (56.4%) and predominantly associated with primary production land use (45.4%). Without specific management actions, saltmarshes are likely to experience losses from both expanding mangroves and ongoing land-use pressures. Overall, these findings provide valuable insights to support stakeholders in scenario-based planning and the management of coastal and urban areas to enable wetland adaptation to rising sea levels.

How to cite: Perera, N., Wartman, M., Nuyt, S., Macreadie, P., and Duarte de Paula Costa, M.: Landward Migration of Coastal Wetlands under Land-Use Constraints in Australia, EGU General Assembly 2026, Vienna, Austria, 3–8 May 2026, EGU26-15259, https://doi.org/10.5194/egusphere-egu26-15259, 2026.

EGU26-15541 | ECS | Posters virtual | VPS6

Constructing a Multi-Scale Urban Cooling Island Ventilation Network to Mitigate the Urban Heat Island Effect: A Case Study of Changsha, China 

Xingfa Zhong, Baojing Wei, Luyun Liu, and Yijia Huang

         To address the intensifying urban heat island (UHI) effect driving by rapid urbanization, current research reveals a significant scale discontinuity between macro-level strategies, such as regional cooling network design, and micro-level studies that focus on localized cooling mechanisms of individual green patches. Macro-scale approaches often overlook small cooling islands embedded within dense urban fabrics, while micro-scale investigations lack systematic understanding of inter-patch connectivity. This study proposes a multi-scale cooling island ventilation network to synergistically mitigate UHI impacts across spatial hierarchies. Using the core area of Changsha City as a case study, the research introduces an innovative three-tier scale classification framework incorporating building density. By integrating relative land surface temperature and morphological spatial pattern analysis, the study identifies core cold island sources. Further, a cold island ventilation resistance surface is constructed using the CRITIC objective weighting method, enabling the identification of key nodes and corridors for establishing a comprehensive multi-scale ventilation network. Findings reveal that, amidst urban expansion and increasing building/road densities, landscape fragmentation has led to a “shrinking-in-size, growing-in-number” trend for both primary and secondary cold island sources. From 2009 to 2016, the total area of primary-scale cold sources declined sharply from 45 km² to 19.8 km², while their number rose from 130 to 151. The average patch size fell from 0.35 km² to 0.07 km², and the minimum temperature increased from 28.7 °C to 35.3 °C-signaling a depletion risk. Similarly, secondary cold sources shrank from 215.38 km² to 144.83 km², as their number increased from 123 to 169, with average patch size dropping from 1.75 km² to 0.86 km²-weakening their thermal buffering capacity. Despite this, ventilation corridors peaked in 2020, totaling 371 in number and 528.5 km in length, continuing to act as "relay stations" transmitting peripheral cooling effects to the urban core. Notably, tertiary cold sources rebounded after 2016 due to strengthened ecological conservation efforts, expanding by 237.5 km² by 2020. Their temperatures stabilized between 35–38 °C—significantly cooler than the urban core—demonstrating sustained cooling potential. Policy recommendations are proposed across three spatial scales: 1) primary scale, remove obstructions at cold source points to broaden cooling supply channels; 2) secondary scale: prioritize the protection of key corridors and junctions to preserve inter-patch connectivity and maintain dynamic cold air flow; 3) tertiary scale: safeguard and enhance core ecological areas to ensure stable and continuous cooling output. By identifying cold island sources and constructing a multi-scale ventilation network, this study offers a science-based framework for optimizing thermal environments in high-density urban areas.

Graphical Abstract

How to cite: Zhong, X., Wei, B., Liu, L., and Huang, Y.: Constructing a Multi-Scale Urban Cooling Island Ventilation Network to Mitigate the Urban Heat Island Effect: A Case Study of Changsha, China, EGU General Assembly 2026, Vienna, Austria, 3–8 May 2026, EGU26-15541, https://doi.org/10.5194/egusphere-egu26-15541, 2026.

EGU26-16743 | ECS | Posters virtual | VPS6

Restoring Mediterranean holm oak forests: ecosystem functioning and climate mitigation in the LIFE RECLOAK project 

antonella gori, sara beltrami, francesca alderotti, francesco ferrini, camilla dibari, roberto ferrise, donatella paffetti, and cecilia brunetti

Mediterranean forest ecosystems are currently facing severe challenges due to the combined pressures of biotic and abiotic stressors. In particular, Holm oak (Quercus ilex L.) forests are experiencing a widespread decline driven by the effects of climate change-induced drought and the aggression of the soil pathogen Phytophthora cinnamomi. This decline threatens not only forest biodiversity but also the stability of essential ecosystem services. In response to this problem, the LIFE RECLOAK project aims to restore and improve the conservation status of these threatened habitats. The project adopts an approach involving the genetic selection of drought-tolerant and pathogen-resistant genotypes, their micropropagation, and subsequent planting in pilot sites across Italy, Spain, and Malta. Within this framework, Work Package 7 (WP7) is dedicated to the "Evaluation of ecosystem functioning and climate mitigation effects," validating the success of the reforestation efforts. Therefore, the primary objective of WP7 is to quantify the restoration of ecosystem processes and the enhancement of climate change mitigation potential provided by the selected resistant genotypes compared to traditional forest stock.

The activities of WP7 integrate field monitoring and modelling tasks. Firstly, the project will assess vegetation growth and biodiversity. In the pilot sites, key morphological parameters of Q. ilex (such as Basal Diameter (BD), Plant Height (PH), and Leaf Area Index (LAI)) will be measured annually to track biomass accumulation. Concurrently, biodiversity indexes (BI) will be calculated to monitor the recovery of understory vegetation. To evaluate the restoration of below-ground processes, soil quality will be assessed through measurements of soil respiration, Soil Organic Carbon (SOC), erosion rates, and Water Holding Capacity (WHC). Recognizing the slow growth rate of holm oaks, these monitoring activities are planned to continue for ten years after the project's conclusion, ensuring a long-term perspective on ecosystem recovery. Data collected from vegetation and soil monitoring will be used for the assessment of carbon sequestration, calculating the CO2 absorbed by both the woody biomass and the soil compartment. WP7 will also develop a monitoring tool using the Biome-BGC Musso ecohydrological model. By integrating site-specific pedoclimatic data with the physiological traits of the resistant genotypes, this model will be calibrated to simulate carbon and water pathways (e.g., Water Use Efficiency) over the plantation's lifespan. This approach quantifies the added value of the resistant genotypes, demonstrating their superior resilience under changing environmental and management conditions.

Finally, under the coordination of the Democritus University of Thrace, WP7 will integrate these findings to analyze broader Ecosystem Services (ES), including provisioning, regulating, and supporting functions. Ultimately, by validating biological indicators and establishing a robust carbon monitoring protocol, WP7 will demonstrate the effectiveness of using improved genotypes, offering a replicable model for restoring Mediterranean areas affected by forest dieback.


How to cite: gori, A., beltrami, S., alderotti, F., ferrini, F., dibari, C., ferrise, R., paffetti, D., and brunetti, C.: Restoring Mediterranean holm oak forests: ecosystem functioning and climate mitigation in the LIFE RECLOAK project, EGU General Assembly 2026, Vienna, Austria, 3–8 May 2026, EGU26-16743, https://doi.org/10.5194/egusphere-egu26-16743, 2026.

EGU26-17838 | ECS | Posters virtual | VPS6

Research progress on magnetotactic bacteria under high magnetic field 

Junfeng Wang and Kun Ma

Magnetotactic bacteria (MTB) are an ancient microbial lineage that navigate geomagnetic field lines via intracellular magnetosomes, and their unique multi-disciplinary properties have long drawn research attention. This study focuses on MTB’s behavioral and metabolic adaptations under high magnetic fields—including extreme environments six orders of magnitude stronger than the geomagnetic field—and explores their application potential.Our recent progress is outlined as follows: 1) Using Magnetospirillum gryphiswaldense MSR-1 as the model strain, we analyzed how high magnetic fields reprogram MTB metabolism, modulate biomineralization dynamics, and impact MmaK scaffold assembly as well as magnetofossil genesis.2) We clarified the regulatory role of MTB-derived Mms6 protein in biomineralization, and synthesized magnetosome-mimetic nanocrystals in vitro that match natural magnetosomes in cuboctahedral morphology, soft ferromagnetic behavior, and high saturation magnetization. 3) We built a magnetic nanorobot-based navigation system to realize precise spatial control and trajectory planning of MTB, paving new ways for MTB-mediated nanodrug delivery and magnetic navigation.

References

[1] WAN, Hengjia, et al. Assembly dynamics of magnetotactic bacterial actin-like protein MamK under shielded geomagnetic fields: In vitro evidence of inhibited filament formation. International Journal of Biological Macromolecules, 2025, 320: 145863.

[2] Tao, Tongxiang, et al. "Boosting SARS-CoV-2 enrichment with ultrasmall immunomagnetic beads featuring superior magnetic moment." Analytical Chemistry 95.30 (2023): 11542-11549.

[3] Ma, Kun, et al. "Magnetosome-inspired synthesis of soft ferrimagnetic nanoparticles for magnetic tumor targeting." Proceedings of the National Academy of Sciences 119.45 (2022): e2211228119.

[4] TAO, Tongxiang, et al. A Precise BSA Protein Template Developed the C, N, S Co-Doped Fe3O4 Nanolayers as Anodes for Efficient Lithium-Ion Batteries. ACS Applied Energy Materials, 2022, 5.8: 10254-10263..

How to cite: Wang, J. and Ma, K.: Research progress on magnetotactic bacteria under high magnetic field, EGU General Assembly 2026, Vienna, Austria, 3–8 May 2026, EGU26-17838, https://doi.org/10.5194/egusphere-egu26-17838, 2026.

EGU26-21475 | ECS | Posters virtual | VPS6

Drought resilience and fruit performance in strawberry tree (Arbutus unedo L.) populations: ecophysiological screening and postharvest behaviour  

Giovanni Pascucci, Francesca Alderotti, Ermes Lo Piccolo, Sara Beltrami, Cassandra Detti, Andrea Baptista, Valeria Palchetti, Lorenzo Bini, Francesco Ferrini, Maria Dulce Antunes, Edgardo Giordani, Cecilia Brunetti, and Antonella Gori

Climate change is increasing the frequency and intensity of drought and heat events in Mediterranean regions, urging the need for resilient fruit crops that link stress tolerance to relevant fruit quality traits. My PhD project focuses on the strawberry tree (Arbutus unedo L.), an underutilised Mediterranean evergreen fruit species of considerable ecological relevance in Southern Europe, with a recognised capacity to cope with diverse abiotic and biotic constraints. The project objective is to characterise six Italian A. unedo populations in terms of physiological performance under water-limited conditions and fruit quality characteristics. The primary step is to select provenances with contrasting pedoclimatic characteristics and to use calculated climatic indices (e.g., Emberger’s Q2) across an aridity–temperature gradient. These provenances are then screened for constitutive traits under well-watered conditions combining measurements of xylem vulnerability to embolism formation (P50), water-use strategy (e.g., minimum epidermal conductance, gmin; specific leaf area, SLA), and cellular drought tolerance derived from pressure–volume analysis (turgor loss point, TLP; osmotic potential at full turgor, π₀; and modulus of elasticity, ε).  After that, inducible trait modifications are tested under water stress and recovery conditions, monitoring gas exchange, plant water relations, chlorophyll fluorescence parameters, hydraulic resistance, and growth. In parallel,  a core component of the work investigates fruit physiological performance across different ripening stages (identified by skin colour) and during post-harvest storage. Fruits, harvested at the yellow–orange stage, are analysed for respiratory activity using a custom fruit chamber coupled to a LI-COR 6800 system. Post-harvest dynamics are monitored under two storage treatments (ambient temperature vs. 4 °C) and related to quality attributes, including colour development, soluble solids (°Brix), firmness, weight loss, pectin content, sugar profile, and polyphenol-related traits. Within this post-harvest study, the project also considers the use of edible coatings as a practical tool to modulate storage techniques and help preserve the quality attributes of this perishable fruit. Therefore, integrating provenance screening with fruit respiration and post-harvest physiology provides a practical basis for selecting A. unedo genotypes with improved drought resilience and high fruit yield and quality, thereby fostering A. unedo cultivation in Mediterranean areas under a changing climate.


How to cite: Pascucci, G., Alderotti, F., Lo Piccolo, E., Beltrami, S., Detti, C., Baptista, A., Palchetti, V., Bini, L., Ferrini, F., Antunes, M. D., Giordani, E., Brunetti, C., and Gori, A.: Drought resilience and fruit performance in strawberry tree (Arbutus unedo L.) populations: ecophysiological screening and postharvest behaviour , EGU General Assembly 2026, Vienna, Austria, 3–8 May 2026, EGU26-21475, https://doi.org/10.5194/egusphere-egu26-21475, 2026.

BG1 – General Biogeosciences

EGU26-377 | ECS | Posters on site | BG1.1

Control or destroy: Wildfire as a response mechanism 

Bikem Ekberzade and Tolga Görüm

The role of wildfire as a controller in wildland ecosystems is well researched. However, much uncertainty is present with climate change. Will this morphing force turn into a game breaker in the longevity of terrestrial ecosystems? Or will it continue its role as the ultimate controller of vegetation composition, and for certain taxa, fecundity? This study aims to answer these questions for a study region situated in the northern segment of Eastern Mediterranean Basin – Anatolian Peninsula and its immediate surroundings. It considers the historical and potential future changes in biomass and fuel capacity in the region with respect to the changes in amplitudes of climate variability due to climate change in two distinct time periods (present and future). Changes in fire severity and fire return interval (FRI) are simulated using a dynamic vegetation model (LPJ-GUESS v.4.1) coupled with wildfire modules (SIMFIRE and BLAZE), and high-resolution climate datasets. For 1961-2025, the model is forced with ERA5-Land reanalysis data, and for 1961-2100, an ensemble of 5 CMIP6 datasets under the SSP 5-8.5 global warming scenario are used which are resized to 0.1°. While the historical trend analyses of the climate indices (such as SPEI) indicate strong drying for the region overall, simulation results signal an increase in burned area, the frequency of wildfire incidents, while highlighting important changes in vegetation composition and biomass under a changing climate, as wildfire turns into a response mechanism under increasing temperatures and changing rainfall patterns. 

How to cite: Ekberzade, B. and Görüm, T.: Control or destroy: Wildfire as a response mechanism, EGU General Assembly 2026, Vienna, Austria, 3–8 May 2026, EGU26-377, https://doi.org/10.5194/egusphere-egu26-377, 2026.

EGU26-2363 | ECS | Orals | BG1.1

Extratropical lightning fires burn increasingly more severe than human-ignited fires 

Hongxuan Su, Kairui Qiu, Yan Yu, Yunxiao Tang, Shuoqing Wang, Xianglei Meng, and Wei Guo

Fires ignited by human and lightning occur at distinct environments and thus diverge during their developing processes. A global characterization of fires by their ignition cause will inform fire forecast and prediction but is currently prohibited by a lack of ignition cause in global fire inventories. Here we develop a machine-learning classification system and ascribe the ignition cause of 65.17 million global, satellite-detected fire events during 2012-2024. According to this fire inventory, extratropical lightning fires exhibit longer duration, larger burned area and hotter flame, compared with human fires. Despite their contribution to only 2.4% of fire occurrence, lightning fires are responsible for 10.9% of extratropical burned area and 47.6% of that consumed by large fires over 100 km2. This disproportionate abundance of lightning fires in the regime of most severe burning is attributable to synchronized seasonality of lightning ignition and burning conditions, as well as their scarcer accessibility to firefighting practices. Due to their closer linkage to the elongating fire-favorable weather, extratropical lightning fires has elongated by about 0.24 days decade-1, outpacing human fires. With projected hotter, dryer, and stormier extratropical summers, our results provide a direct support for a future of severer lightning fires.

How to cite: Su, H., Qiu, K., Yu, Y., Tang, Y., Wang, S., Meng, X., and Guo, W.: Extratropical lightning fires burn increasingly more severe than human-ignited fires, EGU General Assembly 2026, Vienna, Austria, 3–8 May 2026, EGU26-2363, https://doi.org/10.5194/egusphere-egu26-2363, 2026.

EGU26-3494 | ECS | Posters on site | BG1.1

Climate-cooling impacts from post-fire snow-albedo for the 2023 Canadian fires season 

Max J. van Gerrevink, Alemu Gonsamo, Brendan M. Rogers, Stefano Potter, Zilong Zhong, and Sander Veraverbeke

The 2023 Canadian fire season was record-breaking in terms of burned area and carbon emissions.  Yet, the climate impacts of these fires extend far beyond the immediate carbon emissions and can persist for decades. Post-fire changes in vegetation and surface properties prolong snow exposure during winter and spring, increasing surface albedo and producing long-lasting regional cooling impacts. Historically, the surface albedo-driven cooling has offset the warming influences of carbon emissions by boreal fires. However, with ongoing high-latitude warming, fire seasons are expected to become longer and more intense while spring snow cover declines. This combination may weaken the climate-cooling effect of post-fire surface-albedo changes and reduce the offset potential.

Here, we quantified and mapped the climate-cooling effects from post-fire surface albedo changes for the 2023 Canadian fire season under shared socioeconomic pathway SSP2-4.5 for a 70-year period. We estimate that the 2023 Canadian fires resulted in a time-integrated climate-cooling of –3.67 W m-2 of burned area (95% CI: −4.83 to −2.51) over a 70-year period. Our analysis further shows that the climate-cooling impact of boreal fires has weakened by approximately 30% due to changes in snow cover and duration. This has significant implications for the ability of albedo-driven cooling to offset warming from fire emissions. As a result, we conclude that contemporary boreal fires are, on average, twice as likely to result in a net climate-warming effect relative to the 1960s.

How to cite: van Gerrevink, M. J., Gonsamo, A., Rogers, B. M., Potter, S., Zhong, Z., and Veraverbeke, S.: Climate-cooling impacts from post-fire snow-albedo for the 2023 Canadian fires season, EGU General Assembly 2026, Vienna, Austria, 3–8 May 2026, EGU26-3494, https://doi.org/10.5194/egusphere-egu26-3494, 2026.

Biomass burning (BB) emissions in the Indo-China Peninsula (ICP) can be transported to southern China, perturbing the atmospheric environment and climate in southern China. However, the impact of these fire emissions transports on the terrestrial ecosystems in southern China remains unclear. Here we combine several state-of-the-art models and multiple measurement datasets to quantify the impacts of ICP fire-induced aerosol radiation and O3 damage effect on gross primary productivity (GPP) in southern China during ICP fire seasons (March and April) in 2013-2019. Our results demonstrate that ICP fire-derived aerosols and O₃ collectively reduce annual mean GPP in southern China by 5.4% (13.86 TgC per burning season) under all-sky and 3.4% (12.87 TgC per burning season) under clear-sky conditions. In all-sky, fire aerosols decreased direct photosynthetically active radiation (PAR) by 2.68 W m⁻² while increased diffuse PAR marginally (+0.03 W m⁻²), driving a GPP reduction of 13.36 TgC per burning season across southern China. Concurrently, fire-induced O₃ reduces regional GPP by 0.54 TgC per burning season. In clear-sky, aerosols reduce direct PAR more sharply (−3.22 W m⁻²) but enhance diffuse PAR (+1.51 W m⁻²), resulting the GPP loss to 12.18 TgC, while O₃ damage effect is increased (−0.69 TgC). The fire aerosols contributed to 96.4% of the GPP reduction in all-sky and 94.6% in clear-sky, whereas ozone played a minor role (3.9% in all-sky and 5.4% in clear-sky). This study highlights ICP fire emissions as a significant driver of ecosystem productivity declines in downwind regions, influencing the regional land carbon cycle.

How to cite: Zhu, J.: Quantifying the multi-year impacts of Indo-China Peninsula biomass burning on vegetation gross primary productivity in southern China, EGU General Assembly 2026, Vienna, Austria, 3–8 May 2026, EGU26-3711, https://doi.org/10.5194/egusphere-egu26-3711, 2026.

EGU26-4207 | Posters on site | BG1.1

The Fire Modeling Intercomparison Project (FireMIP) for CMIP7 

Fang Li and the CMIP7 FireMIP group

Fire is a global phenomenon and a key Earth system process. Extreme fire events have increased in recent years, and fire frequency and intensity are projected to rise across most regions and biomes, posing substantial challenges for ecosystems, the carbon cycle, and society. The Fire Model Intercomparison Project (FireMIP), launched in 2014, has contributed to advancing global fire modeling in Dynamic Global Vegetation Models (DGVMs) and improving understanding of fire's local drivers and local impacts on vegetation and land carbon budgets through land offline (i.e., uncoupled from the atmosphere) simulations. We now bring FireMIP into Coupled Model Intercomparison Project Phase 7 (CMIP7) to: (1) evaluate fire simulations in state-of-the-art fully coupled Earth system models (ESMs); (2) assess fire regime changes in the past, present, and future, and identify their primary natural and anthropogenic forcings and causal pathways within the Earth system, including the associated uncertainties; and (3) quantify the impacts of fires and fire changes on climate, ecosystems, and society across Earth system components, regions, and timescales, and elucidate the underlying mechanisms. FireMIP in CMIP7 will advance the fire and fire-related modeling in fully coupled ESMs, and provide a quantitative, detailed, and process-based understanding of fire's role in the Earth system by using models that incorporate critical climate feedbacks and multi-model, multi-initial-condition, and CMIP7 multi-scenario ensembles. Here, we presents the motivation, scientific questions, experimental design and its rationale, model inputs and outputs, and the analysis framework for FireMIP in CMIP7, providing guidance for Earth system modeling teams conducting simulations and informing communities studying fire, climate change, and climate solutions.

How to cite: Li, F. and the CMIP7 FireMIP group: The Fire Modeling Intercomparison Project (FireMIP) for CMIP7, EGU General Assembly 2026, Vienna, Austria, 3–8 May 2026, EGU26-4207, https://doi.org/10.5194/egusphere-egu26-4207, 2026.

EGU26-4268 | Orals | BG1.1

Increasing global human exposure to wildland fires despite declining burned area 

Mojtaba Sadegh, Seyd Teymoor Seydi, John Abatzoglou, Matthew Jones, and Amir AghaKouchak

Although half of Earth’s population resides in the wildland-urban interface, human exposure to wildland fires remains unquantified. We show that the population directly exposed to wildland fires increased 40% globally from 2002 to 2021 despite a 26% decline in burned area. Increased exposure was mainly driven by enhanced colocation of wildland fires and human settlements, doubling the exposure per unit burned area. We show that population dynamics accounted for 25% of the 440 million human exposures to wildland fires. Although wildfire disasters in North America, Europe, and Oceania have garnered the most attention, 85% of global exposures occurred in Africa. The top 0.01% of fires by intensity accounted for 0.6 and 5% of global exposures and burned area, respectively, warranting enhanced efforts to increase fire resilience in disaster-prone regions.

How to cite: Sadegh, M., Seydi, S. T., Abatzoglou, J., Jones, M., and AghaKouchak, A.: Increasing global human exposure to wildland fires despite declining burned area, EGU General Assembly 2026, Vienna, Austria, 3–8 May 2026, EGU26-4268, https://doi.org/10.5194/egusphere-egu26-4268, 2026.

EGU26-4614 | ECS | Orals | BG1.1

Strong Shortwave Absorption by Wildfire Brown Carbon from Global Observations and Modeling 

Lulu Xu, Guangxing Lin, and Xiaohong Liu

Wildfires emit large quantities of brown carbon (BrC), a class of light-absorbing organic aerosols with poorly constrained climate effects. BrC exhibits highly variable absorptivity, from weakly absorbing chromophores in the near-ultraviolet to strongly absorbing "dark BrC" (d-BrC) extending into the visible spectrum, yet the optical properties, global prevalence, and radiative impact of d-BrC remain poorly understood.  Here we show that d-BrC is widespread in wildfire plumes globally, based on integrated analyses of aircraft, ground-based, and satellite observations. We found d-BrC mass absorption efficiencies of 0.5–1.5 m²/g at 500 nm, with absorption often comparable to or exceeding that of black carbon (BC). Implementing these observationally constrained optical properties in a global aerosol-climate model, we estimate a direct radiative effect (DRE) of +0.097 W/m² (range: +0.050 to +0.276 W/m²) from wildfire-derived BrC, with the upper bound surpassing BC and extending into mid- and high-latitude regions including the Arctic These findings position d-BrC as a critical but overlooked driver of wildfire radiative forcing, underscoring the need to account for its strong radiative effects on climate.

How to cite: Xu, L., Lin, G., and Liu, X.: Strong Shortwave Absorption by Wildfire Brown Carbon from Global Observations and Modeling, EGU General Assembly 2026, Vienna, Austria, 3–8 May 2026, EGU26-4614, https://doi.org/10.5194/egusphere-egu26-4614, 2026.

The Fire INventory from NCAR (FINN) is a daily, high resolution (1 km) fire emissions inventory designed for use in atmospheric chemistry models. FINN uses a ‘bottom-up’ approach to estimate fire emissions. Satellite observations of active fires from MODIS (and VIIRS) are combined with land cover, emission factors and fuel loadings to predict fire emissions of key air pollutants. However, one of the key limitations of FINN is lack of peat fire emissions in the dataset, which only accounts above ground vegetation fires. Therefore, neglecting an important emissions source given the extensive abundance of peat in key tropical regions. Fires that occur on the surface of peatland can burn into the below-ground organic layers (up to 0.6 m). Peat fires can smoulder for weeks after the surface fire has extinguished, resulting in substantially greater emissions compared to surface vegetation fires. Therefore, it is essential to include peat fires in FINN.

Globally, peatlands cover >4 million km2 (3 %) of the global land area. However, emissions from the combustion of tropical and Arctic-boreal peat alone account for a disproportionately large fraction of total global carbon emissions (13 %). This is driven by above ground fires burning into the carbon rich peat below.

We first focus on tropical peatlands in Indonesia since these have well documented impacts on air quality. Indonesia is home to a large proportion (36 %) of total tropical peatlands, and a large fraction of fires in Indonesia occur on peatlands. For example, in 2015 53 % of fires in Indonesia occurred on peatland, accounting for only 12 % of the land area. Peat fires contributed 71-95 % of the particulate matter (PM2.5) fire emissions, though emissions are uncertain.

Our work builds upon previous work, which estimated Indonesian peat fire emissions for FINN.  Previously, satellite-derived soil moisture was used to determine a straightforward linear relationship with burn depth of fires that occurred on peatlands. We further develop this method adding additional complexity by using ground-based measurements of burn depth collocated with satellite soil moisture. We also consider canal density and fire frequency maps to account for changes in burn depth with drainage and fire history.

We plan to apply this method to other tropical peatland and boreal regions, so we welcome any discussions on our current work so far and/or future plans.

How to cite: Graham, A. M., Pope, R. J., and Chipperfield, M. P.: Accounting for peat fires in the Fire INventory from NCAR (FINN): Improved air pollutant emissions estimates for tropical peatlands using soil moisture, drainage density and fire history., EGU General Assembly 2026, Vienna, Austria, 3–8 May 2026, EGU26-5608, https://doi.org/10.5194/egusphere-egu26-5608, 2026.

EGU26-5840 | Orals | BG1.1

Quantifying Downwind Deposition of Wildfire-Emitted Particles to Ecosystems 

Facundo Scordo, Majid Bavandpour, Dani Or, Hamed Ebrahimian, Sudeep Chandra, and Janice Brahney

Pyrogenic airborne particle deposition downwind of active wildfires has traditionally been examined primarily as near-term hazards of fire spotting by firebrands or long-range transport of smoke particles (<10 µm). However, wildfires also emit substantial quantities of intermediate-sized airborne particles (10-2000 µm) that carry nutrients and contaminants affecting ecosystems downwind of the fire perimeter. The production, transport, and deposition of these intermediate-sized particles remain understudied. Here we develop a physics-based modeling framework for particle generation at fire lines, lofting by fire-driven convection, transport by prevailing winds, and subsequent ballistic settling. The framework enables characterization of this largely overlooked wildfire deposition footprint. Sensible heat flux from the fire feeds a convective plume capable of lofting particles to heights governed by fire intensity, particle size, shape, and density. Once aloft, particles are carried by ambient winds and ultimately ballistically deposited. The model performance was assessed using a unique dataset of particle deposition measured 3-40 km downwind of the fire front during the 2021 Caldor Fire. Supplemental observations of fire behavior, fuel properties, and meteorological conditions serve as inputs for model evaluation. The framework relies on various assumptions and constraints regarding unknown variables, including the mass fraction of emitted particles (5-7%), particle density (150-300 kg/m³), and drag coefficient formulation (fixed versus size-dependent), whose values were selected based on existing literature and physical plausibility. Over a 16-day sampling period, measured particle deposition ranged from 0.35 to 11.1 g/m². The largest deposition values (9.12-11.10 g/m²) occurred at collection sites closest to the fire (4-8 km), with progressively lower deposition (0.58-2.62 g/m²) observed at distant sites (10-40 km). When extrapolated to the landscape scale, a deposition rate of 10 g/m² over 1 km² corresponds to approximately 10 metric tons of pyrogenic material delivered to ecosystems for two weeks, an amount comparable to inputs from volcanic ashfall events. Within the modeling framework, simulations assuming a particle density of 300 kg/m³ and a pyrogenic emission fraction of 7% most closely matched field observations (RMSE < 1.8 g/m²; modest positive bias 0.8 g/m²; R > 0.90; p > 0.2). This configuration successfully reproduced both the magnitude and spatial gradients of observed pyrogenic mass deposition, demonstrating the framework’s potential to predict and quantify downwind delivery of wildfire-emitted particulate material to ecosystems.

How to cite: Scordo, F., Bavandpour, M., Or, D., Ebrahimian, H., Chandra, S., and Brahney, J.: Quantifying Downwind Deposition of Wildfire-Emitted Particles to Ecosystems, EGU General Assembly 2026, Vienna, Austria, 3–8 May 2026, EGU26-5840, https://doi.org/10.5194/egusphere-egu26-5840, 2026.

EGU26-5864 | ECS | Orals | BG1.1

Prescribed Fire Opportunities in the European Mediterranean under Climate Change 

Alice Hsu, John Abatzoglou, Paulo Fernandes, Davide Ascoli, Hamish Clarke, Cristina Santin, Marco Turco, Crystal Kolden, Juan Felipe Patino, Eric Rigolot, Rachel Carmenta, and Matthew Jones

Prescribed fire is the intentional use of fire under specific environmental conditions used to achieve specific land management objectives. Across the European Mediterranean basin, it is used for hazardous fuel reduction, pastoralism, habitat restoration, and silviculture. However, the ability to conduct prescribed burns is limited by meteorological conditions that facilitate the desired fire behavior to achieve the burns’ objectives, or the “burning window”. Under climate change, the continued availability of these conditions is highly uncertain as changes in the frequency and timing of these conditions are expected to occur. This presents a major challenge to future fire management planning. Here, we use projections of future climate based on scaling factors derived from the Coupled Model Intercomparison Project (CMIP6) and applied to ERA5 meteorology to quantify future changes in days suitable for prescribed burns (RxB days) across Mediterranean Europe. We find a 14% (-12 days) decrease in the number of RxB days across the region at a global warming level of 3.0°C, with losses most pronounced from April to October, particularly at the end of the spring burning window (May-June) and the beginning of the fall burning window (September-October). While some regions see an increase in winter burn days, these gains are outweighed by reduced burn days throughout the year. Future reductions in burn days were limited to 5% at 1.5°C, consistent with the commitments made in the Paris Agreement. Our results suggest that fire managers can expect a decline in opportunities to conduct prescribed burns, especially under higher warming scenarios. Thus, its continued use under these conditions will likely require significant investments and changes to current fire management policies to utilize and scale up remaining prescribed burning opportunities.

How to cite: Hsu, A., Abatzoglou, J., Fernandes, P., Ascoli, D., Clarke, H., Santin, C., Turco, M., Kolden, C., Patino, J. F., Rigolot, E., Carmenta, R., and Jones, M.: Prescribed Fire Opportunities in the European Mediterranean under Climate Change, EGU General Assembly 2026, Vienna, Austria, 3–8 May 2026, EGU26-5864, https://doi.org/10.5194/egusphere-egu26-5864, 2026.

EGU26-7609 | ECS | Posters on site | BG1.1

Atmospheric and landscape controls on fire size in tropical dry forests: insights from the South American Gran Chaco 

Rodrigo San Martín, Catherine Ottlé, Anna Sorenssön, Florent Mouillot, and Pradeebane Vaittinada Ayar

Fire is a dominant disturbance in tropical and subtropical dry forests and a major contributor to variability in carbon emissions, atmospheric composition, and land–atmosphere interactions. Despite their global extent and rapid transformation, the processes controlling fire size and extreme fire events in dry forest systems remain less understood than in savannas or humid tropical forests.

We investigated the controls on fire size using the South American Gran Chaco as a representative large-scale tropical dry forest system spanning strong climatic, ecological, and land-use gradients. We analyzed two decades (2001–2022) of satellite-derived fire patches from the FRY v2.0 burned-area database, combined with ERA5-Land meteorology and Fire Weather Index diagnostics, land-cover composition, landscape fragmentation metrics, topography, and anthropogenic pressure proxies. Our analysis focuses explicitly on fire size rather than fire occurrence, using statistical approaches and machine learning tools such as Random Forest models with SHAP-based interpretation to disentangle the relative and interacting roles of atmospheric forcing, landscape structure, and human-driven land transformation.

Our results show that fire size distributions are highly skewed across the region, with a small fraction of large and extreme events accounting for a disproportionately large share of total burned area. Wind and atmospheric dryness exert a strong influence on the final shape and size. At the same time, precipitation plays opposing roles by constraining fire spread through fuel moisture and enhancing fuel accumulation in fuel-limited environments. Landscape structure mediates the translation of meteorological extremes into large burned areas, with land-cover composition, fuel continuity, and fragmentation consistently ranking among the most influential predictors of burned area. Topography systematically emerges as the dominant predictor across subregions and seasons, acting not as a direct driver of fire spread but as an integrative proxy capturing hydrological gradients, vegetation structure, and human accessibility. Direct anthropogenic proxies show weaker importance at the event scale but exert strong indirect control through long-term land-use change and fuel reorganization, which in turn modulate fuel continuity and landscape configuration.

These results highlight tropical dry forests as a distinct fire domain where fire size emerges from coupled climate–biosphere–human interactions. By combining Earth observation fire products with explainable machine-learning approaches, this study advances understanding of fire–Earth system interactions and supports improved fire-risk assessment in rapidly transforming dry forest regions.

How to cite: San Martín, R., Ottlé, C., Sorenssön, A., Mouillot, F., and Vaittinada Ayar, P.: Atmospheric and landscape controls on fire size in tropical dry forests: insights from the South American Gran Chaco, EGU General Assembly 2026, Vienna, Austria, 3–8 May 2026, EGU26-7609, https://doi.org/10.5194/egusphere-egu26-7609, 2026.

EGU26-8017 | ECS | Orals | BG1.1

Annual Litter Fuel Load Estimation from Optimality-Derived Litterfall and Decomposition Dynamics 

Sophia Cain, Boya Zhou, I. Colin Prentice, and Sandy P. Harrison

Fine fuel loads ignite easily because they dry rapidly and are therefore an important driver of wildfire occurrence and spread. Accurate modelling of fine fuel load dynamics is crucial not only for current and future wildfire prediction, but also carbon cycling. Current fire-enabled dynamic global vegetation models simulate fine fuel accumulation and decomposition, but using parameters that vary with plant functional types (PFTs). Observationally derived models from satellite products provide good estimates of fine fuel loads but cannot be used to predict how these will change in response to ongoing climate changes. We have combined an eco-evolutionary modelling approach to simulate litterfall with a simple empirical model of decomposition rate to predict fine litter loads. The litterfall model predicts the amount of leaf mass that is shed using leaf economics principles and predictions of optimal leaf area index to predict litterfall for evergreen and broadleaf trees and C3 and C4 grasses. The model of decomposition rate uses a generalised linear mixed model to fit a large available dataset of decomposition rate to three variables: C:N ratio representing the litter quality and growing degree days and dry days representing local climate. Both models were independently validated using field observations collated from the literature. We show that the combined model predicts the spatial and temporal variation in fine fuel loads reasonably well when compared to field observations and existing products. This new approach provides a robust framework to derive environmentally driven changes in fine fuel loads in the context of prognostic modelling of wildfires.

How to cite: Cain, S., Zhou, B., Prentice, I. C., and Harrison, S. P.: Annual Litter Fuel Load Estimation from Optimality-Derived Litterfall and Decomposition Dynamics, EGU General Assembly 2026, Vienna, Austria, 3–8 May 2026, EGU26-8017, https://doi.org/10.5194/egusphere-egu26-8017, 2026.

The current methods to systematically validate Earth Observation (EO) products capturing transitory events such as fire activity rely mostly on the intercomparison between Near-real-time products without clearly identifying one as the reference dataset. In addition, due to the highly dynamic and ephemeral nature of such events, comparisons are restricted to near-simultaneous measurements which significantly limits the sample size of any intercomparison. In this study, we propose a new comparison framework that overcomes these limitations. This novel approach is based on a robust analysis of the frequency density (f-D) distributions of each product’s assessment of the event. We start by defining the concepts associated for distribution fitting and performance, temporal and spatial requirements, comparison metrics, and then provide an overview of the various sources of uncertainty contributing to the intercomparison exercise, and how and what uncertainties are propagated.

In this study we inter-compare eight operational remotely sensed active fire detections and fire radiative power (FRP) retrieval products: the polar-orbiter products derived from active fires detected using the Moderate Resolution Imaging Spectroradiometer data (MCD14ML), the Visible Infrared Imaging Radiometer Suite (VNP14IMGML), and the Sea and Land Surface Temperature Radiometer (SLSTR) Non-time critical product from European Space Agency (SLSTR-NTC), and the geostationary products derived from data collected by Meteosat’s Spinning Enhanced Visible and Infrared Imager (LSA-SAF FRP-PIXEL), and the three available products based on Advanced Baseline Imager (KCL/IPMA-GOES16, KCL/IPMA-GOES17, and KCL/IPMA-Himawari). We focus on annual detections and perform the analysis at 0.5° grid cell resolution, for the overlapping product’s time-series. The results are analysed for their temporal and spatial consistency, and inter-product differences are analysed in the context the product’s metadata.

The results show that an Inverse-gamma distribution can be used to characterize the fire ‘statistical signature’ and provide a reference baseline on to which all FRP products can be compared to, and their ‘representation uncertainty’ assessed. Individually, the fitting results show the degree of under representation of each sensor’s detections, namely the identification of minimum FRP detection limit, which typically precludes the detection of a proportion of the highly numerous but individually relatively small and/or low intensity fires. Furthermore, inter-comparison differences allowed for the identification, and assess the impact, of some of the key non-fire effects such as: pixel size, off-nadir pixel area growth, algorithm limitations, quality information, and the impacts of low temporal resolution of polar-orbiting sensors.

This proposed framework is a useful tool to compare EO-based FRP products and transferable to any product measuring transitory event properties that do not rely on simultaneous observations. It complements existent comparison exercises by identifying additional sources of uncertainty, the conditions under which these occur and how these translate into product inconsistencies. It is an essential tool, providing users with product-specific information on measurement limitations that, in principle, can be corrected and assimilated to higher level products and downstream applications such as GHG emission estimates from biomass burning, providing better quality information used for adaptation and mitigation policies.

How to cite: Mota, B.: Validation framework for EO measurements of transitory events based on robust statistics retrieved from non-simultaneous observations: A case study applied to Fire Radiative Power (FRP) products. , EGU General Assembly 2026, Vienna, Austria, 3–8 May 2026, EGU26-8037, https://doi.org/10.5194/egusphere-egu26-8037, 2026.

EGU26-8718 | ECS | Orals | BG1.1

Global Patterns of Post-Fire Vegetation Productivity Recovery 

Zhengyang Lin, Anping Chen, and Xuhui Wang

Fire is a major ecosystem disturbance impacting the global carbon cycle, with its frequency and severity projected to increase. The time required for ecosystems to recover productivity after fire (recovery time) is an important metric for resilience, yet its global patterns remain poorly quantified. Here, we conduct a global analysis using Moderate Resolution Imaging Spectroradiometer (MODIS) observations from 2001 to 2024. We employ satellite-derived burned area data and the near-infrared reflectance of vegetation (NIRv) as a robust proxy for Gross Primary Production (GPP) to track recovery, which is defined as the duration to recover 90% of pre-fire productivity. Our analysis focuses on single-fire events, filtering out areas with recurrent disturbances, and defines recovery as the point when at least 90% of pre-fire productivity is regained.

Our results reveal that the global mean post-fire recovery time is 3.9 ± 0.3 years. This average is masked by strong geographical disparities: recovery follows a pronounced latitudinal gradient, with boreal ecosystems (≥50°N) requiring nearly twice as long to recover (5.6 ± 0.5 years) compared to tropical regions (3.0 ± 0.2 years). Evergreen needleleaf forests exhibit the longest recovery times (6.3 ± 0.9 years), while savannas and grasslands recover fastest. Statistical machine learning modeling identifies the magnitude of the immediate fire-induced GPP loss as the dominant factor controlling recovery duration, with burn severity and pre-fire productivity acting as important secondary drivers.

We show that CMIP6 Earth System Models (ESMs) significantly underestimate these recovery periods (simulating a global mean of 1.8 ± 0.1 years) and fail to capture the observed spatial heterogeneity, particularly in high-latitude regions. This suggests that current models may overestimate the carbon sink capacity of regenerating post-fire landscapes and underestimate positive fire-vegetation feedbacks. Our findings provide a new observational benchmark for improving the representation of post-disturbance dynamics in land surface models and refining global carbon budget assessments.

How to cite: Lin, Z., Chen, A., and Wang, X.: Global Patterns of Post-Fire Vegetation Productivity Recovery, EGU General Assembly 2026, Vienna, Austria, 3–8 May 2026, EGU26-8718, https://doi.org/10.5194/egusphere-egu26-8718, 2026.

Variability in cloud droplet number concentrations (Nd) within the large subtropical stratocumulus decks can strongly impact outgoing shortwave radiation. The southeast Atlantic subtropical stratocumulus deck is particularly prone to elevated Nd, attributed to continental African fire emissions.  The highest stratocumulus Nd occur when Angolan agricultural fires coincide with weak surface warming during the austral winter months (June-early August). Dry convection fills a shallow continental boundary layer with smoke and a nighttime land breeze advects the aerosol into or slightly above the marine boundary layer. The offshore transport is strengthened by low-level easterlies from a continental high to the southeast of Angola that is stronger when the Angolan land is cooler. Simultaneously, the south Atlantic subtropical high (SASH) is weaker when Angolan land warming is more muted, allowing the biomass-burning aerosol to also disperse further south. The shortwave-absorbing aerosol can either reach the remote boundary layer by direct low-lying easterly transport, or through entrainment over longer time scales after being transported south. While the weak Angolan land heating in June-July correlates with higher offshore Nd, these coincide with lower cloud fractions and thinner clouds, primarily because the SASH is also weaker. This meteorological co-variation fully compensates for any aerosol brightening of the cloud deck. Marine cloud brightening by emissions from a southeast Atlantic shipping lane is more evident when Angolan land heating is stronger, coinciding with a stronger SASH, as the background Nd is less and the background cloud fraction is higher. Most of the year-to-year variability from 2003 to 2023 in the June-July marine shortwave cloud radiative effect can be constrained using the surface-level temperature over Angola (r2 = 0.4). While Angolan land has warmed slightly in June-July since 1980 in reanalysis, no trend is evident in synoptic variations of warmer versus cooler heating. Fire emissions have slightly increased since 2003. A continuing warming trend would deepen the continental boundary layer, and could place more of the transported smoke above the marine boundary layer, stabilizing the lower atmosphere through shortwave absorption.

How to cite: Zuidema, P. and Tatro, T.: Weak, low-level dry convection over Angola determines biomass-burning aerosol entry into the marine boundary layer, EGU General Assembly 2026, Vienna, Austria, 3–8 May 2026, EGU26-8759, https://doi.org/10.5194/egusphere-egu26-8759, 2026.

EGU26-9005 | ECS | Orals | BG1.1

Impacts of 2023 Canadian wildfire emissions on solar power over North America and Europe 

Iulian-Alin Rosu, Matthew W. Jones, Manolis Grillakis, Manolis P. Petrakis, Matthew Kasoar, Rafaila-Nikola Mourgela, and Apostolos Voulgarakis

Wildfires are unpredictable combustion events that significantly drive atmospheric emissions and modulate global cloud cover. An extreme example of such an event is the case of the 2023 Canadian wildfires, wherein nearly 5% of Canada’s forested area was burned between May and September 2023 [1]. This event produced the largest wildfire emissions ever recorded in Canada, with plumes extending across the Northern Hemisphere [2]. Aerosol intrusions and associated modifications absorbing and/or scattering can cause variability of solar irradiance [3], while reductions in photovoltaic power anywhere between 13% and 22% can take place because of aerosol optical depth (AOD) increases [4]. Consequently, the plumes resultant from the 2023 Canadian wildfires might have caused significant photovoltaic power losses over North America and Europe.

In this work, the global and local atmospheric impacts of this historic wildfire event are investigated using the EC‑Earth3 Earth system model in the interactive aerosols and atmospheric chemistry configuration (AerChem) [5]. BB emissions from the Copernicus Atmosphere Monitoring Service (CAMS) Global Fire Assimilation System (GFAS) were used through the model to produce two 10-member ensemble simulations, with and without the 2023 Canadian wildfire emissions respectively. The main parameter of interest is the modelled surface downwelling flux anomaly, which enables direct inference of modelled reductions in solar power output.

Model results have shown substantial radiative anomalies during May–September 2023 mainly in North America and Europe, with an average hemispheric shortwave radiation reduction of −4.18 W/m2 leading to PV production deficits. Secondary analyses suggest that surface cooling, which amounted to an average hemispheric temperature anomaly of −0.91 °C and which impacts PV performance, compensated 8–21% of the PV losses, varying by region. The results indicate a total 5-monthly modelled PV generation loss of 6.38 TWh, and the emitted carbon burden equivalent to this reduction in energy production is estimated at 2083 tons of CO2, with a total associated economic deficit of 1.33 billion euros. These findings emphasize the need for integrated transnational strategies in extreme event prediction and wildfire prevention to ensure the continued resilience of renewable energy production.


[1] Roșu, I. A., Mourgela, R. N., Kasoar, M., Boleti, E., Parrington, M., & Voulgarakis, A. (2025). Large-scale impacts of the 2023 Canadian wildfires on the Northern Hemisphere atmosphere. npj Clean Air, 1(1), 22.

[2] Byrne, B., Liu, J., Bowman, K. W., Pascolini-Campbell, M., Chatterjee, A., Pandey, S., ... & Sinha, S. (2024). Carbon emissions from the 2023 Canadian wildfires. Nature, 633(8031), 835-839.

[3] Wendisch, M., & Yang, P. (2012). Theory of atmospheric radiative transfer: a comprehensive introduction. John Wiley & Sons.

[4] Neher I., Buchmann T., Crewell S., Pospichal B. & Meilinger S. (2019). Impact of atmospheric aerosols on solar power. Meteorologische Zeitschrift, 4, 28.

[5] Van Noije, T., Bergman, T., Le Sager, P., O'Donnell, D., Makkonen, R., Gonçalves-Ageitos, M., ... & Yang, S. (2020). EC-Earth3-AerChem, a global climate model with interactive aerosols and atmospheric chemistry participating in CMIP6. Geoscientific Model Development Discussions, 1-46.

How to cite: Rosu, I.-A., Jones, M. W., Grillakis, M., Petrakis, M. P., Kasoar, M., Mourgela, R.-N., and Voulgarakis, A.: Impacts of 2023 Canadian wildfire emissions on solar power over North America and Europe, EGU General Assembly 2026, Vienna, Austria, 3–8 May 2026, EGU26-9005, https://doi.org/10.5194/egusphere-egu26-9005, 2026.

EGU26-9056 | ECS | Orals | BG1.1

Fire as a Catalyst for Carbon Sequestration: Respiration Suppression and Regeneration Feedback in South African Fynbos Shrubland 

Jonathan D. Muller, Warren Joubert, Abri de Buys, Erin Ramsay, Richard Carkeek, and Guy F. Midgley

Wildfires are mainly considered to be CO2-releasing events, while their long-term impact on biogeochemical carbon sequestration remains a major source of uncertainty. We analysed five years of ecosystem-scale eddy covariance data in a South African Fynbos shrubland that experienced a wildfire in the middle of the measurement period and combined it with leaf-scale ecophysiological measurements to quantify the ecosystem-scale carbon feedbacks and energy flux shifts following wildfire.

Unexpectedly, wildfire doubled the annual net carbon sink from 5.36 to 10.55 tC ha-1 yr-1. This increase was driven by a ca. 50% suppression of ecosystem respiration while ecosystem energy exchange remained stable. These findings reveal a significant missing carbon pool of ca. 110 tC ha-1 over the course of the fire return interval of 15-20 years. Likely explanations for this discrepancy are either a below-ground carbon pool protected from volatilization through fire or a potential sink into dissolved carbon, potentially leading to eventual long-term ocean storage.

To identify the biological drivers of this carbon sequestration, we measured gas exchange in the two main regeneration plant types of this fire-dominated ecosystem, i.e. obligate reseeders, whose seedlings must achieve reproduction before the next fire to persist, and resprouting species that invest into fire tolerance traits at the cost of slower growth. Stomatal conductance (gsw) was the primary trait distinguishing the two strategies. Reseeders initiated photosynthesis earlier in spring and exhibited gsw that was highly responsive to changes in ambient CO2 and light, while resprouters exhibited stronger resilience to drought but no response to ambient CO2 fluctuations. This difference in response to CO2 suggests that current climate trends may preferentially boost reseeders, potentially partially offsetting the impacts of shortened fire return intervals. Conversely, resprouter resilience may prove crucial under a higher drought intensity and duration scenario.

Our unexpected findings for this Mediterranean-climate shrubland (typically considered to be a low carbon sink ecosystem) underscore the necessity for ground-based ecophysiological data to constrain Earth system models, and challenge biomass-centric climate policies, particularly in fire-prone, naturally tree-free ecosystems.

How to cite: Muller, J. D., Joubert, W., de Buys, A., Ramsay, E., Carkeek, R., and Midgley, G. F.: Fire as a Catalyst for Carbon Sequestration: Respiration Suppression and Regeneration Feedback in South African Fynbos Shrubland, EGU General Assembly 2026, Vienna, Austria, 3–8 May 2026, EGU26-9056, https://doi.org/10.5194/egusphere-egu26-9056, 2026.

The late dry season of 2019 featured one of the most severe Indonesian wildfire events of the past decade, driven by persistent drought and extensive peatland burning. These extreme wildfires emitted large amounts of carbonaceous aerosols, substantially degrading air quality and posing risks to human health. However, the impacts of extreme wildfire events on black carbon (BC) across Southeast Asia remain poorly quantified. Here, we evaluate the influence of Indonesian wildfires during August–October 2019 using the GEOS-Chem chemical transport model at 0.25° × 0.3125° resolution. Sensitivity simulations with and without Indonesian fire emissions are conducted to isolate fire-driven contributions to BC. Results indicate dominant wildfire control over BC across Southeast Asia. Fire contributions reach about 91% over both Borneo and Sumatra during peak burning. Comparable fire influence extends to nearby seas, particularly the South China Sea, with contributions exceeding 90% over the southern South China Sea. Contributions remain near 70% over the Sulu and Celebes Seas and still reach about 50% over the Philippine Sea. In contrast, impacts over the East China Sea are episodic, occurring only during short-lived northeastward outflow events. These findings demonstrate the strong and spatially heterogeneous influence of Indonesian wildfires on regional BC across Southeast Asia, highlighting the role of extreme wildfire events in shaping air quality through fire-driven transboundary transport.

How to cite: Zheng, H.: Impacts of the 2019 extreme Indonesian wildfires on black carbon across Southeast Asia, EGU General Assembly 2026, Vienna, Austria, 3–8 May 2026, EGU26-9088, https://doi.org/10.5194/egusphere-egu26-9088, 2026.

EGU26-9452 | Posters on site | BG1.1

How asynchronous is fire burning in Iberia and the Central–Eastern Mediterranean? A dependence analysis of burned area, fire activity, and teleconnection forcing to inform shared European suppression fleets 

Ana Russo, Célia Gouveia, Virgílio Bento, João M. N. Silva, Carlos DaCamara, Ricardo M. Trigo, and José M. C. Pereira

European wildfire response systems are increasingly challenged by the simultaneous demand for aerial and ground suppression assets. If major fire-prone regions burn asynchronously, Europe could benefit from risk-diversified deployment of shared suppression fleets and more efficient cross-border mutual-aid strategies. We test the hypothesis that fire activity in (1) the Iberian Peninsula (Portugal and Spain) and (2) Central–Eastern Mediterranean (Italy and Greece) exhibits identifiable and temporally stable dependence patterns modulated by large-scale climate variability.
Annual burned-area time series covering 1980–2023 are compiled from the European Forest Fire Information System (EFFIS). These are complemented by satellite-derived indicators of fire activity from MODIS, namely Fire Radiative Power (FRP), enabling joint assessment of burned area extent and fire intensity. Climate-fires’ dependence is quantified through correlations of annual and seasonal anomalies and joint-extreme metrics focused on tail co-exceedance probability. The relationship between fire activity (burned area, FRP, FRE) and large-scale climate variability is assessed following established teleconnection-based frameworks, combining seasonal aggregation, lagged cross-correlation analysis, and composite analysis of extreme fire years. Teleconnection indices considered include the North Atlantic Oscillation (NAO), East Atlantic pattern (EA), Mediterranean Oscillation Index (MOI), Arctic Oscillation (AO), and ENSO. Analyses explicitly account for the non-stationary and scale-dependent nature of teleconnection–fire relationships, and are conditioned on regional temperature and precipitation anomalies to isolate circulation-driven effects.

The analysis aims to identify: (i) the frequency and persistence of synchrony versus compensatory (negative) dependence in burned area and fire activity between the two macro-regions, (ii) the teleconnections most strongly associated with synchronous extreme fire seasons, and (iii) multi-decadal periods offering potential for suppression-fleet diversification. Owing to its direct control on Mediterranean-scale pressure gradients and precipitation contrasts, MOI provides the primary explanatory signal for synchronous versus compensatory fire activity between the two macro-regions.

Results are interpreted within an operational risk-pooling framework, where weak or negative dependence supports climate-informed scheduling of shared European suppression fleets and enhanced cross-border mutual aid, while strong positive dependence indicates heightened likelihood of concurrent continental-scale resource strain.


This work is partially supported by FCT, I.P./MCTES through national funds (PIDDAC): LA/P/0068/2020 – https://doi.org/10.54499/LA/P/0068/2020, UID/50019/2025 – https://doi.org/10.54499/UID/PRR/50019/2025, UID/PRR2/50019/2025 and Dhefeus (https://doi.org/10.54499/2022.09185.PTDC). AR, JMCP and JMNS also thank the FCT by supporting UIDB/00239/2020 (https://doi.org/10.54499/UIDB/00239/2020), UIDP/00239/2020 (https://doi.org/10.54499/UIDP/00239/2020), and through project references UIDB/00239/2020 (https://doi.org/10.54499/UIDB/00239/2020) and UIDP/00239/2020 (https://doi.org/10.54499/UIDP/00239/2020) and European Space Agency Climate Change Initiative (ESA-CCI9 Tipping Elements SIRENE project (Contract No. 4000146954/24/I-LR). 

How to cite: Russo, A., Gouveia, C., Bento, V., Silva, J. M. N., DaCamara, C., Trigo, R. M., and Pereira, J. M. C.: How asynchronous is fire burning in Iberia and the Central–Eastern Mediterranean? A dependence analysis of burned area, fire activity, and teleconnection forcing to inform shared European suppression fleets, EGU General Assembly 2026, Vienna, Austria, 3–8 May 2026, EGU26-9452, https://doi.org/10.5194/egusphere-egu26-9452, 2026.

EGU26-10271 | Orals | BG1.1

First results from INFLAMES - Interdisciplinary Network for Fire research from Low Earth Orbit Atmospheric Measurements 

K. Folkert Boersma, Martin de Graaf, Otto Hasekamp, Marloes Penning de Vries, Anton Vrieling, Nick Schutgens, Gerbrand Koren, Peter van Bodegom, Dimitra Kollia, Manouk Geurts, and Annabel Chantry

Wildfires are powerful forces of nature, shaping ecosystems, degrading air quality, and influencing the climate. Human activities intensify fires through land use change, accidental ignitions, and droughts driven by climate change. However, the complex interactions between climate change, vegetation shifts, and human behavior—and their consequences for wildfires—remain poorly understood. The Dutch innovations in atmospheric satellite sensors SPEXone, EarthCARE and TROPOMI now allow detailed studies of wildfires and their nearby and far-reaching consequences. The recently funded and started INFLAMES-project (Interdisciplinary Network for Fire research from Low Earth Orbit Atmospheric Measurements) aims to combine cutting-edge satellite data with state-of-the-art modeling techniques to unravel how wildfires alter air quality and climate, with a special focus on vegetation’s evolving role—both as a fuel source and a carbon sink in fire-affected regions. 

In this presentation, we demonstrate the scientific ambition of the INFLAMES-project. We then show the first scientific results from INFLAMES, including satellite-derived trace gas (NOx, VOCs) and aerosol emission estimates for severe fires in Les Landes, France (August 2022), based on TROPOMI and MODIS observations and evaluated against the GFED emission inventory. We further show the first coincident EarthCARE, PACE and TROPOMI observations of wildfire plume heating-rate profiles over the Pantanal, demonstrating the potential of combined active–passive satellite measurements to directly constrain aerosol radiative effects. Together, these results establish a pathway toward improved quantification of the Aerosol Direct Radiative Effect (ADRE), a major remaining uncertainty in present-day radiative forcing, which will be further addressed using aerosol microphysical constraints from SPEXone on PACE. We conclude by highlighting opportunities for broader community engagement through dedicated workshops and an international summer school.

How to cite: Boersma, K. F., de Graaf, M., Hasekamp, O., Penning de Vries, M., Vrieling, A., Schutgens, N., Koren, G., van Bodegom, P., Kollia, D., Geurts, M., and Chantry, A.: First results from INFLAMES - Interdisciplinary Network for Fire research from Low Earth Orbit Atmospheric Measurements, EGU General Assembly 2026, Vienna, Austria, 3–8 May 2026, EGU26-10271, https://doi.org/10.5194/egusphere-egu26-10271, 2026.

EGU26-10325 | ECS | Orals | BG1.1 | Highlight

Tropical Small-Scale Nuclear War Fire Emissions Cause Greater Ozone Depletion Than Extratropical Large-Scale Conflicts 

Zhihong Zhuo, Francesco S. R. Pausata, Kushner J. Paul, and Anson K. H. Cheung

Nuclear conflict can ignite widespread fires that inject massive quantities of smoke particles into the atmosphere. Using the chemistry–climate model CESM2-WACCM6, we simulate idealized nuclear war scenarios with varying emission magnitudes of black carbon (BC) and primary organic matter (POM) released at 150~300 hPa over a 7-day period. Model results show that absorption of solar radiation by BC and POM leads to stratospheric temperature increases exceeding 50 K. This intense heating enhances the vertical lofting of smoke particles, enabling their transport even into the lower mesosphere and significantly extending their atmospheric residence time to over 4 years, thus leading to long-term environmental and climatic impacts. Even a regional nuclear conflict between India and Pakistan, emitting 5 Tg of BC (IP-5B scenario), results in a global total column ozone reduction exceeding 400 Tg (~12%), comparable in magnitude to that simulated for a large-scale nuclear war between USA and Russia with 16 Tg of BC emissions (UR-16B scenario). The co-emission of POM further amplifying stratospheric ozone depletion, leading to increased ultraviolet (UV) radiation at the surface. This heightened UV exposure poses serious risks to ecosystems and human health.

How to cite: Zhuo, Z., Pausata, F. S. R., Paul, K. J., and Cheung, A. K. H.: Tropical Small-Scale Nuclear War Fire Emissions Cause Greater Ozone Depletion Than Extratropical Large-Scale Conflicts, EGU General Assembly 2026, Vienna, Austria, 3–8 May 2026, EGU26-10325, https://doi.org/10.5194/egusphere-egu26-10325, 2026.

EGU26-11040 | Orals | BG1.1

Linking Air Quality and Marine Ecosystem Responses to Biomass Burning Aerosols in the Adriatic Coastal Zone 

Sanja Frka, Ana Depolo, Jasna Arapov, Sanda Skejić, Danijela Šantić, Ana Cvitešić Kušan, Fred Chaux, Estela Vicente, Célia Alves, and Lara Bubola

Climate change projections point to a sustained rise in emissions from biomass burning (BB), highlighting the need for a comprehensive evaluation of the environmental impacts of BB-derived aerosols (BBA). Of particular importance is the organic aerosol fraction (BBOA), which is chemically reactive and undergoes complex transformations during atmospheric ageing. These processes are especially critical in coastal regions, where strong coupling between atmospheric and marine systems can amplify environmental and ecological risks. In this study, we apply a multidisciplinary framework combining atmospheric chemistry, aerosol characterization, modeling, marine science, and toxicology to investigate the physicochemical properties of BBA, with emphasis on BBOA, and to assess how their atmospheric evolution affects air quality and marine ecosystems.

A comprehensive field campaign was conducted in the central Adriatic region, an area frequently impacted by intense wildfire events yet still poorly characterized in terms of BB influences. During controlled pinewood biomass burning experiments in April 2025, real-time measurements were conducted using state-of-the-art instrumentation, including a Scanning Mobility Particle Sizer (SMPS), an Optical Particle Counter (OPC), gas analyzers, and a CASS system combining an Aethalometer and a Total Carbon Analyzer. In parallel, fine particulate matter (PM2.5), volatile organic compounds (VOCs), and size-resolved aerosols (0.010–32 µm) were collected for comprehensive offline analyses, including the determination of trace metals, major ions, anhydrosugars, polyols, organic carbon, and aerosol oxidative potential.

To link atmospheric processes with marine impacts, laboratory exposure experiments were performed to evaluate the effects of ambient BB aerosols and model black carbon materials on the growth of representative marine phytoplankton species (such as Emiliania huxleyi, Cylindrotheca closterium, Melosira nummuloides, Synechococcus sp.) under controlled conditions (18 °C; 16 h light/8 h dark). These experiments reveal species-specific physiological responses to BB aerosol exposure. Overall, the integrated dataset provides new insights into the properties and evolution of BB aerosols and their cascading impacts on coastal air quality and marine ecosystem health in the Adriatic region, with broader implications for other vulnerable coastal environments.

This work was supported by Croatian Science Foundation project IP-2024-05-6224 ADRIAirBURN.

How to cite: Frka, S., Depolo, A., Arapov, J., Skejić, S., Šantić, D., Cvitešić Kušan, A., Chaux, F., Vicente, E., Alves, C., and Bubola, L.: Linking Air Quality and Marine Ecosystem Responses to Biomass Burning Aerosols in the Adriatic Coastal Zone, EGU General Assembly 2026, Vienna, Austria, 3–8 May 2026, EGU26-11040, https://doi.org/10.5194/egusphere-egu26-11040, 2026.

EGU26-11423 | Posters on site | BG1.1

Integrating the Global Forest Fire Emissions Prediction System version 1.0 to GEOS-Chem  

Timothé Payette, Samaneh Ashraf, Patrick Hayes, and Jack Chen

Wildfire smoke is an increasingly important driver of regional air-quality degradation, with well-established impacts on public health and visibility. Although emission controls have reduced many anthropogenic air pollutants over recent decades, wildfire activity has intensified in many regions, increasing the contribution of fine particulate matter (PM2.5; aerodynamic diameter < 2.5 μm) to surface pollution episodes. A key limitation in simulating wildfire smoke in chemical transport models is uncertainty in biomass-burning emissions, as inventories can have different mythologies and assumptions, such as fire occurrence, intensity, burn area, fuel characterization, and emission factors. These discrepancies can translate into substantial variability in modeled PM2.5 and related co-emitted species, complicating both forecasting and attribution of smoke impacts. Here, we implement and evaluate the Global Forest Fire Emissions Prediction System (GFFEPS), a wildfire emissions framework developed by Environment and Climate Change Canada (ECCC), within the GEOS-Chem chemical transport model. We perform simulations for Canada, the United States, and Europe in 2019, and for Australia in 2019–2020, to quantify the sensitivity of simulated smoke to fire emissions and to assess model skill against observations. GFFEPS-driven simulations are compared with those using widely applied global biomass-burning inventories (the Global Fire Emissions Database (GFED), the Global Fire Assimilation System (GFAS), and the Quick Fire Emissions Dataset (QFED2)) and evaluated using ground-based PM2.5 monitoring data across each region. Inventory choice strongly influences both the magnitude and timing of simulated PM2.5 enhancements, with clear regional dependence and the largest inter-inventory spread during extreme fire events. Over North America, GFFEPS shows the best overall performance among the four inventories based on the mean error metric. Over Australia, GFFEPS generally underestimates PM2.5 concentrations but remains a strong performer, ranking second behind GFAS using the same evaluation metric. Over Europe, GFFEPS ranks third, following GFAS and GFED, and is closely comparable to QFED2. These results highlight the need to better constrain fire detection and fuel consumption estimates, and demonstrate the value of GFFEPS within GEOS-Chem for diagnosing key drivers of inter-inventory differences and improving confidence in regional wildfire smoke simulations.

How to cite: Payette, T., Ashraf, S., Hayes, P., and Chen, J.: Integrating the Global Forest Fire Emissions Prediction System version 1.0 to GEOS-Chem , EGU General Assembly 2026, Vienna, Austria, 3–8 May 2026, EGU26-11423, https://doi.org/10.5194/egusphere-egu26-11423, 2026.

EGU26-11440 | Orals | BG1.1

A global CO fire emissions assessment and its connection with drought events 

Hélène Peiro, Ivar van der Velde, Guido van der Werf, Sander Houweling, Pieter Rijsdijk, and Ilse Aben

Fire is a dominant terrestrial ecosystem disturbance and a major driver of atmospheric composition. Quantifying fire emissions and their variability remains a key challenge, particularly as fire frequency and intensity vary and increase under climate change. Inverse modeling provides a powerful framework to estimate fire emissions by constraining chemistry transport models (CTMs) with satellite observations, while simultaneously delivering three-dimensional information on the transport and distribution of fire-related pollutants.

In this study, we use the global CTM TM5 coupled with a four-dimensional variational data assimilation system (TM5-4DVar) to better constrain fire-related carbon monoxide (CO) emissions using satellite observations. We assimilate CO column super-observations from the Measurements of Pollution In The Troposphere (MOPITT) instrument aboard NASA’s Terra satellite (version 9) and, separately, higher spatiotemporal resolution CO observations from the TROPOspheric Monitoring Instrument (TROPOMI) aboard ESA’s Sentinel-5P. The assimilations are performed globally at 3° × 2° horizontal resolution over multiple years (2019–2024).

The posterior simulations provide insights into both regional fire emissions and the horizontal and vertical transport of CO, enabling assessment of downwind pollution impacts, evaluated against independent ground-based observations. Results show bias reductions with posterior simulated mixing ratios in comparison to prior simulations based on bottom-up emission inventories. We further investigate the influence of regional drought conditions on fire-related CO emissions and examine correlations with key environmental variables, including climate and vegetation indicators. Our results contribute to an improved understanding of interactions among fire emissions, climate, and atmospheric composition, and demonstrate the value of remote sensing data assimilation for reducing uncertainties and advancing fire emission monitoring.

How to cite: Peiro, H., van der Velde, I., van der Werf, G., Houweling, S., Rijsdijk, P., and Aben, I.: A global CO fire emissions assessment and its connection with drought events, EGU General Assembly 2026, Vienna, Austria, 3–8 May 2026, EGU26-11440, https://doi.org/10.5194/egusphere-egu26-11440, 2026.

EGU26-11975 | Orals | BG1.1

Impacts of wildfire plumes from Northern America on atmospheric composition as observed by permanent observatories in Italy during June 2025 

Paolo Cristofanelli, Francesca Barnaba, Alessandro Bracci, Claudia Roberta Calidonna, Rita Cesari, Daniele Contini, Luca Diliberto, Francesco d'Amico, Stefano Decesari, Adelaide Dinoi, Leonardo Gori, Angela Marinoni, Lucia Mona, Davide Putero, Isabella Zaccardo, and Marco Zanatta

In May and June 2025, wildfires in Canada produced atmospheric effects extending beyond North America. Large quantities of gases and aerosols emitted by biomass combustion were transported across the Atlantic and reached Europe. Here, our aim is to investigate how these events affect the variability of climate-altering species in Italy using observations from permanent observatories.

Clear evidences of this long-range transport were observed from 8th June 2025 at the GAW/WMO Global Station “O. Vittori” at Monte Cimone (2165 m a.s.l., northern Italy) and at the Potenza CIAO observatory (760 m a.s.l., southern Italy), two co-located sites for the Research Infrastructures ICOS and ACTRIS. It was also observed, albeit with weaker intensity, at the ACTRIS Environmental-Climate Observatory (ECO) in Lecce (37 m a.s.l., southern Italy). Atmospheric transport modelling (LAGRANTO and HYSPLIT back-trajectories) confirmed that the air masses affecting the sites originated in North America.

Average daily carbon monoxide (CO) values peaked to 207 ppb on 9th June at CMN and to 247 ppb at ECO, nearly doubling the levels measured during the preceding 7 days. Also, black carbon (BC) showed marked increases, with values more than doubling the average of the preceding days at both sites.

Additional confirmation of the plume’s arrival and vertical evolution was provided by the ALICE-Net ceilometer at CMN: between 6th and 8th June, aerosol-rich layers were detected at high altitudes before gradually descending to the measurement site. At CIAO, the aerosol lidar observed smoke layers between 11 and 14 km from 5th to 10th June.

CO and ozone (O₃) remained high until 13th June at CMN (average values: 188 ppb and 70 ppb), and at ECO (average CO value of 232 ppb, O3 data not available). Subsequently, intermediate values have been observed from 14th to 21st June. At CIAO, CO increased between 8th and 17th June, reaching up to 250 ppb.

No corresponding increases in carbon dioxide (CO₂) have been observed during the wildfire plume event. During the days characterized by the peaks in CO and O3 (8th  – 13th June), daily mean CO2 values showed a – 6.4 ppm and – 3.4 ppm decrease with respect to the previous 7 days at CMN and ECO. The analysis of back-trajectories showed air masses travelling at pressure levels representative of the European PBL, where active ecosystems could take up CO₂, in the 24 hours before the arrival at CMN.

The analysis of the day-to-day variability of nighttime/daytime N2O, CO2 and δ13CO2, pointed to a significant influence of air masses from the regional PBL to CMN during the daytime on 9th – 14th and 18th – 19th June. This suggests that emissions occurring at regional scale could contribute to the observed atmospheric composition variability. Together with the role of air mass mixing and in-plume chemical processes along transport, this implies that attributing the observed enhancements to wildfire emissions requires careful and critical evaluation.

Acknowledgments: Observations/analyses are supported by the ITINERIS (PE0000021, NRRP – NextGenerationEU) and PRO-ICOS MED (PON 2014–2020) projects, funded by the Italian Ministry of University and Research and the European Union.

How to cite: Cristofanelli, P., Barnaba, F., Bracci, A., Calidonna, C. R., Cesari, R., Contini, D., Diliberto, L., d'Amico, F., Decesari, S., Dinoi, A., Gori, L., Marinoni, A., Mona, L., Putero, D., Zaccardo, I., and Zanatta, M.: Impacts of wildfire plumes from Northern America on atmospheric composition as observed by permanent observatories in Italy during June 2025, EGU General Assembly 2026, Vienna, Austria, 3–8 May 2026, EGU26-11975, https://doi.org/10.5194/egusphere-egu26-11975, 2026.

The 2019–2020 Australian Black Summer megafires burned over eight million hectares of vegetation and constituted an extreme perturbation to terrestrial carbon cycling, releasing an unprecedented quantity of greenhouse gases to the atmosphere. Quantifying fire-driven emissions remains a key challenge, as emission inventories typically fall into one of two categories; bottom-up approaches (such as with the Global Fire Emission Database, GFED) that rely on burned area, fuel load, and combustion completeness estimates, or top-down approaches, (such as the Global Fire Assimilation System, or GFAS) which scale Fire Radiative Power (FRP) observations to emissions using emission coefficients. Currently, the two most widely used inventories (GFED and GFAS) ultimately rely heavily on uncertain modelled estimates of broad scale biome-specific combustion completeness, which remains a major limitation in constraining carbon fluxes from fires. We apply the Fire Radiative Energy Emission (FREM) approach, a top-down framework that directly links observed Fire Radiative Energy (FRE) to trace gas emissions, thereby reducing reliance on poorly constrained fuel and combustion assumptions. FREM is derived from co-located observations of FRP from the geostationary Himawari satellite and carbon monoxide (CO) from TROPOMI aboard Sentinel-5P. A dataset of 580 cloud-free landscape fires and associated plumes across six major Australian biomes (low woodland savanna, grassland, shrubland, evergreen and deciduous broadleaf forests, and sparse vegetation) was assembled for 2019 to derive biome-specific emission coefficients relating FRE to excess CO. These coefficients, combined with a calculated small-fire correction factor and hourly FRE observations from Himawari, were used to estimate emissions from the Black Summer megafires and to compare FREM-derived fluxes with those from existing inventories (GFAS v1.2, GFED v4.1s, GFED v5.1, and the Fire Energetics and Emissions Research, or FEER). The FREM estimates exhibit coherent spatial and temporal patterns and fall within the spread of emissions reported by these inventories, indicating consistency at regional scales while retaining sensitivity to fire intensity and temporal variability. By utilizing the geostationary FRP observations from Himawari, the FREM approach provides high-temporal-resolution, near-real-time estimates of fire emissions across Australia that are directly linked to observed radiative energy release, and bypasses the need for fuel load and combustion completeness estimations.

How to cite: Maslanka, W., Xu, W., Wooster, M., and He, J.: Quantifying Greenhouse Gas emissions from the Australian Black Summer Megafires using the Fire Radiative Energy Emission (FREM) Approach, EGU General Assembly 2026, Vienna, Austria, 3–8 May 2026, EGU26-12220, https://doi.org/10.5194/egusphere-egu26-12220, 2026.

EGU26-12251 | Orals | BG1.1

Feedback Loop between fire and land degradation 

Diana Vieira, Pasquale Borrelli, and Panos Panagos

Wildfires are increasingly shaping terrestrial ecosystems, with profound implications for land degradation processes across fire-prone regions.

This work advances the assessment of post-fire land degradation by jointly analysing fire occurrence, burn severity and vegetation recovery as key indicators of ecosystem vulnerability. By integrating multi-temporal fire records (2001-2019) the study captures both the frequency of disturbances and its immediate ecological impact, enabling another view on the evaluation of degradation trajectories globally (Vieira et al., 2026) .

Results indicate that recurrent fires, particularly when combined with high-severity events, substantially exacerbate vegetation loss, and erosion risk, thereby accelerating land degradation processes. Preliminary results indicate that areas experiencing short fire-return intervals show limited recovery capacity, leading to cumulative impacts on soil health, which on turn might be leading to alternate states (McGuire et al., 2024) . The analysis further highlights strong spatial variability, where land cover, and pre-fire conditions influence degradation response.

Overall, this work underscores the importance of moving beyond binary burned–unburned classifications and incorporating fire severity and recurrence into land degradation assessments. Such an approach provides critical insights for post-fire management, restoration prioritisation, and the development of adaptive strategies aimed at mitigating long-term degradation under a changing fire regime.


McGuire, L. A., Ebel, B. A., Rengers, F. K., Vieira, D. C. S., and Nyman, P.: Fire effects on geomorphic processes, Nat Rev Earth Environ, 1–18, https://doi.org/10.1038/s43017-024-00557-7, 2024.

Vieira, D. C. S., Borrelli, P., Scarpa, S., Liakos, L., Ballabio, C., and Panagos, P.: Global estimation of post-fire soil erosion, Nat. Geosci., 19, 59–67, https://doi.org/10.1038/s41561-025-01876-0, 2026.

How to cite: Vieira, D., Borrelli, P., and Panagos, P.: Feedback Loop between fire and land degradation, EGU General Assembly 2026, Vienna, Austria, 3–8 May 2026, EGU26-12251, https://doi.org/10.5194/egusphere-egu26-12251, 2026.

EGU26-13135 | ECS | Orals | BG1.1

Benefits and limits of Integrated Fire Management for climate change adaptation: a global quantitative assessment  

Oliver Perkins, Matthew Kasoar, Olivia Haas, Cathy Smith, Joao Teixeira, Apostolos Voulgarakis, Jay Mistry, and James Millington

Wildfires are increasing in severity and harm to humans, creating a pressing climate change adaptation challenge. Current firefighting-focused management approaches in the Global North can drive fuel accumulation and increased fire intensity. In contrast, Indigenous peoples and local communities have used controlled burning to successfully co-exist with fire for at least 50,000 years. Consequently, intentional and controlled burning of landscape vegetation has been suggested as a strategy to adapt to climate-altered fire regimes in an approach known as Integrated Fire Management.  

Here, we present the first quantitative global assessment of controlled burning in Integrated Fire Management (IFM) for climate change adaptation, using the JULES-INFERNO dynamic global vegetation model coupled to the WHAM! agent-based model of human fire use and management. WHAM! has agent types to represent both fire exclusionary, suppression-oriented and pyro-inclusive, controlled burning (IFM) land manager approaches. This new online coupling includes novel representations of human fire use seasonality and fireline intensity. Modelled fireline intensity, accounting for climate, fuel and human management now drives fire-induced vegetation mortality in JULES. Hence, the WHAM-JULES-INFERNO ensemble can assess the human and climate drivers of future fire intensity, and also fire-vegetation feedbacks resulting from contrasting management approaches.  

We explored two Shared Socio-Economic Pathways (SSP1.26 and SSP3.70), using gridded socio-economic capitals consistent with the SSP scenarios and biophysical forcings from three ISIMIP 3b ESMs. Additionally, we drew on WHAM! functionality to complement the SSPs scenarios with two IFM scenarios: “IFM-max”, in which the world turns increases controlled burning through IFM; and “Suppression-max”, in which IFM is abandoned and the world focuses on fire exclusion and suppression. 

We find that IFM can play an important role in constraining future fire hazard and intensity. However, we also identify barriers and confounding factors that may limit implementation. Notably, even in a low emissions-scenario (SSP1.26) with increased adoption of IFM, fire hazard is still 40.0% [32.1%-49.6%] higher in 2100 than in 2015. Importantly, we find that the impact of IFM is smaller than general land management changes resulting from economic conditions of the SSPs. For example, for both IFM scenarios mean 2100 fire intensity is higher in SSP1.26 than SSP3.70 because changes in fire management do not offset increases in intensity due to reduced human fire use between the SSPs. Specifically, in SSP1, rapid economic growth in low-income countries (e.g. sub-Saharan Africa) sees fire use in agriculture and forestry increasingly replaced by chemicals and machinery.  

Our results suggest that incremental changes in land and fire management may be an insufficient response to the combined impacts of socio-economic and climate change. Transformative approaches that change fundamental relationships between economic development and fire suppression could in principle address this adaptation shortfall, but will need to grapple with how to integrate and maintain low-intensity fire in capital-intensive land systems on an increasingly flammable planet. 

How to cite: Perkins, O., Kasoar, M., Haas, O., Smith, C., Teixeira, J., Voulgarakis, A., Mistry, J., and Millington, J.: Benefits and limits of Integrated Fire Management for climate change adaptation: a global quantitative assessment , EGU General Assembly 2026, Vienna, Austria, 3–8 May 2026, EGU26-13135, https://doi.org/10.5194/egusphere-egu26-13135, 2026.

EGU26-13146 | Orals | BG1.1

Global near-real time burned area mapping with Sentinel-2 based on reflectance modelling and deep learning 

Marc Padilla, Ruben Ramo, Jose Luis Gomez-Dans, Sergio Sierra, Bernardo Mota, Roselyne Lacaze, and Kevin Tansey

Global burned area (BA) products are commonly available at a Non-Time Critical (NTC) basis, several months or even several years from the present date; i.e. they are unavailable for Near-Real Time (NRT) applications. The Copernicus Land Monitoring Service (CLMS) delivers the only global BA product in NRT, since recently, at very high accuracy, comparable to the most accurate non-CLMS NTC product (FIRECCIS311). However, global BA products are generated from coarse >= 300 m reflectance observations. Despite the Sentinel-2 mission having been in operation since 2017, providing decadal resolution 10-50 m reflectance data every ~5 days, and despite the well-known benefits of using decadal resolution data to estimate BA, a global Sentinel-2 NRT BA algorithm does not exist. The purpose of this study is to adapt and apply the latest developments in NRT detection, as implemented in the CLMS, to Sentinel-2 L2A imagery. The mapping method uses a neural network (NN) with 2D convolutional layers, followed by a Long Short-Term Memory (LSTM) layer. The NN processes the time series of reflectance images on a per-pixel basis, with convolutional layers applied along the spectral and temporal dimensions. The time series of fractional BA maps, predicted by the NN, are combined with time series of spatio-temporal density of VIIRS active fire detections. Such a combination consists of a logistic model and allows the reduction of false positives (such as cloud shadows). The NN is trained on a sample dataset automatically generated from time series reflectance observations (Sentinel-2 data in this case), extracted over locations of VIIRS active fire detections across the Globe for the year 2020, and corresponding estimates of fractional BA, derived from physically-based radiative transfer modelling. The mapping method generates one BA map for each new Sentinel-2 image available (referred to as BAS2nrt0), which is updated with images from the following 5 days (referred to as BAS2nrt5) and the following 10 days (referred to as BAS2nrt10). The additional images available after the mapping day are expected to reduce false positives due to cloud shadows. The mapping method also generates an NTC BA map for each calendar month (referred to as BAS2ntc), with images available for a buffer of 45 days around the month. The algorithm results are validated against an independent global reference dataset for the year 2019, which includes long time series of Landsat-derived BA maps covering 105 sampling units distributed across the Globe. The analysis of the 2019 validation results shows that the accuracy of the proposed Sentinel-2 products is high regardless of estimation timeliness. As expected, (1) the accuracy of the NTC product, Dice coefficient (DC) of 87.2%, is higher than the NRT products, DC 82.7–85.4%, and (2) the accuracy of the NRT product is increased with each update. Such accuracy levels are remarkably high: the accuracy of NRT estimates is comparable to a precedent global non-CLMS NTC Sentinel-2 BA mapping (DC 81.8%).

How to cite: Padilla, M., Ramo, R., Gomez-Dans, J. L., Sierra, S., Mota, B., Lacaze, R., and Tansey, K.: Global near-real time burned area mapping with Sentinel-2 based on reflectance modelling and deep learning, EGU General Assembly 2026, Vienna, Austria, 3–8 May 2026, EGU26-13146, https://doi.org/10.5194/egusphere-egu26-13146, 2026.

EGU26-14942 | ECS | Orals | BG1.1

Wildfire-driven Stratospheric Perturbations:Modelling Insights from the Australian Wildfires 

Meghna Soni, Ben Johnson, and Jim Haywood

The rising frequency and intensity of wildfire-driven pyro-cumulonimbus (pyroCb) events constitute an important atmospheric perturbation, injecting massive amounts of smoke into the stratosphere. The Australian Black Summer wildfires of 2019–2020 released about a million tonnes of smoke and gases, causing the most significant stratospheric temperature perturbation since 1991 Pinatubo eruption. This study simulates the evolution of smoke plumes from the Australian wildfires using the UKESM1.1 model. The aerosol and greenhouse gas follow the CMIP6 SSP245 scenario, with 0.62 Tg of total smoke injected into the upper troposphere/lower stratosphere based on estimates from Global Fire Emissions Database (GFED). The simulated aerosol layer expands both vertically and horizontally, with significant lofting in the first month following injection, reaching altitudes of ~30 kms, consistent with CALIPSO observations. The modelled zonal-mean aerosol extinction agrees well with OMPS retrievals, with peak values of around 0.006 km⁻¹. However, the modelled stratospheric AOD is higher (up to ~2 times) than the observations showing the aerosols in the model are more optically efficient. Additional sensitivity tests are ongoing to examine whether a higher initial injection altitude in these simulations might be causing the aerosols to remain in the stratosphere longer and decay more slowly. These findings highlight the need for improved observational constraints and modelling strategies to better quantify the global impacts of wildfire-induced stratospheric smoke.

How to cite: Soni, M., Johnson, B., and Haywood, J.: Wildfire-driven Stratospheric Perturbations:Modelling Insights from the Australian Wildfires, EGU General Assembly 2026, Vienna, Austria, 3–8 May 2026, EGU26-14942, https://doi.org/10.5194/egusphere-egu26-14942, 2026.

Fire is a major driver of forest change worldwide. In tropical regions, it is primarily used by local populations to clear forested land for human activities such as agriculture and infrastructure development. Here, we use three decades of Landsat-based observations to analyse fire-related forest loss over a broad temporal scale across a major tropical region in South America, spanning more than 2 million km² and encompassing a wide range of ecosystems. This long-term assessment provides a comprehensive view of post-fire forest cover dynamics, with strong potential to capture deforestation trends, forest fate, and the roles of protection status and landscape history. Over the study period, the newly generated medium-resolution dataset of burned area detected a cumulative total of approximately 345 million hectares burned, equivalent to an average annual burned fraction of 5.65%, with pronounced interannual variability and the period between 1999 and 2010 being the most extreme. During the same timeframe, more than 24.5 million hectares of forest were lost, representing nearly one-quarter of the 1990 forest extent, with fires accounting for 26% of this loss. Most of these losses have not recovered over time and were subsequently followed by deforestation, with 99% of affected areas converted to pastures and croplands, while recovery rates have remained negligible. Fragmentation and fire history legacy emerged as critical factors influencing the trajectory of forest loss.

How to cite: Khairoun, A. and Salinero, E.: Analysis of long-term fire-related deforestation and cover change dynamics in South American ecosystems, EGU General Assembly 2026, Vienna, Austria, 3–8 May 2026, EGU26-15336, https://doi.org/10.5194/egusphere-egu26-15336, 2026.

EGU26-15696 | ECS | Orals | BG1.1

Changes in biomass burning in Africa since the last glacial maximum: a new continental-scale paleo-synthesis and interrogation of the climatic and human drivers of shifting fire regimes 

Nicholas O’Mara, Esther Githumbi, Patrick Bartlein, Marie Norwood, Oriol Teruel, Julie Aleman, Carla Staver, and Jennifer Marlon

Fires on Earth are changing in response to human activities, both through direct ecosystem management and indirect climate change-induced warming and associated shifts in regional rainfall patterns. While increased burning in forested systems often captures international media attention, the decline in burning in grassy systems––especially African savannas––receives less focus, despite their dominant contribution to total global burned area and fire emissions. Forecasting future fire activity and its impacts on local ecology and livelihoods, as well as global climate feedbacks, requires a robust mechanistic understanding of the complex interactions between climatic conditions, ecosystem functioning, human activities, and fire across a range of climate states not captured by modern satellite-based observations.

This study focuses on Africa, whose environments span a diversity of climates and ecologies, from some of the driest and most sparsely vegetated regions on Earth (such as the Sahara) to some of the wettest and most biologically productive (such as the Congo Rainforest). These two ends of the rainfall gradient experience non-existent to infrequent burning. However, the most expansive biomes in Africa are tropical savannas and grasslands where precipitation is intermediate and highly seasonal, supporting rapid vegetation growth during wet seasons and drying and abundant fires in the dry season. As a result, burning in Africa constitutes more than half of all global burned area each year. Robust histories of how fires have changed in Africa through time are therefore essential to understanding changes in biomass burning at a global scale. In addition to its broad scope of environments and outmatched contributions to total global burning, Africa also has the longest history of human fire use and land-use change, making it an ideal testing ground for interrogating the combined roles climate shifts and human behaviors play in shaping fire regimes through time.

Here, we present a new synthesis of African paleofire activity inferred from the accumulation of both physical and molecular proxies (e.g., charcoal and polycyclic aromatic hydrocarbons) within climate archives spanning multiple depositional contexts (e.g., lacustrine, marine, and peat sediments) which record biomass burning across a host of ecosystems. Our new reconstruction spans the last 24 thousand years, within which we focus on four key time periods: the Last Glacial Maximum and deglaciation, the mid-Holocene African Humid Period, the late-Holocene rise of metallurgy and agriculture, and the post-industrial era. We evaluate trends in biomass burning during these intervals, and, by comparison to paleoclimate and archeological datasets, we assess the extent to which these patterns are driven by climatic and/or human influences at continental, regional, and biome scales.

How to cite: O’Mara, N., Githumbi, E., Bartlein, P., Norwood, M., Teruel, O., Aleman, J., Staver, C., and Marlon, J.: Changes in biomass burning in Africa since the last glacial maximum: a new continental-scale paleo-synthesis and interrogation of the climatic and human drivers of shifting fire regimes, EGU General Assembly 2026, Vienna, Austria, 3–8 May 2026, EGU26-15696, https://doi.org/10.5194/egusphere-egu26-15696, 2026.

EGU26-16499 | Orals | BG1.1

Ancient carbon released in Arctic-boreal wildfires 

Meri Ruppel, Sonja Granqvist, Lucas Diaz, Negar Haghipour, Olli Sippula, Rienk Smittenberg, Markus Somero, Sander Veraverbeke, and Minna Väliranta

Wildfires are rapidly increasing in boreal forests and are extending to Arctic environments at an unforeseen scale. Above-ground biomass burning may be compensated by regrowth in the years following a wildfire, impacting atmospheric CO2 levels only temporarily.  However, high-latitude wildfires characteristically combust deep into carbon-rich soils accumulated over centuries to millennia and thereby risk transforming these long-term carbon sinks into net sources into the atmosphere. Hitherto, research on Arctic-boreal fires has largely focused on their surface impacts, including the burned area, severity, and forest recovery, while many of their underground characteristics are poorly understood. For instance, observations of the age of carbon released in the fires remain scarce, resulting in incomplete understanding of the climate impact of high-latitude fires.

To determine the age of carbon released in recent Arctic-boreal fires, we collected charred organic material for radiocarbon dating from a tundra fire in Greenland, and two boreal forest and one tundra fire site in northwestern Canada. Our results indicate that, contrary to previous observations, up to centennial to millennial-aged carbon was released in these arctic and boreal wildfires. Moreover, laboratory combustion experiments of Arctic-boreal biomass collected from fire-susceptible surface layers (0-30 cm depth) from Svalbard, Russia, Norway and Finland, demonstrate that the combustion mode, and thus the phase of the emitted carbon, depend on the age of the combusted material. Above-ground modern vegetation combusts flamingly emitting mainly gases, while below-surface older and partly decomposed organic material smoulders, producing increasing carbonaceous particle/gas ratios with increasing age of the combusted material. Similar to the studied Greenland and Canadian wildfires, the laboratory combustion of the Arctic-boreal biomasses show up to millennia-aged carbon emissions.

Our results indicate that centennial to millennial-aged carbon is released in Arctic-boreal wildfires, thereby causing long-lasting feedback to the global climate system. Currently, climate models do not consider the potential release of ancient carbon from wildfires. Thus, our results indicate that increasing Arctic-boreal wildfires may exacerbate global warming more than previously estimated.  

How to cite: Ruppel, M., Granqvist, S., Diaz, L., Haghipour, N., Sippula, O., Smittenberg, R., Somero, M., Veraverbeke, S., and Väliranta, M.: Ancient carbon released in Arctic-boreal wildfires, EGU General Assembly 2026, Vienna, Austria, 3–8 May 2026, EGU26-16499, https://doi.org/10.5194/egusphere-egu26-16499, 2026.

EGU26-16685 | Orals | BG1.1

Reconstructing the last 60,000 years climate-driven interactions of fire, vegetation, and megaherbivores at Fish Lake, Utah, USA 

Jesse Morris, Vachel Carter-Kraklow, Brian Codding, Natalie Winward, Andrea Brunelle-Runberg, Jamie Vornlacher, Josef Werne, Dave Marchetti, Kurt Wilson, Lesleigh Anderson, Mark Abbott, and Mitchell Power

Fish Lake is located at 2700 m (a.s.l.) on the boundary of the Colorado Plateau and Great Basin geologic provinces in western North America. Climate forecast models suggest that this region will become warmer and drier during the 21st Century, which will likely intensify fire regimes and threaten biodiversity in this region, including the ancient Pando aspen clone located next to Fish Lake. Here we present a paleoenvironmental reconstruction from an 80-meter lake sediment core spanning the last 60,000 years. At the Last Glacial Maximum (LGM), the upland areas near Fish Lake (3200-3500 m asl) were heavily glaciated and plant communities were open and dominated mainly by herbs and conifers, such as grasses (Poaceae) and spruce (Picea spp.). During the LGM fire activity was low due to cold temperatures, low woody fuel abundance and connectivity, and the presence of megaherbivores (e.g., Mammuthus) as reconstructed from nearby fossil sites and the presence of coprophilous fungal spores (Sporormiella) in the Fish Lake sediments. In the Late Glacial Period, the demise of upland glaciers and megaherbivores was accompanied by a ‘release’ in woody vegetation, especially spruce and pine (Pinus spp.) and a rise in charcoal accumulation. During the Early Holocene, this rise in burning sustained and was likely enhanced by warming temperatures and the establishment of closed-canopy forests similar to modern composed of Engelmann spruce (Picea engelmannii), aspen (Populus tremuloides), and subalpine fir (Abies lasiocarpa). Fire activity in the Middle Holocene remained high, with a stepwise increase observed during the Late Holocene that occurred with increasing evidence of human activities and amplification of El Nino-Southern Oscillation (ENSO). Throughout the 60,000 record, aspen pollen is consistently present. While pollen alone does not provide direct evidence of the long-lived Pando aspen clone, this record does confer the presence of aspen growing near Fish Lake through contrasting climate periods and fire regimes. This long-term reconstruction offers new insights into the interactions of climate, vegetation, and herbivory in shaping wildfire in western North America to help support land management policies.

How to cite: Morris, J., Carter-Kraklow, V., Codding, B., Winward, N., Brunelle-Runberg, A., Vornlacher, J., Werne, J., Marchetti, D., Wilson, K., Anderson, L., Abbott, M., and Power, M.: Reconstructing the last 60,000 years climate-driven interactions of fire, vegetation, and megaherbivores at Fish Lake, Utah, USA, EGU General Assembly 2026, Vienna, Austria, 3–8 May 2026, EGU26-16685, https://doi.org/10.5194/egusphere-egu26-16685, 2026.

EGU26-17500 | Orals | BG1.1

Environmental factors disrupting the adaptive advantage of fire-trait syndromes 

José Maria Costa-Saura, Costantino Sirca, Donatella Spano, and Teresa Valor

Fire regimes show substantial variability among ecosystems, with a fundamental contrast between surface and crown fires. While surface fires predominantly consume understory vegetation, crown fires involve the combustion of canopy fuels. This distinction is therefore central to understanding fire-driven ecosystem dynamics and to designing effective wildfire risk management strategies.

Ongoing climate change is expected to further reshape fire regimes by altering temperature and moisture conditions and by driving shifts in species distributions. These processes may indirectly modify fire behaviour by changing fuel structure, continuity, and overall landscape flammability.

Within this context, plant functional traits provide a valuable lens through which to interpret fire–vegetation interactions. They not only respond to environmental filtering but also actively shape ecosystem functioning. Two traits in particular—branch shedding (the ability to shed dead lower branches) and serotiny (the retention of mature cones that open after exposure to high temperatures)—have been proposed as key adaptive strategies influencing fire regimes. However, there is limited understanding of whether environmental factors can effectively cancel the adaptive advantages conferred by these traits, which, if occurring frequently, might substantially alter ecosystem dynamics.

To explore these issues, we integrated forest information from the Spanish Forest Map with fire severity data from the European Forest Fire Information System (EFFIS). Our analysis focused on pine species dominating coniferous forests across the western Mediterranean region. We examined how branch shedding and serotiny relate to crown fire occurrence, and how these relationships are modulated by stand-level attributes such as successional stage, shrubs abundance, and the occurrence of extreme drought during the fire season.

Our results indicate that the effectiveness of these trait-based strategies is, at least in the western Mediterranean, strongly contingent on forest stand conditions and suggests that climate change might disrupt the current spatial consistency of these long-established  fire-traits relationships.

How to cite: Costa-Saura, J. M., Sirca, C., Spano, D., and Valor, T.: Environmental factors disrupting the adaptive advantage of fire-trait syndromes, EGU General Assembly 2026, Vienna, Austria, 3–8 May 2026, EGU26-17500, https://doi.org/10.5194/egusphere-egu26-17500, 2026.

EGU26-18115 | ECS | Posters on site | BG1.1

Top-down carbon monoxide fire emissions over South America correlated with global climate indices 

Ben Bradley, Chris Wilson, Martyn Chipperfield, Carly Reddington, Ailish Graham, and Fiona O'Connor

South America (SA) has suffered a multitude of extreme, drought-induced fires in recent years, including 2024 which saw fire emissions across the continent 263 Tg C (84%) above average[1]. Burned area and fire carbon emissions in SA are projected to increase over the coming decades due to higher temperatures and drier conditions associated with climate change[2]. These effects are already being seen in the Amazon, where fire is driving the rainforest towards being a net carbon source[3] and threatening existential climate tipping points. Meanwhile to the South, the ecologically diverse Pantanal wetlands have undergone a step-change in wildfire activity, with 2019–2021 experiencing a 408% increase in annual carbon monoxide (CO) emissions relative to the 2013–2018 average.

CO is a major trace gas released from fires. Its emissions can be used to quantify wildfire carbon impacts and investigate correlations between fire activity and global climate indices. Despite this, there remains considerable disagreement between fire inventory products, with mean annual CO emissions ranging from 284–625 Tg yr-1 globally, and predictions diverging further at smaller spatial scales. These large uncertainties originate from the underlying assumptions of the inventory methodologies and the imperfect sensitivity of their satellite data inputs. Satellite observations of atmospheric total column CO, combined with inverse modelling techniques, provide a direct, top-down method to constrain these estimates, allowing more accurate CO emissions to be determined.

Here, we derive fire emission estimates between 2019–2024 for SA using the INVICAT 4D-Var inverse chemical transport model, assimilating TROPOspheric Monitoring Instrument (TROPOMI) total column CO satellite observations into the model for the first time. Six fire inventories (GFEDv4.1s, GFEDv5.1, GFASv1.2, QFEDv2.6r1, FINNv1.5, FINNv2.5) are used as priors in separate CO inversions, from which posterior result sensitivity is quantified and prior biases are assessed. We use emission ratios to determine, spatially and temporally, the total carbon flux into the atmosphere from fires in SA. We find that the 2024 extreme fire season in SA is poorly captured by the fire inventory products currently available, with peak atmospheric CO over SA observed to be 12.8 Tg (46%) larger than forward-modelled inventory emissions predict. Additionally, we create a multilinear regression model to predict the spatial distribution of CO anomalies across tropical SA by correlating the inversion posterior emissions to key global climate indices at various lag times. This novel method can provide spatial forecasts of the wildfire vulnerability arising from the global state of the climate months in advance.


[1] Kelley et al., 2025, State of Wildfires 2024–2025, Earth System Science Data

[2] Burton et al., 2021, South American fires and their impacts on ecosystems increase with continued emissions, Climate Resilience and Sustainability

[3] Basso et al., 2022, Atmospheric CO2 inversion reveals the Amazon as a minor carbon source caused by fire emissions, with forest uptake offsetting about half of these emissions, Atmospheric Chemistry and Physics

How to cite: Bradley, B., Wilson, C., Chipperfield, M., Reddington, C., Graham, A., and O'Connor, F.: Top-down carbon monoxide fire emissions over South America correlated with global climate indices, EGU General Assembly 2026, Vienna, Austria, 3–8 May 2026, EGU26-18115, https://doi.org/10.5194/egusphere-egu26-18115, 2026.

EGU26-18182 | ECS | Orals | BG1.1

How forest management, land abandonment, and protected areas affect wildfire occurrence 

Gian Luca Spadoni, Jose V. Moris, Judith Kirschner, Sergio de Miguel, Imma Oliveras Menor, Cinzia Passamani, Gilles Le Moguedec, Davide Ascoli, and Renzo Motta

Forest management at the landscape scale is increasingly regarded as a key instrument for maintaining and improving the supply of multiple forest ecosystem services. Contemporary policy agendas, including the EU Forest and Biodiversity Strategies for 2030, together with management paradigms such as sustainable forest management, closer-to-nature forestry and rewilding, promote markedly different pathways. Some approaches rely on targeted silvicultural interventions, while others emphasise non-intervention and natural dynamics. Despite their growing relevance, the spatial prevalence of these contrasting strategies and their implications for ecosystem service provision at regional scales remain insufficiently explored. In this study, we assessed how alternative forest management trajectories affect ecosystem services across the entire forested landscape of the Piedmont region (Italy). Drawing on information from regional forest management plans, we categorised planned management into two broad classes: active management, encompassing silvicultural interventions of varying intensity, and passive management, characterised by the absence of direct interventions. We quantified the spatial extent of each management type and analysed their relationships with three key ecosystem services—carbon storage, fire hazard reduction and tree-species diversity—using principal component analysis and generalised linear models. Additionally, we investigated the association between management strategies and Protected Areas, and whether protection status modulates ecosystem service outcomes. Our results indicate that approximately 60% of Piedmont’s forests are designated for active management, although actual implementation is increasingly constrained by widespread forest abandonment. Active management was consistently associated with higher levels of carbon stocks, reduced fire hazard and greater tree-species diversity. Protected Areas were more frequently linked to passive management, yet their contribution to enhancing ecosystem services appeared limited. Based on these findings, we highlight the importance of: (i) reactivating forest management in abandoned areas, (ii) prioritising active management strategies to strengthen ecosystem service delivery, and (iii) using currently unprotected, passively managed forests as strategic candidates for expanding the Protected Area network, in line with EU2030 policy objectives.

How to cite: Spadoni, G. L., V. Moris, J., Kirschner, J., de Miguel, S., Oliveras Menor, I., Passamani, C., Le Moguedec, G., Ascoli, D., and Motta, R.: How forest management, land abandonment, and protected areas affect wildfire occurrence, EGU General Assembly 2026, Vienna, Austria, 3–8 May 2026, EGU26-18182, https://doi.org/10.5194/egusphere-egu26-18182, 2026.

Vegetation fires emit a wide variety of aerosol particles. Most originate from the combustion of carbonaceous material, however, fire-induced pyro-convective updrafts can modify the near-surface wind field in a way that mobilizes soil-dust particles from the ground and inject them into the atmosphere. Mineral dust particles are well known as efficient cloud condensation nuclei (CCN) and ice nucleating particles (INPs), thereby substantially altering cloud microphysics and influencing the Earth’s radiation budget through scattering and absorption of solar radiation. When emitted during wildfires, these dust particles are likely mixed with smoke aerosols, which modifies their physio-chemical properties and consequently their impacts on the atmosphere and climate. Therefore, a precise characterization of this emission pathway and robust knowledge of its global abundance are essential.

The fire-driven emission of soil-dust particles has already been incorporated into the global aerosol–climate model ICON-HAM through the development of a sophisticated parameterization that describes fire-induced dust emission fluxes as a function of fire intensity and some soil-surface properties, such as the soil type and the vegetation class at the fire location. Multi-year model simulations have indicated that fire-related dust emissions can account for a significant fraction of the global atmospheric dust load, exhibiting strong regional and seasonal variability driven by a varying fire activity and the local soil-surface conditions.

However, global fire activity has changed substantially over the recent decades due to both climatic and socioeconomic factors, resulting in significant shifts in the magnitude and regional distribution of fire-related dust emissions. Here, trends in fire-induced dust emissions over the past 20 years are analyzed and changes across different continental regions are contrasted. Furthermore, projections of fire activity under future climate scenarios can be used to assess the strength and regional distribution of fire-related dust emissions under changing climate conditions and mitigation strategies. This analysis can contribute to improved estimates of the future global aerosol burden, in particular with respect to the changing fire occurrence in a warmer world.

How to cite: Wagner, R. and Tegen, I.: Trends in fire activity and associated fire-induced soil-dust emissions over the last two decades, EGU General Assembly 2026, Vienna, Austria, 3–8 May 2026, EGU26-18932, https://doi.org/10.5194/egusphere-egu26-18932, 2026.

EGU26-19168 | Posters on site | BG1.1

Wildfire Hot Spot Mapping in the Alps - Austria Fire Futures 

Andrey Krasovskiy, Hyun-Woo Jo, Harald Vacik, Mariana Silva Andrade, Herbert Formayer, Johannes Laimighofer, Arne Arnberger, Tobias Schadauer, Mortimer Müller, Eunbeen Park, Johanna San-Pedro, and Florian Kraxner

The main objective of the Austria Fire Futures study is to develop a unique and innovative framework for fire risk assessment by producing high-resolution fire risk hotspot maps under multiple climate change scenarios. These maps integrate novel insights on local fuel types into forest and wildfire risk models, including mountain-specific variables such as topography, morphology, and recreational activities.

To generate fire risk information at the local scale, advanced fire hazard modeling is required to identify vulnerable forest types in combination with topographic effects. Recent wildfire events in the Austrian Alps have demonstrated that social factors—particularly hiking tourism—are currently underrepresented in fire risk assessments. In response, this study aims to advance fire risk hotspot mapping as a foundational element for forest and wildfire prevention. Such mapping is essential for integrated fire management, encompassing prevention, suppression, and post-fire measures, while contributing to climate change mitigation and minimizing impacts on ecosystems, ecosystem services, and human well-being.

We present modeling results from the Wildfire Climate Impacts and Adaptation Model (FLAM), a process-based fire risk model operating at a daily time step. FLAM employs machine learning techniques to calibrate extended suppression efficiency based on spatial segmentation of landscapes. Historical ground data on burned areas in Austria were used for model calibration and validation. The results include historical simulations (2001–2020) and future projections (2021–2100) of burned area across Austria at 1 km spatial resolution, based on an ensemble of downscaled climate change scenarios. In addition, FLAM was applied to Lower Austria at 250 m resolution, using the most recent high-resolution datasets on fuels, forest cover, human ignition probability, and response times.

The results improve our understanding of fire-vulnerable forest areas in the Alpine region and how these vulnerabilities may shift over time and space under changing climate and fuel conditions. This knowledge enables experts, practitioners, and the broader public to explore plausible future fire regimes and to derive robust short-, medium-, and long-term recommendations for fire-resilient and sustainable forest management, as well as for wildfire preparedness and emergency planning.

How to cite: Krasovskiy, A., Jo, H.-W., Vacik, H., Silva Andrade, M., Formayer, H., Laimighofer, J., Arnberger, A., Schadauer, T., Müller, M., Park, E., San-Pedro, J., and Kraxner, F.: Wildfire Hot Spot Mapping in the Alps - Austria Fire Futures, EGU General Assembly 2026, Vienna, Austria, 3–8 May 2026, EGU26-19168, https://doi.org/10.5194/egusphere-egu26-19168, 2026.

EGU26-19257 | Posters on site | BG1.1

Critical analysis of Fire Radiaive Power derived by hyperspectral sensors from space 

Stefania Amici and Bernardo Mota

Fire Radiative Power (FRP) is a quantitative measure of the instantaneous rate of radiant heat energy emitted by a fire during the combustion process. It is usually retrieved via satellite remote sensing and serves as a key indicator of fire intensity and the rate of fuel consumption. FRP is generally estimated by measuring the thermal radiation (radiances) emitted by wildfires, in the Middle Infrared (MIR) spectral range (3.9- 4.0) where the Planck function peaks for sources at 1000K and the contrast between the fire and the cooler background is most pronounced.

A number of satellite imaging systems, at LEO (i.e. MODIS-TERRA and AQUA, VIIRS-Suomi NPP, SLSTR-Sentinel 3A and 3B) and GEO (i.e. SEVIRI-MSG, ABI-GOES, ABI-HIMAWARI) orbits provide FRP retrievals. However, due to their coarse spatial resolution (1-2 km/px) and wide spectral bands, small fires detection and associated FRP retrieval is limited, representing a potential source of omission error.

While currently available high-resolution sensors lack coverage in the Mid-Infrared (MIR) spectral range, recent research has investigated the potential of Short-Wave Infrared (SWIR) sensors as an option. By analyzing airborne data from the AVIRIS, EMAS, and MASTER sensors, studies have established a robust correlation between MIR-derived and SWIR-derived FRP. Furthermore, the SWIR band on Sentinel-3 is already being effectively utilized to estimate FRP for gas flares monitoring.

In this study we retrieve FRP by using two similar hyperspectral sensors, Precursore IperSpettrale della Missione Applicativa (PRISMA) and Environmental Mapping and Analysis Program (EnMAP).  We compare the results with operational FRP products, namely the Sentinel-3 L2 NRT FRP and the CAMS-GOES-W FRP product and evaluate potentials and limitations for mapping the intensity of wildfires and gas flares.

How to cite: Amici, S. and Mota, B.: Critical analysis of Fire Radiaive Power derived by hyperspectral sensors from space, EGU General Assembly 2026, Vienna, Austria, 3–8 May 2026, EGU26-19257, https://doi.org/10.5194/egusphere-egu26-19257, 2026.

EGU26-19404 | ECS | Posters on site | BG1.1

Modelling burned area and emissions with deep learning 

Seppe Lampe, Lukas Gudmundsson, Basil Kraft, Stijn Hantson, Emilio Chuvieco, and Wim Thiery

Wildfires play a key role in the Earth system by shaping ecosystem dynamics and influencing the carbon cycle and atmospheric composition. Data-driven models have recently emerged as powerful tools for reproducing observed fire activity, particularly burned area, across a range of spatial and temporal scales. The first version of BuRNN (Burned area and emissions modelling through Recurrent Neural Networks) focused solely on burned area and outperformed all process-based fire-coupled DGVMs from ISIMIP over a wide range of spatial, temporal and spatio-temporal skill metrics. Here we present the 2nd version of BuRNN, a data-driven model that now jointly represents burned area and fire-related emissions.

How to cite: Lampe, S., Gudmundsson, L., Kraft, B., Hantson, S., Chuvieco, E., and Thiery, W.: Modelling burned area and emissions with deep learning, EGU General Assembly 2026, Vienna, Austria, 3–8 May 2026, EGU26-19404, https://doi.org/10.5194/egusphere-egu26-19404, 2026.

EGU26-19990 | Orals | BG1.1

A European Initiative on Wildfire Risk and Atmospheric Impacts 

Cyrielle Denjean, Ronan Paugam, Sophie Pelletier, Agnès Borbon, Isabelle Chiapello, Maria João Costa, Francisco Senra Rivero, Mélanie Rochoux, Rui Salgado, Pierre Tulet, Eva Marino, Roberto Roman, Yolanda Luna, Gisèle Tong, Xavier Ceamanos, Arnaud cambre, Francesca Di Giuseppe, Jean Baptiste Filippi, Hervé Petetin, and Julien Ruffault and the Cyrielle Denjean

A new wildfire regime is emerging in Southern Europe, characterised by larger and more intense fires, and by a fire season that now extends beyond the traditional summer months. In this region, climate projections indicate that fire occurrence and severity will increase faster than the global average due to an increased risk of heatwaves and droughts, as well as the evolution of biodiversity towards more resilient and less fire-prone plant species. These changes in wildfire regimes reveal significant gaps in the tools and technologies needed for implementing comprehensive fire management approaches. The community still faces challenges in predicting which wildfires may escalate into extreme events, and the environmental, climate and health impacts of such events remain poorly understood.

The Southern Europe Biomass BURNing (EUBURN) programme emerged as a concerted response to the need to improve the prevention, monitoring and prediction of wildfire risks in southern Europe. EUBURN integrates a series of multi-year and multi-scale field campaigns, lab studies, satellite remote sensing, and advanced modeling to build the research foundations for understanding the complex interactions between wildfires and the atmosphere. Based on this fundamental research, the EUBURN programme aims to support fire responders, ecosystems and air quality management, while addressing specific climate research requirements by developing new or enhanced operational products, tools and services for monitoring and predicting wildfires and their atmospheric impacts.

The first field campaign SILEX (Smoke from European Wildfire Experiment) of the EUBURN programme took place in southern France from 15 July to 3 August 2025. It had three specific objectives: (i) characterising the interactions between fuel, fire, gases, aerosols, radiation and clouds; (ii) contributing to the development of numerical prediction tools for fire behaviour and atmospheric plume dynamics; and (iii) assessing the uncertainties, biases and limitations of fire and smoke products from ground-based and satellite remote sensing. Ten scientific flights were carried out with the ATR-42 research aircraft equipped with state-of-the-art remote-sensing and in situ instruments to characterise wildfires occurring in southern France, as well as their associated smoke plumes, from the onset of emissions to their regional transport. The main purpose of the presentation is to familiarize the broader scientific community with the EUBURN programme and the SILEX dataset it produced. New findings on fire characteristics, gas and aerosol emissions, physical and chemical aging and cloud condensation nuclei will be emphasized.

How to cite: Denjean, C., Paugam, R., Pelletier, S., Borbon, A., Chiapello, I., Costa, M. J., Senra Rivero, F., Rochoux, M., Salgado, R., Tulet, P., Marino, E., Roman, R., Luna, Y., Tong, G., Ceamanos, X., cambre, A., Di Giuseppe, F., Filippi, J. B., Petetin, H., and Ruffault, J. and the Cyrielle Denjean: A European Initiative on Wildfire Risk and Atmospheric Impacts, EGU General Assembly 2026, Vienna, Austria, 3–8 May 2026, EGU26-19990, https://doi.org/10.5194/egusphere-egu26-19990, 2026.

EGU26-20208 | Orals | BG1.1

Process-Based Attribution of the 2025 Iberian Wildfire Season Using a Storyline Framework 

István Dunkl, Julia Mindlin, Marco Turco, and Sebastian Sippel

An enduring heatwave over the Iberian Peninsula in July and August 2025 led to exceptionally extensive wildfires, resulting in the fifth-largest burned area in Spain since 2001 and the fourth-largest in Portugal. Hot and dry fire weather conditions are a key driver of large wildfires in the Mediterranean, and are intensifying rapidly under anthropogenic climate change. However, strong interannual variability of burned area and changes in multiple non-climatic drivers (e.g., land management) complicate the attribution of individual fire seasons.

Methods for attributing climate impacts to anthropogenic forcing are commonly divided into statistical and storyline approaches. Statistical methods quantify changes in the probability of exceeding predefined thresholds across climate states with different forcing levels, whereas storyline approaches examine how a specific historical event might have unfolded in the absence of anthropogenic climate change. Such counterfactual storylines can be generated with Earth system models (ESMs) constrained by observed historical conditions, enabling a process-based interpretation of climate impacts. However, this type of storyline method has not been applied to the attribution of complex ecosystem processes such as fires.

Here, we use the 2025 Iberian wildfire season as a case study to evaluate our nudged circulation storyline simulation with the Community Earth System Model 2 (CESM2) and compare it to statistical attribution. The ESM-based storyline enables a process-based quantification of thermodynamic influences on fire weather and of biological factors controlling fuel load. However, the approaches differ on the role of thermodynamic climate change in intensifying the 2025 fire season. Statistical attribution suggests a large thermodynamic contribution but indicates that events of comparable intensity are not exceptional under present-day climate. In contrast, the storyline approach identifies the 2025 circulation anomaly as unprecedented in magnitude. We show that this discrepancy arises from decadal Mediterranean circulation trends, which are implicitly absorbed into the thermodynamic response in the statistical attribution framework.

Our results demonstrate the utility of a storyline framework in the causal attribution of complex processes such as fires, and highlight the need for caution when applying attribution methods in regions characterized by strong dynamical trends.

How to cite: Dunkl, I., Mindlin, J., Turco, M., and Sippel, S.: Process-Based Attribution of the 2025 Iberian Wildfire Season Using a Storyline Framework, EGU General Assembly 2026, Vienna, Austria, 3–8 May 2026, EGU26-20208, https://doi.org/10.5194/egusphere-egu26-20208, 2026.

Tropical montane forests have historically not been prone to large-scale forest fires as a result of their high humidity and rainfall. Yet, current increased frequencies and intensity of these fires are making them an increasingly pressing area of study, especially in the context of increasing climate variability and land use changes.  To understand present and future fire dynamics, it is, however, essential to look at the origins and factors behind trends in fire frequency and intensity. To explore this, long-term assessment of the dynamics of montane forest fire, and their relationships to anthropogenic and climate changes, are essential.

Such work has been largely lacking in montane ecosystems due to a paucity of available quantitative data, and a general perception that fire has played a minimal role in shaping biodiversity in these areas. Here we combine historical forest fire records and remote sensing to investigate the evolution and dynamics of montane forest fires in Kenya since the 1920s in response to changes in forest fire management, land use changes and climate variability.  We argue that historically, indigenous communities used their traditional knowledge and practices in managing local fires and limiting them to manageable intensities. However, the introduction of colonial rule shifted their role in forest management and ultimately their relationship in using fire within forest areas.

Our research and datasets highlight that changes in fire dynamics can be linked to extensive colonial prohibition of fire controls by traditional communities and the imposition of fines to deter their use. In addition, introduction of new fire sources through the development of the railway systems along forest areas, introduction of exotic tree species and largescale agricultural expansions exacerbated forest fire dynamics within the montane forests. Meanwhile, the colonial government introduced fire lines as a form of forest fire controls, which were meant as fire control measure and required sophisticated management plans, that were adopted in forest management.

We suggest that these changes have left legacies for contemporary fire issues as a loss of traditional fire management knowledge, smallholder relocation and land restrictions, and industrial pressures have accumulated to intensify fire risk in montane forest ecosystems. Looking into the future, we argue that, as with other regions of the latitudinal tropics, it is essential to understand traditional ecological knowledge and historical path dependencies in order to chart more effective and just conservation strategies including active use of fire and restoration of fire-resistant species. 

How to cite: Gitau, P., Kinyanjui, R., and Roberts, P.: Evolution of tropical montane forest fires in response to shifts in historical forest management, climate variability and land use changes., EGU General Assembly 2026, Vienna, Austria, 3–8 May 2026, EGU26-20289, https://doi.org/10.5194/egusphere-egu26-20289, 2026.

EGU26-20299 | Orals | BG1.1

Regional to global impacts of boreal biomass burning emissions changes 

Marianne T. Lund, Zosia Staniszek, Bjørn H. Samset, Olivia Linke, and Annica Ekman

High latitude wildfire regimes are changing, and boreal regions have seen unprecedented fire activity in recent years. Given the high climate sensitivity of the Arctic and boreal regions, it is important to explore the impacts of these changes. There are also region-specific impacts of biomass burning particular to high latitude regions, such as black carbon (BC) deposition on snow. While many sources of atmospheric pollution are being mitigated, fires are emerging as a growing contributor to poor air quality, both locally to the fire emissions source and across wider regions.

Here we investigate the climate and atmospheric effects of increased biomass burning emissions, including the sensitivity to emission region, focusing on aerosols. We perform idealized emission perturbation experiments in two Earth System Models (CESM2 and NorESM2), where we perturb first all boreal biomass burning emissions and then emissions in smaller regions of interest (boreal North America, East Siberia and West Siberia). These experiments use 2005-2014 as a baseline period, and use the sum of this period as the perturbation, giving an approximately x10 perturbation in the regions of interest, in both fixed SST (30 years) and coupled (200 years) simulations. The strength and location of the aerosol changes studied here (when comparing aerosol optical depth) are comparable to the recent trends in aerosols between 2015-2024 and 2005-2014.

We investigate subsequent effects on modelled atmospheric composition with a focus on the high latitudes, including air quality implications, and climate response, including effective radiative forcing (ERF) and fully-coupled climate response estimates. The preliminary analysis highlights the role of boreal forests in enhancing aerosol optical depth, over the source regions but also extending into the central Arctic, as well as local air pollution levels. Global and Arctic mean ERFs of 0.5 Wm-2 are estimated, with some distinct differences depending on the region of emission, at least for the Arctic average forcing.

How to cite: Lund, M. T., Staniszek, Z., Samset, B. H., Linke, O., and Ekman, A.: Regional to global impacts of boreal biomass burning emissions changes, EGU General Assembly 2026, Vienna, Austria, 3–8 May 2026, EGU26-20299, https://doi.org/10.5194/egusphere-egu26-20299, 2026.

EGU26-22880 | ECS | Posters on site | BG1.1

Dimensions of forest fires in Poland, 2019-2024 

Patrycja Kowalczyk, Ewa Zin, Łukasz Tyburski, Przemysław Śleszyński, Sandra Słowińska, Adrian Kaszkiel, Damian Czubak, Marcin Klisz, Kamil Pilch, Jan Kaczmarowski, and Michał Słowiński

Changing climatic conditions are amplifying the frequency and intensity of hydroclimatic extremes across Europe. Droughts, heatwaves, intense precipitation and floods increasingly co-occur and cascade, creating compound risks for ecosystems and societies. One of the most visible and severe consequences of these interconnected crises is the growing global threat of forest fires, which are more often facilitated by favorable weather conditions, as well as forest structure and fuel properties. However, the most important cause of fires is related to human pressure, resulting from intentional or unintentional activities that contribute to the outbreak of fires.

Forests are an assemblage of diverse habitats, each of which may differ markedly in fire risk and fire behaviour. Here, we examine how fire occurrence in Poland varies among forest habitat types, land-use patterns and management functions, and how these relationships are shaped by interannual meteorological variability and regional context. We compile (i) forest fire records for Poland for 2019-2024, (ii) a 2024 state forest administration database of forest divisions (i.e., basic forest management units) including habitat type, dominant tree species and main forest function, (iii) a database of socio-economic indicators for country's administrative units, and (iv) annual meteorological characteristics relevant to fire weather. This enables a spatially explicit analysis of fire frequency and (where available) burnt area across heterogeneous forest landscapes, while accounting for administrative-region differences and socio-economic factors that may reflect contrasting management practices, accessibility, and human ignition pressure.

We quantify fire occurrences in 2019-2024 for distinct forest area types (classified by habitat, dominant tree species and function) and evaluate their sensitivity to meteorological conditions across years. The analysis is designed to identify which combinations of forest habitat, tree species, forest function, and local socio-economic structure show consistently elevated fire incidence, whether observed changes between 2019 and 2024 are uniform or regionally differentiated across Poland, and to determine which meteorological characteristics best explain interannual variability in forest fire occurrence. By integrating ecological and forest management attributes with fire records and meteorological context, the study provides an empirical basis for stratified fire-risk assessment in Polish forests and supports targeted prevention and management measures. This research is conducted as part of the NCN project 2023/49/N/ST10/04035 "Fire, burnt area and charcoal - charcoal-data modeling of burnt area, cross-validation of fires and charcoal signal".

How to cite: Kowalczyk, P., Zin, E., Tyburski, Ł., Śleszyński, P., Słowińska, S., Kaszkiel, A., Czubak, D., Klisz, M., Pilch, K., Kaczmarowski, J., and Słowiński, M.: Dimensions of forest fires in Poland, 2019-2024, EGU General Assembly 2026, Vienna, Austria, 3–8 May 2026, EGU26-22880, https://doi.org/10.5194/egusphere-egu26-22880, 2026.

EGU26-583 | Posters on site | BG1.2

Wind to plume driven wildfire cycles caused by topographically forced wildfire – atmosphere coupling, Southeast Queensland, Australia. 

Hamish McGowan, Adrien Guyot, Andrew Sturman, Viola Seifried, and Tony Dale

Mountains create their own weather through topographic modification of the prevailing synoptic meteorology. As a result, wildfires in mountainous terrain may exhibit erratic and extreme behaviour as ridges and valleys modify the prevailing winds. Here we present a case study analysis of a wildfire that occurred in mountainous terrain in subtropical eastern Australia. The wildfire was observed to transition between a wind-driven and plume-driven wildfire on at least three occasions with a periodicity of around 60 minutes. The Weather Research and Forecasting (WRF) model was used to investigate the surface windfield and vertical thermodynamic properties of the atmosphere. Results from the WRF simulations aligned with observational data indicating that topographic lifting caused by only moderate changes in terrain may have contributed to the coupling of the wildfire plume to an elevated layer of humidity leading to rapid pyrocumulus (pyroCu) development. Strong horizontal wind shear caused the pyroCu to detach from the wildfire on at least three occasions with a subsequent return to wind-driven wildfire behaviour. Our results highlight the importance of understanding the influence of what may be perceived as only subtle to moderate changes in terrain on local meteorological conditions and wildfire behaviour.

How to cite: McGowan, H., Guyot, A., Sturman, A., Seifried, V., and Dale, T.: Wind to plume driven wildfire cycles caused by topographically forced wildfire – atmosphere coupling, Southeast Queensland, Australia., EGU General Assembly 2026, Vienna, Austria, 3–8 May 2026, EGU26-583, https://doi.org/10.5194/egusphere-egu26-583, 2026.

EGU26-897 | ECS | Orals | BG1.2

Prescribed burning reduces wildfire impacts in Brazil, but extreme events are climate-driven 

Renata Veiga, Julia Rodrigues, Caio Sena, Leonardo Peres, Livia Moura, Julia Boock, Osvaldo Gajardo, Daniel Silva, Isabel Schmidt, and Renata Libonati

Wildfires are natural components of fire-prone settings. Yet, their severity, intensity, frequency and duration have escalated to damaging levels in recent decades, predominantly due to climate change. The rise of extreme fire weather conditions has amplified the impacts of wildfires, calling for prevention mechanisms to become more prominent and broadly implemented. In this context, Integrated Fire Management (IFM) emerges as a mitigation strategy worldwide, in which prescribed burning (PB) is a common activity. In Brazil, after the prevalence of fire exclusion policies, the Integrated Fire Management National Policy (PNMIF, in Portuguese) was approved in 2024, positioning IFM as a strategy to reduce the intensity and severity of wildfires, while encouraging a comprehensive understanding of the ecological, economic and sociocultural aspects of fire. In light of the recently approved National Policy, documentation of existing results is extremely important, as current IFM projects can inform the implementation of fire management activities at a national level. In this study, we assess over two decades (2001-2021) of remote sensing data to evaluate fire regime in protected areas in Brazil before and after the implementation of PB, through the analysis of burned area and fire intensity in the late dry season. We use MODIS MCD64A1 product to estimate burned area and Fire Radiative Power (FRP) derived from MCD14DL active fire product to estimate fire intensity. We evaluate 31 Protected Areas in Brazil, including Indigenous Lands, Conservation Units and Quilombola Territory, spread across Amazonia, Cerrado, Mata Atlantica and Pantanal biomes. We separate them into four groups, based on the year when PB started: 2015, 2016, 2017 or 2018. We compare the Kernel Probability Density Function for 11 different percentiles, from p50 to p99, of burned area and FRP for the periods before and after the implementation of PB of each group. We emphasize extreme events using the percentiles above p90 (p90, p95 and p99). Our results indicate that PB effectively reduces burned area and FRP, but its effectiveness decreases during extreme events, as shown by the prevalence of smaller reductions at higher percentiles. We hypothesize that extreme events are predominantly driven by climatic variables, which limits the effectiveness of PB in such conditions. This becomes increasingly relevant under a changing climate. Our results also indicate that PB does not yield immediate outcomes. For burned area, groups with the shortest PB history are ineffective at p99 in 2017 and from p85 onward in 2018, evidenced by higher values after PB implementation relative to the pre-implementation period. For FRP, 2018 is also dominated by the ineffectiveness of PB. This research is ongoing, and our preliminary results highlight the role of PB in managing burned area and fire intensity, as well as the influence of climatic factors in driving extreme fire events. Thus, the implementation of PNMIF and the management of wildfires require strategic planning and continuous monitoring, with adaptation and mitigation mechanisms as key components. 

How to cite: Veiga, R., Rodrigues, J., Sena, C., Peres, L., Moura, L., Boock, J., Gajardo, O., Silva, D., Schmidt, I., and Libonati, R.: Prescribed burning reduces wildfire impacts in Brazil, but extreme events are climate-driven, EGU General Assembly 2026, Vienna, Austria, 3–8 May 2026, EGU26-897, https://doi.org/10.5194/egusphere-egu26-897, 2026.

EGU26-1269 | ECS | Posters on site | BG1.2

Fires during recent El Niño and La Niña periods in Eastern Amazon 

Savanah Freitas, Débora Dutra, Isadora Haddad, Guilherme Mataveli, Maria Isabel Escada, and Luiz Aragão

Anomalies in sea surface temperature of the tropical Pacific Ocean, are associated with changes in precipitation and humidity patterns in the Amazon region. Temperature increases (El Niño) causes abnormal dry seasons, making the forest more susceptible to wildfires. The decrease (La Niña) in ocean temperatures implies abnormal increases in rainfall, especially in the northern region of Amazon. Between 2019 and 2024, the municipality of Santarém (Pará, Brazil), eastern Amazon, was affected by an increase in forest fires, leading the local government to declare an environmental emergency state in 2024. The objective of this study was to characterize burned areas and changes in land cover in Santarém during the recent ENSO period (2019 to 2024). Annual data on Land Use and Land Cover (LULC) from MapBiomas (Collection 10), and monthly data of burned area from MapBiomas Fogo (Collection 4) were used. National Oceanic and Atmospheric Administration's (NOAAs) Weather Prediction Center data was used to define El Niño (EN), La Niña (LN) and “no anomalies” months (Regular - Rg). LULC was analyzed in small properties (SMp > 300 hectares (ha)), medium-sized (MS, 300 to 1125 ha), large properties (LP >1125 ha), and smallholdings (SMs < 300 ha), as well as indigenous lands (ILs), quilombola areas (Qa), and conservation units (Cs). These data were extracted from SICAR (National Rural Environmental Registry System). For EN periods, 19 months between 2019 and 2024 were analyzed, with 62,962.56 ha of burned areas. For LN (28 months), 15,799.59 ha were burned. During Rg (25 months), 60,109.20 ha of burned area were detected. During EN and Rg periods, Forest Formation (FF) was the most affected coverage, with 36,016.92 ha (EN, 57%) and 39,183.03 (Rg, 65%). For LN, the highest burned coverage was Pasture (Pt), with 8,537.94 ha burned. Mostly small properties (SMp) were affected, with 1,249.29 ha (EN) and 1,124.82 ha (Rg) of FF scorched (1.87%). Pt areas were also affected in SMp (2.07%), accounting for 4.84% of the total. For the protected areas, Cs had 5.63% of the total burned area, with 3,913.47 ha (EN), 2,574.09 ha (Rg) and 1,330.56 ha (LN), mostly in FF. ILs had 1.04% of the total, mostly during EN, with 1,287.27 ha. Other classes (MS, LP, SMs and Qa) accounted for only 1.06% of the burned area. Areas without SICAR classification had the largest burned area (87.43% of the total). These patterns raise concern, given that burning persists in forest areas that remain unprotected and unmonitored. The occurrence of climatic phenomena that induce drier vegetation and less precipitation in the Amazon enable increases in  burned area associated with anthropic activities. Implementing fire-prevention measures in vulnerable areas is crucial, and it is equally important to account for these climatic periods. Investment in public policies for environmental education and fire mitigation are essential for transforming these scenarios, in order to mitigate the effects of climate change.

How to cite: Freitas, S., Dutra, D., Haddad, I., Mataveli, G., Escada, M. I., and Aragão, L.: Fires during recent El Niño and La Niña periods in Eastern Amazon, EGU General Assembly 2026, Vienna, Austria, 3–8 May 2026, EGU26-1269, https://doi.org/10.5194/egusphere-egu26-1269, 2026.

In recent years, California has experienced increasingly severe wildfire events, leading to substantial socio-economic losses and ecological degradation. Against this backdrop, this study aims to identify key indicators influencing forest fire occurrence, assess forest fire vulnerability, and examine vegetation cover changes in Butte County, California. First, we analyze and visualize 14 wildfire-relevant environmental and anthropogenic factors, capturing climatic, topographic, and land-use characteristics of the study area. To address multicollinearity among variables, the Variance Inflation Factor (VIF) is employed, resulting in the selection of 11 non-collinear indicators. Based on these selected variables, a Boosted Regression Tree (BRT) model is applied to evaluate spatial patterns of wildfire vulnerability in Butte County. Finally, we employ Vegetation Fractional Cover (VFC) to quantify post-fire vegetation cover changes, enabling an assessment of wildfire impacts on vegetation dynamics. The results indicate that rainfall, land use, and topographic conditions exert significant influences on wildfire vulnerability in Butte County. Moreover, VFC analysis reveals a notable decline in vegetation cover surrounding fire locations between July 2024 and September 2024, highlighting the short-term ecological impacts of recent wildfire events.

How to cite: Tong, C.: Wildfire Vulnerability Modeling and Vegetation Cover Change in Butte: An Analysis Based on Boosted Regression Tree, EGU General Assembly 2026, Vienna, Austria, 3–8 May 2026, EGU26-4145, https://doi.org/10.5194/egusphere-egu26-4145, 2026.

In February 2024, the Las Tablas wildfire killed at least 135 people near the coastal city of Valparaíso, Chile, making it the deadliest wildfire disaster since the 2009 Black Saturday bushfires in Australia. Amid increased focus on global wildfire disasters, the economic impacts of wildfires often overshadow fatalities, presenting a gap in analysis and understanding of why some fires are more deadly than others. Here, we reconstruct the 2024 Las Tablas Fire and use a mixed methods approach to examine the factors contributing to the record fatalities. We further assess how this fire aligns with other recent global wildfire disasters that produced mass fatalities. The Las Tablas Fire occurred during a record heat wave and with an offshore wind, known locally as a puelche wind. Satellite data and burn severity patterns show it exhibited high rates of spread burning through highly flammable, non-native forests and complex topography in the wildland-urban interface. Most fatalities occurred in neighborhoods of informal, unregulated housing not connected to city services and home to some of the most vulnerable residents of the region. Both the biophysical and social factors present in the Las Tablas Fire are consistent with many recent fatal wildfire disasters globally, particularly in Mediterranean climates. These common denominators point to the potential for increasing frequency of fatal wildfire disasters with climate change, land use change, and social disparities. They also highlight the complexity of mitigating fatal wildfires.

How to cite: Kolden, C.: Why was the 2024 Las Tablas Fire in Chile so deadly? Common socioecological drivers of global wildfire disasters, EGU General Assembly 2026, Vienna, Austria, 3–8 May 2026, EGU26-5690, https://doi.org/10.5194/egusphere-egu26-5690, 2026.

Extreme forest fires are escalating globally, causing extensive forest loss and prolonged recovery time, which raises the risk of forests transitioning from carbon sinks to sources. However, most studies define extreme fires solely by burned area, neglecting interactions among fire characteristics and potentially underestimating their impacts on post-fire recovery. Here we constructed a global multidimensional forest fire dataset (2001–2021) comprising >300,000 events with burned area, intensity, duration, spread rate, and severity. After around 2010, fire characteristics intensified, especially in extratropical forests, with burned area and duration often triggering cascading amplifications of intensity, spread rate, and severity. While extreme large‑area fires frequently coincided with fast spread and long duration, they seldom reached extremes in both intensity and severity. Notably, the 244 forest fires that were extreme across all five dimensions simultaneously increased significantly, yet 75% occurred after 2011. Forests affected by these synchronized extremes required 1.2 years longer to recover than the global mean and also 0.4–1.0 years longer than fires extreme in any single dimension. We further identified that the interaction between fire intensity and severity as the primary driver of prolonged recovery across nearly all biogeographic pyromes. These results demonstrate that conventionally defined extreme large-area fires do not necessarily represent the most ecologically damaging events. Despite increasing global fire-suppression investment, current strategies may primarily remove low-intensity, small fires while failing to mitigate the catastrophic consequences of climate-amplified extreme wildfires, escalating threat poses profound challenges to global forest recovery and carbon-cycle stability.

How to cite: Lv, Q. and Peng, J.: Synchronized Extremes in Forest Wildfires: Amplified Recovery Delays from Coupled Intensity and Severity, EGU General Assembly 2026, Vienna, Austria, 3–8 May 2026, EGU26-6152, https://doi.org/10.5194/egusphere-egu26-6152, 2026.

EGU26-6694 | ECS | Posters on site | BG1.2

Airborne infrared observations of extreme wildfires in California 2022 

Thijs Stockmans, Andrew Klofas, Craig B. Clements, Christopher C. Giesige, Eric Goldbeck-Dimon, Salini Manoj Santhi, Paula Olivera Prieto, and Mario Miguel Valero

Extreme wildfires are one of the most destructive natural phenomena in our world. Modeling of these fires is challenging due to large uncertainties in model parameters as well as initial and boundary conditions. High-resolution observations of fire behavior can be used to reduce modeling uncertainties. However, adequate observational systems and methods are scarce.

We will present airborne based mid-wave infrared (MWIR) and long-wave infrared (LWIR) imagery with high spatial and temporal resolution of extreme fires that occurred in California around September 2022. This data was captured using the SJSU Wildfire Imaging Suite during the California Fire Dynamics Experiment (CalFiDE) campaign together with meteorological data both from ground-based and airborne instruments.

We will show a comparison of our airborne observations with the infrared spectral imagery captured by the spaceborne MODIS and VIIRS instruments during the campaign. The cross-platform comparison will address the spatial extent of the fire as well as the differences in the registered radiance values. 

This rich dataset, including more than 400 overpasses over multiple days and multiple extreme fires, provides a unique detailed view of the active wildfire behavior during these fire events. 


Acknowledgements: This work was supported by the U.S. National Science Foundation under award number 2053619, the U.S. National Oceanic and Atmospheric Administration during the CalFiDE campaign, and the EU COST Action NERO (CA22164).

How to cite: Stockmans, T., Klofas, A., Clements, C. B., Giesige, C. C., Goldbeck-Dimon, E., Manoj Santhi, S., Olivera Prieto, P., and Valero, M. M.: Airborne infrared observations of extreme wildfires in California 2022, EGU General Assembly 2026, Vienna, Austria, 3–8 May 2026, EGU26-6694, https://doi.org/10.5194/egusphere-egu26-6694, 2026.

EGU26-6760 | ECS | Posters on site | BG1.2

Building a Unified Framework for Extreme Wildfire Data in Europe 

Paula Olivera Prieto, Nieves Fernández Anez, Roman Berčák, Thijs Stockmans, Salini Manoj Santhi, Theodore M. Giannaros, and Mario Miguel Valero

Extreme wildfires present an increasing environmental and socio-economic concern across Europe. However, the absence of comprehensive observational datasets of fire behaviour restricts the capacity to analyse, model, and manage extreme wildfire events effectively. This work aims to develop a unified and standardized dataset of extreme wildfire events in Europe based on reliable official sources, thus contributing to a consistent reference for research and management applications.

Fire event information was gathered from European fire management agencies. The data has been filtered and organized to capture the most relevant variables for extreme fire behaviour analysis, such as the temporal evolution of the burned area and the fire perimeter. Data processing and validation was performed in QGIS and outputs were exported in GeoJSON format to ensure easy integration in any geographic information system. The produced dataset allows the temporal and spatial reconstruction of fire progression. The overarching goal is to develop a comprehensive dataset of extreme wildfire events across Europe to support research and modelling efforts through shared, high-quality and standardized data resources.

Acknowledgements: This research initiative is based upon work from COST Action NERO, CA22164, supported by COST (European Cooperation in Science and Technology).

How to cite: Olivera Prieto, P., Fernández Anez, N., Berčák, R., Stockmans, T., Manoj Santhi, S., Giannaros, T. M., and Valero, M. M.: Building a Unified Framework for Extreme Wildfire Data in Europe, EGU General Assembly 2026, Vienna, Austria, 3–8 May 2026, EGU26-6760, https://doi.org/10.5194/egusphere-egu26-6760, 2026.

EGU26-8792 | Posters on site | BG1.2

Extreme wildfire simulations using kilometer-scale regionally refined E3SM 

Qi Tang, Ziming Ke, Jishi Zhang, Yang Chen, Xiuyuan Ding, James Randerson, Yunyan Zhang, and Gang Chen

Extreme wildfires have become more frequent in many regions worldwide in recent years. Compared with moderate events, the most intense wildfires, especially those that generate pyrocumulonimbus (pyroCb) clouds, exert disproportionately large impacts on the Earth system and cause substantial socioeconomic losses. High‑fidelity modeling is a critical tool for studying wildfire behavior, identifying key drivers, and quantifying their impacts. Here, we improve the pyroCb representation in the global Energy Exascale Earth System Model (E3SM) by leveraging its kilometer-scale regionally refined model (RRM) capability, integrating satellite-based high-resolution (hourly, 500 m) fire emissions, and incorporating fire-related parameterizations. Compared with conventional global simulations at coarse resolution (approximately 100 km), the kilometer-scale grid spacing over the fire source region substantially improves the simulation by explicitly resolving more fire-related dynamic and thermodynamic processes. In the meanwhile, the RRM configuration enables seamless smoke transport and interactions between the fine and coarse meshes and allows efficient simulation of downstream fire aerosol spatiotemporal distributions in regions where high resolution is less critical. The simulations capture essential pyroCb features, e.g., cloud height, spatiotemporal evolution, and convective intensity, as observed by satellite and ground measurements for different cases occurred in California. Sensitivity experiments suggest that pyroCb formation in our simulations is not controlled by a single dominant factor, but instead emerges from the coupled interactions of multiple fire-atmosphere processes. Furthermore, we use the global RRM to investigate the mechanisms of stratospheric aerosol injection and examine implications for seasonal and longer predictability. Because these simulations include interactive chemistry and aerosol schemes, we also evaluate the impacts of wildfires on surface air quality.

How to cite: Tang, Q., Ke, Z., Zhang, J., Chen, Y., Ding, X., Randerson, J., Zhang, Y., and Chen, G.: Extreme wildfire simulations using kilometer-scale regionally refined E3SM, EGU General Assembly 2026, Vienna, Austria, 3–8 May 2026, EGU26-8792, https://doi.org/10.5194/egusphere-egu26-8792, 2026.

EGU26-10023 | ECS | Posters on site | BG1.2

How Sensible Heat Release and Water Vapor Emissions from Fires Impact the Characteristics of Pyro-convective Plumes 

Jason Müller, Fabian Senf, and Ina Tegen

Large wildfires are a major source of atmopsheric aerosol. The lifetime of the smoke aerosol in the atmosphere, and thus their impact on the climate, is strongly controlled by the altitude in which the smoke is injected into the atmopshere. While most fires release their smoke in the lower troposphere, so called pyrocumulunimbus (PyroCb) events have the potential to transport smoke aerosol upwards deep into the troposphere and even into the lower stratosphere, extending the lifetime of the smoke by several orders of magnitude. These PyroCbs are thunderstorms that are triggered by extreme heat release and occasionally form above particularly intense wildfires.

For example, during the extreme PyroCb event now often referred to as the “Australian New Year’s Eve Event” of 2019/2020, deep pyro-convective plumes generated by record-breaking wildfires injected vast quantities of smoke into the tropopause region that are comparable to those of a major volcanic eruption. It is therefore crucial to understand which fires produce deep PyroCbs and why. In this study, we investigate the critical heat emission threshold at which shallow wildfire smoke plumes transition into pyroCbs that penetrate deep into the tropopause region. We further examine the sensitivity of the pyroCbs to further changes in the total amount of heat released by the fire and analyze how changes in the sensible heat emissions and water vapor release impact plume dynamics. 

To do that, using case studies of extreme fires such as the Australian New Years Eve PyroCb event, we perform semi-idealized simulations with a regional high-resolution atmospheric model. Based on the so simulated plumes, we uncover a pronounced bimodal behavior of the fire-induced convection with an abrupt onset of pyroCb formation when the sensible heat flux emissions by the fire exceeds 50kW m-2. We show, that whenever cloud formation is present within the plume, the plume top height is mainly controlled by the sum of the sensible and latent heat flux by the fire, while the ratio between the two plays a subordinate role. Increasing either heat flux will simultanously raise  both the plume water content and temperature anomaly within the cloud.  These results show the importance of accurate estimates of heat and moisture released by fires for predicting pyroCb development. Encouragingly, these results suggest that a reliable estimate of the total heat flux might be sufficient to characterize the behavior of pyroCbs, reducing the need for detailed partitioning of sensible and latent heat.

How to cite: Müller, J., Senf, F., and Tegen, I.: How Sensible Heat Release and Water Vapor Emissions from Fires Impact the Characteristics of Pyro-convective Plumes, EGU General Assembly 2026, Vienna, Austria, 3–8 May 2026, EGU26-10023, https://doi.org/10.5194/egusphere-egu26-10023, 2026.

EGU26-10291 | ECS | Posters on site | BG1.2

Sampling extreme wildfire events from LPJmL-SPITFIRE large ensemble simulations 

Andreia Ribeiro, Kirsten Thonicke, Maik Billing, Werner von Bloh, Jakob Wessel, Sabine Undorf, Matthias Forkel, and Jakob Zscheischler

Extreme fire weather conditions are becoming increasingly unprecedented worldwide, yet the full range of potentially high-impact extreme wildfires remains difficult to assess. Here we generate a large ensemble of wildfire simulations by forcing the process-based model LPJmL-SPITFIRE with a 40-member bias-adjusted and statistically downscaled climate model (ACCESS-ESM1-5). This enables robust sampling of extreme wildfire events and allows comparison against single realizations (using forcing from climate reanalysis GSWP3-W5E and from an individual climate model ensemble member, r1i1p1f1). We show that wildfire ensemble maxima typically exceed single realizations maxima, suggesting that using a single climate forcing misses a substantial portion of the plausible extreme wildfire events due to internal climate variability. Extreme fire impacts (carbon emissions and burned area) respond more strongly to internal climate variability than fire weather conditions, suggesting a strong vegetation-fire feedback sensitivity to the climate forcing. Additionally, the large ensemble simulations capture climate driver-fire relationships not captured by single realizations, where maximum impacts occur without maximum fire danger, and vice-versa, highlighting the critical role of other factors beyond weather conditions that contribute to whether fires become extreme. These findings demonstrate that modelling a large range of possible wildfire events using the full distribution of climate realizations can help identify the mechanisms leading to the most extreme events.

How to cite: Ribeiro, A., Thonicke, K., Billing, M., von Bloh, W., Wessel, J., Undorf, S., Forkel, M., and Zscheischler, J.: Sampling extreme wildfire events from LPJmL-SPITFIRE large ensemble simulations, EGU General Assembly 2026, Vienna, Austria, 3–8 May 2026, EGU26-10291, https://doi.org/10.5194/egusphere-egu26-10291, 2026.

EGU26-12505 | ECS | Posters on site | BG1.2

Why some wildfires become megafires: compound short-term fire weather and antecedent drought controls in Mediterranean Europe. 

Farzad Ghasemiazma, Marj Tonini, Paolo Fiorucci, and Marco Turco

Extreme wildfires and megafires in Mediterranean Europe generate disproportionate ecological, social, and economic impacts, yet the processes that govern transitions from large fires to the most extreme events remain insufficiently constrained. In particular, it is unclear whether the emergence of megafires is primarily controlled by short-term atmospheric fire-weather anomalies, antecedent drought-driven fuel preconditioning, or their compound interaction. Clarifying these mechanisms is critical for improving impact-oriented wildfire risk assessment and early warning.

Here, we analyse 11,403 summer wildfires (≥30 ha) that occurred across Mediterranean Europe between 2008 and 2022, including 44 megafires (≥10,000 ha). Fires are classified into four size categories (30–100 ha, 100–1,000 ha, 1,000–10,000 ha, and ≥10,000 ha) to explicitly examine transitions across wildfire size classes. Official fire perimeters from EFFIS are combined with the MESOGEOS environmental–fire datacube (daily, 1 km), integrating meteorological variables, drought indicators, and land-surface conditions.

Fast-reacting atmospheric drivers (air and land-surface temperature, relative humidity, precipitation, and wind speed) are characterized over a ±1-day window around the reported ignition date and aggregated as a 3-day mean to account for start-date uncertainty. Slow-reacting environmental controls are represented using multi-month antecedent drought indicators, including the Standardized Precipitation–Evapotranspiration Index (SPEI), capturing longer-term fuel moisture and stress conditions.

Across increasing fire-size classes, we observe a systematic intensification of hot, dry, and windy conditions near ignition, alongside progressively drier antecedent conditions. Drought indicators show marked stepwise deterioration from medium to very large fires, supporting a strong role of fuel preconditioning driven by prolonged moisture deficits. However, the transition from very large fires to megafires is distinguished less by further increases in drought severity and more by exceptional short-term fire-weather anomalies, particularly strong winds and anomalously high night-time land-surface temperatures.

Using Random Forest classification models with permutation-based feature importance and repeated cross-validation to address class imbalance, we identify a compact and interpretable set of predictors that consistently discriminate transitions toward extreme fire sizes. Night-time land-surface temperature and wind speed emerge as dominant drivers of megafire occurrence, while multi-month drought indicators play a secondary role at the uppermost tail. Complementary logistic regression analyses confirm coherent directions of effect and demonstrate meaningful predictive skill for rare extreme events.

Overall, our results support a compound but non-uniform mechanism: antecedent drought and fuel stress set the stage for very large fires, whereas megafires arise when this preconditioning coincides with extreme short-term fire-weather conditions, particularly persistent nocturnal heat and strong winds. These findings provide actionable insights for extreme-event-focused wildfire early warning and highlight the need to jointly address fuel management and short-term atmospheric extremes under a warming Mediterranean climate.

References:

Balch et al. (2022), Nature.
Fernandes et al. (2016), Journal of Geophysical Research: Biogeosciences.
Ghasemiazma et al.(2026), NPJ Natural Hazard (under revision).
Linley et al. (2022), Global Ecology and Biogeography.
Luo et al. (2024), Nature.
Ruffault et al. (2020), Scientific Reports.
Turco et al. (2017), Scientific Reports.

How to cite: Ghasemiazma, F., Tonini, M., Fiorucci, P., and Turco, M.: Why some wildfires become megafires: compound short-term fire weather and antecedent drought controls in Mediterranean Europe., EGU General Assembly 2026, Vienna, Austria, 3–8 May 2026, EGU26-12505, https://doi.org/10.5194/egusphere-egu26-12505, 2026.

EGU26-13422 | Orals | BG1.2

Modelling multidimensional causes and impacts of extreme fires in the climate system through X-ECV analysis (XFires) 

Stephen Sitch, Clement Albergel, Philippe Ciais, Simon Bowring, Emilio Chuvieco, Pierre Defourny, Wouter Dorigo, Tom Eames, Darren Ghent, María Lucrecia Pettinari, James Haywood, Daan Hubert, Ben Johnson, Stine Kildegaard Rose, Céline Lamarche, Mary Francesca Langsdale, Carlota Segura García, Erika Cristina Solano Romero, Roland Vernooij, and Guido van der Werf and the XFires Team

Fire plays an important role in the Earth system, affecting atmospheric composition and climate, vegetation, soil and societal resources. Extreme fires are particularly important, as they entail the most severe damages, both in terms of social and ecological values. According to the European Commission, within Europe “most damage caused by fires is due to extreme fire events, which only account for about 2% of the total number of fires”. Their occurrence and impacts are closely linked to climate change, and are related to a wide range of climatic and environmental state variables, such as soil and vegetation moisture content, biomass, temperature, etc. Fires have a powerful impact on the atmosphere and thus aerosol, greenhouse gases, and ozone concentrations, while the indirect effects of fire-related particles affect also water bodies and ice sheets.

Here we summarize progress on the XFires project, which aims to research and quantify all of the above interactions to gain a holistic understanding of extreme fires, including understanding drivers of extreme fire events, modelling their occurrence and their impact in the Earth system. A particular focus of this project lies in gaining an improved theoretical and quantitative understanding of what the medium-term net effects of fire are on global carbon and radiative forcing budgets.  This is important because at a global scale, little is known regarding how extreme fires impact vegetation and soil recovery timescales with respect to the time until the same system next experiences fire. Extreme fires are of particular interest because of how different biomes might hypothetically respond to, and recover from, different extreme fire characteristics, which have significant potential bearing on the global carbon cycle. To address these questions, we first use a cross-Essential Climate Variable (ECVs) approach to define and characterise extreme fires. Results show almost 20k extreme fire events over the period 2003 to 2022. We then explore trends in extreme fire events across biomes and associated greenhouse gas emissions. We will then develop and apply machine-learning approaches to model extreme fires and generate new emissions datasets to be used as input into an Earth System Model, to quantify impacts on atmospheric composition and climate. Finally, we will explore the wider impact of extreme fires on human health, lakes, and via black carbon affecting melt-rates on the Greenland ice-sheet.

How to cite: Sitch, S., Albergel, C., Ciais, P., Bowring, S., Chuvieco, E., Defourny, P., Dorigo, W., Eames, T., Ghent, D., Pettinari, M. L., Haywood, J., Hubert, D., Johnson, B., Kildegaard Rose, S., Lamarche, C., Langsdale, M. F., Segura García, C., Solano Romero, E. C., Vernooij, R., and van der Werf, G. and the XFires Team: Modelling multidimensional causes and impacts of extreme fires in the climate system through X-ECV analysis (XFires), EGU General Assembly 2026, Vienna, Austria, 3–8 May 2026, EGU26-13422, https://doi.org/10.5194/egusphere-egu26-13422, 2026.

EGU26-14889 | Orals | BG1.2

Fire weather waves drive extreme fires globally 

John Abatzoglou, Cong Yin, Piyush Jain, Motjaba Sadegh, Mike Flannigan, and Matthew Jones

Fire weather waves (FWWs), episodes of persistent extreme fire weather akin to heat waves, sustaining favorable burning conditions over multiple consecutive days. Here, we examine the relationship between FWWs and fire activity, as well as the patterns and trends of FWWs across global terrestrial ecoregions. Accounting for only 4% of days during 2002–2024 in forested ecoregions, FWWs coincided with 26% of the area burned, and half of the top 1% of energetic fires ignited on FWW days. Compared with grassland and shrubland fires, forest fires exhibit a larger and more persistent increase in daily burned area in response to FWWs, particularly in Mediterranean forests. FWWs intensify fire activity by sustaining warmer, drier, and windier conditions compared to non-FWW periods – facilitating chronic periods of favorable fire weather that promote fire spread. FWWs have become, and are projected to become, more frequent, persistent, and severe, with a twofold increase in FWW days projected for 2076–2100 compared to 1979–2024. These findings underscore forecasted FWWs as an important component of early warning systems to strengthen preparedness for extreme forest fires.

How to cite: Abatzoglou, J., Yin, C., Jain, P., Sadegh, M., Flannigan, M., and Jones, M.: Fire weather waves drive extreme fires globally, EGU General Assembly 2026, Vienna, Austria, 3–8 May 2026, EGU26-14889, https://doi.org/10.5194/egusphere-egu26-14889, 2026.

EGU26-15952 * | Orals | BG1.2 | Highlight

What makes a wildfire extreme? 

Carla Staver

Extreme wildfires are occurring more frequently in many (although not all) flammable ecosystems. However, what exactly is meant by extreme depends on the context, as fires may be increasing in extent, size, intensity, rate of spread, severity, and/or infrastructural and economic damage, and these different meanings of extreme fire are often conflated. Here, we explore what is meant by extreme wildfire and discuss some of the analytical challenges to understanding extreme fire behaviors. We also examine some examples of analyses that have appropriately differentiated extreme fires from other wildfires to better understand the drivers of extreme wildfires in the context of climate and global change.

How to cite: Staver, C.: What makes a wildfire extreme?, EGU General Assembly 2026, Vienna, Austria, 3–8 May 2026, EGU26-15952, https://doi.org/10.5194/egusphere-egu26-15952, 2026.

EGU26-16760 | Orals | BG1.2

CCI Fire advances: global Sentinel-2 burned area product, harmonised MODIS - Sentinel-3 dataset, and extreme fires events database 

M. Lucrecia Pettinari, Carlota Segura-García, Erika Solano-Romero, Miguel Ángel Torres-Vázquez, Amin Khaïroun, Rubén Ramo-Sánchez, Thomas Storm, Martin Boettcher, Hannes Neuschmidt, Carsten Brockmann, Clément Albergel, Stephen Sitch, and Emilio Chuvieco

As part of the ESA Climate Change Initiative (CCI), two projects – FireCCI and XFires – have developed during the past year several datasets that will significantly contribute to the understanding of the fire phenomenon and the analysis of extreme fires and their climatic consequences.

In FireCCI, we have developed the first global Sentinel-2 burned area (BA) dataset at 20-m spatial resolution (FireCCIS2.v1), achieving a level of detection of small fire patches not possible with coarse resolution sensors, and thus increasing the BA detection to more than 8 Mkm2 for the year 2023. This means more than double the BA detected by other existing global products such as MCD64A1 and VNP64A1, and >60% more than the Sentinel-3 based dataset FireCCIS311. This new generation of medium resolution datasets is expected to significantly improve the calculation of fire emissions, and contribute to fire ecology, land use change, and other fire related research.  

Complementary, we have also produced a harmonised global burned area dataset that extends the ESA FireCCI record from 2003 to 2024 (to be extended to the future), with monthly temporal resolution on a 0.25° grid. The product, named FireCCI60, ensures continuity between the historical FireCCI51 product (based on MODIS) and the more recent FireCCIS311 product (based on Sentinel-3), addressing the challenge posed by the forthcoming end of the MODIS mission for long-term fire monitoring and its climate-related applications. This dataset harmonises de FireCCI51 BA detections to resemble as close as possible FireCCIS311, which has a better detection capability, in order to obtain a dataset that is consistent through the time series and can be directly used for time series analysis and extreme fire research. This harmonisation adds around of 1 Mkm2 of BA per year to the FireCCI51 detection, with mean yearly BA values of ~5.6 Mkm2.

Finally, as part of the XFires project, we have developed an extreme fire events (EFE) dataset, based on FireCCI51 BA and MODIS active fires products, and identified both extreme and non-extreme fire events over the past two decades on a 0.25° grid. The identification of EFEs is performed using a statistical approach on a per-region basis that aims to tackle the fact that different parts of the world present different typical patterns of fire – one of the main challenges to defining EFEs globally. This dataset is currently being updated to integrate the harmonised FireCCI60 one, to obtain a consistent EFE database spanning to the present that can be used to explore trends, causes and consquences of extreme fire occurrence during the past decades.

How to cite: Pettinari, M. L., Segura-García, C., Solano-Romero, E., Torres-Vázquez, M. Á., Khaïroun, A., Ramo-Sánchez, R., Storm, T., Boettcher, M., Neuschmidt, H., Brockmann, C., Albergel, C., Sitch, S., and Chuvieco, E.: CCI Fire advances: global Sentinel-2 burned area product, harmonised MODIS - Sentinel-3 dataset, and extreme fires events database, EGU General Assembly 2026, Vienna, Austria, 3–8 May 2026, EGU26-16760, https://doi.org/10.5194/egusphere-egu26-16760, 2026.

EGU26-18849 | ECS | Posters on site | BG1.2

Probabilistic forecasting of wildfire ignitions and intensity at sub-kilometre scale using diffusion models 

Yuchen Bai, Georgios Athanasiou, Diogenis Antonopoulos, Ioannis Papoutsis, and Nuno Carvalhais

Wildfires are becoming more frequent and severe in many fire-prone regions, with disproportionate impacts on carbon emissions, ecosystems, and society. However, existing fire and Earth system models still struggle to represent the highly localized and stochastic nature of extreme fire ignitions and to quantify their short-term impacts at fine spatial scales.

In this work, we develop a data-driven framework for next day active fire forecasting at sub-kilometre resolution by combining reanalysis meteorology with satellite fire observations. Our approach builds on recent advances in spatio-temporal deep learning from the AI community, in particular Earth system transformers and denoising diffusion probabilistic models. We use multi-year ERA5 meteorological fields together with static variables (topography, land cover, fuel proxies) as training data, and VIIRS active fire detections and pixel-level brightness/fire radiative power as targets.

The model consists of a deterministic spatio-temporal backbone that encodes the joint evolution of weather and surface conditions, coupled to a diffusion-based probabilistic head that predicts the distribution of future ignition locations and associated fire intensity. This design allows us to explicitly represent uncertainty in rare, extreme events while retaining high spatial resolution. We evaluate the system on multiple fire-prone regions and held-out seasons containing documented extreme fire episodes. Preliminary results show improved skill in localizing ignitions and capturing extreme-tail intensity compared to baseline statistical and convolutional models, particularly in top-k precision metrics relevant for operational targeting.

We plan to couple the predicted intensity fields with standard emission factors to estimate event-scale CO₂ emissions and explore the relative importance of meteorological and surface drivers using feature attribution techniques using causality discovery methods. Our findings illustrate the potential of modern probabilistic deep learning to bridge between high-resolution fire observations and Earth system applications, and to support the assessment and management of future extreme fires.

How to cite: Bai, Y., Athanasiou, G., Antonopoulos, D., Papoutsis, I., and Carvalhais, N.: Probabilistic forecasting of wildfire ignitions and intensity at sub-kilometre scale using diffusion models, EGU General Assembly 2026, Vienna, Austria, 3–8 May 2026, EGU26-18849, https://doi.org/10.5194/egusphere-egu26-18849, 2026.

EGU26-19805 | ECS | Orals | BG1.2

How Climate and Land Cover Change Shaped Europe's Record Breaking 2025 Fire Season 

Theodore Keeping, Mariam Zachariah, Clair Barnes, Olivia Haas, Emmanouil Grillakis, Izidine Pinto, Ben Clarke, Joyce Kimutai, Sjoukje Philip, Sarah Kew, and Friederike Otto

The 2025 European fire season was characterised by record-breaking burned area and multiple extreme wildfire events across the continent. Increasing wildfire extremes in Europe and globally has intensified interest in how climate and land-use changes are altering European fire regimes. Extreme event attribution of antecedent and concurrent fire weather conditions is used here to assess the changing likelihood and intensity of recent events both relative to preindustrial conditions and under projected climate change.

We analyse five regions that experienced extreme wildfire activity in 2025: northwestern Iberia, upland Britain, southwestern Mediterranean France, the eastern Adriatic/Ionian, and northern and western Türkiye. For each region, we attribute changes in the likelihood of short-term fire-weather extremes around peak wildfire activity, using 7-day maxima of vapour pressure deficit (VPD), surface wind speed, and a composite index of VPD and wind, in addition to spring and summer effective precipitation to characterise seasonal drought and fuel accumulation conditions. In addition to weather-related drivers, we assess trends in spring and summer vegetation cover using the leaf area index (LAI) and in land abandonment or reclamation using the changing fraction of managed and unmanaged land.

Climate change strongly increased vapour pressure deficit and the composite VPD/wind index for all southern European regions, with the likelihood of drought conditions at least as strong as 2025 also increasing by over a factor of three relative to in the preindustrial climate. Short-term fire weather or summer drought exhibited a weak positive and negative trend with warming respectively, though an increasing likelihood of spring drought conditions, a key driver of 2025’s wildfires, was identified. Spring vegetation significantly increased across Europe, implying higher fuel loads and a potential for more intense wildfires. Land management trends were mixed, with long-term land abandonment in southwestern France and northern and western Türkiye and a recent, rapid land abandonment signal in the eastern Adriatic/Ionian.

The record-breaking 2025 European fire season occurred in the context of a climate change driven intensification of the fire weather extremes and drought conditions associated with each of the five wildfire events examined. Combined with increasing growth-season vegetation cover and ongoing land abandonment, these factors suggest increases in European wildfire extremes will continue.

How to cite: Keeping, T., Zachariah, M., Barnes, C., Haas, O., Grillakis, E., Pinto, I., Clarke, B., Kimutai, J., Philip, S., Kew, S., and Otto, F.: How Climate and Land Cover Change Shaped Europe's Record Breaking 2025 Fire Season, EGU General Assembly 2026, Vienna, Austria, 3–8 May 2026, EGU26-19805, https://doi.org/10.5194/egusphere-egu26-19805, 2026.

EGU26-19953 | Orals | BG1.2

State of Wildfires 2024-2025 

Douglas Ian Kelley, Chantelle Burton, Francesca Di Giuseppe, and Matthew Jones and the State of Wildfires report 2024-2025 co authors

The 2024–2025 fire season saw extreme wildfires across the Americas, with events in the Amazon, Pantanal, and Los Angeles emerging from the tails of historical distributions and burning substantially larger areas than would have occurred without human-induced climate change. These amplified fire extents translated into severe impacts on carbon emissions, air quality, and communities. These are the key findings in the latest State of Wildfires report: an annual, community-led synthesis developed in response to the increasing prevalence of high-impact wildfire events worldwide.

Globally over this period, wildfires burned approximately 3.7 million km², exposed around 100 million people and over USD 200 billion of infrastructure, and generated more than eight billion tonnes of CO₂ emissions, which was around 10 % above the long-term average, driven largely by intense forest fires in South America and Canada. Impacts were particularly severe in the Amazon and Pantanal, where large-scale forest and wetland fires caused extreme smoke exposure and major economic losses, and in Los Angeles, where January 2025 fires resulted in mass evacuations and substantial damage.

In several regions, climate change substantially increased burned area, with fires approximately four times larger in Amazonia, 35 times larger in the Pantanal–Chiquitano, 25 times larger in Southern California, and nearly three times larger in the Congo Basin compared to a world without human-induced climate change. In these regions, we found anomalous weather created conditions for extreme fires, with prolonged drought dominating in tropical systems, and compound heat, wind, and fuel build-up shaping fires in California. Projections indicate that events of comparable scale will become markedly more frequent in tropical regions under continued warming, while strong mitigation can substantially limit, but not eliminate, the additional risk.

The State of Wildfires report (https://stateofwildfires.com/latest-report/) snapshot of globally extreme wildfire impacts and drivers, providing an evolving evidence base to support preparedness, mitigation, and adaptation as wildfire risk intensifies. Looking ahead, the 2025–2026 edition will expand coverage to emerging hotspots, and we welcome contributions that help capture the next generation of assessments of high-impact wildfire events.

How to cite: Kelley, D. I., Burton, C., Di Giuseppe, F., and Jones, M. and the State of Wildfires report 2024-2025 co authors: State of Wildfires 2024-2025, EGU General Assembly 2026, Vienna, Austria, 3–8 May 2026, EGU26-19953, https://doi.org/10.5194/egusphere-egu26-19953, 2026.

EGU26-21215 | ECS | Posters on site | BG1.2

Giant aerosol particles and pyrometeors emitted by western US wildfires: shape, occurrence, and transport 

Manuel Schöberl, Daria Tatsii, Maximilian Dollner, Andreas Gattringer, Agnieszka Kupc, Joshua P. Schwarz, Christopher D. Holmes, Hannah S. Halliday, Johnathan W. Hair, Marta A. Fenn, Paul T. Bui, Andreas Stohl, and Bernadett Weinzierl

Wildfires have become much more frequent in recent decades and are posing an increasing threat to human health and the surrounding environment. Beside generating aerosol particles predominantly in the accumulation mode, wildfires also emit giant aerosol particles (> 20 µm) and pyrometeors (> 2 mm), whose occurrence and transport in the atmosphere are not yet fully understood. This knowledge gap must be addressed in order to improve our understanding of the possible effects of these particles on the climate and to advance the early detection and tracking of wildfires using weather radar.

The NOAA/NASA joint aircraft field campaign FIREX-AQ of 2019 conducted systematic measurements of trace gases and aerosol particles in wildfire smoke plumes. During the project, we observed smoke particles up to a nominal diameter of 6.2 mm with state-of-the-art open-path instruments (Cloud, Aerosol, and Precipitation Spectrometer and Precipitation Imaging Probe; both manufactured by Droplet Measurement Technologies, Longmont, CO, USA) aboard the NASA DC-8 research aircraft at various distances from the wildfire. In total, 194 smoke plume encounters (“transects”) were investigated from nine different wildfires with some measured on multiple days. In this study we discuss the shape, occurrence, and transport of particles larger than 0.1 mm emitted by western US wildfires in the near- to mid-field from the source.

Giant aerosol particles and pyrometeors were found in the vast majority of the transects examined, with younger smoke containing more of the very massive particles than 4-hour old smoke. In only 4% of cases where the smoke age was less than 2 hours particles larger than 0.1 mm were absent. The largest particles, measuring up to over 4 mm, were observed during transects in which the Modified Combustion Efficiency (MCE) indicates flaming combustion conditions. All observed particles larger than 0.1 mm were analyzed based on their shape. The results show that the larger the particles are, the more elongated their shape is with median aspect ratios (ratio of major to minor axis length) of 5.2 for particles larger than 2.6 mm. Furthermore, a case study was considered in which we attempt to reconstruct the observed settling of pyrometeors with a size of about 3.5 mm with theoretical calculations.

How to cite: Schöberl, M., Tatsii, D., Dollner, M., Gattringer, A., Kupc, A., Schwarz, J. P., Holmes, C. D., Halliday, H. S., Hair, J. W., Fenn, M. A., Bui, P. T., Stohl, A., and Weinzierl, B.: Giant aerosol particles and pyrometeors emitted by western US wildfires: shape, occurrence, and transport, EGU General Assembly 2026, Vienna, Austria, 3–8 May 2026, EGU26-21215, https://doi.org/10.5194/egusphere-egu26-21215, 2026.

EGU26-21274 | ECS | Posters on site | BG1.2

Impact of future wildfire spread on forest carbon seqeustrartion: A case study of South Korea 

Sukyoung Kim and Chan Park

As the frequency and intensity of megafires continue to increase, projecting and managing future wildfire occurrence is becoming increasingly important. Wildfires damage forests as major carbon sinks, thereby posing substantial uncertainties to carbon uptake. Furthermore, climate change is expected to intensify wildfire spread, leading to greater overall damage. Therefore, future wildfire management requires assessments that incorporate wildfire spread patterns under changing climate conditions. However, most existing studies have focused primarily on estimating wildfire ignition locations, with limited consideration of wildfire spread under climate change. In this study, we trained wildfire spread patterns within wildfire events using a combination of remote sensing data and field survey observations. Based on these patterns, we estimated future wildfire occurrence and subsequent spread using a dynamic Bayesian network framework. We further analyzed changes in forest carbon uptake resulting from wildfire occurrence and spread. Our results indicate that simulations accounting for both wildfire occurrence and spread result in greater total burned area by 2050 compared to simulations considering wildfire occurrence alone. In particular, repeated wildfire occurrences and their spatial propagation expanded the cumulative damaged areas. When wildfire spread was included, forest carbon uptake declined more sharply, with some regions projected to shift from net carbon sinks to net carbon sources. These findings demonstrate that excluding wildfire spread leads to an underestimation of wildfire damage and associated carbon sequestration.

How to cite: Kim, S. and Park, C.: Impact of future wildfire spread on forest carbon seqeustrartion: A case study of South Korea, EGU General Assembly 2026, Vienna, Austria, 3–8 May 2026, EGU26-21274, https://doi.org/10.5194/egusphere-egu26-21274, 2026.

EGU26-93 | Posters on site | BG1.3

Global Soil Methane Uptake Estimated by Scaling up Local Measurements 

Jiawei Jiang and zhifeng Yan

Methane (CH4) is the second most important greenhouse gas after CO2, contributing as much as 0.5°C of warming since pre-industrial times. Soil methane uptake (SMU) is thought to be the only biological sink of atmospheric CH4, but global SMU estimates remain highly uncertain due to challenges in scaling local data. We develop a data-driven approach to refine this global estimate by incorporating local data of 79,800 flux measurements from 198 sites. This novel approach links the global SMU budget to local SMU fluxes by varying its parameters with soil properties. Our 2003-2018 global SMU estimate is ~39.0 Tg CH₄ yr-1 —about 30% higher than existing bottom-up estimates and consistent with top-down assessments. The projected future global SMU is shaped by temperature and atmospheric methane, though local SMU is primarily influenced by changes in soil moisture. This study emphasizes the potential of soils in climate regulation and highlights the need to focus on key biomes for better understanding the soil-atmosphere methane feedback and optimizing methane management strategies.

How to cite: Jiang, J. and Yan, Z.: Global Soil Methane Uptake Estimated by Scaling up Local Measurements, EGU General Assembly 2026, Vienna, Austria, 3–8 May 2026, EGU26-93, https://doi.org/10.5194/egusphere-egu26-93, 2026.

EGU26-178 | Orals | BG1.3

The North American Greenhouse Gas Budget: Emissions, Removals, and Integration for CO2, CH4, and N2O (2010–2019) 

Benjamin Poulter, Guillermo Murray-Tortorola, Daniel Hayes, Philippe Ciais, Ana Bastos, and Pep Canadell

Greenhouse gas emissions for North America show large disagreement between top down and bottom up methodologies. As part of the REgional Carbon Cycle Assessment and Processes study (RECCAP2) we evaluated these sources of disagreement using atmospheric inversions, process models, and national greenhouse gas inventories. We found that for the period 2010–2019, the national greenhouse gas inventories reported total net-GHG emissions of a source of 7,270 TgCO2-eq yr−1 compared to top down estimates of 6,132 ± 1,846 TgCO2-eq yr−1 and bottom up estimates of 9,060 ± 898 TgCO2-eq yr−1.  The differences between the estimates are from a combination of uncertainties in emissions and removals, but also due to definitions used to account for anthropogenic versus natural emissions or both, including the use of the managed land proxy, and the role of the land ocean aquatic continuum (LOAC). Reconciling net emissions between methodologies is partly achievable after accounting for these methodological and definition-based differences.

How to cite: Poulter, B., Murray-Tortorola, G., Hayes, D., Ciais, P., Bastos, A., and Canadell, P.: The North American Greenhouse Gas Budget: Emissions, Removals, and Integration for CO2, CH4, and N2O (2010–2019), EGU General Assembly 2026, Vienna, Austria, 3–8 May 2026, EGU26-178, https://doi.org/10.5194/egusphere-egu26-178, 2026.

EGU26-3861 | Orals | BG1.3

Global methane emissions and their variability over two decades: insights from atmospheric inversion modelling 

Luana Basso, Christian Rödenbeck, and Christoph Gerbig

Methane (CH4) is the second most important greenhouse gas, with its atmospheric levels having more than doubled since pre-industrial times, and exhibiting highly variable growth rates in recent decades. Significant uncertainties remain in the global methane budget, despite ongoing efforts to quantify methane sources and sinks using bottom-up and top-down approaches. In particular, the relative contributions of natural and anthropogenic sources to the accelerated increase in recent years remain unclear. Wetlands are major natural sources of methane and are expected to respond to climate variability and the long-term increase in global temperature. Accurately capturing their temporal variability and long-term trend is a significant challenge to global methane budget assessments. In addition, atmospheric methane loss, which is primarily caused by the oxidation of hydroxyl radicals (OH), is a significant source of uncertainty in atmospheric inverse modelling. Uncertainties in the magnitude and temporal variability of OH directly impact the estimation of methane emissions. Therefore, improving estimates of methane emissions at global to regional scales advances our understanding of methane and its climate feedback.

In this context, we have applied the Jena CarboScope Global Inversion System to estimate global methane surface fluxes from 2000 to 2024. This analysis uses a Bayesian atmospheric inversion framework to optimize surface emissions by combining atmospheric transport modelling with long-term atmospheric methane observations.  Inversions were carried out at a horizontal resolution of approximately 3.8° latitude and 5° longitude. The prior emissions included wetland fluxes (ORCHIDEE model), anthropogenic emissions (EDGAR database), biomass burning emissions (GFEDv4s), as well as other minor source categories (termites, freshwater, geological and the ocean). To evaluate the sensitivity of emission estimates to assumptions about atmospheric loss, we conducted inversions varying the OH fields, such as a climatological OH distribution and an interannually varying OH field.

We present the temporal evolution of global methane emissions over the last two decades, analyze their spatial distribution and regional emission patterns, and evaluate the consistency of the inversion results using independent observational datasets across different regions. Using two representations of atmospheric methane loss, we found that differences exist not only in whether interannual variability is included, but also in mean magnitude and spatial distribution. These differences lead to variations in inferred emission strengths. The largest variations in flux magnitude occur in  North America temperate, South America temperate, and Eurasia temperate regions. Overall, global posterior fluxes tend to be larger than prior fluxes, with model adjustments that are spatially heterogeneous. While there are differences in absolute flux estimates, posterior global methane emissions derived from various inversion setups show consistent interannual variability, with minor differences in variability during the latter part of the period. Overall, this work provides a multi-decadal, top-down perspective on global methane emissions, emphasizing the importance of accounting for uncertainties in atmospheric loss when interpreting methane budgets. 

How to cite: Basso, L., Rödenbeck, C., and Gerbig, C.: Global methane emissions and their variability over two decades: insights from atmospheric inversion modelling, EGU General Assembly 2026, Vienna, Austria, 3–8 May 2026, EGU26-3861, https://doi.org/10.5194/egusphere-egu26-3861, 2026.

High mountain sites offer strategic spots for long-term monitoring of greenhouse gases, thanks to their altitude and distance from local anthropogenic emissions that enable measurements of well-mixed troposphere. At the atmospheric monitoring station at Plateau Rosa carbon dioxide (CO2) and methane (CH4) mole fractions are measured continuously with a cavity ring-down spectrometer. The station is situated in in the north-western Italian Alps near Mt. Cervino at 3480 meters AMSL and is part of the ICOS (Integrated Carbon Observation System) framework and WMO/GAW program (World Meteorological Organisation/Global Atmospheric Watch, Identification Code: PRS).

In this study we show the CO2 and CH4 record measured at the station since 2018 in comparison with NOAA's global trends, demonstrating the PRS representativeness of global mole fractions, and we select pollution events at regional scale that led to significant CO2 and CH4 mole fraction enhancements at the station. Analysis of these events using the FLEXPART-COSMO modelling framework for tracing back air masses draws attention to specific hotspot areas in Europe. We identified five pollution events during the 2021-2024 period, lasting more than six hours, associated with air masses coming mainly from the Po Valley, in Italy, and European countries such as France, Germany, Belgium, the Netherlands and the UK.

We finally demonstrate how observations of CO₂ and CH₄ at Plateau Rosa provide a continuous and accurate record of the two major greenhouse gases, which can be used, together with atmospheric transport modelling, to address specific source regions in Europe for targeted reduction efforts.

How to cite: Zazzeri, G., Apadula, F., Henne, S., and Lanza, A.: The continuous record of carbon dioxide and methane at the atmospheric station at Plateau Rosa: analysis of global trends and identification of source regions in Europe , EGU General Assembly 2026, Vienna, Austria, 3–8 May 2026, EGU26-3981, https://doi.org/10.5194/egusphere-egu26-3981, 2026.

EGU26-4846 | ECS | Posters on site | BG1.3

National-scale simulations of N2O emissions from agricultural soils in Switzerland 

Shauna-kay Rainford, Stephan Henne, and Sonja Keel

Direct emissions from agricultural soils represented approximately 35% (3.28 kt or 1,269 CO2 equivalent kt) of Switzerland’s total nitrous oxide (N2O) emissions in 2022, according to the annual Swiss National Greenhous Gas (GHG) Inventory submitted to the United Nations Framework Convention on Climate Change (UNFCCC). While concerning, estimating N2O emissions over large geographical scales is challenging because of high spatial and temporal variability caused by factors such as climaate, soil properties, and land management. 

This study aims to first improve the Swiss National GHG Inventory by estimating N2O emissions from agricultural soils using the DayCent model in lieu of emission factors. Process-based models have the advantage that they consider the effects of both management and environmental factors on N2O emissions, while emission factors only account for management effects. Second, we compare the resulting, national-scale emissions against estimates based on atmospheric inverse modelling of N2O emissions. 

For the first part of our study we used newly available, high resolution land use maps to simulate N2O in different land use types (croplands, meadows, and pastures). Simulations were performed based on pedo-climatic conditions that were defined by land use type, regional weather conditions, soil texture, and soil depth. For the second part of the study N2O emissions from this bottom-up approach were compared for a three year period to top-down estimates that were derived from atmospheric observations and transport simulations using inversion techniques. 

For the years 2021-2023 the bottom-up analysis showed high spatial variability in N2O emissions that could be attributed to both differences in management (e.g. crop types or fertilization intensity) and soil properties. The results of the bottom-up and the top-down approaches were comparable in terms of seasonality. As expected monthly emissions from the top-down approach were generally greater than those of the bottom-up approach as they include other sources of N2O that are not accounted for in the DayCent model (e.g. emissions from manure management and indirect N2O emissions). Similarly, the average percent change in annual N2O emissions from the bottom-up apparoach was 29% lower than the Swiss National GHG Inventory. 

Our preliminary results show that atmospheric inversions are very useful to evaluate N2O emission variability at the national scale. The model-based bottom-up approach we set up will allow others to evaluate the effect of different cropping systems under different environmental conditions in future studies and can help stakeholders implement targeted regional measures to reduce emissions.


How to cite: Rainford, S., Henne, S., and Keel, S.: National-scale simulations of N2O emissions from agricultural soils in Switzerland, EGU General Assembly 2026, Vienna, Austria, 3–8 May 2026, EGU26-4846, https://doi.org/10.5194/egusphere-egu26-4846, 2026.

EGU26-5202 | ECS | Orals | BG1.3

Wildfires dominate inter-annual variability in atmospheric methane growth 

Xiaobo Wang and Yuzhong Zhang

Atmospheric methane, a key greenhouse gas, has continued to grow in recent years, jeopardizing the Paris Agreement's climate goals. Atmospheric methane growth rate (MGR) shows pronounced inter-annual variability (IAV), which provides a "natural laboratory" to unravel climatic controls on methane dynamics, thereby improving future projections critical to climate mitigation. While multiple processes are known to influence methane sources and sinks, the drivers remain actively debate and their interplay is unquantified systematically. Here, we integrate state-of-the-art emission inventories, observation constraints, and model simulations to resolve and evaluate systematacially these contributions. Challenging the prevailing wetland-centric consensus, we demonstrate that wildfires dominate the IAV in MGR through near-equivalent dual mechanisms: direct methane emissions and indirect atmospheric sink, followed with wetland emissions and lightning-induced sink effects. These drivers are orchestrated by the El Niño-Southern Oscillation (ENSO) through distinct phase-specific contrasts: during El Niño, disproportionately escalating wildfire impacts are partially offset by suppressed wetland emissions and enhanced lightning sink, whereas La Niña amplifies wetland emissions and inhibits lightning-induced sink. This framework largely explains observed MGR variability. Our study implies that under future warming, the nonlinear intensification of fire-climate feedbacks may accelerate atmospheric methane growth, posing a greater threat than previously anticipated.

How to cite: Wang, X. and Zhang, Y.: Wildfires dominate inter-annual variability in atmospheric methane growth, EGU General Assembly 2026, Vienna, Austria, 3–8 May 2026, EGU26-5202, https://doi.org/10.5194/egusphere-egu26-5202, 2026.

EGU26-7090 | ECS | Orals | BG1.3

Exploring the ocean and land carbon sinks from Jungfraujoch's carbon dioxide and oxygen observational record 

Stuart Grange, Peter Nyfeler, Vasileios Mandrakis, Filip Zürcher, and Eliza Harris

The global carbon budget is a critical system to understand with respect to global temperature change. An accurate carbon budget correctly allocates carbon among Earth's four key reservoirs: fossil fuel reserves, the atmosphere, the ocean, and terrestrial ecosystems. Such budgets allow for the monitoring of the health of the natural global carbon sinks. Both the ocean and land sinks have demonstrated high levels of resilience in the face of increasing anthropogenic carbon emissions and subsequent growth of carbon dioxide (CO2) in the atmosphere. However, there are signals that these two critical carbon sinks' abilities to sequester carbon are declining.

Observations of CO2 and oxygen (O2; in the form of δ(O2/N2)) from both in situ analysers and flask sampling activities from the Jungfraujoch high-alpine observatory (3572 m above sea level) in the Swiss Alps will be used to constrain the carbon budget using the O2-CO2 partitioning method to illuminate the behaviour of the ocean and land sinks between 2005 and 2025. High-precision measurements of CO2 and O2 are useful for partitioning because these two species are intrinsically linked through photosynthesis, respiration, and combustion processes. However, the dissolution of CO2 into the ocean does not involve O2, thus allowing for the separation of the ocean and land sinks. The O2-CO2 partitioning, along with other observational-based analyses such as the exploration of seasonal amplitudes and potentially isotopic measurements, will be used to shed light on the behaviour of the ocean and land sinks over the past decade purely from observational records, thus offering a validation and verification process for other, generally modelling-based estimates. The possible downstream climate impacts will be discussed.

How to cite: Grange, S., Nyfeler, P., Mandrakis, V., Zürcher, F., and Harris, E.: Exploring the ocean and land carbon sinks from Jungfraujoch's carbon dioxide and oxygen observational record, EGU General Assembly 2026, Vienna, Austria, 3–8 May 2026, EGU26-7090, https://doi.org/10.5194/egusphere-egu26-7090, 2026.

EGU26-7525 | ECS | Posters on site | BG1.3

Spatiotemporal patterns and drivers of wildfire CO2  emissions in China from 2001 to 2022 

Xuehong Gong and Yongming Han

Wildfires release large amounts of greenhouse gases into the atmosphere, exacerbating climate change and causing severe impacts on air quality and human health. In this study, based on a bottom-up approach and using satellite data, combined with emission factor and aboveground biomass data for different vegetation cover types (forest, shrub, grassland, and cropland), the dynamic changes in CO2 emissions from wildfires in China from 2001 to 2022 were analyzed. The results showed that between 2001 and 2022, the total CO2 emissions from wildfires in China were 937.7 Tg (522.6–1516.0 Tg, 1 Tg = 1012 g), with an annual average of 42.6 Tg (23.8–68.9 Tg). The CO2 emissions from cropland and forest fires were relatively high, accounting for 45 % and 46 % of the total, respectively. The yearly variation in CO2 emissions from forest and shrub fires showed a significant downward trend, while emissions from grassland fires remained relatively stable. In contrast, the CO2 emissions from cropland fires showed an upward trend, primarily in Northeast China. Hot spot analysis and geographically and temporally weighted regression (GTWR) models revealed significant spatial heterogeneity in emissions across vegetation types. Persistent hot spots of shrub and forest fires were located in Southwest and South China, while Northeast China experienced sporadic but extreme fire events. The GTWR model for shrub fire CO2 emissions exhibited the highest predictive performance (R2 = 0.87), and climatic factors (particularly temperature and humidity) were the main influencing factors. Notably, the recent rise in cropland fire CO2 emissions in Northeast China is closely linked to region-specific straw-burning policies. The research results provide valuable references for atmospheric transport models, regional fire management, and national carbon accounting frameworks in the context of climate change.

How to cite: Gong, X. and Han, Y.: Spatiotemporal patterns and drivers of wildfire CO2  emissions in China from 2001 to 2022, EGU General Assembly 2026, Vienna, Austria, 3–8 May 2026, EGU26-7525, https://doi.org/10.5194/egusphere-egu26-7525, 2026.

EGU26-7668 | ECS | Orals | BG1.3

Decadal Carbon Budget and Recent Trends in South America: Insights from RECCAP2 

Dr. Thais Rosan and the RECCAP2 South America team

Since the 1950s, the rapidly rising atmospheric greenhouse gas (GHG) concentrations have driven anthropogenic climate change, with terrestrial ecosystems acting as both sources and sinks of carbon. While global syntheses provide crucial benchmarks, regional assessments are essential to understand the fine-scale interactions between land-use, climate variability, and carbon fluxes. Motivated by this need, the Regional Carbon Cycle Assessment and Processes- Phase 2 (RECCAP2) initiative aims to deliver updated GHG budgets across (sub-) continental scales. Here, we focus on South America, a continent of critical importance to the global carbon cycle due to its extensive tropical forests, particularly the Amazon Forest. This is also important to the methane cycle due to the large wetland areas in the region.

Quantifying the regional carbon budget is challenging because it emerges from the net balance of large opposing fluxes: high productivity and long carbon residence times in old-growth forests act as a sink, while deforestation, degradation, and human-induced fires contribute to a source. Climate variability, including the El Niño-Southern Oscillation and Atlantic-Pacific sea surface temperature anomalies, modulates interannual and decadal fluxes, influencing droughts, fire risk, and forest stability. The interactions of land-use change, climate extremes, and fire introduce substantial uncertainty in current budget estimates.

Using a combination of dynamic global vegetation models, atmospheric inversions, and regional observational datasets, we quantify the terrestrial carbon balance of South America at continental, national, and Amazon basin scales, for the period 2010-2019, and assess recent trends (i.e., 2020–2024) in key components, including land-use and land-cover change (LULUCF) and fire emissions. Preliminary results reveal spatially heterogeneous contributions to the continental carbon sink and highlight regions where disturbances and climate extremes are driving shifts in the net flux towards a carbon source. To provide a more comprehensive overview of the dynamics in this region, we also examine methane fluxes during this period and investigate potential recent trends. Our findings will provide a benchmark for regional greenhouse gas budgets, improve attribution to processes, and inform climate mitigation strategies in South America.


How to cite: Rosan, Dr. T. and the RECCAP2 South America team: Decadal Carbon Budget and Recent Trends in South America: Insights from RECCAP2, EGU General Assembly 2026, Vienna, Austria, 3–8 May 2026, EGU26-7668, https://doi.org/10.5194/egusphere-egu26-7668, 2026.

EGU26-9187 | Posters on site | BG1.3

Discovering regions of robust CO2 fluxes based on an atmospheric inversion ensemble 

Martin Jung, Fabian Gans, and Brendan Byrne

Global atmospheric CO2 inversion results have been providing key estimates of net carbon flux variations between atmosphere, land, and ocean. These results seem robust at large spatial scales but are uncertain locally due to spatially compensating errors arising from atmospheric transport uncertainty, observation density and other factors. Inversions using satellite-based CO2 benefit from much larger observation density relative to in situ CO2 data and promise improved capabilities in localizing carbon fluxes. However, it remains unclear which regions and at which spatial granularity atmospheric inversion results are robust and useful for policy relevant budgeting, process interpretation, or as data constraint for global ecosystem model evaluation or calibration.

To address this question we developed a pattern recognition methodology to delineate regions with optimal robustness based on the ensemble of atmospheric inversions of the OCO2-MIP project. The employed optimization procedure balances systematic differences of carbon flux patterns between regions and uncertainties within regions. The algorithm delivers a hierarchical tree-like structure of nested regions that are beneficial for interpretation and analysis. Due to the factorial design of OCO-2-MIP we can address the following key questions: 1) How do these regions compare to the traditionally used TRANSCOM regions? 2) For which regions does the inclusion of satellite based CO2 data lead to large changes in net carbon flux estimates and its ensemble spread? 3) For which regions do we find the largest differences between prior and posterior flux estimates?

How to cite: Jung, M., Gans, F., and Byrne, B.: Discovering regions of robust CO2 fluxes based on an atmospheric inversion ensemble, EGU General Assembly 2026, Vienna, Austria, 3–8 May 2026, EGU26-9187, https://doi.org/10.5194/egusphere-egu26-9187, 2026.

Carbon Accounting in Forest Ecosystems Under Alternative Management Regimes: Distributional Implications for Baselines and Emission Factors

Juliet Isnino Eisimsidele, Cathal O’Donoghue, Patrick McGetrick

University of Galway


Abstract

Robust carbon accounting in forest ecosystems depends critically on baseline selection, emission factors, and temporal boundaries, yet these elements are highly sensitive to forest management decisions across the forest life cycle. Building directly on existing work on life-cycle economic and social returns to afforestation, this study examines how alternative management regimes, specifically thinned versus unthinned systems, shape carbon accounting outcomes from pre-planting baselines through harvest and post-harvest use, with particular attention to the timing and distribution of carbon benefits.

An integrated life-cycle carbon accounting framework is applied, combining forest growth modelling with carbon stock and flow analysis across full rotation cycles. The approach incorporates management-specific baselines, rotation length, thinning interventions, and the allocation of harvested timber to long-lived construction products, reflecting assumptions consistent with national greenhouse gas inventory practice. The analysis captures both in-forest carbon stocks and post-harvest carbon storage over time by linking forest growth dynamics with harvested wood product pathways. Sensitivity analyses are used to assess uncertainty related to baseline definition, temporal scaling, and key accounting parameters.

Preliminary results indicate systematic differences in both the magnitude and timing of carbon sequestration across management regimes. Unthinned systems concentrate carbon stocks earlier in the rotation. In contrast, thinned systems redistribute a greater share of carbon benefits to later stages through harvested wood products and extended storage beyond the forest stand. These variations affect the representation of mitigation performance within standard reporting periods used in national greenhouse gas inventories and influence implied emission factors.

This research provides empirical evidence relevant to ongoing debates on baseline definition, emission factor design, and Measurement, Reporting and Verification (MRV) by explicitly linking forest management decisions, life-cycle dynamics, and distributional carbon outcomes. The findings support the development of decision support tools and accounting frameworks that better reflect the long-term dynamics of afforestation systems, thereby improving the policy relevance of forest-based climate mitigation strategies within EU and international contexts.


How to cite: Eisimsidele, J.: Carbon Accounting in Forest Ecosystems Under Alternative Management Regimes: Distributional Implications for Baselines and Emission Factors, EGU General Assembly 2026, Vienna, Austria, 3–8 May 2026, EGU26-9259, https://doi.org/10.5194/egusphere-egu26-9259, 2026.

EGU26-10468 | ECS | Posters on site | BG1.3

Intercomparison of observation-based anthropogenic carbon estimates across the Atlantic Ocean using hydrographic cruise data 

Marta López-Mozos, Blanca Marigómez-Roldán, Antón Velo, Reiner Steinfeldt, and Fiz F. Pérez

Since the industrial revolution, the ocean has absorbed nearly one third of anthropogenic carbon dioxide (Cant), playing a key role in climate regulation while marine systems simultaneously undergo substantial stress. The storage of Cant in the ocean is spatially heterogeneous, making its quantification both challenging and essential. Because Cant cannot be measured directly, its estimation relies on indirect approaches that can be broadly classified into model-based and observation-based methods. Observation-based approaches are particularly valuable, as they commonly serve as benchmarks for evaluating model performance. These methods include those based on transient tracer data such as CFCs (e.g., Transit Time Distributions, TTD) as well as approaches relying on marine carbonate system observations, including back-calculation techniques or repeated measurements used to infer decadal carbon changes. In this study, we estimate Cant concentrations using carbon and CFC data from the GO-SHIP A25-OVIDE and A05-RAPID sections in the North Atlantic and the GO-SHIP A17-FICARAM section in the South Atlantic. Cant is derived using several observation-based methodologies, including the φ-method, Cant-TMI, TrOCA, TRACE, and a TTD-based approach. This intercomparison provides an up-to-date assessment of widely used observation-based techniques and offers a detailed analysis of their underlying assumptions, methodological differences, areas of convergence, and inherent limitations.

How to cite: López-Mozos, M., Marigómez-Roldán, B., Velo, A., Steinfeldt, R., and F. Pérez, F.: Intercomparison of observation-based anthropogenic carbon estimates across the Atlantic Ocean using hydrographic cruise data, EGU General Assembly 2026, Vienna, Austria, 3–8 May 2026, EGU26-10468, https://doi.org/10.5194/egusphere-egu26-10468, 2026.

EGU26-10681 | ECS | Orals | BG1.3

Underestimation of the anthropogenic carbon inventory of the Western South Atlantic Ocean linked to Antarctic Bottom Water characterization 

Blanca Marigómez-Roldán, Marcos Fontela, Xosé A. Padín, Antón Velo, and Fiz F.Pérez

The western South Atlantic Ocean is an important sink of anthropogenic carbon dioxide (Cant), whose deepest layers are influenced by Antarctic Bottom Water (AABW) formed at high latitudes, while also receives Cant transported by the Atlantic Meridional Overturning Circulation (AMOC) towards the Southern Ocean. The mismatch between observation and model-based estimations is a long-standing issue in the current global carbon budget but regional assessments of interior ocean Cant inventories are still limited. Recent analyses have shown that Global Ocean Biogeochemical Models (GOBMs) predictions underestimate the rates of increase of Cant in the western South Atlantic, especially in the Brazilian Basin. We contrast full-depth Cant inventories based on observations (Global Ocean Data Analysis Project, GLODAPv2.2023) against state-of-the-art GOBMs (RECCAP2) and Ocean Circulation Inverse model (OCIM) outputs. Here, we show that most the observation-based approaches, either methods that use transient tracers’ data (TRACE) or marine-carbonate-system data (Φ-method, eMLR(C*)), yield higher Cant inventories—by up to 50%—than the mean outputs from GOBMs and OCIM. The annual trend in the storage of Cant per unit area is higher in observation-based approaches (1.08 ± 0.12 mol m-2 year-1 for Φ-method, 1.18 ± 0.06 mol m-2 year-1 for eMLR(C*) and 0.66 ± 0.03 mol m-2 year-1 for TRACE) than the mean outputs from GOBMS and OCIM (0.55 ± 0.01 mol m-2 year-1). We identify the inaccurate characterization of AABW Cant concentration and extent as the main reason of disagreement. Furthermore, a limited advection of Cant from the North Atlantic to the South Atlantic by the AMOC also affects intermediate layers. This study confirms that GOBMs systematically underestimate Cant inventory in the western South Atlantic and reaffirm that high-quality deep ocean carbon observations are a requirement to avoid overlook the contribution of AABW to the global budget.

How to cite: Marigómez-Roldán, B., Fontela, M., A. Padín, X., Velo, A., and F.Pérez, F.: Underestimation of the anthropogenic carbon inventory of the Western South Atlantic Ocean linked to Antarctic Bottom Water characterization, EGU General Assembly 2026, Vienna, Austria, 3–8 May 2026, EGU26-10681, https://doi.org/10.5194/egusphere-egu26-10681, 2026.

EGU26-10696 | ECS | Orals | BG1.3

Unveiling Cascading Lag Effects of Wetland Methane Emissions: Evidence from Lake Chad in Africa 

Ruoqi Liu, Geli Zhang, Mengyao Liu, Ronald van der A, Michiel van Weele, Oliver Schneising, Jilin Yang, Shushi Peng, Vincent Huijnen, Michael Buchwitz, Xiaoxing Zuo, and Jinwei Dong

Wetland methane (CH4) emission seasonality is a major yet uncertain component of the global CH4 seasonal cycle, limited by challenges in accurately characterizing wetland dynamics and CH4 emissions. Advances in satellite observations, methodology and computing capabilities enable the production of tropical basin-scale wetland-CH4 seasonality at a finer scale. Here, we quantify monthly CH₄ emissions in the Lake Chad Basin, Africa—a region with pronounced hydroclimatic variability—using an advanced divergence method and TROPOspheric Monitoring Instrument (TROPOMI) satellite observations. We distinguish open water and inundated vegetation and quantify their monthly area dynamics using high-resolution Sentinel-2 data (10 m). Our results reveal a strong seasonal amplitude (4.75 Tg a⁻¹) and significant seasonal hysteresis between CH4 emissions and wetland inundation (i.e., greater CH4 emissions during the reduction period of inundation, +1.68 Tg a⁻¹). The cascading link of precipitation–wetland inundation–vegetation succession–CH4 emissions is proven to drive emission seasonality, comprising a three-month lag for wetland inundation and a subsequent four-month lag for CH4 emissions. These findings provide new constraints for tropical CH4 flux estimates, which are the dominant sources of uncertainty between the bottom-up models (± 44—65%), and differences from satellite observations. It is also crucial to improve our understanding of the driver(s) of tropical wetland CH4 emissions to better assess the impact of future climate changes on these wetland emissions and potential positive feedback.

How to cite: Liu, R., Zhang, G., Liu, M., van der A, R., van Weele, M., Schneising, O., Yang, J., Peng, S., Huijnen, V., Buchwitz, M., Zuo, X., and Dong, J.: Unveiling Cascading Lag Effects of Wetland Methane Emissions: Evidence from Lake Chad in Africa, EGU General Assembly 2026, Vienna, Austria, 3–8 May 2026, EGU26-10696, https://doi.org/10.5194/egusphere-egu26-10696, 2026.

EGU26-10785 | ECS | Posters on site | BG1.3

Does Rice Cultivation Decouple from Methane Emissions? 

Idhayachandhiran Ilampooranan, Mukund Narayanan, and Ankit Sharma

Monitoring global food security and climate change necessitates a precise understanding of rice production dynamics, given that rice cultivation constitutes a major source of methane emissions worldwide. However, understanding the complex trade-off between rice productivity and methane emissions has been impeded by the high spatial variability of agronomic practices and a scarcity of consistent field data to discern regional trends. Therefore, researchers and policymakers have assessed these trade-offs by focusing on broader variables like area and water regimes, which fail to account for the agronomic variability. To address these gaps, this study employed a physics-aware self-supervised digital twin to map rice areas and yields (a product of agronomic practices) at 500 m resolution across India from 2004 to 2021. As a key global rice producer and methane emitter, Indian rice cultivation has significantly increased in its area (17%) and yield (52%), with specific regions showing a clear pattern of intensification (22.7%), discontinuation (24.4%), and expansion (37.5%). By integrating these detailed rice yield maps with top-down methane emissions, the analysis uncovered nine distinct yield emission decoupling scenarios where rice cultivation did not necessarily increase methane emissions. In the most favourable scenario, approximately 27% of cultivated areas achieved higher yields with concurrently reduced emissions, providing evidence of sustainable decoupling. However, a concerning scenario in 6% of the cultivated areas involved regions with reduced yields and increasing emissions, suggesting inefficient cultivation practices and poor resource management.  Such decoupling scenarios in cultivation offer insights to enhance global food security strategies effectively, while also indicating a need to rethink existing emission estimation methods.

How to cite: Ilampooranan, I., Narayanan, M., and Sharma, A.: Does Rice Cultivation Decouple from Methane Emissions?, EGU General Assembly 2026, Vienna, Austria, 3–8 May 2026, EGU26-10785, https://doi.org/10.5194/egusphere-egu26-10785, 2026.

EGU26-11689 | ECS | Posters on site | BG1.3

JULES Modelling of Tropical Wetland Methane 

Jeremy Emmett, Robert Parker, and Nicola Gedney

Tropical peatlands constitute the largest and most uncertain natural source of methane. Methane is a highly potent greenhouse gas, with a 100-year global warming potential approximately 30 times that of carbon dioxide, and accounting for around one quarter of total anthropogenic radiative forcing.

Natural wetlands contribute roughly one-third of global methane emissions, while tropical wetlands dominate this flux due to their high productivity, warm temperatures, and persistently waterlogged conditions. However, significant uncertainties remain in estimating current methane budgets and in understanding how environmental drivers, such as temperature, hydrology, and soil carbon availability, interact to regulate tropical wetland methane emissions.

Robust digital twins of tropical methane regions are being developed with The Joint UK Land Environment Simulator (JULES) to address these gaps. A first step towards achieving this understanding is the evaluation of JULES wetland methane emissions across different model configurations, exploring dependencies related to forcing data, temperature sensitivity and wetland extent. The model will be tightly coupled with Earth observation data to develop a near–real-time framework that enhances process-level understanding of methane dynamics while reducing uncertainty in emission estimates. The resulting improved model representations will inform projections of future methane emission rates under a range of ISIMIP climate scenarios.

These analyses will together deliver policy-relevant insights into the magnitude, variability, sensitivities, and temporal evolution of methane emissions across near- and long-term horizons, supporting climate assessments and informing mitigation and adaptation strategies.

How to cite: Emmett, J., Parker, R., and Gedney, N.: JULES Modelling of Tropical Wetland Methane, EGU General Assembly 2026, Vienna, Austria, 3–8 May 2026, EGU26-11689, https://doi.org/10.5194/egusphere-egu26-11689, 2026.

EGU26-11713 | ECS | Orals | BG1.3 | Highlight

Impact of coppice conversion to high forest as a carbon farming practice: a case study from broadleaved forests in central Italy 

Gabriele Antoniella, Gregorio Fantoni, Sara Marinari, Antonio Brunori, Eleonora Mariano, Rosita Marabottini, and Tommaso Chiti

The conversion of abandoned coppice forests into high forests is promoted in Europe as a sustainable forest management strategy and as a potential carbon farming intervention under the EU Carbon Removal Certification Framework (CRCF, European Union, 2024), replacing low-input, low-output systems with practices aligned to long-term carbon sequestration goals. While the expected increase in aboveground biomass (AGB) carbon stock is supported by prior research, the effect of this transition on soil organic carbon (SOC) remains insufficiently quantified (Chiti et al., 2026). This study evaluates carbon stock variations across five ecosystem pools, AGB, belowground biomass (BGB), litter, deadwood, and SOC, in two broadleaved forest types, beech and mixed broadleaves, in central Italy. For each forest type, three abandoned coppice stands and three coppices converted to high forest were selected. Conversion occurred 5 years prior in mixed broadleaved forests and 18 years prior in beech stands. Biomass was measured using forest inventory protocols and species-specific allometric equations, while SOC was quantified across the 0–30 cm mineral soil layer by dry combustion (CHN) following carbonate removal.

In beech forests, AGB carbon stock increased from 59.00 Mg C ha⁻¹ (control) to 77.88 Mg C ha⁻¹ in the converted sites, with statistically significant differences (p = 0.001). In mixed broadleaved stands, no statistically significant differences were observed five years after conversion (46.47 vs. 49.70 Mg C ha⁻¹, p = 0.8147).

SOC stocks across the 0–30 cm profile decreased in both forest types following conversion. In mixed broadleaves, total SOC declined from 59.44 Mg C ha⁻¹ to 43.08 Mg C ha⁻¹, in beech, from 89.83 to 78.47 Mg C ha⁻¹. While no significant differences were observed at individual depth layers (0–5, 5–15, and 15–30 cm), total SOC over the 0–30 cm profile was significantly reduced following coppice conversion.

Litter carbon stocks increased significantly in mixed broadleaved forests (from 1.54×10³ to 2.92×10³ kg C ha⁻¹, p = 0.0022), while a non-significant decrease was observed in beech stands. Deadwood carbon stocks remained stable in mixed broadleaves and showed slight reductions in beech.

The results demonstrate that conversion to high forest enhances carbon storage in aboveground biomass, particularly in older stands, while SOC exhibits early-phase declines that may persist in the short to medium term. This highlights the importance of pool-specific and time-sensitive assessment frameworks when evaluating the climate mitigation potential of forest management practices. The inclusion of coppice-to-high forest transitions in CRCF-aligned carbon farming schemes is supported, provided that monitoring protocols capture dynamics across all major carbon pools.

- Chiti, T., Rey, A., Abildtrup, J., et al. (2026). A review of forest management practices potentially suitable for carbon farming in European forests. Journal of Environmental Management, 398, 128391. https://doi.org/10.1016/j.jenvman.2025.128391

- European Union. Regulation (EU) 2024/3012 of the European Parliament and of the Council of 27 November 2024 establishing a Union certification framework for permanent carbon removals, carbon farming and carbon storage in products (Regulation 2024/3012) https://eur-lex.europa.eu/legal-content/EN/TXT/?uri=OJ:L_202403012

How to cite: Antoniella, G., Fantoni, G., Marinari, S., Brunori, A., Mariano, E., Marabottini, R., and Chiti, T.: Impact of coppice conversion to high forest as a carbon farming practice: a case study from broadleaved forests in central Italy, EGU General Assembly 2026, Vienna, Austria, 3–8 May 2026, EGU26-11713, https://doi.org/10.5194/egusphere-egu26-11713, 2026.

EGU26-11807 | Posters on site | BG1.3

Leveraging Earth Observation for Maritime Emission Monitoring: Insights from the EO4SEM Project 

Filipe Brandão, Joao Vitorino, Dhritiraj Sengupta, Rossana Gini, Gregoire Broquet, Frédéric Chevalier, Mouhamadou Diouf, Hugo Vignesoult, Audrey Fortems-Cheiney, Jukka-Pekka Jalkanen, Androniki Maragkidou, Carles Debart, Nathan Magnall, Pierre-Yves Foucher, and Antony Delavois

Maritime transport underpins nearly 90% of global trade and constitutes a persistent and growing source of anthropogenic greenhouse gas (GHG) emissions, contributing approximately 3–4% of global CO₂ emissions and around 14% of transport-related emissions within the European Union. As global warming alters atmospheric composition and feedback processes in marine and coastal systems, improved monitoring of maritime emissions is increasingly important for constraining warming-induced greenhouse gas emissions (WIE).

Funded by the European Space Agency, the EO4SEM project assesses the capability of Earth Observation (EO) technologies to provide independent, spatially explicit information on maritime GHG emissions and to complement bottom-up, activity-based inventories. EO4SEM develops a multi-scale Representative Dataset that integrates satellite observations from TROPOMI, PRISMA, EnMAP, and GHGSat with high-resolution emissions simulated using the Ship Traffic Emission Assessment Model (STEAM v4). Modelled emissions are derived from Automatic Identification System (AIS) data and ship technical characteristics, providing hourly, gridded and ship-level estimates of CO₂, NOₓ, and CH₄ emissions across European maritime regions. Satellite data are analysed using a combination of regional to local atmospheric inversion techniques and plume-based methods adapted for moving point sources, enabling emission estimates at regional, shipping-lane, and individual vessel scales. Regional inversions assimilate TROPOMI NO₂ and CH₄ products into atmospheric transport models to derive monthly emission budgets over major European sea regions; estimates for shipping lanes rely on the analysis of the divergence of mass fluxes in satellite images, while ship-level approaches exploit plume divergence and cross-sectional flux methods to quantify instantaneous emissions from isolated vessels. Hyperspectral data from PRISMA and EnMAP are further explored to evaluate methane detection capabilities in port and coastal environments, and GHGSat glint-mode observations are used to investigate methane emissions associated with liquefied natural gas (LNG) ship-to-shore transfers. Together, these approaches demonstrate the potential of EO to identify emission hotspots, characterise spatial emission patterns, and support independent verification relevant to regulatory frameworks such as the EU Emissions Trading System and Monitoring, Reporting, and Verification requirements. However, EO4SEM also highlights substantial scientific and technical challenges. These include low signal-to-noise ratios and strong background interference in coastal and industrial regions, difficulties in separating ship plumes from land-based sources, and the limited spatial and temporal coverage of hyperspectral sensors. Validation remains a challenge due to scarce in-situ measurements over marine environments and uncertainties associated with incomplete or missing AIS data.

The EO4SEM project aims to showcase the transformative potential of EO-based monitoring systems in supporting regulatory compliance, informing policy decisions, and advancing scientific understanding of maritime emissions. Its findings will contribute to paving the way for future Copernicus Sentinel Expansion missions, such as CO2M and CHIME. To support transparency, reproducibility, and policy uptake, all EO4SEM-derived datasets including satellite products, inversion outputs, and model-based emission inventories are being made available through the ESA APEx and geospatial explorer platforms.

How to cite: Brandão, F., Vitorino, J., Sengupta, D., Gini, R., Broquet, G., Chevalier, F., Diouf, M., Vignesoult, H., Fortems-Cheiney, A., Jalkanen, J.-P., Maragkidou, A., Debart, C., Magnall, N., Foucher, P.-Y., and Delavois, A.: Leveraging Earth Observation for Maritime Emission Monitoring: Insights from the EO4SEM Project, EGU General Assembly 2026, Vienna, Austria, 3–8 May 2026, EGU26-11807, https://doi.org/10.5194/egusphere-egu26-11807, 2026.

EGU26-11944 | ECS | Posters on site | BG1.3

Improving the representation of the fate of harvested wood in global and regional carbon budgets 

Tobias Nützel, Julia E. M. S. Nabel, Katharina Meike Holube, Holger Metzler, and Julia Pongratz

The rapidly shrinking carbon budget to stay within the Paris Agreement targets raises the importance of reducing CO2 emissions from land use (ELUC), while enhancing land-based carbon sinks. In this context, realistic estimates of ELUC and land-based carbon dioxide removal require an accurate representation of the fate of harvested wood, including how much carbon remains on site as slash versus being removed for harvested wood products, and how long this carbon is stored.

For regional and global carbon budgets, like the Global Carbon Project’s annual Global Carbon Budget, ELUC estimates are typically derived from bookkeeping models, which track carbon pools and their responses to land use change and land management. These models, however, currently represent the fate of harvested wood in highly simplified ways: They heavily rely on expert judgement and outdated data to determine slash and wood product pool fractions, typically only using a few generic wood product pools with lifetimes following an exponential decay, which poorly captures the dynamics of long-lived wood products. Here, we implement an improved representation of the fate of harvested wood in the bookkeeping model, BLUE, one of the three bookkeeping models used in the Global Carbon Budget. It is informed by the best available literature, FAO and IPCC data, and the LUH2 land use forcing. Our approach includes spatially explicit, partially time-varying fractions of harvested carbon allocated to slash and six wood product pools with different lifetimes, which capture specific product groups, and a computationally efficient two-step scheme that approximates more realistic gamma-function-like decay.   

Compared to the default implementation of harvested wood products, net ELUC in our improved scheme differs substantially in regions where harvested carbon is stored for much longer periods, predominantly in the Global North: Over the last 20 years, net ELUC is more than 30% smaller in Canada and ~10% smaller in Europe, China and Oceania. In contrast, net ELUC is more than 40% larger in Russia, highlighting that longer storage of harvested carbon can also result in temporary emission increases, since carbon from past harvest or clearing events remains in the system for longer. In tropical regions, where soil turnover times are short and most wood products are short-lived, differences in net ELUC are small. As tropical regions contribute most to global net ELUC, this translates into a reduction of only ~3% at the global scale over the last 20 years and even less over longer time scales. 

Our results suggest that the simplified representation of the fate of harvested wood in current bookkeeping models is adequate for global ELUC estimates. However, as regional and even national carbon budgets gain importance, our improved approach provides a more realistic basis for estimating ELUC. Our approach is also transferable to land surface and Earth system models, which currently exhibit similar limitations in their treatment of harvested wood. 

How to cite: Nützel, T., Nabel, J. E. M. S., Holube, K. M., Metzler, H., and Pongratz, J.: Improving the representation of the fate of harvested wood in global and regional carbon budgets, EGU General Assembly 2026, Vienna, Austria, 3–8 May 2026, EGU26-11944, https://doi.org/10.5194/egusphere-egu26-11944, 2026.

EGU26-12295 | Posters on site | BG1.3

Methane emissions in the southern North Sea: From single cruise tracks to an aerial German Bight extrapolation 

Ingeborg Bussmann, Subhas Dahal, Kirstin Dähnke, Louise Rewrie, Tina Sanders, Yoana Voynova, and Hannes Imhof

In the context of the project "Integrated greenhouse gas monitoring system for Germany", a central objective is to facilitate the availability of marine cruise-based greenhouse gas data for the land-based or atmospheric end-user community.

During annual ship cruises in the southern German Bight since 2019, the concentrations of dissolved methane were continuously determined. Based on wind speed and atmospheric methane concentration, the diffusive methane flux was calculated. Since the configuration of cruise tracks is generally limited to single lines between different ports, spatial extrapolation to wider areas is needed for regional flux estimates.

Therefore, we utilised water body categories provided by the Federal Environment Agency, which included euhaline, polyhaline tidal flats, and coastal waters, to extrapolate methane emissions to the entire region. Six regional categories were defined based on salinity, tidal flat exposure, tidal range, current velocity and other factors. For the years 2019-2023 the six categories had significantly different methane fluxes. The combined fluxes ranged from 3.2 g CH4 / m2 in 2019 to 20.3 g/m2 in 2023. By combining the methane recorded during cruise track with the shape files of the different water body categories, we can provide methane emissions estimates and variability from the whole southern North Sea which are suited for use by local authorities and stakeholders.

How to cite: Bussmann, I., Dahal, S., Dähnke, K., Rewrie, L., Sanders, T., Voynova, Y., and Imhof, H.: Methane emissions in the southern North Sea: From single cruise tracks to an aerial German Bight extrapolation, EGU General Assembly 2026, Vienna, Austria, 3–8 May 2026, EGU26-12295, https://doi.org/10.5194/egusphere-egu26-12295, 2026.

EGU26-12601 | Posters on site | BG1.3

Towards improving regional and national budgets from regional inversion system CSR by using ABLH measurements 

Michal Galkowski, Navid Mouji, Jochen Förstner, Linda Schlemmer, Yang Xu, and Christoph Gerbig

Greenhouse gases (GHGs) play a key role in the Earth's climate due to their connection with the planet's energy balance. A scientific understanding of contemporary GHG fluxes and their drivers is essential for any climate change mitigation policies being implemented or considered. Furthermore, regular, scientifically accurate information on recent GHG emissions supports the implementation of existing policies by allowing to identify - and act on – potential deviations.

Atmospheric inversion systems, such as CarboScope Regional and ITMS-Demonstrator, are used to support climate policies (e.g. Paris Agreement) within the German ITMS (Integrated Greenhouse Gas Monitoring System). They provide independent estimates of anthropogenic and natural greenhouse gas emissions (currently targeting CO2 and CH4) on regional scales, with a particular focus on national anthropogenic fluxes. One of the main sources of uncertainty in fluxes retrieved by inversion systems is the misrepresentation of the height of atmospheric boundary layer’s height (ABLH). At the regional scale, inaccuracies in the ABLH can lead to biases in the estimated GHG fluxes that are challenging to identify and quantify, as they can vary in both space and time.

In this study, we evaluate the performance of the STILT (the transport model in the CSR system) and ICON (playing the same role for the ITMS-Demonstrator) in representing the ABLH across Europe. We compare the model performance with high-resolution radiosonde data collected over Europe between 2021 and 2023. We present the spatial and seasonal patterns of bias, and furthermore, we evaluate the models' performance against ceilometer data collected in Germany by the German Weather Service (DWD) ceilometer network. Finally, we show preliminary results on the application of Kriging with External Drift (KED) applied to the European and German domains, exploring the potential of using spatially resolved, data-driven fields as input for ABLH corrections in the inverse model.

How to cite: Galkowski, M., Mouji, N., Förstner, J., Schlemmer, L., Xu, Y., and Gerbig, C.: Towards improving regional and national budgets from regional inversion system CSR by using ABLH measurements, EGU General Assembly 2026, Vienna, Austria, 3–8 May 2026, EGU26-12601, https://doi.org/10.5194/egusphere-egu26-12601, 2026.

EGU26-13263 | ECS | Posters on site | BG1.3

Towards a Greener Christmas: Reducing the Carbon Footprint of Christmas Trees 

Liya Zhao and Qi Yang

In 2019, more than 26 million natural Christmas trees were purchased in the United States, with nearly twice that number sold across Europe. Each year, the majority of these trees are either landfilled or incinerated, leading to substantial methane and carbon dioxide emissions. This study explores alternatives to natural Christmas trees and evaluates climate-smart end-of-life strategies to reduce the overall carbon footprint associated with Christmas tree consumption. We first employ Google Trends data to approximate global production, consumer demand, and predominant disposal practices for both natural and artificial Christmas trees. Using these data, we construct a global map of Christmas tree-related eCO₂ emissions under different disposal scenarios, including landfilling, burning, and mulching. We introduce a “Christmas Tree Carbon Exchange Index” to quantify the disparity between carbon emissions generated during production and those occurring in consumer regions. For instance, exporting countries such as China exhibit negative index values due to their role as producers of artificial trees for international markets.
Our analysis reveals pronounced regional imbalances in carbon exchange, with major importing regions such as the European Union and the United States bearing a disproportionate net carbon burden. Life-cycle assessment results indicate that the environmental performance of a Christmas tree type is highly dependent on end-of-life management. Natural trees disposed of in landfills emit methane that, over a 10-year horizon, can exceed the cumulative emissions of an artificial tree. In contrast, mulching or chipping natural trees provides a net carbon benefit by returning biomass to the soil. We estimate that the carbon “break-even” point for an artificial tree is approximately 12 years of reuse when compared with a landfilled natural tree, but this threshold increases substantially when natural trees are mulched. Overall, achieving a genuinely greener Christmas requires shifts in both policy and consumer behavior, emphasizing the diversion of natural trees from landfills, support for local production, and long-term reuse of artificial trees.

How to cite: Zhao, L. and Yang, Q.: Towards a Greener Christmas: Reducing the Carbon Footprint of Christmas Trees, EGU General Assembly 2026, Vienna, Austria, 3–8 May 2026, EGU26-13263, https://doi.org/10.5194/egusphere-egu26-13263, 2026.

EGU26-13433 | Posters on site | BG1.3

Reconciling differences in observed annual methane growth rates 

Yuzhong Zhang

Satellite and surface observations of the annual growth rate of atmospheric methane (MGR) often show notable differences, which are typically interpreted as inter-platform discrepancies. The surface network is conventionally considered the more accurate benchmark. Using a chemical transport model (GEOS-Chem) with precisely known methane budget terms, we demonstrate that these differing MGR estimates can be inherently consistent and do not necessarily reflect observational error. By sampling the model to create pseudo-observations, we show that satellite-derived MGR aligns more closely with the model's "true" global growth rate than the surface-network-derived MGR at monthly-to-annual scales. This superior performance stems from the satellite's more comprehensive spatial coverage. Perturbation experiments reveal that the sparse and uneven distribution of surface sites systematically biases global burden estimates in response to short-term, regional emission changes—underestimating signals from poorly sampled regions (e.g., tropical Africa) and overestimating those from well-sampled regions (e.g., East Asia). In contrast, satellite observations provide a more robust estimate of such perturbations, although gaps in coverage can still introduce bias. We conclude that for monitoring the global methane growth rate, satellite observations offer greater representativeness and accuracy than the surface network, reconciling apparent discrepancies and redefining the hierarchy of observational constraints for global-scale methane variability.

How to cite: Zhang, Y.: Reconciling differences in observed annual methane growth rates, EGU General Assembly 2026, Vienna, Austria, 3–8 May 2026, EGU26-13433, https://doi.org/10.5194/egusphere-egu26-13433, 2026.

EGU26-13545 | ECS | Orals | BG1.3

Integrating methane isotopic source signatures with high-resolution wetland fluxes to interpret atmospheric δ13C–CH4 measurements in the central Amazon 

Santiago Botía, Ayan Santos Fleischmann, John Melack, Luana S. Basso, Shrutika Wagh, Ahmad Al Bitar, Hella van Asperen, Sam Jones, Shujiro Komiya, Jost Lavric, Carlos Sierra, Armin Jordan, Michael Rothe, Heiko Moossen, Thomas Röckmann, and Susan Trumbore

The decreasing global trend in δ13C–CH4 suggests that rising biogenic sources are a plausible explanation for the accelerated atmospheric mole fraction observed over the last decade. Tropical wetlands play a critical role in this context and represent one of the largest sources of uncertainty in the global methane budget. The Amazon lowland region, where up to 20–30% of the area can be seasonally flooded, is among the largest natural methane sources in the tropics. However, limitations in both isotopic observations and the representation of wetland diversity and sparse ground base flux measurements continue to limit our ability to attribute emissions to specific ecosystem types and to understand their temporal variability.

In this study, we combine new methane isotopic source signature information from different wetland and aquatic environments in central Amazonia with a refined wetland flux map for the lowland Amazon basin. The combined isotopic and bottom-up flux information is used in atmospheric transport simulations to interpret methane mole fractions and δ13C–CH4 time series at the Amazon Tall Tower Observatory (ATTO). Using a tagged-tracer approach we explore the ability of habitat-specific methane source signatures to distinguish wetland contributions to atmospheric δ13C–CH4 measurements compared to anthropogenic and fire sources. Our results contribute to improving measurement-based source attribution and to reducing uncertainties in regional methane budgets for tropical wetlands.

How to cite: Botía, S., Santos Fleischmann, A., Melack, J., S. Basso, L., Wagh, S., Al Bitar, A., van Asperen, H., Jones, S., Komiya, S., Lavric, J., Sierra, C., Jordan, A., Rothe, M., Moossen, H., Röckmann, T., and Trumbore, S.: Integrating methane isotopic source signatures with high-resolution wetland fluxes to interpret atmospheric δ13C–CH4 measurements in the central Amazon, EGU General Assembly 2026, Vienna, Austria, 3–8 May 2026, EGU26-13545, https://doi.org/10.5194/egusphere-egu26-13545, 2026.

EGU26-13862 | Posters on site | BG1.3

Estimating biogenic CO2 fluxes for different vegetation types using CarboScope-Regional inversion (CSR) over Europe 

Saqr Munassar, Christian Rödenbeck, Frank-Thomas Koch, and Christoph Gerbig

CO2 atmospheric inversions are typically used to derive Net Ecosystem Exchange (NEE) estimates from atmospheric observations, while prescribing the anthropogenic component or resolving for CO2 emissions using proper proxy data. Year-to-year variability of the biosphere sink is primarily caused by climate variations such as drought events, heat waves, and seasonal changes. However, the response of biospheric sink to climate conditions varies spatially across lands depending on vegetation type. In this study, we modified our CSR experiment by augmenting the state space of a standard CO2 inversion enabling the separate optimization of seven vegetation types within CSR, which increases the state space by a factor seven. The diagnostic biosphere model VPRM is used to provide a priori fluxes of CO2 for the targeted vegetation classes, which are derived from the remote sensing data. Posterior flux estimates demonstrate the contributions of CO2 estimates from evergreen, deciduous, mixed forests, as well as shrublands, savanna, croplands, and grasslands. The results indicate that the largest flux adjustments are associated with croplands over Europe, suggesting a shift from being largest sink in the prior model to the largest source of CO2. A similar analysis at the national scale over Germany shows substantial flux adjustments in croplands, which also exhibit the dominant interannual variability. Although the inversion suggests smaller corrections for mixed, evergreen, and deciduous forests, these vegetation types contribute substantially to total fluxes over Germany and display lower interannual variability than croplands. Additionally, we assess the sensitivity of the system to choices of the prior uncertainty settings.

How to cite: Munassar, S., Rödenbeck, C., Koch, F.-T., and Gerbig, C.: Estimating biogenic CO2 fluxes for different vegetation types using CarboScope-Regional inversion (CSR) over Europe, EGU General Assembly 2026, Vienna, Austria, 3–8 May 2026, EGU26-13862, https://doi.org/10.5194/egusphere-egu26-13862, 2026.

EGU26-14756 | Posters on site | BG1.3

Limited impact of fire and grazing on methane emission in a tropical inundated savanna 

Stijn Hantson, Adriana Sánchez, Juan Carlos Benavides, Juan José Ceballos, Milena González, Yeraldin Roa, Anghy Gutierrez Rincon, Santiago Botía, and João Henrique Fernandes Amaral

Atmospheric methane concentrations experience an ongoing increase following a brief stabilization in the early 2000s. Evidence suggests that recent increases are driven by different mechanisms than during the pre-2000 period, with enhanced natural emissions from tropical regions as a leading hypothesis. However, the processes responsible for increasing methane emissions from tropical wetlands remain poorly understood. Improving our understanding of the magnitude, variability, and drivers of methane emissions from tropical wetlands is therefore essential. As large parts of these systems are subject to some form of land management, an often-overlooked factor is how such management practices might influence methane emissions. Land management practices such as prescribed burning and cattle grazing can strongly affect biomass accumulation and, consequently, the availability of carbon substrates for methanogenesis. We therefore hypothesized that treatments leading to a reduced biomass accumulation would also result in lower methane emissions. Here, we present results from a field experiment designed to assess the effects of cattle grazing and prescribed burning on the structure and functioning of an inundated savanna in the Orinoco Plains, Colombia. We conducted chamber measurements of CO₂ and CH₄ fluxes under four treatments: no fire and no grazing, fire and no grazing, no fire and grazing, and fire and grazing. In total, 571 chamber measurements were collected between January 2024 and October 2025. We found that the inundated tropical savanna acted as a substantial source of methane during the wet season (mean 27 mg CH4 m⁻² d-1) and as a small sink during the dry season (mean -1.5 mg CH4 m⁻² d-1). Although treatments significantly altered biomass accumulation (range 128–685 g m⁻²), differences in methane emissions among treatments were not significant, indicating that grazing and prescribed burning do not exert a strong control on methane emissions in this tropical wetland ecosystem.

How to cite: Hantson, S., Sánchez, A., Benavides, J. C., Ceballos, J. J., González, M., Roa, Y., Gutierrez Rincon, A., Botía, S., and Fernandes Amaral, J. H.: Limited impact of fire and grazing on methane emission in a tropical inundated savanna, EGU General Assembly 2026, Vienna, Austria, 3–8 May 2026, EGU26-14756, https://doi.org/10.5194/egusphere-egu26-14756, 2026.

EGU26-15770 | ECS | Orals | BG1.3

Weakening and reversal of greenness-carbon sink coupling across northern lands 

Kai Wang, Philippe Ciais, Yidi Xu, Xuhui Wang, Youngryel Ryu, Dan Zhu, Nazhakaiti Anniwaer, Xiangyi Li, Shuchang Tang, Hui Yang, Shilong Piao, and Yilong Wang

Vegetation greening is commonly viewed as a proxy of increasing land carbon sink since the 1980s. Here we show a weakening or reversal of the coupling between vegetation greening and land sink trends over the recent decade by integrating regional carbon sink estimated by atmospheric measurements with satellite-based greening signals from optical vegetation index. While vegetation greening continued during the recent decade in the northern lands, carbon sinks decreased, implying a carbon sink deficit of 0.37 PgC yr-1 compared to the cases when the coupling remained constant. In addition to changes in annual and seasonal climate, recent increases in hot extremes and forest disturbances explain 37% and 22% of the carbon sink deficit. This study underscores the imperative to improve the representation of the impacts of climate extremes and disturbances in predictive models of the land sinks, and to bolster forest management practices to maintain ecosystem functioning when facing climate extremes and disturbances.

How to cite: Wang, K., Ciais, P., Xu, Y., Wang, X., Ryu, Y., Zhu, D., Anniwaer, N., Li, X., Tang, S., Yang, H., Piao, S., and Wang, Y.: Weakening and reversal of greenness-carbon sink coupling across northern lands, EGU General Assembly 2026, Vienna, Austria, 3–8 May 2026, EGU26-15770, https://doi.org/10.5194/egusphere-egu26-15770, 2026.

EGU26-16287 | Posters on site | BG1.3

The European Carbon Budget - declining forest sinks and regional carbon sources 

Nora Linscheid, Laura Mayer, Philippe Ciais, Stephen Sitch, Martin Brandt, Mélanie Juillard, Katja Kowalski, Siyu Liu, Cornelius Senf, Alba Viana-Soto, Yidi Xu, and Ana Bastos

An alarming decline has been observed in the European carbon sink in recent years, thought to be a combination of increased harvest, severe droughts, bark beetle infestations, tree mortality and slow-down in tree growth causing reduced CO2 uptake. These developments are challenging European forests in their capacity to remain carbon sinks. Meanwhile the European Union’s climate policy is counting on this large natural carbon sink to meet their agreed climate targets.

Although Europe is an extensively studied region, several knowledge gaps remain in the European greenhouse gas (GHG) budgets, importantly a lack of assessments of carbon losses from recent forest disturbances. Due to the highly fragmented European landscapes, data at very high resolution of tree cover and biomass are needed to capture disturbance and heterogeneity at small scales. Large uncertainties also remain in the contribution of land-cover and land-use change and fires.

Here we investigate the recent changes in the European carbon sink by combining new high-resolution Earth Observation-based estimates of forest biomass, forest disturbance and recovery, atmospheric CO2 inversions, and national GHG inventory (NGHGI) approaches to ask (i) which European regions have already turned into carbon sources, (ii) in how far this is due to decreased carbon uptake or increased carbon release, and (iii) how these changes relate to natural and anthropogenic disturbances. We highlight regional differences across the continent and discuss advantages and challenges of the complementary data streams. 

How to cite: Linscheid, N., Mayer, L., Ciais, P., Sitch, S., Brandt, M., Juillard, M., Kowalski, K., Liu, S., Senf, C., Viana-Soto, A., Xu, Y., and Bastos, A.: The European Carbon Budget - declining forest sinks and regional carbon sources, EGU General Assembly 2026, Vienna, Austria, 3–8 May 2026, EGU26-16287, https://doi.org/10.5194/egusphere-egu26-16287, 2026.

EGU26-16307 | ECS | Posters on site | BG1.3

Rapid Methane Emission Reductions within Stabilized Climate Scenarios 

Jonathan Buzan, Jens Terhaar, Fortunat Joos, Niels Iversen, and Peter Roslev

The Paris Agreement encourages member states to keep global warming below 2.0C, and more ambitiously, limit warming to 1.5C. Recent coupled Earth system model simulations adaptively adjusted emissions to reach these stabilization temperatures show that fossil fuel CO2 reductions cannot reach the goals of the Paris Agreement alone. Building upon this framework, we show how varying the relative contribution of cumulative sustained methane emissions reductions is independent of pathway and modifies the allowable emissions from fossil fuels to reach 1.5C, 2.0C, and 3.0C of warming. Our results show that methane emissions reductions can have a large impact on the allowable emissions budget, and with mitigation goals >75% methane emissions reductions combined with rapid decarbonization, may reach the Paris Agreement goals. 


Despite much shorter atmospheric perturbation lifetimes of methane compared to CO2, we find a surprisingly linear relationship of the climate impacts of a one-time release of CO2 versus the cumulative impact of sustained reduction in methane emissions at 2663.1 kgCO2/kgCH4/yr. The 5000-year timescale of atmospheric CO2 removal by ocean sediments translates into a methane emission equivalency of 0.53x CO2, much smaller than the currently proposed emissions trading 1 system value of 25x and the Global Warming Potential approach 100-year horizon of 27.8x. Thus, methane emissions must be treated as a sustained reduction versus an instantaneous reduction like CO2, and should be part of the most urgent decarbonization towards the Paris goals, while the concept of a market exchange value between methane and fossil fuel CO2 must be viewed critically. While acknowledging the indefinite commitment of rapid methane emissions mitigation, this combined with rapid decarbonization may help to prevent an overshoot of Paris Agreement temperature goals.

How to cite: Buzan, J., Terhaar, J., Joos, F., Iversen, N., and Roslev, P.: Rapid Methane Emission Reductions within Stabilized Climate Scenarios, EGU General Assembly 2026, Vienna, Austria, 3–8 May 2026, EGU26-16307, https://doi.org/10.5194/egusphere-egu26-16307, 2026.

EGU26-16589 | Posters on site | BG1.3

Satellite and isotopic constraints on global methane source attribution 

Emeline Tapin, Antoine Berchet, Adrien Martinez, Nicole Montenegro, Malika Menoud, Joël Thanwerdas, Xin Lan, Edward Malina, Daniele Gasbarra, Sylvia Michel, and Marielle Saunois

Methane (CH₄) is the second most important anthropogenic greenhouse gas, yet the drivers of recent increases in its atmospheric concentration remain insufficiently constrained, particularly regarding the relative contributions of different source sectors and sinks. Improving methane source attribution is therefore essential to support effective climate change mitigation strategies.

Atmospheric methane isotopic measurements (δ¹³C–CH₄) provide valuable information to distangle between methane sources, but have so far relied primarily on sparse surface observations. Recent advances in satellite remote sensing, notably with the TROPOspheric Monitoring Instrument (TROPOMI) onboard Sentinel-5P, now offer near-global coverage of column-averaged methane mole fractions (XCH₄), opening new opportunities for integrated source attribution approaches.

Within the ESA-funded SMART-CH4 project (2024–2026), we investigate how combining satellite methane observations with surface isotopic signature measurements can improve constraints on the global methane budget. We assimilate TROPOMI XCH₄ observations (2018–2024) together with updated δ¹³C–CH₄ datasets using inversion techniques implemented in the Community Inversion Framework (CIF), coupled to the LMDZ-SACS chemistry transport model.

We explore the sensitivity of inferred methane emissions to the choice of observational data streams and inversion configurations, and assess the potential added value of isotopic information for separating methane source categories at the global scale. This work aims to contribute to improved estimates of the global methane budget and its uncertainties by integrating satellite and isotopic constraints, with implications for emission monitoring.

How to cite: Tapin, E., Berchet, A., Martinez, A., Montenegro, N., Menoud, M., Thanwerdas, J., Lan, X., Malina, E., Gasbarra, D., Michel, S., and Saunois, M.: Satellite and isotopic constraints on global methane source attribution, EGU General Assembly 2026, Vienna, Austria, 3–8 May 2026, EGU26-16589, https://doi.org/10.5194/egusphere-egu26-16589, 2026.

EGU26-17182 | ECS | Posters on site | BG1.3

National greenhouse gas budgets reconciliation 2025 

Zhu Deng, Philippe Ciais, Liting Hu, Peng Gong, and Frédéric Chevallier

In this study, we provide an update on the methodology and data to compare the national greenhouse gas inventories (NGHGIs) and atmospheric inversion model ensembles contributed by international research teams coordinated by the Global Carbon Project. The comparison framework uses transparent processing of the net ecosystem exchange fluxes of carbon dioxide (CO2) from inversions to provide estimates of terrestrial carbon stock changes over managed land that can be used to evaluate NGHGIs. For methane (CH4), and nitrous oxide (N2O), we separate anthropogenic emissions from natural sources based directly on the inversion results to make them compatible with NGHGIs. Our global harmonized NGHGI database was updated with inventory data by compiling data from the first biennial transparency reports (BTRs) under the Paris Agreement, providing the first annual time-series official reported values in most non-Annex I countries. For the inversion data, we used an ensemble of 30 global inversions produced for the most recent assessments of the global CO2 and CH4 budgets coordinated by the Global Carbon Project with ancillary data, and 6 inversion results of CH4 budgets from Ciais et al, 2026. The inversion ensemble in this study goes through 2024, building on our previous report from 1990 to 2021. The methodology proposed here to compare inversion results with NGHGIs can be applied regularly for monitoring the effectiveness of mitigation policy and progress by countries to meet the objectives of their pledges.

How to cite: Deng, Z., Ciais, P., Hu, L., Gong, P., and Chevallier, F.: National greenhouse gas budgets reconciliation 2025, EGU General Assembly 2026, Vienna, Austria, 3–8 May 2026, EGU26-17182, https://doi.org/10.5194/egusphere-egu26-17182, 2026.

EGU26-17508 | ECS | Orals | BG1.3

Decadal climate modes and ocean carbon sink variability from 1960 to 2020 

Jahfer Sharif, Eun-Young Kwon, Yong-Yub Kim, Yoshimitsu Chikamoto, Ingo Bethke, Sun-Seon Lee, and June-Yi Lee

The ocean has absorbed approximately 30% of global carbon dioxide emissions since the pre-industrial era, thereby mitigating climate change. The uptake of atmospheric carbon depends on coupled changes in ocean circulation, atmospheric CO2 forcing, and ocean biogeochemical processes, and exhibits pronounced variability on interannual to decadal timescales. However, the scarcity of in situ observations makes it difficult to robustly quantify the magnitude, temporal variability, and drivers of oceanic carbon uptake over the period of 1960-2020.

Using multiple observation-based data products together with numerical experiments based on the Community Earth System Model version 2 (CESM2), we examine the variability of air-sea carbon fluxes on interannual to decadal timescales. Consistent with previous studies, we find that externally forced variability driven by anthropogenic emissions, along with natural variability associated with climate modes such as the El Niño–Southern Oscillation (ENSO) and the Interdecadal Pacific Oscillation (IPO), are key contributors to carbon-flux variability over the past decades. Earth System Models including the CESM2 tend to underestimate the magnitude of this variability because they struggle to capture complex physical and biogeochemical processes as well as inter-decadal climate variability. Assimilating realistic anomalies in observed surface winds improves the representation of variability in the equatorial ocean, enhancing the model’s ability to reproduce observed changes in ocean carbon uptake since the 1960s. Additional assimilation of observed ocean temperature and salinity anomalies further improves extra-tropical variability, although model performance degrades in the equatorial regions.

Based on these assimilated simulations, we demonstrate how a large-scale climate mode in the Pacific led to a redistribution of both natural and anthropogenic dissolved inorganic carbon in the global ocean, accompanied by a slowdown of ocean carbon sink during the 1990s (the so-called carbon-sink hiatus). Finally, we discuss the inferred decadal variability of the land carbon sink, estimated by incorporating the newly constrained ocean carbon sink into the global carbon budget.

How to cite: Sharif, J., Kwon, E.-Y., Kim, Y.-Y., Chikamoto, Y., Bethke, I., Lee, S.-S., and Lee, J.-Y.: Decadal climate modes and ocean carbon sink variability from 1960 to 2020, EGU General Assembly 2026, Vienna, Austria, 3–8 May 2026, EGU26-17508, https://doi.org/10.5194/egusphere-egu26-17508, 2026.

EGU26-18213 | ECS | Orals | BG1.3

The Community Inversion Framework as an operational tool for inverse modelling: towards robust, streamlined, and automatized intercomparisons of top-down estimates 

Joel Thanwerdas, Antoine Berchet, Isabelle Pison, Friedemann Reum, Eldho Elias, Gregoire Broquet, Frédéric Chevallier, Rona Louise Thompson, Audrey Fortems-Cheiney, Aki Tsuruta, Anteneh Mengistu, Philippe Peylin, Vladislav Bastrikov, Elise Potier, Marielle Saunois, Adrien Martinez, Lukas Emmenegger, and Dominik Brunner

Inverse modelling is employed to reconcile greenhouse gas (GHG) emission inventories, based on bottom-up methods, with the observed atmospheric GHG concentrations. The Community Inversion Framework (CIF) was created to unify inverse-model developments and simplify the generation of inversions. It makes atmospheric transport models and inversion algorithms easily interchangeable and facilitates the comparison of inversion results obtained using such diverse components.

After several years of development and the coupling of CIF with a wide range of transport models used by the inversion community, we present the first intercomparison study conducted with CIF. This exercise focuses on Europe and aims to refine CO₂ natural emissions for the year 2019, following a strict protocol. It involves five transport models (CHIMERE, ICON-ART, LMDz, STILT, and WRF-CHEM) and two inversion algorithms (variational and ensemble-based). Two additional transport models, TM5 and FLEXPART, will be incorporated in the near future.

The results show a good agreement, both across transport models, and inversion algorithms. It paves the way towards using CIF as an operational tool for intercomparison studies. It also highlights its strong potential to support the systematic derivation of GHG budgets with multiple transport models, enable a proper and easy quantification of the modelling uncertainty, and improve the robustness of emission estimates, for any relevant atmospheric species, at any scale.

How to cite: Thanwerdas, J., Berchet, A., Pison, I., Reum, F., Elias, E., Broquet, G., Chevallier, F., Thompson, R. L., Fortems-Cheiney, A., Tsuruta, A., Mengistu, A., Peylin, P., Bastrikov, V., Potier, E., Saunois, M., Martinez, A., Emmenegger, L., and Brunner, D.: The Community Inversion Framework as an operational tool for inverse modelling: towards robust, streamlined, and automatized intercomparisons of top-down estimates, EGU General Assembly 2026, Vienna, Austria, 3–8 May 2026, EGU26-18213, https://doi.org/10.5194/egusphere-egu26-18213, 2026.

EGU26-18294 | ECS | Orals | BG1.3

Global air-sea CO2 flux estimates leveraging both ship and corrected BGC Argo observations 

Raphaël Bajon, Seth Bushinsky, Haichao Guo, Peter Landschützer, Arianna Olivelli, Daniel Burt, Christian Rödenbeck, and Kenneth Johnson

Accurately mapping the sea surface partial pressure of carbon dioxide (pCO2) remains a major constraint for quantifying global air-sea CO2 fluxes. New autonomous platforms, including biogeochemical(BGC)-Argo floats, now provide unprecedented temporal coverage across the global ocean, enabling the derivation of pCO2 from measured parameters such as oxygen and pH. However, recent studies have highlighted biases in these parameters, raising questions about their impact on derived parameters and flux estimates. Float oxygen offsets and carbonate system thermodynamics are among the reasons behind float derived pCO2 biases. By correcting the sources of bias in pCO2, we aim to improve global air-sea CO2 fluxes and provide guidance for refining observational strategies to constrain the ocean carbon sink. We also examine how sensor characterization of uncertainties and recalibration in BGC-Argo data propagate through pCO2 derivation and ultimately affect regional and global CO2 flux quantification.

How to cite: Bajon, R., Bushinsky, S., Guo, H., Landschützer, P., Olivelli, A., Burt, D., Rödenbeck, C., and Johnson, K.: Global air-sea CO2 flux estimates leveraging both ship and corrected BGC Argo observations, EGU General Assembly 2026, Vienna, Austria, 3–8 May 2026, EGU26-18294, https://doi.org/10.5194/egusphere-egu26-18294, 2026.

EGU26-18522 | ECS | Orals | BG1.3

High-resolution estimates of vegetation and soil carbon densities for regional and global carbon budgets 

Raphael Ganzenmüller, Wolfgang A. Obermeier, Selma Bultan, Seth A. Spawn-Lee, Florian Zabel, and Julia Pongratz

Mitigating global climate change requires massive greenhouse gas emission reductions and carbon removal efforts. Although terrestrial ecosystems store large amounts of carbon, land-use change has substantially diminished these stocks in many regions. However, a consistent, high-resolution approach to quantify the differences between actual and potential carbon stocks in vegetation and soils – the terrestrial carbon deficit – remains elusive, limiting the evaluation of global climate models. In particular the high spatial heterogeneity of vegetation and soil organic carbon stocks at the ecosystem level introduces major uncertainty into common methods for estimating land-use change carbon fluxes, propagating uncertainties into national, regional and global carbon budgets.

Here, we generate spatially explicit maps of vegetation and soil carbon stocks for ten ecosystem types by combining a machine-learning algorithm with semi-empirical observations and simulations of global dynamic vegetation models (DGVMs). Our results show that commonly used default carbon values substantially underestimate the heterogeneity of carbon within ecosystems. By integrating our spatially explicit carbon data into the bookkeeping of land-use emissions model BLUE – one of the models underlying the net land-use change flux estimates of the annual Global Carbon Budget of the Global Carbon Project –, we find that global estimates of the net land-use change flux for 1960–2023 are 3–14% lower than estimates relying on default values from the literature. The estimates further reveal in several regions pronounced differences of more than 20%, highlighting the value of spatially explicit carbon data for accurate national and sub-national net land-use change flux assessments. Improving this accuracy reduces the uncertainty in net land-use change flux estimates and in land-based carbon mitigation potential calculations, which both are fundamental for informing political decision-making to achieve carbon neutrality and global climate targets.

Across ecosystems, we quantify the terrestrial carbon deficit to be 344 (251–393) PgC, equivalent to a 24% depletion, predominantly driven by pasture expansion (30%), cropland expansion (24%), and forest management (23%). We reveal that dynamic global vegetation models (DGVMs) underestimate the terrestrial carbon deficit by 37% on average (range: 2%–58%), highlighting critical limitations. Our findings support assessments of anthropogenic impacts on ecosystems and help constrain global climate models to better evaluate nature-based solutions and climate mitigation policies.

How to cite: Ganzenmüller, R., Obermeier, W. A., Bultan, S., Spawn-Lee, S. A., Zabel, F., and Pongratz, J.: High-resolution estimates of vegetation and soil carbon densities for regional and global carbon budgets, EGU General Assembly 2026, Vienna, Austria, 3–8 May 2026, EGU26-18522, https://doi.org/10.5194/egusphere-egu26-18522, 2026.

EGU26-19053 | ECS | Posters on site | BG1.3

Satellite-based CH4 emission monitoring based on the Community Inversion Framework (CIF): application to the Tropics 

Eldho Elias, Aurélien Sicsik-Paré, Ines Kamoun, Marielle Saunois, Adrien Martinez, Isabelle Pison, Grégoire Broquet, Audrey Fortems-Cheiney, Élise Potier, and Antoine Berchet

Atmospheric inversions are used by the global greenhouse gas (GHG) monitoring community for the estimation of GHG emission budgets both at global and regional scales. The Community Inversion Framework (CIF) brings novel inversion capabilities for emission monitoring, especially based on satellite data. The system is designed to enable easily deployable inversions using a large variety of inputs, with one of the key aspects of interest being the smooth integration of satellite data (from existing platforms such as S5P TROPOMI, or new ones as GOSAT-GW and S5) and their comparison to transport model simulations. To cover the needs of the inversion community, CIF is compatible with multiple inversion algorithms (variational and ensemble-based) and chemistry and transport models. These integrated features in a single system facilitate inter-comparison analyses and transparent and reliable policy-relevant reporting, consistent with WMO-promoted guidelines for inversion use in the UNFCCC context. 

In the present study, we showcase a satellite-based inversion system over tropical regions using the CIF-CHIMERE inversion setup. Domains of interest include Africa, India and Southeast Asia, and South America, which contribute approximately 14%, 23%, and 16%, respectively, to the total annual CH4 emissions worldwide, according to the Global Methane Budget (Saunois et al., 2025). Thus, our system covers more than 50% of methane emissions worldwide. Still, CH4 emission estimates over these regions remain largely uncertain due to the scarcity of observational data, as well as the complexity and diversity of emission processes. We use satellite CH4 total column mixing ratios observation from TROPOMI that provides extensive spatial coverage over the Tropics to better constrain emissions in these regions. 

Inversion results are highly dependent on transport patterns, observational coverage, uncertainties, and reliable prior information. In this study, we assess the system capabilities in monitoring fluxes using a low-cost Monte-Carlo approach. We highlight potential and remaining gaps for future systematic application for emission monitoring.

How to cite: Elias, E., Sicsik-Paré, A., Kamoun, I., Saunois, M., Martinez, A., Pison, I., Broquet, G., Fortems-Cheiney, A., Potier, É., and Berchet, A.: Satellite-based CH4 emission monitoring based on the Community Inversion Framework (CIF): application to the Tropics, EGU General Assembly 2026, Vienna, Austria, 3–8 May 2026, EGU26-19053, https://doi.org/10.5194/egusphere-egu26-19053, 2026.

EGU26-19061 | Orals | BG1.3

Ecosystem-Scale Carbon Balance to Improve the Emission Factors for Acacia Plantations on Tropical Peatlands  

Ari Putra Susanto, Chandra Shekhar Deshmukh, Nardi Nardi, Nurholis Nurholis, Sofyan Kurnianto, Steven Gunawan, Suci Ramadhanti, Safira Dyah Kusumawardhani, Aquilla Garry Andrean Samosir, Rico Wenadi, Ankur R Desai, Susan E Page, Alexander R Cobb, Takashi Hirano, Frédéric Guérin, Dominique Serça, Fahmuddin Agus, Supiandi Sabiham, and Chris Evans

Peatlands are among the most carbon‑rich terrestrial ecosystems and play a key role in the global carbon cycle. However, managed peatlands for agriculture and silviculture emits significant carbon. Southeast Asia hosts approximately one third of tropical peatlands with around half of it are managed for agriculture and silviculture to support economic and population growth.

Substantial uncertainties remain in existing estimates with a large range. Partially, such uncertainties can be attributed to both limited field measurements from major land uses and also lack of direct measurements of carbon loss when using short‑term chamber and subsidence approaches. Despite strong interests from scientific community and policy makers, current Intergovernmental Panel on Climate Change (IPCC) Tier 1 emission factors (EFs) for tropical peatlands are derived from short‑term chamber and subsidence measurements, which may not fully capture total ecosystem carbon dynamics and introduce potential uncertainty into emission estimates.

Using continuous 30-minutes eddy covariance measurements, we quantified comprehensive greenhouse gas (GHG) balance of an Acacia crassicarpa plantation on tropical peatland in Sumatra, Indonesia. Net ecosystem carbon dioxide (CO₂), methane (CH₄), and soil nitrous oxide (N₂O) exchange to estimate the GHG exchange.

Considering carbon export from harvested wood over a complete plantation rotation as emissions, the Acacia plantation exhibited net CO2 emissions of 30.0 ± 4.6 tCO₂-eq ha⁻¹ yr⁻¹, approximately 50% lower than IPCC Tier 1 EFs. Emissions were also ~20% lower than degraded peatlands in the same landscape, and the partial use of harvested biomass for bioenergy potentially further reduces the plantation’s overall climate impact.

These findings indicate that current emission factors by IPCC may not fully represent GHG dynamics in existing Acacia plantations on tropical peatlands. Incorporating ecosystem-scale observations and full plantation rotation assessment into Tier 3 EFs estimation improved the accuracy in GHG emissions from managed tropical peatland ecosystems.

How to cite: Susanto, A. P., Deshmukh, C. S., Nardi, N., Nurholis, N., Kurnianto, S., Gunawan, S., Ramadhanti, S., Kusumawardhani, S. D., Samosir, A. G. A., Wenadi, R., Desai, A. R., Page, S. E., Cobb, A. R., Hirano, T., Guérin, F., Serça, D., Agus, F., Sabiham, S., and Evans, C.: Ecosystem-Scale Carbon Balance to Improve the Emission Factors for Acacia Plantations on Tropical Peatlands , EGU General Assembly 2026, Vienna, Austria, 3–8 May 2026, EGU26-19061, https://doi.org/10.5194/egusphere-egu26-19061, 2026.

EGU26-19933 | Orals | BG1.3

Forestry and climate change mitigation in Quebec (Canada) 

Évelyne Thiffault

We have estimated that for Quebec, a province of eastern Canada, an ambitious climate change mitigation portfolio of actions mobilizing the forest lands of the province and the wood processing industries could generate annual greenhouse gas reductions varying from 0.5 to 6.7 Mt CO2 eq/year by 2030. Implementing these actions requires detailed knowledge of the territory and dynamics of forest ecosystems and the links between forests and societal needs for materials and energy. In this context, our simulation results suggest partial-cut harvesting, when used as an alternative to clear-cut harvesting in the boreal forests of Quebec, can be a promising way of supplying high-quality wood products to markets and maintaining carbon stocks in ecosystems, although field data do not always support this promising view about partial cut. Conversely, afforestation measures such as tree planting on abandoned agricultural lands do not appear to provide benefits in the context of Quebec. Most of these lands supported forest ecosystems before their clearing for agriculture, and field data suggest that they can revert relatively quickly to natural succession leading to a forest cover and sequestering large quantities of carbon without the need for artificial plantation. Moreover, the change in surface albedo and associated radiative forcing incurred by the establishment of a coniferous plantation on a previously non-forested land can be substantial due to the high latitude and long snow-covered winter season of Quebec; the deciduous-dominated natural succession can lower this effect. Nevertheless, our research demonstrates that improving the management of the end-of-life of wood products by preventing their landfilling (which is still very common in Quebec) through increased wood cascading use or increasing the recovery and use of landfill methane would yield significantly higher climate benefits than any forest management action.

How to cite: Thiffault, É.: Forestry and climate change mitigation in Quebec (Canada), EGU General Assembly 2026, Vienna, Austria, 3–8 May 2026, EGU26-19933, https://doi.org/10.5194/egusphere-egu26-19933, 2026.

EGU26-19942 | ECS | Orals | BG1.3

Widespread Shift in the Seasonal Phase of Long-Term and Multi-Site Atmospheric CO2 Observations 

David Hafezi Rachti, Christian Reimers, Sebastian Sippel, and Alexander J. Winkler

Observing atmospheric CO2 concentrations is akin to taking the pulse of the global carbon cycle. Long-term observations at sampling stations in the Northern Hemisphere reveal a pronounced seasonal cycle, reflecting the annual course of terrestrial photosynthetic carbon uptake and respiratory release. This cycle has changed over the last decades: The amplitude has increased due to increased respiration during winter and greater carbon uptake during the growing season. At the same time, the phase defined as the timing of the zero-downward crossing of the seasonal cycle has shifted to earlier in the season. However, the drivers of the increase in amplitude, and particularly of the phase shift, are still uncertain.

Here, we analyse this phase shift and its drivers over the last six decades using observational data, process-based models and statistical learning. Our analysis reveals a statistically significant phase shift towards earlier dates of 1.5 – 2.0 days per decade at multiple stations in the Northern Hemisphere and even at the South Pole (2 ± 1 days per decade). In contrast to the increase in amplitude and phenological changes, the phase shift does not increase with latitude and is rather consistent across the latitudinal gradient.

To understand what is behind the observed phase changes, we next analyse simulations from different experiments using Earth system models and land surface model outputs from the TRENDY protocol. The carbon fluxes from the TRENDY models are transported using an atmospheric transport model. Additionally, we train statistical learning models to predict phase changes based on various potential drivers, such as observed temperature and pressure fields and evaluate their performance and feature importance.

By combining long-term atmospheric CO2 observations, process-based model simulations and statistical learning, this study will shed light on the driving forces of seasonal CO2 phase shifts and provide key insights into the changing land carbon dynamics.

How to cite: Hafezi Rachti, D., Reimers, C., Sippel, S., and Winkler, A. J.: Widespread Shift in the Seasonal Phase of Long-Term and Multi-Site Atmospheric CO2 Observations, EGU General Assembly 2026, Vienna, Austria, 3–8 May 2026, EGU26-19942, https://doi.org/10.5194/egusphere-egu26-19942, 2026.

EGU26-20380 | Posters on site | BG1.3

Boreal and subarctic dwarf shrub contribution to carbon capture early in the growing season  

Ane Vollsnes, Sonya Rita Geange, and Vigdis Vandvik

In boreal and subarctic regions, dwarf shrubs may dominate the ground cover in forests as well as open habitats. Therefore, their contribution to the carbon capture in these areas is important to quantify. The length of the growing season impacts greatly on the carbon capture and is also very variable depending on duration of the snow cover as well as daylenghts and temperatures. In a project studying many ecological aspects of dwarf shrubs in four sites in Norway, we compare a coastal and an inland site in the south and the north of the country. The coastal sites typically have less snow than the inland sites, whereas the southern sites have higher mean air temperatures than the northern sites. The extremes of these four sites are then the southern coastal site where the snowless season with favourable temperatures can come in April, versus the northern continental site where snowmelt and favourable temperatures may come in June when there is midnight sun. If the plants from varying locations are differently adapted to start photosynthesising and producing new leaves, it will impact on the seasonal carbon capture. To compare these abilities between sites, we collected plants from each site and grew them in controlled conditions giving them the same winter and spring startup conditions. The dwarf shrubs Calluna vulgaris and Empetrum nigrum are among the species we studied. Repeated measurements of photosynthesis rate, respiration rate and branch lengths were done to investigate the phenology. This presentation will show how the species differed between sites of origin and the results will be discussed with respect to the normal climate at each site.

How to cite: Vollsnes, A., Geange, S. R., and Vandvik, V.: Boreal and subarctic dwarf shrub contribution to carbon capture early in the growing season , EGU General Assembly 2026, Vienna, Austria, 3–8 May 2026, EGU26-20380, https://doi.org/10.5194/egusphere-egu26-20380, 2026.

EGU26-21963 | Orals | BG1.3

Sensitivity of modeled forest carbon exchange in Germany to climate forcing differences between E-OBS and ERA5-Land 

Hassane Moutahir, Rüdiger Grote, David Kraus, Edwin Haas, and Ralf Kiese

Process-based models are widely used to estimate forest carbon exchange, however, their outcomes depend strongly, among other factors, on the choice of climate forcing data. This study assesses the sensitivity of modeled carbon exchange in German forests to differences between the E-OBS and ERA5-Land climate datasets using the ecosystem LandscapeDNDC model for the period 2011–2023. Simulations were conducted on a spatially explicit 10 × 10 km grid across Germany for the four dominant tree species groups (beech, oak, spruce, and pine). Within each grid cell, 15 representative sampling points per species were selected and used to extract the vegetation and soil properties. Forest structure was initialized using biomass and canopy height derived from Planet products, soil properties from SoilGrids, and climate forcing was provided alternatively by E-OBS and ERA5-Land. Preliminary results indicate that on average, ERA5-driven simulations produce higher gross primary production (GPP) due to higher precipitation amounts, but also higher total ecosystem respiration (TER) associated mainly with increased minimum temperatures, reflecting warmer nighttime conditions and enhanced ecosystem respiration. As the relative increase in TER exceeds that of GPP, net ecosystem exchange (NEE) is reduced under ERA5-Land forcing compared to E-OBS. Despite this general reduction, NEE exhibits considerable spatial variability across Germany, including both positive and negative deviations. Overall, both climate datasets reproduce the large-scale spatial patterns of GPP, TER, NEE, with consistent regional gradients across Germany. These findings demonstrate that climate forcing choice can significantly influence modeled forest carbon balances at national scale, with important implications for greenhouse gas inventories and forest carbon accounting.

How to cite: Moutahir, H., Grote, R., Kraus, D., Haas, E., and Kiese, R.: Sensitivity of modeled forest carbon exchange in Germany to climate forcing differences between E-OBS and ERA5-Land, EGU General Assembly 2026, Vienna, Austria, 3–8 May 2026, EGU26-21963, https://doi.org/10.5194/egusphere-egu26-21963, 2026.

EGU26-22007 | Orals | BG1.3

The impact of restoring management to undermanaged forests in the UK: Comparing stand level assessments to the impact at a National Greenhouse gas inventory scale.  

Carly Whittaker, Emma Hubbert, Paul Henshall, Geoff Hogan, Charlie Clark, and Robert Matthews

Approximately 54% of woodlands in the UK are undermanaged meaning they have not had a Woodland Management Plan, grant or felling licence in the last 15 years. There is policy interest in restoring management to these woodlands to enhance biodiversity, ecosystem function and ecosystem resilience, however it is well known that management can influence forest carbon stocks by both removing carbon in harvested material and by shifting carbon into the deadwood pool where it decomposes. Therefore, there are expected to be trade-offs between managing forests for biodiversity and carbon objectives.

This paper outlines research showing that the carbon losses from woodland restoration could be long lasting on both a regional and national scale when applied to the GHG inventory.

We examined this from a top-down and bottom-up approach. The top-down approach applies a restoration target to the UK National Greenhouse Gas inventory by transitioning areas reported as unmanaged areas to low intensity silvicultural management. The transition takes place over a 10-year period to either achieve a target of 65% or 75% of total UK woodland into active management. The GHG Inventory and inventory projections applied the CARBINE-R forest sector carbon accounting model to model carbon sequestration in trees, transfers to and between deadwood, litter, soil, and the atmosphere due to turnover, mortality, harvesting, and decay, and allocation of harvested timber to the raw wood products of bark, roundwood, and sawlogs. This was used to project the change in national carbon stocks over the next 100 years, which showed a modest decline that increased with the area of forest restored.

The GHG Inventory assumes growth without disturbance in the baseline, and the restoration is applied agnostically to all unmanaged woodland types, therefore a bottom-up method stand-level assessment was performed for a number of unmanaged woodland case studies that ranged in species composition, management history, and targeted management interventions for either biodiversity or commercial objectives. This approach allowed us to consider the impact of different stocking levels, species mixes, as well as comparing the impacts of different levels of management. Also, a business-as-usual scenario was developed that considered disturbance from common tree diseases (ash dieback, acute oak decline, Dothistroma needle blight), that could affect the baseline.

The results show that in most of the unmanaged woodland types modelled, introducing management leads to large carbon stock losses which do not recover by 2150, except areas of woodland that are young and have failed to establish, resulting in understocked or overly browsed woodland. These consistently gained land carbon due to introducing management. For other woodland types, the carbon losses can be reduced if there is considerable mortality due to natural disturbance in the baseline, suggesting that targeting restoration to areas at high risk of disturbance would mitigate the carbon losses. We can use these results to refine the GHG inventory projections by focusing on suitable tree species mixes and ages of stands and to identify the potential impact of a more targeted management restoration policy.

How to cite: Whittaker, C., Hubbert, E., Henshall, P., Hogan, G., Clark, C., and Matthews, R.: The impact of restoring management to undermanaged forests in the UK: Comparing stand level assessments to the impact at a National Greenhouse gas inventory scale. , EGU General Assembly 2026, Vienna, Austria, 3–8 May 2026, EGU26-22007, https://doi.org/10.5194/egusphere-egu26-22007, 2026.

EGU26-523 | ECS | Posters on site | BG1.5

Developing an enhanced preconcentration system (RAPTOR) for high-precision tropospheric nitrous oxide isotope measurements by laser spectroscopy  

Phillip Agredazywczuk, Rudolf Meier, Jiri Hlubucek, Jonas Bruckuisen, Christophe Espic, Benjamin Wolf, Joachim Mohn, Oleg Aseev, and Eliza Harris

The mixing ratio of nitrous oxide (N2O), an important greenhouse gas and ozone-depleting substance, in the troposphere has increased by 25% (~336 ppb) since the preindustrial period, with increased emissions in the last few years showing that effective mitigation policies are urgently required.  N2O is emitted from a range of anthropogenic sources, particularly fertilised agricultural soils. N2O sources and sinks can be constrained using measurements of four isotopocules: 14N15N16O (α), 15N14N16O (β), 14N14N16O, and 14N14N18O, and the site-specific relative isotope ratio differences (δ15Nα and δ15Nβ); however, N2O’s long tropospheric lifetime requires high precision (<0.1 ‰) to distinguish source signals from background variability. Existing preconcentration-laser spectrometry (TREX-QCLAS) systems lack the sufficient precision required for detailed tropospheric N2O budget studies, for example, resolving trends in site preference or the interhemispheric gradient in isotopic composition. In this project, we build upon preconcentration system development with key innovations: (1) a simplified single 6-port VICI valve design; (2) a system-wide reduction of dead volumes to minimise memory effects; (3) a smaller trap enabling faster heating/cooling without linear actuators; and (4) integration with MIRO Analytical's first commercial N2O isotope spectrometer featuring a temperature/pressure-controlled measurement cell. This system will measure N2O isotopic composition in flask samples from Jungfraujoch High-Altitude Research Station and other background sites, establishing global isotope scale compatibility through multi-site measurements and inter-laboratory comparisons. These advances will improve constraints on regional and temporal variability in the global N2O budget to support effective mitigation strategies.


How to cite: Agredazywczuk, P., Meier, R., Hlubucek, J., Bruckuisen, J., Espic, C., Wolf, B., Mohn, J., Aseev, O., and Harris, E.: Developing an enhanced preconcentration system (RAPTOR) for high-precision tropospheric nitrous oxide isotope measurements by laser spectroscopy , EGU General Assembly 2026, Vienna, Austria, 3–8 May 2026, EGU26-523, https://doi.org/10.5194/egusphere-egu26-523, 2026.

Maize and wheat are two major staple foods that collectively contribute two-thirds of the world’s grain supply. The extensive use of nitrogen (N) fertilizers during the cultivation of both crops leads to significant losses of reactive nitrogen (Nr) into the environment. Here, using machine learning algorithms, we generate high-resolution maps of crop-specific soil Nr losses based on global field measurements. We estimate that global annual soil Nr losses from the use of synthetic N fertilizer in 2020, including direct emissions of nitrous oxide (N2O), nitric oxide (NO), ammonia (NH3), N leaching and run-off, amount to 0.18, 1.62, 0.09, 1.47 and 1.10 million tonnes N for maize, and 0.12, 1.33, 0.07, 1.21 and 0.95 million tonnes N for wheat, respectively. The annual indirect N2O emissions induced by synthetic N fertilizer use from these soil Nr losses are estimated to be 45,000 and 37,000 tonnes for maize and wheat, respectively, with hydrologic pathways playing a predominant role. Enhancing N use efficiency up to 60% for regions below this value can achieve a total soil Nr loss mitigation potential of 4.00 million tonnes per year for the two crops, thereby reducing indirect N2O emissions by 49%. Our results contribute to constrain global N budgets from the use of fertilizer in agriculture, which then can help to improve projections of nitrogen cycle–climate feedbacks using modelling approaches.

How to cite: Liu, S.: Reducing soil nitrogen losses from fertilizeruse in global maize and wheat production, EGU General Assembly 2026, Vienna, Austria, 3–8 May 2026, EGU26-1654, https://doi.org/10.5194/egusphere-egu26-1654, 2026.

EGU26-2377 | Posters on site | BG1.5

Modelling N2O Fluxes in Peatlands: From Process to Global Mapping 

Ülo Mander, Jaan Pärn, Mikk Espenberg, Sandeep Thayamkottu, Mohit Masta, Fahad Ali Kazmi, Valentina Sagris, and Kaido Soosaar

Peatlands cover a small portion of the Earth's land area, but their impact on the carbon (C) and nitrogen (N) cycles at both regional and global scales is significant. The water regime of peatlands (as an indicator of oxygen content) and temperature are the main factors in peatland greenhouse gas (GHG) fluxes. Under high water tables, as well as very dry conditions, emissions of both carbon dioxide (CO2) and nitrous oxide (N2O) are low, but excess moisture and anoxic conditions increase methane (CH4) emissions. At moderate soil moisture and fluctuating water table, CO2 and N2O emissions are high. Peatland N2O emissions also depend significantly on availability of total mineral nitrogen (TIN). Permanently wet (i.e., natural) peatlands act as CO2 sinks, accumulating organic C in the soil. In drained peatlands, both gaseous and dissolved C losses are high. Artificial drainage and climatic drying induce approximately 70% of all N2O emissions from organic soils.

Tropical regions are some of the most important terrestrial sources of N2O. In drained tropical peatlands, N2O emissions are the second most important contributor to the GHG budget after CO2. Forests dominate tropical peatlands. These are more complex ecosystems than open peatlands, as the canopy (phyllosphere) may significantly influence GHG fluxes, especially during wet periods. Our studies show that large N2O fluxes from the soil can be absorbed by the canopy, although the underlying mechanisms remain unclear.

In our empirical process-based PeatN2O model, which simulates monthly N2O fluxes in peatlands, we integrate the following parameters: peat ammonium (NH4+) and nitrate (NO3) content, C/N ratio, soil moisture level, rate of change in soil moisture, N and C cycle microbiome ratios, source (NH4+ and/or NO3) partitioning based on N2O isotopologue signatures, a plant traits factor, and a canopy factor. The results of this model can be used to refine the global N2O estimates based on a combination of N2O emission estimates from the Global Peatlands Initiative map (2022) and the Major Land Cover Units map (MODIS, 2022). The sources are from our working group's global studies, IPCC emission factors, and other published studies. The main challenge in scaling future GHG fluxes to global change scenarios is predicting the spatial and temporal variability in environmental conditions that create hot spots and hot moments of fluxes.

How to cite: Mander, Ü., Pärn, J., Espenberg, M., Thayamkottu, S., Masta, M., Kazmi, F. A., Sagris, V., and Soosaar, K.: Modelling N2O Fluxes in Peatlands: From Process to Global Mapping, EGU General Assembly 2026, Vienna, Austria, 3–8 May 2026, EGU26-2377, https://doi.org/10.5194/egusphere-egu26-2377, 2026.

EGU26-3617 | ECS | Orals | BG1.5

Terrestrial nitrogen cycling in Earth System Models: from biological nitrogen fixation to projecting pollution for planetary stewardship 

Sian Kou-Giesbrecht, Carla Reis Ely, Steven Perakis, Cory Cleveland, Duncan Menge, and Sasha Reed and the Terrestrial Biological Nitrogen Fixation USGS John Wesley Powell Center for Analysis and Synthesis Group

Terrestrial nitrogen cycling plays a vital role in the Earth system, influencing climate change and a myriad of dimensions of human well-being, yet remains poorly constrained in Earth system models (ESMs). In particular, terrestrial biological nitrogen fixation (BNF) is the dominant natural nitrogen source to the terrestrial biosphere and can alleviate nitrogen limitation of CO2 fertilization but is a key source of uncertainty in ESMs. When comparing terrestrial BNF from a CMIP6 ensemble of ESMs to a new global synthesis of observations across natural and agricultural biomes, ESMs are found to underestimate agricultural BNF but overestimate natural BNF by over 50% in the present day. Natural BNF is overestimated in the most productive ecosystems that contribute most to the terrestrial carbon sink (forests and grasslands). There is a positive correlation between modeled present-day natural BNF and the CO2 fertilization effect across ESMs, suggesting that overestimated natural BNF translates to an exaggerated CO2 fertilization effect of approximately 11%. Additionally, while the focus of terrestrial nitrogen cycling in ESMs has primarily been nitrogen limitation of CO2 fertilization, nitrogen losses from the terrestrial biosphere to the atmosphere and hydrosphere has been neglected. These include key flows of nitrogen, such as reactive nitrogen gas emissions from soils and wildfires as well as its transport along the land to ocean aquatic continuum, that are strongly influenced by human activities. ESMs with fully interactive nitrogen cycling could both improve climate change projections and be used to project nitrogen pollution and its impacts to inform planetary stewardship over the 21st century.

How to cite: Kou-Giesbrecht, S., Reis Ely, C., Perakis, S., Cleveland, C., Menge, D., and Reed, S. and the Terrestrial Biological Nitrogen Fixation USGS John Wesley Powell Center for Analysis and Synthesis Group: Terrestrial nitrogen cycling in Earth System Models: from biological nitrogen fixation to projecting pollution for planetary stewardship, EGU General Assembly 2026, Vienna, Austria, 3–8 May 2026, EGU26-3617, https://doi.org/10.5194/egusphere-egu26-3617, 2026.

EGU26-3763 | Orals | BG1.5

Global Nitrogen budget 1980-2022 

Xiuming Zhang, Xin Xu, Wilfried Winiwarter, and Baojing Gu

Human activities have profoundly altered the global nitrogen (N) cycle, with far-reaching consequences for the environment and human well-being. By integrating data from multiple sources and employing advanced modeling techniques, here we present an up-to-date comprehensive assessment of the global nitrogen budget from 1980 to 2022, quantifying the major flows and redistributions of reactive nitrogen (Nr) among the atmosphere, terrestrial ecosystems, and aquatic systems. Our analysis reveals a 49% increase in anthropogenic Nr release over the past four decades, largely driven by agricultural intensification and industrial expansion. Emissions to the atmosphere (NH₃, NOₓ, N₂O) rose by 37%, while nitrogen losses to water bodies surged by 72%, intensifying air pollution, eutrophication and climate change. Regarding the terrestrial fate of Nr, we estimate that terrestrial ecosystems eliminate approximately 100 Tg N yr⁻¹ via denitrification to N2, while net accumulation in soils, biomass and industrial products accounts for 130-150 Tg N yr⁻¹. Hotspots of nitrogen accumulation and deficiency emerging in different regions, exacerbating regional and global inequalities. These findings underscore the urgency of coordinated global policies and region-specific strategies to mitigate nitrogen pollution and advance sustainable nitrogen management.

How to cite: Zhang, X., Xu, X., Winiwarter, W., and Gu, B.: Global Nitrogen budget 1980-2022, EGU General Assembly 2026, Vienna, Austria, 3–8 May 2026, EGU26-3763, https://doi.org/10.5194/egusphere-egu26-3763, 2026.

Imbalanced synthetic nitrogen fertilizer use remains a critical obstacle to global sustainable development. Excessive nitrogen application leads to environmental pollution in many world regions, whereas insufficient nitrogen input elsewhere constrains yields and exacerbates food insecurity. Resolving this spatial imbalance requires a comprehensive understanding of how nitrogen use can be more effectively redistributed, together with the associated economic costs and societal benefits to the achievement of Sustainable Development Goals (SDGs). We present a global analysis of synthetic nitrogen fertilizer redistribution among countries and its potential to contribute to multiple SDGs, particularly enhancing food security while mitigating nitrogen emissions to air and aquatic systems. The redistribution based on optimal regional nitrogen use efficiencies could increase global crop production by 14% while reducing global nitrogen fertilizer use by 11 million tonnes. This reduction would lower reactive nitrogen losses, decreasing emissions to the atmosphere and aquatic systems by 22% and 21%, respectively. The estimated implementation cost is US$21 billion, far below the projected social benefit of US$535 billion. Redistribution would improve 1-16% of multiple SDG performance, especially the SDG 2 (Zero Hunger). These findings offer a practical and cost-effective pathway to reconcile crop production with environmental sustainability, providing an evidence base for more equitable and efficient global nitrogen management.

How to cite: Qiu, Z. and Gu, B.: Redistributing 14% of global nitrogen fertilizer use advances multiple Sustainable Development Goals, EGU General Assembly 2026, Vienna, Austria, 3–8 May 2026, EGU26-4749, https://doi.org/10.5194/egusphere-egu26-4749, 2026.

Nitrogen (N) addition from anthropogenic atmospheric deposition and fertilizer application is widely recognized to enhance terrestrial carbon (C) storage by alleviating ecosystem nutrient limitation. However, long-term N addition can also acidify soils and impair ecosystem functioning, an effect that is often overlooked in global assessments of terrestrial C cycling. Here, we performed a global meta-analysis to systematically quantify both the impacts of long-term N addition on soil pH and the responses of vegetation root growth and soil microbial respiration to soil pH changes. This data-driven understanding was then used to develop a parameterization for soil acidification and its impacts on vegetation and soil microbe within the C-N-coupled terrestrial biosphere model QUINCY. Model simulations show that present-day global N fertilization effects on terrestrial net ecosystem productivity (NEP) are around 240 Tg C yr-1, which are approximately 20% lower than the estimate when neglecting the long-term N-induced soil acidification. In the meanwhile, inclusion of soil pH effects increases the simulated soil carbon storage, consistent with patterns emerging from the meta-analysis. By explicitly incorporating soil acidification into terrestrial C–N interactions, our results reveal critical gaps in current representations of long-term ecosystem responses to N enrichment, with important implications for future sustainable N management and climate change mitigation.

How to cite: Gong, C. and Zaehle, S.: Overestimated nitrogen fertilization effects on global terrestrial carbon sinks due to neglect of long-term soil acidification, EGU General Assembly 2026, Vienna, Austria, 3–8 May 2026, EGU26-5298, https://doi.org/10.5194/egusphere-egu26-5298, 2026.

Nitrous oxide (N2O) production in the biosphere is traditionally attributed to microbial nitrification and denitrification. Recent studies suggest that N2O can be produced via chemodenitrification, i.e., the reduction of nitrite to N2O, which remains a major uncertainty in global N2O budget. By conducting 15N-tracer incubations, samples from a land–ocean continuum demonstrated that the significance of N2O production via chemodenitrification may be overlooked, particularly at metal-rich, acidic and anoxic conditions. Transition metals beyond iron, specifically manganese and zinc, drive abiotic N2O formation in both oxic and anoxic environments. And the rates are significantly enhanced under lower oxygen concentration. In natural estuarine waters, abiotic N2O production is modest but consistent (0.0001–0.0013 nmol N L-1 d-1). In contrast, acidic metal-rich mine wastewater stimulated abiotic N2O production up to 138 nmol N L-1 d-1. Furthermore, at the interface where mine drainage contaminating soils, N2O efflux reached 446 μmol N m-2 d-1, rivaling or exceeding emissions from many intensively managed croplands. In these hotspots, abiotic and biotic processes act in concert to sustain elevated N2O production, with microbial activity potentially modulating substrate availability for abiotic production. These findings highlight the necessity to integrate chemodenitrification into regional and global nitrogen assessments to improve the accuracy of N2O budget.

How to cite: Zheng, X. and Ji, Q.: Abiotic N2O Formation Across the Land–Ocean Continuum: An Overlooked Source of Nitrous Oxide via Abiotic Formation Across the Land–Ocean Continuum, EGU General Assembly 2026, Vienna, Austria, 3–8 May 2026, EGU26-6235, https://doi.org/10.5194/egusphere-egu26-6235, 2026.

EGU26-6898 | ECS | Posters on site | BG1.5

Using half-straw return to tackle trade-offs among Grain Yield, Multiple Soil Gas Emissions, and Soil Health in Rice-Based Rotations 

Jin Huang, Lanting Yue, Yuling Ding, Dianming Wu, and Zhimin Sha

Sustainable intensification of rice systems requires strategies that synergize productivity, environmental, and economic goals. This study presents a comprehensive, multi-dimensional evaluation of eight rice-based cropping systems (including straw-return and diversified green manure rotations) in the Yangtze River region, China. We uniquely integrated field measurements of greenhouse gases and reactive nitrogen (Nr) species (CH4, N2O, NH3, HONO) with agronomic and soil health indicators. The climate impacts were assessed using multi-temporal metrics (GTP20, GTP100). A Comprehensive Evaluation Index (CEI) quantified system-level synergies and trade-offs. The medium rate straw-return system (NPKS2) achieved the highest CEI score (0.63), representing the optimal balance among evaluated systems. A fundamental trade-off was identified: economic benefits and crop yield showed strong positive correlations with net GHG (r = 0.6 & 0.61, P ≤ 0.001) and Nr gas emissions (r = 0.54, P ≤ 0.001and r = 0.45, P ≤ 0.05, respectively), but were negatively linked to soil organic carbon (SOC) sequestration and biodiversity. This reveals an inherent conflict between short-term productivity and environmental sustainability. Critically, by including short-lived Nr species, our assessment shows that the climate impact is highly time-dependent. For instance, NH3-induced aerosol cooling offset 8–70% of N2O -induced warming over 20 years, but less than 0.1% over a century. We conclude that moving beyond single-gas or single-timescale assessments is essential to reveal the true costs and benefits of management practices, thereby informing strategies that are genuinely climate-smart and sustainable.

How to cite: Huang, J., Yue, L., Ding, Y., Wu, D., and Sha, Z.: Using half-straw return to tackle trade-offs among Grain Yield, Multiple Soil Gas Emissions, and Soil Health in Rice-Based Rotations, EGU General Assembly 2026, Vienna, Austria, 3–8 May 2026, EGU26-6898, https://doi.org/10.5194/egusphere-egu26-6898, 2026.

EGU26-7363 | Posters on site | BG1.5

Overestimation of indirect agricultural N2O fluxes from the groundwater due to neglect of nitrate attenuation  

Reinhard Well, Roland Fuß, Tim Wolters, and Maximilian Zinnbauer

To estimate N2O fluxes from groundwater due to N leaching from agricultural soils, an empirical parameter had been determined from the ratio of dissolved N2O-N to NO3--N (EF5(1), leading to a first estimate of IPCC-EF5g of 0.015 in 1998. While the data-set of dissolved N2O was steadily growing, the IPCC-EF5g was first lowered to 0.0025 in the 2006 guidelines, but raised back to 0.006 in the IPCC2019 guidelines based on a more recent review (Tian et al 2019). But it had previously been shown that the concept of EF5(1) must overestimate indirect N2O fluxes because it related N2O measured at a certain sampling point in groundwater to the NO3- concentration at that point (Well and Weymann, 2005). This neglects the fact that some of the NO3- leached to the groundwater surface is typically consumed by denitrification. Studies measuring N2O together with excess-N2 from denitrification and residual NO3- have shown that this overestimation can be highly relevant (Weymann et al., 2008). An alternative emission factor EF5(2) was thus proposed as the ratio between dissolved N2O-N and initial NO3--N, where the latter was calculated from the sum of excess N2 and residual NO3--N. Neglecting NO3- reduction in the EF5g concept had been justified by the wide lack of excess-N2 data in groundwater (Tian et al, 2019). But NO3- consumption in groundwater can also be estimated from the difference between NO3--N in leachate calculated from N budgets and the residual NO3--N in groundwater monitoring wells. For Germany, these data are widely available and could be used to correct current estimates of indirect N2O fluxes.

Here we present recalculations of indirect N2O fluxes using the EF5(2) concept. For the dataset of Tian 2019, we select data from regions where we can assume typical ranges of N fertilization together with the default IPCC factor for N leaching and typical ranges of seepage rates to estimate initial NO3--N at the groundwater surface. For Germany, we use respective data from inventories and spatial models. For both cases, indirect N2O fluxes based on EF5(1) and EF5(2) are compared. For Germany, we also estimate the lowering of currently reported indirect N2O fluxes with those based on EF5(2). We conclude that there is need for new research on indirect N2O fluxes from groundwater globally to avoid overestimation of this source.


References:


IPCC, 2019: 2019 Refinement to the 2006 IPCC Guidelines for National Greenhouse Gas Inventories, edited by E. Calvo Buendia, K. Tanabe, A. Kranjc, J. Baasansuren, M. Fukuda, S. Ngarize, A. Osako, Y. Pyrozhenko, P. Shermanau, and S. Federici, IPCC, Switzerland. 

Tian, L., Y. Cai and H. Akiyama (2019), Environmental Pollution 245: 300-306.

Well, R. and D. Weymann (2005), 4th International Symposium on non-CO2/ greenhouse gases (NCGG-4), science, control, policy and implementation, Utrecht, Netherlands, 4-6 July 2005: 129-136.

Weymann, D., R. Well, H. Flessa, C. von der Heide, M. Deurer, K. Meyer, C. Konrad and W. Walther (2008). Biogeosciences 5(5): 1215-1226.

How to cite: Well, R., Fuß, R., Wolters, T., and Zinnbauer, M.: Overestimation of indirect agricultural N2O fluxes from the groundwater due to neglect of nitrate attenuation , EGU General Assembly 2026, Vienna, Austria, 3–8 May 2026, EGU26-7363, https://doi.org/10.5194/egusphere-egu26-7363, 2026.

Nitrogen (N) is an essential element for life and a fundamental regulator of terrestrial ecosystem productivity, carbon sequestration, and climate feedbacks, yet it remains one of the most weakly constrained and uncertain components of Earth system models. Despite major advances in terrestrial biosphere modeling, large discrepancies persist in how models represent nitrogen inputs, internal cycling, losses, and their coupling to the carbon and water cycles. Here we present the first comprehensive, process-resolved benchmark of the global terrestrial nitrogen cycle based on coordinated simulations from the Nitrogen Model Intercomparison Project Phase 3 (NMIP3) combined with multiple independent observational constraints.

We trace the full nitrogen cascade across land ecosystems—from natural and anthropogenic inputs (biological nitrogen fixation, atmospheric deposition, and fertilizer and manure application), through plant uptake and soil–microbial transformations, to hydrological export to inland waters and gaseous losses to the atmosphere (N₂O, NH₃, NO, and N₂). This integrated framework allows us to evaluate not only individual fluxes and pools, but also the internal consistency of regional and global nitrogen budgets and their emergent coupling with carbon cycling.

Across models, we find broad agreement in the magnitude of total nitrogen inputs and in first-order global spatial patterns. However, models diverge strongly in how nitrogen is partitioned among vegetation, soils, and loss pathways. The largest spreads occur in biological nitrogen fixation, soil nitrogen turnover, nitrate leaching, and gaseous emissions, producing substantial inconsistencies in regional budget closure and large uncertainty in carbon–nitrogen feedback strength. These discrepancies are especially pronounced in intensively managed agricultural regions and climate-sensitive ecosystems, including the tropics and high latitudes, and they propagate directly into uncertainty in the magnitude and spatial distribution of the terrestrial carbon sink.

By systematically comparing model structures and process representations, we diagnose the dominant sources of these divergences and show that a small number of key processes control most of the uncertainty. Our analysis demonstrates that improving the representation and observational constraint of biological nitrogen fixation, soil organic matter turnover, and coupled nitrification–denitrification pathways can substantially reduce uncertainties in nitrogen budgets, N₂O and NH₃ emissions, and land carbon sink estimates.

More broadly, this work establishes a community framework for nitrogen cycle benchmarking that moves the field from qualitative model intercomparison toward quantitative, process-level accountability. Our results show that coordinated benchmarking can transform nitrogen–carbon–climate projections into more robust and policy-relevant tools, with direct implications for climate mitigation, air and water quality management, and integrated carbon–nitrogen stewardship.

How to cite: Tian, H. and the NMIP3 Participants: Where Does the Nitrogen Go? Model Intercomparison and Benchmarking of the Global Terrestrial Nitrogen Cycle and Carbon–Nitrogen Interactions, EGU General Assembly 2026, Vienna, Austria, 3–8 May 2026, EGU26-7379, https://doi.org/10.5194/egusphere-egu26-7379, 2026.

EGU26-7384 | ECS | Orals | BG1.5

Price-based nitrogen mitigation from global croplands with uneven regional responses 

Weichen Huang, Jinfeng Chang, Stefan Frank, David Leclere, Marta Kozicka, Petr Havlík, and Feng Zhou

Anthropogenic nitrogen (N) losses from croplands have risen alongside global food production and are a major driver of transgressed planetary boundaries. Price-based policy instruments are widely proposed to curb agricultural nitrogen pollution, yet their effectiveness and distributional consequences under market feedbacks remain insufficiently understood. Here we assess the global impacts of nitrogen pricing on cropland N losses, food security and economic outcomes. We extend the global land-use model GLOBIOM by endogenizing crop- and country-specific nitrogen balances and explicitly representing multiple N-loss pathways. Field-level mitigation technologies are incorporated, with adoption governed by marginal abatement costs, yield effects and economic affordability, allowing nitrogen taxation and subsidies to interact with production decisions, land allocation and international trade. Without additional intervention, global cropland N losses increase by 28% by 2050 relative to 2020. Nitrogen taxation reverses this trend, reducing N losses by 22% (12–29%) compared with business as usual, but at the cost of higher food insecurity. Field-level mitigation technologies provide a critical buffer, delivering additional abatement and offsetting nearly one-third of the food-security losses induced by taxation. In contrast, mitigation subsidies implemented alone yield limited net mitigation, as technology-driven reductions are partly offset by subsidy-induced cropland expansion. Combining taxation, subsidies and technologies yields the most balanced outcome, reducing global N losses by 23 Tg N by 2050 while moderating food-security impacts. Responses to nitrogen pricing vary strongly across regions. Under the combined policy scenario, South Asia, East Asia and Europe together account for about 58% of global mitigation, but through distinct pathways. Economically resilient regions mainly achieve mitigation through higher adoption of field-level technologies and declines in N-loss intensity, with mitigation shares exceeding their emission shares. Less affluent regions rely more on trade adjustments, shifting part of the mitigation burden to exporting regions through virtual N flows. These contrasts translate into marked distributional effects: technologies and subsidies offset more than half of taxation-induced farmer revenue losses in high-income regions, whereas buffering effects remain limited in some low-income regions, with mitigation costs increasingly borne by consumers and governments. Overall, price-based nitrogen mitigation can halt the long-term rise in global N pollution, but its effectiveness and equity critically depend on technology deployment and policy design and must be aligned with broader food-system transformations.

How to cite: Huang, W., Chang, J., Frank, S., Leclere, D., Kozicka, M., Havlík, P., and Zhou, F.: Price-based nitrogen mitigation from global croplands with uneven regional responses, EGU General Assembly 2026, Vienna, Austria, 3–8 May 2026, EGU26-7384, https://doi.org/10.5194/egusphere-egu26-7384, 2026.

EGU26-8421 | ECS | Posters on site | BG1.5

Large differences in variability between land surface models (LPJ-GUESS and ORCHIDEE) and inventory estimates: N₂O emissions and emission factors in Italy 

Tan J.R. Lippmann, Fredrik Lagergren, Kim Naudts, Anna Maria Jönsson, and Angela Fiore

In recent years, emission factors published by the Intergovernmental Panel on Climate Change (IPCC) are widely used by national inventory compilers as a Tier 1 methodology for estimating N2O emissions at national levels. Whilst emission factors are straightforward to implement and offer several practical advantages, conventional emission factors tend not to account for the impacts of interannual climatic variability or spatial heterogeneity.

To investigate the added value of using spatially and temporally explicit processes included in land surface models, we assess the spatial and temporal variability of N2O emissions associated with land management and extreme weather events over Italy for the 2010-2021 period. We compare N2O emissions and N2O emission factors estimated from two process-based land surface models, LPJ-GUESS and ORCHIDEE, against those estimated using national inventory data and published emission factors from IPCC guidelines.

Inventory-derived emissions do not show a trend over the study period and have limited interannual variation. In contrast, both models show a positive trend in emissions over the study period with interannual variability that extends well beyond the variability suggested by the inventory. We investigate the variability in emissions simulated by both models and assess whether this is indicative of a sensitivity to climate that is largely muted in IPCC based emission factors.

Both models show higher emissions from croplands than grasslands (total and per square meter) but higher emission factors from grasslands than croplands, indicating that the addition of (organic) fertilisers to pastures is more likely to be emitted as N2O emissions than the same fertiliser added to croplands. We discuss key structural difference in how the models treat grasslands and pastures and how these discrepancies underscore the simplifications present in land surface model representations of these systems, especially regarding grazing, harvests, and manure management.

The substantial interannual variability in emission factors produced by both models exceed those estimated by inventory estimates and indicated by IPCC emission factors. These temporal patterns highlight the potential relevance of considering climate anomalies when using emission-factor methodologies, particularly with the increasing occurrence of extreme climate events.

How to cite: Lippmann, T. J. R., Lagergren, F., Naudts, K., Jönsson, A. M., and Fiore, A.: Large differences in variability between land surface models (LPJ-GUESS and ORCHIDEE) and inventory estimates: N₂O emissions and emission factors in Italy, EGU General Assembly 2026, Vienna, Austria, 3–8 May 2026, EGU26-8421, https://doi.org/10.5194/egusphere-egu26-8421, 2026.

EGU26-10815 | ECS | Posters on site | BG1.5

Integrated environmental thresholds for nitrogen in China 

Jingwen Huang, Chaopu Ti, João Serra, Xiaoyuan Yan, and Klaus Butterbach-Bahl

The environmental problems caused by the overuse of nitrogen (N) fertilizer is well recognized. However, the complexity of the N cycle and its multiple pollution pathways have hindered the quantification of a safe operating space for N fertilizer use in China. We used a modeling approach and environmental thresholds for N deposition, N concentrations in surface water and groundwater, as well as for ammonia (NH3) volatilization and nitrous oxide (N2O) emissions to assess spatial patterns and quantify N use mitigation goals for different regions in China.

At the national scale, the results indicate that the safe operating space for N use can be achieved if total N deposition is reduced to 5.2 Tg N yr-1, total loading of N to surface water and groundwater are reduced to 5.4 and 13.9 Tg N yr-1, respectively, and total NH3 volatilization and N2O emissions are below 5.3 and 0.6 Tg N yr-1, respectively. Meeting these thresholds would require reductions of approx. 22%, 44%, 11%, 48%, and 30%, respectively. In total, this amounts to a reduction of 12.5 Tg N yr-1, or a 29% decrease from current levels of N inputs to the environment. Specifically, central China and southern China require higher emission reductions to meet the thresholds, particularly in provinces such as Henan, Shandong, and Sichuan. This study is the first to integrate multiple N indicators to determine a national reduction target for China. This approach provides a scientific basis for improving N management, mitigating its environmental impacts and identifying regional “low-hanging fruits” where targeted reductions could yield the greatest environmental benefits.

How to cite: Huang, J., Ti, C., Serra, J., Yan, X., and Butterbach-Bahl, K.: Integrated environmental thresholds for nitrogen in China, EGU General Assembly 2026, Vienna, Austria, 3–8 May 2026, EGU26-10815, https://doi.org/10.5194/egusphere-egu26-10815, 2026.

EGU26-11153 | Posters on site | BG1.5

Evaluation of the Nitrogen Cycle in the Land Surface Model of CNRM 

Jeanne Decayeux, Christine Delire, and Bertrand Decharme

Earth system models (ESMs) need to include nutrient limitation to predict realistic land carbon (C) uptake. In particular, Nitrogen (N) is a critical nutrient, that controls photosynthesis and decomposition processes. We have implemented an explicit N cycle in the land component of the CNRM-ESM model. Here we present an evaluation of the model using data from the Free-Air CO2 Enrichment (FACE) experiments conducted over 10 years in North America. We compare the reference version of the model without the N cycle (C) to the new version in which it is included (CN). We investigate the response of the Net Primary Prodcution (NPP) to elevated CO2 and confront our results to a multi-model analysis carried out on these two sites. Our results fall in the inter model range. We show that the CN version of the model performs better than the C version because NPP is reduced by N limitation. In the literature, diverging strategies are observed to overcome N limitation. We analyse the simulated N dynamics and show that the model reproduces well the main features but fails to represent some sites characteristics.

How to cite: Decayeux, J., Delire, C., and Decharme, B.: Evaluation of the Nitrogen Cycle in the Land Surface Model of CNRM, EGU General Assembly 2026, Vienna, Austria, 3–8 May 2026, EGU26-11153, https://doi.org/10.5194/egusphere-egu26-11153, 2026.

EGU26-14527 | ECS | Orals | BG1.5

Reconciling bottom-up and top-down N2O emission inventories for Germany, Switzerland and the UK  

Clemens Weber, Benjamin Wolf, Leilee Chojnacki, Clemens Scheer, Ralf Kiese, David Kraus, Edwin Haas, Andrew Smerald, Daniela Brito Melo, Stephan Henne, Alistair Manning, Alison Redington, Alice Ramsden, Peter Andrews, Emanuele Lugato, Helene De Longueville, Alexandre Danjou, Brendan Murphy, and Anita Ganesan

Nitrous oxide (N2O) is a major GHG and ozone-depleting substance which is produced by microbial processes in soils, with mineral nitrogen availability, carbon availability, soil moisture, soil temperature, oxygen availability and pH being important controlling factors. Emissions of N2O are notorious for being short-lived with the magnitude of emissions being difficult to predict due to the interplay of the aforementioned controlling factors. In Europe, the major share of anthropogenic N2O emissions result from fertilizer application to agricultural land. National reporting typically relies on so-called Tier 1 or 2 approaches which relate activity data (N inputs) to an emission factor to estimate a national total. However, this method does not consider the full set of spatially and temporally varying controlling factors, so that the latter approaches may be biased. For this reason, reconciliation with an independent, top-down method has large potential to improve national GHG budgets and to review mitigation strategies.

Here we present results from the Horizon Europe project Process Attribution of Regional emISsions (PARIS), where we calculate bottom-up and top-down N2O emission inventories for Germany, the UK and Switzerland at monthly time resolution for the timeframe 2018 – 2024. Bottom-up estimates are obtained using the biogeochemical model LandscapeDNDC and state-of-the-art European datasets. Top-down estimates are averaged results from three different inverse modeling systems: InTEM (UK MetOffice), RHIME (University of Bristol), ELRIS (EMPA) and two different atmospheric transport models: NAME-UM and FLEXPART-ECMWF.

We find the emission estimates from both top-down and bottom-up methods to be consistently higher than the corresponding national inventories, but bottom-up approaches are within the uncertainty of the top-down estimate. In terms of seasonality, bottom-up and top-down methods indicate a seasonal cycle, although its magnitude is country dependent. Across all countries, the discrepancy between bottom-up and top-down estimates is greatest in autumn, where LandscapeDNDC predicts an emission peak following planting of winter crops. Discrepancies regarding magnitude and seasonality of top-down and bottom-up approaches will be discussed considering controlling factors for N2O emissions simulated using LandscapeDNDC.

How to cite: Weber, C., Wolf, B., Chojnacki, L., Scheer, C., Kiese, R., Kraus, D., Haas, E., Smerald, A., Brito Melo, D., Henne, S., Manning, A., Redington, A., Ramsden, A., Andrews, P., Lugato, E., De Longueville, H., Danjou, A., Murphy, B., and Ganesan, A.: Reconciling bottom-up and top-down N2O emission inventories for Germany, Switzerland and the UK , EGU General Assembly 2026, Vienna, Austria, 3–8 May 2026, EGU26-14527, https://doi.org/10.5194/egusphere-egu26-14527, 2026.

Nitrous oxide (N2O) emissions from agricultural soils vary greatly in time and space, rendering detailed quantification challenging. Process models that have been used for that purpose are challenged by high computing resources and duration of model runs while providing modest improvement over data-driven approaches. In addition to the well-confirmed dependence on nitrogen input that also provides the basis for the IPCC emission factor to be applied to agricultural soils, multiple studies denoted a non-linear effect, such that excess fertilization provides over-proportionally high emissions. Directed towards effect-based consideration of sources and in order to better reflect mitigation measures, we have revised the N2O emissions calculation methodology for IIASA’s GAINS model to cover such non-linearities, which requires spatially explicit accounting of inputs and emissions. In a first step, emission sources (mineral N fertilizer application and manure N application taken from GAINS) were distributed on a 5’ grid globally using harvested areas from the M3 crop map and the gridded livestock of the world dataset, both updated using annual EUROSTAT data on NUTS2 level (for Europe) and FAOSTAT data for the rest of the world. In a second step, a data-driven approach was chosen reflecting enhanced emissions based on excessive nitrogen application to calculate N2O emissions. The spatially explicit representation of emissions allows to discern sub-regional hot spots of particularly high impact of this non-linearity such as the Indo-Gangetic plain in South Asia, Egypt’s Nile delta, the Yangtse river delta in China, with Northern France or also the Brazilian North-East tip to follow. Automatizing the calculations facilitates the development of a time series as well as the analysis of individual sources of nitrogen and different scenarios. Scenario analysis identifies the value of efficient N abating measures even before applying specific N2O reduction technology. These improvements in depicting N2O emissions in GAINS enhance the analysis of sub-regional emission patterns. Furthermore, they offer to cost-effectively address emission hotspots in more focused emission reduction policies and provide the foundation for fully assessing the impact of N2O abatement policies, both retroactively and in emission projections.

How to cite: Kaltenegger, K. and Winiwarter, W.: Global analysis of N2O emissions from agricultural soil surfaces considering non-linearity effects for the GAINS model, EGU General Assembly 2026, Vienna, Austria, 3–8 May 2026, EGU26-17628, https://doi.org/10.5194/egusphere-egu26-17628, 2026.

EGU26-18329 | ECS | Orals | BG1.5

Impact of Past and Future Nitrogen Deposition Pathways on the Terrestrial Carbon Sink and N2O emissions 

Jialin Deng, Cheng Gong, Jan Engel, Julia Nabel, Karolina Slominska-Durdasiak, Georgii Nerobelov, Hideki Ninomiya, Lin Zhang, and Sönke Zaehle

Atmospheric nitrogen deposition has long been recognized as an important external driver of terrestrial carbon uptake by alleviating ecosystem nitrogen limitation. However, it also enhances terrestrial nitrous oxide (N2O) emissions, leading to a potential climate trade-off under future mitigation pathways. Despite extensive research, the relative roles of anthropogenic emissions and climate change in regulating nitrogen deposition and their impacts on the terrestrial carbon sink and N2O emissions remain poorly constrained at the global scale. Here, we quantify the impacts of past and future nitrogen deposition pathways on terrestrial carbon cycling and N2O emissions from 1850 to 2100 by generating historical and future nitrogen deposition scenarios with the GEOS-Chem atmospheric chemistry transport model under the SSP1-2.6 and SSP3-7.0 pathways. We use these data and climate forcing from ISIMIP to drive a global carbon-nitrogen cycle model (ICON-Land in QUINCY configuration) in a factorial design to isolate climate and emission effects, while keeping the land cover fixed at 2014 land use conditions.

We find that increasing nitrogen deposition during the historical period (1850–2014) substantially enhanced terrestrial carbon uptake – contributing approximately 0.15 Pg C yr-1 to the global land carbon sink – but also accounted for about 0.82 Tg N yr-1 of terrestrial N2O emissions. In the future period (2015-2100), declining nitrogen deposition under strong mitigation (SSP1-2.6) leads to a decline of the terrestrial carbon sink and a reduction of terrestrial N2O emissions, whereas elevated nitrogen deposition under weak mitigation (SSP3-7.0) enhances both terrestrial carbon sequestration and N2O emissions. Climate change further modulates these responses by altering nitrogen deposition patterns, amplifying both positive and negative feedbacks. These results highlight a fundamental trade-off within the nitrogen–carbon–climate system and underscore the importance of explicitly representing nitrogen processes in earth system carbon budget assessments and mitigation strategies.

How to cite: Deng, J., Gong, C., Engel, J., Nabel, J., Slominska-Durdasiak, K., Nerobelov, G., Ninomiya, H., Zhang, L., and Zaehle, S.: Impact of Past and Future Nitrogen Deposition Pathways on the Terrestrial Carbon Sink and N2O emissions, EGU General Assembly 2026, Vienna, Austria, 3–8 May 2026, EGU26-18329, https://doi.org/10.5194/egusphere-egu26-18329, 2026.

EGU26-18454 | ECS | Posters on site | BG1.5

Improving the representation of NOx emissions from soils in the LMDZORINCA model for global chemistry and climate purposes 

Nikhil Hanig, Juliette Lathiere, Nicolas vuichard, David Simpson, Anne Cozic, and Didier Hauglustaine

Nitrogen oxides (NOₓ ≡ NO + NO₂) play a central role in atmospheric chemistry, with direct impacts on human health through respiratory stress and indirect effects on climate via tropospheric ozone production, methane lifetime, and secondary aerosol formation. To study the impacts of NOₓ emissions on the atmospheric chemistry and the climate, we developed a version of the LMDZORINCA Chemistry-Transport model in which soil NOₓ emissions are computed by the ORCHIDEE land surface model, in complement of anthropogenic emissions provided by inventory data.

Current estimates place global total NOx emissions at about 45–50 Tg N yr⁻¹, dominated by fossil fuel combustion. Soils are a substantial source of NOₓ, with global emissions estimated at ~10–15 Tg N yr⁻¹, of which ~3 Tg N yr⁻¹ are attributable to fertilizer and manure inputs, the remainder arising from natural processes. Due to air-quality and climate policies reducing NOₓ emissions from transport and industrial sectors, the relative importance of soil NOₓ emissions is expected to further increase in the future. Currently, most atmospheric chemistry models take into account agricultural soil NOₓ emissions, using inventory-based approaches. These inventories rely on fixed emission factors or highly simplified parameterizations to calculate NOₓ emissions from nitrogen inputs, thereby neglecting, or overly simplifying, the strong non-linear dependence of emissions on climate, soil biogeochemistry, and vegetation type. Furthermore, natural soil NOₓ emissions are often neglected or calculated using simplified parametrizations.

In this work, we use soil NOₓ emissions estimated by the ORCHIDEE terrestrial biosphere model as an input to the LMDZINCA atmospheric chemistry model. ORCHIDEE simulates the carbon-nitrogen cycle as well as soil microbial nitrification and denitrification processes, thus offering a mechanistic and ecologically grounded description of soil NOₓ emissions. We first evaluate ORCHIDEE soil NOX emissions against three different datasets : CAMS-GLOB-SOIL product, which is based on empirical parametrizations, the inventory-derived dataset for anthropogenic NOₓ emissions CEDS, and the DESCO dataset using top-down constraints from satellite-based NO2. In the current configuration of LMDZINCA, soil NOₓ emissions are based on the CEDS anthropogenic emission inventory, therefore not taking into account NOₓ emissions from natural soils. Replacing these current CEDS soil NOₓ emissions with ORCHIDEE soil NOₓ emission includes the very substantial natural soil NOₓ component which has previously not been accounted for in LMDZINCA. The resulting changes on atmospheric NO2 in recent years are then analysed and compared with satellite derived NO2 columns from OMI and TROPOMI. These differences of soil NOX emissions and resulting tropospheric NO2 changes are studied over the last two decades.

The offline implementation of ORCHIDEE soil NOₓ in LMDZINCA represents a first step toward a fully coupled nitrogen cycle within the IPSL framework, enabling future assessments of feedbacks between terrestrial and atmospheric nitrogen reservoirs.

How to cite: Hanig, N., Lathiere, J., vuichard, N., Simpson, D., Cozic, A., and Hauglustaine, D.: Improving the representation of NOx emissions from soils in the LMDZORINCA model for global chemistry and climate purposes, EGU General Assembly 2026, Vienna, Austria, 3–8 May 2026, EGU26-18454, https://doi.org/10.5194/egusphere-egu26-18454, 2026.

EGU26-20535 | ECS | Posters on site | BG1.5

Long-term trends in Net Nitrogen Inputs across the Yangtze River Basin and large-scale management implications 

Weijia Wen, James White, Biqing Xia, Yanhua Zhuang, Wangzheng Shen, David Hannah, and Liang Zhang

Anthropogenic transformations to river systems are profoundly altering basin-scale nitrogen cycling globally, leading to long-term nitrogen accumulation that poses persistent and episodic threats to downstream water quality. Net nitrogen input (NNI) is a key integrative indicator that quantifies the cumulative influence of human activities on nitrogen budgets. This study constructed a comprehensive spatiotemporal NNI dataset for the Yangtze River Basin (YRB) between 1980-2020 and systematically examined its temporal dynamics, source composition, and landscape-driven controls. Results show that basin-wide NNI in the YRB followed a distinct three-stage trajectory during 1980–2020, characterized by a rapid increase, a high-level plateau, and a subsequent partial decline. Average NNI intensity typically increased along an upstream-downstream gradient, primarily governed by intense nitrogen fertilizer use and dense population pressures. Trend analyses revealed strong spatial asynchrony in NNI evolution, whereby: the downstream basin exhibited the earliest plateauing effect (c. 1994); the midstream basin experienced the longest period of sustained accumulation (1995–2010); and the upstream basin, despite possessing the lowest average NNI overall, displayed the fastest growth rate that highlights emerging nitrogen management challenges in upstream regions. Machine learning analyses demonstrated that these trends were primarily driven by agricultural land cover, whereas urban land and water bodies also exerted strong but nonlinear controls on long-term NNI evolution. This study thus provides novel and unique insights into long-term, large-scale nitrogen fluxes operating across one of the world’s mega-basins. By characterizing anthropogenic pressures governing these trends, this research could help underpin effective nutrient management efforts in the Yangtze River Basin and beyond.

How to cite: Wen, W., White, J., Xia, B., Zhuang, Y., Shen, W., Hannah, D., and Zhang, L.: Long-term trends in Net Nitrogen Inputs across the Yangtze River Basin and large-scale management implications, EGU General Assembly 2026, Vienna, Austria, 3–8 May 2026, EGU26-20535, https://doi.org/10.5194/egusphere-egu26-20535, 2026.

EGU26-22032 | ECS | Orals | BG1.5

Anthropogenic Perturbations of Nitrogen Cycling and Budgets Across the Land–Inland Water Continuum: Insights from ORCHIDEE3_Nlat  

Minna Ma, Nicolas Vuichard, Haicheng Zhang, Tao Huang, and Pierre Regnier

Quantifying lateral nitrogen (N) transfers and riverine N2O emissions is essential for closing the global N budget. We present ORCHIDEE3-Nlat, which couples lateral N routing with ORCHIDEE3 to simulate NH4+, NO3-, and DON fluxes through the land ocean aquatic continuum, from canopy to ocean. Aquatic transformations, including nitrification, denitrification and DON decomposition, occur within the routing framework, and riverine N2O emission is estimated to using an emission-factor scheme tied to nitrification and denitrification rates. Evaluation against global observation-based datasets shows that the model reproduces the global magnitudes and broad spatial patterns of DIN and DON concentrations and fluxes, as well as N2O emission rates across major river systems spread across the world. The model was then applied to reconstruct the historical evolution (1901–2020) of global N lateral transfers from land to rivers, and ultimately to the ocean, together with associated N2O emissions. Globally, DIN inflow to rivers and export to oceans increased by ~245% and ~151% from 1901–1920 to 2001–2020, whereas DON increased more modestly (~38% and ~32%), implying a century-scale shift towards inorganic N cycling. Riverine N2O emissions increased substantially, with a strong acceleration after the mid-1960s, with contemporary hotspots in intensively managed subtropical regions. Attribution analysis indicates that DIN trends were dominated by atmospheric deposition and sewage injection before the 1960s, while fertilizer inputs dominated the increase after the 1960s. The analysis also revealed that due to the fertilization effect on vegetation, increasing atmospheric CO2 decreased the DIN exports to the global river network. In contrast, DON variability and trends were governed primarily by manure application and hydroclimate, showing weaker sensitivity to anthropogenic N inputs than for DIN. Together, these results provide a comprehensive picture of how human activities have reshaped riverine N composition, downstream N export, and the spatial distribution of N2O emissions over the twentieth century, offering a robust baseline for global N-cycle assessments and mitigation planning.

How to cite: Ma, M., Vuichard, N., Zhang, H., Huang, T., and Regnier, P.: Anthropogenic Perturbations of Nitrogen Cycling and Budgets Across the Land–Inland Water Continuum: Insights from ORCHIDEE3_Nlat , EGU General Assembly 2026, Vienna, Austria, 3–8 May 2026, EGU26-22032, https://doi.org/10.5194/egusphere-egu26-22032, 2026.

EGU26-128 | ECS | Posters on site | BG1.6

Sources and formation pathways of particulate nitrate over the western India: Insights through δ15N and δ18O isotopes 

Chandrima Shaw, Neeraj Rastogi, Ritwick Mandal, and Prasanta Sanyal

Oxides of Nitrogen (NOx) are key precursors of tropospheric ozone and particulate nitrate (NO3-), both of which contribute to air quality degradation and climate forcing. NOx is oxidized to nitric acid (HNO3), which partitions into particulate NO3-, an important component of PM2.5. The formation of HNO3 and ultimately NO3- occurs through multiple chemical pathways and is influenced by atmospheric chemistry as well as meteorological parameters like temperature, relative humidity, and boundary layer dynamics. India has been recognised a global hotspot for NOx emission, owing to rapid urbanization and population growth. Major sources of NOx include emissions from traffic, agriculture, biomass burning, and combustion. Despite being a major contributor of NOx, large uncertainties exist in regional emission inventories due to limited observational constraints. Stable isotopic signature of particulate NO3- serves as an excellent tool to understand its formation pathways and sources of its precursor.  Here, we have applied a dual-isotope (δ15N and δ18O) approach to understand seasonal and diurnal variations in NO3- formation pathways and NOx sources over Ahmedabad, an urban megacity in western India, during winter and summer. In winter, overall particulate NO3- formation was driven mainly by the OH oxidation pathway (P1, 61.9 ± 7%) and N2O5 hydrolysis (P2, 24.6 ± 6%), with smaller contributions from VOC-derived (P3, 7.6 ± 4%) and ClNO2 pathways (P4, 5.9 ± 3%). However, strong diurnal contrasts were evident, with P1 accounting for 69.4 ± 5% during the day and P2 increasing to 32.8 ± 7% at night, reflecting enhanced photochemical activity during day and nocturnal buildup of N2O5 under cooler, low-light conditions at night. In summer, NO3- formation was dominated by the OH pathway throughout the day and night (67.5 ± 7%), with no significant diurnal variability. This seasonal shift was attributed to elevated boundary layer height and enhanced atmospheric mixing, which stabilized particulate NO3-, which was particularly associated with stable non-volatile cations. Source apportionment of NOx using the Bayesian model (MixSIAR) revealed no significant diurnal differences within either season; however, a distinct seasonal pattern in NOx sources was observed. In winter, traffic was the largest contributor (46.7 ± 19%), followed by soil emissions (24.4 ± 12%), biomass burning (18.0 ± 9%), and coal-fired power plants (10.9 ± 8%). In summer, soil-related emissions increased to 38.4 ± 12% due to temperature-enhanced microbial activity and volatilization from urban waste, livestock areas, and fertilized land, while traffic remained a dominant source (40.1 ± 17%). Biomass burning and power plant contributions remained lower but persistent across both seasons. Together, these results provided the first dual-isotope-based evidence from western India showing how meteorology and emission processes jointly influence NO3- formation and NOx source, thus offering critical observational insight needed to improve regional nitrogen budgets and air quality mitigation strategies.

How to cite: Shaw, C., Rastogi, N., Mandal, R., and Sanyal, P.: Sources and formation pathways of particulate nitrate over the western India: Insights through δ15N and δ18O isotopes, EGU General Assembly 2026, Vienna, Austria, 3–8 May 2026, EGU26-128, https://doi.org/10.5194/egusphere-egu26-128, 2026.

EGU26-914 | ECS | Posters on site | BG1.6

Nitrogen air pollution concerns for Nepal’s forested ecosystems and lichen bioindicators  

Suman Prakash Pradhan, Christopher J Ellis, Ajinkya G Deshpande, Yuanlin Wang, Massimo Vieno, Matthew R Jones, Sanjeev Kumar Rai, Nani Raut, Gothamie Weerakoon, David S Stevenson, and Mark A Sutton

Excessive reactive nitrogen (Nr) is a growing challenge for sensitive terrestrial habitats like forests. Nepal is experiencing threats of nitrogen (N) pollution largely transported from the Indo-Gangetic Plain (IGP) – a global nitrogen pollution hotspot – which affects biodiversity, ecosystem functioning and human health. This urges the quantification of the impacts of those pollutants in the Himalayan region. Our analysis, based on the atmospheric chemistry transport model (European Monitoring and Evaluation Programme-Weather Research and Forecasting 2010 emission with 2018 chemistry and meteorology) with land use land cover and digital elevation model, shows that 95-99% of Nepal’s forests have already exceeded the United Nations Economic Commission for Europe (UNECE)-recommended ammonia (NH3) critical levels and N critical loads. Overall, ammonia (NH3) (0.54-13.13 μg m–3) and nitrogen oxides (NOx; 0.05-13.64 μg m–3) concentrations are higher at low elevation forests, but a contrasting pattern of bulk N deposition (4.52-38.56 kg N ha–1 yr–1) is observed in forests along the elevation gradients and forest types. Wet deposition of N is exceptionally high in forested areas receiving high precipitation, but dry deposition is heterogeneously distributed over different parts of the country. The forests in the lowland Tarai and Mid-hills that are near IGP are exposed to high concentrations of NH3 and NOx – thus are at a higher risk of biodiversity loss. Contributing only small shares, deciduous and needleleaf forests are vulnerable to N pollution as they cover the subtropical to subalpine region of the Mid-hills and host most of the sensitive species like lichens. This demonstrates a serious concern of N pollution on biodiversity and ecosystem services in the region. The empirical testing of N impacts on Nepal’s forested ecosystems is now crucial to establish the field-based toxicity threshold of N-based pollutants for biodiversity conservation and policy negotiation.

How to cite: Pradhan, S. P., Ellis, C. J., Deshpande, A. G., Wang, Y., Vieno, M., Jones, M. R., Rai, S. K., Raut, N., Weerakoon, G., Stevenson, D. S., and Sutton, M. A.: Nitrogen air pollution concerns for Nepal’s forested ecosystems and lichen bioindicators , EGU General Assembly 2026, Vienna, Austria, 3–8 May 2026, EGU26-914, https://doi.org/10.5194/egusphere-egu26-914, 2026.

EGU26-1215 | ECS | Orals | BG1.6

Site-Calibrated LandscapeDNDC Modeling of Yield-Scaled N₂O Emissions from Smallholder Cropping Systems in Sub-Saharan Africa 

Mary Grace Barbacias, Klaus Butterbach-Bahl, and Jaber Rahimi

Sub-Saharan Africa (SSA) faces a critical dilemma: how to close yield gaps and ensure food security while minimizing agriculture's climate footprint. While nitrogen (N) fertilisation is essential for boosting crop productivity, it can also lead to increased nitrous oxide (N₂O) emissions, thereby further fueling climate change. SSA is highly vulnerable to changes in climate. Yield-scaled N₂O emissions offer a framework to evaluate agricultural climate efficiency, but regional estimates require robust modeling approaches that are calibrated to local conditions. Here, we calibrated LandscapeDNDC, a process-based biogeochemical model, using the most comprehensive dataset on N2O emissions and yields as obtained from 25 field experiments conducted across 12 locations in SSA. These experiments focused on the dominant food crops of maize, sorghum, millet, and rice, and legumes (soybeans and beans). Site-specific parameterization was achieved through Latin hypercube sampling via SPOTPY-LDNDC, followed by validation against an independent dataset of 256 treatment-years across 44 sites representing SSA's major agroecological zones. We assessed the model’s performance in terms of absolute N₂O emissions, yields, and yield-scaled emissions (YSE). We then applied sensitivity analysis to identify the primary drivers of emission variability. Our results show that LandscapeDNDC effectively captures the variability in N₂O and YSE across various cropping systems, highlighting its potential as a tool for national and regional GHG inventories. This could be an efficient way to improve greenhouse gas inventories, enabling better-targeted mitigation and sustainable intensification strategies.

How to cite: Barbacias, M. G., Butterbach-Bahl, K., and Rahimi, J.: Site-Calibrated LandscapeDNDC Modeling of Yield-Scaled N₂O Emissions from Smallholder Cropping Systems in Sub-Saharan Africa, EGU General Assembly 2026, Vienna, Austria, 3–8 May 2026, EGU26-1215, https://doi.org/10.5194/egusphere-egu26-1215, 2026.

EGU26-1371 | ECS | Orals | BG1.6

Hidden source of nitrate fuel benthic denitrification in the anoxic monimolimnion of a deep meromictic lake. 

Leonardo Morini, Marta Lidia Sudo, Diana Marcela Arroyave-Gomez, Monia Magri, Sara Benelli, Ugo Marzocchi, Giuseppe Castaldelli, and Marco Bartoli

Deep meromictic lakes are anoxic below the chemocline and accumulate chemically reduced solutes in bottom waters. In the 120 m deep meromictic Lake Idro (Italy), nitrate is almost completely consumed at the chemocline depth, yet measurable concentrations (≈ 3 μM NO₃⁻) are consistently found in the sulphide-rich bottom water and surficial sediment. Under strongly reducing conditions, nitrate is expected to be rapidly consumed as evidenced by measured denitrification rates, and its presence suggests the existence of a hidden source.

Two potential nitrate sources were hypothesized: (i) the oxidation of NH₄⁺ to NO₃⁻ via manganese oxides (MnOx) as the lake sediment is rich in Mn; and (ii) allochthonous inputs, supported by nitrate-rich sinking particles.

To test the first hypothesis, potential nitrification was measured in sediment slurry incubations amended with ¹⁵NH₄⁺ and MnOx. These experiments showed no clear evidence of NH₄⁺ oxidation, indicating that Mn-driven nitrification is unlikely to sustain the observed nitrate pool. The analyses of intracellular nitrate storage revealed nitrate concentrations an order of magnitude higher than the dissolved fraction, suggesting that sinking diatoms are potential nitrate sources for the benthic system.

Diatoms are well known for their ability to accumulate nitrate in vacuoles and to respire it under unfavourable or anoxic conditions. Lake Idro experiences frequent diatom blooms, and the sediment is enriched in diatom frustules, primarily from the genus Aulacoseira, which is capable of surviving in anoxic sediments for extended periods. These observations support the hypothesis that sinking diatoms may act as carriers of nitrate to the deep sediments of Lake Idro, fuelling benthic nitrogen transformations.

The application of the ¹⁵N isotope-pairing technique on intact sediment cores confirmed active 14N-NO3- denitrification in the monimolimnion sediment, with measured rates of 5.9 ±1.5 µmol 14N-NO3- m-2 h-1, accounting approximately for 25 % of total benthic denitrification in the entire lake. Dissimilative nitrate reduction to ammonium (DNRA) rates were also detected but were five times lower than denitrification. These findings demonstrate that diatom-mediated delivery of intracellular nitrate may represent a quantitatively significant and previously overlooked nitrate source to sediments in stratified lakes. Consequently, this mechanism represents an important sink for nitrate and must be considered in future nitrogen-cycle models of meromictic and stratified lakes.

How to cite: Morini, L., Sudo, M. L., Arroyave-Gomez, D. M., Magri, M., Benelli, S., Marzocchi, U., Castaldelli, G., and Bartoli, M.: Hidden source of nitrate fuel benthic denitrification in the anoxic monimolimnion of a deep meromictic lake., EGU General Assembly 2026, Vienna, Austria, 3–8 May 2026, EGU26-1371, https://doi.org/10.5194/egusphere-egu26-1371, 2026.

EGU26-1717 | Orals | BG1.6

Uneven decline and role of long-range atmospheric transport of global wet nitrogen deposition  

Sekh Mohinuddin, Jr-Chuan Huang, and Yi Ying Chen

Atmospheric wet nitrogen deposition (NDepwet) represents the key pathway through which anthropogenic nitrogen emissions are transferred to terrestrial ecosystems. However, global assessments remain limited by sparse observations and strong regional variability in emissions, atmospheric chemistry, and transport. To overcome these constraints, we developed a global ensemble machine-learning framework to generate annual NDepwet estimates for all terrestrial regions from 2005 to 2019 by integrating satellite-derived reactive nitrogen concentrations, meteorological fields, and data from major ground-based monitoring networks. The model achieved strong predictive performance (R² > 0.8), enabling a consistent reconstruction of global deposition trends. 

Globally, NDepwet declined from 61.24 Tg N yr⁻¹ in 2005 to 52.31 Tg N yr⁻¹ in 2019 (−14.6%), driven mainly by reductions in NOₓ emissions. Yet this decline was highly uneven. Developed regions reduced NOₓ emissions by 26% and NH₃ by 5%, but achieved only ~15% reductions in NDepwet , revealing a clear decoupling between emission controls and deposition outcomes. In contrast, developing regions exhibited minimal declines (−3.4% in Africa; −0.6% in India) or slight increases (+0.8% in South America), reflecting continued emission growth and shifts in atmospheric circulation that enhanced cross-boundary nitrogen transport. 

Trajectory-derived backward/forward ratios further revealed changes in each region’s role as a net importer or exporter of reactive nitrogen. Africa and India showed sharp decreases in these ratios (Africa: 0.94→0.36; India: 1.16→0.88), indicating a transition toward export-dominated regimes and reduced sensitivity of NDepwet to domestic emissions. Across most regions, only 18–35% of deposition originated from local emissions, implying that long-range transport is the dominant driver of NDepwet. 

These findings demonstrate that regional emission controls alone cannot effectively reduce nitrogen deposition when transboundary imports remain high. Effective mitigation will require internationally coordinated emission reductions and targeted support for developing regions where emissions continue to rise. 

How to cite: Mohinuddin, S., Huang, J.-C., and Chen, Y. Y.: Uneven decline and role of long-range atmospheric transport of global wet nitrogen deposition , EGU General Assembly 2026, Vienna, Austria, 3–8 May 2026, EGU26-1717, https://doi.org/10.5194/egusphere-egu26-1717, 2026.

EGU26-5550 | ECS | Posters on site | BG1.6

From fertilizer form to microbial function: soil pH controls nitrogen cycling pathways under conventional and recovered phosphorus fertilization 

Matteo Alberghini, Johannes Friedl, Christoph Rosinger, Franziska Weinrich, Rebecca Hood-Nowotny, Giacomo Ferretti, Katharina Keiblinger, and Massimo Coltorti

The transition towards circular nutrient management requires fertilizers that enhance nitrogen (N) use efficiency while minimizing environmental losses. Struvite, a recovered magnesium ammonium phosphate, is increasingly proposed as an alternative to conventional mineral fertilizers such as monoammonium phosphate (MAP). However, the extent to which fertilizer chemistry interacts with soil properties to regulate microbial functioning and N cycling processes remains insufficiently understood.

In this study, we investigated short-term N transformations, microbial activity, and greenhouse gas emissions in two agricultural soils differing in pH (acidic and alkaline) following fertilization with struvite and MAP. Soils were incubated under controlled conditions, and temporal changes in mineral N forms, soil chemical properties, and CO₂ and N₂O emissions were monitored. Microbial respiration and growth were quantified to assess microbial carbon use efficiency (CUE) and biomass turnover. To resolve underlying process rates beyond net fluxes, stable isotope techniques were applied to quantify gross ammonium and nitrate production and consumption, allowing the calculation of microbial nitrogen use efficiency (M-NUE).

Fertilizer effects were strongly regulated by soil pH. In acidic soil, struvite promoted a more gradual and microbially efficient N turnover compared to MAP, characterized by distinct ammonium and nitrate transformation pathways and higher M-NUE. In alkaline soil, N cycling was dominated by rapid nitrification, which reduced functional differences between fertilizer types. Across both soils, fertilizer-specific shifts in microbial growth, CUE, and biomass turnover revealed changes in microbial resource allocation and N processing pathways.

By integrating gas flux measurements, microbial efficiency indicators, and stable isotope–derived gross N transformation rates, this study highlights how soil chemical context governs the biogeochemical performance of recovered fertilizers. Our findings emphasize the need to account for soil pH and microbial functioning when optimizing the use of struvite and other circular fertilizers in sustainable agricultural systems.

How to cite: Alberghini, M., Friedl, J., Rosinger, C., Weinrich, F., Hood-Nowotny, R., Ferretti, G., Keiblinger, K., and Coltorti, M.: From fertilizer form to microbial function: soil pH controls nitrogen cycling pathways under conventional and recovered phosphorus fertilization, EGU General Assembly 2026, Vienna, Austria, 3–8 May 2026, EGU26-5550, https://doi.org/10.5194/egusphere-egu26-5550, 2026.

Degrading topsoil, declining habitat and biodiversity, climate change and social and political unrest alongside a growing population and demand for food are calling for a sustainable alternative to the current industrialised agricultural systems. Permaculture and agroecology are two potential alternative sustainable food systems that are currently lacking scientific evidence base. This study compared the two alternative management approaches against a conventionally practiced control in terms of their soil fertility, microbial abundance and diversity (via PLFA analysis) and greenhouse gas mitigation potential. The permaculture site comprised of a no-dig, organically amended market garden for vegetable production, while the agroecology site was minimally tilled and organically amended, whereas the control was tilled & fertilised with a legacy of herbicide and pesticide use. Monthly soil sampling and greenhouse gas emission monitoring via closed chambers over a 12-month period assessed the soils biogeochemistry, microbial abundance and greenhouse gas fluxes. Permaculture soils supported the most abundant microbial community, with an annual mean total microbial biomass of 89.92 ± 20.84 µg g-1 (23.23 ± 30.7 µg g-1 and 28.69 ± 30.7 µg g-1, more than the minimally tilled and conventionally managed soil, respectively). The same soils also exhibited more than double soil organic matter content (annual mean 16.87%) relative to the conventional management, alongside a significantly lower proportion of soil organic carbon (SOC) loss as CO2 (1.98%, compared to 7% under conventional management). Surprisingly, nitrous oxide (N2O) fluxes at the conventional site were limited, despite the build-up of the soil nitrate pool during summer, which was attributed to the exceptionally dry soil conditions that prevailed during the year of study, suppressing microbial N2O production. However, the denitrification product ratio (N2O/N2+N2O) was consistently lower under permaculture soils compared with agroecology and conventional soils, an indication of a strong potential for N2O emission mitigation. Seasonal warming during spring further stimulated microbial activity, accelerating nutrient acquisition and carbon turnover, with permaculture no-dig soils maintaining three times greater total soil carbon (0.67 ± 0.02 %, annual mean), suggesting a more stable carbon pool. Overall, this study demonstrates permaculture and agroecology practices, particularly no dig management combined with organic amendments, enhances soil fertility, microbial activity, and carbon retention, indicative of a more balanced food system. Multi-year assessments across contrasting climatic conditions are warranted to reduce the uncertainty of temporal variability in GHG flux dynamics and assess long-term carbon stability under these managements.

How to cite: Sgouridis, F., Williamson, R., Reay, M., and Williamson, C.: The effect of sustainable agricultural land managements (agroecology & permaculture) on soil nitrogen and carbon cycling, microbial diversity and greenhouse gas emissions, EGU General Assembly 2026, Vienna, Austria, 3–8 May 2026, EGU26-5670, https://doi.org/10.5194/egusphere-egu26-5670, 2026.

EGU26-5881 | ECS | Posters on site | BG1.6

Topography-driven divergence of plant nitrogen acquisition strategies in forests 

Shuting Yang and Tongbin Zhu

Soil nitrogen (N) supply and plant N acquisition strategies are central to species coexistence and ecosystem functioning, but how topography regulates plant N acquisition strategies remains poorly understood. Here, we used 15N natural abundance approach to quantify plant N uptake proportions along a valley to slope gradient in Southwest China. We further measured leaf and root functional traits with soil N transformation rates to explore topography controls of plant N acquisition strategies.

The results showed that soil nitrate (NO3), decreased significantly from valley to slope, whereas soil ammonium (NH4+) and extractable organic N (EON) increased significantly. These differences were attributed to distinct soil N transformation pathways, with markedly higher soil N mineralization and nitrification rates in valley soils. Consistent with the shifts of soil N availability, plants predominantly utilized NO3 (83.1%) in the valley, but markedly increased the uptake proportions of organic N and NH4+ at slope. In addition, leaf functional traits shifted from an acquisitive strategy in valley plants, characterized by high leaf N concentrations, to a conservative strategy in slope plants with higher leaf carbon (C) to N ratios and increased leaf thickness. In contrast, root functional traits changed from “amount” strategies in the valley, indicated by high specific root length, to “efficiency” strategies reflected by high root N uptake rates at slope. Our structural modeling indicated that topography-driven shifts in plant biomass, leaf and root C: N, soil physicochemical properties, and soil enzyme activity constrain soil N mineralization and nitrification rates on slopes, thereby increasing the relative contribution of EON and NH4+ in soils and driving a corresponding shift in plant N acquisition strategies.

Together, these findings highlight that plants adapt to topography-driven variations in soil N supply by coordinating above and belowground functional traits. Our results provide a scientific basis for future forest restoration and species selection across topographic gradients.

How to cite: Yang, S. and Zhu, T.: Topography-driven divergence of plant nitrogen acquisition strategies in forests, EGU General Assembly 2026, Vienna, Austria, 3–8 May 2026, EGU26-5881, https://doi.org/10.5194/egusphere-egu26-5881, 2026.

EGU26-6968 | ECS | Posters on site | BG1.6

Quantifying thermal adaptation of cropland N2O emissions and its compensatory microbial basis 

Wantong Zhang, Ming Nie, and Feng Zhou

Quantifying the response of cropland N2O emissions to future warming is critical for predicting the feedback between nitrogen cycling and climate change. A central uncertainty is whether soil N2O emissions thermally adapts, an assumption often invoked in carbon-cycle theory. If present, both the magnitude and mechanistic basis of this adaptation remain unresolved. Here, using a global compilation of N₂O flux measurements from temperature-controlled incubations of cropland soils, we identify mean annual temperature (MAT) as the dominant predictor of N2O fluxes and their temperature sensitivity (Q₁₀). Along the MAT gradient, N2O fluxes at a reference temperature (25 ℃) declined by 12.2 ± 2.6% (mean ± SE) per °C, and Q₁₀ decreased by 0.05 ± 0.01 per °C. To probe mechanisms, we conducted two complementary experiments using soil samples spanning climate gradients: a short-term temperature-response assay and a 90-day warming incubation, both under controlled moisture and with 15N-labelled substrate additions. Across both datasets, warmer thermal regimes (higher MAT and experimental warming) reconfigured temperature response curves toward lower Q10 and higher Topt (temperature optima) for both nitrification and denitrification. Mechanistically, this pattern is aligning with the compensatory theory, microbial N2O production rates normalized to mean nitrifier and denitrifier RNA abundances were reduced under warmer thermal regimes. Together, these findings highlighted that soil N₂O production adapts to local thermal regimes across space and to sustained warming through time, implying that future warming may amplify cropland N₂O emissions, but less than commonly predicted.

How to cite: Zhang, W., Nie, M., and Zhou, F.: Quantifying thermal adaptation of cropland N2O emissions and its compensatory microbial basis, EGU General Assembly 2026, Vienna, Austria, 3–8 May 2026, EGU26-6968, https://doi.org/10.5194/egusphere-egu26-6968, 2026.

EGU26-7079 | ECS | Orals | BG1.6

Transitional hypoxia during peatland rewetting drives high N2O fluxes via coupled microbial pathways with evidence of N2O sink potential by fog and tree leaves. 

Mohit Masta, Fahad Ali Kazmi, Mikk Espenberg, Triinu Visnapuu, Louise B. Sennett, Lauri Eving, Dominika Lewicka-Szczebak, Sushmita Deb, Ramita Khanongnuch, Laura Kuusemets, Priit Kupper, Klaus Butterbach-Bahl, and Ülo Mander

Peatlands are globally significant sinks for carbon and nitrogen. The carbon and nitrogen cycles in peatlands are highly sensitive to changes in water table, temperature, and soil moisture. Long-term rewetting has been suggested as a potential restoration strategy for peatland restoration; however, if done improperly, it can create transitional oxic and hypoxic zones, which can act as major hotspots for N2O emissions. In this study, we investigated the effect of transitioning from oxic to hypoxic conditions in a drained peat soil prepared in mesocosms, which were installed in a climate chamber to simulate day and night conditions. The humidity in the climate chamber was maintained above 90% to study the interaction of the produced N2O with artificial fog, generated using foggers. We prepared 12 mesocosms, out of which 4 received a 15N-NO3- tracer, 4 received a 15N-NH4+ tracer, and the remaining 4 were kept as controls. One birch plant sapling was also planted in each mesocosm before the start of the experiment. Soil oxygen levels were reduced from 9 mg/L to 1.5 mg/L over the course of ten days, and the effects of this change from oxic to hypoxic conditions were studied.

Our results indicate that due to a decrease in soil oxygen over time, N2O emissions increased and peaked on the final day (162 ± 22.80 μg N m-2 h-1) of the experiment. During this transition (oxic to hypoxic), we observed a significant increase in the abundance of nirK-type denitrifiers. Our 15N tracers indicate that on the initial days, the produced N2O was dominated by the 15N-NH4+ tracer, but on the final days, the 15N-NO3- showed a significant contribution to the N2O flux. The birch sapling showed a major uptake of 15N-NO3- in its roots and leaves. This indicates a preference for birch saplings towards the soil nitrate pool compared to the soil ammonium. We also applied the 3D Frame isotope model to the natural isotopomers of soil-produced N2O and observed a change in the N2O production processes over the course of the experiment. The initial days were dominated by nitrifiers’ denitrification and nitrification; however, by the end of the experiment, isotopic mapping revealed the dominance of nitrification, coupled with bacterial and nitrifier denitrification. We also found evidence of the solubility of tracer-produced N2O in the fog water.

Our study demonstrated that the improper restoration of peatlands through rewetting can create transitional oxic-hypoxic zones, which can serve as hotspots for N2O emissions. Moreover, soil-produced N2O can be dissolved in fog during colder seasons, which can be further coupled by tree leaves as they also possess potential for N-cycle processes.

How to cite: Masta, M., Ali Kazmi, F., Espenberg, M., Visnapuu, T., Sennett, L. B., Eving, L., Lewicka-Szczebak, D., Deb, S., Khanongnuch, R., Kuusemets, L., Kupper, P., Butterbach-Bahl, K., and Mander, Ü.: Transitional hypoxia during peatland rewetting drives high N2O fluxes via coupled microbial pathways with evidence of N2O sink potential by fog and tree leaves., EGU General Assembly 2026, Vienna, Austria, 3–8 May 2026, EGU26-7079, https://doi.org/10.5194/egusphere-egu26-7079, 2026.

EGU26-8551 | ECS | Posters on site | BG1.6

HONO Emission from Marine Algae 

xuelian zhong, hengqing shen, and likun xue

Nitrous acid (HONO) is a key precursor to hydroxyl radicals (OH) and a reservoir of reactive nitrogen, yet the processes sustaining elevated daytime HONO in marine and coastal environments remain poorly understood. We combine coastal field observations with irradiation chamber experiments and atmospheric modeling to identify abiotic photodecomposition of marine algae as a previously unrecognized HONO source. During Ulva prolifera green tides, daytime HONO levels in the coastal atmosphere closely followed tidal cycles and peaked at low tide, in contrast to typical inland nocturnal peaks. Chamber experiments confirm that common algae (Ulva prolifera, Bryopsis plumosa, Chaetomorpha spiralis Okam., Sargassum, and Silvetia siliquosa) directly emit HONO under irradiation, with fluxes increasing with light intensity and algal surface area. Measured HONO fluxes of 1.08 × 10⁻⁷ to 2.31 × 10⁻⁶ mol m–2 h–1are comparable to reported soil HONO emissions and exceed marine NO fluxes by 2 to 3 orders of magnitude. Incorporating this source into an atmospheric model increases HONO concentrations, enhancing OH and ozone production and accelerating the oxidative loss of dimethyl sulfide and methane. As eutrophication and warming intensify algal blooms worldwide, algal photodecomposition is likely to become an increasingly important driver of coastal reactive nitrogen emissions and oxidation capacity.

How to cite: zhong, X., shen, H., and xue, L.: HONO Emission from Marine Algae, EGU General Assembly 2026, Vienna, Austria, 3–8 May 2026, EGU26-8551, https://doi.org/10.5194/egusphere-egu26-8551, 2026.

EGU26-8694 | ECS | Orals | BG1.6

Substantial underestimation of soil nitrogen gaseous losses from global croplands under warming 

Wenxin Ba, Haoming Yu, Longfei Yu, Peter Dörsch, Ming Nie, Ping Han, Erik Hobbie, Yunting Fang, and Feng Zhou

Temperature sensitivities (Q10) of nitric oxide (NO) and nitrous oxide (N2O) emissions are the core parameters to project future trajectories of soil nitrogen (N) cycling and climate feedback. However, spatial variations in Q10 and their underlying microbial processes are unknown, hindering accurate projection. We sampled 21 upland soils across a 4000-km transect in China and conducted incubations at 5 to 40°C with 15N tracer to quantify Q10 of NO and N2O emissions, alongside process-specific emissions from nitrification, denitrification and co-denitrification. Optimal temperatures (Topt) for these processes exceeded  30°C and increased with mean annual site temperature. Q10 ranged widely from 1.3 to 5.7 (averaged 3.3) and 1.0 to 5.9 (averaged 3.5) for NO and N2O emissions, respectively, showing higher values observed in lower mid-latitudes and high-pH croplands. The Q10 values were governed by shifts in the ratios between nitrifier and denitrifier functional genes, which are in turn regulated by edaphic and climatic factors. Our observed Q10 values are significantly higher than the default of 2 set in Earth System Models (ESMs). Integrating the experiment-derived Q10 values into model projections reveals that current ESMs underestimate future NO and N2O emissions by 17.5–26.6% across the Shared Socioeconomic Pathways (SSP3-7.0 and SSP5-8.5) by 2100. This suggests a substantial underestimation of future gaseous N losses from global croplands under warming.

How to cite: Ba, W., Yu, H., Yu, L., Dörsch, P., Nie, M., Han, P., Hobbie, E., Fang, Y., and Zhou, F.: Substantial underestimation of soil nitrogen gaseous losses from global croplands under warming, EGU General Assembly 2026, Vienna, Austria, 3–8 May 2026, EGU26-8694, https://doi.org/10.5194/egusphere-egu26-8694, 2026.

EGU26-12836 | Orals | BG1.6 | Highlight

They say “carbon!”, we say “…and nutrients!”: N-cycle biogeochemistry sustaining net productivity in a long-established temperate broadleaf forest under elevated CO2 

Rob MacKenzie, Manon Rumeau, Michaela Reay, Grace Handy, Carolina Mayoral, Anna Gardner, Richard Norby, Andy Smith, Iain P. Hartley, R. Liz Hamilton, and Sami Ullah

Enhanced ‘woody growth’ (dry matter increments, specifically), averaging 10%, has been sustained in patches of long-established (180+ years old) oak forest through 9 years of treatment with elevated CO2 (eCO2; 150 ppm above ambient). Root exudation of carbon (C) into the rhizosphere increased by 63%, which primed the microbes for nutrient acquisition to meet enhanced tree N demands. A ‘faster-tighter’ nitrogen cycle accelerates the return of nitrogen via ammonification to plant-available forms and suppresses processes such as nitrification. This ecosystem-scale N conservation strategy supports increased net productivity by maintaining the nutritional balance of the trees in the C-rich atmosphere. The faster-tighter N-cycle makes an additional 25 kg N ha-1 yr-1 available to the trees under eCO2. That is, the forest’s N-cycle adjusts to the increased C supply, but whether this capacity to adjust endures may be constrained by soil organic N stocks and anthropogenic N deposition. Further, when considering broader aspects of the forest under eCO2, we find nutritional deficiencies producing a cascade of nascent ecosystem fragility in pollen, seeds, seedlings, and food webs. The clear policy implications are: (i) that enhanced net primary productivity does not, in itself, guarantee forest resilience; (ii) that both C and N emission pathways must be accounted for when forecasting 21st-century C uptake into temperate forests; and (iii) that, when proposing forests as natural climate solutions, understanding C-nutrient interactions is of primary concern.

How to cite: MacKenzie, R., Rumeau, M., Reay, M., Handy, G., Mayoral, C., Gardner, A., Norby, R., Smith, A., Hartley, I. P., Hamilton, R. L., and Ullah, S.: They say “carbon!”, we say “…and nutrients!”: N-cycle biogeochemistry sustaining net productivity in a long-established temperate broadleaf forest under elevated CO2, EGU General Assembly 2026, Vienna, Austria, 3–8 May 2026, EGU26-12836, https://doi.org/10.5194/egusphere-egu26-12836, 2026.

EGU26-13347 | Posters on site | BG1.6

Lithology controls of soil N availability and plant N acquisition strategies in subtropic forests 

Peter Dörsch, Shuting Yang, and Tongbin Zhu

Soil nitrogen (N) availability and plant N uptake strategies are central to species adaptation and community assembly, yet how lithology shapes soil N supply and plant N uptake remains poorly understood. Here, we used 15N labeling to compare soil N supply and plant N uptake preferences in forests on soils developed from limestone and clastic rocks, respectively. Our results revealed significant contrasts in inorganic N pools: nitrate (NO3) dominated in limestone soils, while ammonium (NH4+) was more abundant in red soils developed from clastic rocks. We attributed these differences to different soil N transformation pathways. Increased nitrification rates in limestone soils increased NO3content, whereas red soils exhibited high mineralization but lower nitrification rates, leading to NH4+ dominating inorganic N. Forest plants in both limestone and red soils preferentially utilized NH4+ as their primary N source. However, plant in limestone soils took up significantly higher proportions of NO3and glycine. Moreover, total N uptake rates by plants were significantly larger in limestone than red soils, suggesting a more efficient N acquisition strategy. Structural equation modeling indicated that lithology significantly affected soil N mineralization and nitrification by regulating soil pH and total N, thereby driving differences in soil inorganic N pools and ultimately plant N uptake. Our results provide evidence that lithology-driven variations in soil N supply can strongly affect plant N acquisition strategies.

How to cite: Dörsch, P., Yang, S., and Zhu, T.: Lithology controls of soil N availability and plant N acquisition strategies in subtropic forests, EGU General Assembly 2026, Vienna, Austria, 3–8 May 2026, EGU26-13347, https://doi.org/10.5194/egusphere-egu26-13347, 2026.

EGU26-16855 | Orals | BG1.6

Cover crops, soil depth and nutrient dynamics drive N2O emissions and N2O forming processes during soil freezing and thawing 

Mari Pihlatie, Osmo Virta, Heidi Aaltonen, Jonna Teikari, Pauliina Turunen, Lukas Kohl, Matej Znamínko, Carlos Palacin Lizarbe, Hannu Nykänen, Christina Biasi, and Markku Koskinen

Freeze–thaw cycles (FTCs) are recognized as important regulators of nitrous oxide (N₂O) emissions in temperate and boreal soils, yet the underlying drivers and processes during FTC remain poorly understood. 

We set up two controlled incubation experiments to investigate the effect of freezing and thawing on N2O emissions, emission drivers and N2O forming processes. Soil samples were collected during spring freeze-thaw period from a biodiversity cover crop plot trial in Helsinki, southern Finland. In experiment 1, we studied the effects of soil depth and cover crops (CC) on N₂O emissions, soluble nutrients (N, P, C) and active N cycling genes (RNA) during consecutive freezing and thawing phases over a 3-week period. In experiment 2, we studied N2O emissions and their isotopologue ratios in a dynamic automated FTC experiment with alternating freezing (–4 °C) and thawing (+4 °C) cycles. To support the controlled experiments, we conducted twice weekly N2O flux measurements in the field during the spring freezing-thawing period.

Throughout the experiment 1, we found significantly greater N2O production at the surface (0 – 2 cm) compared to the subsurface (9 – 11 cm) soil depth. To support this, soil nitrate, ammonium, total dissolved N, dissolved organic C and soluble reactive P concentrations where higher in the topsoil compared to the subsurface. In experiment 2, N2O emissions occurred during thawing periods but were stimulated by freezing. Based on isotopologue ratios, the N2O originated predominantly from denitrification. Field N2O flux data support the laboratory results showing higher N2O emissions during freeze-thaw, and smaller during warm periods, and that cover crop treatments potentially lead to higher N2O emissions during soil freeze-thaw. Overall, the findings demonstrate the episodic nature of freeze-thaw related N2O emissions governed by substrate dynamics in soil that support conditions suitable for “hot moments”.

How to cite: Pihlatie, M., Virta, O., Aaltonen, H., Teikari, J., Turunen, P., Kohl, L., Znamínko, M., Palacin Lizarbe, C., Nykänen, H., Biasi, C., and Koskinen, M.: Cover crops, soil depth and nutrient dynamics drive N2O emissions and N2O forming processes during soil freezing and thawing, EGU General Assembly 2026, Vienna, Austria, 3–8 May 2026, EGU26-16855, https://doi.org/10.5194/egusphere-egu26-16855, 2026.

EGU26-16945 | ECS | Posters on site | BG1.6

Seasonal patterns of N2O and CO2 emissions from Finnish agricultural soil under oat with and without cover crops as affected by reduced rainfall 

Pauliina Turunen, Asko Simojoki, Markku Koskinen, Jussi Heinonsalo, and Mari Pihlatie

Nordic agricultural production faces multiple challenges in a warming climate. Although predictions indicate an overall increase in annual mean precipitation in northern Europe, increasing temperatures may lead to earlier snowmelt and drying of soil during springtime, as well as longer growing season and higher evapotranspiration increasing the risk of summer droughts. The use of cover crops in agriculture is one of the climate-smart practices that have multiple benefits, such as increasing SOC, reducing N losses, and increasing biodiversity. Still, the question whether cover crops and their diversity increase resilience against climate extremes such as drought, and how the combined effects of cover crops, their diversity and drought affect greenhouse gas (GHG) emissions from soil remain largely unknown. We studied the effect of cover crop diversity and drought on soil and crop C and N dynamics and GHG (CO2, N2O) emissions in a biodiversity cropland experiment with or without shelters that remove 50% of incoming precipitation for two years. GHG emissions were measured with the manual dark chamber method twice a week during growing season and once a week during off-season. Soil temperature and water content were measured continuously, and the soil was sampled for mineral N and total C and N analysis seasonally.

The preliminary results showed that reduced rainfall did not affect N2O emissions significantly during the growing season in either year. During off-season, reduced rainfall led to elevated N2O emissions irrespective of cover crop diversity treatments. However, the effect was absent in the second year, indicating that factors other than drought were driving the N2O production. Contrary to N2O, drought did not affect CO2 emissions during off-season in either year. Overall, during both years off-season N2O emissions dominated the annual N2O balance in all diversity treatments, highlighting the importance of including off-season measurements to the annual N2O balance estimation.

How to cite: Turunen, P., Simojoki, A., Koskinen, M., Heinonsalo, J., and Pihlatie, M.: Seasonal patterns of N2O and CO2 emissions from Finnish agricultural soil under oat with and without cover crops as affected by reduced rainfall, EGU General Assembly 2026, Vienna, Austria, 3–8 May 2026, EGU26-16945, https://doi.org/10.5194/egusphere-egu26-16945, 2026.

EGU26-17046 | Posters on site | BG1.6

Woody paludiculture as an after-use option for peat extraction fields  

Tuula Larmola, Sakari Sarkkola, Sari Juutinen, Helena Rautakoski, Maiju Linkosalmi, Jyrki Jauhiainen, Mika Aurela, Liisa Ukonmaanaho, and Päivi Merilä

As peat extraction for energy has declined in Europe, extensive areas released from peat production require sustainable after-use. This land use change provides opportunities to mitigate climate change, halt biodiversity loss and support socially fair and rewarding solutions for communities. Here we present the first results from PaluWise project’s large 50 ha peat extraction area converted into demonstration site of paludiculture i.e., the productive land use of rewetted peatlands that preserves the peat soil and thereby reduces carbon dioxide (CO2)  and nitrous oxide (N2O) emissions and subsidence. The risks related to paludiculture include increased methane (CH4) emissions, high nutrient losses and wetting the surrounding fields. We also reviewed evidence from climate change mitigation potential of common after-use options in agriculture and forestry for peat extraction areas in Northern Europe (ALFAwetlands project). Our data synthesis of annual greenhouse gas (GHG) fluxes revealed that boreal paludiculture showed a net loss of carbon (C) based on the net ecosystem C balance at least in the short term after rewetting cultivated peat soil. A woody crop, short rotation coppice of willow had more favourable greenhouse gas balance than forage and set-aside treatments during 4 years after transition. Options enhancing C input to the soil without rewetting may stop net annual C losses from a former peat extraction site just in one year: Afforestation on Scots pine with fertilization turned the site fast into a CO2 sink, as measured by eddy covariance technique. We hypothesize that woody crops having low nutrient requirements and potential for added value products may offer a win-win after-use solution for rewetted peat extraction areas. We examined biomass and CO2, CH4 and N2O fluxes from stands of downy birch and colonizing wild vegetation at our demonstration site. We found that the first Sphagnum mosses co-occur with downy birch, indicating favourable conditions for enhanced C sequestration. We expect that land use decisions may optimize many targets: climate, biodiversity, water quality, and economy simultaneously. Confounding factors, e.g. time perspective may affect landowner’s preferences. Long-term changes in peat carbon stock under any after-use option require further study.


How to cite: Larmola, T., Sarkkola, S., Juutinen, S., Rautakoski, H., Linkosalmi, M., Jauhiainen, J., Aurela, M., Ukonmaanaho, L., and Merilä, P.: Woody paludiculture as an after-use option for peat extraction fields , EGU General Assembly 2026, Vienna, Austria, 3–8 May 2026, EGU26-17046, https://doi.org/10.5194/egusphere-egu26-17046, 2026.

EGU26-17105 | ECS | Posters on site | BG1.6

Petagrams of Nitrogen released from the Permafrost affect Arctic Ecosystem Fluxes under any Climate Scenario 

Lara Rosalind Oxley, Benjamin David Stocker, Sönke Zähle, Yu Zhu, and Fabrice Lacroix

Arctic permafrost-affected soils serve as one of Earth’s most significant terrestrial reservoirs of nitrogen (N), storing an estimated 55 Pg of total N within the first three meters of the soil. Ongoing anthropogenic climate change is causing permafrost soils to thaw at greater depths each summer, rendering part of vast pools of N stored in the permafrost accessible to plant uptake and microbial processing. However, little is known of the magnitudes and consequences of the potential increase of N availability due to permafrost thaw, as the mobilisation and mineralisation of this N has the potential to alter ecosystem productivity, as well as increase emissions of reactive nitrogen gases, such as nitrous oxide (N2O). This research aims to quantify nitrogen dynamics across the Arctic following permafrost thaw from the historical period to the end of the twenty-first century.

In our study, we first estimate the total amount of soil N that will be mobilized through thawing. To do this, we combine a vertically-resolved high spatial resolution soil C and N dataset with future projections of pan-Arctic active layer depth changes derived from five CMIP6 models across four climate change scenarios. Vertical mean soil N profiles were thereby determined for different land cover types of the tundra, taiga, wetlands and barren biomes. Secondly, we estimated the amount of permafrost organic soil N that is rapidly mineralized to bioavailable forms, was determined from a temperature-dependent mineralisation flux estimation. Finally, we perform a first-order estimation of the impact of the additional bioavailable N for Arctic vegetation NPP and N2O emissions. 

Across the CMIP6 models, the pan-Arctic mean maximum active layer depth is projected to increase by an additional 1 - 2.65 m by 2100 (SSP 1-2.6 to 5-8.5), relative to present-day conditions. This increase corresponds to a potential cumulative release of 20 - 44 Pg total N by the end of the century, of which 4.4 - 5.5 % may be mineralised rapidly under projected soil warming. Putting these estimates into context with our novel budget of present-day pan-Arctic N fluxes, we show that the addition of reactive nitrogen from the permafrost will consist of an important part of N sources to the Arctic in the future (40-50 %).  

Based on our synthesis of N fertilisation effects on Arctic vegetation net primary productivity (boreal ANPP: 14.1 (+/- 3.55) g C / g N, BNPP: 2.82 g C / g N; tundra ANPP: 2.66 (+/- 2.22) C / N, BNPP: 2.29 (+/- 4.41) g C / g N), we furthermore quantify that the release of N from the permafrost could increase  NPP by 150 – 400 Tg C yr-1 until year 2100. In a similar approach based on soil manipulation experiments, we also estimate a potential additional 0.12 – 0.8 Tg N yr-1 in N2O emissions by the year 2100.

Our results show that permafrost thawing will significantly alter the Arctic N budget, having very likely substantial impacts for both terrestrial NPP and as N2O emissions. 

How to cite: Oxley, L. R., Stocker, B. D., Zähle, S., Zhu, Y., and Lacroix, F.: Petagrams of Nitrogen released from the Permafrost affect Arctic Ecosystem Fluxes under any Climate Scenario, EGU General Assembly 2026, Vienna, Austria, 3–8 May 2026, EGU26-17105, https://doi.org/10.5194/egusphere-egu26-17105, 2026.

EGU26-17133 | ECS | Posters on site | BG1.6

When Yedoma permafrost thaws: disturbances from lake drainage to thaw slump, and their impact on nitrogen cycling 

Wasi Hashmi, Paula Martinez-Risco Martinez, Tina Sanders, Alexandra Veremeeva, Ingmar Nitze, Jenie Gil, Tobias Rütting, Dhiraj Paul, Jens Strauss, Claire C. Treat, and Maija E. Marushchak

The Arctic is warming four times faster than the global average, triggering the widespread degradation of permafrost and enhancing mobilization of vast, previously frozen soil nitrogen (N) and carbon (C) stocks. While C release associated with permafrost thaw is better documented, the liberation of permafrost N, a potential precursor to the strong greenhouse gas (GHG) nitrous oxide (N2O), remains a critical knowledge gap. This is particularly relevant for ice-rich Yedoma deposits, which are highly vulnerable to abrupt thaw and the formation of disturbance features, such as retrogressive thaw slumps (RTSs), thermokarst lakes, and drained thermokarst lake basins (DTLBs). While RTSs are known hotspots for N2O, recently formed DTLBs underlain by ice-rich Yedoma deposits with a high content of buried, poorly decomposed organic matter, remain largely understudied, although they are widespread across Yedoma landscapes. Importantly, there are no studies reporting N2O fluxes from DTLBs, despite the high N mineralization expected after drainage, which might support high emissions.

Here, we report N2O fluxes and N turnover processes from RTS and DLB on the Baldwin Peninsula, Western Alaska, underlain by ice-rich late Pleistocene Yedoma deposits. In situ fluxes were measured during the summer of 2024, alongside aerial surveys for high-resolution elevation and vegetation mapping with lidar and optical cameras. We conducted laboratory incubations for GHG production, including denitrification and 15N labeling to quantify gross rates of mineralization, nitrification, and dissimilatory nitrate reduction to ammonium (DNRA) using the 15N tracer method.

Our study reveals high N2O emissions at both disturbance sites, demonstrating that DTLBs are emerging as significant sources of N2O (up to 7.7 mg N m-2 d-1) emissions, comparable to known high emissions from thaw slumps. supported by high nitrate concentrations, reaching up to 205.1 µg N gDW-1. We identified the role of environmental factors in driving the spatial variability in N2O fluxes as well as N cycling. These findings suggest that as thermokarst lake drainage events increase across the Arctic, DTLBs in Yedoma uplands represent a major, expanding source of permafrost-driven N emissions that must be integrated into global climate feedback models. By tracking how N moves through the soil and how different environmental conditions, like moisture and thaw, trigger specific microbial processes, we can better understand the overall behavior of the N cycle and its growing role in these disturbance landforms.

How to cite: Hashmi, W., Martinez-Risco Martinez, P., Sanders, T., Veremeeva, A., Nitze, I., Gil, J., Rütting, T., Paul, D., Strauss, J., C. Treat, C., and E. Marushchak, M.: When Yedoma permafrost thaws: disturbances from lake drainage to thaw slump, and their impact on nitrogen cycling, EGU General Assembly 2026, Vienna, Austria, 3–8 May 2026, EGU26-17133, https://doi.org/10.5194/egusphere-egu26-17133, 2026.

EGU26-17418 | ECS | Posters on site | BG1.6

Nitrogen balance and nitrogen use efficiency in an East African tropical montane catchment characterised by smallholder farming 

Miriam Kasebele, Suzanne Jacobs, and Lutz Breuer

The input of reactive nitrogen sourced from anthropogenic activities such as smallholder farming as well as changes in its transport and fate in the environment may alter the nitrogen balance of a catchment and the nitrogen use efficiency for crop production. Both have the potential of causing detrimental effects on agricultural productivity and the environment such as water bodies. Insufficient nitrogen addition for crop production could lead to soil nitrogen depletion, while too high input rates could lead to excess nitrogen polluting water bodies. In the Mau Forest Complex (MFC) in Kenya, fertilizers and livestock management have been assumed to be associated with the increase in annual riverine export of reactive nitrogen. Twice the annual export of nitrogen from a catchment dominated by smallholder agriculture was reported compared to that from the native forest. To assess the role of smallholder agriculture in nitrogen losses, this study aims at determining the nitrogen balance and nitrogen use efficiency of a 27 km² headwater catchment characterized by smallholder farming in the MFC. Anthropogenic inputs and outputs were estimated from a household survey (n=185), field measurements involving precipitation collectors in 10 different locations as well as literature review. The nitrogen flows in the native forest were obtained from the literature.

Results show that at farm scale, about one third of investigated farms have negative nitrogen balances, while at the catchment scale the aggregate nitrogen balance is −10.9 kg N ha−1 yr−1. This is in contrast to the positive nitrogen balance of the native forest of 26.5 kg N ha−1 yr−1. With respect to the nitrogen use efficiency only 20% and 18% of the maize fields as well as 7% and 12% of the potato fields, recorded nutrient use efficiency between 50% and 90% in 2018 and 2019, respectively.

The study shows that inorganic fertilisers, atmospheric deposition and biological fixation are the most important sources of reactive nitrogen, while crop harvest, denitrification and leaching were identified as major loss pathways. The wide range of nitrogen surplus and deficits among farms and the subsequent potential for eutrophication and soil mining highlight the need to better educate farmers on the optimal use and timing of fertiliser application to close the deficit gap and prevent pollution.

How to cite: Kasebele, M., Jacobs, S., and Breuer, L.: Nitrogen balance and nitrogen use efficiency in an East African tropical montane catchment characterised by smallholder farming, EGU General Assembly 2026, Vienna, Austria, 3–8 May 2026, EGU26-17418, https://doi.org/10.5194/egusphere-egu26-17418, 2026.

EGU26-17679 | ECS | Posters on site | BG1.6

Cryptogam-associated microbial processes shaping N2O and CH4 cycling in Amazonian peat swamp forests 

Si Chen, Ülo Mander, Ramita Khanongnuch, Fahad Ali Kazmi, Mohit Masta, Kaido Soosaar, Lizardo Fachin-Malaverri, and Mikk Espenberg

Tropical wetlands are among the most important regulators of the global carbon (C) and nitrogen (N) cycles, largely through microbially mediated processes that control greenhouse gas (GHG) production and consumption. Tropical peat forests play a key role in these biogeochemical cycles by storing large amounts of organic matter and regulating gas exchanges between soils and the atmosphere, with their functioning strongly influenced by vegetation composition and seasonal shifts between dry and rainy periods. Amazonian peatlands are emerging as potentially significant sources and sinks of nitrous oxide (N2O) and methane (CH4), depending on climatic conditions and climate change, including more frequent droughts and increasing irregularity between rainy and dry seasons. Despite their importance for climate regulation, the links between peat forest structure, microbial C and N cycling, and ecosystem-scale GHG fluxes remain poorly quantified. In addition to vascular plants, cryptogams such as mosses and lichens may exert important yet understudied controls on microbial activity, thereby potentially affecting N2O and CH4 emissions in aboveground compartments.

This study aims to assess how cryptogam-associated microbial processes affect N2O and CH4 fluxes in the Quistococha peat swamp forest and Zungarococha secondary peat swamp forest of Peruvian Amazon, and to evaluate how these processes  differ between forest types.

A total of 25 cryptogam samples were collected from two sites in the Loreto Region of northern Peru. Quistococha is an intact peat swamp forest dominated by Mauritia, Tabebuya, and Caspi, whereas Zungarococha is a secondary peat swamp forest dominated by Cashapona, Mauritia, Hebea, Caspi, M_Beuna, Symphonia, and Cumala. Samples were collected from the stems of trees and palms during two campaigns, in rainy and dry seasons. Metagenomic sequencing of cryptogams was performed to investigate microbial functional potential related to C and N cycling and its relationship with forest type.

Our results show that: (1) Cashapona, Caspi, Cumala, and Hebea exhibited similar functional gene abundance patterns across different seasons and sites, suggesting relatively stable microbial functional characteristics; (2) genes associated with N fixation, dissimilatory nitrate reduction to ammonium (DNRA), and nitrification–processes regulating N availability and potential N2O production–were more abundant in Zungarococha, especially during the rainy season; (3) genes related to methanogenesis (CH4 production) and methanotrophy (CH4 oxidation) were present at relatively low abundances at both sites, with no significant seasonal differences; (4) most functional genes related to C and N cycling were more abundant in Zungarococha than in Quistococha, with peak abundances during the rainy season , whereas in Quistococha, genes related to methanotrophy, N fixation, nitrification, and denitrification (also influencing N2O consumption) were more abundant during the dry season; (5) Burkholderiaceae and Methanobacteria were more abundant in Zungarococha, Methylococcales and Opitutae were more abundant during the dry season, and Oscillatoriales were more abundant in the rainy season, which are affecting C and N cycling.

How to cite: Chen, S., Mander, Ü., Khanongnuch, R., Kazmi, F. A., Masta, M., Soosaar, K., Fachin-Malaverri, L., and Espenberg, M.: Cryptogam-associated microbial processes shaping N2O and CH4 cycling in Amazonian peat swamp forests, EGU General Assembly 2026, Vienna, Austria, 3–8 May 2026, EGU26-17679, https://doi.org/10.5194/egusphere-egu26-17679, 2026.

EGU26-18666 | ECS | Posters on site | BG1.6

Influence of Iron Mineralogy on Reactive Nitrogen Gas Emissions from Soil 

Megan L. Purchase, Celine Waez, Alex J. Thorpe, and Ryan M. Mushinski

Iron exists abundantly in soil in multiple oxidation states and mineral forms, and is the dominant redox-active metal. Recent evidence suggests iron chemistry plays a central role in producing volatile reactive nitrogen oxides (NOy = NO + NO2 + HONO + other N-oxides), which are key air pollutants contributing to tropospheric ozone formation, acid deposition, and respiratory health risks. Current atmospheric models do not accurately represent soil NOy fluxes, particularly HONO and NO₂, because biogenic production mechanisms remain poorly characterised. In moist soils, HONO is primarily produced by bacterial and archaeal ammonia oxidisers. However, as soils dry, nitrite and nitrate can accumulate and pH often decreases, potentially favouring abiotic nitrate reduction as a critical HONO source.

To investigate how soil iron mineralogy, concentration, and speciation influence NOy emissions during drying, HONO and NO₂ fluxes are measured over 24 hours using an ICAD-HONO/NO₂-210L system (Airyx GmbH) from soil microcosms amended with three iron oxides (ferrihydrite, goethite, magnetite) at two concentrations (3.5% and 4.5% total iron). Microbial community responses will also be assessed via quantitative PCR targeting nitrogen cycling genes. We hypothesise that: 1) soil drying will increase nitrate accumulation and lower pH, leading to HONO fluxes that peak at intermediate moisture when thin water films enable reactions but allow gas diffusion; 2) ferrihydrite-amended soils will exhibit the highest NOy emissions due to its Fe³⁺ reduction potential, transition metal adsorption, and reactive oxygen species generation; and 3) NOy emissions will increase with iron oxide concentration, although high concentrations may suppress microbial activity via metal toxicity.

Preliminary results show substantial HONO emissions from all iron amendments in neutral soils (~pH 7), followed by a steep decline as soils dry. A late NO₂ peak was observed, possibly due to physical release during drying or shifts in microbial pathways. Increasing goethite concentrations correlated with higher HONO emissions, whereas ferrihydrite showed a negative correlation. Future work will examine the pH modulation of the relationship between iron and NOy fluxes by repeating flux measurements in acidic soils (~pH 5.5), where we expect enhanced nitrite protonation, and altered iron solubility and redox activity.

How to cite: Purchase, M. L., Waez, C., Thorpe, A. J., and Mushinski, R. M.: Influence of Iron Mineralogy on Reactive Nitrogen Gas Emissions from Soil, EGU General Assembly 2026, Vienna, Austria, 3–8 May 2026, EGU26-18666, https://doi.org/10.5194/egusphere-egu26-18666, 2026.

EGU26-19174 | ECS | Posters on site | BG1.6

Adapting soils to salt: Effects of saline irrigation on soil C and N turnover 

Ragne Kyllingstad, Peter Dörsch, and Åsgeir Almås

Salinization is an increasing threat to global food security. Sea-level rise and storm surges drive coastal salinization, while inland salinization is driven by intensive fertilization and low-quality irrigation. High salt levels cause osmotic stress, which impairs plant growth and microbial activity, ultimately degrading soil health and food production. Both the EU and UN recognize soil salinization as a major global challenge requiring urgent action. 

This study is part of the EJP SOIL project SoilSalAdapt, with Norwegian partners funded by the Research Council of Norway. The project explores adaptation strategies to soil salinization in a temperate climate. Experiments indicate that controlled saline irrigation can promote salt tolerance in soil microbes, suggesting that saline irrigation may serve as a proactive climate adaptation measure. This sub-study examines the legacy effect of previous salt exposure on soil biogeochemical turnover of carbon and nitrogen in response to a new shock salinization event.

Specifically, this study investigates 1) oxic microbial respiration and carbon use efficiency, 2) anoxic respiration and denitrification end-product stoichiometry, and 3) nitrification potential rates and the relative contributions of ammonia-oxidizing bacteria and archaea.

Denitrification completeness was strongly impacted by the salt treatment, particularly in the low-fertilization scenario, were salt seems to reduce nitrous oxide production per total denitrification. Nitrification rates responded differently to historical salinity in clay and sand soils, but the saline shock converged rates across soil types at a lower overall level.

At the EGU conference, I will present our findings and discuss how soil-based adaptation strategies can support resilient food production under ongoing and future climate pressures.

How to cite: Kyllingstad, R., Dörsch, P., and Almås, Å.: Adapting soils to salt: Effects of saline irrigation on soil C and N turnover, EGU General Assembly 2026, Vienna, Austria, 3–8 May 2026, EGU26-19174, https://doi.org/10.5194/egusphere-egu26-19174, 2026.

EGU26-20602 | Orals | BG1.6

Biological nitrogen transformations within the tree canopy: seasonal variations and microbial contributions to nitrogen fluxes in a Mediterranean Holm oak forest 

Raquel Ruiz-Checa, David Elustondo, Anna Ávila, Rossella Guerrieri, Wendell Walter, Stefania Mattana, and Rocio Alonso

Human activities have increased atmospheric reactive nitrogen (N) deposition, with important consequences for ecosystem biogeochemical cycles. In forest ecosystems, tree canopies act as active filters that intercept, transform and redistribute atmospheric N before it reaches to the soil. These canopy-level processes determine the chemical forms of N that become available for biological uptake or are transferred to the soil. Despite their importance, the temporal variability of these processes remains poorly understood, particularly in Mediterranean ecosystems with pronounced seasonal contrasts.

In this study, we investigated the seasonal dynamics of atmospheric N transformations within the canopy of a Mediterranean Holm oak forest (Quercus ilex / Q. rotundifolia) in Spain. We focused on canopy-scale nitrification processes and the abundance of N-fixing and nitrifying microorganisms associated with the phyllosphere and precipitation. Canopy N fluxes were quantified, nitrate sources were identified using Δ¹⁷O isotopic signatures, and microbial abundances were quantified by qPCR, to explore seasonal dynamics and their environmental drivers.

Our results show that the canopy acted as a net sink for atmospheric N throughout the year, indicating that N inputs did not exceed ecosystem demand and suggesting potential N limitation. The nitrate measured in throughfall samples indicated a predominantly atmospheric origin during most of the year (76–92%). In contrast, during summer up to 76% of the nitrate was derived from in situ biological processes at canopy level. These enhanced biological transformations were correlated with weather conditions, particularly the higher temperatures and dry conditions typical of summer, which may favour nitrification and promote the accumulation of N compounds on leaf surfaces. Reduced plant activity and lower N uptake during summer further prolong N residence time within the canopy, increasing the likelihood of microbial transformations. Both archaeal and bacterial nitrifiers, as well as N-fixing microorganisms, were detected year-round in the phyllosphere and precipitation. Archaeal nitrifiers consistently outnumbered bacterial ones, and showed a marked increase during summer, driven by higher radiation, temperature and lower humidity. This pattern suggests that archaea may play a significant important role in nitrification, coinciding with the highest nitrification rates observed in summer. These findings highlight the crucial function of canopy processes in regulating N fluxes in Mediterranean forests, particularly during summer. The seasonal dynamics of biological transformations and microbial communities emphasise the influence of environmental conditions on N cycling.

How to cite: Ruiz-Checa, R., Elustondo, D., Ávila, A., Guerrieri, R., Walter, W., Mattana, S., and Alonso, R.: Biological nitrogen transformations within the tree canopy: seasonal variations and microbial contributions to nitrogen fluxes in a Mediterranean Holm oak forest, EGU General Assembly 2026, Vienna, Austria, 3–8 May 2026, EGU26-20602, https://doi.org/10.5194/egusphere-egu26-20602, 2026.

EGU26-20705 | Orals | BG1.6

Microbial superoxide production influences biogenic nitrogen dioxide formation in soils 

Ryan Mushinski, Megan Purchase, Jonathan Raff, and Deying Wang

Nitrogen dioxide (NO2) is a critical atmospheric pollutant and ozone precursor, yet biogenic soil sources remain poorly constrained. Current models assume soil NO2 flux is exclusively depositional. Here we demonstrate that soils can produce NO2 through microbial superoxide (O2) production. Using manipulative slurry experiments, native microbial communities produced 6-10 times more NO2 than sterile controls following NO exposure. Stimulating superoxide production with NADH increased NO2 formation 15-fold, while inhibiting NADH oxidase reduced production to near-sterile levels. Superoxide dismutase decreased NO2 production by 50-75%, and superoxide concentration explained 60% of variation in NO2 production rates. Addition of peroxynitrite to soil increased headspace NO2, confirming this intermediate as the mechanistic link. These findings reveal a novel pathway linking carbon and nitrogen cycling where heterotrophic decomposers facilitate biogenic NO to NO2 via superoxide chemistry, potentially explaining discrepancies between satellite observations and modelled soil NOx emissions.

How to cite: Mushinski, R., Purchase, M., Raff, J., and Wang, D.: Microbial superoxide production influences biogenic nitrogen dioxide formation in soils, EGU General Assembly 2026, Vienna, Austria, 3–8 May 2026, EGU26-20705, https://doi.org/10.5194/egusphere-egu26-20705, 2026.

Nutrient loss from land use is a major cause of water-quality problems worldwide. High inputs of nitrogen (N) and phosphorus (P) to rivers, lakes, and coastal waters drive eutrophication, reduce aquatic biodiversity, and damage ecosystem services. In many regions, policy frameworks such as the European Union Water Framework Directive require reliable estimates of nutrient pressures to support effective water-quality management. However, measured load data are often limited or inconsistent, particularly at large spatial scales. As a result, export-coefficient (EC) approaches are widely used to estimate nutrient losses from land use. A continuing challenge is ensuring that the coefficients applied are relevant to the environmental context and selected in a consistent and transparent way, especially when values are transferred from international studies.

This study develops a harmonised framework for selecting and applying nutrient export coefficients based on international literature. A structured decision-tree approach is used to systematically assess whether published export coefficients are suitable for application under different climatic and environmental conditions. Each coefficient is screened against six practical criteria: compatibility with local land-use systems, similarity of soil types, relevance of climatic setting, comparability of dominant hydrological pathways, suitability of reporting format for load calculation, and study reliability—evaluated based on the quality of methods, length of monitoring, and peer-review status.

The framework is demonstrated using Ireland as a case study, and the analysis also compares how different land-cover datasets influence national nutrient export estimates. Three datasets are used to explore the effect of spatial representation: the Irish National Land Cover Map 2018 and the CORINE 2012 and 2018 Land Cover maps. National nutrient exports are calculated by multiplying harmonised export coefficients by mapped land-use areas and compared with a national benchmark study, the Source Load Apportionment Model (SLAM).

Across the different land-cover datasets, nutrient export coefficients derived from the framework show strong agreement with SLAM in estimating national nitrogen loads. This suggests that the decision-tree framework supports the selection of export coefficients for dominant agricultural systems, which are the main drivers of nitrogen loss. In contrast, larger differences between SLAM and framework-based estimates are observed for phosphorus, particularly in peatlands, wetlands, and forestry areas. This reflects both the higher sensitivity of phosphorus to coefficient choice and the influence of land-cover representation. Differences between land-cover datasets lead to significant changes in the mapped extent of organic soils and semi-natural land uses, resulting in notable variation in national phosphorus estimates. These findings show that even when identical export coefficients are applied, national nutrient totals can vary substantially depending on the structure and resolution of the underlying spatial data.

Overall, this study demonstrates that combining harmonised export coefficients with high-resolution land-cover data provides a robust and adaptable basis for national-scale nutrient modelling. The close agreement with SLAM for nitrogen supports the validity of the approach for dominant agricultural pressures, while the divergence observed for phosphorus highlights the need for improved representation of peatlands, wetlands, and forestry in national frameworks. 

How to cite: Alighanbari, S.: Developing a harmonised framework to model nutrient emissions from land uses: a case study from Ireland, EGU General Assembly 2026, Vienna, Austria, 3–8 May 2026, EGU26-20909, https://doi.org/10.5194/egusphere-egu26-20909, 2026.

EGU26-21159 | Posters on site | BG1.6

Nitrogen legacies in agricultural soils? Evidence from long-term lysimeter balances and isotope analyses 

Stefan Werisch and Tiedke Alexandra

Nitrogen is a fundamental plant nutrient and important fertilizer in modern agriculture, while nitrate-based nitrogen losses from agroecosystems become an increasing problem in ground- and surface waters. To reduce the emission of nitrate from agricultural soil, substantial efforts were made in regulation and assessment of plant specific fertilizer needs to reduce fertilization excess. Unfortunately, those efforts have not yet led to a considerable reduction of nitrate loadings in ground and seepage water under agricultural land use. This lag of response is often explained with residence and transport times in groundwater and a potential contribution of nitrogen legacies accumulated in soils.

Since 1980 the water and solute balances of different soils under agricultural land use are investigated at the lysimeter station Brandis (Saxony, Germany). Additionally, historic marking experiments with 15N enriched fertilizers were performed on some of the investigated soils. The combination of the long-term nitrogen balances together with an 15N isotope measurement campaign clearly show, that in a broad range of soils:

  • a substantial amount of the historic fertilizer excess has accumulated in the soils
  • historic fertilizations with 15N enriched fertilizer are still visible in the top soils after 40 years of agricultural landuse
  • nitrogen residence times are independent of water transport times
  • nitrate loss from soil organic matter pools is a major source of nitrate lost by seepage water

Our results clearly show, that substantial nitrogen legacies from fertilization excess can accumulate in a broad range of soil types. It becomes evident that considering and understanding the dynamics of this biochemical nitrogen legacy in agricultural soils is key to explain the lag of response in water quality observations in ground- and surface waters.

How to cite: Werisch, S. and Alexandra, T.: Nitrogen legacies in agricultural soils? Evidence from long-term lysimeter balances and isotope analyses, EGU General Assembly 2026, Vienna, Austria, 3–8 May 2026, EGU26-21159, https://doi.org/10.5194/egusphere-egu26-21159, 2026.

EGU26-21533 | Orals | BG1.6

Investigating biological uptake of nitrous oxide (N2O)in soils 

James Benjamin Keane, Phil Ineson, James Moir, and Mark Hodson

Excessive emissions of greenhouse gases (GHGs), are driving uncontrolled planetary heating. This is already causing devastating consequences for our climate and to avoid the worst consequences of climate change, we mustn’t let global heating exceed 1.5°C.

Nitrous oxide (N2O) is 265 times as powerful a GHG as CO2 and persists in the atmosphere for 120 years, meaning today’s N2O emissions will still be affecting the climate in five generations’ time. Given the ongoing trajectory of global GHG emissions, we already require negative emissions technology to limit global heating to 1.5ºC

Current understanding is that the only process that consumes N2O in soils is complete denitrification, which occurs under extremely wet conditions when a proportion of N2O produced is converted to nitrogen gas and returned to the atmosphere. New technologies, however, have provided data which suggest that there may be a previously unknown biological process which consumes N2O in soils, under dry aerated conditions.

We will present initial data describing soils which have this capacity and discuss approaches to answer the following key questions: how N2O uptake occurs in soils; who is responsible; why these organisms take up N2O; where within the soil N2O uptake occurs; when it occurs and under what conditions and; how much N2O is drawn down.

How to cite: Keane, J. B., Ineson, P., Moir, J., and Hodson, M.: Investigating biological uptake of nitrous oxide (N2O)in soils, EGU General Assembly 2026, Vienna, Austria, 3–8 May 2026, EGU26-21533, https://doi.org/10.5194/egusphere-egu26-21533, 2026.

EGU26-204 | ECS | Orals | BG1.7

Moisture-driven controls on the stability of short-range order minerals and phosphorus cycling in tropical volcanic soils 

Juan Carlos Mendez, Cintya Solano-Solano, Manuel E. Camacho-Umaña, Agustin F. Solano-Arguedas, and Alexander Kaune

The pedogenic minerals in volcanic soils are predominantly composed of short-range order (SRO) aluminosilicates (e.g. allophane, imogolite) and Fe-hydr(oxides) (e.g. ferrihydrite), which influence the geochemical cycling of phosphorus (P). SRO minerals are metastable and can transform into more stable crystalline phases, a process influenced by environmental conditions like temperature and soil moisture. The present study aimed to analyze the variation in Fe and Al contents associated with SRO and their reactivity toward P across two soil toposequences with different soil moisture conditions on the Irazú Volcano, Costa Rica. Soil samples were collected from various horizons along an East-South (ES) toposequence (1734–2853 m.a.s.l.) with a consistently humid udic regime, and a West-South (WS) toposequence (1724–3178 m.a.s.l.) that transitions from a udic to a drier ustic regime when altitude decreases. Pedogenic forms of Fe, Al, and Si were operationally defined using ammonium oxalate (AO), dithionite-citrate (DC) and sodium pyrophosphate (Py) extractions. Phosphorus pools (P-Olsen, AO-extractable P (Pox), total P) were also quantified. Phosphorus adsorption was evaluated using batch experiments, and data were interpreted using the Langmuir equation and the mechanistic Charge Distribution (CD) model to estimate P adsorption capacity (Qmax) and reactive surface area (RSA) of the soils. In the humid ES toposequence, AO-extractable Al (Alox) and (Feox), Qmax and RSA, increased as altitude decreased. Those trends were attributed to the stable moisture along the altitudinal gradient and the increasing temperatures with decreasing altitude, favoring the formation and persistence of SRO minerals. In contrast, the WS toposequence showed no consistent trend with altitude, probably because the transition to ustic regime at lower altitudes promoted the transformation of SRO minerals into more crystalline phases. The P-Olsen/Pox ratio was low (<10%) across all samples and significantly lower in the ES toposequence, suggesting that the persistence of SRO minerals under humid conditions severely constrains P availability. An independent dataset of samples (n = 88) from the same study region corroborated the above findings. The udic soils showed a strong negative correlation between altitude and Alox (r = -0.80), Feox (r = -0.77), Pox (r = -0.53), and total C (r = -0.64). In ustic soils, the relationships were not evident and only Feox correlated with altitude (r = -0.63). The results show that soil moisture regime is a key factor regulating the persistence of highly reactive SRO minerals along altitudinal gradients. Thus, in humid regimes, persistent SRO minerals increase the capacity of soils to retain P and stabilize organic C, resulting in direct implications for P availability and cycling in these tropical volcanic landscapes.

How to cite: Mendez, J. C., Solano-Solano, C., Camacho-Umaña, M. E., Solano-Arguedas, A. F., and Kaune, A.: Moisture-driven controls on the stability of short-range order minerals and phosphorus cycling in tropical volcanic soils, EGU General Assembly 2026, Vienna, Austria, 3–8 May 2026, EGU26-204, https://doi.org/10.5194/egusphere-egu26-204, 2026.

EGU26-5410 | Posters on site | BG1.7

Spectroscopic analysis shows crandallite can be a major component of soil phosphorus 

Christian Vogel, Julian Helfenstein, Michael Massay, Ruben Kretzschmar, Ulrich Schade, René Verel, Oliver Chadwick, and Emmanuel Frossard

Phosphorus (P) bioavailability is crucial for the productivity of natural and agricultural ecosystems, and soil P speciation plays a major role therein. Better understanding of P forms present in soil is thus essential to predict bioavailability. However, P speciation studies are only as powerful as the reference spectra used to interpret them, and most studies rely on a limited set of reference spectra. Most studies on soil P forms differentiate between Ca-bound P (e.g. apatite), organic P, Fe-bound P, and Al-bound P. In our analysis of a Ca, Al, and P rich soil from the Kohala region of Hawaii, we identified the mineral crandallite, CaAl3(PO4)2(OH)5∙H2O, a mineral previously not considered to play a significant role in soils. Crandallite was first identified with powder X-ray diffraction. Subsequently reference spectra were collected, and the presence of crandallite was confirmed using micro-focused P K-edge X-ray absorption near edge structure (XANES) spectroscopy, micro-infrared spectroscopy, and solid-state 31P nuclear magnetic resonance (NMR) spectroscopy. Crandallite XANES spectra were distinct from other common XANES spectra due to the presence of features in the post-edge region of the spectrum. Linear combination fitting of bulk P K-edge XANES spectra allowed the determination of the proportion of crandallite to the total P content, indicating that crandallite comprises up to half, possibly even more of the soil P in the samples. Crandallite is therefore an important and potentially overlooked component of soil P, which pedogenically forms in soils with high P, Al, and Ca contents, where it could play an important role in P bioavailability.

How to cite: Vogel, C., Helfenstein, J., Massay, M., Kretzschmar, R., Schade, U., Verel, R., Chadwick, O., and Frossard, E.: Spectroscopic analysis shows crandallite can be a major component of soil phosphorus, EGU General Assembly 2026, Vienna, Austria, 3–8 May 2026, EGU26-5410, https://doi.org/10.5194/egusphere-egu26-5410, 2026.

Long-term phosphorus (P) fertilization has resulted in substantial P accumulation in Taiwanese rice paddy soils, with concentrations reaching several thousand mg kg⁻¹. To assess the phytoavailability of this legacy P to rice, soil P speciation was characterized using X-ray absorption near-edge structure (XANES) spectroscopy and a sequential extraction procedure, and quantified P accumulation in rice as soil-to-plant translocation. Despite lower total and extractable P, acidic soils showed greater soil-to-root P translocation, whereas alkaline soils contained larger soil P pools but exhibited more constrained P translocation. Sequential extraction and XANES consistently indicated the coexistence of Ca-bound P (Ca–P) and Fe-bound P (Fe–P) across the pH range, including species not predicted to dominate from thermodynamic considerations. In acidic soils, the persistence of Ca–P suggests a potentially available pool that may supply P through gradual dissolution. In alkaline soils, abundant Fe–P implies retention within mineral phases that could remain chemically labile over long timescales. Overall, these findings highlight the need to account for soil P speciation when evaluating legacy P use and guiding fertilizer management, and the information is essential for developing strategies to sustain rice growth while reducing or eliminating P inputs.

How to cite: Huang, Z.-L. and Wang, S.-L.: Decoupling Phosphorus Pools and Plant Uptake: Chemical Speciation and Phytoavailability of Legacy P in Taiwanese Rice Paddies, EGU General Assembly 2026, Vienna, Austria, 3–8 May 2026, EGU26-6111, https://doi.org/10.5194/egusphere-egu26-6111, 2026.

EGU26-6497 | ECS | Orals | BG1.7

Ubiquitos and dynamic phosphorus cycle mediated by marine fungi 

Kangli Guo and Zihao Zhao

Phosphorus (P) is essential for marine life, but fungal roles in the marine P cycle remain unclear despite the increasing recognition on marine fungal biomass. Using size-fractionated (0.8-5, 5-20, 20-180, 180-2000 µm) metagenomes and metatranscriptomes from the global epipelagic ocean, we reveal size-dependent fungal P metabolism dominated by Ascomycota . Pyrimidine metabolism dominates in the 20–180 µm fraction, whereas functions diversify in other sizes. Fungi on the largest particles (180-2000 µm) exhibit pronounced P uptake via transporters but limited extracellular alkaline phosphatase expression relative to smaller fractions. Signal peptide analysis indicates alkaline phosphotase (APase) as the main extracellular APase on large particles, yet overall AP expression remains modest and size-dependent. Linking P metabolism with carbohydrate and protein pathways shows coupling of P metabolism and carbohydrate/protein metabolism, suggesting acquisition of bioavailable P during particle degradation. Considering the notable biomass of marine fungi, these patterns imply an overlooked P sink and a particle-associated transfer route for P to fungal cells.

How to cite: Guo, K. and Zhao, Z.: Ubiquitos and dynamic phosphorus cycle mediated by marine fungi, EGU General Assembly 2026, Vienna, Austria, 3–8 May 2026, EGU26-6497, https://doi.org/10.5194/egusphere-egu26-6497, 2026.

EGU26-6796 | ECS | Posters on site | BG1.7

Analysis of phosphorus stock variation in soil and biomass during an Eucalyptus rotation: a step towards modelling the phosphorus cycle 

Philippine Dubertrand, Guerric le Maire, Adam da Cruz Rodrigues, José Leonardo de Moraes Gonçalves, Ivan Cornut, and Nicolas Delpierre

Forests play a fundamental role in supporting global biodiversity, supplying key resources such as timber, paper, and energy, and acting as one of the largest terrestrial carbon sinks. Forest productivity, however, is constrained by several environmental factors, including the availability of carbon dioxide (CO2) and essential nutrients such as nitrogen (N), phosphorus (P), and potassium (K). Over the past decades, an increasing number of terrestrial ecosystem models (TEMs) have incorporated representations of nutrient cycles, most frequently considering N (Zaehle et al. 2009, Vuichard et al. 2019) more rarely P (Goll et al. 2012, 2017, Jiang et al. 2024) and K (CASTANEA model, see Cornut et al. 2022a, b).

Our study contributes to that effort by focusing on to the quantification and modelling of phosphorus (P) cycles, based on data and model simulations from Eucalyptus plantations in Brazil. As a starting point, we studied the fluxes of P between the soil (i.e., soil organic and inorganic P stocks) and the trees (i.e., aboveground biomass and P stocks). To do so, we used data from a P fertilization experiment conducted at the Itatinga experimental station (University of Sao Paulo) with various forms of P fertilizers. Using allometric relations and concentration measurements, we quantified the mass of phosphorus in each compartment of the trees (leaves, branches, trunk wood, bark and roots) during the entire rotation and compared it to the variation of P stock in the soil, measured in different chemical forms.

Results showed that, compared to control conditions (no fertilizer added), phosphorus fertilization increased the tree biomass production, the amount of P accumulated in plant tissues, as well as increasing the soil P stocks. However, the magnitude of these effects depended on the type of fertilizer used. Complexed humic phosphate, designed to enhance phosphorus bioavailability, produced the highest tree biomass and phosphorus mineralomass. In contrast, rock phosphate was most effective at increasing total soil phosphorus stocks. This outcome aligns with previous findings, as rock phosphate is less readily absorbed by plants than more soluble forms. Accounting for the spatial heterogeneity in soil P concentrations proved essential when computing the ecosystem P. In 5 out of 6 treatments we observed apparent P losses (i.e. unclosed P balance), which may reflect underestimation of deep root biomass and P pools in deeper soil layers. By contrast, in rock phosphate treatment, apparent P gains probably stemmed from overestimations of soil P related to uncertainties in the estimation of soil P spatial variability.

Given limitations in the data, we are currently considering incorporating a simplified representation of soil P in the CASTANEA model, representing only a small number of phosphorus compartments (organic vs. mineral form and availability to trees).

How to cite: Dubertrand, P., le Maire, G., da Cruz Rodrigues, A., de Moraes Gonçalves, J. L., Cornut, I., and Delpierre, N.: Analysis of phosphorus stock variation in soil and biomass during an Eucalyptus rotation: a step towards modelling the phosphorus cycle, EGU General Assembly 2026, Vienna, Austria, 3–8 May 2026, EGU26-6796, https://doi.org/10.5194/egusphere-egu26-6796, 2026.

EGU26-7061 | ECS | Posters on site | BG1.7

Comparing turnover of soil organic phosphorus and bulk soil organic carbon in a 56-year oil palm chronosequence 

Ye Tian, Juan Carlos Quezada, and Marie Spohn

Soil organic phosphorus (SOP) can represent a large fraction of the total soil phosphorus pool, and its mineralization plays a key role in plant P supply. Phosphorylated organic compounds generally exhibit stronger adsorption to soil minerals than non-phosphorylated organic carbon, suggesting that SOP may cycle more slowly than bulk soil organic carbon (SOC). However, direct comparisons of SOP and SOC turnover times remain largely unknown due to methodological limitations.

Here, we investigated SOP turnover using soils from a 56-year chronosequence documenting the conversion of C₄ pasture to C₃ oil palm, thereby exploiting the natural δ¹³C contrast between vegetation types as an in situ tracer of carbon turnover. To specifically assess SOP dynamics, we applied a recently developed method to isolate SOP compounds from other soil organic compounds and quantified the δ¹³C signature of this SOP pool (Tian and Spohn, 2025). Turnover times of isolated SOP were then compared with those of bulk SOC across the chronosequence.

This study provides empirical data on SOP dynamics that are currently poorly represented in soil biogeochemical assessments and offers a transferable approach for disentangling phosphorus and carbon turnover in soils across ecosystems.


Reference

Tian, Y., & Spohn, M. (2025). A method to isolate soil organic phosphorus from other soil organic matter to determine its carbon isotope ratio. Soil Biology and Biochemistry, 210, 109911.


Acknowledgement

This research was funded by the European Research Council (ERC) (grant number 101043387).

How to cite: Tian, Y., Quezada, J. C., and Spohn, M.: Comparing turnover of soil organic phosphorus and bulk soil organic carbon in a 56-year oil palm chronosequence, EGU General Assembly 2026, Vienna, Austria, 3–8 May 2026, EGU26-7061, https://doi.org/10.5194/egusphere-egu26-7061, 2026.

EGU26-7661 | ECS | Posters on site | BG1.7

Long-term soil organic phosphorus dynamics: evidence from 14C time series 

Layla M. San Emeterio, Carlos A. Sierra, and Marie Spohn

Soil organic matter (SOM) dynamics involve interactions between carbon (C) and phosphorus (P) cycling; while organic phosphorus (OP) constitutes only a small fraction of total SOM, its long-term turnover remains poorly constrained and may strongly influence nutrient availability and long-term biogeochemical cycling. While organic carbon (OC) turnover has been extensively studied using radiocarbon (14C), OP dynamics are commonly assumed to mirror those of OC, despite evidence that phosphorylated compounds interact more strongly with soil minerals and may persist longer than non-phosphorylated compounds. Here, we use bomb-derived 14C as a tracer to investigate multi-decadal OP turnover in agricultural soils based on a technique that allows us to isolate soil OP to measure its isotopic signature [1].

We analysed archived topsoil samples (0–20 cm) collected between 1957 and 2019 from a long-term field experiment, replicated at three sites in southern Sweden. This time series spans the period of atmospheric bomb 14C enrichment caused by thermonuclear weapons testing in the late 1950s, and subsequent decline, enabling thus direct comparison of C incorporation into OC and OP pools over more than five decades. Using a recently developed extraction–precipitation approach [1], we isolated soil organic phosphorus (TPOP) and measured its Δ14C signature alongside the Δ14C signature of soil total OC.

At the beginning of the observation period, the Δ14C values of bulk soil organic carbon (TOC) were consistently lower than those of the total precipitated organic phosphorus (TPOP) fraction across all sites. Over time, Δ14C of bulk TOC increased, reflecting incorporation of bomb-derived radiocarbon, and subsequently declined following the decrease in atmospheric Δ14C. In contrast, Δ14C values of TPOP showed a slower, attenuated response compared to bulk TOC across the study period. This pattern indicates a slower incorporation of recently fixed carbon into the OP-associated pool relative to bulk soil organic carbon.

The attenuated Δ14C response of TPOP therefore suggests that OP-associated organic matter is preferentially stabilized within mineral-associated pools [2,3], leading to longer persistance compared to bulk soil organic carbon. Although TPOP accounted for only a small proportion of soil TOC (≤ 14%), its older radiocarbon signature indicates a distinct contribution to long-term SOM persistence.

Our results provide the first long-term, radiocarbon-based evidence that soil OP turns over more slowly than TOC, likely due to stronger mineral associations and reduced microbial accessibility. These findings support the view that carbon and phosphorus cycling in soils are partially decoupled at multi-decadal timescales, with OP turnover constrained not by pool size but by stabilization mechanisms.

References:

[1] Tian, Y., & Spohn, M. (2025). A method to isolate soil organic phosphorus from other soil organic matter to determine its carbon isotope ratio. Soil Biology and Biochemistry210, 109911.

[2] Kögel‐Knabner, I., Guggenberger, G., Kleber, M., Kandeler, E., Kalbitz, K., Scheu, S., Eusterhues, K., & Leinweber, P. (2008). Organo‐mineral associations in temperate soils: Integrating biology, mineralogy, and organic matter chemistry. Journal of Plant Nutrition and Soil Science, 171(1), 61-82.

[3] Spohn, M. (2020). Phosphorus and carbon in soil particle size fractions: A synthesis. Biogeochemistry, 147(3), 225-242.

Acknowledgement:

This research was funded by the European Research Council (ERC) (grant number 101043387).

How to cite: San Emeterio, L. M., Sierra, C. A., and Spohn, M.: Long-term soil organic phosphorus dynamics: evidence from 14C time series, EGU General Assembly 2026, Vienna, Austria, 3–8 May 2026, EGU26-7661, https://doi.org/10.5194/egusphere-egu26-7661, 2026.

EGU26-9236 | ECS | Orals | BG1.7

Disentangling the drivers of total and available phosphorus distributions in Swiss soils 

Jolanda E. Reusser, Anina Gilgen, Jérôme Schneuwly, Simon Baumgartner, Helge Aasen, Diane Bürge, and Juliane Hirte

Phosphorus (P) is essential for plant growth, but excessive accumulation in soils can pose environmental risks, particularly through losses into water bodies. However, despite large spatial variability in P concentration and availability, no nationwide map of soil P exists for Switzerland. Moreover, knowledge of the relative importance of management-related factors compared to soil chemical and pedoclimatic drivers on the distribution of total and available P remains limited.

This study aims to predict and explain the distribution of total and available P pools in Swiss topsoils. For this purpose, we combined machine-learning approaches (ML) using Random Forests with model interpretation based on Shapley values to identify the main drivers controlling the P distribution. As model input, we used total P data measured at 960 sites of the Geochemical Soil Atlas of Switzerland in combination with predictor variables representing land use, soil properties, as well as environmental and geological conditions. To further investigate P dynamics in agricultural soils, we integrated a dataset from the Swiss Proof of Ecological Performance (PEP) subsidy scheme, which comprises 14 years of soil analyses since 2010. Available P pools were operationally defined using CO₂ saturated water extraction as a proxy for immediately plant available P, and ammonium acetate - EDTA extraction (AAE10) representing a larger pool of exchangeable soil P. This dataset includes approximately 150’000 observations, allowing differentiation between arable land and grassland.

As expected, total P concentrations are significantly higher in arable land and in pastures/grasslands compared with forests and alpine areas. Accordingly, interpretable ML measures, including Shapley values, indicate that land use is the most important predictor, followed by the presence of nutrients such as nitrogen (N), potassium (K), and sulfur (S). In contrast, soil chemical properties (e.g. pH, soil organic carbon) and proxies for pedoclimatic conditions, such as temperature or lithology, are less important for the prediction on a national scale.

Across Switzerland, the lowest available P concentrations are observed in north-western and southern regions, whereas the highest concentrations were measured along the Swiss Plateau and in central and north-eastern Switzerland. While P concentrations extracted with CO₂ saturated water are similar between arable crops and grassland, arable soils exhibit systematically higher AAE10 extractable P. Further work will focus on identifying the main drivers of available P pools and their temporal changes across Switzerland, including data from remote sensing and other monitoring programmes.

By combining spatially resolved geochemical data, interpretable machine learning approaches, and long-term agricultural monitoring data, this study provides a framework for identifying key drivers of the distribution of P pools in Swiss soils, thereby supporting targeted and sustainable nutrient management strategies.

How to cite: Reusser, J. E., Gilgen, A., Schneuwly, J., Baumgartner, S., Aasen, H., Bürge, D., and Hirte, J.: Disentangling the drivers of total and available phosphorus distributions in Swiss soils, EGU General Assembly 2026, Vienna, Austria, 3–8 May 2026, EGU26-9236, https://doi.org/10.5194/egusphere-egu26-9236, 2026.

EGU26-10267 | ECS | Posters on site | BG1.7

Characterization and Dynamics of NaOH-Extractable Organic Phosphorus Species in Soils 

Yaqin Wang and Zheng Chen

Organic phosphorus (Po) plays a critical role in soil phosphorus (P) cycling, yet the behavior and fate of specific Po species remain poorly understood. In this study, ion chromatography coupled with inductively coupled plasma mass spectrometry (IC-ICP-MS) was employed to characterize NaOH-extractable Po species in two soil types, with a focus on their temporal dynamics and responses to soil degradation. Nine distinct phosphorus peaks were identified in soil extracts, of which four remain unidentified. Based on their occurrence patterns and sensitivity to environmental change, these Po species were classified into three groups: unstable species, detected only in fresh plant or algal materials; stable species, consistently present across all samples with minimal variation; and indicator species, exhibiting moderate sensitivity to environmental conditions. Notably, the indicator species α-glycerophosphate (α-gly) and an unidentified compound (P150) showed pronounced declines during degradation. Along a grassland degradation gradient, P150 concentrations decreased by 66% in highly degraded soils compared with non-degraded soils, while α-gly declined by 27%. In addition, IC-ICP-MS revealed a tenfold discrepancy between conventional colorimetric and direct Po measurements, indicating the dominance of recalcitrant macromolecular Po fractions in soils. These results provide new insights into the molecular-level dynamics of soil Po and highlight the importance of small-molecular Po species in sustaining soil fertility and ecosystem resilience.

How to cite: Wang, Y. and Chen, Z.: Characterization and Dynamics of NaOH-Extractable Organic Phosphorus Species in Soils, EGU General Assembly 2026, Vienna, Austria, 3–8 May 2026, EGU26-10267, https://doi.org/10.5194/egusphere-egu26-10267, 2026.

Phosphorus (P) availability has regulated terrestrial productivity over geological time, leaving a persistent imprint on ecosystem structure, biodiversity, and function. In tropical forests, strong soil P gradients are overcome by fine-tuned P use and acquisition strategies, enabling forests to maintain high productivity despite large differences in soil P supply. Rising atmospheric CO₂ increases biological P demand, making P constraints a central factor for tropical forest carbon sink capacity and a major source of uncertainty in future model projections. Climate change and human disturbances further disrupt plant–soil–microbial interactions and reconfigure P losses and recycling, raising questions about forest functioning and vulnerability.

I synthesize current understanding of tropical forest functioning across soil P gradients, focusing on the co-evolution of soil P pools, vegetation P acquisition strategies, and consequences for the forest carbon (C) cycle. Evidence on P acquisition spans “foraging” strategies in relatively P-rich systems to “mining” of less accessible P forms in highly weathered soils.

Building on this framework, I present model results showing that internal recycling of organic P pools plays a critical role in shaping carbon sink capacity and vulnerability under rising CO₂. Simulations with a terrestrial biosphere model across the Amazon reveal that CO₂ fertilization effects depend not only on background soil P, but also on the capacity of forest ecosystems to enhance enzyme-driven acquisition of rapidly recycled organic P, intensifying internal P recycling. This strategy occupies an intermediate position between foraging and mining, relying on carbon investment to increase turnover of actively cycling P. Such recycling may support short-term forest functioning while increasing sensitivity to P disruption and loss under global change.

Finally, I highlight how an upcoming CO₂ enrichment experiment in the Amazon will provide a unique opportunity to directly test these mechanisms and provide empirical constraints on how internal phosphorus recycling shapes tropical forest carbon sink capacity and vulnerability under global change.

How to cite: Fleischer, K.: Tropical Forests on a Phosphorus Loop: Internal Recycling Regulates Carbon Sink Capacity and Vulnerability under Global Change, EGU General Assembly 2026, Vienna, Austria, 3–8 May 2026, EGU26-12109, https://doi.org/10.5194/egusphere-egu26-12109, 2026.

The concentration of soil available P is influenced by multiple processes, including the input, loss, and transformation of available P. Phosphorus limitation in terrestrial ecosystems is considered a major issue that needs to be urgently addressed for ecosystem management and restoration. Microorganisms exert important effects on soil P cycling and regulate its availability. Alkaline phosphatase (ALP), primarily derived from soil microbes, is a key enzyme responsible for hydrolyzing organic phosphorurs.
In this study, we analyzed soil samples from uncultivated land to investigate the relationships among ALP gene abundance, enzyme activity, and soil chemical properties, including total carbon, phosphorus, and nitrogen. Quantitative PCR (qPCR) was used to quantify ALP-related genes, while 16S rRNA gene sequencing was employed to characterize microbial community structure. Species richness, Shannon diversity index, and available phosphorus levels were also measured to provide ecological context.
Our findings reveal complex interactions between microbial community composition, functional gene abundance, and phosphorus availability. Notably, ALP activity did not always correspond to gene abundance—particularly phoD—suggesting the influence of regulatory mechanisms, community diversity, or environmental constraints. Furthermore, correlations between microbial diversity and ALP activity varied, underscoring the nuanced role of community structure in functional gene expression.
This integrative approach highlights the importance of combining molecular, biochemical, and ecological data to enhance our understanding of phosphorus cycling in uncultivated soils and provides valuable insight into the microbial ecology of low-disturbance terrestrial ecosystems.

How to cite: Dawas, A., Ghose, A., and Kolton, M.: Linking phosphorus-solubilizing bacterial activity in uncultivated soils with soil chemical properties and key gene abundance, EGU General Assembly 2026, Vienna, Austria, 3–8 May 2026, EGU26-14119, https://doi.org/10.5194/egusphere-egu26-14119, 2026.

EGU26-14673 | Posters on site | BG1.7

A geospatial framework to model within-field phosphorus efficiency via proximal sensing and machine learning 

Kabindra Adhikari, Douglas Smith, and Chad Hajda

Phosphorus (P) is essential for crop production, yet inefficient management contributes to nutrient losses, water pollution, and eutrophication. Phosphorus use efficiency (PUE) is a key metric for balancing agronomic productivity with environmental sustainability. However, within-field spatial variability of PUE remains poorly understood. This study presents a spatially explicit framework integrating proximal sensing, field measurements, and machine learning to assess and map PUE in corn (Zea mays L.) systems from Central Texas, USA. Grain yield was measured with an Ag Leader yield monitor, while grain protein, oil, and starch were assessed using a CropScan grain quality sensor mounted to the combine. Apparent soil electrical conductivity (ECa) was mapped using a Veris platform to characterize soil spatial variability. Grain and soil P contents were determined from strategically selected locations using conditioned Latin hypercube sampling and scaled across fields through regression with CropScan measurements. PUE was calculated as the ratio of grain P removal to residual soil P plus applied fertilizer P. A Random Forest (RF) model was trained using ECa and terrain attributes to predict spatial patterns of PUE. The proximal sensing approach effectively captured P dynamics, with CropScan-based grain P predictions achieving R² up to 0.97. The RF model predicted PUE with high accuracy (R² = 0.78; RMSE = 0.01). ECa, elevation, and wetness index were the dominant drivers of PUE variability, with predicted values ranging from 0.02 to 0.25. Fields with higher residual soil P exhibited lower PUE, while P-limited fields showed greater efficiency. This framework enables high-resolution assessment of within-field PUE and supports precision P management to enhance productivity while reducing environmental impacts.

How to cite: Adhikari, K., Smith, D., and Hajda, C.: A geospatial framework to model within-field phosphorus efficiency via proximal sensing and machine learning, EGU General Assembly 2026, Vienna, Austria, 3–8 May 2026, EGU26-14673, https://doi.org/10.5194/egusphere-egu26-14673, 2026.

EGU26-15957 | ECS | Posters on site | BG1.7

Soil Legacy Phosphorus Reshapes the Soil–Plant Nutrient Continuum: Evidence from 77 Taiwanese Rice Paddies 

Yin-Chiao Chang and Shan-Li Wang

Legacy phosphorus (P) from long-term fertilization persists in farmland soils due to strong soil P fixation. Because P mobility and accumulation are linked to reactions with other elements, excessive soil P accumulation may alter nutrient translocation across the soil-rhizosphere-plant continuum, potentially disrupting crop nutrient homeostasis. To investigate these effects, this study collected samples from 77 rice paddies across Taiwan, which spanned a wide range of soil P levels. Element concentrations in soils and in rice (Oryza sativa L.) roots, shoots, and grains were analyzed using ICP-OES and ICP-MS after microwave digestion. Accumulation factors and translocation factors were subsequently calculated and compared with data from previous studies. The results showed that increasing soil P led to a significant increase in P concentration only in roots, but no corresponding increase in P concentrations in shoots or grains, indicating strong retention of excess P in roots. Magnesium (Mg) and zinc (Zn) concentrations in rice grains were lower than literature benchmarks, with Mg ranging from 865.0 to 1344.4 mg·kg⁻¹ (≈1400 mg·kg⁻¹ in previous studies) and Zn averaging 23.3 mg·kg⁻¹ (36.1 mg·kg⁻¹ in previous studies). As root P concentrations increased, the root-to-shoot translocation of both Mg and Zn decreased, suggesting that phosphate-driven binding and/or precipitation within the root system. Selenium (Se) concentrations in rice grains also showed a declining trend (averaging 0.01 mg·kg⁻¹) relative to previous soil-based studies (≈0.07 mg·kg⁻¹). Furthermore, Se accumulation in roots decreased with increasing soil phosphorus levels, suggesting competition between selenite (SeO₃²⁻) and phosphate (PO₄³⁻) during plant uptake and translocation. Manganese (Mn) in shoots averaged 303.6 mg·kg⁻¹, lower than the 560 mg·kg⁻¹ reported previously, and root Mn concentrations decreased with increasing soil P concentrations, suggesting that elevated P may reduce Mn availability through precipitation or adsorption processes under high P conditions. Overall, these results suggest that soil legacy P can alter the uptake and internal partitioning of multiple micronutrients in rice, and may reduce some micronutrients in grains. Mechanistic confirmation (e.g., root-phase speciation and transporter-level evidence) is needed to resolve the processes underlying these patterns.

How to cite: Chang, Y.-C. and Wang, S.-L.: Soil Legacy Phosphorus Reshapes the Soil–Plant Nutrient Continuum: Evidence from 77 Taiwanese Rice Paddies, EGU General Assembly 2026, Vienna, Austria, 3–8 May 2026, EGU26-15957, https://doi.org/10.5194/egusphere-egu26-15957, 2026.

EGU26-16317 | ECS | Posters on site | BG1.7

The divergent role of inorganic versus organic P during the Fe(II)-catalyzed transformation of ferrihydrite 

Sara Martinengo, Andrew R.C. Grigg, Andreas Voegelin, and Ruben Kretzschmar

In reduced soils, phosphorus (P) biogeochemistry is strongly governed by iron (Fe) oxides, particularly poorly crystalline ferrihydrite due to its large surface area. Ferrihydrite is metastable and naturally transforms into more stable phases such as lepidocrocite and goethite. Under reducing conditions, under reducing conditions, adsorption of Fe(II) on the Fe(III) oxyhydroxide surface catalyzes this transformation via iron atom exchange (IAE). Structural impurities, including retained anions and organic ligands, influence transformation kinetics and products. Stable 57Fe isotope tracer experiments showed that neither P nor organic ligands prevent initial IAE, but P strongly suppresses lepidocrocite and goethite recrystallization, whereas organic ligands were less effective.

P speciation in natural environments is complex and includes inorganic (Pin) and organic (Porg) forms. Porg, especially inositol phosphates, often dominates total soil P and acts as a long‑term sink when retained by poorly crystalline Fe oxides. Different P compounds interact differently with ferrihydrite surfaces, thereby potentially influencing its transformation products in various ways. However, to the best of our knowledge, the influence of P speciation on Fe(II)-catalyzed ferrihydrite transformation remains unexplored.

In this study, NAFe ferrihydrite (⁵⁴Fe: ~5.84%; ⁵⁶Fe: ~91.76%; ⁵⁷Fe: ~2.12%; ⁵⁸Fe: ~0.28%) co‑precipitated with inorganic P (Pin‑Fh) and/or organic P (inositol phosphate; Porg‑Fh) suspensions were spiked with a ⁵⁷Fe(II) stock solution (⁵⁷Fe = 97.3%) to reach a Fe(II):Fe(III) ratio of 0.14 mol/mol. Suspensions were incubated for 4 weeks at pH 6.0 (40 mM MES buffer). Variations in aqueous P and Fe(II) concentrations, as well as the Fe isotopic composition of the solution, used to track atom exchange between solid NAFe(III) and aqueous ⁵⁷Fe(II), were measured by inductively coupled plasma mass spectrometry (QQQ‑ICP‑MS). The mineral composition of the solid phase was determined by X‑ray diffraction (XRD), Fe extended X‑ray absorption fine structure (EXAFS) spectroscopy, and ⁵⁷Fe Mössbauer spectroscopy.

The obtained results demonstrate that neither inorganic nor organic P fully prevented IAE; however, Porg‑Fh showed a faster and overall greater exchange compared to Pin‑Fh. After 4 weeks of incubation, Porg‑Fh resulted in nearly complete atom exchange, while only 60% of the atoms were exchanged in Pin‑Fh. This effect can be attributed to the pronounced decrease in ferrihydrite surface charge induced by Porg co‑precipitation, which may have promoted aqueous Fe(II), especially at pH < 7.

After 2 weeks of incubation, XRD showed that Porg‑Fh progressively started to transform into lepidocrocite, while no changes were detected for Pin‑Fh. Fe‑EXAFS showed that initial Porg‑Fh transformed into 40% lepidocrocite, and high‑resolution Mössbauer temperature profiles further confirmed the presence of <10% goethite fractions. Pin‑Fh was nearly unchanged in Fe‑EXAFS, while Mössbauer showed a slight increase in blocking temperature, likely associated with increased mineral structural ordering.

The release of P into solution was <1% of the P initially retained in the solid and was entirely attributed to Pin. No Porg release was detected. Overall, our results indicate that ferrihydrite is an effective sink for P during Fe(II)‑catalyzed transformation. Porg is much more strongly retained than Pin, which likely limits its availability for biological degradation processes and favors accumulation over time.

How to cite: Martinengo, S., Grigg, A. R. C., Voegelin, A., and Kretzschmar, R.: The divergent role of inorganic versus organic P during the Fe(II)-catalyzed transformation of ferrihydrite, EGU General Assembly 2026, Vienna, Austria, 3–8 May 2026, EGU26-16317, https://doi.org/10.5194/egusphere-egu26-16317, 2026.

EGU26-17437 | ECS | Orals | BG1.7

How hydrological connectivity controls sediment phosphorus release in a river–floodplain system 

Michele Meyer, Matthias Koschorreck, Markus Weitere, Daniel Graeber, David Kneis, and Nuria Perujo

River–floodplain systems are multifunctional and hydrologically dynamic systems that provide key ecosystem services, including water storage and nutrient retention. Albeit reduced phosphorus (P) inputs to freshwater systems, eutrophication remains widespread. In shallow systems such as floodplains, sediment P released through microbial mineralisation can sustain high nutrient concentrations in water. Lateral hydrological connectivity further shapes sediment nutrient fluxes and microbial processes by changing biogeochemical conditions. However, the mechanistic pathways linking hydrological dynamics to sediment P release remain insufficiently understood.

Here, we synthesise findings from three complementary studies combining field campaigns along a hydrological river-floodplain gradient with experimental drought–rewetting incubations. We propose a framework in which hydrological connectivity functions as the ultimate driver, regulating microbial activity and organic matter quality, which in turn act as proximate drivers of sediment P release.

Across a hydrological gradient in a floodplain of the German Elbe River, we find that hydrological connectivity between floodplain water bodies and the main river consistently mediates sediment P release. Field measurements during floodplain connection and retraction phases revealed spatially distinct dynamics, with P release increasing progressively along the hydrological gradient during retraction. This pattern coincided with enhanced sediment phosphatase enzyme activity and organic matter concentrations. An experimental drought-rewetting incubation further showed that short-term drought modifies microbial controls on sediment P release but exerts weaker effects than long-term hydrological connectivity. Moreover, we observed P release under oxic conditions, which was linked to heterotrophic microbial carbon use and humic-like dissolved organic matter.

Our findings collectively suggest that P fluxes are shaped by hydrologically mediated shifts in microbial organic matter decomposition, with hydrological connectivity possibly defining the boundary conditions under which microbial processes operate. Ultimately, hydrological connectivity should be integrated into river–floodplain research for its simultaneous effects on phosphorus transport and turnover.

How to cite: Meyer, M., Koschorreck, M., Weitere, M., Graeber, D., Kneis, D., and Perujo, N.: How hydrological connectivity controls sediment phosphorus release in a river–floodplain system, EGU General Assembly 2026, Vienna, Austria, 3–8 May 2026, EGU26-17437, https://doi.org/10.5194/egusphere-egu26-17437, 2026.

EGU26-18787 | Posters on site | BG1.7

Regeneration and burial of phosphorus along a lake chain in a complex boreal catchment 

Tom Jilbert, Siqi Zhao, Jussi Vesterinen, and Olga Tammeorg

Phosphorus is transported laterally within river catchments due to weathering and erosion processes, but may also be retained on floodplains and in lake sediments. The balance between lateral transport and retention on the catchment scale is important in determining downstream impacts of phosphorus loading on water quality. In low-relief boreal environments with positive water balance, river catchments typically consist of complex lake chains connected by short lotic sections. The density of lakes enhances the potential for retention of phosphorus mobilized in upstream areas and thus protection of downstream water quality. However, the morphometry of individual lakes may impact upon retention capacity, through regulating sedimentation and redox conditions and thus also phosphorus regeneration.  Here we studied phosphorus retention in lake sediments in the Siuntionjoki river catchment in southern Finland. The 487 km2 catchment includes 65 lakes of at least one hectare in surface area, draining into the Gulf of Finland to the west of Helsinki. We monitored sedimentary phosphorus accumulation and release in 10 primary lakes along the axis of the main Siuntionjoki river during one annual cycle. In this contribution, we present first results of the project and discuss these in the context of known water quality variability in the catchment.     

How to cite: Jilbert, T., Zhao, S., Vesterinen, J., and Tammeorg, O.: Regeneration and burial of phosphorus along a lake chain in a complex boreal catchment, EGU General Assembly 2026, Vienna, Austria, 3–8 May 2026, EGU26-18787, https://doi.org/10.5194/egusphere-egu26-18787, 2026.

EGU26-19734 | Orals | BG1.7

Bioavailable dissolved organic carbon serves as a key regulator of phosphorus dynamics in stream biofilms  

Nuria Perujo, Daniel Graeber, Patrick Fink, Lola Neuert, Nergui Sunjidmaa, and Markus Weitere

Phosphorus (P) dynamics at the sediment-water interface of aquatic ecosystems are receiving increasing attention due to their implications for water quality. P uptake by microbial biofilms can serve as a mechanism to control and mitigate the risk of eutrophication. Microbial biofilms capture P both intracellularly and extracellularly. While the significance of extracellular P entrapment in biofilms in engineered systems has recently been established, little is known about its dynamics in aquatic ecosystems. Current research on eutrophication control predominantly emphasizes nitrogen, phosphorus, or nitrogen-phosphorus ratio-based approaches, often overlooking the potential indirect influence of bioavailable dissolved organic carbon (DOC) on P uptake by heterotrophic microorganisms.

In this study, we tested the effect of bioavailable DOC on P entrapment patterns in biofilms and in biofilm P-regulation mechanisms such as polyphosphate accumulation and alkaline phosphatase activity in semi-natural flow-through experimental flumes. Our results show that intracellular P entrapment, is limited by bioavailable DOC, while extracellular P entrapment is independent of bioavailable DOC and potential to offset intracellular P saturation.

We further demonstrate that DOC bioavailability influences benthic P cycling and that its implications may extend into critical areas of ecosystem functioning such as river self-purification, competitive resource utilization and organic P cycling.

How to cite: Perujo, N., Graeber, D., Fink, P., Neuert, L., Sunjidmaa, N., and Weitere, M.: Bioavailable dissolved organic carbon serves as a key regulator of phosphorus dynamics in stream biofilms , EGU General Assembly 2026, Vienna, Austria, 3–8 May 2026, EGU26-19734, https://doi.org/10.5194/egusphere-egu26-19734, 2026.

EGU26-20853 | Orals | BG1.7

Insights into soil phosphorus biogeochemistry using new NMR techniques and P fertilization experiments 

Jürgen Schleucher, Alessandro Ruda, Lucia Fuchslueger, and Reiner Giesler

Phosphorus is considered a limiting nutrient in many ecosystems, and is therefore likely to constrain global carbon sinks. A thorough understanding of organic P composition in soils is vital across fields, from agriculture to ecology. Organic phosphorus (P) is a large fraction of soil P, but its speciation is still poorly understood.

NMR spectroscopy gives important insights into the speciation of soil P, because each P species gives rise a specific signal, and information on molecular weight can also be obtained from NMR spectra. Here we present new methodology to define soil P speciation, results concerning identification of P monoesters in soils, and on P speciation in tropical ecosystems.

Orthophosphate monoesters, with are intrinsically linked to P biochemistry, make up a central region in 31P NMR spectra. This region often contains resolved signals overlaid on a background. The resolved signals have been identified, but the background hampers their quantification. More important, the background can represent a large fraction of soil P, but its P biogeochemistry is completely enigmatic.

We have previously reported that the background is not composed of macromolecular P species. Instead, measurements of the true linewidths of the signals revealed that the background is composed of hundreds of small-molecule P species (Haddad et al., 2024). Here we show that the background contains a large number of P monoesters, and we present data on their identity based on a combination of MS-metabolomics and new NMR experiments, to understand the origin and ecological significance of this large unexplored P pool.

Highly weathered soils in the tropics often contain low P levels. In two tropical forests in French Guiana, the effect of P fertilization in these ecosystems has been studied (Lugli et al., 2023). Here we present NMR data on the P speciation in the two forests which differ in nutrient status, and on the effect of P fertilization on P speciation.


Haddad, L.; Vincent, A. G.; Giesler, R.; Schleucher, J. Small Molecules Dominate Organic Phosphorus in NaOH-EDTA Extracts of Soils as Determined by 31P NMR. Sci. Total Environ. 2024, 931, 172496.

Lugli LF., Fuchslueger L et al. Contrasting responses of fine root biomass and traits to large-scale nitrogen and phosphorus addition in tropical forests in the Guiana shield. Oikos 2024:e10412

How to cite: Schleucher, J., Ruda, A., Fuchslueger, L., and Giesler, R.: Insights into soil phosphorus biogeochemistry using new NMR techniques and P fertilization experiments, EGU General Assembly 2026, Vienna, Austria, 3–8 May 2026, EGU26-20853, https://doi.org/10.5194/egusphere-egu26-20853, 2026.

To promote sustainable crop production, the use of synthetic mineral fertilisers must be reduced. Bio-based fertilisers (BBF) offer a sustainable alternative, but their adoption is hindered by a lack of understanding of their fertilising value and behaviour in soil. This is particularly crucial for phosphorus (P), a finite, non-renewable resource that limits crop productivity in 67% of soils worldwide and is subject to potential supplier monopolies.

The addition of BBF to soil introduces significant amounts of carbon (C) and nitrogen (N), which can greatly influence nutrient cycling driven by soil microorganisms. These microorganisms are key drivers of the P cycle, and their activity is often limited by the availability of C and N. Another source of C in soil is plant root activity, which continuously supplies a small amount of labile C during plant growth. Microbial communities may respond differently to this continuous C supply depending on previous C and N availability.

The overarching goal of the PRIME-P project is to achieve a mechanistic and dynamic understanding of soil P cycling mediated by microorganisms in relation to different forms of C and N introduced by BBF and plant roots. I propose using state-of-the-art approaches to evaluate the effects of BBF and root exudates on microbial P mobilisation. This will allow to address the following specific objectives:

  • Identify how regulating soil nutrient balance can positively affect microbial-P processing for plants
  • Determine how different BBF additions affect soil OM over time and influence microbial P mobilisation
  • Assess whether rhizosphere P priming occurs in soils that have received BBF
  • Enhance modelling capabilities for P derived from BBF

These objectives are fundamental for identifying more sustainable agricultural practices that promote nutrient circularity. They will address critical challenges in soil-plant-microorganism interactions, paving the way for scalable, bio-based solutions to sustainable soil fertility and beyond.


How to cite: Raymond, N. S.: Can microbial phosphorus mobilization be primed? Organic fertilisereffect on biological soil phosphorus cycling (PRIME-P), EGU General Assembly 2026, Vienna, Austria, 3–8 May 2026, EGU26-22251, https://doi.org/10.5194/egusphere-egu26-22251, 2026.

EGU26-1778 | ECS | Orals | BG1.10

Untangling root and microbial volatile organic compound emissions from soils of two different temperate tree species 

Mirjam Meischner, Alexej Steuerle, Riikka Rinnan, and Christiane Werner

The main sources of volatile organic compounds (VOCs) emitted from forest soils are roots and soil microorganisms. However, quantifying the relative contributions of these sources to net soil VOC emissions and the proportion of root VOCs degraded by soil microorganisms is challenging.

In order to partition soil VOC emissions into root and microbial VOC emissions, we conducted a controlled mesocosm experiment using Picea abies and Fagus sylvatica saplings, as well as soil (Cambisol) collected from a temperate forest dominated by these two species. VOC emissions from the soil surface (combined root and soil emissions), as well as from excavated roots and root-free bulk soil (sieved to 2 mm), were analyzed using PTR-TOF-MS and GC-MS. To evaluate the role of microorganisms as a source or sink of VOCs in the rhizosphere, microbial colonization of roots was modified by applying three washing treatments: (1) no washing (intact rhizosphere, high colonization), (2) water washing (partial removal of root microbiome, intermediate colonization), and (3) washing with 70% (v/v) ethanol (disinfection, reduced colonization), with 6 replicates per species and treatment.

This study aims to improve our understanding of the soil VOC fluxes in forest ecosystems by quantifying the contributions of roots and microorganisms to net soil VOC emissions, as well as the uptake of root VOCs by soil microorganisms.

How to cite: Meischner, M., Steuerle, A., Rinnan, R., and Werner, C.: Untangling root and microbial volatile organic compound emissions from soils of two different temperate tree species, EGU General Assembly 2026, Vienna, Austria, 3–8 May 2026, EGU26-1778, https://doi.org/10.5194/egusphere-egu26-1778, 2026.

EGU26-3031 | Posters on site | BG1.10

Soil compaction by forest management creates hotspots of BVOC emissions in a temperate mixed forest 

Hojin Lee, Tim Stippich, Jan Petersen, David Meine, Julian Brzozon, Markus Sulzer, Andreas Christen, Teja Kattenborn, Lea Dedden, Christiane Werner, and Jürgen Kreuzwieser

Soil emissions of biogenic volatile organic compounds (BVOCs) and their impacts at the ecosystem scale have been intensively studied. However, less attention has been paid to how forest management practices alter soil BVOC exchange by modifying soil physical and biogeochemical properties. In managed forests, timber harvesting operations frequently create skid trails, where repeated machine traffic leads to soil compaction and impaired drainage, potentially altering oxygen availability and microbial processes.

In this study, we investigated how soil property changes associated with skid trails influence BVOC exchange from the forest floor of the ECOSENSE forest, a temperate mixed forest. We combined field measurements of soil–atmosphere BVOC exchange at waterlogged skid trails and adjacent undisturbed forest floor with laboratory incubations of intact soil cores under controlled oxic and anoxic conditions.

Our results show that skid trail soils exhibit distinct BVOC emission patterns compared to well-drained forest soils. In particular, emissions of aromatic compounds, including toluene and the aromatic monoterpene p-cymene, increased markedly under waterlogged and oxygen-limited conditions. Emissions of several monoterpenes, such as α-pinene, camphene, limonene, and δ-3-carene were also enhanced.

Although skid trails cover only a small fraction of the forest area, our findings indicate that they can act as BVOC emission hotspots within forest ecosystems. This highlights that small-scale heterogeneity introduced by forest management can substantially influence ecosystem-level BVOC budgets and forest–atmosphere interactions.

How to cite: Lee, H., Stippich, T., Petersen, J., Meine, D., Brzozon, J., Sulzer, M., Christen, A., Kattenborn, T., Dedden, L., Werner, C., and Kreuzwieser, J.: Soil compaction by forest management creates hotspots of BVOC emissions in a temperate mixed forest, EGU General Assembly 2026, Vienna, Austria, 3–8 May 2026, EGU26-3031, https://doi.org/10.5194/egusphere-egu26-3031, 2026.

EGU26-3307 | ECS | Posters on site | BG1.10

Five months of BVOC flux measurements above a Pinus sylvestris forest stand in the Austrian Alps 

Judith Schmack, Werner Jud, Thomas Karl, Felix M. Spielmann, Georg Wohlfahrt, and Albin Hammerle

Biogenic Volatile Organic Compounds (BVOCs) are a group of highly reactive chemical compounds that are emitted by the terrestrial biosphere. They play a crucial role in atmospheric chemistry by contributing to the formation of tropospheric ozone, secondary organic aerosols (SOA) and cloud condensation nuclei, thereby influencing both air quality and climate processes. However, quantifying their exchange between ecosystems and the atmosphere remains challenging due to the interplay of measurement complexities, heterogeneous surface properties and vegetation variability.

For about five months from summer to autumn 2025, we conducted an intensive measurement campaign to study the BVOC fluxes at the University of Innsbruck’s Forest Atmosphere Interaction Research (FAIR) field site in Mieming, Tirol, Austria. The site is characterized by a Pinus sylvestris canopy with Juniperus communis understory and is equipped with a 30 m tall flux tower, a heated Teflon sampling line, and an air-conditioned instrument container. BVOC concentrations were measured using Proton-Transfer-Reaction Time-of-Flight Mass Spectrometry (PTR-ToF-MS), and turbulent fluxes were calculated via the eddy covariance technique.

Here, we investigate the temporal variability and environmental controls of BVOC fluxes with a focus on mono- and sesquiterpenes at the ecosystem scale. We further evaluate how well emission patterns align with findings from a laboratory study conducted in 2024 on saplings of the dominant species at the FAIR site, and plan to assess the performance of the MEGAN 2.1 emission model in reproducing the observed flux dynamics.

Our results provide new insights into the drivers of BVOC fluxes in an alpine forest and support the improvement of biosphere–atmosphere exchange parameterizations in emission models.

How to cite: Schmack, J., Jud, W., Karl, T., Spielmann, F. M., Wohlfahrt, G., and Hammerle, A.: Five months of BVOC flux measurements above a Pinus sylvestris forest stand in the Austrian Alps, EGU General Assembly 2026, Vienna, Austria, 3–8 May 2026, EGU26-3307, https://doi.org/10.5194/egusphere-egu26-3307, 2026.

EGU26-3388 | ECS | Posters on site | BG1.10

Ozone alters heat-driven Biogenic VOC responses: evidence from forest and urban tree species under sequential stress 

Biplob Dey, Clémence Depp, Yichen Gu, Toke Due Sjøgren, Peeyush Khare, Georgios Ι. Gkatzelis, Yizhen Wu, Sindhu Vasireddy, Alexander Knohl, Riikka Rinnan, Anna Novelli, Hendrik Fuchs, Thorsten Hohaus, and Eva Y. Pfannerstill

Predicting plant responses to changing climate, particularly to heat extremes and elevated near-ground ozone, is a key obstacle in robustly quantifying future biogenic volatile organic emissions (BVOCs) and understanding the climate feedback loop. Scaling BVOC emissions from leaf to landscape level and identifying stress-specific emission fingerprints require controlled-chamber experiments with sequential stress exposure that realistically mimic natural events.

In a climate-controlled chamber, periodic stress exposures were applied to forest (Fagus sylvatica L., Quercus robur L.) and urban tree species (Castanea sativa Mill., Tilia cordata Mill.) during summer 2024 and 2025. The forest species were exposed to heat (~40°C) and nocturnal ozone stress (100-120 ppb), while urban species experienced heat stress (~40°C) and a 72h simultaneous ozone exposure (100-120 ppb). BVOC emission fluxes were measured using proton-transfer reaction time-of-flight mass spectrometry and compared across pre-stress, heat, and combined heat–ozone conditions.

Heat stress strongly increased BVOC emissions, with urban tree species showing 2–8-fold increases in isoprene and ~3-fold increases in monoterpenes, along with elevated sesquiterpenes and green leaf volatiles. Forest species showed more selective heat-induced emissions, primarily in monoterpenes and green leaf volatiles. In contrast, combined ozone–heat stress following ozone exposure suppressed most BVOC emissions by 30–60%, largely independent of species, despite differing ozone treatments. The concurrent increase of methyl salicylate, a stress-alarm compound, emissions under combined stress compared to heat alone showed a non-additive physiological response. Heat stress consistently yielded the highest OH reactivity of BVOCs across all species and decreased by 10–30% following ozone-mixed heat exposure. A cross-investigation using machine learning and positive matrix factorization identified stress- and species-specific VOC fingerprints, with a good agreement.

These multi-stress experiments provide mechanistic insight into stress-induced BVOC emissions and could improve parameterizations of BVOC emissions in Earth system and air-quality models under increasing pollution and heat events.

How to cite: Dey, B., Depp, C., Gu, Y., Sjøgren, T. D., Khare, P., Gkatzelis, G. Ι., Wu, Y., Vasireddy, S., Knohl, A., Rinnan, R., Novelli, A., Fuchs, H., Hohaus, T., and Pfannerstill, E. Y.: Ozone alters heat-driven Biogenic VOC responses: evidence from forest and urban tree species under sequential stress, EGU General Assembly 2026, Vienna, Austria, 3–8 May 2026, EGU26-3388, https://doi.org/10.5194/egusphere-egu26-3388, 2026.

EGU26-4871 | ECS | Orals | BG1.10 | Highlight

Volatile compounds in cave ecosystems and their roles in subterranean carbon cycling 

Kajsa Roslund, Ana Sofia Reboleira, Kasun Bodawatta, Luka Civa, Anders Sommer, Michael Poulsen, and Riikka Rinnan

The composition of cave atmospheres is unknown beyond ventilation studies on carbon dioxide (CO2) and methane (CH4). The identities, concentrations, and roles of volatile organic compounds (VOCs) and their link to CO2 and CH4 – although crucial for understanding subterranean carbon cycling – remains unexplored. Caves also take part in gas exchange with terrestrial ecosystems and the atmosphere, acting as sources and sinks of reactive gases. However, the magnitude of this gas exchange, and the potential effects on local and global carbon budgets, has not yet been characterized.

We analyzed VOCs, CO2, CH4, and oxygen in situ from the air of two caves (in Loulé and Torres Novas) in the main karst massifs of Portugal, along with cave microbiomes in sediment samples. Additionally, we isolated bacterial and fungal species from the sediment samples and investigated their volatile fingerprints in vitro. We used headspace vials and sorbent tubes for the in situ and in vitro volatile sampling combined with analysis via mass spectrometric and optical spectroscopy methods. Cave microbial compositions were analyzed with metabarcoding of 16S rRNA (bacteria) and ITS (fungi) genes.

We will present novel data connecting cave atmospheric compositions to cave microbial carbon cycling, including analysis of the origin of volatiles through stable isotope analysis (13C). We also present data for seasonal and spatial variation in the cave atmospheric compositions. Our results suggest that cave atmospheres are dynamic rather than stable, affected by outside conditions, and therefore, potentially compromised by climate change. Conversely, we confirm that caves can act as sources and sinks for some reactive gases, suggesting that they can also impact the surrounding environment.

How to cite: Roslund, K., Reboleira, A. S., Bodawatta, K., Civa, L., Sommer, A., Poulsen, M., and Rinnan, R.: Volatile compounds in cave ecosystems and their roles in subterranean carbon cycling, EGU General Assembly 2026, Vienna, Austria, 3–8 May 2026, EGU26-4871, https://doi.org/10.5194/egusphere-egu26-4871, 2026.

EGU26-4991 | ECS | Posters on site | BG1.10

How does European beech smell under drought stress? Volatile responses across genetically diverse backgrounds 

Ting Tang, Toja Guerra, Domitille L. Coq—Etchegaray, Bernhard Schimd, Sergio R. Castro, Linus Reichert, Meredith C. Schuman, and Sofia van Moorsel

European beech (Fagus sylvatica) is widespread and dominant in many central European forests. Increasing drought stress due to climate change has caused severe damage in beech stands across the continent (Geßler et al., 2007; Leuschner, 2020). Volatile organic compounds (VOCs) are key ecological signals during drought, mediating within-plant responses and interactions with other plants and trophic levels (Baldwin, 2010). Understanding VOC responses in European beech is therefore important for future forest management under climate change. However, the volatile profiles of European beech under drought stress remain poorly studied.

In this study, we used 72 four-year-old European beech trees from seven provenances and 12 seed families (same maternal trees), assigning them to drought and control groups in a common garden located in Zurich, Switzerland. Drought-treated trees received no water for a total of 14 days, while the control group remained well watered throughout the experiment. VOCs were sampled at three time points for both groups: before drought, after 7 days of drought treatment, and after 14 days of re-watering. A “push–pull” system was used to actively collect headspace volatiles around each whole tree into Tenax tubes, and samples were analyzed using gas chromatography–mass spectrometry (GC–MS). Features were detected and aligned among samples using MZmine (Heuckeroth et al., 2024), and peak heights were analyzed with linear models and variance partitioning to identify VOC signals related to genetic background and drought stress.

We found that several monoterpenes displayed genetically specific emission patterns under well-watered conditions, reflecting underlying genetic differentiation in VOC physiology. During drought, a large proportion of the variation in VOCs was explained by drought treatment, while the variation attributed to seed family decreased substantially. In particular, monoterpenes and green leaf volatiles indicated strong activation of stress-response pathways. Notably, a subset of drought-induced VOCs remained elevated even after re-watering, suggesting a legacy effect of drought stress. Our results show that drought-related VOC signals can serve as valuable biomarkers for assessing drought stress in European beech, thereby improving our ability to monitor tree health under climate change.

How to cite: Tang, T., Guerra, T., L. Coq—Etchegaray, D., Schimd, B., R. Castro, S., Reichert, L., C. Schuman, M., and van Moorsel, S.: How does European beech smell under drought stress? Volatile responses across genetically diverse backgrounds, EGU General Assembly 2026, Vienna, Austria, 3–8 May 2026, EGU26-4991, https://doi.org/10.5194/egusphere-egu26-4991, 2026.

EGU26-5389 | ECS | Orals | BG1.10

Stress is in the air: BVOC emissions from beech and oak trees under combined heat stress and herbivory feeding 

Clémence Depp, Biplob Dey, Yichen Gu, Anna Novelli, Thorsten Hohaus, and Eva Pfannerstill

Biogenic Volatile Organic Compound (BVOC) emissions account for more than 70% of VOC global emissions and play a significant role in atmospheric chemistry due to their high reactivity. These compounds are naturally emitted by trees as they are involved in ecological processes such as plant communication and defense against biotic and abiotic stressors. However, climate change has increased those stress factors for trees, altering both magnitude and composition of BVOC emissions. Once oxidized in the atmosphere, BVOCs contribute to the production of Secondary Organic Aerosols (SOA) which are involved in cloud formation, mitigating the Earth’s radiative balance and impacting air quality. Investigating how emission rates and compositions are impacted by such stressors is essential in understanding how atmospheric chemistry is affected.

So far, most studies focused on coniferous trees and isolated stress factors, leaving broad-leaved trees and combined stress impacts understudied, although common. To address the gap, this study sheds light on the BVOC emissions from two common deciduous tree species in Europe: English oak (Quercus Robur), an isoprene emitter, and European beech (Fagus Sylvatica), a monoterpene emitter. They were successively exposed to herbivory feeding of gypsy moth larvae (Lymantria Dispar Dispar) then both herbivory and heat stress (up to ~40°C).

To quantify BVOC fluxes, the emissions were sampled from a climate-controlled plant-chamber (SAPHIR-PLUS) by PTR-TOF-MS coupled to a fastGC. Temperature ramp experiments were conducted under each condition to study the temperature sensitivity of terpenoid emissions in response to the different stressors.

Here, we present results from an intensive two-month campaign with focus on the main primary BVOC emissions. Preliminary results indicate that herbivory feeding increased monoterpenes emissions, but heat stress induced a stronger burst in emissions for both tree species, highlighting their role in plant defense response.

How to cite: Depp, C., Dey, B., Gu, Y., Novelli, A., Hohaus, T., and Pfannerstill, E.: Stress is in the air: BVOC emissions from beech and oak trees under combined heat stress and herbivory feeding, EGU General Assembly 2026, Vienna, Austria, 3–8 May 2026, EGU26-5389, https://doi.org/10.5194/egusphere-egu26-5389, 2026.

EGU26-6225 | ECS | Posters on site | BG1.10

Improving East Asian BVOC Emission Estimates via Machine Learning-Based Plant Functional Types Mapping  

jimin jung, Minjoong J. Kim, Dae-Ryun Choi, Sung-Chul Hong, Jae-Bum Lee, and Yonghee Lee

Biogenic volatile organic compounds (BVOCs) are dominant precursors of tropospheric ozone and secondary organic aerosols, making their accurate representation critical for air quality modeling. Current BVOC emission estimates rely heavily on satellite-derived Plant Functional Type (PFT) maps, which often exhibit substantial discrepancies and fail to capture detailed land-use characteristics in heterogeneous agricultural and urban landscapes. To address these limitations, this study developed a new regional PFT dataset by integrating field-surveyed forest information from the Korea Forest Service’s Forest Geographic Information System (FGIS). We applied a machine learning approach to extrapolate the high-resolution, observation-based PFT characteristics of the Korean Peninsula to the broader East Asian region, utilizing meteorological variables and satellite land-cover products as predictors. The generated PFT dataset was implemented into the biogenic emission module of the Community Multiscale Air Quality (CMAQ) model to evaluate its impact on air quality simulations. We validated the model performance by comparing simulated BVOC mixing ratios with airborne observations from the ASIA-AQ campaign. The results demonstrate that the proposed PFT dataset yields distinct spatial emission patterns compared to conventional satellite-based maps. Notably, the simulation showed improved consistency with observations, particularly over complex terrain and mixed land-use areas. These findings suggest that regionally optimized PFT inputs, grounded in field observations and machine learning, significantly reduce uncertainties in BVOC emission inventories and subsequent chemical transport modeling over East Asia.

Acknowledgment: This work was supported by the National Research Foundation of Korea(NRF) grant funded by the Korea government (MSIT) (No. RS-2025-16070879).

How to cite: jung, J., Kim, M. J., Choi, D.-R., Hong, S.-C., Lee, J.-B., and Lee, Y.: Improving East Asian BVOC Emission Estimates via Machine Learning-Based Plant Functional Types Mapping , EGU General Assembly 2026, Vienna, Austria, 3–8 May 2026, EGU26-6225, https://doi.org/10.5194/egusphere-egu26-6225, 2026.

EGU26-6630 | Orals | BG1.10

Environmental change is reshaping the temperature sensitivity of sesquiterpene emissions and their atmospheric impacts 

Efstratios Bourtsoukidis, Alex Guenther, Hui Wang, Theo Economou, Georgia Lazoglou, Aliki Christodoulou, Theo Christoudias, Anke Nölscher, Ana Maria Yañez-Serrano, and Josep Peñuelas

Air temperature is a critical regulator of ecosystem functions, including the release of biogenic volatile organic compounds (BVOCs) that mediate biosphere-atmosphere interactions. Among these, sesquiterpenes (SQTs) stand out for their dual role as ecologically significant compounds and highly reactive atmospheric constituents. Despite the inherently complex relationship between temperature and biogenic emissions, global emission estimates rely on simplistic parameterizations, assuming a fixed exponential response across all ecosystems and environmental conditions. Here, we synthesize two decades (1997–2019) of SQT emission studies, uncovering significant variability in temperature responses and basal emission rates driven by plant functional types (PFTs) and diverse environmental co-factors. When PFT-dependent parameterizations are integrated into emission-chemistry simulations, the results reveal sensitive feedbacks on atmospheric processes, including ground-level ozone (O₃) production and secondary organic aerosol (SOA) formation. Surprisingly, we identify a statistically significant decline in SQT temperature responses over time, suggesting that evolving environmental changes are reshaping the fundamental relationship between temperature and SQT emissions. This meta-analysis highlights the temperature sensitivity of sesquiterpenes (βSQT) as a key parameter at the interface of the biosphere, abiotic and biotic environmental change, and atmospheric processes, with cascading effects on air quality and climate.  Our findings emphasize the potential to consider βSQT as a "volatile stressometer" for ecosystem-atmosphere interactions, where environmental stresses regulate the emission responses, with cascading effects on atmospheric chemistry and wider implications for future climate-vegetation feedbacks.

How to cite: Bourtsoukidis, E., Guenther, A., Wang, H., Economou, T., Lazoglou, G., Christodoulou, A., Christoudias, T., Nölscher, A., Yañez-Serrano, A. M., and Peñuelas, J.: Environmental change is reshaping the temperature sensitivity of sesquiterpene emissions and their atmospheric impacts, EGU General Assembly 2026, Vienna, Austria, 3–8 May 2026, EGU26-6630, https://doi.org/10.5194/egusphere-egu26-6630, 2026.

EGU26-6635 | ECS | Posters on site | BG1.10

Quantifying BVOC emission rates and variability of three temperate marine macrophytes  

Max Gräfnings, Yuanyuan Luo, Jian Zhao, Kirsten Fossum, Frans Graeffe, Lu Lei, Jurgita Ovadnevaite, Mikael Ehn, and Camilla Gustafsson

Biogenic Volatile Organic Compounds (BVOC), emitted by Earth’s ecosystems, affect several chemical processes in the atmosphere that have profound climate impacts. Despite their climate relevance, global BVOC-budget estimations are still inaccurate and especially emissions originating from our oceans are poorly constrained. Marine macrophytes (i.e. macroalgae and seagrass) are a large and widespread organismal group whose BVOC emission rates are especially poorly quantified. In this study we set out to shorten this knowledge gap by quantifying ex situ with a PTR-TOF-MS the BVOC emission rates of three temperate macrophytes (Zostera marina, Fucus vesiculosus and Ulva intestinalis). To capture and increase our understanding of the variability of macrophyte BVOC-emissions, our quantifications were duplicated in two marine regions that vastly differ from each other, the eastern Atlantic (Ireland) and northern Baltic Sea (Finland). The three macrophytes emitted a large variety of BVOCs as 166 compounds were in total identified. Although many BVOCS were emitted by all macrophytes, significant differences were found in the total emission profiles, both between and within-species. Interestingly, the seagrass Zostera exhibited significantly higher overall BVOC emission rates per unit weight than the two macroalgae but also revealed clearly differing within-species emission profiles between the two regions. Of individual compounds, dimethyl sulfide (DMS) was emitted at the highest rates, but many other compounds (e.g., sesquiterpenes, C10H21O+) also showed notable emission rates. Although the most emitted BVOCs are commonly investigated compounds (e.g., DMS and terpenoids), our results show that the BVOC emissions are spread out over a large number of different compounds, suggesting that future studies would benefit from targeting a wider range of BVOCs than currently. Our results highlight macrophytes as highly variable sources of BVOCs, whose better inclusion into marine BVOC budgets should be strived for. However, more reliable data is needed, and future research should also focus on investigating the dynamics driving macrophyte BVOC emissions, their variability and eventual fate in the environment.

How to cite: Gräfnings, M., Luo, Y., Zhao, J., Fossum, K., Graeffe, F., Lei, L., Ovadnevaite, J., Ehn, M., and Gustafsson, C.: Quantifying BVOC emission rates and variability of three temperate marine macrophytes , EGU General Assembly 2026, Vienna, Austria, 3–8 May 2026, EGU26-6635, https://doi.org/10.5194/egusphere-egu26-6635, 2026.

EGU26-7499 | ECS | Posters on site | BG1.10

Combined Warming and Herbivory Stress Intensifies Isoprene Emissions and Alters CO2 Exchange in Arctic Shrubs 

Marta Contreras-Serrano, Riikka Rinnan, Jing Tang, and Tao Li

Arctic regions are experiencing rapid and disproportionate warming, with consequences for plant ecophysiology and the frequency and severity of insect herbivory outbreaks. Although the individual effects of warming and herbivory on Arctic vegetation and associated biosphere–atmosphere feedbacks have received increasing attention, their combined impacts remain insufficiently understood. Because climatic and biotic stressors frequently co‑occur, identifying whether their effects are additive, synergistic, or antagonistic is critical for predicting future ecosystem functioning.

We conducted a 13-week mesocosm experiment in controlled climate chambers using shrub-dominated plant communities (Salix spp.). The experiment included a 2-week acclimation, an 8-week treatment phase, and a 3-week recovery period. During the treatment phase, we applied four conditions: (1) ambient control, (2) warming (+5 °C, including a +5 °C heat wave in week 8), (3) herbivory by geometrid moth larvae (15 larvae added between weeks 5–7), and (4) combined warming and herbivory. CO₂ exchange was measured continuously throughout the experiment, while volatile organic compound (VOC) emissions via sorbent cartridges were quantified at four time points: weeks 8, 9, and 10 during treatments, and once in week 12, during the recovery period. Plant phenology was continuously monitored using greenness indices before, during, and after the 13-week experimental period.

Combined warming and herbivory strongly enhanced isoprene emissions by ~13-fold, whereas neither stressor alone produced a significant effect on VOC emissions. Isoprene emissions were highest in week 8, followed by a gradual decline during the following weeks, suggesting a transient stress-induced response. Phenological dynamics showed limited treatment sensitivity, although control plants exhibited a slower decline in greenness late in the season, suggesting that stressed plants may enter senescence earlier. CO₂ flux measurements indicated treatment-related trends in carbon exchange, though further analysis is ongoing.

Our results demonstrate that simultaneous climatic and biotic stressors can intensify VOC emissions and influence CO₂ exchange in Arctic shrubs, with potential consequences for atmospheric chemistry and carbon cycling. Incorporating multi‑stressor interactions into ecosystem models will be essential for accurately predicting vegetation–atmosphere feedbacks in a rapidly changing Arctic.

How to cite: Contreras-Serrano, M., Rinnan, R., Tang, J., and Li, T.: Combined Warming and Herbivory Stress Intensifies Isoprene Emissions and Alters CO2 Exchange in Arctic Shrubs, EGU General Assembly 2026, Vienna, Austria, 3–8 May 2026, EGU26-7499, https://doi.org/10.5194/egusphere-egu26-7499, 2026.

EGU26-11434 | ECS | Posters on site | BG1.10

Assessing the size-resolved chemical composition of 10-50 nm particles with an online DMA-VIA-MION-Orbitrap setup 

Henning Finkenzeller, Arttu Yli-Kujala, Ella Hirvensalo, Jian Zhao, Michel Attoui, Runlong Cai, Mrisha Koirala, Anna Bengs, Paxton Juuti, Aleksei Shcherbinin, Mikael Ehn, and Juha Kangasluoma

Measuring the molecular composition of small aerosol particles that have not yet grown to sizes of several 10 nm is difficult, predominately because of the little mass constituted by the particles. At the same time, composition measurements of the early particles would directly reveal the condensable species. Additionally, the chemical composition of these early particles controls the fate of the aerosol particles as it controls their robustness against evaporation. 
    The vaporization inlet for aerosols (VIA), coupled to an Eisele-type chemical ionisation (NO3-) inlet and a time-of-flight mass spectrometer, has been successfully demonstrated previously (Häkkinen et al 2023, Zhao et al 2023, Zhao et al 2023). Particles from a sample gas are first size selected by a differential mobility analyzer. Trace gases present in the gas phase are stripped by an active charcoal denuder. The particles are then evaporated in a sulfinert-coated stainless steel tube (OD ¼”) at temperatures up to 300 °C. The evaporated molecules are then delivered to a chemical ionization mass spectrometer. The concentration of particles entering the setup are monitored by a scanning mobility particle sizer. 
    Amending the experimental setup of the previous studies by a DMA for size selection before analysis, in this study we investigate how the aerosol composition differs between different particle sizes. Here, particles are first size-selected in a DMA, then vaporized in VIA. The resulting gases are ionized in a MION atmospheric pressure interface chemical ionization inlet using both positively and negatively charged reagent ions and detected in a polarity-switching high-resolution Orbitrap mass spectrometer. We demonstrate the general feasibility of the experimental approach in laboratory measurements using ammonium sulfate and a-pinene derived particles. 
    In ambient measurements, we show the ability to reach mass closure between the detected concentration of vaporized trace gases even at low particle sizes and low atmospheric particle concentration. We further present first results from a deployment of the novel approach to Mace Head, Ireland, where marine VOC emissions and the composition of 10-20 nm particles were targeted. Coordinated measurements of the gas and particle phase are used to constrain what species contribute to particle formation under the local conditions.  The work presents a step towards closing the measurement gap of nano-particle composition and contributes to a more complete understanding of aerosol formation from more complex gas mixtures.

How to cite: Finkenzeller, H., Yli-Kujala, A., Hirvensalo, E., Zhao, J., Attoui, M., Cai, R., Koirala, M., Bengs, A., Juuti, P., Shcherbinin, A., Ehn, M., and Kangasluoma, J.: Assessing the size-resolved chemical composition of 10-50 nm particles with an online DMA-VIA-MION-Orbitrap setup, EGU General Assembly 2026, Vienna, Austria, 3–8 May 2026, EGU26-11434, https://doi.org/10.5194/egusphere-egu26-11434, 2026.

EGU26-11489 | ECS | Posters on site | BG1.10

High Monoterpenoid Emissions from Scots Pine Litter Controlled by Moisture 

Yi Jiao, Sana M. James, Zhiyang Zhang, Kajsa Roslund, Irene Lehner, Tobias Biermann, Jing Tang, and Riikka Rinnan

Biogenic volatile organic compounds (VOCs) play important roles in atmospheric chemistry, yet most studies have focused on canopy emissions. Decomposition of forest litter, a major below-canopy VOC source, can substantially influence atmospheric oxidation and aerosol formation. Scots pine (Pinus sylvestris L.), one of the most widely distributed tree species across the boreal zone, produces terpene-rich litter that may represent a significant but understudied VOC source. Here, we incubated fresh needle litter under controlled temperature and moisture levels to quantify VOC and CO2 fluxes. Monoterpenoids overwhelmingly dominated emissions (91%), with oxygenated species such as camphor and 2,5-bornanedione being most abundant. Moisture was the main control: water addition increased monoterpenoid fluxes five- to seven-fold relative to drier treatments, consistent with stimulation of microbial activity. Temperature had a weaker but compound-specific influence, strongest for sesquiterpenoids. Isoprene increased while oxygenated VOCs declined over time, indicating a transition from stored-pool release to microbial processes. Specifically, the strong correlation between monoterpenoid and CO2 fluxes points to shared microbial processes and highlights the key role of moisture in VOC release from decomposing pine litter. This relationship may also offer a potential practical basis for estimating monoterpenoid emissions from pine-dominated forest floors using CO2 flux data.

How to cite: Jiao, Y., James, S. M., Zhang, Z., Roslund, K., Lehner, I., Biermann, T., Tang, J., and Rinnan, R.: High Monoterpenoid Emissions from Scots Pine Litter Controlled by Moisture, EGU General Assembly 2026, Vienna, Austria, 3–8 May 2026, EGU26-11489, https://doi.org/10.5194/egusphere-egu26-11489, 2026.

EGU26-11544 | Orals | BG1.10

Mirror image molecules and low volatility organic compounds emissions expose state ofrainforest stress 

Joseph Byron, Giovanni Pugliese, Carolina de A. Monteiro, Michelle Robin, Eliane Gomes Alves, Johanna Schuettler, S. Christoph Hartmann, Achim Edtbauer, Bianca Krumm, Nora Zannoni, Denisi Hall, Anywhere Tsokankunku, Cléo Q. Dias-Junior, Carlos A. Quesada, Hartwig Harder, Eftstratios Bourtsoukidis, Jos Lelieveld, and Jonathan Williams

Climate change is increasing the frequency and severity of Amazonian droughts, and El Niño events are predicted to become more intense and persistent. Despite this, the effects of drought on biogenic volatile organic compound (BVOC) emissions from tropical rainforests remain poorly understood. Chiral BVOCs like alpha-pinene, exist as mirror image pairs, known as enantiomers. Enantiomers have the same atmospheric reactivity, but are produced and emitted by different enzymes and internal leaf mechanisms. Abiotic stress can alter their relative emissions, suggesting enantiomer ratios could indicate stress severity. Here we present ambient concentrations from within the Amazon rainforest canopy of methyl salicylate, isoprene, monoterpenoids, and sesquiterpenoids from the Amazon rainforest spanning the 2023–2024 El Niño, the most severe drought ever recorded in the basin. Correlations between alpha-pinene enantiomers shifted with stress, aligning with weakening carbon dioxide uptake by vegetation and transition between de novo and storage emissions. Low- and high-stress zones, along with a recovery zone, were defined through alpha-pinene enantiomer correlations, revealing a metric for ecosystem stress. Isoprene and total monoterpenoid abundances showed little influence from El Niño, while total sesquiterpenoids increased by 122% across the El Niño duration. Unexpected emissions of lower-volatility sesquiterpene alcohols, including beta-eudesmol, alpha-eudesmol, and gamma-eudesmol, occurred during the wet season following the peak drought revealing an adaptation to adverse conditions linked to oxidative stress defence. Our results show how severe drought drives shifts in enantiomer ratios and isoprenoid composition in the atmosphere, reflecting underlying physiological changes as vegetation responds to abiotic stress.

How to cite: Byron, J., Pugliese, G., de A. Monteiro, C., Robin, M., Gomes Alves, E., Schuettler, J., Hartmann, S. C., Edtbauer, A., Krumm, B., Zannoni, N., Hall, D., Tsokankunku, A., Q. Dias-Junior, C., A. Quesada, C., Harder, H., Bourtsoukidis, E., Lelieveld, J., and Williams, J.: Mirror image molecules and low volatility organic compounds emissions expose state ofrainforest stress, EGU General Assembly 2026, Vienna, Austria, 3–8 May 2026, EGU26-11544, https://doi.org/10.5194/egusphere-egu26-11544, 2026.

EGU26-11845 | Posters on site | BG1.10

Geogenic and Biogenic Volatile Organic Compounds in an Arctic Permafrost Landscape 

Jesper Christiansen, Getachew Agmuas Adnew, Moritz Schroll, Christian Juncher Jørgensen, and Kajsa Roslund

Future warming of the Arctic may increase emissions of VOCs and GHGs, such as methane (CH4), into the atmosphere. Disintegration of cryospheric caps (permafrost and glaciers) can lead to increase in geogenic carbon emissions, alongside active layer biogenic emissions, and geogenic sources represent an overlooked feedback of atmospheric forcing from permafrost melting. However, the magnitudes, diversity, and partitioning of geogenic and biogenic VOCs and associated CH4 remain unknown, and therefore, we have limited understanding of how important different VOC and CH4 sources are for atmospheric interactions of melting Arctic permafrost landscapes.

We studied VOC and CH4 emissions in Nuussuaq (70°29′57.16″ N, 54°10′35.91″ W) in west Greenland with known natural geogenic gas and oil seeps. During a 10-day period, we collected gas samples from in situ gas seeps at lakes on top of geological fault zones, springs, and permafrost thaw ponds to capture the variation in VOC and CH4 compositions and emission rates in areas with different geogenic impacts. Furthermore, we measured net fluxes of VOCs, CH4, N2O and CO2 across a geomorphological and soil gradient (alluvial fan with sand to hydromorphic palsa rich in organic matter) underlain by permafrost, to gain insight into spatial drivers of diversity and partitioning of VOC and GHG fluxes in an Arctic landscape.

Preliminary results for VOCs across the geomorphological gradient show significant contribution to terrestrial emissions from vegetation, dominated by moss and Arctic shrubs, especially from the terpenes (+)-α-longipinene and (+)-camphor. Emission rates from waterbodies and wetland were smaller compared to terrestrial emissions, but VOC diversity was high, including compounds like acetone, 2-methylbutane, 2-ethyl-1-hexanol, benzaldehyde, and benzonitrile – potentially originating from both geogenic and biogenic sources. However, terpenes dominating terrestrial emissions were also observed abundantly in the water samples. In addition to VOCs, we will also present the flux data on CH4, N2O and CO2 and VOC data for lakes and springs to corroborate whether geogenic VOC’s are emitted. 

How to cite: Christiansen, J., Adnew, G. A., Schroll, M., Juncher Jørgensen, C., and Roslund, K.: Geogenic and Biogenic Volatile Organic Compounds in an Arctic Permafrost Landscape, EGU General Assembly 2026, Vienna, Austria, 3–8 May 2026, EGU26-11845, https://doi.org/10.5194/egusphere-egu26-11845, 2026.

EGU26-12967 | Orals | BG1.10

European Biogenic Volatile Organic Compound Emissions Based on Land Surface Modelling and Satellite Data Assimilation 

Paul Hamer, Miha Markelj, Oscar Rojas-Munoz, Bertrand Bonan, Jean-Christophe Calvet, Virginie Marécal, Alex Guenther, Heidi Trimmel, Islen Vallejo, Sabine Eckhardt, Gabriela Sousa Santos, Katerina Sindelarova, David Simpson, Norbert Schmidbauer, and Leonor Tarrasón

Biogenic volatile organic compound (BVOC) emissions from European vegetation are a major precursor of tropospheric ozone and remain a key uncertainty in regional air-quality modelling. We present two high-resolution (0.1° × 0.1°) European BVOC emission datasets developed within the EU SEEDS project aimed at supporting scientific development within Copernicus Atmospheric Monitoring Service (CAMS). The datasets include BVOC species consistent with the RACM chemical mechanism and are generated by coupling the SURFEX land surface model with the MEGAN3.0 emission model.

Emissions based on two land surface model simulations were analysed: (i) an open-loop SURFEX simulation available for 2018–2022, and (ii) a data-assimilation simulation in which satellite leaf area index (LAI) observations are assimilated, available for 2018–2020. In both cases, SURFEX is configured to allow vegetation phenological responses to meteorological variability, enabling a realistic representation of phenology. Evaluation against independent datasets shows that both simulations capture temporal variability in LAI and root-zone soil moisture, with improved skill in the analysis configuration.

Given its importance for atmospheric chemistry, we focus on isoprene emissions. Interannual and seasonal variability in isoprene emissions is shown to be primarily driven by LAI variability, with specific events (e.g. summer 2019) linked to drought-induced vegetation stress simulated by SURFEX. Daily variability in isoprene emissions is evaluated against in-situ online isoprene concentration measurements at eight western European sites, revealing moderate to strong correlations across most site-year combinations. Comparisons with other bottom-up European isoprene inventories show that SURFEX-MEGAN3.0 emissions lie between the lower CAMS-GLOB-BIOv3.1 and higher MEGAN-MACC estimates, with differences in seasonality attributable largely to the underlying LAI datasets.

These results highlight the important role of vegetation phenology, particularly LAI variability, in controlling BVOC emissions on monthly to interannual timescales, and demonstrate the added value of an Earth-system approach for BVOC emission modelling in support of air-quality assessments.

References

Hamer, . D., Markelj, M., Rojas-Munoz, O., Bonan, B., Calvet, J.-C., Marécal, V., Guenther, A., Trimmel, H., Vallejo, I., Eckhardt, S., Sousa Santos, G., Sindelarova, K., Simpson, D., Schmidbauer, N., and Tarrasón, L.: Two Biogenic Volatile Organic Compound Emission Datasets over Europe Based on Land Surface Modelling and Satellite Data Assimilation, Earth Syst. Sci. Data Discuss. [preprint], https://doi.org/10.5194/essd-2025-442, in review, 2025.

How to cite: Hamer, P., Markelj, M., Rojas-Munoz, O., Bonan, B., Calvet, J.-C., Marécal, V., Guenther, A., Trimmel, H., Vallejo, I., Eckhardt, S., Sousa Santos, G., Sindelarova, K., Simpson, D., Schmidbauer, N., and Tarrasón, L.: European Biogenic Volatile Organic Compound Emissions Based on Land Surface Modelling and Satellite Data Assimilation, EGU General Assembly 2026, Vienna, Austria, 3–8 May 2026, EGU26-12967, https://doi.org/10.5194/egusphere-egu26-12967, 2026.

EGU26-13173 | ECS | Posters on site | BG1.10

BVOCs and CO₂ fluxes under an herbivory outbreak in a Subarctic Birch Forest 

Albert Egea Guevara, Thomas Holst, Cleo L. Davie-Martin, Jolanta Rieksta, Amy Smart, Riikka Rinnan, and Roger Seco

Subarctic forests act as major emitters of biogenic VOCs and important carbon sinks whose balance can be rapidly altered by biotic and abiotic stressors. We analyzed the diel cycles of major VOCs during the growing seasons of 2021, 2022, and 2023 in a subarctic mountain birch forest (Betula pubescens) near Abisko, northern Sweden. Herbivory stress caused by caterpillar outbreaks was associated with changes in VOC emissions, particularly during the complete defoliation event in 2023, highlighting the importance of incorporating VOC dynamics into assessments of ecosystem responses to disturbance and climate change.
Complementing VOC observations, we examined CO₂ fluxes using four years (2021-2024) of eddy covariance data. The 2023 outbreak transformed the forest from a near-neutral carbon balance to a strong source (annual NEE = +150.147 gC m⁻²), compared to modeled undisturbed conditions predicted by RandomForest (+0.195 gC m⁻²) and LPJ-GUESS (−102.637 gC m⁻²). In the recovery year (2024), the observed balance returned to +5.168 gC m⁻². These findings demonstrate that insect outbreaks simultaneously disrupt carbon dynamics and biogenic VOC emissions, reinforcing the need to integrate both processes into models of northern ecosystems under climate change.

How to cite: Egea Guevara, A., Holst, T., Davie-Martin, C. L., Rieksta, J., Smart, A., Rinnan, R., and Seco, R.: BVOCs and CO₂ fluxes under an herbivory outbreak in a Subarctic Birch Forest, EGU General Assembly 2026, Vienna, Austria, 3–8 May 2026, EGU26-13173, https://doi.org/10.5194/egusphere-egu26-13173, 2026.

EGU26-13216 | ECS | Posters on site | BG1.10

Effects of temperature and soil water parameterization improvements in MEGAN-CLM Isoprene emissions: a model-observations assessment. 

Matteo Mastropierro, Bárbara Cardeli, and Daniele Peano

Isoprene accounts for half of the global BVOC emissions from terrestrial ecosystems. Consequently, refining its representation in numerical models is essential for accurately assessing its effects on Ozone and Secondary Organic Aerosols and, more generally, on the role of vegetation in modulating atmospheric physico-chemical processes. Here, we present an analysis and preliminary results of an improved parameterization of Isoprene emissions factor sensitivity to water availability and surface air temperature within the MEGAN model coupled with the Community Land Model (CLM-4.5). Overall, by comparing our results with three (quasi-)observational datasets, the new parameterization yielded more accurate estimates of global annual Isoprene emissions, despite still exhibiting less pronounced seasonal variability. Notably, more realistic values are obtained in the Arctic during boreal summer, as well as stronger emission reductions occur during periods of droughts in the tropics and in subtropical latitudes. Although uncertainties still persist in specific geographic regions, we investigate the specific model and environmental factors contributing to these discrepancies.

How to cite: Mastropierro, M., Cardeli, B., and Peano, D.: Effects of temperature and soil water parameterization improvements in MEGAN-CLM Isoprene emissions: a model-observations assessment., EGU General Assembly 2026, Vienna, Austria, 3–8 May 2026, EGU26-13216, https://doi.org/10.5194/egusphere-egu26-13216, 2026.

EGU26-16671 | Posters on site | BG1.10

Total ozone reactivity measurements indicate unidentified biogenic emissions 

Arnaud P. Praplan, Steven J. Thomas, Ryan W. Daly, Jeong-Hoo Park, Wei Wang, Anssi Liikanen, Hélène Angot, Jacques Hueber, Federico Bianchi, Alex Guenther, and Detlev Helmig

Total ozone (O3) reactivity measurements are rare, even though they are an important tool to assess the extent of the identification and quantification of volatile organic compounds (VOCs) reacting with ozone. This includes a large fraction of VOCs from biogenic sources such as trees and other vegetation. So far, only a few studies have investigated total O3 reactivity from biogenic emissions under controlled conditions (Matsumoto, 2014; Sommariva et al., 2020) or in situ (Thomas et al., 2023). In the present study, we compile previously unreported measurements of total O3 reactivity made during four distinct campaigns conducted between 2010 and 2020.

Two total ozone (O3) reactivity monitors (TORMs; Helmig et al., 2022) were used. The first one at the University of Michigan Biological Station (UMBS) during the 2010 CABINEX campaign to study emissions from red oak, white pine, red maple, and bigtooth aspen, and at the Alabama Aquatic Biodiversity Center (AABC) during the 2013 Southeast Oxidant Aerosol Study (SOAS) campaign to study emissions from sweetgum, white oak and loblolly pine. The second TORM was used at the University of Alaska Toolik lake field station (TFS) in 2019 to study emissions from tundra surface vegetation and at a boreal fen in Finnish Lapland (Lompolojänkkä) in 2020 to study emissions from the fen’s surface. Simultaneously, the chemical composition of the emissions was analysed by chromatographic methods.

TORM directly measures the amount of ozone lost in its reactor when O3 is mixed with sampled air. However, the derivation of total O3 reactivity from the measured O3 loss is not straightforward, particularly in the presence of fast-reacting compounds, such as β-caryophyllene. This invalidates the assumptions made in the equation used to calculate total O3 reactivity. For a more straightforward approach, we compared the measured O3 loss in the reactor against the expected O3 loss, which is modelled from identified VOCs and their reaction rate coefficients with O3. In most cases, the measured O3 loss was found to be higher than the expected one. Even after considering the uncertainties related to the quantification of VOCs, uncertainties of reaction rate coefficients, and uncertainties related to the direct measurement of O3 in TORM, unexplained O3 losses were consistently found during daytime, indicating unidentified biogenic VOC emissions.

References

Helmig, D., A. Guenther, J. Hueber, R. W. Daly, W. Wang, J.-H. Park, A. Liikanen, and A. P. Praplan. (2022). Ozone reactivity measurement of biogenic volatile organic compound emissions, Atmos. Meas. Tech., 15, 5439.

Matsumoto, J. (2014). Measuring Biogenic Volatile Organic Compounds (BVOCs) from Vegetation in Terms of Ozone Reactivity, Aerosol Air Qual. Res., 14, 197.

Sommariva, R., L. J. Kramer, L. R. Crilley, M. S. Alam and W. J. Bloss. (2020). An instrument for in situ measurement of total ozone reactivity, Atmos. Meas. Tech., 13, 1655.

Thomas, S. J., T. Tykkä, H. Hellén, F. Bianchi and A. P. Praplan. (2023). Undetected biogenic volatile organic compounds from Norway spruce drive total ozone reactivity measurements, Atmos. Chem. Phys., 23, 14627.

How to cite: Praplan, A. P., Thomas, S. J., Daly, R. W., Park, J.-H., Wang, W., Liikanen, A., Angot, H., Hueber, J., Bianchi, F., Guenther, A., and Helmig, D.: Total ozone reactivity measurements indicate unidentified biogenic emissions, EGU General Assembly 2026, Vienna, Austria, 3–8 May 2026, EGU26-16671, https://doi.org/10.5194/egusphere-egu26-16671, 2026.

EGU26-16883 | ECS | Posters on site | BG1.10

BVOC Emissions from Mediterranean Urban Shrubs: Implications for Ozone Formation and Air Quality 

Mame Fatou Ndoye Paye, Manon Rocco, Amandine Durand, Anne Monod, and Julien Kammer

Urban greening strategies are increasingly implemented to mitigate urban heat island, restore biodiversity, improve urban carbon balance and improve air quality. Yet vegetation can emit biogenic volatile organic compounds (BVOCs) that influence atmospheric chemistry. BVOCs react with oxidants such as ·OH and NO₃· radicals and O₃, contributing to secondary air pollutants such as tropospheric ozone and secondary organic aerosol (SOA). While emissions from trees in forest ecosystems are well documented, urban environments feature diverse plant types, with shrubs being the most planted type of plants in greening strategies but rarely studied in terms of VOC emissions. The few studies on mediterranean shrubs mostly focused on rosemary and thyme, and were limited to terpene emissions (isoprene, monoterpenes and sesquiterpenes, (Malik et al., 2023; Duan et al., 2023; Bourtsoukidis et al., 2024; Pei et al., 2025)) while their volatilome is probably more complex as for other plant species (Gonzaga Gomez et al., 2019; Furnell et al., 2024).

This study is aimed at providing a complete characterization of BVOC emissions from six common Mediterranean shrub species in Marseille (France), and at evaluating their potential contribution to secondary air pollution. Six species were investigated, and selected based on their abundance and their potential use in vegetation initiative : Rosmarinus officinalis, Thymus vulgaris, Photinia fraseri, Euphorbia characias, Viburnum tinus and Ligustrum vulgare. Dynamic enclosure measurements were used to collect BVOCs for 3 different commercial plants. A non-target approach combining online and offline measurement techniques was used to characterise BVOC emissions. Proton Transfer Reaction Time of Flight Mass Spectrometry (PTR-ToF-MS) was used for online measurements, complemented by VOC sampling on TENAX tubes, analyzed by GC-MS, mainly for monoterpene speciation.

Emission profiles revealed high chemical diversity, ranging from 45 compounds in Ligustrum vulgare to 91 VOCs in Thymus vulgaris emissions. Oxygenated VOCs (OVOCs) dominated the emissions of all species (60–66%) including Thymus vulgaris and Rosmarinus officinalis, which have previously only been considered monoterpene emitters (Gros et al., 2022; Francolino et al., 2023). The emissions of OVOCs such as methanol, acetone, and acetic acid often exceeded those of monoterpenes. The non-target approach used here enabled the detection of unexpected compounds, such as dimethyl sulfide (DMS, C2H6S), typically associated with marine sources, suggesting specific processes that will be discussed.

Ozone Formation Potential (OFP) varied over several orders of magnitude among the 6 species: Rosmarinus officinalis (43.7 g O₃ g VOC⁻¹), Thymus vulgaris (13.1 g O₃ g VOC⁻¹), Photinia fraseri (6.8 g O₃ g VOC⁻¹), Euphorbia characias (3.5 g O₃ g VOC⁻¹), Viburnum tinus (1.7 g O₃ g VOC⁻¹), and Ligustrum vulgare (0.2 g O₃ g VOC⁻¹). The SOA formation potential of these emissions also warrants further investigation to fully assess their contribution to urban atmospheric reactivity. These results indicate that species selection in urban greening projects can strongly influence air quality outcomes. Our findings provide emission factors for Mediterranean shrubs and highlight the need to integrate BVOC data into urban vegetation planning to minimize the formation of secondary pollutant.

How to cite: Paye, M. F. N., Rocco, M., Durand, A., Monod, A., and Kammer, J.: BVOC Emissions from Mediterranean Urban Shrubs: Implications for Ozone Formation and Air Quality, EGU General Assembly 2026, Vienna, Austria, 3–8 May 2026, EGU26-16883, https://doi.org/10.5194/egusphere-egu26-16883, 2026.

EGU26-17178 | ECS | Orals | BG1.10

 Impact of phytoplankton blooms on marine VOCs emission  

Cecilia Costas Selas, Mehrshad Foroughan, Suman Som, Eve Galen, Joseph Donald Martin, Ane Helberg, Simon Rohard, Klara Li Termansen, Riikka Rinnan, and Lasse Riemann

Volatile organic compounds (VOCs) are diverse bioactive molecules of low molecular weight and high vapor pressure. VOCs are produced by biotic and abiotic processes and are important for atmospheric chemistry as main biogenic precursors of secondary organic aerosols. In marine environments, the phytoplankton are the main source of marine VOCs, which appear to be an important source of organic compounds fueling bacterioplankton growth. Increased eutrophication and rising temperatures will likely increase intensity of coastal phytoplankton blooms in the coming decades with the potential cascading consequence of elevated VOC production rates and emissions. To assess VOC production by a phytoplankton bloom, we conducted a mesocosm experiment where VOC production by natural, unaltered microbial communities were compared to that by a phytoplankton bloom induced by nutrient amendment. VOCs were measured by combining a purge-and-trap system with a high-sensitivity proton-transfer reaction time-of-flight mass spectrometer (PTR-TOF-MS). Using 16S rRNA and 18S rRNA sequencing data, we analyzed the prokaryote and eukaryote community composition and the effect of their relationships on the VOC composition and concentration. The concentration and composition of VOCs changed over the course of the phytoplankton bloom, and some VOCs were significantly higher in the phytoplankton bloom than in the unaltered microbial communities.  A strong and significant correlation was found between the bacterial and eukaryotic communities, and VOCs. In addition, permutation analysis showed how the relationships between phytoplankton and bacteria can modify the composition of VOCs. These results evidence the effect of phytoplankton-bacteria relationships in marine VOC emissions.

How to cite: Costas Selas, C., Foroughan, M., Som, S., Galen, E., Martin, J. D., Helberg, A., Rohard, S., Termansen, K. L., Rinnan, R., and Riemann, L.:  Impact of phytoplankton blooms on marine VOCs emission , EGU General Assembly 2026, Vienna, Austria, 3–8 May 2026, EGU26-17178, https://doi.org/10.5194/egusphere-egu26-17178, 2026.

EGU26-17215 | Posters on site | BG1.10

Forest floor VOC emissions in a mountain pine–juniper stand: magnitudes, composition, and implications for ecosystem-scale fluxes 

Werner Jud, Lea Mika Götz, Albin Hammerle, Thomas Karl, Judith Sophie Schmack, Felix Spielmann, and Georg Wohlfahrt

Volatile organic compound (VOC) emissions from forests are typically attributed to tree canopies, while the forest floor remains comparatively understudied despite its complex mixture of litter, soil microbes, and understory vegetation. Here we report first results from a pilot study, in which we measured forest-floor VOC fluxes in a mountain pine–juniper (Pinus sylvestris, Juniperus communis) stand, at the Forest Atmosphere Interaction Research (FAIR) site of the University of Innsbruck in Mieming, Austria. The site is characterized by a relatively open tree canopy dominated by pines, and a forest floor that is almost completely covered by vegetation, including dominant juniper individuals. We compared mean soil emissions with ecosystem-scale VOC fluxes obtained at the same site during a period shortly after the soil measurements, to assess the relative contribution of the forest floor to whole-ecosystem VOC exchange.

Using a dynamic chamber approach coupled to online VOC detection using Proton Transfer Reaction Mass Spectrometry (PTR-MS), we quantified forest floor emissions at two locations: (i) a site dominated by pine needle litter and mosses, and (ii) a site where moss and litter co-occurred with heather (Erica herbacea), some Polygala chamaebuxus and various grasses (Sesleria ssp., Carex ssp.) understory.

Both sites emitted substantial amounts of terpenoid compounds, such as monoterpenes and sesquiterpenes, but also isoprene, as well as oxygenated compounds such as methanol, acetaldehyde and acetone. The emissions were temporally variable and differed between the two micro-sites, consistent with differences in biological composition, substrate and meteorological conditions. While the exact sources cannot be resolved from these measurements alone, plausible contributors include microbial activity within soil and the litter–moss layer, as well as root and shoot emissions from understory shrubs.

A comparison of the forest floor VOC fluxes with the total ecosystem exchange revealed that the mean soil fluxes of many VOCs were on the order of a few to about 40 % of the respective ecosystem fluxes. Strikingly, for sesquiterpenes the soil emissions at both microsites exceeded ecosystem-scale fluxes by about a factor three and seven, respectively. This discrepancy suggests substantial within-canopy loss processes (e.g., rapid oxidation or deposition) and/or differences in temporal representativeness between the datasets.

These findings expand the known role of the forest floor as an active VOC source and suggest that bottom-up budgets that focus solely on canopy emissions may underestimate ecosystem-scale fluxes, especially under conditions favorable to microbial or understory vegetation activity.

How to cite: Jud, W., Götz, L. M., Hammerle, A., Karl, T., Schmack, J. S., Spielmann, F., and Wohlfahrt, G.: Forest floor VOC emissions in a mountain pine–juniper stand: magnitudes, composition, and implications for ecosystem-scale fluxes, EGU General Assembly 2026, Vienna, Austria, 3–8 May 2026, EGU26-17215, https://doi.org/10.5194/egusphere-egu26-17215, 2026.

EGU26-17295 | Posters on site | BG1.10

Coupled insect-outbreak and microclimatic forcing suppresses BVOC emissions in subarctic understory plants 

Simon Nyboe Laursen, Shunan Feng, Amy Smart, Federico Grillini, Jolanta Rieksta, Yi Jao, Cleo Lisa Davie-Martin, Riikka Rinnan, and Andreas Westergaard-Nielsen

Insect herbivory is a major disturbance in subarctic ecosystems, yet its impact on biogenic volatile organic compound (BVOC) emissions from understory vegetation remains poorly understood. Here, we use a severe, natural geometrid moth outbreak in a mountain birch forest in northern Fennoscandia to quantify i) outbreak-associated changes in understory vegetation and ii) indirect effects of mountain birch canopy loss on understory microclimate and BVOC emissions. Across two growing seasons (moderate herbivory vs. peak outbreak), we combined enclosure BVOC measurements (n = 131) from three dominant understory plant species with near-surface spectral proxies of vegetation greenness and microclimatic data.  

The geometrid outbreak caused widespread mountain birch canopy defoliation and reduced understory greenness. Moreover, mountain birch canopy loss increased incident solar radiation in the understory, raised understory canopy surface temperature, and reduced soil moisture. Despite these warmer and brighter conditions, which typically promote BVOC release, understory BVOC emissions declined in the outbreak year, indicating that loss of photosynthetic tissue constrained emission capacity. Empetrum nigrum showed the strongest reduction in total BVOC emissions (72%) despite a pronounced shift toward stress-induced blends during the outbreak year.  Total emissions of Vaccinium myrtillus were reduced by 55% and showed modest compositional change including late-season increases in isoprene under warm, high-PAR conditions in the outbreak year. Graminoids were comparatively resilient, showing limited compositional shifts and only minor reductions in total BVOC emissions. 

Together, these results indicate that BVOC emissions from subarctic understories are jointly controlled by direct herbivory and canopy-mediated microclimatic feedbacks, and that large-scale insect outbreaks can directly or indirectly suppress, rather than enhance, BVOC emissions when green leaf loss outweighs biochemical induction. Accounting for these coupled pathways is essential for predicting biosphere–atmosphere interactions in a warming Arctic where insect outbreaks are expected to intensify. 

How to cite: Laursen, S. N., Feng, S., Smart, A., Grillini, F., Rieksta, J., Jao, Y., Davie-Martin, C. L., Rinnan, R., and Westergaard-Nielsen, A.: Coupled insect-outbreak and microclimatic forcing suppresses BVOC emissions in subarctic understory plants, EGU General Assembly 2026, Vienna, Austria, 3–8 May 2026, EGU26-17295, https://doi.org/10.5194/egusphere-egu26-17295, 2026.

EGU26-17304 | ECS | Orals | BG1.10

Links between Solar-Induced chlorophyll Fluorescence and isoprenoid emissions from field spectroscopy in low Arctic tundra 

Federico Grillini, Simon Nyboe Laursen, Amy Smart, Peiyan Wang, Shunan Feng, Juliane Bendig, and Andreas Westergaard-Nielsen

As climate warming is expected to extend the growing season and enhance vegetation productivity in the Arctic, a consequent increase in emissions of Biogenic Volatile Organic Compounds (BVOC) is forecasted.

Isoprenoid emissions are known to be driven, among other factors, by photosynthetic processes. Our hypothesis is then that the emissions of particularly isoprenoids can be linked to remotely sensed proxies of photosynthetic activity in typical vegetation of low Arctic tundra.

We tested this hypothesis by examining the relationship between Solar-Induced chlorophyll Fluorescence (SIF) in the O2-A absorption band and BVOC emission rates in a field spectroscopy framework, to further investigate the relationship between the reflectance properties of vegetation and total BVOC/isoprenoid emission rates. The study sitis located in the area oKobbefjord, Greenland.

The results of our analysis demonstrate that SIF and other spectral indices (Enhanced Vegetation Index – EVI, Photochemical Reflectance Index – PRI, MERIS Terrestrial Chlorophyll Index – MTCI) explain a substantial share of the variation in isoprenoid and total BVOC emissions. These findings can potentially be of aid in opening new avenues to model BVOC emissions at larger scales, as SIF and other relevant indices can be directly derived from new-generation UAV and satellite imagery.


How to cite: Grillini, F., Laursen, S. N., Smart, A., Wang, P., Feng, S., Bendig, J., and Westergaard-Nielsen, A.: Links between Solar-Induced chlorophyll Fluorescence and isoprenoid emissions from field spectroscopy in low Arctic tundra, EGU General Assembly 2026, Vienna, Austria, 3–8 May 2026, EGU26-17304, https://doi.org/10.5194/egusphere-egu26-17304, 2026.

EGU26-17720 | ECS | Posters on site | BG1.10

Beyond water solubility: physicochemical controls on VOC dry deposition in a mixed temperate forest 

Clément Dumont, Bert Verreyken, Niels Schoon, Benjamin Loubet, Crist Amelynck, and Bernard Heinesch

Volatile organic compounds (VOCs) play a key role in atmospheric chemistry by contributing to tropospheric ozone and secondary organic aerosol formation and by modulating the atmospheric lifetime of methane. Although the majority of atmospheric VOCs originate from biogenic emissions, dry deposition to ecosystems is increasingly recognized as an important sink influencing global budgets. While deposition processes have been quantified for a limited number of highly water-soluble VOCs, they remain poorly constrained for many other compounds.

Using a PTR-ToF-MS instrument, we measured VOC concentrations and fluxes above and below the canopy at the mixed temperate forest ICOS station of Vielsalm (Belgium) over three growing seasons (spring to autumn) between 2022 and 2024 (Dumont et al., 2026). Minimal deposition velocities were derived from negative net fluxes, and a two-layer (canopy and soil) big-leaf resistive model was applied for conceptual interpretation.

Above the canopy, significant deposition was detected for 47 VOC groups, identified by their mass-to-charge ratio (m/z) and spanning a wide range of physicochemical properties. Median deposition velocities ranged from 0.4 cm s⁻¹ for formic acid to 1.5 cm s⁻¹ for m/z 137.060 (C₈H₈O₂H⁺, aromatic OVOCs). Aerodynamic and quasi-laminar boundary layer resistances were negligible compared to the total resistance, while below-canopy uptake contributed only about 10% of the above-canopy deposition. This indicates that canopy processes represent the dominant regulation to VOC uptake.

The widely used Wesely (1989) deposition scheme reproduced the observed deposition velocities only for a subset of highly water-soluble compounds, as indicated by their high Henry’s law constants (e.g. formaldehyde, formic acid, acetic acid, hydroxymethyl hydroperoxide). For most of these low-molecular-weight OVOCs, deposition increased with relative humidity and peaked in autumn, when humid conditions were most frequent.

For many other VOCs, however, the Wesely model underestimated deposition by up to three orders of magnitude. Additional physicochemical properties were examined to account for the high deposition velocities of hydrophobic VOCs. Under dry conditions, deposition velocities were positively correlated with the octanol–air partition coefficient, used here as a proxy for solubility in lipid phases. This suggests uptake pathways not captured by current deposition models, such as dissolution into the waxy leaf cuticle or lipid membranes. Under wet conditions, this relationship weakened, and the Henry’s law constant emerged as the strongest predictor of deposition. These findings were supported by an independent VOC flux dataset acquired over a winter wheat field in the Paris region (Loubet et al., 2022), where a similar dependence on the octanol–air partition coefficient was observed.

Overall, our results indicate that both aqueous and lipid reservoirs within vegetation can contribute to VOC dry deposition and should be treated as complementary uptake pathways. Building on these findings, this ongoing work will aim to extend existing deposition models to predict the uptake of both hydrophilic and hydrophobic organic compounds by ecosystems.

How to cite: Dumont, C., Verreyken, B., Schoon, N., Loubet, B., Amelynck, C., and Heinesch, B.: Beyond water solubility: physicochemical controls on VOC dry deposition in a mixed temperate forest, EGU General Assembly 2026, Vienna, Austria, 3–8 May 2026, EGU26-17720, https://doi.org/10.5194/egusphere-egu26-17720, 2026.

EGU26-17790 | ECS | Posters on site | BG1.10

Effects of Vegetation and Microhabitats on Peatland VOC Emissions and Seasonal Dynamics across one Summer 

Mathilda Bloch Carlsson, Yi Jiao, Riikka Rinnan, and Bjorn Robroek

Peatlands store the largest carbon stocks per unit area and are key regulators of climate. Carbon cycling and emissions to the atmosphere from peatlands are of critical importance and responsive climate change, with changing precipitations patterns and temperatures causing a shift in plant community composition. Yet the underlying drivers for volatile organic compound (VOC) exchange remain poorly understood. This study aims to assess the influence of different functional plant groups and environmental drivers on peatland VOC emissions.

A field study was conducted utilizing an established long-term plant removal experimental setup with 40 plots evenly distributed across four plant removal treatments (control, removal of ericoid plants, removal of graminoid plants and removal of both groups) and two microsite types (hummocks and hollows). VOC emissions were measured twice each month in the summer of 2025 using flow chambers connected to sorbent tubes analyzed by GC-MS. We measured environmental variables; PAR-light, soil and air water content/humidity and temperature concurrently with vegetation VOC measurements. We also collected species cover data on plot level.

A PCA analysis across all VOC emissions uncovered the sampling months to explain multivariate distribution with clustering of all months and especially June standing out. The emission profiles were dominated by isoprene in July (80.7%) and August (87.8%) while in June oxygenated VOCs dominated the total emission (66.8 %). Linear mixed models showed a significant effect of month, treatment, microsite and the interactive effects of month and treatment and month and microsite on isoprene emissions. The highest mean isoprene emission appeared in July; the emissions were higher from hollow microsites than hummocks and the treatments with removal of graminoid plants had lower isoprene emissions compared to both other treatments. Only difference in month had a significant effect on the oxygenated VOC emissions, with OVOC emissions in June being more than tenfold than in the other months. Difference in month also significantly affected all other VOC groups. PLS models showed emissions of all groups except sesquiterpenes to significantly increase with air temperature, while soil temperature, water table depth and soil moisture significantly influenced emissions of isoprene, sesquiterpenoids, and OVOCs. The presence of ericoid plant species correlated negatively with sesquiterpene emissions while graminoid species increased isoprene emissions.

The study supports the understanding that VOC emission abundance and composition are influenced by environmental drivers and plant species composition, while the seasonal variation, even within summer months can be of significant size. Especially OVOC emissions seem responsive to a change in soil moisture, dominating the total emissions in the driest month.

How to cite: Bloch Carlsson, M., Jiao, Y., Rinnan, R., and Robroek, B.: Effects of Vegetation and Microhabitats on Peatland VOC Emissions and Seasonal Dynamics across one Summer, EGU General Assembly 2026, Vienna, Austria, 3–8 May 2026, EGU26-17790, https://doi.org/10.5194/egusphere-egu26-17790, 2026.

EGU26-17831 | ECS | Posters on site | BG1.10

Does Parental Environment Prime Offspring bVOC Responses to Heat and Drought in Scots Pine? 

Simone M. Pieber, Ugo Molteni, Na Luo, Stefan Hunziker, Arun Bose, Celia Faiola, Markus Kalberer, and Arthur Gessler

Biogenic volatile organic compounds (bVOCs) constitute a highly complex and diverse group of chemicals emitted into the atmosphere by the Earth’s biosphere. Through atmospheric oxidation, they alter the mixing ratios of trace gases such as methane, carbon monoxide, and tropospheric ozone. Moreover, oxidation products contribute to aerosol formation, which plays a crucial role in Earth’s radiative balance and air‑quality regulation.

Projected rises in global temperatures over the coming decades are expected to produce warmer and drier conditions in Alpine regions, resulting in combined heat‑ and drought‑stress for forest ecosystems. Understanding how trees respond to these co-occurring abiotic changes is essential for assessing impacts on atmospheric chemistry and secondary organic aerosol (SOA) properties.

We conducted controlled laboratory experiments spanning the peak growing season (July to October) to examine the effects of elevated temperature (heat, +4°C above average), reduced water availability (drought, 50% decrease in volumetric soil water content), and their combination on conifer seedlings grown from seeds collected in the Pfynwald Long‑Term Irrigation Experiment (established in 2003). By using offspring from Scots pine mother trees that experienced contrasting water regimes (naturally dry versus artificially irrigated), we assessed both immediate stress responses and potential maternal‑priming effects on bVOC emissions. Specifically, we investigated (i) bVOC precursors in conifer needles (secondary metabolites) and (ii) bVOC emissions in the gas phase.

To achieve this, we (i) developed an analytical method for extracting and chromatographically separating terpenes and terpenoids from conifer needles, and (ii) designed and built a novel plant chamber for bVOC gas‑phase measurements - online with a PTR‑ToF‑MS and offline with thermodesorption‑GC‑MS.

We present results illustrating terpenes and terpenoid in conifer needles and in the gas-phase from seedlings under different maternal water availability and compare baseline conditions to heat and drought stress. We hypothesize that parental environmental history influences offspring stress responses, and that incorporating these mechanisms into Earth‑system models will improve predictions of bVOC emissions and their feedbacks on atmospheric chemistry under future climate scenarios.

How to cite: Pieber, S. M., Molteni, U., Luo, N., Hunziker, S., Bose, A., Faiola, C., Kalberer, M., and Gessler, A.: Does Parental Environment Prime Offspring bVOC Responses to Heat and Drought in Scots Pine?, EGU General Assembly 2026, Vienna, Austria, 3–8 May 2026, EGU26-17831, https://doi.org/10.5194/egusphere-egu26-17831, 2026.

EGU26-18517 | Posters on site | BG1.10

Speciation of monoterpenes at atmospheric relevant concentrations without sample preconcentration 

Martin Graus, Klaus Winkler, Markus Leiminger, Tobias Reinecke, and Markus Müller

Volatile organic compounds (VOC) are exchanged between the Earth’s surface and the atmosphere. Their role in biosphere-atmosphere-climate interactions have been extensively studied in various and often inherently interdisciplinary research topics. Crucial to the understanding of these processes is the fast quantification of VOCs both primarily emitted as well as products and intermediates. Monoterpenes are an important class of VOCs contributing 15% to the global VOC emissions from terrestrial ecosystems. The most dominant isomeres of monoterpenes in the atmosphere are α-pinene, β-pinene, limonene, myrcene, camphene, and sabinene that are emitted in variable fractions depending on sources and conditions. In the atmosphere, monoterpenes may undergo rapid conversion via reactions with hydroxyl- and nitrate-radicals and ozone, forming oxidation products that eventually condense to secondary organic aerosol at high yields. Reaction rates of the different isomers with OH, O3 and NO3 spread up to orders of magnitude (0.8, 4.4 and 2.3 orders, respectively). Therefore it is of uttermost importance to quantify individual isomers to understand the reactivity of the mix of monoterpenes in an air mass.    

Proton-transfer-reaction mass-spectrometry (PTR-MS) is a well characterized analytical method for the real-time quantification of VOCs including monoterpenes. The drawback of PTR-MS is the detection of VOCs on a chemical composition level, hence, only the sum of monoterpenes can be measured. To solve this problem, we herein introduce an optimized fast gas-chromatographic pre-separation solution (fast-GC) that is seamlessly integrated to an ultrasensitive FUSION PTR-TOF 10 (IONICON Analytik, Austria). 

The improved fast-GC design allows for fast and precise heating rates leading to highest stability and repeatability of GC-runs. A temperature ramp can be completed as quick as 90 s providing  resolutions sufficient for a good separation of several monoterpene isomeres. A fast-GC run can be triggered approximately every 5-10 min; the time in between runs is used to measure the ambient sample without GC separation in real-time PTR-MS mode. With the high sensitivity (> 40 000 cps/ppbV) and lowermost limit of detection (< 1 pptV in 1 s) of FUSION PTR-TOF 10, no preconcentration prior to injection of the sample into the fast-GC is required.

In this presentation we show a thorough characterization of this fast-GC FUSION PTR-TOF 10. To demonstrate the capabilities of the system in a real-world application we sampled ambient air in Innsbruck, Austria, with fast-GC runs triggered every 10 minutes continuously over the course of several weeks. Despite the low ambient concentrations of the sum of monoterpenes in sub-ppbV levels, the presented method was able to separate and quantify 7 monoterpenes.

How to cite: Graus, M., Winkler, K., Leiminger, M., Reinecke, T., and Müller, M.: Speciation of monoterpenes at atmospheric relevant concentrations without sample preconcentration, EGU General Assembly 2026, Vienna, Austria, 3–8 May 2026, EGU26-18517, https://doi.org/10.5194/egusphere-egu26-18517, 2026.

Biogenic volatile organic compounds (BVOCs) play a pivotal role in atmospheric chemistry, significantly contributing to ozone formation and secondary organic aerosol (SOA) precursors. Their accurate and sensitive detection in ambient air is therefore of significant importance for networks such as ACTRIS, which focus on atmospheric research and climate monitoring. However, current analytical methods often lack the sensitivity, selectivity, and portability required for reliable field measurements.
Within the PurPest EU project, novel gas chromatographic systems, both portable and rack mounted, were developed, integrating a miniaturized pre-concentration module and an optimized photoionization detector (PID). These systems were specifically designed to address the challenges of detecting trace-level VOCs in complex environmental matrices. The PID offers high sensitivity and robustness for volatile organic compound (VOC) measurements and presents a significant operational advantage, due to its capability for both VOCs and BVOCs detection. However, it lacks chemical selectivity because it responds to a broad spectrum of VOCs rather than to specific target molecules. To overcome this limitation, a chromatographic column was included to separate individual components of the gas mixture, allowing for a more accurate characterization of VOC profiles.
These analytical systems were jointly tested with three partner universities to assess the sensor unit’s capacity to detect VOCs emitted by pest-stressed plants. In each trial, these systems functioned autonomously 24 hours per day for two consecutive weeks without human supervision, while analyzing various sample environments: laboratory air, air surrounding healthy plants, and air surrounding pest-infested plants.
For the ACTRIS network, these gas chromatograph offer a promising tool for enhancing the analysis of biogenic VOCs in ambient air. Their sensitivity, selectivity, and field-readiness make it well-suited for addressing the network’s research priorities, including the study of ozone and SOA precursors.

How to cite: Chagneau, A.: Advancing Ambient Air Analysis: A Portable Gas Chromatograph for Biogenic VOC Monitoring in the ACTRIS Network, EGU General Assembly 2026, Vienna, Austria, 3–8 May 2026, EGU26-19768, https://doi.org/10.5194/egusphere-egu26-19768, 2026.

EGU26-21092 | Posters on site | BG1.10

Effects of desiccation dynamics on petrichor emissions in Negev Desert soils 

Hai Anh Nguyen, Hayk Gevogyan, Benjamin Poodiack, Baris Weber, Jörg-Peter Schnitzler, Hagar Siebner, Osnat Gillor, Michael Bonkowski, and Andrea Ghirardo

Petrichor – a strong scent released from desiccated soil upon rewetting – is a mixture of volatile organic compounds (VOCs) that impact atmospheric chemistry and originates from the abiotic desorption of stored compounds and the de novo microbial production. The aridity gradient of the Negev Desert soils provides a particularly suitable system for studying petrichor emissions due to their distinctive and well-studied microbial communities (e.g., Actinobacteria and Cyanobacteria) but similar physical properties that control VOC physical evaporation, and absence of plant material as confounding sources of VOCs. While the chemical and microbial origins of petrichor are relatively well described, the controlling factors of its emission remain unclear. This study investigated the influences of desiccation dynamics on petrichor emissions and microbial succession in soils from an aridity gradient of the Negev Desert in Israel. Soil cores were subjected to three sequential rain events followed by contrasting desiccation regimes (long drought, rapid desiccation and slow desiccation) in a realistic climate simulation. Their VOC emissions and microbial metatranscriptomics were studied at five time points, including three upon rewetting and two during slow desiccation. The results showed that VOCs were produced during soil drying, with compound-specific release patterns occurring either during desiccation or upon rehydration. Despite having a common biosynthetic pathway, monoterpenoid and sesquiterpenoid emissions exhibited distinct temporal dynamics, suggesting different underlying physical control or microbial activity. The abundances and chemical diversity of petrichor decreased with increasing aridity, closely following the decline in microbial diversity. The microbial communities varied among rewetting scenarios and exhibited clear temporal succession during slow desiccation, likely regulating petrichor emissions through microbial activation. Greater community dispersion at 24 hours after rewetting indicated rapid and heterogeneous microbial reactivation, potentially contributing to increased variability and reduced predictability of early petrichor emissions. These findings highlighted the importance of desiccation rate in controlling petrichor emissions in desert ecosystems. Further field measurements and functional microbial analyses will be essential to understand how changing desiccation regimes will reshape petrichor emissions and the microbial communities in desert ecosystems.

How to cite: Nguyen, H. A., Gevogyan, H., Poodiack, B., Weber, B., Schnitzler, J.-P., Siebner, H., Gillor, O., Bonkowski, M., and Ghirardo, A.: Effects of desiccation dynamics on petrichor emissions in Negev Desert soils, EGU General Assembly 2026, Vienna, Austria, 3–8 May 2026, EGU26-21092, https://doi.org/10.5194/egusphere-egu26-21092, 2026.

EGU26-21725 | Orals | BG1.10

Dryland soil rewetting induces strong VOC emissions with potential to form ozone and aerosol 

Andrea Ghirardo, Benjamin Poodiack, Hagar Siebner, Matan Kalman Jaffe, Baris Weber, Jörg-Peter Schnitzler, Michael Bonkowski, Osnat Gillor, and Alex B. Guenther

Biogenic volatile organic compounds (VOCs) significantly influence atmospheric chemistry, yet the importance of microbial VOC emissions remains understudied. We investigate petrichor VOC emissions, the characteristic scent following rainfall after prolonged drought, across Israel’s aridity gradient, by simulating soil rewetting events. Rewetting triggered strong VOC fluxes (1-3.5 nmol m-2 s-1 ground area) dominated by sesquiterpenes and benzenoids, with emission patterns linked to climate-regions, soil aridity, and microbial community composition. Petrichor was composed of a complex bouquet of 58 VOCs, and the initial VOC burst resembled the CO2 pulse of the Birch effect. Petrichor emissions showed ozone and secondary organic aerosol formation potentials comparable to anthropogenic VOC sources in Israel. Despite compositional differences, emission magnitudes were of similar order across the aridity gradient. Given that drylands cover nearly half of Earth's land and are expanding, these episodic microbial VOC emissions may represent a significant, previously overlooked source of reactive carbon with potential implications for regional and global atmospheric chemistry.

How to cite: Ghirardo, A., Poodiack, B., Siebner, H., Jaffe, M. K., Weber, B., Schnitzler, J.-P., Bonkowski, M., Gillor, O., and Guenther, A. B.: Dryland soil rewetting induces strong VOC emissions with potential to form ozone and aerosol, EGU General Assembly 2026, Vienna, Austria, 3–8 May 2026, EGU26-21725, https://doi.org/10.5194/egusphere-egu26-21725, 2026.

EGU26-22882 | Orals | BG1.10

Light and High Temperature Dependent Decline in Photosystem II Efficiency in Holcus Is Associated with Photoprotective Roles of Volatile Signals Methyl Salicylate and cis-β-Ocimene 

Kolby Jardine, Asa Elliott, Hunter Seubert, Suzanne Kosina, Elaine Pegoraro, Kelsey Crutchfield-Peters, Erik Brown, Erica Grasberger, Shelly Benson, and Margaret Torn

Leaves must sustain high rates of photosynthesis to support growth while avoiding over-reduction of the chloroplast electron transport chain and the formation of damaging reactive oxygen species during daily exposure to high light and temperature. This challenge is particularly acute for C₃ species such as Holcus lanatus, which experience high rates of photorespiration under the warm, high-light conditions typical of grassland ecosystems.

In leaves of H. lanatus at the Point Reyes Field Station (California, USA), we observed a pronounced midday decline (approximately ten-fold) in the quantum efficiency of photosystem II (ΦPSII) despite elevated electron transport rates (ETR), temperature, and incident light, followed by full recovery in the evening. Controlled light- and temperature-response experiments revealed that net CO₂ assimilation, ETR, and volatile organic compound (VOC) emissions remained tightly coupled during periods of ΦPSII suppression, indicating sustained biosynthetic activity even as photochemical efficiency declined.

Among emitted VOCs, methyl salicylate (MeSA) and cis-β-ocimene—derived from the shikimate and isoprenoid pathways and linked to the Calvin–Benson cycle through carbon skeleton supply—showed strong light and temperature responsiveness. In contrast, α-pinene and sabinene emissions were largely light-independent and negatively temperature-sensitive. Given their established roles as potent phytohormones, these observations raise the possibility that photosynthesis-derived compounds such as MeSA and cis-β-ocimene act as internal feedback signals regulating the photosynthetic light reactions.

Although trans-β-ocimene is widely regarded as the dominant isomer in plant emissions, particularly under biotic stress, our sequence analysis predicts that approximately 18% of β-ocimene-producing species possess a cis-β-ocimene synthase, including a validated plastid-localized example in Cannabis sativa. By comparison, UniProt currently annotates cis-β-ocimene synthases in only ~7% of species. Together, these findings suggest three paradigm shifts: (i) photosynthetic products such as MeSA may directly regulate light reactions; (ii) MeSA may stimulate β-ocimene production, enhancing thermoprotection of photosynthesis; and (iii) cis-β-ocimene is likely far more abundant in nature than previously assumed. This dynamic decoupling of ΦPSII from electron transport, CO₂ assimilation, and biosynthesis under thermal and light stress has important implications for photosynthesis modeling and the interpretation of solar-induced fluorescence.

How to cite: Jardine, K., Elliott, A., Seubert, H., Kosina, S., Pegoraro, E., Crutchfield-Peters, K., Brown, E., Grasberger, E., Benson, S., and Torn, M.: Light and High Temperature Dependent Decline in Photosystem II Efficiency in Holcus Is Associated with Photoprotective Roles of Volatile Signals Methyl Salicylate and cis-β-Ocimene, EGU General Assembly 2026, Vienna, Austria, 3–8 May 2026, EGU26-22882, https://doi.org/10.5194/egusphere-egu26-22882, 2026.

EGU26-824 | ECS | Posters on site | BG1.11

Two new clades of T7-like cyanophages: diversity, distribution and infection patterns based on omics data 

Elena Khavin, Kira Kondratieva, Ilia Maidanik, Michael Carlson, Irena Perkarsky, and Debbie Lindell

Cyanobacteria play a significant role in global biogeochemical cycles, including carbon fixation and oxygen production. Among them, marine picocyanobacteria Prochlorococcus and Synechococcus constitute the most numerically abundant group of photosynthetic organisms on Earth. They are dominant in oligotrophic regions and contribute a quarter of primary production in the ocean. Picocyanobacterial distribution depends on abiotic factors, e.g. light, temperature, and nutrients, as well as biotic mortality factors, such as grazers and viral infection. Viruses also impact the diversity of picocyanobacteria during their coevolution. Infection of cyanobacteria by phages ends in lysis and release of organic matter from cells to the water column. The T7-like cyanophage family is one of two main virus families infecting marine picocyanobacteria. Two groups of T7-like cyanophages were known until recently: clades A and B. They have various distribution, infection properties and patterns, resulting in differential impacts on picocyanobacterial populations. In 2023 a new group of T7-like cyanophages was discovered, and was named clade C. However, only two genotypes of the novel group were known, both isolated on Prochlorococcus. In this study we investigated the diversity within the new group using assembled environmental sequences. We also estimated the relative abundance and infection of this group and compared them with other T7-like cyanophages clades along a transect in the North Pacific Ocean and over the spring period or from winter mixing to summer stratification in the Red Sea. For this we used viromic and cellular metagenomic data to determine relative abundance of free-living viruses and gain an indication of infection, respectively. We found that the new group actually consists of two distinct clades, which we renamed as clades C and D. Clade D is more diverse than clade C. In the North Pacific Ocean both clades were relatively more abundant in the North Pacific Subtropical Gyre and decreased towards the north. In some samples clade D recruited more than 40% of T7-like cyanophage viromic reads. In the Red Sea the relative abundance of both clades increased towards the summer. In both regions clade D was generally more abundant that clade C, and the abundances of clades C and D followed the abundances of Prochlorococcus. This study provides new insights into the diversity, spatial distribution and seasonal dynamics of two new clades of T7-like cyanophages. It demonstrates that clade D could be an important viral group impacting primary production and biogeochemical cycles in the oligotrophic oceans.

How to cite: Khavin, E., Kondratieva, K., Maidanik, I., Carlson, M., Perkarsky, I., and Lindell, D.: Two new clades of T7-like cyanophages: diversity, distribution and infection patterns based on omics data, EGU General Assembly 2026, Vienna, Austria, 3–8 May 2026, EGU26-824, https://doi.org/10.5194/egusphere-egu26-824, 2026.

EGU26-3377 | ECS | Posters on site | BG1.11

In-field monitoring of airborne biodiversity using a passive sampler  

Shayma Alathari

The application of molecular techniques in analysing aerobiology and airborne environmental DNA (eDNA) has expanded rapidly in recent years, offering powerful tools for indirect detection of plant, animal, and microbial taxa at landscape scale. Monitoring shifts in plant communities in response to human activity or management actions is crucial to understand their impact on biodiversity. To date, most airborne DNA studies have focused on pollen and single species detection, overlooking a variety of aerobiological sources, including plant fragments. Consequently, surveying entire plant communities through DNA metabarcoding is increasingly utilised, as it has the potential to enhance detection accuracy and broaden ecological insights at a landscape scale.

Here, we present how a passive air sampler and DNA metabarcoding can be employed to characterise plant biodiversity by capturing aerobiological material. Samplers were deployed across woodland and grassland habitats, with weekly collections used to characterise local plant community composition and quantify temporal dynamics in species detection. Aerobiological material collected by the samplers were analysed using plant-targeted DNA markers and sequenced on the Oxford Nanopore Technologies MinION platform. To evaluate methodological robustness, a sampler was positioned adjacent to a standard pollen trap, enabling comparison of taxa recovered by molecular and morphological methods.

Temporal and spatial patterns revealed through traditional pollen microscopy were closely aligned with those obtained via our molecular workflow, with the DNA based method providing finer taxonomic resolution. Although three days of deployment yielded sufficient cellular material for aerobiological analysis, we recommend a minimum of six days to reliably capture full community composition. Overall, our results demonstrate that aerobiological DNA metabarcoding is a scalable and sensitive approach for characterising plant communities and provides a powerful compliment to existing biodiversity and pollen monitoring programmes.

Integrating environmental genomics with established, aerobiological surveillance methods offer substantial advantages, including the detection of non-pollen plant material and the early recognition of non-native or potentially invasive species. We see considerable potential in combining environmental genomics with existing airborne monitoring approaches. The portability of the MinION device enables metabarcoding directly at the point of sampling, reducing transport delays and minimizing sample degradation, and is especially valuable in biodiversity-rich but under-resourced areas, where timely aerobiological data can guide conservation decisions and support early detection of invasive species.

How to cite: Alathari, S.: In-field monitoring of airborne biodiversity using a passive sampler , EGU General Assembly 2026, Vienna, Austria, 3–8 May 2026, EGU26-3377, https://doi.org/10.5194/egusphere-egu26-3377, 2026.

EGU26-3390 | ECS | Posters on site | BG1.11

Seasonal shifts in the sensitivity of plant hydraulic parameters controlling ecosystem water and carbon fluxes in eCLM 

Juan C. Baca Cabrera, Fernand Eloundou, Bibi S. Naz, Christian Poppe Terán, Harrie-Jan Hendricks Franssen, and Jan Vanderborght

Plant hydraulic traits regulate water transport in the soil–plant–atmosphere continuum and mediate the coupling between soil moisture availability, stomatal regulation, and ecosystem carbon uptake. Mechanistic representations of plant hydraulics in land surface models, such as the Community Land Model (CLM), improve the accuracy of simulated vegetation fluxes, particularly under drying soil conditions¹, but they also introduce additional parameters that can be difficult to constrain and can strongly influence model outputs. Global ensemble perturbation experiments in CLM have shown that plant hydraulic parameters are among the most influential controls on evapotranspiration, although their relative importance varies across regions². Yet, how the sensitivity of these parameters varies across plant functional types (PFTs) and seasons remains largely unexplored.

In this study, we investigated the sensitivity of simulated vegetation water potential and water and carbon fluxes to five key plant hydraulic parameters, including stomatal behavior (medlyn slope), plant and root conductance (kmax and krmax), cavitation resistance (psi50) and root distribution (β) using eCLM (https://github.com/HPSCTerrSys/eCLM). Ensemble simulations were performed for 13 ICOS sites across Europe, covering four climate zones and five PFTs, over the period 2009–2018. The selected parameters were varied within PFT-dependent ranges following previous perturbation experiments²,³, resulting in a total of 336 ensemble members. Variance-based parameter sensitivities (main effects, two-way interaction effects, and total effects) were quantified using the GEM-SA global sensitivity analysis framework based on Gaussian process emulation4. Emulators were trained on monthly averages for each station and each output variable individually.

Across simulations, medlyn slope and kmax showed the strongest effects on simulated water and carbon fluxes (ET, Tr, GPP, NEE) with main effects explaining more than 60% of the variance, while two-way interaction effects contributed only marginally. However, parameter sensitivities varied substantially among PFTs, with distinct patterns in the relative importance of dominant parameters for Mediterranean evergreen broadleaf forests, temperate deciduous forests, and evergreen needleleaf forests. Sensitivities also varied seasonally, with the remaining parameters—particularly psi₅₀—becoming increasingly influential under dry summer conditions. Most notably, seasonal shifts in the direction of parameter effects on canopy transpiration were detected at drought-prone Mediterranean sites: higher medlyn slope increased transpiration during spring, but led to reduced transpiration during summer, reflecting earlier stomatal closure under increasing plant hydraulic stress.

Our results show that model sensitivity to plant hydraulic parameters varies across PFTs and seasons, reflecting changes in model behavior across environments. These findings motivate further model development and refinement of plant hydraulic and stomatal process representation to ensure consistent performance across seasons, especially during drought.

References 

  • 1Kennedy et al. (2019). 10.1029/2018MS001500
  • 2Kennedy et al. (2025). 10.1029/2024MS004715
  • 3Eloundou et al. (2024). 10.5194/egusphere-egu24-16086
  • 4O’Hagan (2006). 10.1016/j.ress.2005.11.025

How to cite: Baca Cabrera, J. C., Eloundou, F., Naz, B. S., Poppe Terán, C., Hendricks Franssen, H.-J., and Vanderborght, J.: Seasonal shifts in the sensitivity of plant hydraulic parameters controlling ecosystem water and carbon fluxes in eCLM, EGU General Assembly 2026, Vienna, Austria, 3–8 May 2026, EGU26-3390, https://doi.org/10.5194/egusphere-egu26-3390, 2026.

EGU26-3488 | ECS | Posters on site | BG1.11

Evolutionary adaptation of soil microbial communities to climate change 

Mathilde Bourreau, Elsa Abs, and Alexander Chase

Recent theory suggests that the evolutionary adaptation of soil microbial communities to climate change could significantly aggravate the currently predicted  global soil carbon loss in response to global warming through the selection of gene variants affecting carbon-cycling traits (e.g. respiration, decomposition or secondary metabolites production).

However, empirical evidence is still lacking to quantify the rate and magnitude of evolutionary changes in carbon-cycling traits across bacterial functional groups. This gap limits the integration of microbial evolutionary responses into carbon biogeochemical models.

We analysed long-term (10 years) high throughput metagenomic time series from two global change experiments: the SPRUCE peatland experiment (warming and elevated CO₂) and the Loma Ridge grassland drought experiment. We combined classical metagenomic analyses (read alignment, SNP detection) with collapsing gene-level variation into functional trait categories.

Focusing on the most abundant Metagenomes Assembled Genomes (MAGs), e.g. Acidocella sp., (> 10X and 50% of coverage), we identified genes showing signs of adaptive evolution associated with carbon-cycling traits, revealing which traits exhibit the strongest evolutionary responses under climate-change treatments such as traits involved in cellulose degradation.

These results provide a framework to link metagenomic time series with process-based carbon models by defining empirical-based evolutionary markers of climate-change response, enabling the explicit inclusion of microbial evolutionary dynamics in global carbon models such as ORCHIDEE.

How to cite: Bourreau, M., Abs, E., and Chase, A.: Evolutionary adaptation of soil microbial communities to climate change, EGU General Assembly 2026, Vienna, Austria, 3–8 May 2026, EGU26-3488, https://doi.org/10.5194/egusphere-egu26-3488, 2026.

EGU26-3509 | ECS | Posters on site | BG1.11

Mapping global functional diversity of soil microbes using metagenomics data 

Elisa Richard and Elsa Abs

Soil microorganisms play a critical role in global carbon fluxes and shape local biogeochemical cycles through their vast functional diversity, yet it remains unclear how this diversity influences soil carbon fluxes at the global scale.  For example, unlike plants, which are almost uniformly autotrophic, microbial communities encompass a wide range of substrate use : however, current models lack a simplified, yet representative framework to capture this functional diversity, limiting our ability to accurately predict biogeochemical cycling in a changing climate.

To address this, we propose a trait-based microbial functional classification that leverages the growing availability of metagenomic data. Using the microTrait tool, we analyze trait information from a global database of 40,000 metagenome-assembled genomes (MAGs) to compare several clustering methods with multiple quality metrics, and define ecologically meaningful functional groups.

By backmapping MAGs to their original metagenome, we obtain relative abundance data, allowing us to examine how microbial community composition varies across environmental gradients of soil, climatic and biotic parameters. Our analysis reveals some associations between community structure and environmental parameters, suggesting that integrating microbial functional traits into soil models could improve biogeochemical predictions.

How to cite: Richard, E. and Abs, E.: Mapping global functional diversity of soil microbes using metagenomics data, EGU General Assembly 2026, Vienna, Austria, 3–8 May 2026, EGU26-3509, https://doi.org/10.5194/egusphere-egu26-3509, 2026.


Soil microbial communities control the fate of the largest terrestrial organic carbon pool, and their decomposition and respiration dynamics are pivotal for predicting future climate feedbacks. Community diversity, functional complexity, and adaptive responses may substantially reshape projections of the global carbon cycle.

Yet, most microbial-explicit soil biogeochemical models rely on simplified communities with static traits (e.g. growth and respiration). Approaches that incorporate microbial diversity and evolutionary processes remain largely theoretical and poorly constrained by empirical diversity and geochemical measurements, limiting their applicability in Earth system model predictions.

Here, we bridge this gap by fitting microbial community adaptation to warming using a genomics-informed, agent-based microbial model (DEMENT). We develop a framework to parameterize realistic microbial communities from metagenome-assembled genomes (MAGs), capturing taxon-specific traits related to enzyme production, resource uptake, and carbon allocation. Using long-term soil warming experiments at the Harvard Forest LTER site as a case study, we explicitly simulate the temporal dynamics of microbial community composition, respiration, and organic matter degradation under warming. We evaluate alternative evolutionary scenarios of microbial adaptation; targeting resource acquisition, growth yield, and stress responses; and identify the scenario that best reproduces observed diversity patterns as well as post-adaptation growth and respiration responses across temperature gradients.

This approach enables the identification of evolutionary pathways underlying microbial community responses to warming and provides a critical foundation for integrating adaptive microbial processes into next-generation Earth system models.

How to cite: Cortier, T. and Abs, E.: Fitting microbial community adaptation of respiration and growth to warming using a genomics-informed agent-based model, EGU General Assembly 2026, Vienna, Austria, 3–8 May 2026, EGU26-3520, https://doi.org/10.5194/egusphere-egu26-3520, 2026.

EGU26-3995 | ECS | Orals | BG1.11

Eco-evolutionary optimization in soil organic matter models 

Erik Schwarz, Elsa Abs, Arjun Chakrawal, Luciana Chavez Rodriguez, Pierre Quévreux, Thomas Reitz, and Stefano Manzoni

Turnover of soil organic matter (SOM) by microbes is an important step in the soil carbon cycle. As microbes are living organisms that interact with their environment and one another, microbial communities are not static but can adapt to various conditions through changes in functional traits. Such adaptation of microbial functional traits can affect the fate of soil organic carbon. However, current microbial-explicit models commonly do not represent such eco-evolutionary dynamics, but treat microbes more akin to inanimate engines or chemical compartments. Eco-evolutionary optimization (EEO) approaches aim to abstract from the complexity of different ecological and evolutionary adaptation mechanisms by assuming that for given conditions, the microbial community might be dominated by those organisms with functional traits that would maximize fitness under these conditions. Different fitness proxies have been used in the literature – but a general framework for EEO approaches in SOM modeling is missing. Based on a review of previous studies, we suggest a classification of EEO approaches in SOM models based on the definition of microbial fitness and the time scale of optimization. Results from different EEO approaches differ systematically along the axes of our classification framework – however, they can also yield convergent qualitative patterns that match experimental observations. Taken together, our results show that EEO approaches have great potential for advancing SOM modeling. Yet, challenges remain – calling especially for further comparative studies and empirical validation of different approaches.

How to cite: Schwarz, E., Abs, E., Chakrawal, A., Chavez Rodriguez, L., Quévreux, P., Reitz, T., and Manzoni, S.: Eco-evolutionary optimization in soil organic matter models, EGU General Assembly 2026, Vienna, Austria, 3–8 May 2026, EGU26-3995, https://doi.org/10.5194/egusphere-egu26-3995, 2026.

EGU26-4785 | ECS | Orals | BG1.11

Widespread pre-noon photosynthesis peak driven by afternoon photoprotection 

Liyao Yu and Xiangzhong Luo

Diurnal patterns of photosynthesis of ecosystems are theoretically expected to mimic those of incoming solar radiation (SW) and peaks at noon. By examining global ecosystem eddy covariance observations, however, we found ecosystem photosynthesis often peaks before noon, indicating widespread midday or afternoon photosynthesis depression. While some studies have attributed this depression to stomatal closure, a strategy that limits water loss under high atmospheric vapor pressure deficit (VPD), leaf-level studies suggest that excess light can trigger photoprotective responses and also cause the depression. Following the hypothesis, we studied the gaps between ecosystem carbon uptake peak and that of SW (0.48 ± 0.26 h), and found that the gaps advance increases with SW even on site-days characterized by the lowest VPD. Biomes receiving the highest SW, such as savannas and evergreen broadleaf forests, exhibit the largest gap between carbon uptake peak and SW peak. Together, these findings indicate that excess light is a key yet underappreciated driver of ecosystem-scale midday depression. Incorporating light-driven photoprotective processes into terrestrial carbon models may improve simulations of diurnal carbon fluxes.

How to cite: Yu, L. and Luo, X.: Widespread pre-noon photosynthesis peak driven by afternoon photoprotection, EGU General Assembly 2026, Vienna, Austria, 3–8 May 2026, EGU26-4785, https://doi.org/10.5194/egusphere-egu26-4785, 2026.

EGU26-5586 | Orals | BG1.11

Darwinian adaptation of plankton in global ocean models 

Boris Sauterey, Olivier Torres, Olivier Aumont, Guillaume Le Gland, Pedro Cermeño, Sergio Vallina, and Laurent Bopp

Plankton communities are an essential component of ocean biogeochemistry and play a key role in making oceans an important climatic buffer. In the oceans, the environmental control of planktonic activity is modulated by the composition and diversity of plankton physiological traits (e.g., size, temperature and light preferences, stoichiometry, etc.). Yet, very little is known about how plankton communities assemble in the ocean under the combined influence of biological (eco-evolutionary dynamics) and physical mechanisms (mixing, transport). Moreover, this key process is very crudely represented for in current ocean models. Here, I show how integrating Darwinian adaptation into ocean models allows simulating how the functional composition and diversity of plankton communities is shaped by adaptation and ocean physics, how it feeds back on ocean biogeochemistry, and what the implications are for the resilience of marine ecosystems under climate change. 

How to cite: Sauterey, B., Torres, O., Aumont, O., Le Gland, G., Cermeño, P., Vallina, S., and Bopp, L.: Darwinian adaptation of plankton in global ocean models, EGU General Assembly 2026, Vienna, Austria, 3–8 May 2026, EGU26-5586, https://doi.org/10.5194/egusphere-egu26-5586, 2026.

EGU26-5626 | ECS | Orals | BG1.11

Predicting forest dynamics and biomass production efficiency based on optimality principles 

Ruijie Ding, Sandy Harrison, and Iain Colin Prentice

Carbon (C) allocation refers to the processes by which plants distribute assimilated C among growth, storage, and respiration. While most ecosystem and land surface models explicitly represent C allocation, its treatment in many models remains rudimentary, reflecting a lack of consensus and limiting their ability to capture the processes governing C partitioning. A long-standing theory explains C allocation as maximizing growth, with foliage and below-ground investments balancing light, water and nutrients availability. However, the large C investment in tree stems does not contribute to primary production but reflects an evolutionary strategy to maximize light capture and competitive ability. Biomass production efficiency (BPE) quantifies the efficiency of assimilated C that is converted into structural growth. It reflects the balance between C gain by photosynthesis and C losses, principally autotrophic respiration (Ra). However, the controls on BPE remain poorly constrained, and even the sign of its response to growth temperature is unclear. Here we develop robust semi-empirical models of C allocation of forest dynamics, maximum tree height (Hm) and BPE in order to explore how C partitioning is influenced by the availability of different resources. We hypothesize that the demands of foliage production, and concomitant below-ground production to support that foliage, are satisfied with highest priority; and that any excess C (the net C profit, Pn) is allocated to stems in such a way as to maximize height growth, as a strategy for competitive fitness. Under this framework, the average diameter growth of a tree, and Hm, in an even-aged forest are shown to be proportional to Pn. We further show that BPE is shown to decrease with growth temperature (Tg), stand age, soil C:N ratio, pH and sand content, while increasing with mean temperature of the coldest month—resolving a contradiction in the literature, about its apparent response to mean annual temperature—and to be greater for deciduous than evergreen woody plants. These findings contribute to an optimality-based theoretical framework for improved process-based C allocation modelling in forest ecosystem models.

How to cite: Ding, R., Harrison, S., and Prentice, I. C.: Predicting forest dynamics and biomass production efficiency based on optimality principles, EGU General Assembly 2026, Vienna, Austria, 3–8 May 2026, EGU26-5626, https://doi.org/10.5194/egusphere-egu26-5626, 2026.

EGU26-5781 | Orals | BG1.11

An eco-evolutionary approach to modelling wildfire regimes 

Sandy P. Harrison, Sophia Cain, Ruijie Ding, David Sandoval Calle, Boya Zhou, and I. Colin Prentice

Wildfires are ubiquitous and an integral part of the Earth System, vital for maintaining the biodiversity and functioning of many ecosystems. Wildfire-induced changes in vegetation and landscape properties also have important feedbacks to climate through modulating water- and energy-exchanges and the carbon cycle. The current state-of-the-art global models used to predict how wildfires might behave in a changing climate capture some aspects of wildfire behaviour, but are poor at simulating fire seasonality, interannual variability and extreme fires, in large part because they do not adequately capture the vegetation-wildfire interactions regulating fire occurrence. Eco-evolutionary optimality approaches are increasingly being used to provide simple but robust models of vegetation functioning, and here we extend this approach to modelling wildfires.

Fuel availability and fuel dryness are consistently shown to be the primary drivers of wildfire occurrence, intensity and burnt area. Differences in the timing of fuel build up and drying determine the optimal time for wildfire occurrence and give rise to pyroclimates with distinct wildfire regimes. The phase difference in the seasonal time course and magnitude of gross primary production (GPP) and vapour pressure deficit (VPD) is used to provide a measure of the “propensity to burn”, which in turn can be translated into a probability for fire occurrence. An EEO-based model of the seasonal cycle of GPP is then used to derive litter fall and hence the inputs to dead fuel loads along with an empirically based formulation of decomposition to determine changes in the actual dead fuel load through time. We use an EEO-based model of biomass production efficiency to derive tree and grass cover, where the grass cover and dead fuel load together will determine the incidence of ground fires and tree cover the incidence of crown fires. We show that this simple model produces realistic simulations of spatial and temporal patterns in wildfire occurrence, and thus provides a basis for simulating the impact of wildfires on vegetation loss, post-fire recovery and ultimately feedbacks to climate.

How to cite: Harrison, S. P., Cain, S., Ding, R., Sandoval Calle, D., Zhou, B., and Prentice, I. C.: An eco-evolutionary approach to modelling wildfire regimes, EGU General Assembly 2026, Vienna, Austria, 3–8 May 2026, EGU26-5781, https://doi.org/10.5194/egusphere-egu26-5781, 2026.

EGU26-5874 | ECS | Posters on site | BG1.11

Right answers for the wrong Reasons? Testing water use efficiency responses in terrestrial biosphere models 

David Sandoval, David Orme, and Iain Colin Prentice

Water-use efficiency (WUE) quantifies the ratio of CO₂ assimilation to transpiration, reflecting the trade-off between carbon gain and water loss. It therefore provides key information about ecosystems’ strategies for dealing with drought, as well as their responses and feedbacks to climate. From an optimality perspective, a robust theory to predict WUE is fundamental for exploring potential adaptations, shifts in vegetation communities, or migration, especially under future scenarios.

Global estimates of WUE, generated by terrestrial biosphere models (TBMs), typically evaluate the accuracy of their predictions using observed fluxes. However, these evaluations often overlook whether the simulated sensitivity of fluxes to environmental drivers matches observed sensitivities, possibly covering flaws in the underlying theory, allowing models to produce “right answers for the wrong reasons”.

Here, we assess the sensitivity of WUE simulated by the TRENDY models to environmental variables and compare them against sensitivities inferred from δ¹³C isotopes and state-of-the-art remotely sensed datasets derived from machine learning. We found qualitative disagreements (opposite signs) in the sensitivity coefficients of WUE to environmental variables, highlighting gaps in the current theoretical understanding of ecosystem functioning.

How to cite: Sandoval, D., Orme, D., and Prentice, I. C.: Right answers for the wrong Reasons? Testing water use efficiency responses in terrestrial biosphere models, EGU General Assembly 2026, Vienna, Austria, 3–8 May 2026, EGU26-5874, https://doi.org/10.5194/egusphere-egu26-5874, 2026.

EGU26-6181 | ECS | Posters on site | BG1.11

Microstructural determinants of mechanical properties in exoskeletons: a comparison between hydrothermal vent crab and ghost crab 

Junyoung Hong, Boongho Cho, Dain Kim, Sook-Jin Jang, Minho Kang, Sungkook Yoon, and Taewon Kim

The exoskeleton of crabs serves functions in protection, support, and sensing. Among the microstructures that compose the exoskeleton, the Bouligand structure is known to contribute to its mechanical properties. Previous research on the influence of microstructures on the mechanical properties of the crustacean exoskeleton has primarily focused on stacking height (SH), yet it remained controversial whether SH is the dominant determining factor of the mechanical properties. In this study, we comprehensively analyzed the pitch angle, diameter of the chitin-protein fiber, and the interlamellar spacing in the Bouligand structure to compare their contribution to the mechanical properties. We found that in vent crabs, the carapace was harder than the claw, while the opposite was observed in ghost crabs. In vent crabs, SH was 1.95 times greater than in the claw, a difference likely attributable to the pitch angle-the only microstructural feature that varied. In contrast, no structural differences were detected between regions in ghost crabs, where SH was extremely small (< 1 μm) and thus mechanical properties appear to be governed by material characteristics rather than structure. These findings indicate that pitch angle influences the mechanical properties of the crab exoskeleton only when SH is sufficiently large.

How to cite: Hong, J., Cho, B., Kim, D., Jang, S.-J., Kang, M., Yoon, S., and Kim, T.: Microstructural determinants of mechanical properties in exoskeletons: a comparison between hydrothermal vent crab and ghost crab, EGU General Assembly 2026, Vienna, Austria, 3–8 May 2026, EGU26-6181, https://doi.org/10.5194/egusphere-egu26-6181, 2026.

EGU26-6247 | ECS | Orals | BG1.11

Heat Stress-Driven Shifts in Marine Phytoplankton Trait Composition in a Global Ocean-Biogeochemical Model  

Hyojeong Kim, Hajoon Song, Stephanie Dutkiewicz, Junwoo Lee, Ibrahim Hoteit, and Yixin Wang

Marine heatwaves (MHWs) are becoming more frequent, intense, and prolonged, posing increasing threats to marine ecosystems, including phytoplankton communities. Yet, understanding the impacts of MHWs on phytoplankton community structure remains challenging, given the limited number of observational and process-resolving modeling studies. Here, we develop a modeling framework using an advanced coupled ocean–biogeochemical model (MITgcm–Darwin), in which biogeochemical processes for 310 types of phytoplankton are explicitly resolved. In this model, 310 types are defined by different combinations of key traits: 14 size classes, 10 temperature preferences, and 8 ecological functions. We find an overall shift in phytoplankton composition toward small and warm-preferring types during MHWs. However, detailed features differ substantially across regions and traits. For example, in the tropical Pacific Ocean, the magnitude of shifts tends to increase with heatwave intensity, for both size and temperature traits. A moderate influence of the duration on the temperature trait is also found. In the Indian Ocean, on the other hand, heatwave intensity is the primary factor that affects size composition, while no significant shifts in temperature preference are detected. For both regions, these composition shifts are accompanied by significant losses in biodiversity, reflected in decreased richness and evenness. These results indicate that even short-term climatic extremes can substantially disrupt phytoplankton communities, with potential increasing consequences for marine food webs and ecosystem functioning that depend on phytoplankton as such perturbations intensify.

How to cite: Kim, H., Song, H., Dutkiewicz, S., Lee, J., Hoteit, I., and Wang, Y.: Heat Stress-Driven Shifts in Marine Phytoplankton Trait Composition in a Global Ocean-Biogeochemical Model , EGU General Assembly 2026, Vienna, Austria, 3–8 May 2026, EGU26-6247, https://doi.org/10.5194/egusphere-egu26-6247, 2026.

Mesoscale eddies are key oceanographic features influencing zooplankton community structure and ecosystem function. However, the vertical impacts of cyclonic and anticyclonic eddies on zooplankton energy transfer efficiency remain unclear in the northern South China Sea (SCS). We conducted a field survey in April 2023, collecting zooplankton samples with a multi-net system and analyzing them via ZooScan imaging technology. Size-based and trophic indicators—including the normalized biovolume size spectrum (NBSS), size diversity, and average equivalent spherical diameter (ESD)—were used to assess energy transfer efficiency across depth layers and eddy types. Results indicated significantly higher zooplankton total abundance, biovolume, and carbon biomass within cyclonic eddies (mean ± SD: 93.2 ± 25.7 ind./m3, 45.4±20.9 mm3/m3, 2.9±1.5 mg C/m3) compared to anticyclonic eddies (mean ± SD: 82.2±23.0 ind./m3, 37.8±14.0 mm3/m3, 2.4±0.9 mg C/m3) in the upper 300 m. Small copepods dominated all depth layers in both eddy types, comprising over 70% of the total abundance. Functional indicators, including the NBSS slope, size diversity, and average ESD, indicated higher energy transfer efficiency in cyclonic eddies within the upper 300 m. However, at the 0–25 m depth layers, anticyclonic eddies exhibited flatter NBSS slopes and higher size diversity than cyclonic eddies. Zooplankton productivity declined consistently with depth, while energy transfer efficiency to higher trophic levels showed a fluctuating vertical pattern and tended to rebound in deeper layers. Our findings highlight the crucial role of mesoscale eddy dynamics in structuring zooplankton communities and regulating energy flow in pelagic ecosystems of the northern SCS.

How to cite: Wang, S., Zhang, F., Chi, X., Li, Q., Zang, W., and Sun, S.: Zooplankton Size Structure and Energy Transfer Characteristics  under the Influence of Mesoscale Eddies in the Northern South China Sea during Spring: Insights from ZooScan Imaging , EGU General Assembly 2026, Vienna, Austria, 3–8 May 2026, EGU26-6255, https://doi.org/10.5194/egusphere-egu26-6255, 2026.

Earth system models (ESMs) represent the pinnacle of our ability to understand and predict Earth system dynamics, and are constructed from submodels that should capture the processes and process interactions occurring in the atmosphere, oceans, on land. One microbial parameter that defines key feedbacks in the Earth system is the microbial temperature dependence, e.g. for decomposition. Submodules within past (e.g. CENTURY, Roth-C) and future (Millennial, MEMS) ESMs represent this with one intrinsic temperature dependence for decomposition, and extending this static temperature dependence (i.e., unchanging) to all microbial processes (organic matter formation or destruction, etc.) and assuming no differences among climates across the globe.


Global microbial diversity has been mapped with -omics, revealing incredibly diverse, versatile and biogeochemically active microbes. However, the central challenge stubbornly persists – translating microbial diversity into quantitative representations that capture ecosystem processes. This inability forms a barrier for integration of microbial ecology into ESMs.


We use instantaneous measurements of microbial processes to estimate microbial intrinsic temperature dependences as “trait distributions” in situ, in environmental samples. We can thus translate biodiversity into ecosystem functions, and generate mathematical descriptions that interface with ESMs. We have uncovered how intrinsic microbial temperature dependences for processes that form (growth) and destroy (decomposition) organic matter vary across the globe, across seasons, and respond to warming. We have unearthed how temperature trait distributions interact with those for moisture, and determined the ecological and evolutionary mechanisms underpinning change. Our insights can be integrated into existing ESMs, revealing that dynamic microbial feedbacks characterise the earth system.

How to cite: Rousk, J.: Solving the microbial temperature problem in Earth system science, EGU General Assembly 2026, Vienna, Austria, 3–8 May 2026, EGU26-6873, https://doi.org/10.5194/egusphere-egu26-6873, 2026.

EGU26-7161 | ECS | Posters on site | BG1.11

Spatially varying parameters improve carbon cycle modeling in the Amazon rainforest 

Lei Zhu, Philippe Ciais, Yitong Yao, Daniel Goll, Sebastiaan Luyssaert, Isabel Martínez Cano, Arthur Fendrich, Laurent Li, Hui Yang, Sassan Saatchi, Ricardo Dalagnol, and Wei Li

Uncertainty in the dynamics of Amazon rainforest poses a critical challenge for accurately modeling the global carbon cycle. Current dynamic global vegetation models (DGVMs), which use one or two plant functional types for tropical rainforests, fail to capture observed biomass and mortality gradients in this region, raising concerns about their ability to predict forest responses to global change drivers. Here we assess the importance of spatially varying parameters to resolve ecosystem spatial heterogeneity in the ORCHIDEE (ORganizing Carbon and Hydrology in Dynamic EcosystEms) DGVM. Using satellite observations of tree aboveground biomass (AGB), gross primary productivity (GPP), and biomass mortality rates, we optimized two key parameters: the alpha self-thinning (α), which controls tree mortality induced by light competition, and the nitrogen use efficiency of photosynthesis (η), which regulates GPP. The model incorporating spatially optimized α and η parameters successfully reproduces the spatial variability of AGB (R2=0.82), GPP (R2=0.79), and biomass mortality rates (R2=0.73) when compared to remote sensing observations in intact Amazon rainforests, whereas the model using spatially constant parameters has R2 values lower than 0.04 for all observations. Furthermore, the relationships between the optimized parameters and ecosystem traits, as well as climate variables were evaluated using random forest regression. We found that wood density emerges as the most important determinant of α, which is in line with existing theory, while water deficit conditions significantly impact η. This study presents an efficient and accurate approach to enhancing the simulation of Amazonian carbon pools and fluxes in DGVMs by assimilating existing observational data, offering valuable insights for future model development and parameterization.

How to cite: Zhu, L., Ciais, P., Yao, Y., Goll, D., Luyssaert, S., Martínez Cano, I., Fendrich, A., Li, L., Yang, H., Saatchi, S., Dalagnol, R., and Li, W.: Spatially varying parameters improve carbon cycle modeling in the Amazon rainforest, EGU General Assembly 2026, Vienna, Austria, 3–8 May 2026, EGU26-7161, https://doi.org/10.5194/egusphere-egu26-7161, 2026.

EGU26-7805 | ECS | Posters on site | BG1.11

Reconstructing the Strength of Photosynthetic Endosymbiosis in Caribbean Corals before the Closure of the Isthmus of Panama 

Julia Schröder, Jonathan Jung, Ian Martongelli, Aaron O´Dea, James Klaus, Eberhard Gischler, Hubert Vonhof, Daniel M. Sigman, Thomas Brachert, Gerald H. Haug, and Alfredo Martinez-Garcia

Coral reef ecosystems are highly sensitive to environmental change, and their long-term persistence depends in part on flexible feeding strategies and symbiotic associations. A well-documented example of a major environmental perturbation is the progressive closure of the Isthmus of Panama during the Pliocene epoch (ca. 4.6–4.1 Ma), which initiated the transformation of the Caribbean Sea from a relatively nutrient-rich to a more oligotrophic marine environment. This reorganization imposed strong selective pressures on reef organisms, particularly corals, to adapt to declining nutrient availability.

Fossil records indicate that many modern Caribbean coral taxa originated before the Pliocene–Pleistocene transition. It remains unclear whether these species had already developed strong host-endosymbiont nutrient coupling prior to the closure of the Isthmus or whether these traits evolved in response to it. Here, we investigate this question by analyzing stable isotope records from fossil corals spanning the Late Miocene to the present in the Caribbean Sea. Coral-bound nitrogen isotope ratios (CB-δ15N) are used to infer changes in internal nitrogen recycling and host-endosymbiont coupling, while coral-bound oxygen isotope ratios (CB-δ18O) provide constraints on past seawater temperatures.

We hypothesize that many coral lineages had already developed tighter host-endosymbiont nutrient coupling before the Isthmus closure, and that species with intermediate levels of symbiosis facilitated adaption to more oligotrophic condition. This pre-adaptation may explain both the successful establishment of the modern Caribbean coral fauna after the closure and its present-day vulnerability to rapid anthropogenic stressors such as warming and nutrient pollution. By placing modern reef ecology in an evolutionary and paleoenvironmental context, this study aims to improve our understanding of coral resilience and inform future conservation strategies.

How to cite: Schröder, J., Jung, J., Martongelli, I., O´Dea, A., Klaus, J., Gischler, E., Vonhof, H., Sigman, D. M., Brachert, T., Haug, G. H., and Martinez-Garcia, A.: Reconstructing the Strength of Photosynthetic Endosymbiosis in Caribbean Corals before the Closure of the Isthmus of Panama, EGU General Assembly 2026, Vienna, Austria, 3–8 May 2026, EGU26-7805, https://doi.org/10.5194/egusphere-egu26-7805, 2026.

Soil represents the largest terrestrial carbon sink, with a substantial fraction stored in subsoils. Microbial functional diversity regulates ecosystem carbon cycling, yet how microbial traits vary with soil depth and landscape transitions remain poorly understood.  This knowledge gap is particularly relevant in coastal environments, where hydrologic and biogeochemical gradients impose strong selective pressures on microbial metabolism. We investigated microbial functional diversity and carbon utilization patterns across a coastal forest–salt marsh gradient, with a specific focus on depth-resolved trait expression and biogeochemical consequences. Monthly in situ porewater sampling was conducted across forest, wetland, and creek environments, from surface soils to subsurface layers. Porewater chemistry (pH, redox potential, electrical conductivity, dissolved organic carbon, DOC) was monitored to characterize environmental and biogeochemical gradients. Microbial carbon utilization patterns and functional diversity were assessed using Biolog EcoPlates, and key extracellular enzyme activities (β-glucosidase and phosphatase) were measured to evaluate microbial activity. DOC concentration increased from forest to wetland soils, accompanied by shifts in microbial functional traits. Forest soils, wetland surface layers and creek samples supported higher microbial diversity, whereas wetland deep layers retained a strong metabolic capacity for processing complex organic carbon substrates, indicating functional specialization under persistent anoxic and saline conditions. Deep layers showed measurable enzyme activities, indicating active microbial carbon turnover. These findings demonstrate that microbial functional diversity varies across both depth and landscape gradients, with implications for carbon transformation and storage in coastal ecosystems.

How to cite: Liu, Y. and Jin, Y.: Depth-Resolved Microbial Functional Diversity and Carbon Utilization Across a Forest–Wetland Gradient, EGU General Assembly 2026, Vienna, Austria, 3–8 May 2026, EGU26-8315, https://doi.org/10.5194/egusphere-egu26-8315, 2026.

EGU26-9721 | Posters on site | BG1.11

Including microbial communities in soil carbon-nitrogen cycling modeling via a hybrid neural-mechanistic modeling approach 

Lorenzo Menichetti, Elisa Bruni, Bernhardt Ahrens, Leo Rossdeutscher, and Jorge Curiel-Juste

A recurring challenge in ecosystem science is modeling the variance of biogeochemical process rates in connection with local microbial community composition. Mechanistic models usually relies on fixed parameters that ignore such ecological variations. Purely statistical approaches require extensive data and, lacking process-based information, often overfit to training conditions, limiting their ability to generalize. We present here a hybrid modeling framework that combines these approaches, allowing mechanistic biogeochemical models to adapt their parameters based on local microbial community structure.

Our approach uses neural networks to translate microbial community composition (bacterial and fungal taxonomic data) into site-specific key parameters in a mechanistic carbon-nitrogen cycling equations. Since these intermediate parameters likely capture multiple processes, we view them as functional parameters that allow the mechanistic model to flexibly incorporate the variance of decomposition rates due to local microbial communities, while still maintaining the interpretable structure of process-based equations and retaining the deterministic information for the processes we know how to model.

The innovation lies in including community composition from sequencing directly as a driver of parameter variation within established biogeochemical theory, preserving information that would otherwise be lost (for example assembling the sequencing data into diversity indicators). Literature-derived constraints ensure parameters remain within physically plausible ranges, but the neural components learns how microbial community structure modulates these values locally to improve predictions.

This methodological framework demonstrates that we can link communities with decomposition processes without requiring a complete mechanistic understanding (with consequent biases due to likely missing processes) of every intermediate step. This approach is broadly applicable, solving the difficulties coming from knowing that functional diversity influences biogeochemical processes but with an incomplete understanding of all the underlying mechanistic complexity, embedding the paradigm of soil decomposition kinetics as emergent ecological properties rather than as fixed intrinsic characteristics.

How to cite: Menichetti, L., Bruni, E., Ahrens, B., Rossdeutscher, L., and Curiel-Juste, J.: Including microbial communities in soil carbon-nitrogen cycling modeling via a hybrid neural-mechanistic modeling approach, EGU General Assembly 2026, Vienna, Austria, 3–8 May 2026, EGU26-9721, https://doi.org/10.5194/egusphere-egu26-9721, 2026.

EGU26-10585 | ECS | Posters on site | BG1.11

Subglacial and proglacial microbial communities in glacial rock flour of the Mont Blanc Massif 

Kara Sampsell, Klara Köhler, Francesca Schivalocchi, Ekaterina Diadkina, Hervé Denis, Bastien Wild, Timothy M. Vogel, and Catherine Larose

As alpine glaciers recede with global warming, proglacial forefields expand, and the processes of soil development take hold. The ecosystem transition toward greening is thought to be initiated by microorganisms that exert biotic weathering forces and accumulate carbon and nitrogen. A portion of the glacial sediments involved in this transition are classified as glacial rock flour. Glacial rock flour’s small particle size and large surface area suggest that it may offer a preferrable habitat and source of inorganic nutrients for microorganisms. However, microbial communities in glacial rock flour have yet to be reported. To investigate the microbial communities that colonize glacial rock flour, deposits were sampled near the melt streams of Mer de Glace and Glacier d’Argentière (Mont Blanc Massif, France). These glaciers flow over largely granitic bedrock. At both sites, three sampling points were selected with increasing distance from the glacier. At Glacier d’Argentière, three subglacial samples were collected off the basal ice surface. We hypothesized that characteristics of the glacial rock flour, such as median grain size or sampling distance from the glacier, would influence alpha diversity and abundance of the prokaryotic community. Laser particle size analysis, X-ray Diffraction (XRD), and geochemical extractions were completed to characterise the material. Quantitative polymerase chain reaction (qPCR) targeting the 16S rRNA gene and metabarcoding of the v3-v4 region of the 16S rRNA gene (rrs) were completed on DNA extracts to estimate prokaryotic abundance, probe taxonomic differences, and compute alpha diversity indices. A prokaryotic community was detected in all samples with a negative correlation evident between median particle size and prokaryotic abundance. Prokaryotic alpha diversity indices (Chao1, Shannon, Simpson) suggest that subglacial alpha diversity is greater than proglacial forefield alpha diversity. However, prokaryotes were less abundant in subglacial samples compared to proglacial samples. These results represent the first report of microbial communities in subglacial and proglacial glacial rock flour sediment.

How to cite: Sampsell, K., Köhler, K., Schivalocchi, F., Diadkina, E., Denis, H., Wild, B., Vogel, T. M., and Larose, C.: Subglacial and proglacial microbial communities in glacial rock flour of the Mont Blanc Massif, EGU General Assembly 2026, Vienna, Austria, 3–8 May 2026, EGU26-10585, https://doi.org/10.5194/egusphere-egu26-10585, 2026.

EGU26-11046 | ECS | Posters on site | BG1.11

Spatial modelling of soil microbial interactions and the emergence of purely spatial interactions 

Julie-Maï Paris, Xavier Raynaud, and Naoise Nunan

A large diversity of microorganisms lives in soils where they transform the available organic matter, and store or release into the atmosphere the carbon it contains. Individual cells of the same or different species interact together in metabolic networks, i.e. networks of interactions ranging from competition for a same resource to cooperation with an exchange of resources. Because soil is a very heterogeneous environment, these interactions are limited by the local presence of resources and species. Therefore, all the theoretically possible interactions are not realized in practice. Understanding the impact of spatial heterogeneity on soil metabolic networks is essential to improve our comprehension of the carbon cycle in soils. However, it remains very difficult today to study spatial heterogeneity and metabolic networks in situ.  
  
Here, we present a numerical model we developed to study the impact of microbial spatial distributions on metabolic networks. Our model is spatially explicit and individual based. Each cell has a spatially limited impact on its environment, in which it is able to take up some resources and transform them into other products, which are then released into the environment and can be used by other cells.  
  
In this work, we explore the emergence of a type of interaction that only arise when spatial heterogeneity is taken into account, the eclipse dilemma (a concept first developed in Metabolic Resource Allocation in Individual Microbes Determines Ecosystem Interactions and Spatial Dynamics, Harcombe et al., 2014): in some spatial configurations, two individuals competing for the same resource can eventually enter a cooperating dynamic by providing to a common partner species with which they exchange resources.  We have found that while competition for the same resource reduces the average amount of resource that each individual can obtain due to sharing, cooperation with a common partner can lead to a local increase in available resources that can exceed the effect of competition. Those local increases in variability of metabolic interactions showed that spatialization in soil models is indeed essential to a proper microbial representation in models.

How to cite: Paris, J.-M., Raynaud, X., and Nunan, N.: Spatial modelling of soil microbial interactions and the emergence of purely spatial interactions, EGU General Assembly 2026, Vienna, Austria, 3–8 May 2026, EGU26-11046, https://doi.org/10.5194/egusphere-egu26-11046, 2026.

EGU26-11414 | ECS | Posters on site | BG1.11

Separating stomatal and non-stomatal responses of gross primary productivity to soil moisture 

Mengdi Gao, David Sandoval, and Iain Colin Prentice

Soil moisture is a major constraint on terrestrial gross primary productivity (GPP). In this study, we propose and test two hypotheses to explain how soil moisture limits carbon uptake: 1) plants reduce stomatal conductance around midday to conserve water, leading to a temporary decline in internal CO₂ concentration and photosynthesis; and 2) water stress causes a more general reduction in photosynthetic capacity, expressed as a decrease in the quantum efficiency of photosynthesis (φ₀), thereby lowering GPP throughout the day. Here, we combine Eco-Evolutionary Optimality (EEO) Theory with eddy covariance observations to separate and quantify stomatal and non-stomatal responses of GPP to soil moisture. Our results show that both midday stomatal closure and photosynthetic capacity suppression coexist, supporting both hypotheses, with their relative importance strongly modulated by soil moisture. Across most sites, the magnitude of midday GPP depression weakens with increasing soil moisture, indicating that stomatal responses are more sensitive under low soil moisture conditions. In addition, photosynthetic capacity increases with soil moisture, contributing to an overall enhancement of daily GPP. By explicitly separating stomatal and non-stomatal pathways through which soil moisture affects carbon uptake, this study provides a mechanistic explanation for the more conservative water use strategies observed in plants from dry climates and improves the representation of diurnal GPP dynamics in water-limited ecosystems.

How to cite: Gao, M., Sandoval, D., and Prentice, I. C.: Separating stomatal and non-stomatal responses of gross primary productivity to soil moisture, EGU General Assembly 2026, Vienna, Austria, 3–8 May 2026, EGU26-11414, https://doi.org/10.5194/egusphere-egu26-11414, 2026.

EGU26-11850 | ECS | Posters on site | BG1.11

Exploring the potential of soil metabolic and microbial composition in predicting ecosystem functions across biomes and land use types. 

Thomas Guzman, Samuel Mondy, Aurore Kaisermann, Sam P. Jones, Joana Sauze, Evert van Scheik, Steven Wohl, Karen Marcellin, Pierre Petriacq, Jérôme Ogée, and Lisa Wingate

Soils support a wide range of ecosystem functions and services, including climate regulation, nutrient cycling and carbon sequestration. Most of these functions are strongly impacted by a large diversity of microorganisms hosted in soil (e.g., bacteria, fungi) which are increasingly threatened by human-induced global change factors such as climate warming or land-use change. A deep understanding of how microbial communities function is thus crucial to evaluate how they influence ecosystem services but also how anthropogenic perturbation may affects soil quality and the delivery of these services. While great efforts have been made to evaluate the relationships between microbial diversity and ecosystem functions, much less attention has been paid to the metabolomic profiling of soil microbial communities. However, recent advances in mass spectrometry and big data processing now allow us to measure hundreds of known and unknown metabolite features constituting the soil metabolome, which can mirror the key biological processes occurring below-ground, and present an important opportunity to better understand the microbial characteristics and metabolic pathways driving soil ecosystem functions.

In this study, soil metabolic profiles and microbial communities were explored on 25 European soils from different biomes and land use types alongside soil physical and chemical measurements in order 1) to characterise soil metabolomes across a large range of soil types, 2) to investigate the links between soil microbial communities and associated metabolic profiles, and 3) to evaluate the potential of soil metabolomics to predict ecosystem functions such as soil gas exchange.

Soil metabolic profiles were screened using UHPLC-LTQ-Orbitrap mass spectrometry (LC-MS) and showed a strong gradient across sites alongside bacterial and fungal community shifts characterised using metabarcoding. The ability of soil metabolic profiles and microbial communities to predict soil ecosystem functions was evaluated through machine learning models across biomes and the interconnection of a core set of metabolic features and microbial genus was further investigated to deepen our understanding of the potential mechanisms and microbial communities involved.

How to cite: Guzman, T., Mondy, S., Kaisermann, A., Jones, S. P., Sauze, J., van Scheik, E., Wohl, S., Marcellin, K., Petriacq, P., Ogée, J., and Wingate, L.: Exploring the potential of soil metabolic and microbial composition in predicting ecosystem functions across biomes and land use types., EGU General Assembly 2026, Vienna, Austria, 3–8 May 2026, EGU26-11850, https://doi.org/10.5194/egusphere-egu26-11850, 2026.

EGU26-12325 | Orals | BG1.11

Functional diversity in motion: a general theory of eco-evolutionary change in complex ecosystems 

Jaideep Joshi, Toyo Vignal, and Ulf Dieckmann

Most ecosystems are characterized by a rich and dynamic landscape of functional diversity. Ecological interactions that drive biodiversity and adaptation are profoundly complex — they arise from fine‐scale variation in organismal traits, unfold across ecological and evolutionary timescales, and operate within dynamic ever-changing environments. An individual’s performance, and thus its contribution to community structure and ecosystem functioning, emerges from the following key factors: (1) its physiological state (such as size, age, or energy reserves), (2) its capacity to acclimate to short-term microclimatic changes, (3) trait-mediated trade-offs it faces in growth and survival, (4) the traits and states of other organisms in the community, and (5) the long-term abiotic environment which itself may be co-created by the population. To understand how functional diversity is filtered and reshaped by these processes, we need a theory that can play out long-term eco-evolutionary dynamics of ecosystems while incorporating realistic ecological complexity. 

Here, we introduce a unified trait-based eco-evolutionary framework that meets this challenge by explicitly integrating three core features of real ecosystems: (1) continuous physiological state structure, (2) intraspecific and interspecific trait variation, and (3) frequency-dependent selection driven by population–environment feedbacks. The framework can be coupled to trait-based eco-physiological models of individual performance, allowing short-term acclimation and long-term evolution to be treated within a single, coherent system. This makes it possible to predict the best-adapted trait combinations under different environments, to test whether physiological trade-offs encoded in models are consistent with observed trait distributions along environmental gradients, and to project how those distributions will shift under future short- and long-term environmental change. At the same time, the approach provides a scalable alternative to computationally intensive individual-based models while retaining key sources of ecological and evolutionary complexity.

We apply this framework to predict plant hydraulic strategies across environmental gradients by coupling it with the Plant-FATE model, which accounts for physiological acclimation of individuals and trait-size-structured vegetation demographics of populations. The theory predicts that, all else being equal, plants evolve more negative xylem vulnerability (P50) in drier environments, matching broad empirical patterns across real ecosystems. This agreement provides an evolutionarily grounded validation of the functional trade-offs embedded in plant physiology and enables robust forecasts of how trait distributions — and their biogeochemical implications — are likely to respond to ongoing environmental change.

How to cite: Joshi, J., Vignal, T., and Dieckmann, U.: Functional diversity in motion: a general theory of eco-evolutionary change in complex ecosystems, EGU General Assembly 2026, Vienna, Austria, 3–8 May 2026, EGU26-12325, https://doi.org/10.5194/egusphere-egu26-12325, 2026.

Bryophytes and lichens in permafrost regions act as a natural insulation cover and thus cool underlying soil layers due to their porous, air-filled structure. The retained water content varies in response to evapotranspiration and freeze-thaw transitions, thereby modulating the insulation effects. Climate change is driving alterations in functional diversity of these highly sensitive non-vascular vegetation communities. Shifts in functional traits are closely linked to height and water retention capacity, thus the insulating properties, of the bryophyte and lichen layer. However, it is largely unclear how changes in functional diversity of non-vascular vegetation will affect soil temperature. Yet this gap may be addressed by trait-based models that simulate the mutual interaction between biodiversity and soil state.

This study focuses on bryophyte and lichen vegetation in high-latitude permafrost ecosystems, aiming to: (1) quantify their insulation effects on soil temperature under long-term climate change, and (2) clarify the underlying mechanisms by which functional diversity modulates the insulation effects. To this end, we refine the permafrost processes within the trait- and process- based LiBry model to accurately capture the coupled states of soil and diversity. Model experiments to isolate effects of bryophyte and lichen vegetation are implemented to determine their contribution to soil temperature variations. We further drive the model with a gradient of climate and diversity scenarios to reveal the relationships between distribution of functional traits and insulation effects. Our findings contribute to a more comprehensive understanding of the impacts of functional diversity on key permafrost processes in data-scarce contexts. 

How to cite: Zhu, Y. and Porada, P.: Uncover the link between functional trait diversity and thermal insulation effects of bryophytes and lichens in permafrost regions: Insights from a processed-based model, EGU General Assembly 2026, Vienna, Austria, 3–8 May 2026, EGU26-12845, https://doi.org/10.5194/egusphere-egu26-12845, 2026.

EGU26-13111 | ECS | Orals | BG1.11

Simulating Forest Carbon-Water Fluxes in Land Surface Models through Eco-Evolutionary Optimality Principles 

Jialiang Zhou, Nuno Carvalhais, Anke Hildebrandt, Sujan Koirala, and Shijie Jiang

Reliable simulation of carbon and water fluxes in forest ecosystems is essential for understanding global energy, carbon, and water cycles, while it remains limited by the large number of poorly constrained parameters in land surface models, particularly in regions lacking flux observations. While model-data integration using satellite and eddy covariance data has improved performance, it does not resolve the fundamental problem of parameter identifiability.

Here, we use SINDBAD (Koirala et al., 2025), a model-data integration framework, to evaluate whether eco evolutionary optimality (EEO) principles can act as effective constraints on a coupled carbon water land surface model when flux observations are unavailable. Using 37 forest sites worldwide spanning 1979-2017, we compare three experiments that differ in the type of constraints applied, i.e., vegetation structure only, vegetation structure plus flux observations, and vegetation structure plus EEO based constraints, to assess to what extent theoretical optimality principles can help even without direct flux information.

We find that vegetation structure alone is insufficient to reproduce observed carbon and water fluxes, especially at water limited sites. Incorporating EEO constraints leads to clear improvements in simulations of gross primary productivity, ecosystem respiration, and evapotranspiration under water limitation, while effects are weaker at energy limited sites. EEO constrained simulations also show more realistic sensitivities of fluxes to precipitation and temperature, in some cases exceeding those obtained when flux observations are directly assimilated.

These results suggest that eco evolutionary optimality principles can provide meaningful constraints on land surface models with high dimensional parameter spaces, reducing effective parameter uncertainty under data sparse conditions.

How to cite: Zhou, J., Carvalhais, N., Hildebrandt, A., Koirala, S., and Jiang, S.: Simulating Forest Carbon-Water Fluxes in Land Surface Models through Eco-Evolutionary Optimality Principles, EGU General Assembly 2026, Vienna, Austria, 3–8 May 2026, EGU26-13111, https://doi.org/10.5194/egusphere-egu26-13111, 2026.

EGU26-13321 | Posters on site | BG1.11

A parsimonious and interpretable model of plant dimensional scaling 

Jaideep Joshi, Tina Garg, Florian Hofhansl, Boya Zhou, and Iain Colin Prentice

Accurate dimensional scaling is essential for translating forest inventory measurements of stem diameter and height into estimates of tree volume, biomass, and carbon stocks, which underpin ecosystem function. Most existing scaling approaches fall into three broad classes: empirical allometries, metabolic scaling theory, and physiologically inspired models such as the pipe model. While widely used, these frameworks typically operate at coarse spatial or taxonomic scales, rely on poorly interpretable parameters, and offer limited insight into how scaling relationships vary across species and environments.

A recent parsimonious model of plant dimensional scaling is the T model, which describes tree height and crown area as a function of basal diameter. It uses just three parameters, all of which are physiologically interpretable and directly measurable functional traits. These are: (1) the initial ratio of height to diameter, or stem slenderness, which affects initial height growth rate as diameter increases, (2) maximum tree height, which affects the later saturating part of the height-diameter scaling, and (3) initial ratio of crown area to sapwood area, which is similar to the pipe model and determines  the scaling of crown area with height and diameter.

Here, we combine measurements from Tallo, a large global dataset of individual tree measurements (spanning over 3000 species-site pairs) with high-resolution environmental data, to test and parameterize the T model for each species within each site. We show that: (1) The T model fits the data well, providing a parsimonious and interpretable model of plant dimensional scaling, (2) the estimated dimensional traits (i.e., the model parameters) show systematic variation across climatic gradients, suggesting an overall macroclimatic adaptation, (3) the traits exhibit substantial phenotypic plasticity, in that site-specific species-mean traits covary with environmental gradients in the same direction and magnitude as community-wide site-mean traits, (4) among coexisting species, especially in the tropics, the traits coordinate systematically with maximum height, reflecting adaptation to the light environment among different canopy strata. This systematic variation likely allows multiple trait combinations to achieve similar levels of species performance (or evolutionary fitness). Such 'functional equifinality' may provide a parsimonious explanation of biodiversity and species coexistence, complementing other known mechanisms such as niche partitioning and neutrality. 

How to cite: Joshi, J., Garg, T., Hofhansl, F., Zhou, B., and Prentice, I. C.: A parsimonious and interpretable model of plant dimensional scaling, EGU General Assembly 2026, Vienna, Austria, 3–8 May 2026, EGU26-13321, https://doi.org/10.5194/egusphere-egu26-13321, 2026.

EGU26-13459 | Orals | BG1.11

Fungi from land to sea: phenotypic plasticity drives functional adaptation across saline and non-saline habitats 

Tiziano Benocci, Asier Zaragoza, Mark Anthony, Federico Baltar, and Riccardo Baroncelli

Fungi are highly efficient degraders of organic matter, including recalcitrant compounds, and are therefore key recyclers in global biogeochemical cycles. While the vast majority of fungal diversity has been studied in terrestrial environments, marine fungi remain largely underexplored despite their ecological relevance and growing biotechnological interest. Notably, only ~1% of described fungal species originate from marine environments, and many of these are also found on land, raising the question of whether environmental adaptability is driven by species-level traits or by strain-level plasticity.

To address this, we compared worldwide strains of the same fungal species isolated from terrestrial and marine environments, integrating genomic analyses with detailed phenotypic assays. Our study focused primarily on the genus Trichoderma, a taxa with key roles in decomposition, plant-fungus interactions, and industrial enzyme production, including the cellulase-producing workhorse Trichoderma reesei, which served as key reference system.

While genome content was largely conserved across strains, pronounced phenotypic divergence was observed between marine and terrestrial isolates regarding salinity tolerance, and divergent metabolic niches through distinct carbon source preferences and altered rhizosphere interactions, even under saline conditions. These results suggest that environmental adaptation in Trichoderma is primarily driven by physiological plasticity rather than major genomic restructuring, indicating a broad physiological reaction norm that allows for the colonization of diverse saline and non-saline habitats.

Our findings highlight marine fungi as overlooked reservoirs of adaptive traits relevant to biogeochemical processes and biotechnology, including enzyme production, metabolite diversity, and stress-resilient plant–fungus interactions. By linking ecological origin to phenotypic performance, this study underscores the evolutionary plasticity of marine fungi and their potential role in shaping resilient bioprocesses and ecosystem functioning in a changing planet.

How to cite: Benocci, T., Zaragoza, A., Anthony, M., Baltar, F., and Baroncelli, R.: Fungi from land to sea: phenotypic plasticity drives functional adaptation across saline and non-saline habitats, EGU General Assembly 2026, Vienna, Austria, 3–8 May 2026, EGU26-13459, https://doi.org/10.5194/egusphere-egu26-13459, 2026.

EGU26-13746 | ECS | Posters on site | BG1.11

From molecules to mountain ranges: Remote sensing of extremophilic algae blooms, Saharan dust deposition events, and meta-omic analysis of the bloom community 

Luke Richardson, Robert Bryant, Jagroop Pandhal, Andrew Sole, Frederick Tallantire, and Darrel Swift

Background and aims

Highly pigmented extremophilic algae communities, “Blood Snow”,  accelerate the retreat of glaciers and snowcaps by depressing the reflectivity of surfaces by up to 13%. In the European Alps these snow algae interact with depositions of Saharan dust, a plausible source of vital nutrients. Using a novel ML-based remote-sensing algorithm, we have tracked blooms and dust deposition events in the Alps, but we now seek molecular-level insight to better understand how, where and when these blooms occur. Unculturable key strains, remote field-sites and low biomass per unit volume has kept meta-omic analysis of functional microbial ecology impractical in these ecosystems. Standard sampling techniques require cryogens or expensive, heavy and limited portable freezers to preserve protein for multi-omics: These are, at minimum, logistically challenging if not unobtainable in remote locations. We aimed to develop ambient temperature concentration, fixation and transportation of field samples for meta-omics, expanding the ability of researchers to probe the ecology of remote extremophile communities in-situ. Better in-vitro understanding of these significant unconstrained cryospheric effects may help untangle the interactions, behavior and uncertain future of these phenomena.

Methods

Traditional flash-freezing requires the sourcing and transportation of cryogens to preserve samples as-is. Using cryogens in remote locations is hazardous, and results in bulky samples that must reach a freezer within hours. Another approach is to use in-situ concentration followed by macromolecule fixation with broad-spectrum enzyme inhibitors. This allows preservation of approximately equal quality to LN2, concentrated samples, safer fieldwork and a generous timescale for samples to reach long-term storage. This then fed into a SP3 proteomic and WGS metagenomic pipeline to identify proteins and infer what the community is capable of on its own, and what must be outsourced.

Results

We show that quality DNA and Protein can be extracted from samples gathered in this manner and present preliminary meta-omic analysis of the same, synthesised with the results of our whole Alp survey of Algal Blooms and dust deposition events. This method also solves an adjacent problem: the low biomass per volume of remote extremophiles via in-situ concentration. We will also discuss how these molecular-level insights may provide clues into community functioning, interaction with other geophysical cycles such as Saharan dust circulation, and outline future opportunities.


Conclusion

A novel sampling technique allows meta-omic exploration of microbial ecological dynamics in remote locations without cryogens. This lower barrier to entry enables affordable, compact, time-insensitive, meta-omics in remote microbial ecosystems, helping to sidestep issues in understanding these currently unculturable but highly influential organisms.

How to cite: Richardson, L., Bryant, R., Pandhal, J., Sole, A., Tallantire, F., and Swift, D.: From molecules to mountain ranges: Remote sensing of extremophilic algae blooms, Saharan dust deposition events, and meta-omic analysis of the bloom community, EGU General Assembly 2026, Vienna, Austria, 3–8 May 2026, EGU26-13746, https://doi.org/10.5194/egusphere-egu26-13746, 2026.

EGU26-13876 | ECS | Posters on site | BG1.11

Environmental drivers of microbial metal transporter diversity in geothermal systems 

Flavia Migliaccio, Davide Corso, Martina Cascone, Edoardo Taccaliti, Benoit De Pins, Deborah Bastoni, Matteo Selci, Gabriella Gallo, Alessia Bastianoni, Luciano Di Iorio, Costantino Vetriani, Peter H. Barry, Rebecca L. Tyne, Karen G. Lloyd, Gerhard L. Jessen, Agostina Chiodi, Marteen J. De Moor, Carlos J. Ramirez, Angelina Cordone, and Donato Giovannelli and the Giovannelli Lab - Università degli Studi di Napoli Federico II, Department of Biology

Transition metals are crucial for microbial metabolism, serving as catalytic cofactors in many enzymes and contributing to protein folding. Their fluctuating bioavailability, depending on environmental concentrations and redox state, but also their potential toxicity due to high reactivity, selected for tight metal homeostasis regulation. Metal transporters lie at the core of this homeostatic control. Accordingly, microorganisms have evolved a wide diversity of metal transport systems to cope with changing environmental metal availability throughout Earth history.

The present study aims at describing the diversity and distribution of microbial metal transport systems across several geothermal environments, with a specific focus on shallow water hydrothermal vents and terrestrial deeply sourced seeps. In these ecosystems, microbial diversity and metabolism are tightly linked to the elements supplied by water-rock interactions, providing an excellent model to investigate the diversity of microbial metal transport systems. 

We performed shotgun metagenomics of geofluids from more than 200 thermal features globally distributed and carried out functional annotation of sequencing reads using a manually curated database of metal transport genes. Metagenomic data were coupled to high-resolution geochemical analysis, including ion chromatography and inductively-coupled plasma mass spectrometry. 

Our results reveal that microbial metal transport systems are strongly structured by geochemical context and dissolved metal availability across geothermal environments. Transporter diversity and abundance varied systematically across tectonic settings and physicochemical gradients, with metal-poor environments exhibiting higher diversity and abundance of uptake systems, whereas metal-rich and acidic environments display reduced transporter diversity and a relative enrichment of efflux-related functions. These relationships point to a dynamic regulatory mechanism, where microorganisms may adapt their metal uptake strategies in response to fluctuating metal concentrations, providing new insights into microbial evolution of metal transport systems. Such findings could have broader implications for understanding microbial evolution in extreme environments, providing more insights into the fundamental role of metal availability in the regulation of microbial diversity.

How to cite: Migliaccio, F., Corso, D., Cascone, M., Taccaliti, E., De Pins, B., Bastoni, D., Selci, M., Gallo, G., Bastianoni, A., Di Iorio, L., Vetriani, C., Barry, P. H., Tyne, R. L., Lloyd, K. G., Jessen, G. L., Chiodi, A., De Moor, M. J., Ramirez, C. J., Cordone, A., and Giovannelli, D. and the Giovannelli Lab - Università degli Studi di Napoli Federico II, Department of Biology: Environmental drivers of microbial metal transporter diversity in geothermal systems, EGU General Assembly 2026, Vienna, Austria, 3–8 May 2026, EGU26-13876, https://doi.org/10.5194/egusphere-egu26-13876, 2026.

EGU26-14116 | ECS | Orals | BG1.11

Biochemical remodeling of phytoplankton cell composition under climate change 

shlomit sharoni, Keisuke Inomura, Stephanie Dutkiewicz, Oliver Jahn, Zoe Finkel, Andrew Irwin, Mohammad M Amirian, Erwan Monier, and Michael Follows

Although the macromolecular composition of phytoplankton shapes the nutrition available to marine ecosystems and regulates global biogeochemistry, there are no mechanistic, predictive models for its global distribution. Using a cellular allocation model, we simulate phytoplankton allocation to proteins, carbohydrates, and lipids in the present day and a warming scenario. Our simulations predict spatial variations consistent with available observations: in nutrient-sufficient, low-light high-latitude regions, phytoplankton allocate more to nitrogen-rich proteins, while in nutrient-depleted subtropical regions, allocation favours carbohydrates and lipids. Under warming, subtropical phytoplankton increase protein allocation by ~20%, as subsurface populations, rich in light-harvesting protein, thrive, whereas high latitude protein allocation declines by ~15–30% due to warming and light limitation relief. In situ macromolecular measurements in polar regions show recent trends consistent with our predictions. These results suggest that macromolecular composition responds measurably to changing environmental conditions, reshaping the nutritional landscape at the base of the marine food web.

How to cite: sharoni, S., Inomura, K., Dutkiewicz, S., Jahn, O., Finkel, Z., Irwin, A., Amirian, M. M., Monier, E., and Follows, M.: Biochemical remodeling of phytoplankton cell composition under climate change, EGU General Assembly 2026, Vienna, Austria, 3–8 May 2026, EGU26-14116, https://doi.org/10.5194/egusphere-egu26-14116, 2026.

EGU26-14477 | ECS | Orals | BG1.11

Improving Gross Primary Production Estimates by Integrating Eco-Evolutionary Optimality Modelling with High-Resolution Sentinel-2 Observations 

Wenjia Cai, Iain Colin Prentice, Hyunjung Hong, Weiguo Yu, and Youngryel Ryu

The terrestrial biosphere constitutes a major component of the global carbon cycle, absorbing a substantial fraction of anthropogenic CO2 emissions and thereby mitigating climate change. Terrestrial vegetation governs the largest carbon flux in biosphere - gross primary production (GPP), the total carbon uptake through photosynthesis - making accurate quantification of GPP critical to projection of land-atmosphere carbon exchange. However, it remains challenging due to uncertainties in observations and model representations. Advances in high-resolution satellite remote sensing products now enable detailed monitoring of vegetation changes, while process-based models could offer mechanistically robust characterization of plant biophysical and biochemical processes. Here we integrate quality-controlled and corrected Sentinel-2 leaf area index (LAI) with eco-evolutionary optimality-based P model to simulate GPP at eddy covariance flux sites. Model performance is evaluated against site observations to assess the ability of this framework to reproduce observed spatial patterns and temporal dynamics. Our results demonstrate that such hybrid approaches combining Earth Observation data with a theoretically grounded, parameter-sparse model greatly improved GPP simulation, highlighting a promising pathway for advancing ecosystem carbon flux modelling and evaluation.

How to cite: Cai, W., Prentice, I. C., Hong, H., Yu, W., and Ryu, Y.: Improving Gross Primary Production Estimates by Integrating Eco-Evolutionary Optimality Modelling with High-Resolution Sentinel-2 Observations, EGU General Assembly 2026, Vienna, Austria, 3–8 May 2026, EGU26-14477, https://doi.org/10.5194/egusphere-egu26-14477, 2026.

EGU26-16163 | Orals | BG1.11

From Arctic soils to the atmosphere: microbial controls on biological ice-nucleating particles at high latitudes 

Tina Šantl-Temkiv, Lasse Z. Jensen, Tommaso Lamesta, Christian D. F. Castenschiold, Shashi Prabha Kumari, Andreas Massling, Henrik Skov, Frank Stratmann, Heike Wex, and Kai Finster

The Arctic is experiencing rapid climate change, with warming rates exceeding three to four times the global average. This has a profound impact on cloud and precipitation formation. Bioaerosols are critical for cloud processes as they can act as high-temperature ice nucleating particles (INPs). Despite their importance, the understanding of bioaerosol-cloud interactions remains highly uncertain, primarily due to limited information on the types, concentrations, and sources of biogenic INPs. To reduce these uncertainties, we combined analyses of Arctic soils as potential reservoirs of biogenic INPs with multi-year atmospheric observations of bioaerosols and INP in the High Arctic.

We first investigated Arctic soils as reservoirs of biogenic INPs by analyzing fungal community composition and INP concentrations across 78 soil samples collected from seven sites spanning southern to northern Greenland. To determine whether INPs from soils are transferred into the atmosphere, we performed the first multi-year (2021–2023) study of bioaerosol abundance and composition, together with quantifying high-temperature INPs from the High Arctic, collected at Villum Research Station at a 3.5-day time resolution. Soils were sieved and INPs associated with particles <5 µm as well as INPs found in the soluble fraction (<0.22 µm) were obtained using the Micro-PINGUIN assay. Fungal and bacterial communities were characterized using ITS2 and 16S rRNA gene amplicon sequencing. Source tracking was used to determine the contribution of local sources to airborne microbial cells and INP.

In the soils, we found that higher INP concentrations were associated with higher latitudes. Based on their high-temperature activity, we suggest that these INPs are proteinaceous. Using multivariate analyses, we identified annual mean air temperature as the dominant explanatory variable, followed by soil pH. The composition of the fungal community varied significantly among sites, and several taxa, including Leptosphaeria, Pseudogymnoascus, Tetracladium, and Microdochium, showed significant positive correlations with high-temperature INP concentrations, suggesting that members of the fungal community are producing soil-derived INPs. We found that the INPs were present in the soluble fraction of the soils, which is also consistent with fungal origin. As suggested for temperate regions, these INPs can disassociate from fungal hyphae and bind to clay particles, getting emitted to the atmosphere on inorganic particles. Analyzing aerosol samples, we found that atmospheric INP concentrations ranged from 2.2 × 10⁻² to 7.2 × 101 m-3, and airborne bacterial concentrations from 2.7 × 100 to 4.2 × 10³ m⁻3. We observed seasonal shifts in microbial community composition, with spore-forming taxa dominating during in spring and more diverse, locally sourced communities in summer. Both bacterial abundance and diversity were positively correlated with warm-temperature INP concentrations, indicating that these were associated with emissions from environments with dense and diverse bacterial communities, such as soils.

Together, our results allow us to link high-latitude terrestrial microbial communities to atmospheric INP, and we demonstrated that Arctic soils, particularly at northern latitudes, represent key reservoirs of biogenic INPs, which disperse into the atmosphere. By integrating studies of the microbial soil communities and long-term atmospheric observations we can constraint biological aerosol–cloud interactions and their potential sensitivity to the ongoing Arctic warming.


How to cite: Šantl-Temkiv, T., Jensen, L. Z., Lamesta, T., Castenschiold, C. D. F., Kumari, S. P., Massling, A., Skov, H., Stratmann, F., Wex, H., and Finster, K.: From Arctic soils to the atmosphere: microbial controls on biological ice-nucleating particles at high latitudes, EGU General Assembly 2026, Vienna, Austria, 3–8 May 2026, EGU26-16163, https://doi.org/10.5194/egusphere-egu26-16163, 2026.

EGU26-16455 | ECS | Posters on site | BG1.11

Statistical approaches to soil carbon dynamics 

Yinon Bar-On and Abraham Flamholz

Terrestrial ecosystems absorb ≈30% of anthropogenic CO2 emissions in a process termed the land sink. This process thus mitigates a large fraction of current and future climate change, and Earth’s future climate depends greatly on whether or not the land sink continues. Accumulation of soil organic carbon (SOC), is responsible for a large fraction of carbon absorbed by the land sector, yet we currently lack sufficient observational constraints on changes in SOC at the global scale. Moreover, the computational models that we rely on to simulate SOC dynamics are too complex to effectively use the limited available data, leading to very large uncertainty in their projections. To help address these challenges, we develop simple-yet-powerful statistical models of soil organic carbon degradation that use available observations of carbon turnover time and radiocarbon dating to constrain the ~10-100 year dynamics of SOC, the relevant time scale over which societies can plan for climate change. We show that these models can be independently parameterized from available data, and have predictive performance on par or exceeding state-of-the-art models, with many fewer parameters.

How to cite: Bar-On, Y. and Flamholz, A.: Statistical approaches to soil carbon dynamics, EGU General Assembly 2026, Vienna, Austria, 3–8 May 2026, EGU26-16455, https://doi.org/10.5194/egusphere-egu26-16455, 2026.

EGU26-17497 | Posters on site | BG1.11

Soil profile structure and transport control equilibrium in microbial soil carbon models 

Lin Yu, Junzhi Liu, Hui Wu, Cheng Gong, Minjung Kwon, Xavier Rodriguez, Sönke Zaehle, and Christian Beer

Equilibrated soil organic carbon (SOC) states are a prerequisite for Earth system model simulations following CMIP and TRENDY protocols, which rely on long preindustrial spin-up phases prior to historical and future integrations. While conventional linear soil carbon models readily achieve equilibrium, microbial-explicit soil carbon models frequently exhibit slow convergence or persistent SOC drift even after millennial-scale spin-up, raising concerns about their applicability in Earth system simulations.

Previous analytical work has derived steady-state solutions for microbial soil carbon models under the assumption of vertically integrated, well-mixed systems, but it remains unclear whether such analytical equilibria are sufficient when models include vertical soil structure and transport processes. Here, we systematically assess the role of soil profile discretization, transport, and model structure in controlling SOC equilibration, and evaluate whether analytically derived steady states can provide reliable initial conditions for depth-resolved microbial soil carbon models.

Using the QUINCY land model framework, we conduct a hierarchy of simulations under standard CMIP-style protocols, consisting of a 1000-year spin-up followed by historical simulations (1850–2019). First, we apply QUINCY-derived litter inputs to the vertically integrated microbial soil carbon model Millennial, which includes explicit microbial dynamics and mineral-associated organic matter formation but no vertical transport. Second, we simulate soil carbon dynamics in QUINCY using a CENTURY-type linear soil model (SSM) with explicit vertical discretization (5 and 15 soil layers to 9.5 m depth), providing a reference case with well-defined analytical equilibria. Third, we perform fully depth-resolved simulations using the Jena Soil Model (JSM) within QUINCY, combining microbial-explicit carbon cycling, sorption dynamics, and vertical transport.

We hypothesize that difficulties in equilibrating microbial soil carbon models arise primarily from structural interactions between nonlinear microbial kinetics, sorption capacity constraints, and vertical transport, rather than from numerical deficiencies or insufficient spin-up duration. We further expect that analytically constrained initial conditions substantially reduce equilibration times and SOC drift in bucket models and linear depth-resolved systems, while providing a useful—but not fully sufficient—approximation for initializing complex microbial soil carbon models with dynamic soil profiles.

By explicitly comparing linear and microbial soil carbon models across vertically integrated and depth-resolved configurations, this study clarifies the conditions under which analytical steady-state solutions are adequate for CMIP- and TRENDY-style simulations, and identifies remaining structural challenges for deploying microbial soil carbon models in Earth system frameworks.

How to cite: Yu, L., Liu, J., Wu, H., Gong, C., Kwon, M., Rodriguez, X., Zaehle, S., and Beer, C.: Soil profile structure and transport control equilibrium in microbial soil carbon models, EGU General Assembly 2026, Vienna, Austria, 3–8 May 2026, EGU26-17497, https://doi.org/10.5194/egusphere-egu26-17497, 2026.

EGU26-19252 | ECS | Orals | BG1.11

Acidity and salinity influence viral ecogenomics and microbial evolution in polyextreme lakes 

Emilie J. Skoog, Benjamin Klempay, Margaret M. Weng, Luke A. Fisher, Taylor Plattner, Britney E. Schmidt, and Jeff S. Bowman and the OAST Team

Viruses are the most abundant biological entities on Earth and exert powerful controls on ecosystem ecology, biogeochemical cycling, and microbial evolution. Hypersaline environments host the highest reported viral abundances of any aquatic system, yet little is known about how salinity and other environmental extremes influence viral ecology. In these systems, salinity alongside acidity strongly influence the isoelectric point (pI) of viral particles – the pH at which a virion carries no net surface charge – which affects viral particle electrostatic interactions and stability. When environmental pH approaches the pI of the viral structural proteome, virions lose surface charge, aggregate, and adsorb to particles, reducing viral infectivity. This, in turn, greatly influences microbial ecology and ecosystem-scale biogeochemical cycling. In this study, we use acidic and alkaline hypersaline lakes in Western Australia as a natural Earth-system laboratory to test how pH and salinity shape viral ecogenomics and microbial evolution. We analyzed metagenomes and viromes from 37 polyextreme lakes spanning pH 2.3-9.4 and 30-465 ppt salinity across wet and dry seasons, recovering 11,804 viral populations from 50 families along with 645 microbial metagenome-assembled genomes. We calculated the pI for viral structural proteomes and placed these data in a global context using viral genomes from environments spanning freshwater, soda lakes, acidic meromictic lakes, and deep-sea hydrothermal vents. Across all environments, viral structural pI distributions were strongly skewed toward more acidic values, with the most acidic capsids occurring in hypersaline and alkaline brines. Even modest shifts in viral structural pIs (~0.8 pH units) correspond to order-of-magnitude changes in proton concentration, suggesting physicochemical selection. Within cosmopolitan viral families, structural pI shifted systematically across pH-salinity regimes, demonstrating that structural traits are not fixed by phylogeny alone but respond to environmental geochemistry. Viruses infecting halophilic archaea exhibited the most acidic and most tightly constrained structural pI values, pointing to host envelope chemistry and host ecology as an additional filter on viral evolution. To understand how viruses may influence microbial adaptation to these environmental extremes, we also functionally characterized viral auxiliary metabolic genes (AMGs) and genes encoded on plasmids. Viral AMGs primarily supported host energy metabolism rather than stress tolerance, whereas plasmids encoded extensive osmotic and acid-stress pathways that were strongly structured across pH-salinity space, identifying plasmids as key agents of microbial adaptation in extreme brines. By linking viral and plasmid omics to geochemical gradients across a natural Earth-system laboratory, this work shows how molecular-scale traits scale up to shape ecosystem function and biogeochemical dynamics across the planet.

How to cite: Skoog, E. J., Klempay, B., Weng, M. M., Fisher, L. A., Plattner, T., Schmidt, B. E., and Bowman, J. S. and the OAST Team: Acidity and salinity influence viral ecogenomics and microbial evolution in polyextreme lakes, EGU General Assembly 2026, Vienna, Austria, 3–8 May 2026, EGU26-19252, https://doi.org/10.5194/egusphere-egu26-19252, 2026.

Understanding and predicting the feedback between climate change and soil carbon dynamics remains a major scientific challenge. A key uncertainty lies in our limited knowledge of how changing hydrothermal conditions influence microbial functional dynamics and their contributions to soil carbon emissions. In particular, the microbial functions that respond to hydrothermal variability—and their interactions with functions involved in soil carbon and nutrient cycling—remain poorly characterized. It is still unclear how both historical and current hydrothermal conditions affect the relative abundances of these microbial functions and how these shifts impact the dynamics of soil carbon emission in response to changing hydroclimate. To fill these knowledge gaps, we combined gene-to-ecosystem data from key ecological networks to develop artificial intelligence models to identify and quantify microbial resource allocation strategies in response to past and present hydrothermal properties. Our findings indicated that microbial communities acclimated to reduced soil moisture by lowering investment in recalcitrant-C decomposition and monomer nutrient mineralization. This drought-mitigation response was amplified by drying legacy but dampened by nutrient limitation. Elevated soil temperature, in contrast, generally increased microbial investment in N acquisition, while thermal legacy strengthened the thermal resistance of N-acquisition allocation and promoted reallocation of C- and P-acquiring functions toward adaptation to current hydrothermal dynamics. Finally, we will show how the identified resource optimization strategies can be applied to interpret observed soil carbon dynamics under climate change and to advance earth system modeling of soil carbon emissions.

How to cite: Song, Y., Fan, C., and Wilson, S.: Past and present hydrothermal regimes shape microbial resource allocation for soil C, N, and P cycling: insights from machine-learning predictions, EGU General Assembly 2026, Vienna, Austria, 3–8 May 2026, EGU26-19305, https://doi.org/10.5194/egusphere-egu26-19305, 2026.

EGU26-20897 | ECS | Posters on site | BG1.11

Spatial hybrid modeling of soil organic carbon processes: testing common assumptions using multivariate, dynamic data with simple models 

Leo Roßdeutscher, Katerina Georgiou, William Riley, Markus Reichstein, Marion Schrumpf, Thomas Wutzler, and Bernhard Ahrens

The land surface accounts for a large share of variability in the global carbon cycle. Although increasing atmospheric CO₂ concentrations have led to higher net primary production and increased land carbon stocks, vegetation carbon stocks appear largely constant, implying that changes in land carbon are primarily driven by soil organic carbon (SOC). As SOC represents the largest active carbon pool, its dynamics are critical for land–atmosphere feedbacks. However, strong spatial heterogeneity and measurement limitations result in sparse and mostly static SOC data, complicating the identification of dominant processes.

Recent studies address this limitation by assimilating soil carbon models to spatial SOC and covariate datasets using neural networks (hybrid modeling). The resulting spatial parameter fields are then interpreted in terms of underlying mechanisms. These approaches typically rely on three key assumptions: steady-state conditions, adequate process representation by the assimilated SOC model, and the sufficiency of bulk SOC data to infer processes. In this study, we explicitly test these assumptions.

We use the Europe-wide LUCAS dataset, which provides spatially resolved physical and chemical soil data at multiple time points. A subset of the dataset includes SOC subfractions, including mineral-associated organic carbon and microbial biomass carbon. Several simple SOC models were assimilated in their steady-state form in the hybrid framework, while accounting for differences in model flexibility. This allowed exclusion of specific modeling assumptions. Comparisons across time steps were used to assess the validity of the steady-state assumption. In addition, first results obtained with a dynamic SOC model are presented.

How to cite: Roßdeutscher, L., Georgiou, K., Riley, W., Reichstein, M., Schrumpf, M., Wutzler, T., and Ahrens, B.: Spatial hybrid modeling of soil organic carbon processes: testing common assumptions using multivariate, dynamic data with simple models, EGU General Assembly 2026, Vienna, Austria, 3–8 May 2026, EGU26-20897, https://doi.org/10.5194/egusphere-egu26-20897, 2026.

EGU26-20949 | ECS | Posters on site | BG1.11

Soil salinity and sodicity in the Camargue (Rhône river delta, France) are strongly controlled by elevation, land use, soil depth 

Stephen Boahen Asabere, Isabel Hielscher, Julie Regis, Marion Lourenco, Olivier Boutron, and Daniela Sauer

Soil salinization threatens agricultural production and wetland functioning in coastal deltas. This threat is expected to intensify with climate change because increasing evapotranspiration, decreasing fresh water supply from rivers, and sea-level rise will expand salt influence into low-lying areas. In such settings, shallow brackish groundwater, evapotranspiration, and land-use–specific hydrology interacts across subtle topographic gradients, with yet unconstrained consequences for both salinity levels and sodicity risk. In this study, we quantified the combined effects of elevation, land use, and soil depth in soils of the Camargue (southern France), a multifunctional delta dominated by paddy rice, dry agriculture (e.g., wheat, clover) and pastureland.

At three elevation classes (low = 0.2–0.6 m a.s.l.; mid = 0.6–1.0 m a.s.l.; high = 1.0–1.4 m a.s.l.), we collected 362 soil cores by manual drilling (using a 1-m auger), which were subdivided into five 20-cm soil-depth increments (0–20, 20–40, 40–60, 60–80, 80–100 cm). We used 1:5 soil:water extracts to measure electrical conductivity (EC) and a targeted ion suite [mg L⁻¹; meq L⁻¹]. We derived dissolved salts (DS = sum of quantified ions), Na-dominance-ratio (Na⁺/√[(Ca²⁺+Mg²⁺)/2]), and a Na⁺–Cl⁻ imbalance metric (ΔNa⁺ = Na⁺ − Cl⁻ [meq L⁻¹]) to distinguish Na⁺–Cl⁻ dominance from Na⁺ enrichment decoupled from Cl⁻.

EC and DS generally increased towards the lower elevations and with soil depth, indicating salt accumulation where drainage is constrained and groundwater influence is strongest. These elevation trends were most pronounced in soils under paddy rice and pastureland (rice median EC = 0.44–0.97 mS cm⁻¹; DS = 306–642 mg L⁻¹; pasture median EC = 0.90–1.97 mS cm⁻¹; DS = 502–942 mg L⁻¹). Soils under dry agriculture showed a different pattern (EC = 0.27–0.49 mS cm⁻¹; DS = 236–314 mg L⁻¹) toward lower elevations. Ion composition was dominated by Na⁺ (20%) > Cl⁻ (18%) > K⁺ (17.7%) > SO₄²⁻ (16%) > NO₃⁻ (10.6%) > Ca²⁺ (4.7%) > Mg²⁺ (0.6%). ΔNa was predominantly positive, especially in soils under paddy rice, coinciding with elevated Na-dominance-ratio (3.4–12.7), indicating widespread Na⁺ excess relative to Cl⁻ and suggesting potential sodicity risk. Negative ΔNa⁺ values occurred mainly in some pasturelands (−0.15 to −8.7 meq L⁻¹), consistent with Cl⁻-dominant inputs (e.g., sea salts, fertilizers).

Projected increases in evapotranspiration and sea-level rise under global warming are likely to reduce arable land availability in the Camargue, suggesting a heightened vulnerability to combined salinity–sodicity pressures. Specifically, to maintain rice cultivation along with all its cultural heritage for the people in the Camargue, a sustained effort for freshwater irrigation and effective drainage needs to be prioritized.

How to cite: Asabere, S. B., Hielscher, I., Regis, J., Lourenco, M., Boutron, O., and Sauer, D.: Soil salinity and sodicity in the Camargue (Rhône river delta, France) are strongly controlled by elevation, land use, soil depth, EGU General Assembly 2026, Vienna, Austria, 3–8 May 2026, EGU26-20949, https://doi.org/10.5194/egusphere-egu26-20949, 2026.

EGU26-21544 | Orals | BG1.11

EcoHydrology, Thermodynamics, and Microbial Ecology at the onset of soil syntrophy 

Amilcare Porporato, Salvatore Calabrese, and Damola Olaitan

Syntrophy is metabolic cross-feeding in which an upstream organism can oxidize a substrate only because a partner continuously removes inhibitory products (often H2), making the overall reaction energetically favorable. In soils, moisture regulates anaerobic microbial interactions by shaping oxygen availability and gas diffusivity, while fermentation produces reduced intermediates, including volatile fatty acids (VFAs) such as butyrate and propionate, whose oxidation is endergonic under standard conditions and becomes feasible only when hydrogen is maintained sufficiently low by hydrogenotrophic methanogens. Here we present a minimalist predator–prey model that captures the key feedbacks among moisture, hydrogen dynamics, and methanogen biomass. Moisture modulate hydrogen production, leakage, and methanogenic growth, shifting the system between a hydrogen-accumulating, methanogen-free regime and a syntrophic coexistence regime in which methanogens depress hydrogen below the threshold required for VFA oxidation to become exergonic. The resulting moisture-driven transition is a transcritical bifurcation governed by a moisture-dependent methanogen reproduction number, providing a compact link between hydrologic variability and the onset and collapse of syntrophy in soils.

How to cite: Porporato, A., Calabrese, S., and Olaitan, D.: EcoHydrology, Thermodynamics, and Microbial Ecology at the onset of soil syntrophy, EGU General Assembly 2026, Vienna, Austria, 3–8 May 2026, EGU26-21544, https://doi.org/10.5194/egusphere-egu26-21544, 2026.

EGU26-597 | ECS | PICO | BG1.13

Evaluating Roadside Vegetation as a Pollution Buffer Along Major Transport Routes: A Case Study from Delhi. 

Roman Bali, Ronak Sharma, and Saurabh Sonwani

High urbanization and industrialization have resulted in a significant increase in air pollution impacting artificial and natural ecosystems. Roadside vegetation often act as a line of defence against air pollution to mitigate the impacts of pollutants. This demands a scientific investigation to assess the role of roadside plantation for better management and planning for urban sprawl where selected trees could be grown to mitigate the impacts of harmful pollutants. Thus, the present study investigates how variations in roadside vegetation density influence pollutant behaviour by comparing two traffic-intensive urban corridors in Delhi: Site 1 – Mundka which is a low-vegetation roadside environment, and Site 2 - Vishwavidyalaya (North Campus) which is characterised by continuous mature tree cover. Long-term ambient datasets (Jan 2024–Nov 2025), short-term real-time monitoring, and i-Tree Eco assessments of sampled roadside trees were integrated to quantify pollutant dynamics and vegetation-mediated mitigation.

Across the 23-month dataset, PM₁₀ concentrations at Site 1- Mundka (mean: 267.7 µg/m³) were consistently higher than at Site 2 - North Campus (186.1 µg/m³), representing ~1.4-fold greater particulate burden despite similar diurnal traffic signatures and strong regional coupling (r = 0.898). Distinct pollutant regimes emerged: Site 2 - North Campus showed elevated combustion pollutants (NO, NOx, CO), whereas Site 1 - Mundka exhibited higher NO₂, O₃, and coarse-particle dominance (PM₂.₅/PM₁₀ = 0.36). Field observations further revealed substantial dust accumulation on Mundka’s tree leaves, likely suppressing stomatal activity and reducing pollutant-removal efficiency.

i-Tree Eco modelling demonstrated a striking multi-fold difference in ecosystem services: trees at Site 2 - North Campus removed up to four times more pollutants than those at Site 1 - Mundka, with peak monthly removal reaching 34 kg compared to 4–5 kg. Higher leaf-area availability, mature DBH classes, and greater species diversity at North Campus also supported substantially greater carbon storage, sequestration, and oxygen production.

Overall, the findings highlight that well-maintained, continuous roadside tree corridors can meaningfully moderate pollution peaks along major transport routes. As several countries increasingly adopt planned roadside greening, the results underscore the potential of structured vegetation strategies to strengthen air-quality resilience at both urban and national scales in India.

How to cite: Bali, R., Sharma, R., and Sonwani, S.: Evaluating Roadside Vegetation as a Pollution Buffer Along Major Transport Routes: A Case Study from Delhi., EGU General Assembly 2026, Vienna, Austria, 3–8 May 2026, EGU26-597, https://doi.org/10.5194/egusphere-egu26-597, 2026.

EGU26-619 | ECS | PICO | BG1.13

Urban Blue-Green Spaces in India: Health, Access, and Hidden Inequities 

Ishita Mathur and Manpreet Kaur

Urban blue-green spaces or UBGS, which include urban water bodies and vegetated areas, play a key role in advancing Sustainable Development Goals 3 (Good health and well-being) and 11 (Sustainable cities and communities). Yet much of the ‘blue health’ literature is grounded in experiences from Europe and other high-income regions, where such spaces are often treated mainly as recreational amenities. This overlooks the socio-ecological realities of rapidly urbanizing countries like India, where UBGS can be closely tied to everyday survival, livelihoods, and exposure to environmental risks. In this paper, equity in UBGS access and its health linkages in Indian cities have been examined, with implications for global urban planning and policy. Following the Arksey and O’Malley scoping review framework, literature published between 2014-2024 was identified in major scholarly databases (Web of Science, Scopus, PubMed), combing search terms on blue-green infrastructure, health equity, environmental justice, and urban India. From the 45 included documents, thematic synthesis focused on spatial patterns of provision, the ways UBGS are used and valued by different social groups, and how policies and planning processes shape access and outcomes. Three interrelated themes emerged from this. First, distributive inequity: better-maintained UBGS cluster in affluent areas, while low-income settlements face degraded, flood-prone sites. Second, functional mismatch: designs prioritized aesthetic and recreational functions like promenades and jogging tracks, over livelihood needs like washing, fishing, grazing, or cultural practices. Third, green gentrification: restoration often raises land values and directly or indirectly displaces residents leading to a shift in the benefits to wealthier groups. These patterns outline Indian UBGS as contested resources rather than neutral health assets. Global North models risk missing survival functions and widening gaps. The Indian case offers lessons for cities growing rapidly and facing climate stress and socio-spatial divides. Planning must integrate anti-displacement measures and multi-use recognition, shifting from proximity to equitable access. Urban planners, policymakers, and public health officials stand to benefit from evidence-based strategies linking UBGS to resilience and justice.

How to cite: Mathur, I. and Kaur, M.: Urban Blue-Green Spaces in India: Health, Access, and Hidden Inequities, EGU General Assembly 2026, Vienna, Austria, 3–8 May 2026, EGU26-619, https://doi.org/10.5194/egusphere-egu26-619, 2026.

EGU26-623 | ECS | PICO | BG1.13

Crop residue biochars – A way towards sustainability as a potent climate change mitigator and fertility enhancer 

Preetiva Brahmacharimayum, Abhishek Kumar Chaubey, Tej Pratap, Jonathan S. Singsit, and Dinesh Mohan

Air pollution is one of the major leading causes of death in India, with 7 out of 10 most polluted cities located in Indo-Gangetic Plain region. With more than 70% residue generated being burnt, crop residue burning is one of the major contributor. Along with pollutants (black carbon, carbon dioxide, carbon monoxide) emissions, residue burning also depletes soil nutrients. Hence, this study aims to provide a sustainable alternative for residue burning, by converting the residues into value added product (biochar). This study demonstrated that biochar not only reduces air pollution by sequestering carbon but can also increase crop productivity in a degraded land (saline). In this study, rice husk and wheat straw crop residues were converted to biochar, in an indigenous reactor. For comparative assessment, both biomass and biochar [rice husk biomass (RHBM), rice husk biochar (RHBC), wheat straw biomass (WSBM), wheat straw biochar (WSBC)] were applied at 1%, 2.5% and 5% (w/w) on two saline soils (Samchana : EC - 4.97 dS/m and Dobh : EC - 5.33 dS/m). It was observed that, in both Samchana and Dobh soil, CO2 emissions were significantly lowered with RHBC (46–53%, 41–56%) and WSBC (66–80%, 61–74%) treatments as compared to RHBM and WSBM and hence increased carbon squestration. Additionally, okra was grown for two seasons (Samchana season 1 - Samc1, Samchana season 2 - Samc2, Dobh season 1 - Dobh1, Dobh season 2 -Dobh2). Salinity reduction was observed, more so using RHBC and WSBC. In all the analyzed soil parameters (pH, EC, soil organic carbon (SOC), soil available phosphorus (SAP), mineral nutrients and nutrients rations), both RHBC and WSBC provide better enhancements as compared to their biomass counterpart as well as unamended soil. These improvements were reflected by plant growth parameter enhancements. Apart from improving various soil and plant growth parameters, biochar amendments also enhance salt leaching via improvements in saturated hydraulic conductivity (Ks). RHBC and WSBC improved Ks by 9–95% and 64–112%, respectively. This was reflected in higher desalination ratios with (DR) with RHBC and WSBC w.r.t their biomass counterpart and control. In Dobh soil, DR values were negative for RHBM and WSBM treatments, indicating that no reclamation occurred, which is correlated with lower soil and plant growth parameters observed. Overall, we concluded (1) biochar significantly reduces emissions of air pollutant (CO2) by capturing and sequestering in soil (2) biochar provides better salinity reduction and improvement in plant growth parameters and salt tolerance. Therefore, biochar can be considered as a sustainable air pollution mitigation strategy along with enhancing crop productivity in a degraded saline soil. This study presents biochar as a potent means to achieve sustainable development goals (SDG) – SDG 2 (by enhancing productivity), SDG 3 and SDG 13 (by reducing CO2 emission).

How to cite: Brahmacharimayum, P., Chaubey, A. K., Pratap, T., Singsit, J. S., and Mohan, D.: Crop residue biochars – A way towards sustainability as a potent climate change mitigator and fertility enhancer, EGU General Assembly 2026, Vienna, Austria, 3–8 May 2026, EGU26-623, https://doi.org/10.5194/egusphere-egu26-623, 2026.

The town of Kishangarh is located between two major tourist destinations (Jaipur and Ajmer/Pushkar) in the desert state of Rajasthan in western India. Apart from being impacted by desert dust and mining activities, the town bears repercussions of marble cutting and processing industries and is aptly known as the marble capital of India. The combined impacts of desert dust and marble dust pose a number of challenges in the urban and peri-urban regions of the semi-arid landscape of Kishangarh district. These include many cases of silicosis in the region and extremely scant greenery in the marble cutting industrial area of Kishangarh. Despite close proximity to Ajmer, Kishangarh exhibits significantly lower rainfall compared to Ajmer. In summer, the temperature in the district can reach upto 49C, exacerbating the heat island effect. Further, the region sees high night-time values of surface ozone (O3) in contrast to many other observations over western India indicating low net photochemical O3 formation during the day. O3 values reach above the threshold of 50 ppbv nearly 43% of the time despite the high dust content favoring dry-deposition of O3. Almost during the entire rabi cropping season, the monthly AOT40 values are above threshold; potentially detrimental to agriculture. Considering the top 10 contributing non-methane hydrocarbons, surprisingly a biogenic fingerprint, Isoprene, is the major contributor to propylene-equivalent concentration in post-monsoon (27%), winter (25%) and pre-monsoon (33%), indicating the major role to be leveraged from biogenics in maintaining atmospheric oxidation and hence air quality to satisfactory levels. Comparison of butane isomeric ratios to butane-propane ratios indicates impact of chlorine chemistry competing with daytime OH chemistry, and points to growing instances of haze impacting traffic, which also needs to be addressed for maintaining better civic infrastructure.

How to cite: Mallik, C., Yadav, S., and Ganguly, V.: Deciphering challenges in the marble dust dominated ecosystem of Kishangarh through atmospheric composition measurements, EGU General Assembly 2026, Vienna, Austria, 3–8 May 2026, EGU26-637, https://doi.org/10.5194/egusphere-egu26-637, 2026.

The Indo-Gangetic Plain (IGP) is one of the most pollution-burdened and meteorologically sensitive regions worldwide, where high population load, intensive agriculture, expanding industries, and stagnant winter conditions combine to create air-quality challenges. The present study analyses the spatio-temporal variations of six key pollutants—PM₂.₅, PM₁₀, NO₂, SO₂, CO, and O₃ collected from Central pollution control board (CPCB) across major urban ecosystem area of IGP region (Agra, Ghaziabad, Meerut, Lucknow, Varanasi, and Kanpur) during 2020–2021. The period is especially informative as it encompasses the emission-suppressed COVID-19 lockdown phases of 2020 and the rapid economic recovery of 2021, providing a unique natural experiment to observe pollutant–meteorology interactions. Annual pollutant patterns show that particulate matter remained the most critical concern throughout both years. Despite large-scale mobility restrictions in 2020, PM₂.₅ and PM₁₀ annual means (55.0 ± 19.6 and 125.8 ± 46.9 µg m⁻³) remained well above national standards, indicating persistent structural sources such as traffic, industrial combustion, dust resuspension, and biomass burning. With economic activity resuming in 2021, these levels rose further (61.3 ± 17.5 and 140.1 ± 46.5 µg m⁻³), highlighting the sensitivity of the region to emission resurgence. In contrast, NO₂, SO₂, CO, and O₃ exhibited relatively modest interannual changes, reflecting more stable emission sectors and meteorological controls. Seasonal patterns showed clear contrasts across both years, with winter emerging as the most polluted period due to strong atmospheric stability, shallow boundary-layer heights, and frequent temperature inversions. Winter 2020 recorded severe particulate peaks (PM₂.₅: 115.1 ± 46.5 µg m⁻³; PM₁₀: 226.4 ± 66.5 µg m⁻³), while winter 2021 displayed similarly elevated levels driven by stagnant meteorology, fossil-fuel combustion, and regional biomass burning. Monsoon months consistently showed the cleanest air, with August 2020 reaching minimum PM₂.₅ (20.1 ± 2.1 µg m⁻³) due to wet scavenging and enhanced mixing. NO₂ and CO exhibited winter maxima, whereas O₃ peaked in pre-monsoon months under strong photochemical activity.Principal Component Analysis identified two dominant pollutant groupings explaining 86.58% of variance. The first (60.63%) represented combustion-related sources linking PM₂.₅, PM₁₀, CO, and NO₂, while the second (25.95%) reflected industrial and secondary processes associated with SO₂ and O₃.Overall, the analysis confirms the entrenched nature of particulate pollution in selected urban ecosystem areas over  IGP region and highlights the importance of coordinated emission-control strategies that are responsive to both source contributions and seasonally driven atmospheric processes.

How to cite: Burdak, R., Khajuria, A., and Somwani, S.: Evaluating the Status of Air Quality, Source Apportionment and Investigating the correlations with meteorological parameters over the Urban Ecosystem area of Indo-Gangetic Plain, EGU General Assembly 2026, Vienna, Austria, 3–8 May 2026, EGU26-710, https://doi.org/10.5194/egusphere-egu26-710, 2026.

EGU26-736 | PICO | BG1.13

Status of Air Quality and Associated Health Risks in Dhaka Metropolitan City, Bangladesh: A Cold Wave Period Analysis 

Ahmad Kamruzzaman Majumder, Mahmuda Islam, Marziat Rahman, Mohsina Hossain, Mohsina Hossain, and Md Nasir Ahmmed Patoary

One of the most serious environmental problems in Dhaka Metropolitan City is air pollution due to uncontrolled vehicle, construction work, emission from surrounding industries and brick kilns and disappearing green space and water bodies. This study was performed to observe the levels of PM2.5 and PM10 in various areas of Dhaka Metropolitan City. hand-held Air quality monitor (Model: Aeroqual S500) used to collect data from 77 major road junctions during cold-wave of winter 2025.

The results show that the average levels of PM2.5 and PM10 concentration over the 77 sites were 211.16 µg/m³ and 277.82 µg/m³, respectively much higher than the Bangladesh National Ambient Air Quality Standards (65 µg/m³ for PM2.5 and 150 µg/m³ for PM₁₀) increased by 3.25 and 1.81 times respectively. By zones, particulate concentration was highest in Zone-6 (Gulshan), followed by Zone-3 (Uttara), Zone-5 (Mirpur), Zone-7 (Tejgaon), Zone-2 (Motijheel), zone 1(Ramna) and next higher in category of particulate concentration was found in zone 4 (Lalbagh). The PM2.5/PM10 ratio suggested a predominance of combustion sources in total particulate mass (75.97 %). The dispersion analysis and box-whisker plots exhibit that the higher deviation was observed in Zone-2, whereas statistical tests to assess the difference among zones revealed no significant differences between the four zones for PM₁₀ (p > 0.05), with exception of PM2.5. Cluster analysis also revealed the presence of four main clusters that converged at 25.

This elevated particulate level is a serious health hazard. PM2.5 which can travel deep into the lungs and bloodstream is associated with respiratory infections, asthma, COPD, heart disease and premature death. PM₁₀ leads to decreased lung function, respiratory discomfort, and cardiovascular burden. The study suggests that Improved vehicle regulation, better construction management, cleaner industrial strategies along with more public transportation and public knowledge are require to minimize the health detriment in DHK as well as air quality enhancement.

Keyword: Air Pollution, Particulate Matter (PM2.5 and PM10), Dhaka City, Spatial Variation, Health Impacts

How to cite: Majumder, A. K., Islam, M., Rahman, M., Hossain, M., Hossain, M., and Patoary, M. N. A.: Status of Air Quality and Associated Health Risks in Dhaka Metropolitan City, Bangladesh: A Cold Wave Period Analysis, EGU General Assembly 2026, Vienna, Austria, 3–8 May 2026, EGU26-736, https://doi.org/10.5194/egusphere-egu26-736, 2026.

Exploring nexus between particulate pollution and urban land using land use regression (LUR) and machine learning models: a case of study of Delhi, India.

Kamna Sachdeva1 and Divansh Sharma2

1Professor Department of sustainability sciences, Delhi Skill and Entrepreneurship University (email: kamna.sachdeva@dseu.ac.in)

2 Research Fellow, Division of air Quality The energy and Resource Institute (TERI) (email: divyansh.sharma@teri.res.in)

Investigating the environmental repercussions of urban growth dynamics is essential for sustainable urban development. Urbanization affects air pollutants through urban expansion and emission growth, inevitably shifting the health risks associated with air pollution. The interaction between temporal variations of pollutants and spatial heterogeneity further complicates the dynamics of urban air pollution. To cater such heterogeneity regression models are integral they provide detailed insights into the relationships between air pollutants and various influencing factors. These models correlate air pollutants with independent variables, including anthropogenic emissions, meteorological parameters, and the concentrations of other air pollutants. The air quality of Delhi where transboundary emissions, local emissions, land use changes/patters and different seasonal patterns interplays, can only be explained by land use regression models. Land use regression (LUR) modeling, which offers refined insights into the spatial distribution of pollutants by incorporating land use characteristics. The integration of machine learning into land use regression (LUR) modeling further enhance its capability to predict air pollution levels with greater accuracy and spatial resolution. The study was planned to investigate the application of Land Use Regression (LUR) models to explore the relationship between particulate pollution and urban land use in Delhi, incorporating geographic, meteorological, and machine-learning approaches. The study highlights the effectiveness of traditional LUR models, Random Forest (RF), and Deep Neural Networks (DNN) in capturing spatial and temporal variability of PM2.5 and PM10 concentrations. Traditional LUR models were developed for both annual and seasonal predictions, with key variables selected based on their statistical significance and impact direction on pollutant levels. For instance, the annual model for PM2.5 included variables like green cover, building area, and wind speed, while the seasonal models adjusted variables to reflect specific environmental conditions of each period. This methodical selection and modeling process formed the basis for further analysis using advanced techniques. Advanced machine learning models, including RF and DNN, were applied to enhance the traditional LUR models. These models demonstrated improved predictive accuracy and robustness, effectively handling nonlinear interactions and complex data patterns. The study revealed some unexpected trends, particularly in terms of the temporal persistence of pollutants and understanding intensity of pollution hotspots across Delhi.

How to cite: Sachdeva, K. and Sharma, D.: Exploring nexus between particulate pollution and urban land using land use regression (LUR) and machine learning models: a case of study of Delhi, India, EGU General Assembly 2026, Vienna, Austria, 3–8 May 2026, EGU26-749, https://doi.org/10.5194/egusphere-egu26-749, 2026.

Urban areas are characterized by high population densities, complex transport networks, and concentrated commercial and industrial activity, all of which can intensify existing environmental and public health challenges. With their dense populations and infrastructure, cities are particularly vulnerable to the impacts of climate change and other environmental stresses. The Delhi-National Capital Region (NCR) consistently records poor Air Quality after October every year. It is the worst among Indian metropolitan areas, posing severe health risks and highlighting the need for systemic policy reform. Air pollution imposes a significant socio-economic burden on Delhi’s healthcare system and residents.  The present study examines the direct and indirect economic costs of air pollution-related major diseases. It also investigates public views towards air pollution mitigation strategies, policies, including interventions, identifying supporters of such measures among Delhi’s residents. 
An online survey of residents across different sections of Delhi NCR was conducted to assess health status, protective behaviors, attitudes toward air pollution recommendations, knowledge of air quality information, and perceptions of mitigation strategies. Respondents were asked whether their views were favorable or unfavorable toward specific policies and interventions.

It is indicated that deteriorating pulmonary health due to increased exposure to urban pollutants results in higher healthcare costs through higher hospitalization rates, longer-term treatments, and increased medication expenditures. Survey responses reveal varying levels of public support for mitigation strategies, with predictors including health status, awareness of air quality information, and adoption of protective behaviors. Public favorability toward interventions such as electric vehicle (EV) adoption, public transport expansion, and stricter pollution control policies underscores the importance of integrating health, economic, and behavioral dimensions into systemic policy reform. It is important to note that urban sustainability entails the reduction and effective management of pollution emissions in cities to safeguard environmental quality and protect public health.

How to cite: Maurya, V.: Air Pollution, Perceived Health Risks, and Public Policies : A Study Of Delhi NCR Region from 2015-2025, EGU General Assembly 2026, Vienna, Austria, 3–8 May 2026, EGU26-776, https://doi.org/10.5194/egusphere-egu26-776, 2026.

Cities in the Global South face increasing environmental challenges due to severe air pollution, rapid land-use change, and rising urban heat stress. In this context, restored urban ecosystems have become essential nature-based solutions to protect human health, improve regulating services, and act for climate change mitigation. The present study considers Sunder Nursery, the UNESCO-linked World heritage site near the densely populated Nizamuddin area in New Delhi, India. It serves as a model urban greenspace offering sustainability benefits that align with SDGs 3, 11, 13, and 15.

A detailed ecological survey of 661 trees representing 105 species is the foundation for the i-Tree Eco assessment. The site features a diverse, mostly native tree community, including Azadirachta indica, Holoptelea integrifolia, Ficus religiosa, Ficus virens, Albizia lebbeck, Anogeissus pendula, and Diospyros montana. This layered canopy, which includes saplings and trees taller than 29 meters, provides strong regulating services. Preliminary i-Tree Eco findings of study site indicate an annual removal of approximately 50 ± 8 kg PM₂.₅, 770 ± 120 kg PM₁₀, 120 ± 20 kg NO₂, 170 ± 25 kg O₃, 55 ± 8 kg SO₂ and about 60 ± 3 tonnes of oxygen per year. This indicates a clear improvement in air quality through pollutant filtration and support for respiratory health in Delhi's polluted environment. The trees also store about approximately 335 ± 25 tonnes of carbon and sequester approximately 22 ± 2 tonnes per year. This offers substantial carbon-service benefits that help with long-term climate change mitigation by stabilizing carbon stocks and reducing urban CO₂ emissions. These results highlight how restored native urban forests strengthen climate resilience and air quality regulation, which are crucial parts of the study’s objectives.

To evaluate human-centered co-benefits, a Scenic Beauty Estimation was done using 17 representative landscape units from water bodies, heritage lawns, native woodland patches, and mixed plantings. 92 respondents rated these landscape units on a 5-point scale were additionally asked about the sense of mental restoration and well-being they experience in natural heritage settings like Sunder Nursery. Scenic Beauty score show a strong preference for native-dominated, structurally diverse, and water-associated landscapes (mean = 4.32). In contrast, homogenized or exotic-dominated areas scored lower (mean = 3.41). The overlap of high scenic beauty, native biodiversity, strong regulating services, and along with reported feelings of calmness, relief, and psychological comfort suggests that restored ecosystems also serve as cultural landscapes, supporting mental well-being, appreciation of heritage, and aesthetic value.

Thus by integrating ecological modeling with perceptual responses, this study demonstrates that the restored urban ecosystems such as Sunder Nursery can enhance air quality, climate resilience, cultural value, and human well-being at the same time. These findings highlight the urgent need to scale up native tree restoration and heritage-linked ecological planning as practical strategies to tackle persistent urban challenges like pollution, heat stress, and the loss of accessible, healthy green spaces.

How to cite: Sonwani, S., Sharma, R., Burdak, R., and Yadav, A.: Urban Ecosystem Restoration for Climate Resilience, and Co-benefits: an Integrated Assessment of the UNESCO World Heritage Site, New Delhi, India, EGU General Assembly 2026, Vienna, Austria, 3–8 May 2026, EGU26-846, https://doi.org/10.5194/egusphere-egu26-846, 2026.

EGU26-919 | PICO | BG1.13

Assessing Air Quality Trends in Malaysian Conurbations: NO₂ and SO₂ Variability AcrossLand Use and Urban Activities 

Nor Diana Abdul Halim, Nurzawani Md Sofwan, Mohd Talib Latif, and Murnira Othman

Nitrogen dioxide (NO₂) and sulphur dioxide (SO₂) are key urban air pollutants affecting air quality
and public health. While emission reduction policies aim to improve air quality, their spatial
patterns and long-term trends in conurbation areas remain uncertain. This study examines NO₂ and
SO₂ trends in major Malaysian conurbations from 2019 to 2023, focusing on land use and urban
activities. While conurbations are primarily urban, they exhibit diverse land use patterns, from
high-traffic commercial zones to industrial hubs, influencing air pollution differently. Continuous
air quality monitoring data from Klang Valley, Johor Bahru, George Town, Kota Kinabalu, and
Kuching were analysed using statistical and geostatistical techniques to assess temporal and spatial
trends. Findings reveal that NO₂ concentrations are highest in traffic dense urban centres, whereas
SO₂ levels are more prominent in industrial and port areas. Seasonal variations, including monsoon
effects and transboundary haze, also influence pollution levels. The study highlights the
heterogeneous nature of air quality trends across conurbations, emphasising the need for localised
air pollution control strategies. By integrating land use planning with targeted mitigation measures,
policymakers can better manage urban air quality while addressing region-specific pollution
sources.

How to cite: Abdul Halim, N. D., Md Sofwan, N., Latif, M. T., and Othman, M.: Assessing Air Quality Trends in Malaysian Conurbations: NO₂ and SO₂ Variability AcrossLand Use and Urban Activities, EGU General Assembly 2026, Vienna, Austria, 3–8 May 2026, EGU26-919, https://doi.org/10.5194/egusphere-egu26-919, 2026.

EGU26-935 | PICO | BG1.13

Impact of anthropogenic and biogenic sources on ambient air isoprene during winter and summer seasons at an urban site in western India  

Lokesh Sahu, Mansi Gupta, Nidhi Tripathi, Dibyani Singh, and Sunilkumar Tharayil

Volatile organic compounds (VOCs) are emitted from various natural (biogenic) and anthropogenic sources. VOCs are important components of photochemical processes with strong significance to atmospheric chemistry and climate change through the formation of ozone and organic aerosols. Time-resolved continuous measurements of ambient isoprene mixing ratios at an urban location in western India were conducted from January to May 2020. The measurement period represents the gradual changes in meteorological parameters from winter to summer, as well as the reductions in anthropogenic emissions from the pre-lockdown phase of COVID-19 to the lockdown period. The day-to-day variations between 0.78-3.25 ppb during January-March and 1.07-2.25 ppb during April-May were associated mainly with the variabilities in night and day data, respectively. Diurnal patterns with higher evening-early morning and daytime concentrations in winter and summer months resemble the features of predominant anthropogenic and biogenic emissions, respectively. The analysis of the ratios of isoprene to aromatic compounds revealed the influence of biogenic sources on diurnal and seasonal variations. The afternoon isoprene/aromatic ratios increased exponentially at higher temperatures (25-42 oC), leading to increasing trends of biogenic contribution during the winter-to-summer transition period. Despite predominant biogenic contributions, reductions in anthropogenic emissions due to the COVID-19 lockdowns could also be a factor for very enhancements of isoprene/xylenes (23.0-30.5 ppb ppb-1), isoprene/ethylbenzene (28.7-37.2 ppb ppb-1), and isoprene/benzene (5.1-9.6 ppb ppb-1) ratios than in winter. The present study shows that there are no significant differences in isoprene mixing ratios between winter and summer seasons. However, tracer-based analysis shows a significant seasonality in the relative apportionment between anthropogenic and biogenic contributions. In addition to relative changes in anthropogenic and biogenic contributions, the trend of the isoprene mixing ratio also reflects the impact of meteorological factors influencing photo-oxidation and dilution.

How to cite: Sahu, L., Gupta, M., Tripathi, N., Singh, D., and Tharayil, S.: Impact of anthropogenic and biogenic sources on ambient air isoprene during winter and summer seasons at an urban site in western India , EGU General Assembly 2026, Vienna, Austria, 3–8 May 2026, EGU26-935, https://doi.org/10.5194/egusphere-egu26-935, 2026.

EGU26-950 | ECS | PICO | BG1.13

Abundances, Characteristics, and Health Risk Assessment of Airborne Microplastics in the Urban Area: A Case Study of Kuala Lumpur, Malaysia 

Norfazrin Mohd Hanif, Jenny Lau, Natasha Arina Mohd Izham, Abdul Hakim Ramli, Yosuke Onozuka, Hiroshi Okochi, Yusuke Fujii, and Mohd Talib Latif

Atmospheric microplastics (MPs) have been attracting attention mainly due to its potential adverse effect on human health resulting from inhalation. This study aims to determine the concentration of MPs in total suspended particles (TSP) and fine particulate matter (PM2.5) in the ambient air of urban environment of Kuala Lumpur. The concentration and characteristics of MPs collected during different monsoon seasons (Northeast, Intermonsoon, and Southwest) were also determined. A high-volume air sampler was used to collect samples from December 2022 to July 2023. MPs were analyzed for size, shape, and color using a stereo microscope, and their polymer composition was determined using pyrolysis-GC/MS. Health risk assessments were conducted based on established formulas from the World Health Organization (WHO) and the United States Environmental Protection Agency (US EPA). Results showed significantly higher MP concentrations (p<0.05) in TSP compared to PM2.5 across all seasons, with the highest concentrations (TSP = 13.14 ± 7.57 particles/m3, PM2.5 = 0.54 ± 0.37 particles/m3) during the Northeast Monsoon. The size of MPs in TSP and PM2.5 was mostly concentrated in the 0.1 – 0.5 mm group. Most of the MPs in the urban environment are fibre-shaped (PM2.5: 58.40 ± 10.45%; TSP: 56.07 ± 5.72%) and transparent particles were the most abundant colour found in this area (PM2.5: 67.27%; TSP: 60.87%). Polymer analysis revealed polyvinyl chloride (PVC) as the most prevalent polymer. HYSPLIT trajectory analysis indicated long-range transport during the Northeast and Intermonsoon periods, while the Southwest Monsoon showed more localized sources. Health risk assessment showed a decreasing exposure to airborne MPs in the following order: adults and adolescents > children > toddlers > infants. This study highlights the seasonal variation of atmospheric MPs in an urban environment and the importance of considering both particle size fractions and meteorological conditions for a comprehensive understanding of MP pollution. The co-occurrence of MPs with PM2.5 raises significant concerns about potential human health risks. Further research and continuous monitoring are needed to fully understand the long-term implications of inhaling MPs, particularly in densely populated regions.

How to cite: Mohd Hanif, N., Lau, J., Mohd Izham, N. A., Ramli, A. H., Onozuka, Y., Okochi, H., Fujii, Y., and Latif, M. T.: Abundances, Characteristics, and Health Risk Assessment of Airborne Microplastics in the Urban Area: A Case Study of Kuala Lumpur, Malaysia, EGU General Assembly 2026, Vienna, Austria, 3–8 May 2026, EGU26-950, https://doi.org/10.5194/egusphere-egu26-950, 2026.

Rising tropospheric ozone (O₃) levels—driven largely by intensified industrialization and human activities since the Industrial Revolution—have become a pressing global concern. As a potent phytotoxic pollutant, ozone disrupts photosynthesis, triggers oxidative stress, and contributes significantly to yield declines in essential food crops like wheat and rice. Alarmingly, many major agricultural belts now coincide with ozone pollution hotspots, heightening threats to global food security.

Motivated by the United Nations Sustainable Development Goals to eradicate hunger and advance sustainable agriculture by 2030, this work explores science-based and eco-friendly interventions capable of enhancing crop resilience under escalating ozone stress. The study evaluates a suite of mitigation strategies, including soil amendments, biochar enrichment, seed inoculation with plant growth-promoting rhizobacteria (PGPR), and antioxidant-rich plant extracts. The chemical protectant ethylenediurea (EDU), known for its strong protective effects against ozone injury, is also examined. Furthermore, adaptive agronomic modifications such as adjusting sowing time, improving irrigation practices, enforcing stricter emission controls on ozone precursors, and developing ozone-tolerant cultivars are critically reviewed.

By bridging the divide between controlled experimental insights and practical field-level applicability, this study highlights the need for integrated, sustainable, and scalable approaches. The findings underscore the potential of combining biological, agronomic, and policy-driven solutions to safeguard crop productivity and strengthen agricultural resilience in an era of increasing atmospheric stress.

How to cite: Ghosh, A.: Safeguarding Agriculture in a High-Ozone World: Sustainable Strategies for Crop Protection, EGU General Assembly 2026, Vienna, Austria, 3–8 May 2026, EGU26-1122, https://doi.org/10.5194/egusphere-egu26-1122, 2026.

EGU26-1147 | PICO | BG1.13

Urban Ecosystem Study for the City of Bangkok during ASIA-AQ over Thailand; Insight towards the Solution for Air Pollution and Climate Change 

Vanisa Surapipith, Kasemsan Manomaiphiboon, Narisara Thongboonchoo, Viphada Boonlerd, James H. Crawford, and Myatthu Kyaw

The intensive Airborne and Satellite Investigation of Asian Air Quality (ASIA-AQ) mission has been the NASA led international cooperative field study designed to address local air quality challenges in Asia. Specifically, ASIA-AQ flight observations over Bangkok and its vicinity (BKV) during March 2024 suggest the presence of daytime pollution and heat islands for which aerosol and certain gaseous constituents intensify over the urban core and so does temperature. Asymmetry of their spatial patterns is potentially linked to diverse land cover (also human activities) and more importantly the land-sea interface where internal boundary layers (both thermal and mechanical) develop. The DC-8 flight monitored aerosol (backscatter), O3, NO2, and CO concentrations, that were used to identify the extent of daytime pollutant island. Spatial distribution of pollutants and temperature in BKV and human exposure are illustrated by integrating with population distribution and urban structure. The findings indicate public health situation and projection of inhabitants. This study allows insight towards solutions for Air Pollution and Climate Change Impacts for redesigning and resilience planning for Urban Ecosystem in Thailand. Communications to policy makers are also demonstrated so that achieving the SDG meets the Net-Zero commitment of Bangkok Metropolitan Administration, while public attention is high in many forums across the capital city.

How to cite: Surapipith, V., Manomaiphiboon, K., Thongboonchoo, N., Boonlerd, V., Crawford, J. H., and Kyaw, M.: Urban Ecosystem Study for the City of Bangkok during ASIA-AQ over Thailand; Insight towards the Solution for Air Pollution and Climate Change, EGU General Assembly 2026, Vienna, Austria, 3–8 May 2026, EGU26-1147, https://doi.org/10.5194/egusphere-egu26-1147, 2026.

Contemporary urban landscapes feature a variety of urban ecosystems, synonymous with urban greenspaces. Maintaining a high-quality greenspace system is essential for promoting the sustainable development of cities. Urban greenspaces provide a full spectrum of ecosystem services, ensuring the well-being of city-dwellers. However, urban greenspaces in many European cities have a highly fragmented, mosaic structure, and the aspect of their spatial configuration tends to be overlooked in the scientific research.

The research aimed to evaluate the spatial integrity of urban greenspaces, defined as the configuration of the greenspaces’ spatial structure that ensures their interconnection.

To achieve the research goal, spatial analyses were conducted using GIS software. To extract the urban greenspaces, the Urban Atlas served as the data source. The Silesian Metropolis was chosen as the research area due to its diversity of urban greenspaces and its large spatial extent at the landscape scale. The evaluation of spatial integrity was based on well-established assumptions in the field of landscape ecology research. The urban greenspaces were evaluated through scoring, in terms of five variables: greenspace patch area, core area of the patch, neighborhood between nearest patches, proximity index, and suitability of land cover for ecological functions. Supplementally, Moran’s I spatial autocorrelation statistics was calculated, to better interpret the overall configuration pattern.

The results indicate significant variability in the spatial integrity of urban greenspaces, particularly when comparing different types of greenspaces. It was found that despite a high fragmentation of urban greenspaces, a relatively large part is strongly integrated with the others. On the other hand, the greenspace patches near urban centers have a low level of spatial integrity.

The study enabled the classification of urban greenspaces in terms of their spatial integrity on a five-level scale. The author aims to highlight the applicability of results in managing urban ecosystems. The elaborated method can also be utilized in other research areas, enabling comparative studies.

How to cite: Pyryt, P.: Evaluation of spatial integrity of urban greenspaces on a case of the Silesian Metropolis (southern Poland), EGU General Assembly 2026, Vienna, Austria, 3–8 May 2026, EGU26-2517, https://doi.org/10.5194/egusphere-egu26-2517, 2026.

Rapid urbanization creates a conflict between economic prosperity and human health, a tension largely stemming from deteriorating urban air quality. For fast-growing megacities, achieving a sustainable balance—where urban ecosystems support both development and well-being—is a major challenge. This study quantitatively explores pathways to sustainability in Guangdong Province, China, by analyzing the spatiotemporal coupling between urbanization intensity and PM₂.₅ pollution from 2000 to 2021.

We developed a comprehensive urbanization index using 19 socioeconomic indicators, validated against long-term Nighttime Light (NTL) remote sensing data. To assess progress toward sustainability, we applied the Coupling Coordination Degree (CCD) model and tested the Environmental Kuznets Curve (EKC) hypothesis across three dimensions: land expansion, population growth, and economic development.

Our analysis identifies a pivotal turning point in 2010. Before this threshold, rapid urban expansion significantly degraded air quality, with urbanization and pollution increasing synchronously. After 2010, however, the region underwent a distinct transition—shifting from "Discordance" to "Transitional" and finally to "Advanced Coordination." For public health, these changes are substantial: PM₂.₅ concentrations fell by 49.3% from their peak, and annual haze days in core cities like Guangzhou dropped by over 89% (from 36.8 to 4 days). This trend effectively decouples pollution from economic growth. Spatially, our findings highlight a clear divide: coastal urban agglomerations (e.g., Pearl River Delta) have achieved high coordination through industrial upgrading and strict regulations, while inland areas still grapple with aligning development with environmental quality.

These results provide empirical evidence that targeted policy interventions—including China’s Air Pollution Prevention and Control Action Plan—can reverse the adverse health impacts of urbanization. We demonstrate that the Coupling Coordination Degree is a vital tool for policymakers to monitor the shift from conflict to synergy, ensuring that future urban ecosystems prioritize human well-being alongside economic growth.

How to cite: shen, J.: Evaluation of the Coupling Coordination Degree Between PM2.5 and Urbanization Level: A Case in Guangdong Province(2000–2021), EGU General Assembly 2026, Vienna, Austria, 3–8 May 2026, EGU26-4741, https://doi.org/10.5194/egusphere-egu26-4741, 2026.

To achieve the “30×30” conservation target, Other Effective Area Conservation Measures (OECMs) serve as an innovative conservation approach that can provide a critical supplement to existing protected areas. However, related research and practice remained in their infancy, with particularly limited exploration in urban ecosystems. To address the challenge of ongoing biodiversity loss amid rapid urbanization, this study took the biodiversity-rich Yunnan Province in China as an example. Utilizing the International Union for Conservation of Nature (IUCN) criteria for identifying OECMs, we constructed a systematic identification framework for potential OECMs in urban areas. This framework assessed conservation value across three dimensions: habitat importance, ecosystem services, and functional connectivity. We employed the Zonation model for spatial conservation prioritization and identified potential OECMs within the top 30% conservation priority areas by selecting urban units with clear spatial boundaries and management entities. The result showed that 104 potential urban OECMs were identified in Yunnan, predominantly distributed in Kunming, Dali, and Qujing. These sites were primarily small-to-medium-sized patches averaging approximately 0.29 km². Urban parks and campuses constituted the main types. High-connectivity patches are predominantly larger campuses, while patches with high habitat importance and ecosystem services were mainly small-to-medium-sized parks. Based on the categorical characteristics of these potential OECMs, the study further recommended tailored management strategies to promote long-term and effective urban biodiversity conservation. By focusing the OECMs identification framework on urban areas, this study provided an operational approach for implementing conservation goals within highly artificial landscapes and presented a new practical pathway toward achieving the “30×30” target.

How to cite: Zhong, D., Jiang, H., Hu, T., Tang, H., Xu, D., and Peng, J.: How can urban areas contribute to achieving the 30×30 target? Application potential of other effective area-based conservation measures (OECMs) , EGU General Assembly 2026, Vienna, Austria, 3–8 May 2026, EGU26-5337, https://doi.org/10.5194/egusphere-egu26-5337, 2026.

EGU26-7334 | PICO | BG1.13

Integrated Assessment of Urban Greening, Air Quality, and Health in the Paris Region: Insights from the PEPR VDBI Paris-RÉUSS-I projects inteGREEN and URBHEALTH  

Misha Faber, Simone Kotthaus, Karine Sartelet, Martial Haeffelin, Gaëlle Uzu, and Gilles Foret

Altogether, urbanization, climate change, and air pollution challenge human health, equity, and ecosystem integrity in cities. As a consequence, the French Programme and Priority Research Equipment for Sustainable Cities and Innovative Buildings (PEPR VDBI) supports interdisciplinary research to generate scientific evidence that bolsters resilient urban planning and public health strategies. Within this programme, the Paris RÉUSS-I initiative merges two complementary research initiatives : inteGREEN and URBHEALTH, to investigate how vegetation-based solutions and pollutant exposures shape environmental and health outcomes in the Paris region. 

Urban greening strategies entail a rigorous spatial and functional framework to optimize ecosystem services. inteGREEN investigates the placement, morphology, and typology of urban green infrastructures to enhance their multi-dimensional benefits. At the heart of our approach is the optimization of the soil-water-plant continuum, ensuring vegetation resilience and sustained ecological performance. Moreover, the research addresses the social dimension by evaluating accessibility and equitable use across diverse urban populations.  By combining field experiments, environmental monitoring, social surveys, and numerical modeling, this component develops decision-relevant indicators and tools for urban greening strategies that maximize positive outcomes while limiting downsides such as water demand, maintenance constraints, and biogenic emissions from vegetation.

On the other hand, URBHEALTH investigates the health impacts of spatial heterogeneities in urban air pollution by focusing on regulated and emerging pollutants, such as ultrafine particles or black carbon, using the oxidative potential, a key indicator of their intrinsic toxicity. Harnessing high-resolution atmospheric modeling, multi-environment exposure estimation, epidemiological data, and socio-economic analysis, URBHEALTH identifies vulnerable populations and urban hotspots of elevated risk. Our scenario analyses will integrate cost–benefit frameworks to assess public-health-oriented mitigation pathways taking into account environmental justice. 

Paris REUSS-I not only advances fundamental research of urban ecosystems and health interactions but also aims at providing actionable insights for policymakers and planners seeking to implement sustainable transformations in cities. At the core of the projects resides interactions with a great variety of stakeholders. Aligning with the session’s interdisciplinary fields of study, our work exposes the ongoing thematic research as well as the process of co-construction and knowledge exchange, thus highlighting the good practices and challenges that we identified so far. 

How to cite: Faber, M., Kotthaus, S., Sartelet, K., Haeffelin, M., Uzu, G., and Foret, G.: Integrated Assessment of Urban Greening, Air Quality, and Health in the Paris Region: Insights from the PEPR VDBI Paris-RÉUSS-I projects inteGREEN and URBHEALTH , EGU General Assembly 2026, Vienna, Austria, 3–8 May 2026, EGU26-7334, https://doi.org/10.5194/egusphere-egu26-7334, 2026.

EGU26-10904 | PICO | BG1.13

Investigating the Influence of 3D Urban Morphology on Land Surface Temperature in Central Asian Cities 

Kirsten de Beurs, Daniel Hicks, and Dana Bazarkulova

Cities in Central Asia remain underrepresented in global urban and climate studies, despite significant climate impacts in the region. At the same time, rapid urban expansion in Central Asia is changing both the horizontal and vertical dimensions of the cities, creating complex thermal environments. Urban morphology, including both two-dimensional (2D) and three-dimensional (3D) structural characteristics, plays a crucial role in shaping surface urban heat island (sUHI) intensity. While most previous research has mainly focused on 2D indicators such as building density and land use, the influence of 3D urban features on land surface temperature (LST) remains underexplored.

To provide a regional-scale perspective, we first analyze urban growth and LST changes using Landsat and MODIS satellite time series in nine Central Asian cities. Next, we examine how urban morphology impacts LST across our cities, linking the findings to the observed urban growth trends.

We find significant urban growth, particularly in Kazakhstan and Uzbekistan. The LST trend analysis reveals rising temperatures in urban areas, exacerbating heat stress, particularly in rapidly expanding cities. However, the temperature changes are uneven with some cities showing significant warming, while others show daytime cooling particularly in newly developed dense urban areas. By integrating 3D urban morphology indicators with contemporary LST data and information on urban vegetation, we demonstrate that significant urban temperature deviations are driven not only by 2D factors but also by vertical urban structures. Our findings highlight the need to incorporate 3D urban metrics into climate adaptation and urban planning strategies to better manage urban heat and promote resilient cities in Central Asia.

How to cite: de Beurs, K., Hicks, D., and Bazarkulova, D.: Investigating the Influence of 3D Urban Morphology on Land Surface Temperature in Central Asian Cities, EGU General Assembly 2026, Vienna, Austria, 3–8 May 2026, EGU26-10904, https://doi.org/10.5194/egusphere-egu26-10904, 2026.

EGU26-17512 | ECS | PICO | BG1.13

Urban green infrastructure and depression dynamics: a causal loop analysis 

Doris Zjalic, Erik van Raaij, and Chiara Cadeddu

Major depressive disorder affects an estimated 280 million people worldwide and ranks among the leading contributors to years lived with disability. Single-cause explanations are insufficient to account for the complexity of depression, which is shaped by dynamic interactions between biological, psychological, social and environmental determinants. Urban environments, where over half of the global population currently lives and projections suggest this will reach nearly 68% by 2050, concentrates multiple interacting stressors including air pollution, noise, heat island effect, social fragmentation, and diminished access to restorative environments that trigger and reinforce pathways associated with depression onset and persistence.

This study aims to design a causal loop diagram (CLD) that integrates depression-generative mechanisms with the ways urban green infrastructure can counteract these processes, serving both as analytical framework and boundary object for transdisciplinary dialogue at the interface of urban ecosystems and mental health.

The methodological approach builds upon foundational CLDs from Wittenborn et al. and Herrera et al. that model depression as interacting feedbacks across cognitive and biological processes. We adapted these frameworks to the urban context by identifying mechanisms relevant to city environments and by systematically incorporating urban environmental variables alongside nature-related factors, informed by scientific literature. The resulting CLD will undergo validation through focus groups with stakeholders from health, planning, ecology and policy sectors to ensure relevance and plausibility.

The CLD identifies three dominant reinforcing feedbacks that may drive urban depression dynamics: a stress sensitization cycle in which chronic exposure to noise, air pollution, heat, and artificial light amplifies physiological stress responses, progressively lowering stress tolerance; a behavioural withdrawal loop in which depressive symptoms reduce physical activity and social engagement, deepening isolation and symptom severity; and a sleep disruption loop in which environmental disturbances impair sleep quality, increasing vulnerability to stress and mood dysregulation.

Counteracting these dynamics, the CLD highlights three principle balancing feedbacks associated with urban green infrastructure. An environmental mitigation loop links vegetation and tree canopy to reduced air pollution, noise, and ambient temperatures, weakening stress-generative processes. A restoration loop captures how accessible, high-quality green spaces promote psychophysiological restoration, physical activity, and informal social interaction, countering behavioural withdrawal. A sleep-supporting loop reflects the capacity of vegetated environments to moderate nighttime temperatures and noise, improving sleep quality and reducing stress sensitivity.

Analysis of these feedback loops reveals strategic intervention points, including increasing green infrastructure coverage and quality, reducing access barriers, and ensuring equitable distribution so protective loops operate across socioeconomic groups.

This work provides a systems level framework for understanding the dynamic of urban depression and for identifying intervention strategies that directly support Sustainable Development Goals 3, 11, 13 and 15, demonstrating that mental health promotion in cities requires both targeted environmental improvements and structured cross-sector collaboration grounded in systems thinking.

How to cite: Zjalic, D., van Raaij, E., and Cadeddu, C.: Urban green infrastructure and depression dynamics: a causal loop analysis, EGU General Assembly 2026, Vienna, Austria, 3–8 May 2026, EGU26-17512, https://doi.org/10.5194/egusphere-egu26-17512, 2026.

EGU26-19565 | ECS | PICO | BG1.13

Citizens’ perception of smart initiatives and implications on their quality of life in Iasi Municipality, Eastern Europe 

Ioana Bejenaru, Bogdan Ibănescu, Lucian Roșu, and Corneliu Iațu

Smart city concepts and quality of life have become important, with implications for urban development. They are slowly but surely becoming indispensable for urban areas such as Iași, a city in Romania. This study examines whether citizens utilise these initiatives and perceive them as enhancing the quality of their daily lives. Over the past decade, various initiatives have emerged to transform this city into one of Romania's leading smart cities. Our analysis focuses on initiatives to improve public transport accessibility, municipal tax payments, and green transport. We analyse data from a semi-structured survey to examine participants' awareness of existing smart initiatives, their digital lives, and their level of facility use. We also attempted to evaluate people's perception of their quality of life in relation to these initiatives. We employed statistical tests, the Chi-squared (χ²) test, the Kruskal–Wallis test, and the Spearman correlation to ensure good representation, as they provided valuable insights that helped us achieve our main objective. Our analyses have shown that perceptions differ according to age. Active adults tend to be more satisfied, while young and older people tend to be less satisfied. Many people are unaware of the various initiatives and lack trust in the local administration.

How to cite: Bejenaru, I., Ibănescu, B., Roșu, L., and Iațu, C.: Citizens’ perception of smart initiatives and implications on their quality of life in Iasi Municipality, Eastern Europe, EGU General Assembly 2026, Vienna, Austria, 3–8 May 2026, EGU26-19565, https://doi.org/10.5194/egusphere-egu26-19565, 2026.

This study investigated the complex temporal behavior of cosmogenic Beryllium-7 (7Be) by analyzing daily activity concentrations from 21 monitoring stations in the CTBTO network, spanning the years 2010 through 2017. By applying multifractal detrended fluctuation analysis (MF-DFA), it was established that 7Be time series exhibit significant nonlinear scaling behaviors. The results indicate a broad multifractal spectrum (Δα ranging from 0.17 to 0.66), with statistically significant multifractality observed at all locations except RN45 and RN47. Leveraging the extracted spectral width and Hölder exponents, current study utilized the K-means algorithm to categorize the global stations into three distinct clusters based on their dynamic signatures. Furthermore, this study assessed the external forcing of 7Be variations via multifractal cross-correlation analysis against five major indices: the Southern Oscillation Index (SOI), North Atlantic Oscillation (NAO), and solar activity markers (Total, Northern, and Southern hemisphere sunspot numbers). While cross-correlations varied across indices, the NAO emerged as the dominant driver. Notably, station RN16 (Yellowknife, Canada) displayed the highest sensitivity to these external drivers, suggesting a unique coupling between atmospheric/solar indices and isotope concentration at this latitude.

How to cite: Ogunjo, S.: Global Beryllium-7 Dynamics: Nonlinear Scaling Properties, Spatial Classification, and Sensitivity to Atmospheric Teleconnections, EGU General Assembly 2026, Vienna, Austria, 3–8 May 2026, EGU26-963, https://doi.org/10.5194/egusphere-egu26-963, 2026.

Various empirical methods exist to calculate fractal dimension of geospatial objects with the box-counting principle being a popular one. However, these methods generally require geospatial data to be projected to Euclidean space. While this works fine at small geographic scales, computation at larger or global scales introduces distortions inevitable with projection due to the curvature of the earth. I show from mathematical principles how Discrete Global Grid Systems (DGGSs) – hierarchical spatial data structures composed of polygonal cells that are increasingly being used for modelling geospatial data – can be employed creatively to act as the covering set for calculating the Minkowski-Bouligand dimension using the box-counting principle. This enables computation of the fractal dimension of geospatial data in spherical coordinates without having to project the data in question on a planar surface. Results on synthetic datasets are within 1% of their theoretical fractal dimensions. A case study on opaque cloud fields obtained from a geostationary meteorological remote sensing satellite image yields a result of 1.577±0.0207 when aggregated using three different geodesic DGGSs based on the Icosahedral Snyder Equal Area (ISEA) projection, in line with values reported in the literature. As the cells of a DGGS are generally pre-defined and fixed to the earth, this method also brings some relief associated with the box-counting method in general, particularly the choice of cell-sizes to be sampled as well as the placement and orientation of the grid that acts as the covering set – issues that are usually circumvented by rules of thumb and conventions. I comment on the possibility to extend the method for use with raster data.  Ways to improve the method using low-aperture DGGSs to better capture the self-similarity and possibilities of developing custom DGGSs for this purpose are also noted. Being a computationally intensive method, development of software libraries making use of parallel computing to enhance performance and scalability is also proposed. With climatic variables exhibiting spatiotemporal autocorrelation with long-range effects, I believe this method would be of interest to climate scientists interested in studying their fractal properties at continental and global scales.

How to cite: Ghosh, P.: Computing fractal dimension at large geographic scales using Discrete Global Grid Systems, EGU General Assembly 2026, Vienna, Austria, 3–8 May 2026, EGU26-4299, https://doi.org/10.5194/egusphere-egu26-4299, 2026.

EGU26-4711 | ECS | Orals | NP3.3

Numerical Study on the Path-Dependent Evolution of the Excavation Damage Zone under Transient Unloading 

Gongliang Xiang, Ming Tao, Xibing Li, Qi Zhao, Linqi Huang, Tubing Yin, Rui Zhao, and Jiangzhan Chen

Excavation and unloading of deep rock mass under varying in-situ stress levels is a typical non-linear geomechanical process, Specifically, in the context of the widely used drilling and blasting (D&B) method, the excavation damage zone (EDZ) around underground opening induced by transient unloading represents a dynamic response problem governed by multiple factors. While the exact theoretical solution of stress state in surrounding rock during transient excavation can describe the stress state and eventually converge to the Kirsch solution after rock mass excavation completed, it cannot fully capture the dynamic damage process. Therefore, a circular tunnel model for transient excavation was established in this study using a dynamic finite element code LS-DYNA. An equivalent released nodal force method was implemented to stably control the transient unloading path under non-hydrostatic in-situ stress conditions after stress initiation, which realizing the synchronous release of radial and tangential stresses in the excavated zone. Moreover, the validity of the linear elastic transient excavation model was verified through comparison with an analytical solution. Then the dynamic stress redistribution, as well as the EDZ evolution process were numerically simulated under various stress unloading paths and lateral pressure coefficients, utilizing an elastoplastic constitutive model. This study provides a basis for simulating transient excavation under various paths and understanding failure of surrounding rock in non-hydrostatic stress states.

How to cite: Xiang, G., Tao, M., Li, X., Zhao, Q., Huang, L., Yin, T., Zhao, R., and Chen, J.: Numerical Study on the Path-Dependent Evolution of the Excavation Damage Zone under Transient Unloading, EGU General Assembly 2026, Vienna, Austria, 3–8 May 2026, EGU26-4711, https://doi.org/10.5194/egusphere-egu26-4711, 2026.

EGU26-7074 | Posters on site | NP3.3

Global-scale multidecadal climate variability: The stadium wave 

Sergey Kravtsov, Andrew Westgate, and Andrei Gavrilov

A significant fraction of multidecadal fluctuations in the reanalysis-based gridded estimates of the observed climate variability over the past century and a half lie outside of the envelope generated by ensembles of climate-model historical simulations. Several pattern-recognition methods have been previously used to map out a truly global reach of the observed vs. simulated climate-data differences; in our own work we dubbed these global discrepancies the stadium wave to highlight their most striking spatiotemporal characteristic. Here we used a novel combination of such methods in conjunction with a large multi-model ensemble and two popular twentieth-century reanalysis products to: (i) succinctly describe the geographical evolution of the observed stadium wave in the annually sampled near-surface atmospheric temperature and mean sea-level pressure fields in terms of three basic patterns; (ii) show the robustness of this identification with respect to methodological details, including the demonstration of the truly global character of the stadium wave; and (iii) provide essential clues to its dynamical origin. All input time series were first decomposed into the forced signal and the residual internal variability; multi-model forced-signal estimates were also decomposed into their common-evolution part and the individual-model residuals. Analysis of the latter residuals suggests a contribution to the stadium-wave dynamics from a delayed climate response to variable external forcing despite the observed stadium-wave patterns’ exhibiting the magnitudes and the level of global teleconnectivity unmatched by the forced-signal residuals.

How to cite: Kravtsov, S., Westgate, A., and Gavrilov, A.: Global-scale multidecadal climate variability: The stadium wave, EGU General Assembly 2026, Vienna, Austria, 3–8 May 2026, EGU26-7074, https://doi.org/10.5194/egusphere-egu26-7074, 2026.

Scaling dynamics, intermittency, and multifractality in complex natural systems remain a central challenge across physics, geoscience, and hazard science. Earth system dynamics exhibit strongly non-equilibrium behaviour, long-range codependences, irreversible energy and information flows, and multiscale spatiotemporal coevolution, including dynamically adaptive interactions across spatial, temporal, and organizational domains.

The present contribution introduces and explores our latest advances in information physical intelligence for addressing these challenges, further building from our recent developments in non-ergodic nonlinear open quantum systems, where systems non-recurrently exchange energy, matter and information with structural-functional coevolutionary environments. In this setting, entropy production, information backflow, coherence, and decoherence are anchored on cross-scaling organizing principles spanning from microphysical foundations to emergent macrophysical behaviour, dynamically traceable and solvable through our novel nonlinear quantum developments.

Our new nonlinear quantum intelligence framework is then equipped with our latest non-ergodic information physical categorical algebraic infrastructure and associated mathematical physics apparatus, underlying the natural emergence of coevolutionary cyber-physical cognitive systems. These are then tested in controlled synthetic and free-range natural experiments, in order to provide operational insights on their ability to autonomously unfold and shape structural-functional emergence of complex system dynamics including scaling mechanisms in nonlinear non-ergodic multiscale stochastic-dynamical systems exhibiting scale-dependent entropy production rates, anomalous dissipation, and multidirectional cascades, on an inherent information physical thermodynamic process for far-from-equilibrium coevolutionary multifractal scaling.

One of the advances herein brings out a novel coevolutionary far-from-equilibrium thermodynamic renormalization of non-ergodic open quantum dynamics, where delocalization and aggregation across scales induces effective non-Markovianity, memory kernels, and scale-dependent effective energetics. These features are then shown to map naturally onto formal multifractal signatures observed in turbulence, precipitation fields, seismicity, geomagnetic activity, and climate variability.

Within this framework, coevolutionary multifractality emerges as a signature of competing irreversible processes operating across coevolving subsystems, rather than as a purely statistical or kinematic geometric construct. The corresponding generalization of information-theoretic quantities, including quantum relative entropy, Fisher information, and entropy production fluctuations, provide structural descriptors of scaling regimes and phase-transition-like behaviour in Earth system dynamics.

From theory to operation, we demonstrate how these information physical foundations and developments enable cross-domain integration in multiscale, multidomain Earth system modeling and more broadly across our System-of-Systems for Multi-Hazard Risk Intelligence Networks (SoS4MHRIN) platform. In doing so, we unveil and elicit coevolutionary scaling mechanisms linking traditional quantum information to meso and macroscale complexity, and harness elusive predictability pertaining to far-from-equilibrium non-ergodic non-recurrent emergence, intermittence and persistence of structural-functional changes, critical transitions and extreme events, along with their interactions and impacts.

This is particularly relevant for compound, cascading, coevolutionary and synergistic multi-hazards, where earthquakes, volcanic eruptions, extreme weather, floods, wildfires, and landslides interact across scales and domains. Far-from-equilibrium entropy production and information physical flows act as early warning indicators and organizing variables for multi-hazard interactions and tipping dynamics.

By synergistically articulating non-ergodic information physics, nonlinear open quantum thermodynamics, scaling theory, and Earth system science, this work provides a physically grounded, scale-aware framework for better understanding and operating on complexity, predictability, and resilience in the Earth system under ongoing structural-functional multiscale coevolution.


How to cite: Perdigão, R. A. P. and Hall, J.: Nonlinear Quantum Intelligence Framework for Coevolutionary Scaling and Multifractality across Far-from-Equilibrium Earth System Dynamics and Multi-Hazards, EGU General Assembly 2026, Vienna, Austria, 3–8 May 2026, EGU26-7773, https://doi.org/10.5194/egusphere-egu26-7773, 2026.

EGU26-8215 | ECS | Orals | NP3.3

Accounting for spatially autocorrelated errors is necessary to infer cross-scale biodiversity–ecosystem functioning patterns in natural world 

Zibo Wang, Yunfei Li, Fen Zhang, Jianye Yu, Chongshan Wang, Long Chen, and Xiaohua Gou

Cross-scale biodiversity–ecosystem functioning (BEF) relationships are widely used to evaluate how biodiversity relates to ecosystem functioning across space. Theory predicts that when species turnover is incomplete across space, the BEF slope follows a characteristic hump-shaped scaling pattern, strengthening with increasing scale before weakening at broader scales. In real landscapes, however, biodiversity and ecosystem function often co-vary along environmental gradients, and spatial autocorrelation naturally increases with scale, potentially confounding regression-based BEF inference.

We combined simulations and field data to quantify how explicitly accounting for spatial autocorrelation (SAC) affects BEF scaling. In simulations, biodiversity and ecosystem function were generated under joint control of an environmental gradient and a spatial stochastic component, allowing SAC to emerge in both predictors and responses. In empirical analyses, we used forest inventory data from two temperate forests. We constructed a sequence of spatial scales by aggregating plots using a k-nearest-neighbor procedure, with k increasing from small to large neighborhoods. At each scale, we estimated BEF as the slope of species richness (SR) on biomass increment, while controlling for climate, soil, and trait covariates. We then contrasted non-spatial models with spatial models that include SAC in the residual structure, and quantified ΔBEF as the difference in SR slopes between spatial and non-spatial fits.

Across simulations and observations, ignoring SAC produced an apparently monotonic strengthening of BEF with scale. However, when SAC was included, the BEF scaling curve followed the predicted hump-shaped pattern. Moreover, ΔBEF increased with residual Moran’s I, indicating that stronger spatial dependence systematically inflates non-spatial BEF estimates as scale increases. Finally, the BEF slopes were negatively correlated with excess species richness and positively correlated with species turnover after correcting for SAC, consistent with the theory that species turnover plays a key role in BEF scaling. Our study emphasizes that accounting for SAC is essential for accurate BEF scaling and provides a useful approach for future studies.

How to cite: Wang, Z., Li, Y., Zhang, F., Yu, J., Wang, C., Chen, L., and Gou, X.: Accounting for spatially autocorrelated errors is necessary to infer cross-scale biodiversity–ecosystem functioning patterns in natural world, EGU General Assembly 2026, Vienna, Austria, 3–8 May 2026, EGU26-8215, https://doi.org/10.5194/egusphere-egu26-8215, 2026.

EGU26-9513 | ECS | Posters on site | NP3.3

CMIP6 simulations overestimate historical decadal temperature variability over most land areas 

Tom Schürmann and Kira Rehfeld

A robust understanding of the potential range of Earth system dynamics is essential for effectively simulating future climate change. Previous studies have reported increasing discrepancies in modelled temperature variability from global to local scale, and beyond decadal timescales, based on paleoclimate reconstructions. The instrumental record is most complete for the last 145 years. This limits a spatio-temporal assessment of historical temperature variability to multidecadal timescales at the upper end.  To this day, model-observation comparisons of regional climate variability have mostly focused on sea surface temperature. 

Here, we compare historical near-surface air temperatures from an ensemble of 50 CMIP6 models with similar initial conditions and two single-model initial-condition large ensembles (SMILE) with reanalysis and observation datasets. Following a robust like-for-like approach, all datasets are interpolated to a common grid of about 2.8 degrees and compared over the period of 1880 to 2015. Spectral analysis and filters reveal the structure of temperature variability over different spatial and temporal scales. Specifically, we focus on temperature variability on timescales of 10 to 30 years from global to local scale.  

On the global scale, models consistently display higher temperature variance in bands from 10 to 30 years than reanalysis data. Masking the analysis to regions with a consistent observational record confirms this trend. On the local scale, observed temperature variability can deviate substantially from the mean of stacked model standard deviation fields. For example, observed temperature variability in Europe lies in the lower tail of the model distribution. Vice versa, observed temperature in the southern Atlantic is representative of the model distributions' upper tail. Consistently over the multi-model ensemble and two SMILEs, decadal temperature variability is overestimated on land, but underestimated over the ocean. Nevertheless, there are exceptions to this pattern. For example, in the northern Atlantic, modelled variability overestimates observations consistent with the literature. Overall, these regional inconsistencies suggest that multiple, regionally heterogeneous processes are involved. 

How to cite: Schürmann, T. and Rehfeld, K.: CMIP6 simulations overestimate historical decadal temperature variability over most land areas, EGU General Assembly 2026, Vienna, Austria, 3–8 May 2026, EGU26-9513, https://doi.org/10.5194/egusphere-egu26-9513, 2026.

Empirical, data-driven models provide a complementary approach to dynamical models for simulating and forecasting weather and climate variability across daily to subseasonal timescales. We present ongoing work toward the development of a global, data-driven weather emulator for temperature and precipitation based on higher-order Linear Inverse Models (LIMs) formulated within the Empirical Model Reduction (EMR) framework. This formulation enables the representation of effective low-order dynamics, memory effects, and scale-dependent variability embedded in high-dimensional atmospheric fields. Rather than relying on a fixed EOF-based spatial decomposition, we explore a state-space approach in which the spatial basis is parameterized and optimized using Kalman filtering, thereby learning an optimal dynamical representation directly from the data.

The model is trained using a combination of NASA satellite observations and atmospheric reanalysis products. Near-surface temperature is modeled directly, while precipitation is represented using a pseudo-precipitation variable: precipitation equals observed rainfall where it occurs and otherwise corresponds to the negative air-column integrated water-vapor saturation deficit, defined as the amount of water vapor required to bring the atmospheric column to saturation at each vertical level. This formulation yields a continuous and dynamically meaningful representation of moist processes that facilitates the analysis of variability statistics across scales.

Model performance is evaluated in terms of its ability to reproduce observed variability statistics, temporal persistence, and subseasonal prediction skill, while dynamical diagnostics will be used to investigate the underlying sources of forecast skill. By focusing on the statistical and dynamical representation of variability, this work contributes to ongoing efforts to bridge data-driven modeling and theoretical perspectives on weather to climate variability across scales.

How to cite: Hébert, R. and Kravtsov, S.: A Global Data-Driven Weather Emulator for Temperature and Precipitation Based on Higher-Order Linear Inverse Modeling, EGU General Assembly 2026, Vienna, Austria, 3–8 May 2026, EGU26-10397, https://doi.org/10.5194/egusphere-egu26-10397, 2026.

EGU26-11706 | ECS | Posters on site | NP3.3

Atlantic Multidecadal Variability-like behaviour since 1850 is largely externally forced 

Yongyao Liang, Ed Hawkins, Gerard McCarthy, and Peter Thorne

Whether observed Atlantic Multidecadal variability (AMV) is truly an intrinsic internal mode of climate variability or an externally forced response remains contentious, with conflicting literature that North Atlantic SST variability arises from internal dynamics or external forcing. The availability of several single-model initial-condition large ensembles (SMILEs) and new insights into potential biases in sea surface temperature (SST) variations offer a fresh opportunity to reassess this question. We show that SMILE ensembles provide strong evidence that AMV-like variability is largely externally forced. New insights into potential SST biases also raise questions about apparent early 20th-century oscillatory behaviour, suggesting that discrepancies between observations and climate model simulations may not arise solely from model deficiencies. SMILE models with stronger multidecadal variability show weaker agreement with observed AMV phasing, even in the best-performing individual ensemble members, suggesting that large internal model variability may obscure the forced signal. We conclude that future variations in North Atlantic SST will very likely be driven primarily by future anthropogenic activities.

How to cite: Liang, Y., Hawkins, E., McCarthy, G., and Thorne, P.: Atlantic Multidecadal Variability-like behaviour since 1850 is largely externally forced, EGU General Assembly 2026, Vienna, Austria, 3–8 May 2026, EGU26-11706, https://doi.org/10.5194/egusphere-egu26-11706, 2026.

EGU26-12081 | ECS | Posters on site | NP3.3

Universal Multifractals characterization of high-resolution rainfall in the Paris region 

Atheeswaran Balamurugan, Auguste Gires, Daniel Schertzer, and Ioulia Tchiguirinskaia

Rainfall exhibits strong variability, intermittency and a heavy-tailed distributions across a wide range of scales. Understanding and characterizing these features is needed for numerous applications such as quantifying the extremes or merging measurements from various sensors operating at different space-time scales. 

This study presents a comprehensive multifractal analysis of high-resolution (30 s) 1D rainfall time series from the Paris region (2018 – 2024) using the Universal Multifractals (UM) framework. The data was collected with the help of optical disdrometers installed on the campus of Ecole nationale des Ponts et chausséee campus (https://hmco.enpc.fr/portfolio-archive/taranis-observatory/) UM framework has been widely used to characterize and simulate rainfall across wide range of scales with the help of only three parameters: the mean intermittency C₁, the multifractality index α and  the non-conservation parameter H. 

Spectral analysis identifies a clear scale break around 1 h, separating two distinct regimes. Coarse scales (>1h) are characterized by smooth, low-intermittency variability (spectral slope β ≈ 0.4), while fine scales (<1h) exhibit stronger spectral slope (β > 1). Accordingly, a regime-dependent analysis strategy is adopted: actual rainfall series are used at coarse scales to preserve large scale structure, while absolute values of fluctuation series are preferred at fine scales to reduce to study underlying conservative field and obtain cleaner scaling behaviour.

Analyses reveal strong multifractality (α ≈ 1.6 –1.7) and moderate intermittency (C₁ ≈ 0.12 – 0.45) at fine scale regimes. At coarser scale regimes, rainfall exhibits smoother variability with moderate multifractality (α < 1)and lower intermittency (C₁ ≈ 0.15–0.18). The UM parameters display good inter annual stability over 2018 – 2024, mild seasonal modulation (slightly higher C₁ in summer), and individual rain-event analyses were performed to examine event-to-event variability, indicating substantial heterogeneity between events.  

These results demonstrate the relevance of the UM framework for quantitatively characterizing rainfall variability in the Paris region. Initial attempts to interpret the observed differences between fine and coarse scales regimes using a unique model will be presented. 

Authors acknowledge partial financial support by the European Union as part of the Horizon Europe programme, Marie Skłodowska-Curie Actions, call COFUND-2022 and under grant agreement number 101126720; the France-Taiwan Ra2DW project (grant number by the French National Research Agency – ANR-23-CE01-0019-01).

How to cite: Balamurugan, A., Gires, A., Schertzer, D., and Tchiguirinskaia, I.: Universal Multifractals characterization of high-resolution rainfall in the Paris region, EGU General Assembly 2026, Vienna, Austria, 3–8 May 2026, EGU26-12081, https://doi.org/10.5194/egusphere-egu26-12081, 2026.

EGU26-12716 | ECS | Posters on site | NP3.3

Linking meteorological extremes to clay shrink–swell hazard: Insights from 65 years of climate data 

Carl Tixier, Pierre-Antoine Versini, and Benjamin Dardé

Clay shrink-swell (CSS) behavior arises from fluctuations in soil moisture driven by seasonal cycles of rainfall and drought. This phenomenon causes ground movements that can damage building foundations and infrastructure. In France, where approximately 54% of constructions are exposed to this hazard, CSS ranks as the second most significant category of natural disaster insurance claims.

The French central reinsurance fund reports that the average annual cost, calculated over a five-year sliding window, remained below €300 million in 2016. Since 2017, this figure has increased, reaching about €1.35 billion as of 2025. Climate change is expected to amplify droughts, heatwaves, and precipitation extremes, further intensifying CSS processes and potentially rendering their financial burden unsustainable for insurers.

To address this issue, we analyze meteorological data from the SAFRAN reanalysis provided by Météo-France, which offers daily observations at an 8 km spatial resolution across France since 1958. Our study applies geostatistical and multifractal techniques to characterize spatiotemporal variability, identify scale breaks, estimate extreme values, and examine spectral properties of key climatic variables. Specifically, we compute:

  • Multifractality index (α): It measures the speed of change in intermittency;
  • Mean singularity (C₁): Average singularity, characterizes intermittency;
  • Maximum probable singularity (γₛ): maximum probable singularity.

Tracking these parameters from 1958 to 2025 enables us to identify regions most affected by changes in extremes. Analyses focus on variables influencing CSS behavior, including precipitation, temperature, evapotranspiration, and soil moisture index.

Finally, we compare the evolution of extremes in these climatic parameters with trends in CSS occurrence, quantified through insurance claims. This spatial and temporal comparison between multifractal indicators and affected areas provides insights into the relationship between the intensification of extreme meteorological events and the dynamics of clay shrink-swell processes.

This work is part of the IRGAK (inhibition of clay shrinkage-swelling by K+ ion injection) project, founded by the French Agency for Ecological Transition (ADEME). Its objective is to model the link between climate variability and CSS, and to propose adaptation strategies to mitigate a risk that is expected to increase significantly with climate change, leading to escalating insurance costs and growing socio-economic impacts.

How to cite: Tixier, C., Versini, P.-A., and Dardé, B.: Linking meteorological extremes to clay shrink–swell hazard: Insights from 65 years of climate data, EGU General Assembly 2026, Vienna, Austria, 3–8 May 2026, EGU26-12716, https://doi.org/10.5194/egusphere-egu26-12716, 2026.

EGU26-14920 | Orals | NP3.3

Understanding extreme heat: Causes and time scales revealed by Rényi information transfer 

Milan Paluš, Pouya Manshour, Anupam Ghosh, Zlata Tabachová, Eva Holtanová, and Jiří Mikšovský

Recently, Paluš et al. (2024) demonstrated that information-theoretic generalization of Granger causality – based on conditional mutual information/transfer entropy – when reformulated in terms of Rényi entropy, provides a time-series analysis tool suitable for identifying the causes of extreme values in affected variables.

Investigating the causes of warm summer surface air temperature extremes in Europe, Rényi information transfer highlights the role of blocking events among large-scale circulation patterns and modes of variability. Soil moisture interacts with air temperature on a daily scale, exhibiting bidirectional causal effects on the mean, whereas its influence on temperature extremes emerges over longer time scales, from a fortnight to a month. In contrast, the causal effect of blocking on temperature extremes is primarily observed at the daily scale. Using tools from Rényi information theory, we aim to disentangle this complex, multicausal, multiscale phenomenon and identify the regions in Europe where these factors modulate the probability of extreme summer heat.


This research was supported by the Johannes Amos Comenius Programme (P JAC), project No. CZ.02.01.01/00/22_008/0004605, Natural and anthropogenic georisks; and by the Czech Science Foundation, Project No. 25-18105S.

Paluš, M., Chvosteková, M., & Manshour, P. (2024). Causes of extreme events revealed by Rényi information transfer. Science Advances, 10(30), eadn1721.


How to cite: Paluš, M., Manshour, P., Ghosh, A., Tabachová, Z., Holtanová, E., and Mikšovský, J.: Understanding extreme heat: Causes and time scales revealed by Rényi information transfer, EGU General Assembly 2026, Vienna, Austria, 3–8 May 2026, EGU26-14920, https://doi.org/10.5194/egusphere-egu26-14920, 2026.

EGU26-14999 | Orals | NP3.3

From Eons to Epochs: multifractal  Geological Time and a compound multifractal-Poisson model 

Shaun Lovejoy, Andrej Spiridonov, Raphael Hebert, and Fabrice Lambert

Geological time is punctuated by events that define biostrata and the Geological Time Scale’s (GTS) hierarchy of eons, eras, periods, epochs, ages. Paleotemperatures and macroevolution rates, have already indicated that the range ≈ 1 Myr to (at least) several hundred Myrs) is a scaling (hence hierarchical) “megaclimate” regime.  We apply analysis techniques including Haar fluctuations, structure functions trace moment and extended self-similarity to the temporal density of the boundary events (r(t)) of two global and four zonal series.  We show that r(t) itself is a new paleoindicator and we determine the fundamental multifractal exponents characterizing the mean fluctuations, the intermittency and the degree of multifractality.  The strong intermittency allows us to show that the (largest) megaclimate  scale is at least  ≈ 0.5 Gyr.  We also analyze a Precambrian series going back 3.4Gyrs directly confirming this limit and allowing us to quantatively compare the Phanerozoic with the Proterozoic eons.

We find that the probability distribution of the intervals (“gaps”) between boundaries and find that its tail is also scaling with an exponent qD≈ 3.3 indicating huge variability with occasional very large gaps such that it’s third order statistical moment barely converges.  The scaling in time implies that record incompleteness increases with its resolution (the “Resolution Sadler effect”), while scaling in probability space implies that incompleteness increases with sample length (the “Length Sadler effect”). 

The density description of event boundaries is only a useful characterization over time intervals long enough for there to be typically one or more events.  In order to model the full range of scales (and low to high r(t)), we introduce a compound Poisson-multifractal model in which the multifractal process determines the probability of a Poisson event.   The model well reproduces all the observed statistics.

Scaling changes our understanding of life and the planet and it is needed for unbiasing many statistical paleobiological and geological analyses, including unbiasing spectral analysis of the bulk of geodata that are derived from cores.

How to cite: Lovejoy, S., Spiridonov, A., Hebert, R., and Lambert, F.: From Eons to Epochs: multifractal  Geological Time and a compound multifractal-Poisson model, EGU General Assembly 2026, Vienna, Austria, 3–8 May 2026, EGU26-14999, https://doi.org/10.5194/egusphere-egu26-14999, 2026.

EGU26-15166 | ECS | Orals | NP3.3 | Highlight

Global sonde datasets do not support a mesoscale transition in the turbulent energy cascade 

Thomas DeWitt, Tim Garrett, Karlie Rees, and Stephen Oppong

The dynamics driving Earth's weather are commonly presumed to be governed by a hierarchy of distinct dynamical mechanisms, each operating over some limited range of spatial scales. The largest scales are argued to be driven by quasi-two-dimensional turbulence, the mesoscales by gravity waves, and the smallest scales by 3D isotropic turbulence. In principle, such a hierarchy should result in observable breaks in atmospheric kinetic energy spectra at discrete points as one mechanism transitions to the next. Using global radiosonde and dropsonde datasets, we show that this view is not supported in observations. Between 200m and 8km, we find that structure functions calculated along the vertical direction display a Hurst exponent of H_v \approx 0.6, which is inconsistent with either gravity waves (H_v = 1) or 3D turbulence (H_v = 1/3). In the horizontal directions, large-scale structure functions between 200km and 1800km display a Hurst exponent of H_h \approx 0.4, which is inconsistent with quasi-geostrophic dynamics (H_h = 1). We show that these observations are instead consistent with a lesser-known theory of stratified turbulence proposed by Lovejoy and Schertzer in 1985, where at all scales the dynamics obey a single anisotropic turbulent cascade with H_v=3/5 and H_h =1/3.

Our results suggest a reinterpretation of atmospheric dynamics: rather than being controlled by a hierarchy of distinct dynamical elements, atmospheric flow should instead be thought of as a superposition of anisotropic turbulent eddies that continually cascade from large scales to small scales. We show how this view may be interpreted literally and used to construct photorealistic and quantitatively accurate simulations of atmospheric volumes, and without integration of the hydrodynamic equations. We argue that the model also provides a more intuitive basis for interpreting both the intermittent and the anisotropic aspects of the observed statistics of the atmosphere.

How to cite: DeWitt, T., Garrett, T., Rees, K., and Oppong, S.: Global sonde datasets do not support a mesoscale transition in the turbulent energy cascade, EGU General Assembly 2026, Vienna, Austria, 3–8 May 2026, EGU26-15166, https://doi.org/10.5194/egusphere-egu26-15166, 2026.

The background continuum of climate variability recorded in proxy records is often modelled using parametric spectral models, such as power-laws, auto-regressive processes, or stochastic differential equations.

However, fitting such models to proxy data is usually done in an ad-hoc manner, such as by using least-squares fitting in log-log space.

Here I will discuss two formal Bayesian methods for fitting parametric stochastic models to proxy data. One is a spectral-domain approach based the Whittle likelihood. The other is a time-domain approach based on Gaussian Processes.

In both cases, I show how the standard approaches can be modified to account for some of the ways in which climate proxies alter spectral slopes: measurement error, time uncertainty, uneven sampling, and smoothing (e.g. from diffusion or bioturbation). Finally, I use synthetic data generated from power-law and Matern processes, and proxy-system models, to show expected skill of the two approaches for different proxies.

I find that these formal approaches provide significant bias reduction relative to typical ad-hoc approaches, allowing for much more accurate calibration of stochastic models of climate variability across scales.

How to cite: Proistosescu, C.: Bayesian methods for fitting spectral models to noisy, sparse, proxy data, EGU General Assembly 2026, Vienna, Austria, 3–8 May 2026, EGU26-15967, https://doi.org/10.5194/egusphere-egu26-15967, 2026.

EGU26-19188 | ECS | Orals | NP3.3

New classes of climate model emulators to improve paleoclimate reconstructions 

Auguste Gaudin and Myriam Khodri

It is well known that the predictability of the climate varies over time and will depend on the initial conditions, especially when considering non-linear systems such as El Niño Southern Oscillation (ENSO). While recent decades have seen a few extreme ENSO events, proxy data reveal a large amplitude in tropical Pacific sea surface temperatures low frequency modulations over past millennia. To better interpret what is observed in proxies, a useful approach is to combine the climate information derived from natural archives with the physics of GCMs using paleoclimate data assimilation (PDA). Recently, efficient online ensemble-based data assimilation techniques have been developed relying on climate model emulators and the predictable components of the climate system. The skill of these ensemble forecasts is a key factor for the success of PDA especially when considering Particle Filters. Such predictability may however change according to the host-GCM, the emulator skills in capturing the host-GCM non-linear behaviours and the dimension of the problem. In this study, we explore these issues in a perfect model framework across PMIP3 and PMIP4 climate model simulations for the past millennium, relying on various types of architectures and climate model emulators. Our results indicate that relying on such a hierarchy of multi-model approaches provides a promising way to better quantify uncertainties and decipher the relative contribution from internal dynamics and external forcings embedded in proxy records, particularly regarding ENSO.

How to cite: Gaudin, A. and Khodri, M.: New classes of climate model emulators to improve paleoclimate reconstructions, EGU General Assembly 2026, Vienna, Austria, 3–8 May 2026, EGU26-19188, https://doi.org/10.5194/egusphere-egu26-19188, 2026.

EGU26-19829 | Posters on site | NP3.3

Extending the Fresnel Platform with a 3D Isometric Graphical Interface for Land-Use Scenario Design in Hydrological Modeling   

Guillaume Drouen, Daniel Schertzer, Auguste Gires, Pierre-Antoine Versini, and Ioulia Tchiguirinskaia

Urban areas are increasingly exposed to localized extreme rainfall events, with evidence suggesting a trend toward higher precipitation volumes and more frequent short-duration, high-intensity storms, posing major challenges to infrastructure resilience and public safety. 

Urban hydrometeorology is characterized by highly nonlinear processes, strong interactions with geophysical systems, and pronounced variability across spatial and temporal scales, making both scientific understanding and operational management particularly demanding. 

Within this context, the Fresnel platform is a state-of-the-art urban hydrometeorological observatory combining conceptual modeling approaches with extensive field measurements. One of its components, RadX, is a Software-as-a-Service (SaaS) platform that provides real-time and historical data from high-resolution sensors, together with a graphical user interface (GUI) for Multi-Hydro, a fully distributed and physically based hydrological model developed at École nationale des ponts et chaussées (ENPC). Multi-Hydro relies on four open-source software components representing different processes of the urban water cycle. The RadX GUI allows users to efficiently run simulations using dedicated high-performance computing resources, configure multiple scenarios for a given catchment, modify land-use parameters, and assess their impacts on drainage system discharges. 

The originality of this contribution lies in the development of a new 3D isometric graphical interface based on an open-source game engine. Unlike conventional interfaces relying on the editing of raster matrices, this approach provides a more intuitive and spatially explicit visualization of land-use configurations. It enables a clearer representation and manipulation of Nature-based Solutions (NbS), such as porous pavements, whose implementation often remains abstract when expressed solely through raster data. 

Beyond hydrological modeling, RadX also supports integrating shared value principles into business models to enhance resilience and sustainability. Within the PIA3 TIGA-CFHF project (“Construire au futur, habiter le futur”), it promotes an integrated vision where economic activities are situated within a complex socio-environmental system, aligning economic performance with environmental and societal objectives. 

To support this transition, RadX aims to incorporates multifractal and advanced socio-economic analysis tools that enable organizations to assess performance and develop shared value–oriented strategies aligned with measurable environmental objectives. 

The RadX platform is continuously improved through an iterative development process driven by feedback from students, academic researchers, and industry practitioners, and may integrate additional visualization or forecasting components in future developments. 

How to cite: Drouen, G., Schertzer, D., Gires, A., Versini, P.-A., and Tchiguirinskaia, I.: Extending the Fresnel Platform with a 3D Isometric Graphical Interface for Land-Use Scenario Design in Hydrological Modeling  , EGU General Assembly 2026, Vienna, Austria, 3–8 May 2026, EGU26-19829, https://doi.org/10.5194/egusphere-egu26-19829, 2026.

EGU26-20114 | Orals | NP3.3

Geophysical extremes, scaling and fractal support induced by zero-values 

Ioulia Tchiguirinskaia, Auguste Gires, and Daniel Schertzer

In the era of the data-driven research, the zero-values of geophysical fields require increased attention in order to improve understanding of their effective impacts on the prediction of extreme geophysical phenomena.

In everyday life, we use the idea that zero denotes the absence of quantity, whereas in geophysics, it refers to a chosen reference point, not necessarily the absence of a physical phenomenon.  It then results from the removal of the background field, either by design of the measured quantity or due to the current limitations of empirical detection.

Regardless of their origin, the presence of zeros in data significantly alters the resulting statistical distributions and influences the estimates of statistical parameter. Regarding universal multifractals (UM), two approaches have been favoured over the last thirty years to mimic the appearance of zeros and/or quantify their influence on the resulting UM estimates. The first, among the most widely used, relies on multiplying of a UM field by an independent fractal model, the ‘beta-model’, i.e. to assume the field has physically a fractal support. The second consist of thresholding the UM singularities and ignoring the fluctuations below the threshold, i.e. assuming that there is a detection of low field values.

This presentation will revisit these two approaches, emphasizing the significant resulting differences in the theoretical behaviour of the multifractal phase transitions, which are responsible for the behaviour of multifractal extremes. Then practical methods for preliminary detection of the most appropriate zero-creation mechanism within the data will be illustrated with concrete examples from geophysical fields.

How to cite: Tchiguirinskaia, I., Gires, A., and Schertzer, D.: Geophysical extremes, scaling and fractal support induced by zero-values, EGU General Assembly 2026, Vienna, Austria, 3–8 May 2026, EGU26-20114, https://doi.org/10.5194/egusphere-egu26-20114, 2026.

EGU26-20699 | ECS | Orals | NP3.3

Multifractal Analysis of the Large-Scale Galaxy Distribution 

Dariusz Wójcik and Wiesław M. Macek

This study examines the large-scale structure of the visible universe to determine if fractal scaling laws offer a plausible explanation for the distribution of galaxies. Using the extensive Updated CfA Redshift (Z) CATalog (UZCAT) compilation, which includes redshift data for around one million galaxies, we identify a reliable multifractal spectrum of the galaxy distribution on cosmological scales.

By calculating the generalized dimensions Dq and the singularity spectrum f (α), we demonstrate that the observed distribution is consistent with the weighted Cantor set model, indicative of nonlinear multifractal scaling. We find that the one-scale model parameter (p ≈ 0.45) relates to the presence of voids in the large-scale distribution of matter. Furthermore, the observed asymmetry in the spectrum may be explained by variations from the Hubble law for ideal uniform expansion

Interestingly, the overall shape of the multifractal spectrum resembles that observed by NASA's Voyager missions at the heliospheric boundaries, suggesting some universal properties of scaling across these different physical systems. However, the degree of multifractality for galaxies (Δ ≈ 0.1 – 0.17) is notably smaller than that found in heliospheric turbulence, indicating distinct underlying physical constraints despite the shared mathematical methodology.

Acknowledgments: This work has been supported by the National Science Centre, Poland (NCN), through grant No. 2021/41/B/ST10/00823.


[1] W. M. Macek and D. Wójcik, 2026, Fractal Nature of Galaxy Clustering in the Updated CfA Redshift Catalog, Sci. Rep., https://doi.org/10.1038/s41598-026-36013-3.

[2] W. M. Macek, A. Wawrzaszek, and L. F. Burlaga, 2014, Multifractal structures detected by Voyager 1 at the heliospheric boundaries.
Astrophys. J. Lett. 793, L30. https://doi.org/10.1088/2041-8205/793/2/L30.

How to cite: Wójcik, D. and Macek, W. M.: Multifractal Analysis of the Large-Scale Galaxy Distribution, EGU General Assembly 2026, Vienna, Austria, 3–8 May 2026, EGU26-20699, https://doi.org/10.5194/egusphere-egu26-20699, 2026.

EGU26-21023 | ECS | Posters on site | NP3.3

A Dye-Tracer Forward-Modeling Framework for Deglacial Meltwater Reconstruction 

Laura Endres, Ruza Ivanovic, Yvan Romé, and Heather Stoll

Freshwater input from melting polar ice sheets can profoundly alter ocean circulation, in particular the Atlantic Meridional Overturning Circulation (AMOC), with far-reaching climatic consequences. Yet the sensitivity of the AMOC to freshwater forcing remains highly uncertain: models exhibit divergent responses depending on source location, background climate state, and circulation regime, while the instrumental record is too short to unambiguously detect and characterise a melt-driven weakening.

Palaeoclimate archives, especially from the last deglaciation, provide ample evidence of melt events through indicators such as surface-ocean δ¹⁸O and biomarkers (e.g. BIX) in sediment cores and speleothems. However, the spatial and temporal characteristics of the underlying meltwater forcing remain poorly constrained. While meltwater discharge into the North Atlantic may be local, rapid, and event-like, its redistribution and impact on the AMOC unfold over centuries, complicating direct inference from surface-ocean proxies. Consequently, in deglacial general circulation model simulations, meltwater forcing is typically inferred indirectly from ice-sheet reconstructions or expected climate responses, resulting in a wide spread of applied forcings that propagates into substantial uncertainty.

Here we introduce a new forward-modelling approach aimed at strengthening the estimation and detection of regionally distinct and temporally evolving surface-ocean meltwater signals in proxy archives. We develop an empirical Green’s-function (impulse-response) framework based on a new suite of HadCM3 simulations, in which conservative tracers track meltwater originating from different source regions under distinct AMOC modes representative of deglacial conditions. Signals at terrestrial proxy sites are inferred using atmospheric back-trajectory analysis. The resulting kernels encode the system’s response for different source regions across multiple time lags, allowing any transient meltwater history to be reconstructed through discrete convolution with a derived 500-year response function. Applied to the last deglaciation, the framework demonstrates how differences between ice-sheet reconstructions (e.g. GLAC-1D versus ICE-6G) translate into distinct surface-ocean meltwater anomalies in the North Atlantic. The model highlights the critical role of meltwater amount, timing, and injection location, as well as the underlying AMOC circulation mode, in shaping surface-ocean proxy signals. It further provides quantitative estimates of how meltwater-related surface anomalies propagate to proxy sites distributed across the North Atlantic. Notably, transitions between AMOC modes can effectively mask even massive meltwater pulses, such as Meltwater Pulse 1A, at certain proxy locations. This forward-modelling approach thus offers an alternative perspective on deglacial freshwater forcing in the proxy realm and represents a step towards data-constrained reconstructions of past surface-ocean freshening and AMOC resilience.

How to cite: Endres, L., Ivanovic, R., Romé, Y., and Stoll, H.: A Dye-Tracer Forward-Modeling Framework for Deglacial Meltwater Reconstruction, EGU General Assembly 2026, Vienna, Austria, 3–8 May 2026, EGU26-21023, https://doi.org/10.5194/egusphere-egu26-21023, 2026.

EGU26-196 | ECS | Orals | NH7.1

 Identification and mapping fire danger zones using modeling 

Abiola B. Adewuyi and Anna Barbati

Mediterranean ecosystems face escalating wildfire challenges as climate change intensifies extreme temperature conditions across Southern Europe, making fire danger zone identification increasingly critical for ecosystem management. This research develops a satellite-based modeling framework integrating spatial analysis techniques to comprehensively map fire danger zones across Sicily's Messina province. The study focuses on this fire-prone region where the convergence of fuel availability, multiple ignition sources, and extreme environmental conditions create favorable scenarios for wildfire events. This methodology employed European Forest Fire Information System data spanning the period 2012-2024 (excluding 2015 due to data unavailability) to analyze wildfire patterns across Messina's 326,689 hectares. The research implemented a six-step analytical framework: temporal binary coding for fire occurrence pattern identification, multi-layer spatial union of administrative and burned boundaries, raster conversion with cumulative summation, integrated forest type mapping, coordinate reference system standardization, and comprehensive vegetation-based area calculations. This methodological approach achieved high spatial accuracy while ensuring analytical consistency across heterogeneous landscape types. Results reveal substantial wildfire impact across the study region, with 30,654 hectares affected representing 9.38% of Messina's total area. Fire frequency analysis demonstrated a significant increasing trend, growing from 64 events in 2012 to 382 events in 2023. Spatial analysis identified 1,470 distinct fire events distributed throughout the provincial area. Vegetation impact analysis revealed differential vulnerability patterns, with agricultural lands most affected (34.84% of burned area), followed by Mediterranean maquis (25.88%) and oak forests (19.98%). Mountain pine forests exhibited the highest reburn vulnerability (35.32%), while beech forests demonstrated complete resistance to repeated burning. The modeling approach has so far successfully identified fire danger zones and vulnerability patterns across Messina's diverse ecosystem types, providing valuable data for targeted fire prevention strategies and ecosystem restoration priorities. This research contributes important insights to fire danger zone mapping and establishes a methodology applicable to similar wildfire-prone region across Southern Europe.

Key words: Fire danger zones, Spatial modeling, Mediterranean ecosystems, Burn frequency, Vegetation vulnerability

How to cite: Adewuyi, A. B. and Barbati, A.:  Identification and mapping fire danger zones using modeling, EGU General Assembly 2026, Vienna, Austria, 3–8 May 2026, EGU26-196, https://doi.org/10.5194/egusphere-egu26-196, 2026.

EGU26-529 | ECS | Orals | NH7.1

Defining climatic drivers for the prediction of summer wildfires in northern Italy 

Alice Baronetti, Paolo Fiorucci, and Antonello Provenzale

Wildfires are natural phenomena affecting ecosystems and causing negative impacts on human health and biodiversity. In the Mediterranean region, wildfire regimes are strongly influenced by local climatic conditions, leading to pronounced inter and intra-annual variability in wildfire occurrence.

Owing this link, the study explores for the first time the climatic drivers influencing the monthly burned area (BA) during the summer fire season (May - September) in northern Italy at the three scales of spatial resolution: 0.11, 0.25 and 0.50 degrees. We then build multi-regression data-driven models to define the main BA predictors for the investigated area. The summer monthly percentages of burned area at the three resolution for the 2008-2022 period were derived from the GPS-based BA perimeters. A total of 150 daily precipitation and maximum and minimum ground station series were collected, converted at monthly scale, reconstructed, homogenised and spatialised at 0.11°, 0.25° and 0.50° resolution using the Universal Kriging with auxiliary variables. Several climatic indices were subsequently computed for precipitation, temperature and drought. To identify the best BA predictors, we first performed the Pearson’s correlation test, for each pixel, between the monthly BA series and the climatic indices calculated for three different aggregation periods: concurrent summer (2008-2022), 6 months before the fires (winter 2007-2021) and 12 months before the fires (summer 2007-2021). Multilinear regressions models were computed using every possible combination of the best predictors. The best regression models were selected through an out-of-sample procedure, and the model performance was tested by comparing the predicted BA with the observed data, estimating explained variance and correlation. Finally based on the CORINE Land Cover map, the vegetation classes that were most susceptible to wildfires, and their typical elevation ranges, were identified.

This study shows that summer fires in northern Italy are concentrated in July and August and are predominantly located in the southern part of the study area, at elevations between 100 and 600 m a.s.l. In particular, the lower rates of the Ligurian and Tuscan Apennines exhibit a fire return period of 1 to 2 years, in contrast to the Alps, where it exceeds 6 years. Sclerophyllous, Sparse, and Open Forests appear to be the vegetation classes most susceptible to fire in these fire-prone regions. Modelling results for the 2008–2022 period indicate that the most accurate predictions were performed at 0.11° of resolution and fires are driven by drought conditions caused by water stress than by high temperatures. Indeed, the most significant predictors of burned area were the two drought indices and water balance, recorded both for the current period (June to July) and for the preceding 6 months period (December to March).

How to cite: Baronetti, A., Fiorucci, P., and Provenzale, A.: Defining climatic drivers for the prediction of summer wildfires in northern Italy, EGU General Assembly 2026, Vienna, Austria, 3–8 May 2026, EGU26-529, https://doi.org/10.5194/egusphere-egu26-529, 2026.

EGU26-1102 | ECS | Posters on site | NH7.1

Wildfire Severity and Post-Fire Hydrological Responses in a Central Himalayan Watershed: Integrating Remote Sensing and SWAT 

Biswajit Das, Shailja Mamgain, Arijit Roy, Ashutosh Sharma, Sumit Sen, and Sandipan Mukherjee

Wildfires critically alter hydrological regimes in Himalayan watersheds, yet their quantitative impacts remain poorly understood. This study integrates remote sensing–derived burn severity data with the SWAT model to assess postfire hydrological responses in the Central Himalayan Kosi River Basin (2013–2019). Burn severity information derived from Landsat-8 Operational Land Imager (OLI) imagery was used to update leaf area index (LAI) and curve number (CN) parameters within SWAT model to represent fire-induced surface modifications. The model showed satisfactory performance (R² = 0.67 calibration; 0.66 validation). Results indicated that extensive burns, particularly in 2013 and 2016, increased surface runoff by 20–34% and water yield by 13–20%, while reducing evapotranspiration by 17–24% and recharge by up to 7%. The findings highlight that Subbasin 16 experienced repeated moderate-to high-severity burns throughout 2013–2019 and exhibited the most intense and consistent fire effects. This subbasin is hydrologically more sensitive and likely contribute disproportionately to surface runoff and erosion during postfire periods. Therefore, targeted reforestation and soil stabilization efforts should be prioritized to reduce postfire runoff and erosion. These findings collectively emphasize ongoing postfire hydrological changes caused by vegetation loss and soil degradation, highlighting the importance of remote sensing–SWAT integration for postfire watershed management amid rising wildfire frequency.

How to cite: Das, B., Mamgain, S., Roy, A., Sharma, A., Sen, S., and Mukherjee, S.: Wildfire Severity and Post-Fire Hydrological Responses in a Central Himalayan Watershed: Integrating Remote Sensing and SWAT, EGU General Assembly 2026, Vienna, Austria, 3–8 May 2026, EGU26-1102, https://doi.org/10.5194/egusphere-egu26-1102, 2026.

EGU26-2007 | ECS | Orals | NH7.1

Spatial Resolution Enhancement of Geostationary Thermal Observations for Wildfire Monitoring 

Anna Zenonos, Jean Sciare, Constantine Dovrolis, and Philippe Ciais

Wildfires represent one of the most critical threats to Mediterranean forests, making timely detection and continuous monitoring a priority for risk mitigation and environmental management. Despite significant advances in satellite-based fire monitoring, current approaches remain constrained by a fundamental trade-off between spatial and temporal resolution in available remote sensing data. Geostationary satellite systems offer high-frequency observations that are well suited for near-real-time monitoring, yet their coarse spatial resolution limits their effectiveness for applications requiring fine-scale spatial detail. Addressing this limitation is particularly relevant for wildfire monitoring, where early-stage events often occur at small spatial scales. In this presentation, we introduce a learning-based framework for spatial resolution enhancement of high-temporal infrared satellite observations. The approach explores multiple model families, including autoencoder-based architectures, residual channel attention networks, and generative models such as neural operator diffusion, to reconstruct fine-scale thermal structure from coarse measurements while preserving temporal consistency. The best model configurations are tested in the context of wildfire monitoring, using higher-resolution thermal products from NASA VIIRS as reference data. Results indicate improved representation of fire-related signals, with implications for better early detection and monitoring applications. Detailed methodological developments and quantitative evaluations will be presented in a forthcoming publication.

How to cite: Zenonos, A., Sciare, J., Dovrolis, C., and Ciais, P.: Spatial Resolution Enhancement of Geostationary Thermal Observations for Wildfire Monitoring, EGU General Assembly 2026, Vienna, Austria, 3–8 May 2026, EGU26-2007, https://doi.org/10.5194/egusphere-egu26-2007, 2026.

As one of the key links in maintaining the balance of ecosystems, natural fires in nature are often extensive and unpredictable. When they get out of control and turn into wildfires, the threats they pose to ecosystems, the atmospheric environment, and human health are incalculable. Fires lead to a continuous reduction in forest coverage, while a large amount of harmful gases produced by forest combustion are emitted into the atmosphere. This causes enormous harm to the ecological environment, economic development, and the safety of human lives and property. Therefore, timely and accurate detection of forest fires, as well as grasping specific characteristics such as the exact occurrence time, location, and spatiotemporal evolution of fires, helps to explore the causes and patterns of fires, and is of great significance for the sustainable management of forests supported by fire prevention management.

This study proposes a novel fire detection algorithm integrating spatiotemporal information, utilizing data from Himawari-8, a next-generation geostationary satellite. By combining contextual information and a dynamic threshold detection method, the algorithm achieves real-time detection and scientific prediction of fire points through improving the slope deviation of infrared channels. A forest fire that occurred in Yuxi City, Yunnan Province, from April 11 to April 15, 2023, was selected as a research case for fire detection analysis. The results demonstrate that the proposed fire point detection method reduces edge false detections compared to WLF, the official fire point product of Himawari-8. Meanwhile, it shows significantly higher recognition accuracy and a notably lower false detection rate than the pre-improved algorithm.

The experimental results show that this improved forest fire detection algorithm can quickly and effectively detect fire point information. Compared with the pre-improved algorithm, it has higher detection accuracy. Meanwhile, the improvement of infrared gradient provides new ideas and methods for realizing effective disaster situation monitoring.

How to cite: Xue, Y.: A Novel Spatiotemporal Fire Detection Algorithm Based on Himawari-8 Satellite Data, EGU General Assembly 2026, Vienna, Austria, 3–8 May 2026, EGU26-2348, https://doi.org/10.5194/egusphere-egu26-2348, 2026.

EGU26-3053 | ECS | Orals | NH7.1

Development of an Integrated Static Fire Risk Index for Cyprus Utilizing Tree-Based Ensemble Classifiers: A Soft-Voting Approach 

Venkata Suresh Babu, Apostolos Sarris, and Dimitris Stagonas

Accurate wildfire risk assessment is essential for disaster mitigation and landscape management, particularly in Mediterranean ecosystems. A number of wildfire risk maps for Cyprus use expert-driven indices, single-model statistical methods, and data from remote sensing. However, there is currently no standardized, high-precision Fire Risk Index (FRI) that comprehensively considers multiple risk factors and provides accurate, consistent predictions across different areas. This study introduces an innovative multi-stage machine learning framework designed to develop a comprehensive Static Fire Risk Index (FRI) for Cyprus. The methodology consists of two primary phases: the creation of four thematic sub-indices and their subsequent integration through an ensemble meta-modeling approach. More specifically, a topographic risk index was derived from derivatives of an EU Digital Elevation Model (DEM) (25 m spatial resolution), namely slope, elevation, aspect, plane curvature, and classification of landforms. A vegetation-moisture risk index was generated using multi-temporal satellite imagery from Landsat 8 and 9 to calculate the Leaf Area Index (LAI), Normalized Difference Vegetation Index (NDVI), Normalized Difference Water Index (NDWI), and Normalized Difference Moisture Index (NDMI). Fuel flammability index was assessed using a comprehensive vegetation type map, while an anthropogenic risk index included factors such as population density, proximity to roads, transmitter stations, picnic sites, power lines, and built-up regions to address human-induced fire risks. The historical fire location data from 2015 to 2024 were extracted from VIIRS sensors to facilitate the development of machine learning models. Initially, four thematic fire risk indices were generated: Fuel Flammability, Vegetation Moisture, Topography, and Anthropogenic Risk. These indices were subsequently standardized into five ordinal fire danger classes, ranging from 1 (Very Low) to 5 (Very High).


To determine the most effective integration strategy, eight distinct machine learning architectures were benchmarked: Random Forest (RF), XGBoost, LightGBM (LGBM), Decision Trees (DT), Support Vector Machines (SVM), Artificial Neural Networks (ANN), K-Nearest Neighbors (KNN), and Logistic Regression (LR). Model bias and uncertainty were assessed using cross-validation with historical fire occurrences, along with an examination of prediction residuals and spatial error patterns. The performance evaluation, which focused on accuracy (83%) and Area Under the Curve (AUC) (0.87), revealed that tree-based ensemble models (RF, XGBoost, LGBM, and DT) significantly outperformed both baseline and kernel-based algorithms. Consequently, these four top-performing models were chosen for the final fusion stage.


A "Soft Voting" ensemble method was used to combine the predictions of the chosen models. This approach involved pixel-wise averaging of fire occurrence probabilities, which effectively minimized individual model bias and improved spatial stability. The resulting continuous probability map was then reclassified into five distinct threat classes using the Jenks Natural Breaks optimization method. Validation against historical fire data demonstrated that this consensus-based methodology provides superior predictive reliability in comparison to single-algorithm models. The final Fire Risk Index (FRI) map acts as a high-resolution decision-support tool, allowing fire management authorities to prioritize resources in high-vulnerability zones through a mathematically robust and standardized classification system.

How to cite: Suresh Babu, V., Sarris, A., and Stagonas, D.: Development of an Integrated Static Fire Risk Index for Cyprus Utilizing Tree-Based Ensemble Classifiers: A Soft-Voting Approach, EGU General Assembly 2026, Vienna, Austria, 3–8 May 2026, EGU26-3053, https://doi.org/10.5194/egusphere-egu26-3053, 2026.

EGU26-3099 | ECS | Posters on site | NH7.1

Understanding the drivers of wildfires using JULES model simulations and machine learning emulators 

Limeng Zheng, Robert Parker, Zhongwei Liu, Darren Ghent, Douglas Kelley, and Chantelle Burton

Fires play a critical role in shaping ecosystems, driving biogeochemical cycles, and influencing atmospheric composition. In many regions historically affected by fire, the frequency, intensity, and size of fires have undergone rapid change in recent decades, especially in high-latitude forests. Meanwhile, wildfire extremes are now emerging across many of the world’s forests and fire-sensitive ecosystems including regions such as the Amazon, Congo, Indonesia, and the Pantanal. Many of these ecosystems have evolved with little or no fire, increasing the impacts of these fires’ potential risk of climate-driven tipping points. It is therefore essential to accurately represent wildfire dynamics within Earth system models to quantify their influence on carbon–climate feedbacks and predict ecosystem responses, including potentially rapid and irreversible ones, to environmental change.

Modelling and understanding wildfires processes remain challenging due to complex interactions among climate, vegetation, human activity, and land-use change. The Joint UK Land Environment Simulator (JULES) provides a robust framework for simulating the dynamics of terrestrial hydrology, vegetation, carbon storage, and the surface exchange of water, energy, and carbon. Complementary Machine Learning (ML) techniques allow development of model emulators, enabling large-scale data processing and quantification of model uncertainty for a comprehensive analysis of potential wildfire driving factors.

Here, we will present an ML-based emulator for the JULES-INFERNO model to: (1) Analyse and understand the key climatic drivers for wildfire, characterising recent trends (such as the size, frequency and intensity of wildfires) across JULES model simulations; and (2) Evaluate and identify the potential for monitoring early warning signals for tipping points by combining model simulations, remote sensing data and Artificial Intelligence. The analysis and evaluation will contribute to a better understanding for wildfire processes and provide comprehensive information for policy makers. 

How to cite: Zheng, L., Parker, R., Liu, Z., Ghent, D., Kelley, D., and Burton, C.: Understanding the drivers of wildfires using JULES model simulations and machine learning emulators, EGU General Assembly 2026, Vienna, Austria, 3–8 May 2026, EGU26-3099, https://doi.org/10.5194/egusphere-egu26-3099, 2026.

EGU26-3365 | Orals | NH7.1

The OroraTech Wildfire Solution: Fire Management based on the Forest Satellite Constellation 

Lukas Liesenhoff, Johanna Wahbe, Veronika Pörtge, Dmitry Rashkovetsky, Max Bereczky, Kim Feuerbacher, Korbinian Würl, Martin Langer, and Julia Gottfriedsen

Fire regimes are changing in many parts of the world, with particularly notable shifts in Europe: Regions such as Scandinavia where wildfires historically played a limited role are increasingly experiencing wildfire activity, while parts of Southern Europe face worsening conditions. These developments strengthen the need for integrated information that supports decisions across the full disaster management cycle. OroraTech has developed an end-to-end wildfire product suite that combines satellite observations, numerical modelling, machine learning and AI to support wildfire preparedness, response, and recovery.

Before a fire occurs, the platform focuses on disaster preparedness through medium-range wildfire hazard forecasting up to one week in advance. These forecasts integrate meteorological drivers, fuel characteristics, and historical fire occurrence patterns using data-driven and physics-informed approaches to identify areas of elevated hazard. In addition, scenario-based fire spread simulations allow users to explore potential fire behaviour under varying ignition locations, environmental conditions, and mitigation measures such as fire breaks, enabling proactive planning and evaluation of response strategies.

During an active fire, the system provides operational support. Near real-time active fire detection is delivered via OroraTech’s proprietary thermal infrared satellite constellation, combined with detections from more than 30 additional satellite missions to maximise temporal coverage and robustness. These observations are used to update dynamic fire spread simulations, supporting tactical decisions such as fire break placement and resource allocation. Active fire intelligence is enriched with contextual layers including land cover, topography, and short-term weather forecasts, among others.

After containment, the product suite delivers burned area mapping to support impact assessment, reporting, and recovery planning. Providing consistent pre-, during-, and post-fire products within a single platform enables a continuous and coherent view of wildfire events, supporting stakeholders across the entire wildfire lifecycle.

How to cite: Liesenhoff, L., Wahbe, J., Pörtge, V., Rashkovetsky, D., Bereczky, M., Feuerbacher, K., Würl, K., Langer, M., and Gottfriedsen, J.: The OroraTech Wildfire Solution: Fire Management based on the Forest Satellite Constellation, EGU General Assembly 2026, Vienna, Austria, 3–8 May 2026, EGU26-3365, https://doi.org/10.5194/egusphere-egu26-3365, 2026.

EGU26-3663 | ECS | Orals | NH7.1

Weakened circulation yet stronger wildfires in Western North America 

Chunyang He, Huayu Chen, and Yimin Liu

Western North America (WNA) has emerged as a global wildfire hotspot. While quasi-stationary atmospheric blocking drives persistent fire-favorable conditions, synoptic recurrent Rossby wave packets (RRWPs) represent a critical but underexplored driver of wildfire extremes. This gap is deepened by an apparent paradox that synoptic-scale circulation is projected to weaken under climate change while extreme wildfires intensify. Here we jointly analyze transient RRWPs and quasi-stationary blocking to classify extreme wildfire events in WNA. We then assess how these changing circulation patterns translate into fire risk using a novel wildfire-triggering efficiency framework powered by machine learning. Our results show that RRWPs contribute to wildfire extremes at magnitudes comparable to blocking, together explaining nearly two-thirds of events. Blocking shows only weak changes and RRWPs clearly weaken in WNA, but their wildfire-triggering efficiency is strongly enhanced by thermodynamic amplification. Under SSP5–8.5, blocking-related extreme wildfires increase by 45.9% and RRWP-related events by 37.1% by 2100. These findings establish a more complete picture of circulation controls on wildfires and identify thermodynamics as the primary driver of increasing wildfire risk in a warming future.

How to cite: He, C., Chen, H., and Liu, Y.: Weakened circulation yet stronger wildfires in Western North America, EGU General Assembly 2026, Vienna, Austria, 3–8 May 2026, EGU26-3663, https://doi.org/10.5194/egusphere-egu26-3663, 2026.

EGU26-4032 | ECS | Posters on site | NH7.1

Spatio-Temporal Projection of Forest Fire Risk in the Aegean and Mediterranean Basins of Türkiye (2026–2096) 

Cansu Aktaş and Emrah Tuncay Özdemir

The number of wildfires along the Mediterranean and Aegean coasts increases each year, impacting regional industries and ecosystems. In particular, the wildfire that occurred in Izmir, located in western Türkiye, on June 29-30, 2024, with peak temperatures exceeding 40°C and wind gusts reaching 22 m/s, spread to residential areas, resulting in the temporary closure of the city's airport and disrupting aviation operations. Therefore, predicting regional fire hazard risk based on meteorological data has become crucial, and many studies have been conducted in this area. The Canadian Fire Weather Index System (FWI) estimates forest fires based on the effect of fuel moisture and weather conditions. In this work, the risk of forest fires in Türkiye's Aegean and Mediterranean coastal regions has been estimated for future years using FWI data produced using high-resolution regional climate models supplied by the Copernicus Climate Change Service. The future years between 2026 and 2096 were compared under optimistic (RCP 2.6), moderate (RCP 4.5), and pessimistic (RCP 8.5) emission scenarios, with the 1971–2005 reference period. The results of this study showed that the number of extreme risk days (FWI > 45) increases from 50.48 days to 55.22 days (9.4% increase) under the RCP 2.6 scenario, to 57.26 days (13.4% increase) under the RCP 4.5 scenario, and to 61.71 days (22.2% increase) under the RCP 8.5 scenario when compared to the reference period. More significantly, according to the RCP 8.5 scenario, the risk level in coastal regions is estimated to reach 234.92 days annually, meaning that the risk of fires along the Aegean and Mediterranean coasts may last almost 65% of the year. In order to manage fire hazards in the Aegean and Mediterranean regions, where the risk of fire is extremely high, strategies that prioritize low-emission policies and carefully regulated tourism activitiesare crucial, as evidenced by the difference between RCP 2.6 and RCP 8.5 scenarios. The RCP 8.5 scenario also confirms that heat waves and altered precipitation patterns have increased the frequency and severity of these risks. These results indicate that the fire hazards will increase in the future, highlighting the importance of detailed information on fire risk assessment over the coastal areas of Türkiye’s Aegean and Mediterranean regions. In this context, the next phase of this study will focus on utilization of a Random Forest-based Inference Engine model to increase 12.5 km resolution of the EURO-CORDEX data to a 1 km spatial resolution in order to improve fire risk assessment. The model aims to identify non-linear wildfire risk patterns by correlating FWI components with local geographic features using an ensemble of decision trees. The proposed system is intended to operate as a Decision Support System (DSS) by automatically classifying extreme weather clusters, providing real-time resource allocation strategies.

How to cite: Aktaş, C. and Özdemir, E. T.: Spatio-Temporal Projection of Forest Fire Risk in the Aegean and Mediterranean Basins of Türkiye (2026–2096), EGU General Assembly 2026, Vienna, Austria, 3–8 May 2026, EGU26-4032, https://doi.org/10.5194/egusphere-egu26-4032, 2026.

The prevailing paradigm is that recovery of post-fire soil-hydrologic properties is dominated by pedogenic processes that drive soil structure formation, a critical process for regaining soil hydrologic functioning. The primary drivers for soil structure formation are climate and vegetation required for soil biological activity. Evidence shows that following perturbations of agricultural soils (e.g., compaction) or abrupt land use change soil structure recovery may take years to decades. In contrast, measurements from post-fire soils show that recovery of critical soil hydrologic properties (notably soil saturated hydraulic conductivity) is rapid (generally within 1 to 3 yrs) and occur at rates faster than expected from soil structure regeneration. To reconcile the rapid post-fire recovery rates, we propose a new conceptual framework for recovery of post-fire soil-hydrologic properties driven primarily by accelerated erosion of the unstable and structureless pyrolyzed surface soil layer. In this framework, initial recovery occurs not by redeveloping new structure in the pyrolyzed surface soil layer, but rather by removing it, thus exposing minimally-affected sublayers as new soil surfaces. Based on wildfire characteristics, a typical depth of pyrolyzed soil layer is estimated to be a few centimeters (<5 cm) depending on fuel load, burning times and heat transport. A tentative peak temperature of 300 C (torrefaction limit) defines the extent of loss of binding organic carbon thus creating a fragile and easily transported layer by wind or water erosion. Examples of the proposed mechanism in several Western US post-fire landscapes will be presented with discussion of various landscape geomorphic controls (topography, post-fire rainfall, ash transport and more).

How to cite: Or, D. and W. McCoy, S.: Enhanced erosion of pyrolyzed soil surfaces drives rapid recovery of post-fire landscape hydrologic functions, EGU General Assembly 2026, Vienna, Austria, 3–8 May 2026, EGU26-4293, https://doi.org/10.5194/egusphere-egu26-4293, 2026.

Wildland fire smoke transport is governed by a complex interplay between fire heat release, atmospheric boundary layer (ABL) turbulence, synoptic forcing, and terrain. Despite substantial advances in coupled fire–atmosphere modeling, the role of the ambient, evolving ABL state in controlling plume rise and transport under realistic fire conditions remains insufficiently resolved, largely due to the extreme computational demands of event-scale large-eddy simulation (LES). This study addresses this gap by conducting a high-resolution LES of the atmospheric boundary layer over complex terrain during the Mosquito Wildland Fire (California, September 2022), followed by a plume simulation whose forcing is constrained by satellite observations.

We perform a multi-domain Weather Research and Forecasting (WRF-LES) simulation spanning 24 hours (08–09 September 2022) over the Sierra Nevada, capturing the diurnal evolution of boundary-layer depth, turbulence intensity, wind shear, and regime transitions under realistic synoptic and topographic forcing. The ABL simulation is validated against four ASOS surface stations and NOAA Twin Otter airborne observations, demonstrating accurate reproduction of near-surface thermodynamics and vertical wind shear. The results reveal pronounced transitions from convective to shear–buoyancy-driven regimes, strong inversion-layer shear, terrain-modulated low-level jets, and vertically coherent turbulent structures extending several kilometers above the surface.

Using the resolved ABL state at noon local time, we then simulate the release of a buoyant plume for one hour using an active-scalar LES formulation. The plume is represented as an idealized, steady circular heat source at the ground, with surface heat flux prescribed to match satellite-derived fire radiative power (FRP) from MODIS. This approach isolates the influence of the ambient ABL on plume evolution while maintaining physically realistic forcing. Independent evaluation against MISR stereo plume-height retrievals shows strong consistency between simulated and observed plume-top heights (~3–4 km), vertical gradients, wind shear, and downstream transport pathways. Importantly, MISR plume heights reflect time-integrated plume evolution over several hours of advection, allowing meaningful comparison with the short-duration LES plume simulation.

The results demonstrate that plume rise, vertical penetration, and horizontal transport are primarily controlled by the evolving ABL structure—specifically boundary-layer depth, inversion-layer shear, turbulent kinetic energy distribution, and terrain-induced flow modulation—once the fire heat release is constrained to realistic values. Sensitivity analysis shows that while plume source size and buoyancy magnitude influence near-source behavior, ABL regime and shear dominate plume fate at kilometer scales.

This study provides one of the first event-scale demonstrations that resolving the real atmospheric boundary layer under complex terrain is a prerequisite for physically meaningful wildfire plume simulation. By combining validated ABL LES with satellite-constrained plume forcing, the work establishes a robust foundation for future fully coupled fire–atmosphere modeling and advances understanding of two-way ABL–buoyancy interactions in wildfire environments

How to cite: Bhaganaagar, K.: Using Large-eddy-simulation at event-scale to evaluate the ABL-widllandfire-plume interactions of Mosquito Wildland Fire, EGU General Assembly 2026, Vienna, Austria, 3–8 May 2026, EGU26-4562, https://doi.org/10.5194/egusphere-egu26-4562, 2026.

EGU26-4655 | ECS | Orals | NH7.1

Dry Lightning and Escalating Wildfire Risk in Northern Canada: The 2023 Extreme Fire Season and Future Projections 

Jinil Bae, Simon Wang, Jinho Yoon, and Rackhun Son

Recent wildfire extremes in northern Canada indicate a shift in lightning-driven ignition processes beyond episodic variability. This study examines the atmospheric conditions responsible for the increasing occurrence of dry lightning—cloud-to-ground lightning accompanied by negligible precipitation—across Yukon, the Northwest Territories, and Nunavut. By integrating cloud-to-ground lightning observations with ERA5 reanalysis, we identify a dominant thermodynamic configuration controlling dry-lightning frequency. Dry lightning increases most strongly when anomalously warm near-surface temperatures coincide with enhanced mid-tropospheric moisture (700–500 hPa), forming a pronounced vertical contrast. This structure supports deep convective electrification while limiting surface wetting through efficient sub-cloud evaporation. In contrast, conventional instability and wind-based indices exhibit limited explanatory power for long-term dry-lightning variability. The extreme 2023 wildfire season exemplifies this ignition-efficient configuration rather than representing a rare anomaly. Projections from the CMIP6 multi-model ensemble indicate that continued surface warming and increasing mid-tropospheric moisture will shift this thermodynamic state toward the climatological mean under future warming, particularly under high-emissions scenarios. A physically constrained regression framework suggests that dry-lightning occurrence may increase by more than 50% by the late 21st century. These findings demonstrate that northern Canada is transitioning toward a climate state in which lightning-induced wildfire ignitions are structurally favored. Accounting for evolving vertical thermodynamic conditions is therefore essential for anticipating future high-latitude wildfire risk.

Acknowledgement 
This work was funded by the Korea Meteorological Administration Research and Development Program under Grant RS-2024-00404042 and the National Research Foundation of Korea (NRF) grant funded by the Korea government (MSIT) (RS-2024-00343921). 

How to cite: Bae, J., Wang, S., Yoon, J., and Son, R.: Dry Lightning and Escalating Wildfire Risk in Northern Canada: The 2023 Extreme Fire Season and Future Projections, EGU General Assembly 2026, Vienna, Austria, 3–8 May 2026, EGU26-4655, https://doi.org/10.5194/egusphere-egu26-4655, 2026.

EGU26-4913 | ECS | Orals | NH7.1

An AI-driven approach to enhancing wildfire representation and climate feedbacks in the UVic-ESCM v2.10 

Olivier Chalifour, Julien Boussard, and Damon Matthews

Wildfire trends vary by region and are influenced by climate, vegetation, and human activity. Regional trends over the past 20 years have varied, though overall have driven a 60% increase in global wildfire carbon emissions, primarily from carbon-dense boreal forests. In addition to releasing carbon, wildfires alter surface albedo, aerosols, and vegetation dynamics, producing complex climate feedbacks. Representing patterns and quantities of burned areas across the globe is thus crucial to accurately predict future climate, but is difficult due to the nonlinear and spatially heterogeneous nature of wildfire drivers. In this work, we develop an artificial intelligence (AI)-based model to predict patterns and quantities of burned areas across the globe,  with the goal of integrating it within the University of Victoria Earth System Climate Model (UVic-ESCM v2.10). Our model consists of a deep neural network trained with a new custom, spectral-based loss function (DNN-FFTLoss). We compare it with deep neural networks trained with a mean-square error loss function (DNN-MSE) and random forests (RF), using a consistent set of climate and vegetation predictors from the UVic-ESCM v2.10.Training is performed using climate and vegetation predictors from CMIP6 simulations (1850–2100, including multiple Shared Socioeconomic Pathway (SSP) scenarios) alongside satellite-based Global Fire Emissions Database (GFED) 4 burned area observations (2001–2015). Transfer learning is then performed using the GFED4 dataset to impose observational constraints, reduce biases, and improve burned area predictions and the representation of fire-climate interactions. A comparison with the independent test year (2014) reveals that the DNN-FFTloss more accurately reproduces the spatial and seasonal variability of global burned area than the DNN-MSE and RF. However, the DNN-FFTloss still exhibits regional biases, overestimating burned area in Northern and Southern Africa and Australia and underestimating it in Europe. Nevertheless, these discrepancies are reduced relative to the other architectures. Additionally, the global cumulative density function of burned area is best captured by the DNN-FFTloss, indicating improved representation of both high- and low-burn regions. All model configurations show reduced skill temporally during the spring transition (e.g., March-April), when global Pearson correlations drop to 0.3 for the DNN-MSE model and 0.6 for the DNN-FFTloss model. Overall, the DNN-FFTloss better represents the global behaviour of wildfire burned area and will provide new insights into how climate change alters wildfire regimes and their impact on terrestrial carbon storage.

How to cite: Chalifour, O., Boussard, J., and Matthews, D.: An AI-driven approach to enhancing wildfire representation and climate feedbacks in the UVic-ESCM v2.10, EGU General Assembly 2026, Vienna, Austria, 3–8 May 2026, EGU26-4913, https://doi.org/10.5194/egusphere-egu26-4913, 2026.

EGU26-5436 | ECS | Orals | NH7.1

Quantifying the current and future likelihood of the 2022 extreme wildfires weather conditions in France with anthropogenic climatechange 

Shengling Zhu, Renaud Barbero, François Pimont, and Benjamin Renard

In 2022, southwestern France experienced an exceptional fire season, with a burned area 14 times higher than the 2006–2023 average. Here, we assess how unusual were the fire weather conditions observed during wildfires of different sizes and how anthropogenic climate change (ACC) has altered —and will further alter— the probability of fire-weather conditions associated with the top-3 largest fires in 2022 (Landiras-1: 12,552 ha; Landiras-2: 7,124 ha; La Teste-de-Buch: 5,709 ha).

To do so, we used the daily Fire Weather Index (FWI) computed from the SAFRAN reanalysis (Système d’Analyse Fournissant des Renseignements Atmosphériques à la Neige) —cross-validated with ERA5— and a nationwide fire record dataset (BDIFF, Base de Données sur les Incendies de Forêts en France: 2006–2023). Using the generalized extreme value (GEV) theory, we then quantified the rarity of FWI conditions associated with the top-3 largest fires across different spatiotemporal scales. Our results show that the rarity of those conditions generally increases with the resolution, with return periods increasing from ~6 to ~34 years, from ~22 to ~89 years and from ~6 to ~101 years when moving from the coarser to the finest spatiotemporal scale for Landiras-1, Landiras-2 and La Teste-de-Buch fires, respectively. Finally, we used four GCMs (IPSL-CM6A-LR, CanESM5, MIROC6 and NorESM2-LM) from the CMIP6 DAMIP and ScenarioMIP experiments to examine how ACC has made those FWI conditions more or less probable from 1950–2100. By 2022, ACC had at least doubled the likelihood of those FWI conditions, and will make them, by the end of the century (under SSP2-4.5), at least 10–100 times more probable, depending on the models. Our study underlines the growing influence of ACC in the risk of extreme fires in France across a range of scales.

How to cite: Zhu, S., Barbero, R., Pimont, F., and Renard, B.: Quantifying the current and future likelihood of the 2022 extreme wildfires weather conditions in France with anthropogenic climatechange, EGU General Assembly 2026, Vienna, Austria, 3–8 May 2026, EGU26-5436, https://doi.org/10.5194/egusphere-egu26-5436, 2026.

EGU26-6395 | ECS | Orals | NH7.1

Wildfire Susceptibility in Italy: High-Resolution Mapping for Power Grid Resilience 

Filippo D'Amico, Riccardo Bonanno, Elena Collino, Francesca Viterbo, and Matteo Lacavalla

The increasing number of wildfires in Italy presents a growing challenge for environmental protection and infrastructure resilience. Among the most vulnerable assets is the high-voltage transmission network: during wildfire events, in fact, overhead lines must often be preemptively deactivated to facilitate aerial and ground-based firefighting and to preserve infrastructure integrity and grid stability. This necessity creates a critical conflict between emergency response requirements and the continuity of electricity supply.

While anthropogenic activities and human negligence remain the primary drivers of ignition, the meteorological conditions leading to fire spread have worsened in recent years due to persistent summer heatwaves and prolonged droughts. To monitor and predict wildfire danger, various meteorological indices have been developed, most notably the Canadian Fire Weather Index (FWI). However, while these indices are essential for daily operational monitoring, they are inherently limited by not considering fuel availability and terrain characteristics. Consequently, high FWI values may be recorded in areas with no combustible biomass, such as urban areas, highlighting the limits of purely weather-based fire danger assessments.

To improve fire danger characterization, a susceptibility map was developed on a 100-meter resolution grid covering the entire Italian territory. To achieve this, a random forest model was trained on non-meteorological, high-resolution data using a balanced dataset constructed from areas burned between 2010 and 2023, and an equal number of randomly sampled non-fire locations. These features included land use, topography (elevation, slope, and aspect), latitude, and proximity to critical infrastructure (roads and power lines). The model demonstrated high predictive performance, achieving an accuracy of 0.95 on a 30% hold-out test sample; feature importance analysis revealed that latitude, elevation, and land-use class are the primary drivers of fire susceptibility. Finally, the model has been applied across the entire Italian Peninsula, yielding a high-resolution map of burning probability for each grid cell.

To evaluate its operational effectiveness, the susceptibility map was validated against two case studies where wildfires directly caused the deactivation of critical power lines. The results demonstrate that the map significantly refines the spatial accuracy of coarser meteorological alerts based solely on the FWI. By integrating fuel and topographic data with weather-based indices, the model successfully narrows the focus to specific high-risk segments of the grid, thereby reducing 'false alarm' areas and providing a more targeted decision-support tool for transmission system operators.

This susceptibility map provides an important foundation for a comprehensive wildfire alert system, bridging the gap between broad meteorological forecasts and local-scale infrastructure needs. By refining established weather indices with high-resolution environmental and topographic data, the model allows for a level of situational awareness compatible with the needs of power grid operators within the growing challenges of Mediterranean climate.

How to cite: D'Amico, F., Bonanno, R., Collino, E., Viterbo, F., and Lacavalla, M.: Wildfire Susceptibility in Italy: High-Resolution Mapping for Power Grid Resilience, EGU General Assembly 2026, Vienna, Austria, 3–8 May 2026, EGU26-6395, https://doi.org/10.5194/egusphere-egu26-6395, 2026.

EGU26-6513 | Orals | NH7.1

Defining confidence classes for lightning discharges igniting wildfires 

Jose V. Moris, Francisco J. Pérez-Invernón, Pablo A. Camino-Faillace, Francisco J. Gordillo-Vázquez, Nicolau Pineda, Gianni B. Pezzatti, Marco Conedera, Yanan Zhu, Jeff Lapierre, Hugh G.P. Hunt, and Sander Veraverbeke

The projected increase in lightning-ignited wildfires (LIWs) during the 21st century highlights the need to improve our understanding of the mechanisms and processes governing these natural fires. However, results from large-scale LIW studies are often limited by uncertainty in identifying the specific lightning discharge responsible for each ignition. Here, we present a simple and flexible classification system that ranks LIWs according to the level of confidence in the lightning event causing the ignition.

We first used a probabilistic index to identify the most likely lightning event igniting each wildfire. This index was combined with a set of filters based on eight criteria, including holdover time (the time between lightning-induced ignition and fire detection) and the distance between the reported lightning location and the fire ignition point, to define four confidence classes. The lowest-confidence class applied no filters and retained all lightning events selected by the probability index (one per fire). The remaining three classes applied increasingly strict filters, yielding progressively higher confidence levels. This classification framework was applied to LIWs from four study regions: Switzerland, Catalonia (Spain), California and Nevada (United States), and the whole continental United States. In addition, two LIWs with ignitions documented by video footage were used for validation.

Relative to the unfiltered class, intermediate confidence classes retain approximately one-quarter to two-thirds of lightning discharges, whereas the highest-confidence class retains only 5-20%. This reflects a trade-off between sample size and confidence. The proposed confidence classification provides an initial framework that can be further refined, and offers a way to increase the robustness of LIW analyses, thereby supporting improved investigations of the factors controlling lightning-induced wildfire ignitions.

How to cite: Moris, J. V., Pérez-Invernón, F. J., Camino-Faillace, P. A., Gordillo-Vázquez, F. J., Pineda, N., Pezzatti, G. B., Conedera, M., Zhu, Y., Lapierre, J., Hunt, H. G. P., and Veraverbeke, S.: Defining confidence classes for lightning discharges igniting wildfires, EGU General Assembly 2026, Vienna, Austria, 3–8 May 2026, EGU26-6513, https://doi.org/10.5194/egusphere-egu26-6513, 2026.

EGU26-6748 | Posters on site | NH7.1

Towards a Second-Generation Wildfire Detection and Forecasting Platform: Technical and Operational Advances in FireHUB. 

Nikolaos S. Bartsotas, Themistocles Herekakis, Valentina Kanaki, Panagiotis Zachariadis, Michail-Christos Tsoutsos, and Charalampos Kontoes

Over the past decade, the operational unit BEYOND Centre in the National Observatory of Athens (NOA) has developed and presented an advanced wildfire monitoring and forecasting framework for Greece, namely FireHub. The system is ingesting real-time Meteosat Second Generation satellite data every five minutes through NOA/BEYOND’s in-house antenna, using SEVIRI Level 1.5 infrared bands (IR 3.9 and 10.8 μm) to detect ignition points with quantified confidence. A dedicated downscaling methodology refines detections to a much finer scale (300 m) than the native SEVIRI spatial resolution of 3 km. The system is further enhanced by integrating the Firehub Fire Information System (FFIS), which combines observations from VIIRS, MODIS, and Sentinel-2, providing a more comprehensive and reliable picture of the active fire state. To address early-stage satellite artifacts caused by clouds, smoke, or extreme temperatures, NOA/BEYOND has long coupled observations with fire propagation modeling, initially through the deployment of FLAMMAP alongside real-time meteorology, fuel types, and terrain information. While this hybrid approach proved accurate and well received, it faced constraints under the rapidly growing incident volume that required overwhelming computational resources. In addition, FLAMMAP relying on a static wind field defined only at ignition, limited the realism in complex and highly variable wind environments.

Under the framework of MedEWSa project, the entire system has been re-engineered from the ground up to overcome these limitations. The new architecture runs asynchronously and concurrently on high-performance computing nodes, leveraging optimized code and open data cubes to scale efficiently. FLAMMAP has been replaced by the FOREFIRE model, which incorporates wind variability in both space and time from ignition onward. Sensitivity tests demonstrate that fully dynamic wind simulations produce fire evolutions closer to observed burned scar maps than static approaches. Extensive testing across coastal zones, urban and suburban settings, and complex terrain, using multiple propagation schemes including Rothermel, Balbi, and the newly added FARSITE, has guided the selection of an operational configuration. In peak periods, dozens of fires were handled simultaneously and each ignition triggering parallel, automated propagation forecasts for the coming hours. During the 2025 fire season, the system ran in pseudo-operational mode, allowing a full evaluation to take place against the confirmed ignition points by the Hellenic Fire Service. Further developments are currently underway such as the switch to Meteosat Third Generation, in order to utilize the 1x1-km resolution scans every 10 minutes (2.5 minutes from 2027). Real-time monitoring and fire propagation outputs are presented as overlays with critical infrastructure layers, in order to support rapid action from first responders and informed decision-making by relevant authorities. The latest state will be presented just before the system’s inaugurate fire season as the operational platform of NOA/BEYOND.

How to cite: Bartsotas, N. S., Herekakis, T., Kanaki, V., Zachariadis, P., Tsoutsos, M.-C., and Kontoes, C.: Towards a Second-Generation Wildfire Detection and Forecasting Platform: Technical and Operational Advances in FireHUB., EGU General Assembly 2026, Vienna, Austria, 3–8 May 2026, EGU26-6748, https://doi.org/10.5194/egusphere-egu26-6748, 2026.

EGU26-7424 | Orals | NH7.1

Advancing surface fuel representation for operational wildfire spread modeling at Météo-France 

Margaux Peyrot, Patrick Le Moigne, and Mélanie Rochoux

Accurately predicting wildfire behavior at geographical-to-regional scales using coupled atmosphere-fire models has the potential to enhance the operational activities of Météo-France, which provides fire danger assessment in support of the French civil protection services. Current fire danger indices primarily rely on meteorological variables and do not include an explicit representation of biomass fuels, despite the fact that extreme wildfire events often result from the combined effect of atmospheric conditions and fuel state.

In this study, we investigate how to integrate a detailed representation of surface fuels into the coupled Meso-NH/BLAZE modeling system (Lac et al., 2018; Costes et al., 2021), by taking advantage of high-resolution vegetation modeling from the SURFEX land surface system (Masson et al., 2013) and by defining fuel models for the vegetation types of the ECOCLIMAP database (Faroux et al. 2013). This study focuses on the French Mediterranean area for two main reasons: i) this is a wildfire-prone area that has experienced intense fire activity in recent years and that is projected to face increased fire danger due to climate change in the next decades (Fargeon et al. 2020); and ii) it has been monitored for several decades by the ONF (French forest services) through a dense observational network, providing extensive measurements of Live Fuel Moisture Content (LFMC).

We implement the Rothermel heterogeneous rate-of-spread (ROS) formulation (Andrews, 2018) in the coupled atmosphere-fire model associated with dynamic fuel models (Scott and Burgan, 2005), in order to represent both dead and live components of the biomass fuels, and to dynamically transfer the herbaceous fuel load from live to dead components as a function of the LFMC to reproduce seasonal curing. We thus analyze the added value of including a live component of biomass fuels and the role of the LFMC in the ROS predictions. Preliminary results indicate that accounting for the live fuel component part of fuels generally reduces the simulated ROS, as higher live fuel content tends to inhibit combustion. Moreover, simulations using dynamic fuel models propagate less extensively than non-dynamic fuel models.

Beyond the explicit modeling of fire-fuel interactions, we also examine the Fire Weather Indices (FWI) based on the Canadian approach (Van Wagner et al., 1985) and adopted by Météo-France to assess meteorological fire danger. By analyzing their relationship with simulated ROS, we aim to establish a first quantitative link between fire danger indicators and physically-based fire behavior predictions.

How to cite: Peyrot, M., Le Moigne, P., and Rochoux, M.: Advancing surface fuel representation for operational wildfire spread modeling at Météo-France, EGU General Assembly 2026, Vienna, Austria, 3–8 May 2026, EGU26-7424, https://doi.org/10.5194/egusphere-egu26-7424, 2026.

EGU26-7489 | Orals | NH7.1

Delineating Iberian pyroregions using agglomerative clustering of fire regime descriptors 

Marcos Rodrigues, Farhad Mulavizada, Fermin Alcasena, Juan Ramón Molina, Teresa Lamelas, and Juan de la Riva

Wildfire activity in the Iberian Peninsula (581,353 km²) is highly heterogeneous due to strong gradients in climate, topography, vegetation, disturbances, land use, and management. This spatial variability challenges fire modeling, risk assessment, and fuel reduction strategies across contrasting regions. Previous efforts to map fire regimes succesfully used clustering of historical or remote-sensed fire data. However, the resulting zones were often large and spatially fragmented, rendering them challenging to integrate into landscape scale stochastic wildfire modeling.

To address this, we delineated pyroregions, defined as spatial units with generally homogeneous fire regime conditions, to support subsequent fire weather characterization and the definition of modeling domains for stochastic wildfire simulations. Our objective was to generate contiguous spatial units that exhibit both similar historical fire incidence and consistent fire-weather and topographic characteristics. To achieve this, we populated subwatersheds (obtained from HydroBASINS; n = 4,409; mean area 13,391 ha) with contemporary fire regime descriptors derived from burned area and ignition records –sourced from national (AGIF for Portugal and EGIF for Spain) and European (EFFIS) databases– complemented with fuel moisture (Camprubí et al., 2022; 10.5281/zenodo.6784663) and weather data (ERA5-Land reanalysis data). Descriptors included annual ignition density, annual and summer burned area, wind direction distributions, and fuel moisture content for live woody and fine fuels in the period 2001-2024. Pyroregions were obtained via spatially constrained agglomerative clustering with Ward linkage, enforcing contiguity using a Queen connectivity matrix, which ensured that merges occurred only between adjacent subwatersheds. Following a two-step aggregation scheme, we first delineated 16 broad pyroregions representing major wildfire-regime zones and then partitioned them into 78 similarly sized subareas (pyromes; mean area 7,570 km²) for modeling applications. Finally, boundaries were refined to reduce sharp transitions associated with subwatershed geometry and to produce smoother contours. The resulting map captured transboundary similarities and contrasts in fire regimes and revealed clear structure, including altitudinal gradients and a marked Atlantic to Mediterranean contrast, with large contiguous regions over the inner mesetas and major depressions, and a near continuous coastal belt.


How to cite: Rodrigues, M., Mulavizada, F., Alcasena, F., Molina, J. R., Lamelas, T., and de la Riva, J.: Delineating Iberian pyroregions using agglomerative clustering of fire regime descriptors, EGU General Assembly 2026, Vienna, Austria, 3–8 May 2026, EGU26-7489, https://doi.org/10.5194/egusphere-egu26-7489, 2026.

EGU26-7555 | ECS | Posters on site | NH7.1

Flash Droughts and Wildfire Interactions: Influence of Detection Methods on Fire Risk and Speed Across U.S. Landscapes 

Masoud Zeraati, Hayley Fowler, Colin Manning, and Christopher White

Flash droughts are characterised by rapid soil-moisture depletion driven by elevated atmospheric evaporative demand from higher air temperatures, low humidity, stronger solar radiation and wind, especially when precipitation is limited. This heightened atmospheric evaporative demand enhances evapotranspiration, accelerates moisture depletion in the root zone and intensifies vegetation water stress. As plants dry and weaken, their flammability rises, creating a feedback loop that elevates wildfire risk during prolonged heat and drought conditions.

This study investigates the relationship between flash drought and wildfire dynamics using two commonly used methods of flash drought detection across diverse land-cover types in the continental United States. We show that the frequency and spatial patterns of flash drought and its relationship with wildfire is significantly influenced by the method used for flash drought detection. Flash drought events identified by the Standardized Evapotranspiration Stress Ratio (SESR) capture atmospheric evaporative stress, while Root Zone Soil Moisture (RZSM) reflects sustained soil drying that directly increases fuel flammability. Approximately 53% of fires occurred after flash droughts identified using SESR definition, whereas RZSM classified about 10%, with each producing different spatial footprints.

To quantify how flash drought alters fire evolution, we applied Kaplan–Meier survival analysis to time-to-burn, estimating the probability that pixels remain unburned as a function of time since ignition under flash drought and non-flash drought conditions, and used Cox proportional-hazards models to derive hazard ratios (HR), which measure the relative instantaneous burning rate under FD (HR > 1 indicating faster spread). Grasslands and croplands show the highest vulnerability to flash drought–related fires due to their fine, continuous fuels that rapidly dry and ignite, with stronger acceleration and earlier spread under RZSM identified flash droughts (HR ≈ 1.45 in grasslands, 1.33 in croplands, 1.84 in open shrublands; woody savannas ≈ 1.17), while SESR effects are small or near zero in several covers (HR ≈ 1.05 in croplands and grasslands; ≈ 0.99 in woody savannas).

We therefore recommend incorporating rapid soil-moisture drying dynamics into wildfire risk models and enhancing real-time monitoring to strengthen early warnings and fire management, especially in ecosystems prone to swift drying and ignition.

How to cite: Zeraati, M., Fowler, H., Manning, C., and White, C.: Flash Droughts and Wildfire Interactions: Influence of Detection Methods on Fire Risk and Speed Across U.S. Landscapes, EGU General Assembly 2026, Vienna, Austria, 3–8 May 2026, EGU26-7555, https://doi.org/10.5194/egusphere-egu26-7555, 2026.

EGU26-9904 | ECS | Orals | NH7.1

Lessons learnt from the application of various wildfire growth models for the environmental conditions in Central Europe 

Katrin Kuhnen, Mariana S. Andrade, Mortimer Müller, and Harald Vacik

Wildfires are an upcoming threat across Central Europe, driven by shifting climate regimes, extended drought periods, and rising temperatures. Effective fire management depends on a solid understanding of fire behavior, which creates a demand for reliable fire growth models. Fire modelling in this region poses several challenges, especially if the models were developed for different environmental regions (e.g. North America). The availability of high-resolution fuel data, fuel models and information on local fuel moisture and wind patterns - all important drivers for fire spread prediction – can cause additional difficulties in predicting fire behavior. Well-documented fire events can provide reliable information for model calibration and validation, but such case studies are scarce in Central Europe.

Therefore, this study investigates the applicability of several fire growth models (Farsite, Prometheus, SimtableTM, PhyFire) for the specific environmental conditions in Central Europe based on a set of pre-defined evaluation criteria. The selected models are applied to two well-documented fire cases to assess their ability in predicting spatial and temporal fire growth under varying environmental conditions in Central Europe. The analysis reveals differences in suitability among the models and underscores the need for region-specific calibration. Furthermore, improved data availability regarding documented fire cases and wind velocity and direction are demanded. These results help to identify the needs for an advanced wildfire growth modelling in Central Europe and supports more informed fire management decisions and training in future.

How to cite: Kuhnen, K., Andrade, M. S., Müller, M., and Vacik, H.: Lessons learnt from the application of various wildfire growth models for the environmental conditions in Central Europe, EGU General Assembly 2026, Vienna, Austria, 3–8 May 2026, EGU26-9904, https://doi.org/10.5194/egusphere-egu26-9904, 2026.

EGU26-10852 | Posters on site | NH7.1

Environmental and Operational Drivers of Vegetation Fires Along the Czech Rail Network 

Michal Bíl, Vojtech Nezval, and Richard Andrášik

Vegetation growing along railway corridors creates conditions in which fires can ignite and spread rapidly, even though steam locomotives—the historical source of many railway fires—are no longer in regular use. This study examines vegetation fires occurring near railway lines in the Czech Republic over the last 20 years, with the aim of understanding their temporal patterns, links to weather conditions, and spatial concentration. The analysis draws on detailed incident records from the national railway infrastructure manager and combines them with meteorological, geographic, and operational data to identify the factors that influence fire occurrence.

The results show that fires tend to cluster in the warmer part of the year, particularly from spring through late summer, and most often in the afternoon. Their occurrence is strongly associated with prolonged periods of elevated temperatures, limited precipitation, and low relative humidity. Logistic regression further revealed that infrastructure characteristics play a significant role: electrified lines, areas near railway stations, and sections with heavy freight traffic exhibit a markedly higher likelihood of fire. Conversely, higher elevations and greater distance from built-up areas reduce the probability of ignition.

Using the KDE+ method (https://www.kdeplus.cz), we identified more than 300 hotspots where fires repeatedly occurred, despite these locations representing only a very small fraction of the national rail network. These hotspots are typically situated in regions with warmer climates and on lines with substantial train movements. The findings indicate that even modern railway operations can generate ignition sources, such as sparks from braking systems.

Given projected increases in temperature and drought frequency due to climate change, vegetation fires along railways are likely to become more common. The identification of high‑risk segments therefore provides a valuable basis for targeted vegetation management and other preventive measures aimed at reducing the impacts of fires on railway operations and surrounding ecosystems. As part of our current research, we are developing an early‑warning system that integrates weather forecasts, fuel models, and operational data to alert railway managers to elevated fire risk in advance.

How to cite: Bíl, M., Nezval, V., and Andrášik, R.: Environmental and Operational Drivers of Vegetation Fires Along the Czech Rail Network, EGU General Assembly 2026, Vienna, Austria, 3–8 May 2026, EGU26-10852, https://doi.org/10.5194/egusphere-egu26-10852, 2026.

EGU26-11241 | Posters on site | NH7.1

Event-Based Copula Modeling of Compound Fire-Weather Extremes for Wildfire Risk Assessment 

pegah aflakian, Bruno Colavitto, Andrea Trucchia, Tatiana Ghizzoni, and Paolo Fiorucci

Wildfire impacts are increasingly driven by the joint occurrence and persistence of multiple meteorological drivers, such as atmospheric dryness and strong winds, rather than by isolated univariate extremes. Growing evidence shows that such compound conditions strongly influence wildfire characteristics, including event duration, spatial extent, and intensity, motivating the use of multivariate probabilistic frameworks for wildfire risk analysis [1,2]. Traditional approaches based on marginal extremes or linear dependence are often inadequate for representing tail dependence and joint exceedance behavior, potentially leading to biased estimates of rare but high-impact wildfire events [3,4]. 

This study develops a spatially explicit, event-based probabilistic framework for modeling wildfire-relevant meteorological drivers and derived event characteristics using copula-based dependence structures. The methodology follows a two-stage workflow. In the first stage, hourly gridded fields of a humidity-related variable and wind are transformed into per-cell daily time series, extracting daily extrema and duration metrics based on physically motivated thresholds. A combined condition identifies hours when both drivers are simultaneously active, enabling the construction of compound duration indicators. This spatially explicit, per-cell representation is consistent with established wildfire risk and susceptibility frameworks that rely on pixel-level meteorological and environmental descriptors and supports the consistent aggregation of local information into larger spatial units relevant for regional risk assessment and comparison [5]. 

In the second stage, extreme events are detected and modeled to build an event-based probabilistic dataset and generate long synthetic event catalogs. Event identification relies on return-period exceedance of annual maxima, combined with moving-window logic and minimum inter-event time constraints. Event-level descriptors, including maximum driver intensity and persistence, are used to quantify spatially aggregated impacts, consistent with prior work on joint modeling of wildfire duration and size [6,7]. Marginal distributions are fitted to event-level variables and transformed into the probability domain prior to dependence modeling, following established copula theory [3]. Multivariate dependence is then modeled using copulas, allowing synthetic events to be generated while preserving observed dependence structures among drivers and event characteristics [4,8]. 

The framework builds on recent advances in compound and multihazard analysis [1,2], copula-based frequency analysis [3], and comparative evaluations of multivariate extreme modeling strategies [9]. By exporting spatially aggregated event-impact matrices and event frequencies, the approach is designed for integration into downstream wildfire hazard and risk assessment engines. Preliminary results of a pilot implementations at regional level in Italy (Liguria, Tuscany, Marche), adopting a 40-years weather dataset (1981–2023), are shown. 


References 

 [1] Zscheischler & Fischer (2020), Weather and Climate Extremes. 
[2] Sadegh et al. (2018), Geophysical Research Letters. 
[3] Salvadori & De Michele (2004), Water Resources Research. 
[4] Bhatti & Do (2019), International Journal of Hydrogen Energy. 
[5] Trucchia et al. (2022), Fire. 
[6] Ghizzoni et al. (2010), Advances in Water Resources. 
[7] Xi et al. (2020), Stochastic Environmental Research and Risk Assessment. 
[8] Najib et al. (2022), Natural Hazards. 
[9] Tilloy et al. (2020), Natural Hazards and Earth System Sciences. 

How to cite: aflakian, P., Colavitto, B., Trucchia, A., Ghizzoni, T., and Fiorucci, P.: Event-Based Copula Modeling of Compound Fire-Weather Extremes for Wildfire Risk Assessment, EGU General Assembly 2026, Vienna, Austria, 3–8 May 2026, EGU26-11241, https://doi.org/10.5194/egusphere-egu26-11241, 2026.

EGU26-12016 | ECS | Orals | NH7.1

Global Short-term Daily Wildfire Forecasting and Predictability Attribution using a new Spatio-temporal Deep Learning Framework 

Tong Wu, Junyu Zheng, Jiashu Ye, Zhijiong Huang, Manni Zhu, Weiwen Chen, and Zhaoyang Xue

Reliable short-term wildfire forecasting is essential for early warning, timely air-quality management, and mitigating wildfire-related health impacts and economic losses. However, global prediction remains difficult because wildfire occurrence is rare and highly heterogeneous across fire regimes. The Fire Weather Index (FWI) is widely used as a benchmark, but it mainly reflects weather-driven fire danger and does not explicitly represent fuel or fire dynamics, limiting predictive accuracy. Physics-based coupled models can resolve fire–atmosphere interactions, yet they typically require prescribed ignition information and are too computationally expensive for global deployment. Data-driven methods enabled by satellite and reanalysis data offer an efficient alternative. However, many conventional ML approaches treat grid cells as independent samples, which limits learning of neighborhood interactions and multi-day preconditioning. Recent DL studies improve representation learning, but many remain regional and lack unified spatiotemporal dependency modeling. Thus, global spatiotemporal frameworks tailored to the rare and sparse nature of wildfire occurrence remain scarce.

Here we present the STA-Net, a novel global daily wildfire forecasting framework built on a harmonized multi-source dataset spanning 2013–2024. The dataset integrates meteorology, vegetation, lightning, and topography information on a unified 0.5° global grid. Through modeling of spatiotemporal dependencies and imbalance-aware training, The STA-Net learns coherent features that capture multi-day environmental preconditioning and neighborhood-driven fire evolution, which enables accurate next-day wildfire forecasts at the global scale. It also supports short-range forecasts at 1–7 day lead times, although predictive skill decreases progressively as lead time increases.

The STA-Net outperforms the FWI and representative data-driven baseline models, including XGBoost (non-spatiotemporal), LSTM (temporal-only), and 2D-CNN (spatial-only). On an independent global test set, the STA-Net achieves an AUC of 0.97 and maintains stronger discrimination than FWI across all 14 GFED fire regions. Two 2024 case studies in Bolivia and Canada further show that the STA-Net captures the spatial footprint and concentrated high-risk cores of catastrophic outbreaks, supporting event-level generalization beyond aggregate metrics. Using F1 as the primary rare-event metric, the STA-Net achieves the highest score among the data-driven baselines (F1 = 0.65). An ignition–spread–persistent (I–P–S) stratification attributes the largest improvement to spread fire, where neighborhood propagation is central, providing direct evidence for the effectiveness of the STA-Net’s spatiotemporal modeling.

Beyond forecasting, we perform predictability attribution across fire types and regions. SHAP analyses under an IPS stratification show that persistent fire prediction is dominated by prior fire states, spread fires depend on coupled fuel–environment conditions, and ignition is driven mainly by vegetation and land-surface properties with a stronger role of soil moisture. Region-aggregated attribution further indicates that FRP and NDVI are consistently influential predictors, while secondary drivers vary by region and fire regime, with meteorological controls shifting in importance and lightning density contributing more strongly in regions with frequent lightning-driven ignitions.

Overall, the STA-Net provides a high-skill and scalable approach for global short-term daily wildfire forecasting together with transparent attribution of predictive drivers, supporting wildfire risk management and emission forecasting.

How to cite: Wu, T., Zheng, J., Ye, J., Huang, Z., Zhu, M., Chen, W., and Xue, Z.: Global Short-term Daily Wildfire Forecasting and Predictability Attribution using a new Spatio-temporal Deep Learning Framework, EGU General Assembly 2026, Vienna, Austria, 3–8 May 2026, EGU26-12016, https://doi.org/10.5194/egusphere-egu26-12016, 2026.

EGU26-12302 | Posters on site | NH7.1

Short-Term Hydrometeorological Drivers of Wildfires in Italy: Insights from Extreme Value Modeling 

Marj Tonini, Farzad Ghasemiazma, Marco Turco, Andrea Trucchia, and Paolo Fiorucci

Extreme Wildfire Events (EWEs) represent a growing threat in Mediterranean regions, yet their short-term hydrometeorological drivers remain less well constrained than those of more frequent, lower-intensity fires. Improving the discrimination between extreme and non-extreme wildfire behavior is therefore essential for advancing fire prediction, early warning, and risk management. This study investigates whether EWEs differ significantly from non-extreme fires in terms of their associated dynamic meteorological, vegetation, and hydroclimatic conditions, using Italy as a national-scale case study representative of Mediterranean fire regimes.

We analyzed a high-resolution wildfire geospatial dataset from the Italian Civil Protection Department, comprising 106,620 fire events recorded between 2007 and 2022 and a total burned area of approximately 1.37 million hectares (Moris et al., 2024). Fires smaller than 1 ha were excluded. To explicitly account for the contrasting statistical behavior of extreme and non-extreme wildfires, we adopted a two-regime modeling framework: i) the bulk of the burned-area distribution was modeled using Generalized Additive Models (GAMs); ii) EWEs were characterized using an Extreme Value Theory (EVT) framework in which burned-area exceedances above high percentile-based thresholds (90th, 95th, and 99th percentiles) were modeled with a Generalized Pareto Distribution.
Our analysis is supported by the integration of data-cube technology, which enables efficient extraction of high-resolution spatiotemporal data. Meteorological, vegetation, and drought-related variables were extracted at daily and 1 km resolution from the Mesogeos dataset (Kondylatos et al., 2023). Only dynamic variables were considered, including meteorological fields from ERA5-Land; land surface temperature, Normalized Difference Vegetation Index, and Leaf Area Index from MODIS; soil moisture from the European Drought Observatory. The Standardized Precipitation Evapotranspiration Index (SPEI) was additionally included as a complementary indicator of drought conditions.

Results indicate that EWEs are governed by processes that differ fundamentally from those controlling more frequent, lower-intensity fires. By isolating the tail behavior of burned area, the EVT framework reveals the dominant influence of drought intensity, near-surface air temperature, and wind speed under rare but high-impact conditions, relationships that are largely obscured when relying solely on bulk-based models such as GAMs. These findings highlight the importance of explicitly modeling wildfire extremes and provide a robust statistical basis for improving extreme-focused fire danger assessment, early warning, and risk management in Mediterranean regions.

Moris, J. V., Gamba, R., Arca, B., Bacciu, V., Casula, M., Elia, M., Malanchini, L., Spadoni, 481 G. L., Vacchiano, G. and Ascoli, D. (2024) A geospatial dataset of wildfires in Italy, 2007- 482 2022. Technical report, Zenodo.

Kondylatos, S., Prapas, I., Camps-Valls, G. and Papoutsis, I. (2023) Mesogeos: A multi467 purpose dataset for data-driven wildfire modeling in the Mediterranean. Advances in 468 Neural Information Processing Systems 36, 50661–50676.

How to cite: Tonini, M., Ghasemiazma, F., Turco, M., Trucchia, A., and Fiorucci, P.: Short-Term Hydrometeorological Drivers of Wildfires in Italy: Insights from Extreme Value Modeling, EGU General Assembly 2026, Vienna, Austria, 3–8 May 2026, EGU26-12302, https://doi.org/10.5194/egusphere-egu26-12302, 2026.

EGU26-12564 | ECS | Orals | NH7.1

Wind variability influencing wildfires in Spain 

Nuria Pilar Plaza-Martin, Àngela Alba-Manrique, Étienne Plésiat, César Azorín-Molina, and Juli g. Pausas

Terrestrial near-surface wind speed research (NSWS, at 10 m above ground)  has largely focused on the global-scale stilling phenomenon observed over recent decades. However, much less attention has been paid to whether this phenomenon is also present in the wind regimes associated with wildfire activity. In this context, the recently reported reversal of near-surface wind trends towards increasing wind speeds introduces additional uncertainty regarding the potential impacts of wind on global wildfire regimes.

In this study, we assess the ability of commonly used reanalysis products, such as ERA5 and CERRA, to represent observed wind variability at weather stations across the Iberian Peninsula for 1984-2021. According to our results, most reanalyses fail to reproduce the trends and multidecadal variability of NSWS observed at more than 700 weather stations. In contrast, the use of a high-resolution (3-km) NSWS dataset produced using a U-Net based on partial convolutions,  trained to reconstruct the wind field from station-based wind observations, better captures these temporal trends and variability. We then analyse the wind changes observed during wildfire events in Spain over recent decades, examining their relationship with large-scale climate oscillation modes. Finally, we explore whether observed trends in wildfire-related winds are consistent with the stilling–reversal framework.

How to cite: Plaza-Martin, N. P., Alba-Manrique, À., Plésiat, É., Azorín-Molina, C., and g. Pausas, J.: Wind variability influencing wildfires in Spain, EGU General Assembly 2026, Vienna, Austria, 3–8 May 2026, EGU26-12564, https://doi.org/10.5194/egusphere-egu26-12564, 2026.

EGU26-12914 | ECS | Posters on site | NH7.1

Multiple burns affecting post-fire pollution cycling: Legacies of past charcoal production in areas affected by forest fires  

Lea Deutsch, Ankit Yadav, Robert Jackisch, Andreas Kronz, and Elisabeth Dietze

Wildfires are a hazardous concern for human health and the environment, extensively studied for fire-prone regions for decades. However, in temperate Central Europe a significant gap remains in evaluation, assessment and understanding of the effects and risks on the geoenvironment, including post-fire pollutant cycling.  The Harz Mountains in Central Germany face this environmental challenge, due to climate change, which is driving expansion of fire-prone regions and an increase in the frequency and number of wildfires. Especially since 2022, the region has experienced wildfires following natural disturbances such as bark beetle infestation, windthrow, as well as a high frequency of heat and drought events. The landscape is shaped by legacies of land use during the past millennium. Mining, smelting and wood overexploitation phases significantly altered the topography and soils leaving widespread and partly hazardous environmental legacies, suggested to interact with modern environments, though the extent of this interaction remains poorly understood. We suggest that this interplay of recent wildfires and legacies, represented by former charcoal production sites, creates diverse fire impacts on soils within a single region. On the one hand, the widespread residues of charcoal kilns persist in the soils and on the other hand, modern wildfire affected soils again.

Our study investigates the influence of the landscape legacies in recently burnt areas by analyzing 16 priority PAHs (Polycyclic aromatic hydrocarbons) listed by the U.S. Environmental Protection Agency  in a 1.3 ha site in the Harz Mountains that burnt in 2022 (Jackisch et al., 2023). Samples of organic and mineral horizons were taken in former charcoal kiln and wildfire affected sites mapped by remote sensing. Additionally, control soil profiles were sampled. All samples were analyzed using GC-MS.

We examined the influence of heat on the mineral layer through changes in mineral composition with a focus on thermal transformation of Fe (oxy)hydroxides using SEM (scanning electron microscopy) and XRD (X-ray Diffraction) measurements in mineral layers affected by charcoal production, wildfires and non-affected soils, to improve the mapping of burn severity. We find a high heterogeneity in PAH quantities and composition due to the site’s high soil and micro-relief diversity, with high-molecular weight PAHs dominating in legacy samples.  This study contributes to the discussion about post-fire PAH cycling in soils of the Harz Mountains with legacies from past charcoal production.

Jackisch, R., Putzenlechner, B., & Dietze, E. (2023). UAV data of post fire dynamics, Quesenbank, Harz, 2022 (orthomosaics, topography, point clouds) (1.0) [Data set]. Zenodo. https://doi.org/10.5281/zenodo.7554598

How to cite: Deutsch, L., Yadav, A., Jackisch, R., Kronz, A., and Dietze, E.: Multiple burns affecting post-fire pollution cycling: Legacies of past charcoal production in areas affected by forest fires , EGU General Assembly 2026, Vienna, Austria, 3–8 May 2026, EGU26-12914, https://doi.org/10.5194/egusphere-egu26-12914, 2026.

EGU26-13976 | Orals | NH7.1 | Highlight

AI for wildfire danger forecasting at different spatiotemporal scales 

Ioannis Papoutsis

Wildfire danger reflects the interaction of processes acting across a wide range of spatial and temporal scales, from rapid weather-driven variability to slower fuel, hydrological, and climate-mediated controls. This contribution examines how recent advances in artificial intelligence, when combined with structured Earth System Data Cubes, can be used to improve wildfire danger forecasts and also to better understand the mechanisms that drive their variability across scales.

We build on two complementary datacube paradigms: (i) regional, high-resolution daily cubes (e.g., Mesogeos at 1 km × 1 day over the Mediterranean) to resolve local meteorology–fuel–human interactions, and (ii) global sub-seasonal to seasonal cubes (e.g., SeasFire at 0.25° × 8-day, integrating climate, vegetation, oceanic indices, and human factors) to represent large-scale context and teleconnections.

For short lead times, we show that deep learning models that jointly exploit meteorological forcing and surface state information (e.g., vegetation condition and wetness proxies) consistently outperform operational meteorology-only approaches such as the Fire Weather Index. Importantly, explainable AI methods help diagnose which drivers dominate different fire episodes, revealing physically plausible and event-dependent controls rather than fixed empirical relationships. At subseasonal-to-seasonal horizons, predictability increasingly depends on slow-varying land-surface conditions and remote climate signals. Here, we discuss multi-scale learning approaches that fuse local predictors with coarser global fields and climate indices, enabling skillful forecasts of burned-area patterns at multi-month lead times without assuming homogeneous predictability across regions or biomes.

Finally, we argue that improved accuracy alone is insufficient for operational use. We therefore emphasize uncertainty-aware modelling, drawing on Bayesian deep learning to quantify epistemic and aleatoric uncertainties, improve forecast calibration, and support decision-making under risk through interpretable predictions accompanied by explicit confidence information.

How to cite: Papoutsis, I.: AI for wildfire danger forecasting at different spatiotemporal scales, EGU General Assembly 2026, Vienna, Austria, 3–8 May 2026, EGU26-13976, https://doi.org/10.5194/egusphere-egu26-13976, 2026.

EGU26-14026 | ECS | Posters on site | NH7.1

Evaluating region-dependent skill of seasonal Fire Weather Index forecasts in Australia 

Candice Charlton, Luiz Galizia, and Apostolos Voulgarakis

Forecasting fire danger is essential for early warning, fire management, and planning in several climate-sensitive industries. In Australia, fire regimes are highly seasonal and regionally diverse, creating a complex land-atmosphere interaction driven by extreme climate variability. This study is a preliminary investigation into the relationship between MODIS burned-area data and datasets that can act as predictors, such as seasonal Canadian Fire Weather Index (FWI) forecasts on multiple lead times from the ECMWF; coupled ocean-atmosphere climate modes – Indian Ocean Dipole (IOD) and El Niño-Southern Oscillation (ENSO); satellite-derived fuel-related variables NDVI, NBR, FAPAR at national and subnational (climate biome) scales, to inform the development of a region-adaptive forecasting framework.

Spatio-temporal correlation and spatial autocorrelation are assessed between gridded datasets, with time-series analysis focusing on lagged teleconnections and cross-correlation. In the case of the forecast-driven FWI diagnostic comparisons with reanalysis FWI is undertaken to provide context for forecast skill. These diagnostics are employed to investigate whether Australian fire regimes are governed by a dual-constraint system with a fuel-accumulation and climate-driven phase, in which antecedent fuel accumulation as well as weather triggers are the primary drivers.

The purpose of this study is to reveal the extent to which FWI’s ability to predict danger varies across biomes, highlighting the need for fuel-related inputs. Lagged analysis is used to inform the optimal temporal scale for predicting fire danger in Australia. Diagnostic comparison with reanalysis data may identify potential biases in the ECMWF forecast dataset that play a role in its relationship with burned area, further highlighting the need for a region-adaptive framework to correct for local land-mediated influences. These preliminary findings will shape ongoing research into the use of different combinations of variables by regions.


How to cite: Charlton, C., Galizia, L., and Voulgarakis, A.: Evaluating region-dependent skill of seasonal Fire Weather Index forecasts in Australia, EGU General Assembly 2026, Vienna, Austria, 3–8 May 2026, EGU26-14026, https://doi.org/10.5194/egusphere-egu26-14026, 2026.

EGU26-14044 | ECS | Orals | NH7.1

Impact of Meteorological Conditions on Post-fire Recovery of Boreal Forests across Canada 

Tiago Ermitão, Ana Russo, Ana Bastos, and Célia Gouveia

Over the past years, boreal forests of Canada have been increasingly affected by large and high-severity wildfires, with recent fire seasons recording unprecedented burned areas across the country. Alongside these extreme wildfires, the ecosystems have been forced to recover under frequent climate extreme events, including prolonged droughts and intense heatwaves, which have often occurred compounded. In this study, we propose a preliminary framework to analyse the association between meteorological conditions and their impact on post-fire recovery over three major eco-regions of Canada - Western Canada, the Great Plains, and Eastern Canada. Considering the period 2001-2025, we first estimate the post-fire vegetation recovery rates using a mono-parametric model based on the remotely-sensed Enhanced Vegetation Index (EVI). Then, we apply a Random Forest (RF) modelling approach that integrates SHAPely Additive exPlanations (SHAP), aiming to explain how seasonal meteorological variables, which include air temperature, precipitation, snow depth, and solar radiation, influence the forest recovery process.

Among the three eco-regions, the recovery model exhibits a consistently strong performance. Forests in Western Canada generally show faster post-fire recovery, contrasting with slower recovery rates observed in the Great Plains, although considerable intra-regional contrasts are found. The RF models and the associated SHAP-based results effectively identify key meteorological drivers of burned forest recovery, showing an overall good performance across the three regions. The model tends to give higher importance to variables that strongly control the growing season in boreal ecosystems, namely solar radiation and air temperature during transitional seasons, particularly in spring. In Western Canada, solar radiation and air temperature roughly constitute the most influential features on recovery, whereas in the Great Plains and Eastern Canada, autumn precipitation emerges as the primary controlling feature. Additionally, both precipitation and air temperature extremes in winter and summer frequently appear as secondary drivers of recovery rate, highlighting that climate extreme events may display an important modulating effect on post-fire recovery.

Our preliminary framework provides a novel approach to estimate the recovery rate of burned vegetation across Canada based on a time-series analysis, rather than space-for-time substitution methods. Furthermore, the application of machine-learning techniques combined with SHAP provides new insights related to seasonal and regional roles of meteorological variables in modulating post-fire vegetation recovery processes.

This work was performed under the framework of DHEFEUS project, funded by Portuguese Fundação para a Ciência e a Tecnologia (FCT) (https://doi.org/10.54499/2022.09185.PTDC).

How to cite: Ermitão, T., Russo, A., Bastos, A., and Gouveia, C.: Impact of Meteorological Conditions on Post-fire Recovery of Boreal Forests across Canada, EGU General Assembly 2026, Vienna, Austria, 3–8 May 2026, EGU26-14044, https://doi.org/10.5194/egusphere-egu26-14044, 2026.

EGU26-14322 | ECS | Posters on site | NH7.1

A hybrid modeling approach for wildfire danger assessment: combining data-driven ignition and fire spread models  

Martín Senande-Rivera, Foteini Baladima, Valerie Brosnan, Federica Guerrini, and Mirta Pinilla

Wildfire activity is influenced by a wide range of factors, meteorological, topographical, vegetation-related, and anthropogenic, making its modeling a highly complex task. In this work, we present a methodology that integrates two distinct modeling approaches within a single tool: a Machine Learning-based ignition model and a physical fire spread model. 

Outcome of our approach are event-based burn probability maps, derived by aggregating the outcomes of many fire-spread simulations initialized from stochastic ignition events generated by a Machine Learning ignition model. This model is trained on historical ignition records and integrates meteorological, vegetation, and anthropogenic variables to yield daily ignition probability maps. From each daily map, we sample stochastic ignition events and run the fire spread model for each, generating an ensemble of plausible outcomes whose aggregated footprint yields the final event‑based burn probability map. 

This combined approach enables us to address separately two critical wildfire processes: ignition and spread. Utilizing a data-driven model allows us to account for anthropogenic influences on ignition through variables such as proximity to roads, power lines, and land use. Meanwhile, the complexity of fire spread is handled by a physical propagation model that considers key factors such as fuel continuity, terrain, and processes like spotting. 

The tool is currently under development within the UNICORN project, funded by the EU Horizon Europe Programme (grant agreement No 101180172), and is being tested in the cross-border region of Northwest Spain and Northern Portugal, one of Europe’s most wildfire-prone areas. 

How to cite: Senande-Rivera, M., Baladima, F., Brosnan, V., Guerrini, F., and Pinilla, M.: A hybrid modeling approach for wildfire danger assessment: combining data-driven ignition and fire spread models , EGU General Assembly 2026, Vienna, Austria, 3–8 May 2026, EGU26-14322, https://doi.org/10.5194/egusphere-egu26-14322, 2026.

EGU26-14672 | ECS | Posters on site | NH7.1

Integrating UAV–LiDAR Fuel Data into Stochastic Cellular Automata PROPAGATOR for Crown Fire Modelling 

Andrea Trucchia, Federico Colle, Nicolò Perello, Giacomo Fagugli, Mirko D’Andrea, Flavio Taccaliti, and Paolo Fiorucci

Wildfires are an increasing threat in Mediterranean regions, where extreme fire weather and long-term fuel accumulation are driving more frequent and severe events. In this context, fast and reliable fire spread simulations are essential to support both risk mitigation planning and real-time emergency management. PROPAGATOR is a stochastic Cellular Automata (CA) wildfire spread simulator designed to generate ensemble-based fire spread forecasts. The model, currently available as both an online application and open-source software, operates within a raster-based framework in which each cell is described by static attributes (e.g. fuel type, topography) and dynamic drivers (e.g. wind, fuel moisture). Fire propagation is modelled through a stochastic contamination process between burning and unburned cells, allowing the production of probabilistic maps of fire spread, as well as statistics on rate of spread and fireline intensity. PROPAGATOR also includes the capability to simulate the spotting phenomenon and suppression actions such as water drops or firebreak construction, making it suitable for both operational decision support during active fires and pre-event risk mitigation analyses. 

A current limitation of operational applications of PROPAGATOR is its focus on surface fire propagation, with no explicit representation of vertical fuel structure or transitions to crown fire. Crown fires, however, are characterized by higher spread rates, greater energy release, and increased unpredictability, with major implications for suppression effectiveness and ecological impacts. To address this limitation, an enhanced version of PROPAGATOR has been developed by extending the model to a quasi-three-dimensional (2.5D) representation of fuels, enabling the simulation of crown fire processes within the stochastic CA framework. The proposed Crown Fire Module relies on established empirical and semi-empirical formulations for crown fire initiation and spread that are compatible with a cellular automata approach. Crown fire initiation is governed by surface fireline intensity and crown base height, while crown fire rate of spread depends primarily on canopy bulk density and fire behaviour. These mechanisms have been integrated into the propagation rules of PROPAGATOR, allowing dynamic transitions between surface and crown fire behaviour within a probabilistic modelling framework. 

The implementation of these processes requires detailed information on both surface and canopy fuel structure and characteristics, which remains challenging at operational scales. To address this issue, we investigated the use of UAV-based LiDAR remote sensing to derive key fuel structure parameters using semi-automatic algorithms available in the literature. This approach offers a balance between spatial detail and areal coverage that is suitable for operational wildfire applications. 

A pilot study conducted in the Venafro area (Molise, Italy), based on a past wildfire event with a comprehensive dataset describing fire evolution, provided high-resolution inputs to test the enhanced model. By explicitly simulating surface-to-crown fire transitions, the upgraded version of PROPAGATOR aims to improve decision support for wildfire risk management, supporting applications ranging from fuel treatment planning to operational response under extreme fire weather conditions. 

How to cite: Trucchia, A., Colle, F., Perello, N., Fagugli, G., D’Andrea, M., Taccaliti, F., and Fiorucci, P.: Integrating UAV–LiDAR Fuel Data into Stochastic Cellular Automata PROPAGATOR for Crown Fire Modelling, EGU General Assembly 2026, Vienna, Austria, 3–8 May 2026, EGU26-14672, https://doi.org/10.5194/egusphere-egu26-14672, 2026.

EGU26-14770 | Posters on site | NH7.1

Changes in the South Pacific High intensity since the mid-20th century: implications and environmental impacts in the Mediterranean and South-Central Chile 

Alvaro Gonzalez-Reyes, Manuel Suazo Alvarez, Martin Jacques-Coper, Duncan Christie Browne, and Claudio Bravo-Lechuga

The South Pacific High (SPH) plays a crucial role in shaping the climate of South America by influencing atmospheric and oceanic processes in Chile, such as upwelling, precipitation regime, and affecting the frequency of extreme climate events like heatwaves and extreme wildfires in the Mediterranean (30º-36ºS; MCh) and South-Central Chile (37º-42ºS; SCCh). Despite the relevance of SPH on the Chilean and South American climate at different time scales, its temporal Intensity changes have been partially understood to date. Here, we used monthly mean sea level pressure data from ERA5, spanning 1940 to 2024, to estimate the monthly SPH intensity (SPHI) following Barrett and Hameed (2017). We consider the annual year from January to December months, while summer is taken from the previous December to the current February, March to May as autumn, June to July as winter, and September to November as Spring. We examined annual and seasonal trends in SPHI and explored the relationships between gridded products of precipitation (Pr), minimum (Tn), and maximum temperatures (Tx) derived from the Centre for Climate and Resilience Research CR2 at 5 km. In addition, monthly surface soil moisture (SSM) from ERA5 has also analyzed with the SPHI. We computed Pearson correlations between the SPHI and the environmental variables during 1961-2024. Our findings indicate a significant increasing trend (p-value < 0.01) in the SPHI at annual and seasonal scales since 1940. In addition, Pearson correlations indicate a significant and negative relationship between SPHI and Pr and Tn at annual and all-year seasons in both sub-regions. The linkages between SPHI and Tx and SSM recorder significant and negative correlations during winter and spring in both sub-regions. Our results indicate severe changes in the SPHI on annual to seasonal scales, and also remark the strong modulation of the SPHI on Pr regime in both sub-regions. Furthermore, also reveals the relevance of the SPHI on the Tn modulation at annual and seasonal scales. Finally, relationships between SPHI and SSM in the spring are crucial to understanding, given the previous development of favourable fire conditions associated with wildfire dynamics and drought conditions in both Chilean sub-regions.

How to cite: Gonzalez-Reyes, A., Suazo Alvarez, M., Jacques-Coper, M., Christie Browne, D., and Bravo-Lechuga, C.: Changes in the South Pacific High intensity since the mid-20th century: implications and environmental impacts in the Mediterranean and South-Central Chile, EGU General Assembly 2026, Vienna, Austria, 3–8 May 2026, EGU26-14770, https://doi.org/10.5194/egusphere-egu26-14770, 2026.

EGU26-14984 | Orals | NH7.1

Event-Scale Fire Behaviour Characterization from MTG/FCI Observations and Airborne Observation 

Ronan Paugam, Gilles Parent, Jean-Baptiste Filippi, Akli Benali, Jorge Gomes, Weidong Xu, Emanuel Dutra, Martin Peter Hofmann, Julien Ruffault, Francois Pimont, François André, Damien Boulanger, Vianney Retornard, Andrea Meraner, Cyrielle Denjean, and Victor Penot

The characterization of fire behavior from observations and its coupling with plume dynamics and atmospheric composition remains a major challenge for coupled fire–atmosphere modeling systems. In this context, that is the frame work of the EUBURN initiative, this work presents recent developments in the processing and exploitation of MTG-FCI (Meteosat Third Generation - Flexible Combined Imager) observations for the derivation of fire behavior descriptors, and exercise of validation against airborne infrared measurements acquired during the SILEX experimental airborne campaign conducted in southern France in summer 2025.

A dedicated processing framework based on the Fire Event Tracker (FET) algorithm is introduced. FET performs a spatio-temporal clustering of FCI hotspot detections provided by LSA-SAF to delineate individual fire events and derive event-scale fire behavior descriptors, including fire duration, Fire Radiative Energy (FRE), and time series of Fire Radiative Power (FRP), Forward Rate of Spread (FROS), and Fire Line Intensity (FLI). During the SILEX campaign, FET was operated in Near-Real-Time (NRT) and coupled with the ForeFire–MesoNH modeling system through automated now-casting system (FireCast) to simulate plume rise and dispersion, supporting the design of flight plans for the SAFIRE ATR42 research aircraft.

This summer, FET was also made operational over Portugal in collaboration with the Portuguese civil protection authority (ANEPC), with support from the VOST association. In this operational context, FET products mainly consisted of event-scale FRP time series that were used to monitor fire activity and detect reactivation during prolonged fire episodes.
More recently, FET has been extended to a retrospective processing mode, allowing the integration of the complete 2025 LSA-SAF hotspot archive over the Mediterranean basin. This provides a unique dataset of fire behavior descriptors at the scale of fire regime zones, from which initial sub-regional analyses are presented.

To support satellite product validation and provide high-resolution fire behavior characterization, Middle Wave Infrared (MWIR) thermal cameras were operated onboard the ATR42 during SILEX. These airborne observations provide meter-scale snapshots of active fire fronts and their radiative structure, enabling the assessment of sub-pixel fire heterogeneity and radiative variability and serving as a reference for evaluating FCI-derived FRP and their linkage to FET-derived fire perimeters.

In addition, FCI-derived FRE estimates are compared with fuel consumption measurements obtained by INRAE through post-fire field sampling at the Sigean site. This comparison provides an experimental evaluation of the consistency between satellite-based radiative estimates of biomass consumption and ground-based measurements, contributing to efforts to constrain relationships between FRE, fuel properties, and consumed biomass.

Overall, this work supports the development of an integrated fire characterization framework combining satellite and airborne observations, with direct relevance for the validation of coupled fire–atmosphere modeling systems such as ForeFire–MesoNH. By jointly addressing fire behavior, plume development, aerosol emissions, and atmospheric chemistry, the EUBURN project contributes to advancing event-based wildfire representations in next-generation fire–atmosphere and air quality models.

How to cite: Paugam, R., Parent, G., Filippi, J.-B., Benali, A., Gomes, J., Xu, W., Dutra, E., Hofmann, M. P., Ruffault, J., Pimont, F., André, F., Boulanger, D., Retornard, V., Meraner, A., Denjean, C., and Penot, V.: Event-Scale Fire Behaviour Characterization from MTG/FCI Observations and Airborne Observation, EGU General Assembly 2026, Vienna, Austria, 3–8 May 2026, EGU26-14984, https://doi.org/10.5194/egusphere-egu26-14984, 2026.

EGU26-15094 | Orals | NH7.1

Wildfires and Weather Variability in South-Central Chile 

Martín Jacques-Coper, Natalia Ruiz, Manuel Suazo-Alvarez, Christian Segura, Catalina Mendiburo, Matías Pérez, Alvaro González-Reyes, Francisco de la Barrera, and Andrés Holz

The wildfire regime in South-Central Chile (SCC, 30º to 44ºS) has changed in recent decades due to changes in land use, climate conditions, and characteristics of weather extreme events. While during 1976-2016, the mean annual burned area was ~54,000 ha, during the last decade a sequence of seasons multiplied that value, in particular 2016-2017 with 570,000 ha and 2022-2023 with 450,000 ha. To the north of this region, the fire regime is fuel-limited (e.g. amount and connectivity of biomass), while to the south, it is primarily climate-limited (i.e. plenty of wet fuels). In contrast to all other Mediterranean regions worldwide, SCC has a very low rate of natural ignitions (<1% of wildfires), whereas 99% of fires are caused by humans. In SCC, large-scale plantations of flammable exotic species and invasive trees and shrubs have modified the fuel structure particularly since the mid-1970s, leading to an increase in fire risk. Within this context and beyond climate variability, in this work we unveil crucial aspects on the relationship between wildfires and weather variability in SCC. 

As a first task, we identify weather patterns associated with relatively large wildfires (>520 ha, N~800) within 7 SCC sub-regions, previously delimited according to climate, topography, and land use. Using historical wildfire records (including start date, duration, and burned area) from the National Forestry Corporation (CONAF) spanning 1984-2025, we describe the mean local 15-days evolution of weather conditions centered on the start dates of wildfires. For this, we use daily ERA5 data, including maximum temperature, minimum specific humidity, mean sea-level pressure, and maximum surface wind intensity. Furthermore, within each subregion, a cluster analysis reveals distinct mean weather sequences and typical thresholds for these variables related to wildfires. While subtle weather variability is detected in the northern part of SCC, for the southern part of SCC our analysis reveals the relevance of mid-latitud synoptic variability–in particular blocking patterns induced by migratory anticyclones–, as well as associated mesoscale phenomena, especially coastal lows and foehn wind systems. Moreover, prominent differences in wildfire characteristics are found between distinct extreme weather events, such as heat waves and single hot days.

As a second task, we explore the intra-seasonal evolution leading to selected weather patterns associated with wildfires in SCC. We find groups of events that reveal different sequences of significant mid-latitude and tropical circulation anomalies up to 14 days before the wildfire start dates. For each group, we show that the corresponding weather-fire relationship is in fact mediated by a distinct trajectory of the Fire Weather Index (FWI). Finally, we suggest a scheme based on the Madden-Julian Oscillation (MJO) index and the Standardized Extra-Tropical Index (sETI) to monitor intra-seasonal atmospheric teleconnections favoring weather fire in SCC.

How to cite: Jacques-Coper, M., Ruiz, N., Suazo-Alvarez, M., Segura, C., Mendiburo, C., Pérez, M., González-Reyes, A., de la Barrera, F., and Holz, A.: Wildfires and Weather Variability in South-Central Chile, EGU General Assembly 2026, Vienna, Austria, 3–8 May 2026, EGU26-15094, https://doi.org/10.5194/egusphere-egu26-15094, 2026.

EGU26-15326 | ECS | Orals | NH7.1

The effect of global warming on forest fires in Canada 

Daniel Garduno, Andrew Weaver, Cynthia Whaley, Carsten Abraham, and Stanley Netherton

The Canadian Fire Weather Index (CFWI) system is a wildfire risk evaluation tool used in several countries. This index estimates fire intensity based on meteorological variables. We use the CFWI framework to investigate how global warming will impact the risk of forest fires in Canada. We calculate the CFWI indices in equilibrium 5000-year integrations of the Canadian Earth system model (CanESM5) with different prescribed atmospheric CO2 levels (pre-industrial to 4x pre-industrial). We find that higher atmospheric CO2 levels lead to higher fire weather index (FWI) values and longer fire seasons across Canada. The yearly maximum FWI values also tend to increase with CO2, suggesting that global warming will raise the risk of extreme wildfire. The FWI  increase is mainly driven by temperature: higher CO2 levels and temperatures lead to more efficient and sustained drying periods, resulting in more flammable, drier fuel for forest fires. However, more CO2 in the atmosphere also leads to more precipitation, higher relative humidity, and slower wind speeds, resulting in regional differences in the response of CFWI to changes in CO2. We further conduct a regional analysis of fire indices to examine how global warming will impact Canada at the provincial level. This model-based information will be useful to evaluate the risk of wildfire across Canada in the future, and a similar analysis could be applied in other world regions.

How to cite: Garduno, D., Weaver, A., Whaley, C., Abraham, C., and Netherton, S.: The effect of global warming on forest fires in Canada, EGU General Assembly 2026, Vienna, Austria, 3–8 May 2026, EGU26-15326, https://doi.org/10.5194/egusphere-egu26-15326, 2026.

EGU26-16366 | Orals | NH7.1

Forest fire damage assessment using Sentinel-1 dual-polarimetric SAR data 

Anam Sabir and Unmesh Khati

Forest fires are emerging as an increasingly severe threat to terrestrial ecosystems worldwide, with a reported 246% increase in fire occurrences across the western United States over the past decade. This rapid escalation highlights the urgent need for robust, objective, and scalable forest monitoring approaches capable of detecting fire disturbances in a timely manner. Synthetic aperture radar (SAR), with its all-weather, day-and-night imaging capability, offers significant advantages for operational forest monitoring, particularly in fire-prone regions. In this study, we employ Sentinel-1 C-band SAR data to monitor forest dynamics and map fire-affected areas, with a specific application to the 2025 California forest fires. Sentinel-1 Single Look Complex (SLC) data acquired between 19 June 2024 and 16 June 2025 were processed using the InSAR Scientific Computing Environment (ISCE). The SLC data was used to derive gamma-nought backscatter, alpha angle, and entropy. A statistical change detection framework based on the cumulative sum (CuSUM) method was implemented to identify the timing of fire-induced disturbances. For each pixel, residuals were computed as deviations from the temporal mean, and their cumulative sums were tracked over time. Abrupt shifts exceeding a predefined threshold were interpreted as change events, with the corresponding acquisition dates assigned as pixel-wise change dates. The threshold was adapted to scene-specific characteristics to mitigate false alarms arising from seasonal variability. The algorithm was applied to multitemporal stacks of SAR backscatter, α (alpha) scattering angle, and entropy, producing raster products in which pixel values represent estimated disturbance dates. Validation was conducted using independent vector-based building damage data derived from CALFIRE and compiled by Environmental Systems Research Institute, Inc. (ESRI) for the January 2025 California fires. A comprehensive accuracy assessment was performed by comparing SAR-derived fire-affected areas with the reference data. The results demonstrate that SAR-derived polarimetric parameters provide complementary information for detecting fire disturbances, with VH backscatter yielding the highest agreement (precision: 0.7, F1 score: 0.4) with reference data. Overall, this study presents an efficient and scalable SAR-based framework for near-real-time mapping of forest fire-affected areas, supporting timely disaster response and contributing to sustainable forest management and risk mitigation strategies.

How to cite: Sabir, A. and Khati, U.: Forest fire damage assessment using Sentinel-1 dual-polarimetric SAR data, EGU General Assembly 2026, Vienna, Austria, 3–8 May 2026, EGU26-16366, https://doi.org/10.5194/egusphere-egu26-16366, 2026.

EGU26-16930 | ECS | Posters on site | NH7.1

Global Monitoring of Post-Fire Forest Recovery Using Satellite-Derived Vegetation Indicators 

Jakob Everke, Ruxandra-Maria Zotta, Nicolas Bader, and Wouter Dorigo

Wildfires pose a major threat to forest ecosystems worldwide, leading to substantial losses in ecosystem services. Since forests play a critical role in climate change mitigation and climate regulation, quantifying the rate and completeness of post-fire recovery is essential for assessing long-term ecosystem functionality. However, robust approaches to characterize the timing and trajectories of functional recovery after fire remain limited, particularly at large spatial and temporal scales.
Satellite remote sensing provides a unique opportunity to address this challenge by enabling globally consistent, long-term monitoring of post-fire vegetation dynamics across different land cover types, complementing the limited spatial and temporal coverage of ground-based observations. Based on the Fire Climate Change Initiative (Fire CCI) dataset, fire events are identified globally and used to define the spatial and temporal framework for the analysis. For each fire event, post-fire recovery trajectories are constructed from satellite-derived vegetation indicators capturing complementary aspects of forest condition and ecosystem functioning, including vegetation greenness (NDVI, EVI), canopy structure (LAI), and photosynthetic activity (FPAR). 
These recovery trajectories allow post-fire recovery rates and relative recovery levels to be quantified and compared across land cover types at the global scale, revealing spatial differences and variability in recovery dynamics. The framework thus provides a scalable approach to assess long-term changes in forest ecosystem functionality following wildfires and to evaluate how post-fire recovery dynamics vary across land cover types and over time.

How to cite: Everke, J., Zotta, R.-M., Bader, N., and Dorigo, W.: Global Monitoring of Post-Fire Forest Recovery Using Satellite-Derived Vegetation Indicators, EGU General Assembly 2026, Vienna, Austria, 3–8 May 2026, EGU26-16930, https://doi.org/10.5194/egusphere-egu26-16930, 2026.

EGU26-19149 | Posters on site | NH7.1

Modeling fire occurrence and tree mortality in Belgium for the 21st century using downscaled CMIP6 climate simulations 

Nicolas Ghilain, Louis Francois, Benjamin Lecart, Thomas Dethinne, Francois Jonard, and Xavier Fettweis

Climate change is expected to significantly alter regional fire regimes and forest vulnerability in temperate regions, including western Europe. In Belgium, wildfires have historically been relatively rare, but recent regional studies show a potential threat to population due to an increase of fire-prone climate conditions (Cerac, 2025). In this study, we assess future fire occurrence and tree mortality in Belgium over the 21st century using high-resolution, downscaled climate projections from the CMIP6 ensemble. Daily temperature, radiation, precipitation, humidity, and wind fields are dynamically downscaled by the regional climate model MAR (Grailet et al, 2025) to drive the dynamical vegetation model CARAIB (Verma et al, 2025) to derive occurrence of vegetation ignition and tree mortality for selected widespread species in Belgium. The simulations are performed for multiple baseline emission scenarios from IPCC (SSP2-4.5, SSP3-7.0 and SSP 5-8.5).

We show the main behavior of fire ignition occurrence and tree mortality obtained from the modeling exercise, first with a verification of the capabilities on the past period (1980-2025) when possible, and then with the future modelled trends (till 2100), especially in relation with the increase in the frequency and duration of summer drought periods and of the compound heat-dry events. Limitations of this exercise will be discussed to frame our future work.

This work provides one of the first climate-driven assessment of future fire risk and forest mortality for Belgium in the wake of the national climate downscaling experiment Cordex.Be2 (https://cordex.meteo.be/). It highlights emerging threats to temperate belgian forest ecosystems and offers a frame for quantitative information to support long-term forest management and adaptation strategies.

Cerac (2025): https://www.cerac.be/sites/default/files/media/files/2025-02/rpt_wildfire_risks_in_belgium_20250228_cerac_ngi_en_v2.0.pdf

Verma et al (2025): https://www.sciencedirect.com/science/article/pii/S0301479725003056

Grailet et al (2025): https://gmd.copernicus.org/articles/18/1965/2025/

How to cite: Ghilain, N., Francois, L., Lecart, B., Dethinne, T., Jonard, F., and Fettweis, X.: Modeling fire occurrence and tree mortality in Belgium for the 21st century using downscaled CMIP6 climate simulations, EGU General Assembly 2026, Vienna, Austria, 3–8 May 2026, EGU26-19149, https://doi.org/10.5194/egusphere-egu26-19149, 2026.

EGU26-19978 | Posters on site | NH7.1

Projected changes in fire weather across South Asia using CMIP6 models under multiple emission scenarios  

Jonathan Eden, Zarmina Zahoor, Bastien Dieppois, and Matthew Blackett

The frequency and severity of wildfires are increasing, with damaging effects on infrastructure, human populations and ecosystems. To inform risk mitigation planning, climate change projections are essential for assessing future trends in fire weather - meteorological conditions conducive to wildfire ignition and spread - and subsequently for identifying areas likely to face heightened wildfire risk in the future. This is particularly important in regions where wildfires are emerging as a notable threat in areas not historically considered fire-prone. One such example is South Asia, a region home to two billion people and already facing significant challenges associated with climate and environmental change. 

Here, we examine how fire weather is likely to respond to a changing climate in South Asia. We first evaluate the ability of 14 state-of-the-art Earth System Model (ESM) ensembles from the sixth phase of the Coupled Model Intercomparison Project (CMIP6) to realistically represent observed mean, variance, and spatial variability statistics in the Fire Weather Index (FWI), using the ERA-driven global fire danger reanalysis as a reference. Those ESMs demonstrating an acceptable performance are used to quantify changes in the characteristics of a series of FWI-derived annual indicators throughout the 21st century under four emissions scenarios defined by the Shared Socioeconomic Pathways (SSPs). These projections are also analysed in relation to Land Use and Land Cover (LULC) classifications for each scenario. We find that seasonal means and annual maxima of FWI are projected to increase by up to 10% by the end of the century under the highest emissions scenario, while the incidence of extreme fire weather may rise by as much as 20 days per year under SSP5-8.5. Regarding projected changes across different LULC types, our results reveal significant positive trends in FWI metrics over forest and grassland areas under all SSP scenarios. 

Overall, our findings contribute to a better understanding of future fire weather in a region historically unprepared for wildfire threats. We conclude by discussing the implications of these results for a range of stakeholders and their potential to enhance planning and preparedness at national and regional scales across South Asia, supporting the development of long-term mitigation and adaptation strategies. 

How to cite: Eden, J., Zahoor, Z., Dieppois, B., and Blackett, M.: Projected changes in fire weather across South Asia using CMIP6 models under multiple emission scenarios , EGU General Assembly 2026, Vienna, Austria, 3–8 May 2026, EGU26-19978, https://doi.org/10.5194/egusphere-egu26-19978, 2026.

EGU26-20063 | ECS | Orals | NH7.1

Characterizing wildfire dynamics in steep terrain: a canyon fire field experiment 

Mario Miguel Valero Pérez, Craig B Clements, Andrew Klofas, Christopher C Giesige, Eric Goldbeck-Dimon, Salini Manoj Santhi, Thijs Stockmans, Jackson Yip, Maritza Arreola Amaya, and Paula Olivera Prieto

Wildfire dynamics are a highly coupled system depending on not only wildland fuel characteristics but also on topography and weather. Steep terrain features like canyons have been widely reported to produce significant effects on wildfire dynamics, such as sudden fire accelerations. However, these effects are poorly studied and not correctly captured in current models. Furthermore, observational data of wildfire dynamics in steep terrain is extremely scarce. In this work, we will present the study design and preliminary results from a canyon fire field experiment conducted in California (USA) in October 2022. The experiment was set up so that a high-intensity head fire was started and allowed to spread freely up a canyon of approximately 1 km in length and 300 m in elevation difference. The vegetation primarily consisted of chaparral shrubs. Fire dynamics were monitored using airborne multispectral infrared sensors. Vegetation was characterized before and after the burn through airborne lidar scans. Additionally, fire-weather interactions were investigated leveraging Doppler lidar and radar sensors as well as in-situ micrometeorological towers. A fire eruption was observed when the fire entered the canyon, providing evidence of terrain-induced modifications to fire behavior. Datasets like this one are key to study the complex interactions between fire dynamics, vegetation properties, terrain characteristics, and weather dynamics, and constitute an important resource for model development and validation.

Acknowledgements: This work was supported by the U.S. National Science Foundation (NSF) under award number 2053619, the NSF-IUCRC Wildfire Interdisciplinary Research Center, and the EU COST Action NERO (CA22164). The authors also thank the California Department of Forestry and Fire Protection (CAL FIRE) for coordinating the field experiment.

How to cite: Valero Pérez, M. M., Clements, C. B., Klofas, A., Giesige, C. C., Goldbeck-Dimon, E., Manoj Santhi, S., Stockmans, T., Yip, J., Arreola Amaya, M., and Olivera Prieto, P.: Characterizing wildfire dynamics in steep terrain: a canyon fire field experiment, EGU General Assembly 2026, Vienna, Austria, 3–8 May 2026, EGU26-20063, https://doi.org/10.5194/egusphere-egu26-20063, 2026.

EGU26-20076 | Posters on site | NH7.1

Comparative wildfire susceptibility modelling in heterogeneous terrains 

Boglárka Bertalan-Balázs, László Bertalan, Jesús Rodrigo Comino, Szabolcs Balogh, and Dávid Abriha

As wildfire frequency and intensity escalate globally due to climate change, the development of robust, scalable predictive models becomes critical for effective disaster risk reduction. This research evaluates the adaptability of the Spatio-Temporal Google Earth Engine (STGEE) framework, originally designed for soil erosion modelling, to generate Wildfire Susceptibility Indices (WSI) across morphologically contrasting environments. The study focuses on two distinct sample areas: the rugged, mountainous terrain of Los Guájares, Spain, and the flat, homogeneous landscape of Hortobágy National Park, Hungary.

The methodology employs a Machine Learning (ML) approach within the cloud-computing environment of Google Earth Engine (GEE). A key innovation of this study is the adaptive selection of mapping units based on geomorphological characteristics. For the mountainous Spanish region, Slope Units (SUs) bounded by drainage and divide lines are utilized to capture topographic effects such as wind patterns and fire acceleration. Conversely, a pixel-based approach (30m * 30m) is applied to the Hungarian plain to address the relative topographic homogeneity.

The modelling process integrates a dual-component database. The inventory dataset comprises historical fire extents derived from Landsat and Sentinel-2 (MSI) products, paired with randomly sampled pseudo-absences. These are correlated with a suite of multi-source environmental conditioning factors, including topographic metrics (elevation, slope, aspect, TWI), vegetation and fuel proxies (NDVI, EVI), hydrological status (MNDWI), climatic variables (LST, precipitation, wind speed), and anthropogenic drivers (distance to roads and settlements).

Predictive modelling is performed using the Random Forest (RF) ensemble algorithm, selected for its capacity to handle non-linear interactions and multi-collinearity. To ensure model robustness and mitigate spatial autocorrelation, performance is validated using Spatial K-fold Cross-Validation. Model accuracy is assessed via the Area Under the Receiver Operating Characteristic Curve (AUROC), while Variable Importance Measurement (VIM) based on Gini Impurity is used to identify dominant fire drivers.

Preliminary hypotheses suggest that susceptibility in Los Guájares is primarily driven by topographic factors, specifically slope and aspect, whereas the Hortobágy model is expected to show higher sensitivity to vegetation moisture content and anthropogenic proximity. By successfully applying a unified methodology to heterogeneous terrains, this research aims to demonstrate the versatility of the STGEE framework in supporting targeted fire prevention strategies across diverse landscape types.

---

This research was funded by the Vicerrectorado de Investigación (University of Granada) with the Plan Propio PP2022.PP-12 on the “Caracterización de propiedades clave en la relación agua-suelo para el estudio de la influencia del fuego en el balance hídrico y el carbono para el planteamiento de estrategias de restauración”. Also, it is based on work funded by COST Action (grant no. FIRElinks CA18135), supported by COST (European Cooperation in Science and Technology).

How to cite: Bertalan-Balázs, B., Bertalan, L., Rodrigo Comino, J., Balogh, S., and Abriha, D.: Comparative wildfire susceptibility modelling in heterogeneous terrains, EGU General Assembly 2026, Vienna, Austria, 3–8 May 2026, EGU26-20076, https://doi.org/10.5194/egusphere-egu26-20076, 2026.

EGU26-20218 | ECS | Orals | NH7.1

Validating expert-based fuel model by field observations and simulations  

Mariana Silva Andrade, Katrin Kuhnen, Mortimer M. Müller, and Harald Vacik

Accurate fuel model mapping is essential for supporting the prediction of forest fire ignition and fire propagation. Although standardized fuel model classifications are widely applied in fire sciences, their performance is often limited when evaluated against field observations, largely due to the high variability within the different fuel categories. Especially in Central Europe there are less experiences with the application of different fuel model classification due to the lack of experiences in the predicting fire behavior under the specific environmental conditions and the lower number of larger fire events. This study addresses these needs by proposing a validation framework to ensure that fuel models assigned to a certain forest patch or landscape allow to represent real-world fire behavior. 

To develop the fuel model map for this study, experts combined field measurements on fuel loads with the results of the interpretation of aerial imagery to classify fuels, assigning classes for each 10x10m pixel according to the Scott and Burgan (2005) fuel models based on their interpretation. The proposed validation framework of the fuel model map for this study integrates observed field data from forest fires and prescribed burns in the past to estimate selected fire behavior parameters, such as flame length and rate of spread (ROS). These field observations serve as a ground truth to evaluate the accuracy of a developed customized fuel map using expert-based knowledge. Additionally, we simulate fire behavior with the BehavePlus package for the expert-assigned fuel models, to determine if the simulated parameters match the observed field data, thereby validating whether the fuel model assigned to a given area is both appropriate and provides physically realistic fire behavior. Furthermore, we utilize the Rothermel R package, which implements the mathematical equations of the Rothermel (1972) fire spread model, to reverse-analyze field data and identify the most probable fuel model for a given condition. In a next step, we compare the fuel models suggested by the algorithmic with the fuel models assigned by the expert judgments and the fire behavior parameters derived from BehavePlus. 

The results of this study show that customized fuel models based on expert knowledge outperform standardized fuel classifications in representing real-world fire behavior. Reverse fitting of field data using the Rothermel’s model is likely to show differences between algorithmically derived parameters and expert-assigned fuel models, particularly in complex and heterogeneous landscapes. Overall, the integration of field observations with expert-based fuel modeling is expected to reduce uncertainty in fire behavior simulations by: i) comparing simulated fire behavior parameters to field observations; and ii) using the Rothermel R package to validate expert-assigned fuel models, diagnose mismatches and refine fuel assignments. 

How to cite: Silva Andrade, M., Kuhnen, K., M. Müller, M., and Vacik, H.: Validating expert-based fuel model by field observations and simulations , EGU General Assembly 2026, Vienna, Austria, 3–8 May 2026, EGU26-20218, https://doi.org/10.5194/egusphere-egu26-20218, 2026.

In this contribution, we present a Lagrangean approach to forest fire modelling. The fire perimeter is represented by a three-dimensional discrete curve on a surface. Our mathematical model is based on empirical fire spread laws influenced by the fuel properties, wind, terrain slope, and shape of the fire perimeter with respect to the topography (geodesic and normal curvatures). The motion of the fire perimeter is governed by the intrinsic advection-diffusion equation. 
To obtain the numerical solution, we employ the semi-implicit scheme to discretize the curvature term. For the advection term, we use the so-called inflow-implicit/outflow-explicit approach combined with the implicit upwind scheme. A fast treatment of topological changes (splitting and merging of the curves) is also incorporated and briefly described .
The propagation model is applied to artificial and real-world experiments. To adapt our model to wildfire conditions, we tune the model parameters using the Hausdorff distance as a criterion. Using data assimilation, we estimate the normal velocity of the fire front (rate of spread), the dominant wind direction and selected model parameters.

How to cite: Ambroz, M. and Mikula, K.: Forest fire propagation modelling by evolving curves on topography incorporating data assimilation, EGU General Assembly 2026, Vienna, Austria, 3–8 May 2026, EGU26-20807, https://doi.org/10.5194/egusphere-egu26-20807, 2026.

Mediterranean ecosystems are increasingly exposed to frequent and high-severity wildfires, driven by rising temperatures, prolonged droughts, and land-use change, making wildfire one of the dominant disturbance agents shaping forest structure and function. There is a concern that frequent and high-severity wildfires may threaten the resilience of forests, even in fire-prone forest ecosystems, and their ability to recover to pre-fire levels. This has implications for carbon storage, biodiversity conservation, water regulation, and the long-term provision of ecosystem services on which both local communities and broader society depend. The availability of long-term multispectral satellite time series has demonstrated the ability to estimate the instantaneous impact of fires on forests and the recovery trajectories. Yet, spectral recovery is two-dimensional and does not necessarily mean functional, structural or compositional recovery which may be slower than simply tracking the greenness index trajectories. GEDI lidar metric display a larger variety of fire responses that spectral metrics but are only available since 2019. This study combines structural GEDI metrics with a Landsat-based historical forest disturbance to estimate the structural recovery of forests post fire in Greece from the 1985. Overall, we find post-fire vegetation recovery in Greece, using GEDI biomass, height, canopy cover, and foliage height density, likely takes 50 or more years. Low-intensity and small spatial scale fires recover within the first 20-30 years, while high-intensity and large fires show forest recovery likely >50 years. There is also some evidence of a lack of recovery trajectory or a new ecosystem state within the first 40 years for some regions. This work demonstrates how integrating lidar with long-term spectral archives can provide regional scale post-fire structural recovery assessments, can provide critical information to constrain terrestrial biosphere models predicting fire impacts and forest recovery, and can begin providing more targeted data locally to regionally for fire management, restoration practices and climate mitigation.

How to cite: Antonarakis, A.: Long-term Structural Recovery of Wildfire-affected Forests in Greece using GEDI and Landsat, EGU General Assembly 2026, Vienna, Austria, 3–8 May 2026, EGU26-21174, https://doi.org/10.5194/egusphere-egu26-21174, 2026.

Wildfires initiate a hazard chain that significantly alters landscapes and geohydrological processes. In addition to the extensively documented effects on vegetation, soil erosion, and debris flows, steep and rocky terrains may experience delayed yet persistent slope instabilities. However, post-wildfire hazard assessment frameworks still predominantly use the soil burn severity indicators for any type of mass wasting processes, while the response of rock masses and their contribution to post-fire hazards remain underrepresented.
This study addresses this gap by proposing an integrated, rapid assessment approach to evaluate post-wildfire rock slope instability. The motivation of this study is the necessity of cost-effective and timely tools that support emergency response and short- to medium-term risk management in mountainous Mediterranean environments where infrastructure, settlements, and transportation corridors are exposed to post-fire hazards.
The proposed methodology combines Sentinel-2 Level-2A multispectral imagery with field-based observations. Burn severity was mapped using the differenced Normalized Burn Ratio (dNBR), and field surveys were conducted to validate spectral classifications and to identify fire-induced rock degradation indicators. In contrast to conventional soil burn severity observations, special attention was given to rock-specific responses. The rock burn severity indicators were semi-quantitatively evaluated and integrated within a GIS-based framework to identify potential slope sectors with increased rockfall susceptibility.
Results show that wildfire-induced thermal alteration can significantly weaken carbonate rock surfaces and discontinuities without necessarily leading to rapid slope failures. Wildfire functions as a conditioning mechanism that elevates the susceptibility of rock slopes to subsequent triggers, including rainfall infiltration, runoff concentration, and solar radiation cycles. 
The study emphasizes the importance of incorporating rock-specific burn severity indicators into post-wildfire rock slope stability assessments. Such an approach supports more comprehensive risk inventories and improves prioritization of mitigation and monitoring strategies. The findings contribute to ongoing efforts to integrate field observations and remote sensing.

How to cite: Kadakci Koca, T.: Assessing Wildfire-Induced Changes in Rock Slopes Using Field Observations and Satellite Data, EGU General Assembly 2026, Vienna, Austria, 3–8 May 2026, EGU26-21604, https://doi.org/10.5194/egusphere-egu26-21604, 2026.

EGU26-21833 | ECS | Posters on site | NH7.1

Using Synthetic Controls to Evaluate Wildfire Policy Impacts: Evidence from Madia’s Law in Italy 

Judith A. Kirschner, Johannes Kirschner, Davide Ascoli, Jose V. Moris, George Boustras, and Gian Luca Spadoni

Wildfire policies commonly define agency responsibility for wildfire management, but policy effectiveness is difficult to evaluate because of multiple interacting factors. Our research aims to determine (1) if synthetic control estimations can serve as a data-driven approach to assess effects of wildfire policy interventions, and (2) if the wildfire regime in Italy has been altered in response to a policy intervention (Madia’s law) that in 2017 imposed changes in the wildfire management system in most regions. Using a control pool of European countries, and with and without consideration of fire weather, we demonstrate that synthetic control estimations can be a suitable approach to model counterfactual trends in fire activity following a policy intervention. In Italy, models suggest the attribution of higher burned area and average fire size in the first year after Madia’s Law policy intervention was effective, though the effect appears to a varying degree across regions. We conclude that synthetic control estimations can form a valuable complement to expert-based assessments of wildfire policies in a range of flammable landscapes, although challenges remain due to complex interacting factors.

How to cite: Kirschner, J. A., Kirschner, J., Ascoli, D., Moris, J. V., Boustras, G., and Spadoni, G. L.: Using Synthetic Controls to Evaluate Wildfire Policy Impacts: Evidence from Madia’s Law in Italy, EGU General Assembly 2026, Vienna, Austria, 3–8 May 2026, EGU26-21833, https://doi.org/10.5194/egusphere-egu26-21833, 2026.

EGU26-696 | ECS | Posters on site | AS2.2

Multivariate driver analysis and moisture attribution of the December 2023 Tuticorin floods 

Nikhil Ghodichore and Vinnarasi Rajendran

Between 17th -18th December 2023, Tuticorin district and adjoining regions in Southern India experienced an exceptional extreme precipitation event, receiving approximately 950 millimetres of rainfall within 24 hours, leading to severe inundation and extensive losses to agriculture and infrastructure. The fact that the amount of rainfall received on a single day exceeded the average annual rainfall over Tuticorin makes this event particularly noteworthy. This study investigates the hydrological and meteorological drivers responsible for this rare extreme event using high resolution reanalysis datasets and India Meteorological Department 0.25° gridded precipitation data. The influence of Integrated water Vapour Transport (IVT), along with other dynamic factors such as atmospheric instability and total column water vapour on the extreme precipitation is assessed using a factor combination methodology based on conditional probability. Additionally, to reveal the moisture sources for this event, the backward trajectory of moisture particles was traced using HYbrid Single Particle Lagrangian Integrated Trajectory (HYSPLIT) model. Results reveal that all three factors exceeded their 99th percentile thresholds, with their peaks occurring one day prior to the rainfall maximum, indicating a strong preconditioning of the atmosphere for extreme convection. HYSPLIT results confirmed sustained moisture influx from the Bay of Bengal and equatorial Indian Ocean up to seven days before the event. A comparative evaluation across El Niño years (1991, 1997, 2005, 2015, and 2023) showed that only the 2023 event exhibited concurrent extremes in all parameters. These findings underscore the compound nature of the 2023 Tuticorin flood and highlight the need for integrated moisture diagnostics in predicting future extreme rainfall events over peninsular India.

How to cite: Ghodichore, N. and Rajendran, V.: Multivariate driver analysis and moisture attribution of the December 2023 Tuticorin floods, EGU General Assembly 2026, Vienna, Austria, 3–8 May 2026, EGU26-696, https://doi.org/10.5194/egusphere-egu26-696, 2026.

EGU26-1138 | ECS | Posters on site | AS2.2

Increased PM levels influence leaf conductance and modify transpiration dynamics, altering groundwater levels in IGP India. 

Sombir Pannu, Prakhar Shrivastava, Vikram Singh, Usha Mina, Chandan Gupta, Bhupinder Singh, Piyush Jain, and Mayank kumar

Aerosols affect the worldwide plant environment in both beneficial and harmful ways. Despite its potential importance, its direct influence on plant–water interactions is little known. Tomato plants were grown in ambient urban air, filtered air, and severely polluted air following precise exposure procedures. While measuring transpiration rate and stomatal density, leaf hydration kinetics, microscopic leaf wetness creation, and aerosol deposition patterns were also assessed.

The experiment was conducted from August 2025 in three plant-growing chambers at IIT Delhi. Temperature and RH were the same. At plant level, plants were exposed to natural daylight (up to 1500 µmol m⁻² s⁻¹). Leaf dust deposition was monitored. Every other day, elevated chambers were sprayed with dust, while HEPA filters cleaned air in filtered chambers. PM2.5 deposition on leaves ranges from 50 µg/cm² to 600 µg/cm² for HEPA filter-equipped and increased PM conc. chambers, respectively. During the monitoring period, PM2.5 levels at several locations in the area averaged 150-600 µgm⁻³.Net photosynthesis, stomatal conductance, and transpiration rate were measured in real time using LI-COR 6400XT.

The mass accumulated on leaves was 10 to 12 times more in the elevated PM chamber. Fresh leaves from plants grown under reduced, ambient, and elevated chamber conditions were collected, affixed to specimen holders using adhesive Leit tabs, and analysed using environmental scanning electron microscopy. Stomatal density was seen to have risen (~170 per mm²) from the seedling stage. The minimum leaf conductance (gmin) was measured on leaflets. Photosynthetic rate increased from 14 µmol m⁻² s⁻¹ to 21 µmol m⁻² s⁻¹. The gmin is anticipated to rise when dust deposition on leaves increases. The rise in water uptake by plants suggests that phenomena such as hydraulic activation of stomata (HAS) or heat retention by deposited aerosols have intensified water loss, either through cooling themselves from the heat absorbed from excessive dust accumulation or by forming wicks into the leaves from the salts in the aerosols, thereby facilitating the escape of water from leaves into the environment through evaporation. The Fv/Fm ratio, a measure of photosynthetic efficiency, was maximised in the lowered chamber.

The impact of aerosols on plants is contingent upon their composition, species, and environmental conditions, affecting the movement of water via stomata and cuticular transpiration. Research indicates that ambient aerosol deposition in polluted urban environments elevates gmin, transpiration rates and modified stomatal density. Severity of impact increases pollution levels and hygroscopic aerosols due to extended exposure. Aerosol-induced water loss diminishes stomatal regulation, impairs drought resilience and water usage efficiency, and complicates carbon-water flow scaling. The increased transpiration rate leads to greater water consumption by plants, which might contribute to the depletion of groundwater levels in the IGP India. Additional investigation is required to elucidate the processes connecting aerosol deposition and stomatal response, considering their significance for global climate change.


How to cite: Pannu, S., Shrivastava, P., Singh, V., Mina, U., Gupta, C., Singh, B., Jain, P., and kumar, M.: Increased PM levels influence leaf conductance and modify transpiration dynamics, altering groundwater levels in IGP India., EGU General Assembly 2026, Vienna, Austria, 3–8 May 2026, EGU26-1138, https://doi.org/10.5194/egusphere-egu26-1138, 2026.

EGU26-1708 | Orals | AS2.2

Cloud–Forest Coupling: New insights integrating Amazon Observations and Explicit Canopy-Cloud Simulations 

Jordi Vila-Guerau de Arellano, Robbert Moonen, Vincent deFeiter, Hugo deBoer, Oscar Hartogensis, Thomas Röckmann, and Raquel Gonzalez-Armas

Forests and clouds are central to Earth’s carbon and water cycles, yet they are rarely studied as a coupled system. Recent observations reveal concurrent shifts in forest CO₂ uptake and cloud regimes across tropical, temperate, and boreal biomes, signaling changes in forest–atmosphere coupling with profound implications for cloud cycling and climate feedbacks. While rising CO₂ may enhance forest assimilation, declining trends in low cloud cover alters radiative fluxes and amplifies warming, potentially modifying forest photosynthesis, turbulence, and biogenic volatile organic compound emissions. In turn, these processes influence clear/cloud boundary layer dynamics by controlling the partitioning of canopy turbulent fluxes, influence boundary-layer dynamics and cloud formation. Yet current Earth system models largely overlook these cross-scale interactions.

To advance our understanding on the forest-cloud coupling, we focus on the Amazon basin as a proof-of-concept where we integrate field observations from the CloudRoots-Amazon22 campaign with new multi-layer canopy large-eddy simulations that explicitly resolve interactions between the forest canopy and the clear/cloudy boundary layer. The CloudRoots-Amazon22 experiment, conducted at the ATTO and Campina supersites during the August 2022 dry season, investigated the sub-diurnal evolution of the common clear-to-cloudy transition in the Amazon.

High-frequency observations reveal that stomatal conductance responds to variations in cloud optical thickness, demonstrating that canopy–cloud radiative perturbations regulate sub-diurnal canopy carbon and water exchange. Turbulent fluxes and vertical transport adjust within minutes to cloud passages, highlighting rapid land–atmosphere coupling. Collocated surface fluxes, profiles of thermodynamic variables, and CO₂ concentrations, further establish causal links between biophysical canopy processes and cloud dynamical development.

Building on these insights, we present an integrated framework that combines high-frequency observations with turbulence-resolving simulations embedded in global storm-resolving models to quantify shifts in cloud–forest coupling under climate change. This coupled approach advances our understanding of how cloud-radiative perturbations, turbulent transport, and photosynthesis co-evolve, bridging leaf-level processes and cloud-scale dynamics, and provides a pathway to constrain key uncertainties in Earth system models.

How to cite: Vila-Guerau de Arellano, J., Moonen, R., deFeiter, V., deBoer, H., Hartogensis, O., Röckmann, T., and Gonzalez-Armas, R.: Cloud–Forest Coupling: New insights integrating Amazon Observations and Explicit Canopy-Cloud Simulations, EGU General Assembly 2026, Vienna, Austria, 3–8 May 2026, EGU26-1708, https://doi.org/10.5194/egusphere-egu26-1708, 2026.

Ultrasonic anemometers (UA) are frequently employed to measure wind, air temperature, and turbulent exchange of energy and matter in the atmospheric boundary layer. They are fast-response, linear, accurate, first-principle instruments.  Their accuracy is determined by the lengths of the acoustic paths, the direction cosines of the path geometry, and the time of flight of the acoustic signals. A fundamental limitation of UA is the self-shadowing wake effect caused by the ultrasonic transducers and support structures interfering with the flow field, leading to underestimation of the wind measurement along the acoustic paths. To minimize the transducer wake effects, numerous UA designs with different geometry, orientation, and length of the ultrasonic paths have been proposed, but there is no consensus on optimal transducer arrangement. In a widely used non-orthogonal UA design each of the three acoustic paths is tilted 60 degrees from the horizontal plane and equally spaced 120 degrees around the vertical axes. The advantage of the non-orthogonal UA is that the transducers are taken out of the horizontal plane and the three sensing paths intersect forming a small measurement volume preserving the correlation between the components of the wind vector. Alternatively, in a less common orthogonal UA design, the acoustic paths are arranged perpendicular to each other and parallel to the axes of a Cartesian coordinate system, allowing the measurement of the vertical wind component by a single pair of transducers. A disadvantage of the orthogonal UA is the large separation between the wind components and the self-shadowing effects of the transducers in the horizontal plane. To compare the performance of the orthogonal and non-orthogonal UAs we designed a unique integrated twelve-transducer probe, combining both designs in one structure with all six acoustic paths referenced to a common coordinate system. Such an arrangement reduces the uncertainty of the combined wind measurements by eliminating the need for coordinate rotation to align each UA coordinate system to the mean flow field. This study is unique because the two UAs use the same ultrasonic transducers, have equal path length to transducer diameter ratios, utilize the same time-of-flight signal processing algorithm, sample rate and measurement bandwidth. The primary difference between the two UAs is the orientation of the six acoustic paths. We demonstrate the details of the design of the combined probe and present results from a field experiment.

How to cite: Bogoev, I. and Strickler, B.: Performance Evaluation of Three-Component Ultrasonic Anemometers with Orthogonal and Non-Orthogonal Transducer Arrays, EGU General Assembly 2026, Vienna, Austria, 3–8 May 2026, EGU26-3170, https://doi.org/10.5194/egusphere-egu26-3170, 2026.

Previous commercially available closed-path eddy covariance instrumentation used to quantify fluxes of trace gases relied on large flow rates from large pumps to attain high frequency response. These pumps would require AC mains power as well as environmental protection, limiting suitable locations for deployment. Building on over 20-years of experience manufacturing field-rugged trace gas analyzers, Campbell Scientific has developed a new novel closed-path analyzer to measure methane or nitrous oxide mixing ratios. The new analyzer achieves excellent frequency response (>3Hz bandwidth) with only 1.8 LPM flow rate and typical power consumption of 40W, while maintaining excellent noise performance (<5 ppb and <1 ppb typical noise at 10Hz Allan deviation for methane and nitrous oxide respectively).

How to cite: Conrad, B.: Frequency Response of a Low-Power Trace Gas Analyzer for Eddy-Covariance Flux Measurements, EGU General Assembly 2026, Vienna, Austria, 3–8 May 2026, EGU26-3183, https://doi.org/10.5194/egusphere-egu26-3183, 2026.

EGU26-3359 | ECS | Posters on site | AS2.2

The Mashash Desert Climate Observatory: A New Megasite for Air–Land Exchange Processes in Subtropical Deserts 

Aviv L. Cohen-Zada, Moshe Armon, Elad Dente, Nili Harnik, Eitan Hirsch, Arnon Karnieli, Ilan Koren, Shira Raveh-Rubin, Maxim Shoshany, Noam Weisbrod, and Nurit Agam

Arid and hyper-arid regions (deserts) are dynamic ecosystems that respond sensitively to changes in water availability, temperature, and atmospheric CO₂, and can both indicate and influence climate change. Although approximately 27% of the world’s land surface is classified as deserts, these regions are second only to oceans in the scarcity of long-term measurement sites. This results in an inadequate representation of the complex interactions among the pedosphere, hydrosphere, and atmosphere in these regions. This knowledge gap limits understanding of desert-specific air–land processes and, given the close coupling between desert climates and the global system, contributes to uncertainty in climate projections.

To address this gap, we are establishing a first-of-its-kind megasite in the Negev Desert representing the subtropical desert belt. Israel’s relatively small size, with ~60% of its territory classified as arid or hyper-arid, makes the Negev uniquely accessible for long-term observations. The Mashash Desert Climate Observatory is built on a record of meteorological data collected at the site since 1973 and extensive micrometeorological measurements conducted in recent years.

The new megasite will generate vertically resolved surface-to-atmosphere profiles of wind, temperature, and moisture, along with detailed radiation, heat, CO2, and dust fluxes, enabling direct analysis of air–land coupling from the soil to the top of the troposphere. Co-located measurements of soil moisture, soil heat flux, and soil CO₂ efflux will allow characterization of subsurface controls on surface energy partitioning and carbon exchange. These continuous estimates will highlight the evolution of dynamics at diurnal, seasonal, and annual scales, linking surface radiative forcing to turbulent transport and boundary-layer development. Combined radiative and thermodynamic profiles will further resolve the vertical structure of moisture transport and non-precipitating systems, clarifying how episodic hydrological inputs propagate through the soil–vegetation–atmosphere continuum in desert environments. The observatory will be open to the international research community, and its data architecture is designed to be compatible with global networks (e.g., FLUXNET and NASA archiving standards), while maintaining access to raw data to ensure transparency and scientific integrity.

By providing sustained observations of air–land interactions in an understudied environment, the Mashash Desert Climate Observatory will deliver essential data for improving land-surface and boundary-layer models, support model–observation intercomparisons and remote-sensing validation, and advance understanding of multi-scale desert processes toward initial upscaling to global climate models.

How to cite: Cohen-Zada, A. L., Armon, M., Dente, E., Harnik, N., Hirsch, E., Karnieli, A., Koren, I., Raveh-Rubin, S., Shoshany, M., Weisbrod, N., and Agam, N.: The Mashash Desert Climate Observatory: A New Megasite for Air–Land Exchange Processes in Subtropical Deserts, EGU General Assembly 2026, Vienna, Austria, 3–8 May 2026, EGU26-3359, https://doi.org/10.5194/egusphere-egu26-3359, 2026.

EGU26-4241 | ECS | Posters on site | AS2.2

Assessment of Surface Energy Balance Closure at eddy-covariance sites in Diverse Alpine Environments 

Sebastiano Carpentari, Mira Shivani Sankar, Nadia Vendrame, Dino Zardi, and Lorenzo Giovannini

The surface energy balance (SEB), which defines the partitioning of energy exchange between the Earth’s surface and the atmosphere, is crucial for characterizing the development and evolution of the atmospheric boundary layer. While an accurate assessment of SEB components is essential for numerous applications, eddy-covariance measurements remain affected by significant uncertainties. Specifically, turbulent heat fluxes typically fail to balance the available energy at the surface. Research suggests that this energy balance closure problem stems primarily from advection driven by secondary circulations, which are prevalent over heterogeneous and complex terrain due to differential heating.

This study assesses the relationship between SEB non-closure, surface heterogeneity, and the subsequent development of local and mesoscale thermally driven circulations. The analysis utilizes data from seven flux sites across diverse Alpine environments (both on flat and sloped terrain) - including vineyards, pastures, pre-alpine and continental forests - incorporating at least two years of data per site, with many exceeding four years. The results provide a systematic and robust quantification of SEB non-closure across several typical Alpine contexts, highlighting key similarities and differences between sites based on their topographic features, land cover, and prevailing meteorological conditions.

The present work is part of the INTERFACE project (INvestigating ThE suRFACe Energy balance over mountain areas), which is performed in the framework of the TEAMx research programme.

How to cite: Carpentari, S., Shivani Sankar, M., Vendrame, N., Zardi, D., and Giovannini, L.: Assessment of Surface Energy Balance Closure at eddy-covariance sites in Diverse Alpine Environments, EGU General Assembly 2026, Vienna, Austria, 3–8 May 2026, EGU26-4241, https://doi.org/10.5194/egusphere-egu26-4241, 2026.

EGU26-5034 | Posters on site | AS2.2

Why Maize Sometimes Behaves Like Pine: Throughfall Microstructure and LAI Influence 

Katarina Zabret, Lana Radulović, Borbala Szeles, Juraj Parajka, Dušan Marjanović, Urša Vilhar, Janez Pavčič, Mark Bryan Alivio, Tamara Kuzmanić, Klaudija Lebar, Nejc Bezak, Peter Strauss, Günter Blöschl, and Mojca Šraj

When vegetation intercepts precipitation, the quantity of rainwater reaching the ground is affected, as it passes through the canopy, drips from it, and runs down the stem. Interception also significantly alters the characteristics of rainfall, which is among others reflected in differences in the number, size and velocity of raindrops. Throughfall drop size distribution was monitored and analysed for three vegetation types, including a single pine tree in an urban park, trees in an urban mixed forest, and a maize field in an agricultural area. Velocity-diameter diagrams were compiled for the 33 selected throughfall events and grouped into three distinct clusters based on similarity using a hierarchical clustering approach. Pine throughfall events were grouped in Cluster 1, urban mixed forest events in Cluster 2, while maize events were split between Clusters 1 (with all the pine tree events) and Cluster 3. A detailed analysis of rainfall microstructure characteristics under maize and pine canopies was conducted in relation to the rainfall event conditions and crop growing stage to evaluate why, in some cases, throughfall microstructure under maize is similar to that beneath pine (events assigned to Cluster 1), and, in other cases, it differs (events assigned to Cluster 3). Throughfall events in Cluster 3 were generally larger and more intense, showing a unimodal temporal distribution. In contrast, maize throughfall events in Cluster 1 exhibited a bimodal distribution, with two intensity peaks separated by a rainfall break. Notably, the maize leaf area index (LAI) exceeded a value of 4 during the period when the shift occurred from the events assigned in Cluster 1 to the subsequent events assigned in Cluster 3. As maize leaves mature, they become less flexible and do not bend as much under the weight of rain. Consequently, throughfall consist of more drips (larger drops) than direct rainfall (smaller drops). Further research could include additional types of vegetation, and the results could be supported by measurements over a longer period of time. These values could also be used for direct analyses of rainfall erosivity.

Acknowledgment: This contribution is part of the ongoing research project entitled “Evaluation of the impact of rainfall interception on soil erosion” supported by the Slovenian Research and Innovation Agency (J2-4489) and the Austrian Science Fund (FWF) I 6254-N.

How to cite: Zabret, K., Radulović, L., Szeles, B., Parajka, J., Marjanović, D., Vilhar, U., Pavčič, J., Alivio, M. B., Kuzmanić, T., Lebar, K., Bezak, N., Strauss, P., Blöschl, G., and Šraj, M.: Why Maize Sometimes Behaves Like Pine: Throughfall Microstructure and LAI Influence, EGU General Assembly 2026, Vienna, Austria, 3–8 May 2026, EGU26-5034, https://doi.org/10.5194/egusphere-egu26-5034, 2026.

EGU26-5092 | ECS | Posters on site | AS2.2

Transport of blowing snow particles through turbulent motions 

Samuele Viaro

In mid-latitudes, and over polar regions, a vast majority of precipitations are linked to the production of ice crystals in clouds. Cloud microphysical processes of complex mountain regions, where mixed-phase clouds (MPC) are consistently present, are therefore better represented if the number of ice crystals are correctly estimated. However, observations have shown that measured ice crystal number concentration (ICNC) can exceed the concentration of ice nucleating particles by orders of magnitude. Moreover, model simulations that rely mainly on primary ice production mechanisms usually underestimate ICNC when compared with observations. Blowing snow particles (BSP) are believed to be one of the causes affecting this discrepancy, but their influence on ICNC in MPS remains poorly understood. Our research uses the numerical model CRYOWRF, which includes blowing snow prognostic equations coupled with the advanced land surface snow model SNOWPACK, to analyze how BSP influence the highly nonlinear cloud microphysics and ICNCs. Numerical results are then validated with observation data from the Cloud and Aerosol Characterization Experiment (CLAVE) 2014 campaign at Jungfraujoch. Results show that, when high wind velocities trigger blowing snow transport, due to the strong updraft typical of mountain regions, BSP reach high levels in the atmosphere thus affecting precipitation and snow redistribution.

How to cite: Viaro, S.: Transport of blowing snow particles through turbulent motions, EGU General Assembly 2026, Vienna, Austria, 3–8 May 2026, EGU26-5092, https://doi.org/10.5194/egusphere-egu26-5092, 2026.

EGU26-5481 | Orals | AS2.2

Integrated observations and atmospheric modeling to bridge the scaling gap from local to landscape 

Mathias Göckede, Sanjid Backer Kanakkassery, Abdullah Bolek, Nicholas Eves, Kseniia Ivanova, Lara Oxley, Elliot Pratt, Mark Schlutow, Nathalie Triches, Judith Vogt, Elias Wahl, Theresia Yazbeck, and Martin Heimann

Many natural ecosystems are subject to fine scale variability in biogeophysical and biogeochemical properties, consisting of a mosaic of patches with individual characteristics in e.g. vegetation, hydrology, or microclimate. Carbon cycle fingerprints between patch types may exhibit strong differences, and reactions to current variability in external forcing as well as to future climate change may substantially differ across spatial gradients of often just a few meters or less. Capturing a representative carbon budget for such landscapes is highly challenging, since footprints of common observation techniques are either rather small with limited representativeness (e.g. flux chambers), or rather large and therefore aggregating signals across multiple patch types (e.g. eddy covariance).

This study is based on a 2025 field campaign at Stordalen Mire in Northern Sweden, a highly structured wetland consisting of a patchwork of fens, bogs, palsas and open water areas. Observational platforms included 2 eddy covariance towers with different instrument heights but nested footprints, stationary (fixed collars) and mobile chamber flux measurements within the tower footprints, a floating mobile auto-chamber system for distributed observations across different lakes and lake zones, and a drone equipped with in-situ greenhouse gas analyzers and meteorological sensors for landscape-integrating surveys using grid, curtain and profile flights. Since all platforms focused their observations on the same wetland section (about 500x500m), our dataset allows to merge detailed process information for individual ecosystem patches (e.g. from flux chamber data) with the landscape-scale integrative products (e.g. by eddy towers or drone).

We present results from different scaling approaches for deriving ecosystem-scale CO2 and CH4 budgets and variability, including e.g. data-driven upscaling, decomposition of eddy-covariance observations into patch-level fluxes, and local scale inversion of drone observations, each focusing on different subsets of the observational database. Through combining all data streams we aim at reducing uncertainties in wetland-scale carbon budgets as well as in the assessment of flux representativeness for the larger region. Comparing upscaled fluxes reveals strengths and weaknesses of individual data streams for constraining net carbon budgets and identifying functional controls, and delivers guidelines towards optimum upscaling strategies.

How to cite: Göckede, M., Backer Kanakkassery, S., Bolek, A., Eves, N., Ivanova, K., Oxley, L., Pratt, E., Schlutow, M., Triches, N., Vogt, J., Wahl, E., Yazbeck, T., and Heimann, M.: Integrated observations and atmospheric modeling to bridge the scaling gap from local to landscape, EGU General Assembly 2026, Vienna, Austria, 3–8 May 2026, EGU26-5481, https://doi.org/10.5194/egusphere-egu26-5481, 2026.

EGU26-6083 | ECS | Posters on site | AS2.2

Investigating the impacts of anthropogenic heat over East China with a global variable-resolution model 

Qike Yang, Chun Zhao, Xuchao Yang, Ziyin Zhang, Jiawang Feng, Gudongze Li, Zihan Xia, Zining Yang, Mingyue Xu, and Jun Gu

Anthropogenic heat (AH) is an important urban forcing factor, with its impacts span local, regional, and larger-scale atmospheric processes. However, its multiscale effects are difficult to quantify using conventional global and regional models. Here we address this challenge by applying a global variable-resolution atmospheric model, the integrated Atmospheric Model Across Scales (iAMAS), which explicitly links urban-scale processes with regional and large-scale atmospheric feedbacks within a single modeling framework. The model employs grid spacing that transitions from 50 km globally to 3 km over the East China with 3 km to resolve the anthropogenic heat effect over urban areas. Two AH parameterizations are implemented in this study: a spatially uniform AH parameterization (UniAH) and a spatially distributed gridded dataset (GrdAH), enabling an investigation of the multiscale atmospheric impacts of different AH parameterizations. At the local boundary-layer scale, both UniAH and GrdAH indicate that AH increases near-surface temperature and planetary boundary layer height, with the strongest responses occurring in winter. Nevertheless, GrdAH reproduces observed 2-m air temperature and 10-m wind speed more accurately than UniAH. At the urban scale, both parameterizations reduce the underestimation of the urban heat island and enhance vertical motion, while producing distinct precipitation responses between urban areas and their surrounding rural regions. At larger scales associated with atmospheric circulation, both UniAH and GrdAH indicate that AH redistributes momentum, partially impeding the upper-level circulation and modifying urban-scale convergence and divergence patterns. The convergent circulation downwind of the city corresponds to enhanced precipitation, demonstrating the coupled interactions across different scales. These results highlight the inherently multiscale nature of AH effects and demonstrate the methodological value of variable-resolution modeling for capturing urban forcing and its associated multiscale atmospheric feedbacks.

How to cite: Yang, Q., Zhao, C., Yang, X., Zhang, Z., Feng, J., Li, G., Xia, Z., Yang, Z., Xu, M., and Gu, J.: Investigating the impacts of anthropogenic heat over East China with a global variable-resolution model, EGU General Assembly 2026, Vienna, Austria, 3–8 May 2026, EGU26-6083, https://doi.org/10.5194/egusphere-egu26-6083, 2026.

EGU26-6583 | Posters on site | AS2.2

Improved wavelet method for accurate high-resolution ecosystem flux estimation and time-derivative analysis 

Gabriel Destouet, Emilie Joetzjer, Nikola Besic, and Matthias Cuntz

We present two major advancements to the wavelet-based, non-stationary flux estimation method of Destouet et al. (2025), enabling accurate calculation of high-resolution (1-minute) ecosystem fluxes and their time-derivatives.

We introduce first a scale-dependent estimation process that explicitly accounts for frequency-dependent eddy correlation times. By assigning different averaging times to each frequency band, we enhances the isolation of turbulent scales, reduces flux estimation errors, and improves the separation of local turbulence from larger scales by eliminating spurious correlations around the 'spectral gap'. This advancement is particularly valuable for wavelet-based flux partitioning, as it preserves high-quality flux estimates while retaining small-scale eddies, such as those hypothesized to transport soil respiration through forest canopies.

Second, our method now enables the computation of flux time-derivatives, allowing analysis of turbulent transport dynamics and ecosystem responses to environmental changes. As a first application, we present how to optimally determine the averaging time required for observed turbulent fluxes to represent underlying ecosystem fluxes. This is achieved by analysing the co-variation of flux time-derivatives with variables such as incoming radiation and carbon storage, which reflect underlying ecosystem dynamics.

These improvements together refine high-resolution flux estimation and unlock new opportunities to investigate ecosystem dynamics from flux towers. They have been implemented in the open-source TurbulenceFlux.jl package, which is readily available for community use.

Reference:

Destouet G, Besic N, Joetzjer E, and Cuntz M (2025) Turbulent transport extraction in time and frequency and the estimation of eddy fluxes at high resolution, Atmospheric Measurement Techniques 18(13):3193–3215, doi:10.5194/amt-18-3193-2025

How to cite: Destouet, G., Joetzjer, E., Besic, N., and Cuntz, M.: Improved wavelet method for accurate high-resolution ecosystem flux estimation and time-derivative analysis, EGU General Assembly 2026, Vienna, Austria, 3–8 May 2026, EGU26-6583, https://doi.org/10.5194/egusphere-egu26-6583, 2026.

EGU26-6602 | Orals | AS2.2

Improving Urban Eddy-Covariance CO2 Flux Estimates Through Removal of Anomalies in High-Frequency Data Using the IMAS Algorithm 

Aneena Binoy, Armin Sigmund, Stavros Stagakis, and Alessandro Bigi

Urban areas are major sources of anthropogenic COemissions, contributing substantially to the global carbon budget. Accurate quantification of urban emissions remains challenging due to uncertainties in measurements and modelling approaches. Eddy covariance (EC) provides direct continuous measurements of net urban CO2 fluxes; however, flux estimates in heterogeneous urban environments can be systematically biased by unresolved micro-scale anthropogenic sources. This study investigates the efficiency of the Identification of Micro-scale Anthropogenic Sources (IMAS) algorithm (Kotthaus and Grimmond, 2012) to detect short-duration, high-frequency micro-scale signals on EC observations. IMAS removes statistically identified micro-scale events from high-frequency data prior to flux computation, enabling retention of standard 30-min averaging periods. Micro-scale event detection is based on statistical metrics computed at 1-min resolution for CO2, H2O and sonic temperature, combining kurtosis, median-based variability, and skewness-sensitive mid-range deviation referenced to a 30-min median.

We applied the IMAS algorithm to two years of continuous EC measurement data, which were collected at the Hardau tall-tower site in the city of Zurich, Switzerland, as part of the ICOS Cities project. Fluxes were measured on a mast on top of a high-rise building at 112 m a.g.l, sampling a heterogeneous footprint influenced by various sources such as residential heating, traffic, railway infrastructure and industrial activities. A local heating unit is located at a horizontal distance of 145 m south-east of the tower, which is used intermittently to support residential heating during cold periods and could potentially affect our tower measurements. Standard EC fluxes and quality control flags were computed using EddyPro software before (L1) and after (L2) the application of the IMAS algorithm. Flux differences between L1 and L2 show a strong dependence on wind direction, with the largest reductions in L2 occuring for sector spanning 120–160°, centered on the direction of a nearby local heating unit (~141°) within the urban footprint. During winter, standard EC processing (L1) overestimates CO2 fluxes by 3.96 ± 0.43 µmol m-2 s-1 (mean ± standard error of the mean) for wind originating from this sector, corresponding to a relative reduction of ~17 % after the IMAS-based removal of micro-scale events. Smaller but consistent mean reductions are also observed for H2O fluxes (0.039 ± 0.005 mmol m-2 s-1, ~12 %) and sensible heat fluxes (4.82 ± 0.75 W m-2, ~38 %). In contrast, IMAS-induced flux changes during summer were minimal. These results demonstrate that unresolved micro-scale emissions can propagate directly into urban CO2 flux calculations, highlighting the need for source-aware, high-frequency preprocessing to complement standard EC quality control in urban carbon flux monitoring.

How to cite: Binoy, A., Sigmund, A., Stagakis, S., and Bigi, A.: Improving Urban Eddy-Covariance CO2 Flux Estimates Through Removal of Anomalies in High-Frequency Data Using the IMAS Algorithm, EGU General Assembly 2026, Vienna, Austria, 3–8 May 2026, EGU26-6602, https://doi.org/10.5194/egusphere-egu26-6602, 2026.

EGU26-6756 | ECS | Posters on site | AS2.2

Tracing Carbon Flux Dynamics and Ecosystem Functioning Along a Land-Use Gradient: Long-Term Eddy Covariance Observations in the western Italian Alps 

Daria Ferraris, Marta Galvagno, Ludovica Oddi, Gianluca Filippa, Edoardo Cremonese, Paolo Pogliotti, Federico Grosso, Umberto Morra di Cella, Sofia Koliopoulous, Chiara Guarnieri, Georg Wohlfahrt, Georg Leitinger, Mirco Migliavacca, Albin Hammerle, and Dario Papale

This study reports a comparative investigation of two alpine research sites situated in the Aosta Valley (Italian Alps), representing distinct neighbouring ecosystems: a high-altitude grassland and a mature larch forest. Eddy covariance flux measurements have been operational since 2008 at the grassland site (2168 m a.s.l.) and since 2012 at the larch forest site (2100 m a.s.l.). Each station is fully instrumented for flux and meteorological observations using  identical instrumentation. The straight-line distance between the two sites is approximately 2.7 km and they experience comparable climatic conditions, thereby enabling direct inter-site comparisons.

The primary aim of this study is to quantify and interpret differences in the carbon dioxide exchange between these ecosystems, with particular attention to the peculiarities of the years showing extreme meteorological conditions.

The two sites represent contrasting stages along a land‑use transition gradient, where the abandoned grasslands — no longer subject to livestock grazing since 2008, when the area was fenced and permanently excluded from grazing — exhibit a progressive encroachment by woody species, ultimately evolving into mature larch stands. This is a widely documented process in the Alpine region: the abandonment of traditional grazing practices and the subsequent natural recolonization of former grasslands by forest species.

To complement this analysis, preliminary results from a third eddy covariance station, installed in 2024 within a transitional ecotone characterized by scattered small larch saplings and shrub species, will also be presented.

Overall, this study demonstrates how multi-year eddy covariance measurements can reveal differences in ecosystem functioning under the same climatic conditions but across distinct vegetation types and successional stages, offering new insights into carbon flux dynamics along alpine land-use gradients.

How to cite: Ferraris, D., Galvagno, M., Oddi, L., Filippa, G., Cremonese, E., Pogliotti, P., Grosso, F., Morra di Cella, U., Koliopoulous, S., Guarnieri, C., Wohlfahrt, G., Leitinger, G., Migliavacca, M., Hammerle, A., and Papale, D.: Tracing Carbon Flux Dynamics and Ecosystem Functioning Along a Land-Use Gradient: Long-Term Eddy Covariance Observations in the western Italian Alps, EGU General Assembly 2026, Vienna, Austria, 3–8 May 2026, EGU26-6756, https://doi.org/10.5194/egusphere-egu26-6756, 2026.

EGU26-6900 | Posters on site | AS2.2

Attributing the surface temperature difference between a northern boreal mire and forest to the differences in their surface biophysical properties 

Erkka Rinne, Juha-Pekka Tuovinen, Maiju Linkosalmi, and Mika Aurela

Restoration of drained peatlands aims to recover the natural carbon sink and storage functions of a mire but also leads to changes in the ecosystems’ biophysical surface properties and, consequently, to their local climate. Impacts of land cover changes on local temperatures are governed by both radiative and non-radiative processes, i.e. changes in albedo and energy partitioning, respectively, with the latter typically as the dominant factor.

There is evidence that the land surface temperature (LST) in degraded peatlands will tend to become similar to that in nearby intact ecosystems1. Therefore, quantifying how the differences in the surface properties between pristine mires and forests contribute to the differences in their LST is relevant to understanding the biophysical effects of peatland restoration. However, data on LST changes following a forest to mire transition are scarce.

We attribute the difference in LST between a boreal mire and forest to the differences in their biophysical surface properties: albedo, energy storage, aerodynamic resistance and bulk surface resistance to evapotranspiration. We use eddy covariance measurements of sensible and latent heat fluxes as well as supporting meteorology. The attribution methodology is the two-resistance mechanism2, but compared to previous studies we also include auto- and cross correlations between the attributed variables using second-order Taylor series expansion3. The attribution is compared between seasons based on vegetation phenology and between weather events based on climatic indicators of warm, cool, wet or dry days.

We hypothesized that contributions to LST difference from the differences in surface resistance would be important because of the very different hydrology and vegetation in the compared ecosystems. However, our results show that the importance of surface resistance was minor compared to aerodynamic resistance which is the dominant factor during spring, summer and autumn. The lower surface roughness of the open mire leads to higher aerodynamic resistance, which has been identified as a strong warming factor also in previous literature comparing forests and open ecosystem such as croplands (e.g. ref.4). During late winter with a continuous snow cover still on the mire, the higher albedo values in the mire explain most of the lower LST there. The interdependencies between the attributed variables emerge as important factors, especially when comparing between different weather conditions.


References

1. Burdun, I. et al. Satellite data archives reveal positive effects of peatland restoration: albedo and temperature begin to resemble those of intact peatlands. Environ. Res. Lett. 20, 084037 (2025).

2. Rigden, A. J. & Li, D. Attribution of surface temperature anomalies induced by land use and land cover changes. Geophys. Res. Lett. 44, 6814–6822 (2017).

3. Chen, C., Wang, L., Myneni, R. B. & Li, D. Attribution of Land-Use/Land-Cover Change Induced Surface Temperature Anomaly: How Accurate Is the First-Order Taylor Series Expansion? J. Geophys. Res. Biogeosciences 125, e2020JG005787 (2020).

4. Chen, C. et al. Biophysical effects of croplands on land surface temperature. Nat. Commun. 15, 10901 (2024).

How to cite: Rinne, E., Tuovinen, J.-P., Linkosalmi, M., and Aurela, M.: Attributing the surface temperature difference between a northern boreal mire and forest to the differences in their surface biophysical properties, EGU General Assembly 2026, Vienna, Austria, 3–8 May 2026, EGU26-6900, https://doi.org/10.5194/egusphere-egu26-6900, 2026.

The persistent lack of energy balance closure in single-tower eddy-covariance measurements remains a major source of uncertainty in surface–atmosphere exchange studies. In most eddy-covariance studies, turbulent fluxes (sensible and latent heat) underestimate available energy (net radiation minus ground heat flux), potentially affecting evapotranspiration estimates used in irrigation management, and propagating uncertainties into land-surface model evaluation and flux upscaling. One important contributor to this imbalance can be the choice of data processing steps, particularly corrections for high-frequency spectral losses, which are known to significantly influence eddy-covariance flux estimates. However, their impact on energy balance closure has not yet been sufficiently quantified for long-term cropland observations.

Here, we investigate how different high-frequency spectral correction methods affect turbulent fluxes and energy balance closure at a managed cropland site in Reinshof, central Germany. Three years of eddy-covariance data collected over rotating crops (winter wheat, winter barley, and sugar beet) during 2022–2024 were processed using EddyPro, applying both analytical (Moncrieff et al., 1997; Massman, 2000; Horst, 1997) and in situ (Ibrom et al., 2007; Fratini et al., 2012) spectral correction methods.

Results show that the choice of spectral correction methods led to differences of up to 3.5% in annual energy balance closure estimates for years using open-path gas analyzers and up to 9.4% for years using closed-path gas analyzers. The in situ correction by Fratini et al. (2012) consistently resulted in the highest energy balance closure across all years, whereas differences among analytical corrections were minor, with a maximum difference of 0.8% in 2023. These effects were driven exclusively by changes in latent heat flux, which increased by 5-15% for open-path systems and by 38% for closed-path systems at the annual scale after spectral correction.

Overall, this study demonstrates that the choice of high-frequency spectral correction methods critically affects energy balance closure estimates in long-term eddy-covariance measurements, with effects varying in magnitude between open- and closed-path systems.

How to cite: Gehrmann, M., Knohl, A., Tunsch, E., and Markwitz, C.: Comparison of high-frequency spectral correction methods for eddy-covariance fluxes over a central German cropland: effects on energy balance closure, EGU General Assembly 2026, Vienna, Austria, 3–8 May 2026, EGU26-7040, https://doi.org/10.5194/egusphere-egu26-7040, 2026.

EGU26-7041 | ECS | Orals | AS2.2

Pitfalls and precautions for understory eddy-covariance processing 

Alexander Platter, Albin Hammerle, and Georg Wohlfahrt

Understory, so within-canopy, eddy-covariance (EC) measurements of energy, water, or CO2 fluxes offer more detailed insights into ecosystem exchange dynamics. Deriving these fluxes from EC systems requires several processing steps, where some of them are only valid for the inertial sublayer (i.e., above the canopy). Here we show that several of these steps are not appropriate for understory EC systems, particularly coordinate rotation, frequency-response correction, and some quality-control procedures. Using a multi-year dataset from a mountain forest site in Austria (At-Mmg), we identify some pitfalls and present precautionary measures.

An underlying assumption of the EC method is that the coordinate system is aligned with the mean flow, which in real-world conditions is not necessarily level or parallel to the surface, requiring coordinate rotations in the post processing of the wind measurements. For complex flow conditions, sectorwise planar fit is a commonly used rotation approach and is often preferred over classical double rotation. We demonstrate advantages of the less commonly used continuous planar fit, which yields more satisfactory results and substantially influences the statistics. Furthermore, the use of seasonal windows is preferable to account for seasonality in the flow structure.

High-frequency response corrections for trace gases (e.g., water vapor, CO₂) require a valid reference spectrum to compensate for instrument-related attenuation. Within the canopy, theoretical reference spectra tailored to the inertial sublayer are not applicable due to altered spectral behavior caused by vegetation elements interacting with the flow. This can introduce additional processes, such as spectral short-cutting, which strongly deviates from expected inertial sublayer behavior and is evident in our dataset. We also show that reference spectra based on temperature measurements are not reliable for trace gases at our site. We therefore explore an experimental, site-specific reference obtained by extrapolating the mid-frequency portion of the CO₂ spectrum to inform corrections.

Quality-control procedures also require revision. Standard turbulence tests assess flux–variance relationships against models to evaluate well-developed turbulence, but these relationships are valid only for the inertial sublayer. Applying them uncritically can misclassify understory data quality. Moreover, some form of low-turbulence filtering is needed. Understory EC systems enable quantification of canopy decoupling, which is becoming an attractive alternative to classical friction-velocity filtering. However, we emphasize that canopy-scale decoupling should not be used to disqualify understory fluxes: for understory measurements, the relevant coupling is between the measurement height and the forest floor, not with the entire canopy.

How to cite: Platter, A., Hammerle, A., and Wohlfahrt, G.: Pitfalls and precautions for understory eddy-covariance processing, EGU General Assembly 2026, Vienna, Austria, 3–8 May 2026, EGU26-7041, https://doi.org/10.5194/egusphere-egu26-7041, 2026.

EGU26-8096 | Orals | AS2.2 | Highlight

The thermal cost of sitting under a parasol: a biometeorological essay 

Georg Wohlfahrt and Albin Hammerle

For many people, beaches are a place they long for and emblematic for summer vacation vibes, even though environmental conditions may be actually physiologically stressful. In order to reduce radiation load, and thereby also exposure to UV radiation, the use of parasols for shading is thus common practise. The parasol, depending on the optical properties of the used fabric, attenuates part of the solar (shortwave) radiation, however at the expense of additional longwave radiation radiated in the downward direction in proportion to the surface temperature of the parasol. Here we ask the question whether sitting under a parasol may actually increase thermal discomfort as the reduction in transmitted shortwave radiation may be compensated by an increase in downward longwave radiation. To this end we have developed a model which allows simulating human thermal comfort in the open (without parasol) compared to below a parasol on a beach. Human thermal comfort is quantified with the Universal Thermal Comfort Index (UTCI). Environmental model inputs are air temperature and relative humidity, mean horizontal wind speed and incident short- and longwave radiation at some reference height above the ground surface. The attenuation of shortwave radiation by the parasol, the upward longwave radiation flux from the sand and the downward longwave radiation flux from the parasol are calculated by solving the radiative and energy balance of the parasol and the sand surface. The radiation calculations below the parasol take the modification of upper and lower hemispheric view factors into account and separately solve for the temperature of the sunlit and shaded sand surface. Our calculations show that the UTCI is generally lower under the parasol (and thus human thermal comfort higher), but differences are often small. Moreover, under certain combinations of conditions, sitting under a parasol feels hotter and we discuss which conditions favour this outcome. Finally, we demonstrate our findings for summertime conditions at some of the globally most well-know beach destinations.

How to cite: Wohlfahrt, G. and Hammerle, A.: The thermal cost of sitting under a parasol: a biometeorological essay, EGU General Assembly 2026, Vienna, Austria, 3–8 May 2026, EGU26-8096, https://doi.org/10.5194/egusphere-egu26-8096, 2026.

Precise estimates of actual evapotranspiration (ETa) are crucial for enhancing our understanding of the water and energy exchanges between land and atmosphere. These estimates are essential for applications and advancements in meteorological, climatological, ecological, and hydrological research. This study compares ET measurements obtained by two commonly used methods: eddy covariance (EC) and lysimeter (LY), based on long-term parallel measurements from 2012 to 2020. The analyses reveal a pronounced seasonal cycle in all measurements, with the highest values observed in summer and the lowest in winter. ET measurements from two lysimeters showed a significant difference of about 30% between areas of vegetation and bare soil. The ET values from the lysimeter method showed good agreement with the EC measurements, with an approximate difference of 7% between the two methods. Additionally, precipitation estimates from the lysimeter method were slightly higher than those from rain gauge measurements. The study identified air temperature as the primary controlling factor of ET, contributing nearly 60%. Net radiation and NDVI also played significant roles, with contributions larger than 10% and approximately 10%, respectively. The main causes of discrepancies between lysimeter and EC measurements were attributed to different measurement scales, varying crop growth stages, and soil moisture conditions. This study quantified ET at two different scales in nine-year period, providing valuable insights into the rational utilization of water resources in the region. The findings underscore the importance of considering measurement scales and environmental conditions when interpreting ET data for water resource management.

How to cite: Xu, Z.: Evapotranspiration measurements in the north China plain: insights from multi-years of lysimeter and eddy covariance system, EGU General Assembly 2026, Vienna, Austria, 3–8 May 2026, EGU26-8519, https://doi.org/10.5194/egusphere-egu26-8519, 2026.

EGU26-8626 | ECS | Orals | AS2.2

Coupled fire-atmosphere behavior observations from a grassland prescribed burn in a Northern California valley 

Ajinkya Desai and the iFireNet Prescribed Burn Research Team

Prescribed burns, primarily aimed at preempting uncontrolled fires, present a valuable opportunity for obtaining field measurements on fire and smoke-plume behavior at micro- and sub-microscales. However, this potential remains underutilized for comprehensive data collection with broad spatio-temporal coverage across the burn unit, in part due to underexplored instrumentation strategies and a lack of synchronous, multidisciplinary observations. During a grassland prescribed burn experiment in a valley region, situated in Trinity County, California, the diverse and extensive instrumentation deployed around the 10-acre burn unit enabled the integration of fire-induced wind patterns with fireline evolution history, air-quality measurements, and fuel characteristics. Small uncrewed aircraft system (sUAS)–based infrared imagery tracked fireline progression and spread rate, together with sUAS-based RGB video that additionally helped quantify flame height via computer-vision techniques. Moreover, high-resolution (cm-scale), sUAS-based measurements of pre- and post-burn multispectral imagery and LiDAR point cloud helped quantify burn severity and post-fire residual fuels in combination with ground-based sampling of fuel characteristics (load, height, moisture). In addition, an autonomous, nano-sized, WeatherHive sUAS swarm sampled high‑resolution temperature, relative humidity, and wind data inside the smoke plumes along “lawnmower” trajectories. An Optical Particle Sizer and a DustTrak II measured high-frequency particle size distributions and mass concentrations near the surface, and were collocated with eddy-covariance (EC) instruments along the burn-unit edges, which measured in-situ turbulence and energy flux statistics. Strong fire-induced horizontal wind convergence at the burn-unit edges was captured by the EC sensors amid variable ambient winds. Within the plume, the WeatherHive swarm recorded temperature excursions up to 8°C with upward redirection of near-surface horizontal flow into strong buoyant updrafts. The dynamic local wind direction and fireline proximity strongly modulated the observed near-surface aerosol mass and number concentrations, which were dominated by fine particulate matter (PM2.5), with background conditions recovered about 2.5 hours post-burn. Additionally, data were leveraged to evaluate a physics-based computational module utilizing the popular Reynold-Averaged Navier Stokes or RANS turbulence model. These integrated datasets provide deeper insight into coupled fire-behavior processes, while also illuminating improved measurement strategies for future experiments, including prolonged pre-burn deployment to characterize terrain-induced ambient flow and calculated sensor placement to capture the burn area flux footprint more effectively. Thus, they contribute to a growing observational database useful in advancing predictive models describing fire and smoke behavior, thereby increasing the reliance on prescribed burns for fire management.

How to cite: Desai, A. and the iFireNet Prescribed Burn Research Team: Coupled fire-atmosphere behavior observations from a grassland prescribed burn in a Northern California valley, EGU General Assembly 2026, Vienna, Austria, 3–8 May 2026, EGU26-8626, https://doi.org/10.5194/egusphere-egu26-8626, 2026.

EGU26-8997 | ECS | Orals | AS2.2

Leveraging CO2 sensor networks to address challenges in urban eddy-covariance measurements 

Armin Sigmund, Dominik Brunner, Jia Chen, Rainer Hilland, Andreas Christen, Christian Feigenwinter, Roland Vogt, Lukas Emmenegger, Markus Kalberer, and Stavros Stagakis

Eddy-covariance measurements allow us to directly monitor the vertical turbulent CO2 flux at a specific point in the urban atmosphere. Under some assumptions such as stationarity and sufficient turbulence, this flux corresponds to the net emissions in a variable footprint area. Combined with a footprint model and a biospheric CO2 flux model, this method has a high potential for validating and optimizing urban emission inventories. However, the reliability of EC measurements depends on a careful site selection, data processing and quality control. Often, sensor heights below z=50 m a.g.l. are chosen to mitigate issues associated with horizontal heterogeneity, storage flux, and horizontal and vertical advection. The storage flux describes the temporal change of the CO2 amount in the control volume between the surface and sensor height. Tall-tower sites (z>50 m a.g.l.) would be beneficial to capture emissions from a larger part of the city but require careful consideration of these issues. While a few studies have reported plausible EC measurements for urban tall-tower sites, little is known about the impact of the storage flux and advection terms. 
In the ICOS-Cities project, tall-tower EC systems and networks of mid-cost and low-cost CO2 concentration sensors were installed in three cities. Here, we aim to better quantify the storage flux and identify periods with horizontal advection by leveraging data from the sensor networks in Zurich, Switzerland, and Munich, Germany, and thus improve the reliability of the observed net CO2 emissions. The low-cost sensors were deployed in the urban canopy layer while the mid-cost sensors were mostly located at the rooftop level and collocated with wind and temperature sensors. We estimate the storage flux by dividing the control volume into three to four layers and averaging data from different sensors in the same layer. The storage flux is then added to the turbulent flux to estimate net surface emissions. To filter out periods in which this estimate is biased by horizontal advection, we consider horizontal CO2 gradients determined using mid-cost sensors at rooftop sites. This approach is compared to the often-used filtering with a friction velocity threshold.
As expected, the storage flux is most important on days with a pronounced diurnal cycle in atmospheric stability. It reduces the net CO2 emission estimates in the morning hours after sunrise and generally increases these estimates at night. From 1.5 to 5 h after sunrise, this effect amounts on average to -7.3 and -8.0 µmol m-2 s-1 in Zurich and Munich, respectively, while in the first 3.5 hours after sunset, it amounts to +4.7 and +3.0 µmol m-2 s-1 (46% and 24% of the turbulent flux) in Zurich and Munich, respectively. On days with a small diurnal cycle in stability, the storage flux plays a smaller role, especially in winter. We will also present insights in the frequency of horizontal advection and favorable conditions for it. Finally, we will discuss the plausibility of median diurnal cycles of the derived net CO2 emissions, considering the directional dependence on land cover and associated sources and sinks.

How to cite: Sigmund, A., Brunner, D., Chen, J., Hilland, R., Christen, A., Feigenwinter, C., Vogt, R., Emmenegger, L., Kalberer, M., and Stagakis, S.: Leveraging CO2 sensor networks to address challenges in urban eddy-covariance measurements, EGU General Assembly 2026, Vienna, Austria, 3–8 May 2026, EGU26-8997, https://doi.org/10.5194/egusphere-egu26-8997, 2026.

EGU26-9186 | Posters on site | AS2.2

Diagnosing LE  

Marie-Claire ten Veldhuis, Judith Jongen-Boekee, and Bas van de Wiel

Despite its omnipresence in atmospheric models, the Penman-Monteith (PM) equation often fails to represent the latent heat (LE) flux accurately. Deviations of several tens of % between modelled and observed LE flux are not an exception. The original PM equation assumed a constant stomatal resistance in time, but most current atmospheric models implement a varying resistance that depends on atmospheric conditions such as radiation, temperature and vapor pressure, while more recent models account for plant physiological stomata control.

In this study, we present a diagnosis of LE fluxes modelled based on the Penman-Monteith equation combined with a fixed, an environmentally driven and a plant physiology driven stomatal conductance model versus observed LE fluxes by Eddy-Covariance. The analysis covers a decade of observations for a grass and three years for a forest site in the Netherlands. We identify atmospheric conditions where the model and observations most strongly disagree and evaluate the contribution of varying stomatal resistance models in reproducing flux observations. We demonstrate that implementing models that account for varying stomatal conductance in response to atmospheric and soil conditions does not help to improve LE model estimates for these two datasets. We investigate the role of aerodynamic versus stomatal conductance in controlling LE flux as well as the effects of diurnal effects of radiation, VPD and stomatal conductance response and how they differ between the grass and forest sites. The aim is to provide suggestions for conceptual improvements that can help resolve some of the shortcomings in the PM-based LE flux estimation. 

How to cite: ten Veldhuis, M.-C., Jongen-Boekee, J., and van de Wiel, B.: Diagnosing LE , EGU General Assembly 2026, Vienna, Austria, 3–8 May 2026, EGU26-9186, https://doi.org/10.5194/egusphere-egu26-9186, 2026.

EGU26-10099 | ECS | Orals | AS2.2

The essence of the Webb, Pearman and Leuning (WPL) correction: w-  correction 

Hanshu Wang, Yaoming Ma, and Jinshu Chi

Vertical wind velocity (w) and gas density (c) are two key variables for estimating trace gas fluxes using the eddy covariance (EC) technique. For many decades within the EC community, the Webb, Pearman and Leuning (WPL) theory proposed by Webb et al. (1980) has been widely accepted as a “density effect correction” for flux calculations. However, we found that Webb et al. (1980) derived their equations correctly by calculating the unmeasurable mean vertical velocity (

How to cite: Wang, H., Ma, Y., and Chi, J.: The essence of the Webb, Pearman and Leuning (WPL) correction: w-  correction, EGU General Assembly 2026, Vienna, Austria, 3–8 May 2026, EGU26-10099, https://doi.org/10.5194/egusphere-egu26-10099, 2026.

EGU26-10326 | ECS | Orals | AS2.2

The Complex Role of Semi-Arid Afforestation-Atmosphere Interactions In Shaping Local Weather 

Yotam Menachem, Leehi Magaritz-Ronen, Eyal Rotenberg, Lior Hochman, Shira Raveh-Rubin, and Dan Yakir

The effects of desert afforestation, such as those used for climate change mitigation, during extreme heat events remain an important yet unresolved question. The well-studied, semi-arid Yatir pine forest, located at the edge of the Negev Desert, provides a unique lens through which we study land surface-atmosphere interactions.

Due to high incoming solar radiation and low albedo, the Yatir Forest's net radiation is higher than in any other eco-region. The massive radiation load is balanced by large sensible heat flux, which can influence the forest microclimate and create a thermal contrast with the surrounding shrubland. These processes, in turn, can affect near-surface atmospheric conditions and boundary-layer dynamics.  

Here, we combine in-situ measurements with high-resolution ICON-LAM simulations to offer new insights into the role of local afforestation in shaping surface weather and boundary-layer dynamics during extreme heat events. The in-situ observations not only describe the forest’s physical and physiological properties but also provide essential inputs for the model, enabling an integrated framework that captures known forest-scale processes and demonstrates their upscaling effects across the region.

Our simulations of a heat wave event from May 20 to May 24, 2019, reveal midday sensible heat flux increases of up to 300 W m⁻² within the forest, resulting in surface (skin) cooling of up to 15 °C, while simultaneously producing warming of up to 2 °C in 2-m air temperature. These contrasts generate pronounced modifications in wind patterns and a distinct forest-induced circulation. Remarkably, this circulation produces strong local instability even under synoptic conditions dominated by harsh subsidence. Our findings underscore the complex and sometimes counterintuitive role of semi-arid afforestation during extreme heat events, with important implications for land-management strategies under different atmospheric forcing regimes.

How to cite: Menachem, Y., Magaritz-Ronen, L., Rotenberg, E., Hochman, L., Raveh-Rubin, S., and Yakir, D.: The Complex Role of Semi-Arid Afforestation-Atmosphere Interactions In Shaping Local Weather, EGU General Assembly 2026, Vienna, Austria, 3–8 May 2026, EGU26-10326, https://doi.org/10.5194/egusphere-egu26-10326, 2026.

EGU26-10726 | ECS | Posters on site | AS2.2

Influence of Atmospheric Water Harvesting on Coupled Land Surface-Atmosphere Processes 

Richard Owusu, Stefan Kollet, Stefan Poll, and Victor Selmert

Direct Air Capture (DAC) technologies designed for atmospheric water harvesting are increasingly being considered as a means of supplying water for green hydrogen production, particularly in arid and semi-arid regions. However, large-scale moisture removal from the atmosphere may affect the thermodynamics of the planetary boundary-layer, yet the magnitude and spatial characteristics of these impacts remain insufficiently characterized. In this study, we implement a physically based DAC parameterization within the ICOsahedral Nonhydrostatic (ICON) model, using Large-Eddy Simulation (LES) to explicitly resolve land–atmosphere exchange processes. DAC operation is represented as an imposed constant moisture extraction flux subtracted from the surface latent heat flux, with configurations spanning a range of flux densities (0–800 W/m) and deployment scales (4–900 units). Simulations reveal systematic near-surface warming and atmospheric drying associated with DAC operation. From the results High flux densities (>= 400 W/m^2)  1) reduce specific humidity of the local lower atmosphere by ~0.2 g/kg, and that of the land surface by 3.5 g/kg relative to the control, 2) decrease relative humidity by ~4 percentage points, 3) and increase virtual potential temperature by ~0.5 K with no significant regional effect. In addition, Large-scale deployments yield spatially distributed but cumulative effects both at the local and regional scale, producing domain-mean warming of ~0.5 K and specific humidity reductions of ~0.1–0.4 g/kg. These perturbations arise from suppressed evaporative cooling and reduced near-surface moisture availability, which may lead to modified local energy partitioning without fundamentally altering boundary-layer stability in the atmospheric boundary layer. For deployment densities above ~400 units, non-physical negative humidity values emerge, indicating that the extraction of moisture exceeds the atmospheric supply—a flux threshold for single unit DAC operation under the atmospheric conditions used here in the study. The results demonstrate that DAC-induced thermodynamic perturbations are non-negligible at both local and regional scales and can influence turbulent mixing, boundary-layer structure. This work provides a quantitative foundation for incorporating DAC into land-surface design, environmental regulation, and future deployment strategy for atmospheric water harvesting systems.

How to cite: Owusu, R., Kollet, S., Poll, S., and Selmert, V.: Influence of Atmospheric Water Harvesting on Coupled Land Surface-Atmosphere Processes, EGU General Assembly 2026, Vienna, Austria, 3–8 May 2026, EGU26-10726, https://doi.org/10.5194/egusphere-egu26-10726, 2026.

Dynamic sub grid-scale turbulence closures require explicit spatial filtering to separate resolved and sub filter-scale contributions. In unstructured-grid atmospheric models such as ICON, constructing consistent filtering operators is nontrivial due to the triangular mesh and the staggered placement of prognostic variables on cells and edges. This work presents the implementation of a spatial filtering framework for the ICON nonhydrostatic dynamical core, designed as methodological infrastructure for scale-aware turbulence modeling.

A coarse-graining filter based on neighbor averaging has been developed on the ICON triangular grid. Cell-centered variables are filtered using edge-connected neighboring cells, while edge-centered variables are treated consistently using the adjacent cell-edge connectivity. The filter may be applied iteratively to achieve a prescribed effective filter width and is compatible with ICON’s block-based data layout on an unstructured mesh.

The filtering operators are integrated into the diffusion module as a diagnostic operation applied after explicit diffusion and halo synchronization, ensuring consistency across MPI subdomain boundaries. Ongoing work focuses on extending this framework toward a dynamic Smagorinsky-type closure using a test-filter formulation.

How to cite: Baksi, A.: Spatial filtering framework for scale-aware turbulence modeling on the ICON unstructured grid., EGU General Assembly 2026, Vienna, Austria, 3–8 May 2026, EGU26-10777, https://doi.org/10.5194/egusphere-egu26-10777, 2026.

EGU26-11416 | Posters on site | AS2.2

Spatial variability of the diurnal cycle of heat fluxes in the atmospheric boundary layer over agricultural land and forest of the GLAFO site in Stuttgart (Germany) on a clear sky day 

Hans-Stefan Bauer, Lisa Jach, Oliver Branch, Diego Lange, Verena Rajtschan, Volker Wulfmeyer, and Kirsten Warrach-Sagi

Spatial heterogeneity of land use impacts land-atmosphere feedback and therefore the spatial and temporal variability of latent and sensible heat fluxes within the atmospheric boundary layer. This is especially visible during clear sky days without notable advection. 
In spring and summer 2025 at the GEWEX Land Atmosphere Feedback Observatory (GLAFO) site of the University of Hohenheim (Stuttgart, Germany) an extensive field campaign was performed by the research group Land Atmosphere Feedback Initiative (LAFI) funded by the German Research Foundation. During five intensive observation periods (IOPs) the GLAFO equipment, which includes two Eddy-Covariance stations, was extended by Lidar measurements of wind, humidity and temperature.
To study the three-dimensional pattern of the heat fluxes over a heterogeneous surface during the day we applied the Weather Research and Forecasting model (WRF). We used WRF in a nested configuration with resolutions of 1250 m, 250 m and 50 m, forced with ECMWF operational data for a clear sky case study on 24 June 2025. In the two inner domains, WRF was applied in Large-Eddy simulation (LES) mode with switched-off turbulence scheme. The simulated evolution of the planetary boundary layer and the influence of the land surface on its development was compared with the temporal and vertical evolution in data from the lidar systems and eddy-covariance stations. 
In addition, we focused on the vertical representation of latent and sensible heat fluxes at the different model resolutions and their dependence on the underlying land surface. This will reveal the so-called blending height, namely the height at which the horizontal distributions of the fluxes are no longer dependent on the underlying surface. The derivation of this important variable paves the way to a more physical coupling of the land surface and the atmosphere in the model.

How to cite: Bauer, H.-S., Jach, L., Branch, O., Lange, D., Rajtschan, V., Wulfmeyer, V., and Warrach-Sagi, K.: Spatial variability of the diurnal cycle of heat fluxes in the atmospheric boundary layer over agricultural land and forest of the GLAFO site in Stuttgart (Germany) on a clear sky day, EGU General Assembly 2026, Vienna, Austria, 3–8 May 2026, EGU26-11416, https://doi.org/10.5194/egusphere-egu26-11416, 2026.

EGU26-11835 | ECS | Posters on site | AS2.2

Earth’s Green Blanket: A study of Heat Transfer through Grass 

Jelle Steenge, Bas van de Wiel, Marie-Claire ten Veldhuis, Nick Romijn, and Steven van der Linden

Land-atmosphere interactions play a key role in the Earth’s climate. The surface temperature is a key parameter in calculating the latent and sensible heat flux and thus important for the closure of the surface energy balance (SEB). Yet vegetated surfaces have different properties compared to bare soil and thus behave differently. Grass-vegetated surfaces are by far the most common type of land cover, covering over 40 % of all land area. Therefore, accurate modelling of soil and grass temperatures is essential for improving numerical weather prediction models.

In current weather models, the surface temperature is often estimated using an empirical skin resistance model, which may lead to significant errors in both the phase and amplitude of the surface temperature, negatively affecting the closure of the SEB. A more refined and physics-based approach is thus needed for accurate modelling of heat transfer processes in the vegetation-soil continuum.

In this research we investigate a new modelling approach for grass-vegetated and topsoil layers, using both analytical and numerical diffusive modelling approaches, building on the work of Van Dijk (2024), where grass was treated as a homogeneous sponge-layer with a uniform thermal diffusivity. The aim is to capture the temperature dynamics within the grass (and soil) layer and compare these with millimetre-resolution observations using distributed temperature sensing (DTS) measurements, as described in Ter Horst (2025).

Results indicate that a purely diffusive model is accurate in describing the temperature dynamics within the soil, but is not fully able to capture the heat transfer within the vegetation layer accurately. Therefore, adjustments are made to the vegetation ‘sponge’-layer, adding a more realistic height-dependent density and a height-dependent (radiative) source term. 

First results from a rudimentary analytic model already show promising results for temperature profiles in quasi-steady state, both during night- and daytime. Similar temperature profile shapes to the DTS measurements are achieved, that would not have been possible for a purely diffusive model.

How to cite: Steenge, J., van de Wiel, B., ten Veldhuis, M.-C., Romijn, N., and van der Linden, S.: Earth’s Green Blanket: A study of Heat Transfer through Grass, EGU General Assembly 2026, Vienna, Austria, 3–8 May 2026, EGU26-11835, https://doi.org/10.5194/egusphere-egu26-11835, 2026.

EGU26-12061 | ECS | Posters on site | AS2.2

Turbulent Fluxes at a Sub-Arctic Peatland and the Role of Data Processing Choices in Carbon Dynamics 

Jon Cranko Page, Rasmus Jensen, Eero Koskinen, Juho Lämsä, Efrén López-Blanco, Hannu Marttila, Mikhail Mastepanov, Riku Paavola, and Torben R. Christensen

Sub-Arctic peatlands are often delicately poised at the carbon source-sink threshold. With peatlands among the most carbon-dense ecosystems on Earth, they are critical players in global climate regulation, with land–atmosphere feedbacks that can disproportionately influence climate change trajectories. However, peatland carbon dynamics, and whether they act as sources or sinks for carbon, are strongly shaped by local conditions underscoring the need for site-specific measurements of turbulent fluxes and meteorology to predict their future role in the carbon cycle. While eddy-covariance is a common and critical in-situ measurement technique, the choice of pre-processing algorithms has the potential to interfere in the clear interpretation of source or sink classification in transitional peatland regimes .  

Here, we present two years of eddy-covariance observations from a newly established eddy-covariance tower in a fen peatland in northeastern Finland. Our analysis characterises the carbon dynamics at the site and addresses a key methodological challenge that is often overlooked: the uncertainty introduced by the subjective choices inherent in eddy-covariance data processing. By generating multiple datasets using alternative processing algorithms, we quantify the sensitivity of flux estimates at the peatland to these decisions, where processing methods affect conclusions regarding its source-sink status. The results provide motivation for a framework for more robust interpretation of peatland carbon fluxes.

How to cite: Cranko Page, J., Jensen, R., Koskinen, E., Lämsä, J., López-Blanco, E., Marttila, H., Mastepanov, M., Paavola, R., and Christensen, T. R.: Turbulent Fluxes at a Sub-Arctic Peatland and the Role of Data Processing Choices in Carbon Dynamics, EGU General Assembly 2026, Vienna, Austria, 3–8 May 2026, EGU26-12061, https://doi.org/10.5194/egusphere-egu26-12061, 2026.

EGU26-12312 | ECS | Orals | AS2.2

Characterizing Scale-Dependent Variance and Flux Patterns Across Heterogeneous Permafrost Landscapes Using Airborne Measurements 

Guo Lin, Torsten Sachs, Manuel Helbig, Patrick Hogan, and Christoph Lotz

Low-level airborne eddy covariance measurements enable the characterization of how surface heterogeneity in Arctic permafrost regions influences the spatial variability of greenhouse gas exchange. This study uses the Polar-5 aircraft to collect high-frequency (20 Hz) data on wind, CO₂, and CH₄ over the Mackenzie Delta, Canada, in 2013. The aircraft operated at approximately 40–60 m above ground level (AGL), enabling detailed observation of near-surface greenhouse gas flux. Flight legs were partitioned into three regions based on surface-type classifications, elevation, and degree of surface heterogeneity. Using wavelet analyses, the scale-dependent variances and covariances (fluxes) are quantified across horizontal scales ranging from microscale (10 m – 2 km) to mesoscale (2-10 km). The results demonstrate that scalar variances exhibit clear scale dependence, linked to surface types, elevation, and the level of heterogeneity. Specifically, CH₄ and CO₂ concentrations and fluxes exhibit enhanced small-scale variability over highly heterogeneous terrain, whereas wetland- and lake-dominated regions are characterized by stronger mesoscale variability. By partitioning the domain into three regions, we highlight how the underlying state of permafrost and surface classification jointly affect greenhouse gas flux. Our findings provide a process-based framework that connects heterogeneity level, variance scaling, and the detectability of airborne fluxes in Arctic permafrost landscapes, thereby enhancing the interpretation of aircraft eddy covariance measurements for regional greenhouse gas budgets, compared to flux tower measurements.

How to cite: Lin, G., Sachs, T., Helbig, M., Hogan, P., and Lotz, C.: Characterizing Scale-Dependent Variance and Flux Patterns Across Heterogeneous Permafrost Landscapes Using Airborne Measurements, EGU General Assembly 2026, Vienna, Austria, 3–8 May 2026, EGU26-12312, https://doi.org/10.5194/egusphere-egu26-12312, 2026.

EGU26-13286 | Orals | AS2.2

Revisiting the Surface Energy Imbalance with Observed Kinetic Energy Dissipation Guided by the Generalized Thermal Energy Balance 

Jielun Sun, Gary Gary Granger, Steve Oncley, Chris Roden, Sebastian Hoch, and Chenning Tong

The disagreement between observed and theoretically expected thermal energy balances in a soil–air system at the ground surface, known as the surface energy imbalance (SEI), has been observed for over 80 years. This intriguing puzzle is marked by a systematic diurnal variation of the SEI across different surface types, beyond observational uncertainties. Guided by total energy conservation, the generalized thermal energy balance equation indicates that the traditional thermal energy balance equation based on the first law of thermodynamics would result in stability-dependent biases. Specifically, it would overestimate the thermal energy increases under convective conditions, underestimate them under stable conditions, and agree with the generalized thermal energy balance under neutral conditions. Considering the diurnal variation of the atmospheric stability within the atmospheric surface layer, these systematic biases align precisely with what field observations reveal in the SEI conundrum. In other words, the observed SEI suggests that a non-isothermal atmosphere is governed by total energy conservation. Furthermore, the limitation of the traditional thermal energy balance equation may also help explain several actively researched issues in the atmospheric boundary layer community, such as the dissimilarity between vertical temperature and humidity profiles under convective conditions and the difficulty of simulating the stable atmospheric boundary layer, including morning and evening transitions.

Turbulence kinetic energy dissipation is estimated using 4-k Hz hot-film observations at four observation heights ranging from 0.5 to 4 m. Its dependence on the atmospheric stability and wind speed is consistent with the development of turbulence driven by both thermal and mechanical forcing. These observations further demonstrate the important contribution of thermal energy transfer to kinetic energy changes, as revealed by the generalized thermal energy balance equation. Overall, this investigation provides additional evidence for the importance of interactions between kinetic and thermal energy variations in explaining the observed surface energy imbalance.


Acknowledgements: The research is supported by the U.S. National Science Foundation, AGS-2231229.


How to cite: Sun, J., Gary Granger, G., Oncley, S., Roden, C., Hoch, S., and Tong, C.: Revisiting the Surface Energy Imbalance with Observed Kinetic Energy Dissipation Guided by the Generalized Thermal Energy Balance, EGU General Assembly 2026, Vienna, Austria, 3–8 May 2026, EGU26-13286, https://doi.org/10.5194/egusphere-egu26-13286, 2026.

EGU26-13661 | ECS | Posters on site | AS2.2

Insights into planetary boundary layer height estimation from the Southern Ontario LIDar (SOLID) Mesonet  

Petra Duff, Robert Crawford, Elisabeth Galarneau, Audrey Lauer, Sylvie Leroyer, Zen Mariani, and Kimberly Strong

Planetary boundary layer height (PBLh), despite being key to atmospheric modelling parametrizations, remains difficult to consistently define, model, and observe. The Southern Ontario Lidar (SOLID) Mesonet, established by Environment and Climate Change Canada (ECCC) in and around Toronto beginning in 2022, provides an opportunity for high spatial and temporal resolution estimates of the PBLh in diverse atmospheric conditions. We present a Doppler lidar-derived PBLh data product using SOLID Mesonet observations, assessed in comparison to PBLh estimates from ECCC’s Global Environmental Multiscale (GEM) model, ERA5, and nearby radiosonde flights in Buffalo, NY. These comparisons highlight the uncertainties between various methods for PBLh estimation, particularly in stable atmospheric conditions such as overnight and in winter months, and give key insights into the accuracy of PBLh estimates for usage in atmospheric modelling as well as avenues for improvements.

How to cite: Duff, P., Crawford, R., Galarneau, E., Lauer, A., Leroyer, S., Mariani, Z., and Strong, K.: Insights into planetary boundary layer height estimation from the Southern Ontario LIDar (SOLID) Mesonet , EGU General Assembly 2026, Vienna, Austria, 3–8 May 2026, EGU26-13661, https://doi.org/10.5194/egusphere-egu26-13661, 2026.

EGU26-13713 | ECS | Orals | AS2.2

A four-Doppler Lidar study to quantify spatio-temporal heterogeneity of wind statistics over a deciduous forest during the LEAFF campaign 

Matteo Puccioni, Sonia Wharton, Stephan De Wekker, Robert Arthur, Tianyi Li, Ye Liu, Sha Feng, Kyle Pressel, Raj Rai, Larry Berg, and Jerome Fast

One fundamental assumption of surface layer flow theory is homogeneity over a horizontal plane, a hypothesis systematically challenged for many atmospheric flows. For example, variability in terrain elevation, presence of heterogeneous roughness sub-layers and mesoscale motions can alter the spatio-temporal flow evolution even over small distances (≈1 km). In this scenario, the experimental investigation of air-land interactions requires simultaneous data acquisitions at multiple sites, against which the hypothesis of flow homogeneity can be assessed. The Appalachian Mountains (in the Southeastern United States) represent a compelling environment to resolve complex flows over small distances due to their irregular terrain (800-1500 m elevation above sea level) and presence of moderately tall deciduous forests (~20 m) and open fields constituting an uneven roughness sub-layer. In this work, three nearby instrument sites (within 2 km of each another) are investigated as part of the Lidar Experiments for Assessing Flow over Forests (LEAFF) campaign located in and around a deciduous forest in mountainous Virginia (U.S.). Ten months of wind statistics are resolved both within the canopy by a well instrumented flux tower, and above it via four remote sensing Doppler Lidar (up to 300 m above ground, i.e. ≈15 times the forest height), thereby resolving the turbulent flow developing over a roughness sublayer with high statistical accuracy. The goal of the present analysis is twofold. First, to quantify the monthly variability of wind statistics induced by the annual cycles of leaf senescence and synoptic winds. Second, to quantify the heterogeneity of the wind statistics between different but closely spaced sites across different months. A year’s worth of data showed that the wind statistics are predominantly affected by synoptic forcing, while the leaf senescence cycle plays a marginal role in shaping mean wind and turbulence within the surface . Additionally, site-to-site heterogeneity is found to change following a monthly time scale, a result emphasizing the importance of selecting a sufficiently long observational period to correctly address site heterogeneity under different background flow conditions. The present study provides a compelling observational dataset to validate  numerical weather prediction tools accounting for the presence of a forest sub-layer, as well as improving our understanding of the physical mechanisms inducing flow heterogeneities over complex terrains.

How to cite: Puccioni, M., Wharton, S., De Wekker, S., Arthur, R., Li, T., Liu, Y., Feng, S., Pressel, K., Rai, R., Berg, L., and Fast, J.: A four-Doppler Lidar study to quantify spatio-temporal heterogeneity of wind statistics over a deciduous forest during the LEAFF campaign, EGU General Assembly 2026, Vienna, Austria, 3–8 May 2026, EGU26-13713, https://doi.org/10.5194/egusphere-egu26-13713, 2026.

EGU26-14605 | Orals | AS2.2

When Rain Meets Heat: Drivers of Peak Carbon Uptake in East African Drylands 

Lutz Merbold, Vincent Odongo, Matti Räsänen, Julius Omondi, Juuso Tuure, Francesco Fava, Petri Pellikka, Timo Vesala, Janne Heiskanen, Janne Rinne, Marcin Jackowicz-Korczynski, Martin Wooster, Thomas Dowling, Matthias Mauder, Rodolfo Ceriani, and Sonja Leitner

Semi-arid landscapes dominate much of Kenya, yet their contribution to regional carbon cycling remains poorly constrained, particularly regarding how peak ecosystem photosynthetic capacity responds to highly variable wet-season rainfall. Here, we synthesize eddy covariance observations from four contrasting Kenyan dryland ecosystems, including natural savannas—a managed savanna grassland at Kapiti and a wooded savanna at Choke—and croplands—a smallholder system at Maktau and a commercial farm at Ausquest. We examine how rainfall, canopy development, and atmospheric demand jointly regulate maximum net ecosystem CO₂ uptake (NEEₘₐₓ) during the wet season, when most annual carbon assimilation occurs and interannual variability in precipitation pulses is pronounced.

Site-specific relationships between rainfall and NEEₘₐₓ were derived, and responses to temperature and vapour pressure deficit (T–VPD) were analysed under light-saturated conditions to disentangle water supply effects from atmospheric constraints on photosynthesis. Across all sites, rainfall primarily acted as a trigger for peak carbon uptake, with NEEₘₐₓ increasing rapidly following rainfall onset but saturating once sufficient soil moisture supported canopy development. In natural savanna ecosystems, increasing rainfall consistently led to higher maximum leaf area index (LAIₘₐₓ) and enhanced NEEₘₐₓ, while differences between grassland and wooded savanna reflected contrasts in vegetation structure and rooting depth. In contrast, croplands exhibited a muted rainfall–NEEₘₐₓ response, with peak uptake largely governed by cropping cycles, crop type, and management practices rather than total rainfall amounts.

Under high-light conditions, temperature and VPD imposed a common upper bound on NEEₘₐₓ across all ecosystems, defining a narrow envelope of maximum photosynthetic capacity. These results demonstrate that peak carbon uptake in East African drylands emerges from interacting controls of rainfall timing, canopy development, vegetation structure, and atmospheric demand and is modulated by management and land use. Our findings provide critical constraints for land–atmosphere coupling in understudied dryland regions and have important implications for modelling carbon cycle responses under increasing rainfall variability and land-use change.

How to cite: Merbold, L., Odongo, V., Räsänen, M., Omondi, J., Tuure, J., Fava, F., Pellikka, P., Vesala, T., Heiskanen, J., Rinne, J., Jackowicz-Korczynski, M., Wooster, M., Dowling, T., Mauder, M., Ceriani, R., and Leitner, S.: When Rain Meets Heat: Drivers of Peak Carbon Uptake in East African Drylands, EGU General Assembly 2026, Vienna, Austria, 3–8 May 2026, EGU26-14605, https://doi.org/10.5194/egusphere-egu26-14605, 2026.

EGU26-14918 | ECS | Posters on site | AS2.2

A method to reduce sampling bias in multi-level tall-tower eddy covariance systems 

Konstantinos Kissas, Anastasia Gorlenko, Ziqiong Wang, Susanne Wiesner, Charlotte Scheutz, and Andreas Ibrom

Tall-tower eddy covariance (TTEC) systems are increasingly used to monitor land–atmosphere exchanges over complex agricultural and urban landscapes. However, interpreting flux estimates is challenging because the eddy covariance footprint varies significantly with meteorological conditions, which can introduce considerable bias assuming that sources and sinks are not uniformly distributed across the landscape or over the diel cycle. For fluxes with systematic diurnal patterns, such as traffic-related emissions, photosynthesis, or agricultural activities, uneven temporal sampling can prevent capturing a full daily cycle, introducing temporal sampling bias into daily flux estimates. The objective of this study was to evaluate the performance of a multi-level TTEC system in reducing footprint-related sampling bias.

The study site is located in an agricultural landscape west of Copenhagen, Denmark. A 15-month dataset (2023-2024) was collected, representing a heterogeneous landscape dominated by grassland and cropland, with scattered settlements, hedgerows, and forested areas. The TTEC system was installed on a 300 m telecommunication tower and equipped with three measurement levels at 70, 90, and 115 m. These sampling heights were selected a priori based on flux footprint estimates from wind data of a nearby tall tower, ensuring a more uniform footprint at a wider range of atmospheric stability conditions. Each level was equipped with a 3D ultrasonic anemometer (uSonic-3 Class A MP, METEK, Germany). A fast-response gas analyser was connected to the system and configured to sample air from one of the three heights at a time based on criteria related to optimal footprint size and constant flux layer requirements.

The results of the study showed that a greater number of observations were collected at the upper sampling height during daytime whereas nighttime observations were predominantly obtained from the lower level. The intermediate level was primarily used during the transition periods between day and night. The multi-level sampling scheme enabled a substantial reduction in sampling bias by actively controlling the horizontal extent of the flux footprint compared to a single-level TTEC system. Consequently, footprint size and the relative contributions of different land-cover types were more consistent across atmospheric stability regimes. The findings from this study highlight the importance of implementing a multi-level approach, particularly for TTEC systems operating over landscapes with greater heterogeneity than those typically sampled by conventional eddy covariance systems.


Acknowledgements

This project is supported by the Independent Research Fund Denmark (DFF-grant 1127-00308B - Observation System of Greenhouse Gas Sources and Sinks at the Landscape Scale for Verification of the Green Transition of Denmark). The authors wish to thank Cibicom A/S for sponsoring access to Hove telecommunication tower. 

How to cite: Kissas, K., Gorlenko, A., Wang, Z., Wiesner, S., Scheutz, C., and Ibrom, A.: A method to reduce sampling bias in multi-level tall-tower eddy covariance systems, EGU General Assembly 2026, Vienna, Austria, 3–8 May 2026, EGU26-14918, https://doi.org/10.5194/egusphere-egu26-14918, 2026.

EGU26-15855 | ECS | Posters on site | AS2.2

On the Role of Land-Atmosphere Coupling in Boundary Layer Cloud Development Over a Mixed Forest in Eastern Canada  

Lukas Rudaitis, Manuel Helbig, Xiaoli Zhou, Deklan Mengering, and Janna Heerah

Forests regulate moisture and heat fluxes in the lower atmosphere, which are inextricably linked to fair weather shallow cumulus formation within the boundary layer. Forest enhanced cloud shading thereby affects the earth’s surface radiation budget, a phenomenon that has been reasonably well studied through modelling and large-scale satellite studies. However, there is a lack of surface-based observational studies linking surface fluxes to cloud formationBy combining flux tower and ceilometer measurements in a mixed Acadian (Atlantic Canadian) forest near Fredericton, New Brunswick, we gain a unique opportunity to study land-cloud coupling using these local, surface-based flux observations. Analysis of 30-minute averaged surface-based tower measurements reveals fair weather summertime shallow cumulus formation over a 3-year period (2023-2025). Shallow cumuli occur on 160 days in total, exhibiting a clear seasonal cycle with a pronounced peak between June and August. We employ machine learning to determine the importance of environmental drivers and surface fluxes on daytime cloud fraction and cloud base height on days with shallow cumuli, with surface moisture exhibiting the strongest influence. Additionally, we show the response of shallow cumulus to extreme surface conditions by examining the period between August and September 2025. Fredericton experienced anomalously dry conditions, receiving only ~15% and ~40% of normal precipitation in August and September, respectively, during which soil moisture falls to 30% typical late-summer values. We find a significant reduction in shallow cumulus formation during the dry conditions, which we hypothesize is caused by the shift of surface flux partitioning from latent to sensible heating, and the concurrent enhancement of daytime lifting condensation level growth. 

How to cite: Rudaitis, L., Helbig, M., Zhou, X., Mengering, D., and Heerah, J.: On the Role of Land-Atmosphere Coupling in Boundary Layer Cloud Development Over a Mixed Forest in Eastern Canada , EGU General Assembly 2026, Vienna, Austria, 3–8 May 2026, EGU26-15855, https://doi.org/10.5194/egusphere-egu26-15855, 2026.

EGU26-16149 | Orals | AS2.2

On controlling regional greenhouse gas emission inventories with landscape scale flux observations 

Andreas Ibrom, Konstantinos Kissas, Anastasia Gorlenko, Ziqiong Wang, Susanne Wiesner, and Charlotte Scheutz

Effective greenhouse gas (GHG) emission policies rely on accurate and actual GHG emission data. Uncertainties in inventories arise from limited knowledge of actual activity data, the technology actually used and local ecosystem features that altogether need to be considered when estimating GHG emissions from a specific area. Independent monitoring and verification are expected to increase credibility of inventory reports and scenario estimations, ideally at the same spatial and temporal level of integration as the desired GHG inventory.

One key challenge to verify distributed anthropogenic GHG emissions with measured net GHG fluxes is that conventional GHG flux observation techniques are limited to process, facility or ecosystem scales and do rarely integrate over a representative fraction of the gross anthropogenic GHG fluxes in a region or country. We developed and built an observation system based on tall tower eddy covariance as one of the pillars of a future measurement based Danish national GHG observation system and explore its effectiveness to observe the integrated GHG exchange in a representative agricultural landscape.

We measured CO2, CH4, N2O and CO exchanges from a telecommunication mas (Hove, in a Danish agricultural landscape, West of Copenhagen (N 55.716, E12.238) for 15 months. We placed substantial efforts on estimating the origin of the measured fluxes and used this information to improve comparability of observed GHG exchanges with regional IPCC GHG emission inventories comparable.

The presentation focusses on 1. necessary processing steps for estimation of annual net GHG exchange budgets (spectral correction, data quality filtering and gap filling). 2. a novel “flux-landscape approach” to define a common reference area with inventories, and 3. an overview over the results of the comparison between observed GHG exchange and local IPCC inventory.

From these results we conclude that such comparisons strongly depend on the distinction of gross fluxes that are relevant for GHG accounting and reporting from other, biotic fluxes that are currently not climate policy relevant. This is particularly challenging for CO2, where we observe a strong net uptake, while the inventory is dominated by gross emissions.

We acknowledge funding by DFF (Independent Research Fund Denmark, ref. 1127-00308B) and sponsoring by CIBICOM A/S Ballerup Denmark.

How to cite: Ibrom, A., Kissas, K., Gorlenko, A., Wang, Z., Wiesner, S., and Scheutz, C.: On controlling regional greenhouse gas emission inventories with landscape scale flux observations, EGU General Assembly 2026, Vienna, Austria, 3–8 May 2026, EGU26-16149, https://doi.org/10.5194/egusphere-egu26-16149, 2026.

EGU26-16151 | Posters on site | AS2.2

Impact of Vertical Mixing on CO2 Simulations during the ASIA-AQ campaign 

Mina Kim, Rokjin J. Park, Jingi Jung, Sang-ik Oh, and Jaein I. Jeong

Uncertainty in vertical mixing is a major source of error in simulations of long-lived trace gases such as CO2 in atmospheric chemical transport models. We perform a set of sensitivity experiments with the GEOS-Chem model by applying different scaling factors to the vertical eddy diffusivity (Kz), thereby varying the strength of vertical mixing. Model results are evaluated using aircraft observations from the ASIA-AQ campaign conducted over Asia, a major anthropogenic CO2 source region where simulations are particularly sensitive to the representation of vertical mixing. The observations cover a wide range of boundary-layer and free-tropospheric conditions. Model–observation agreement is quantified using a suite of statistical metrics. Simulations with weaker vertical mixing consistently show better agreement with aircraft observations across regions than the default model configuration. The improved agreement reflects a better representation of the observed vertical and temporal variability. This study suggests that vertical mixing in GEOS-Chem may be overestimated over Asia and provides a basis for improving the model representation of vertical transport. 

How to cite: Kim, M., Park, R. J., Jung, J., Oh, S., and Jeong, J. I.: Impact of Vertical Mixing on CO2 Simulations during the ASIA-AQ campaign, EGU General Assembly 2026, Vienna, Austria, 3–8 May 2026, EGU26-16151, https://doi.org/10.5194/egusphere-egu26-16151, 2026.

EGU26-17086 | Posters on site | AS2.2

Quantifying Water Stress in Acer pictum subsp. mono and Hovenia dulcis Seedlings Using Thermal Imaging and Sap Flux 

Han Doo Shin, Seoyoung Park, Jiwon Baek, Ahreum Yun, Taegyu Lee, Minsu Lee, Kunhyo Kim, Jeonghyun Hong, and Hyun Seok Kim

 Land–atmosphere interactions at the leaf scale play a critical role in regulating surface energy exchange and plant water use under increasing heat and drought, yet quantitative indicators capturing short-term thermal–hydraulic coupling remain limited. This study compared seedlings of Acer pictum subsp. mono, with highly dissected leaves and low boundary-layer resistance, and Hovenia dulcis, with smoother leaves and thicker boundary layers, to test how leaf morphology constrains thermal and hydraulic regulation. Seedlings were exposed to well-watered, control, and severe-drought treatments, creating a clear soil-moisture gradient, while leaf temperature and sap flux were monitored alongside key environmental drivers. This design enabled evaluation of short-term leaf temperature variability (ΔT, 5-min scale) and its coupling with radiation and transpiration across contrasting water conditions.

 Across both species, ΔT was most strongly coupled with changes in photosynthetically active radiation(PAR). In A. mono, the PAR increase threshold triggering synchronized ΔT responses declined under severe drought (≈103 μmol m⁻² s⁻¹) relative to well-watered conditions (≈135 μmol m⁻² s⁻¹), whereas H. dulcis showed no significant treatment dependence. Under identical PAR reduction levels, higher sap velocity consistently enhanced leaf temperature declines, indicating transpiration-driven amplification of short-term cooling. At high temperatures (30–35 °C), A. mono maintained strong cooling responses, while H. dulcis exhibited flattened sap–ΔT relationships and increased ΔT amplitude under severe drought (≈5.0 °C). These results demonstrate that short-term leaf cooling emerges from the interaction between radiation forcing and transpiration, with species-specific constraints imposed by leaf morphology and hydraulic limitation. Integrating ΔT, PAR, and sap flux provides a quantitative framework for comparing thermal–hydraulic strategies among species and offers a sensitive tool for early diagnosis of drought vulnerability at the seedling stage.


How to cite: Shin, H. D., Park, S., Baek, J., Yun, A., Lee, T., Lee, M., Kim, K., Hong, J., and Kim, H. S.: Quantifying Water Stress in Acer pictum subsp. mono and Hovenia dulcis Seedlings Using Thermal Imaging and Sap Flux, EGU General Assembly 2026, Vienna, Austria, 3–8 May 2026, EGU26-17086, https://doi.org/10.5194/egusphere-egu26-17086, 2026.

EGU26-17305 | Orals | AS2.2

Disentangling the Effects of Forest Structural Heterogeneity on Observed Ecosystem Carbon and Water Fluxes 

Enrico Tomelleri, Anna Candotti, Torben Callesen, and Leonardo Montagnani
Eddy covariance (EC) measurements are essential to characterising biosphere–atmosphere exchanges of carbon (Net Ecosystem Exchange, NEE) and water vapour (Evapotranspiration, ET). However, their interpretation of structurally complex forest canopies remains challenging. EC fluxes integrate spatially variable source areas that are commonly treated as functionally homogeneous, neglecting the role of vegetation structural heterogeneity in regulating observed NEE and ET. Addressing this limitation is critical for improving flux interpretation and land-surface model parameterisation across heterogeneous forest ecosystems. We present a transferable, footprint-based framework. It integrates half-hourly EC fluxes with high-resolution Aerial Laser Scanning (ALS) data to explicitly resolve within-footprint vegetation structural heterogeneity. Using a two-dimensional flux footprint model (Kljun et al., 2015), EC fluxes were assigned according to the spatial contribution of distinct vegetation structural classes. This enables analysis of functional relationships between fluxes and the environment under comparable atmospheric forcing. The approach revealed substantial and systematic differences in both flux magnitude and functional responses among vegetation structural classes. Median differences reached up to 20 µmol m⁻² s⁻¹ for NEE and up to 5 mmol m⁻² s⁻¹ for ET. Light-response parameters and water-use efficiency varied consistently between structural groups. Our results underscore the importance of footprint heterogeneity characterisation for interpreting functional relationships in structurally complex forest ecosystems. By explicitly accounting for spatial heterogeneity within EC footprints, this framework provides a scalable pathway to link vegetation structure with ecosystem-scale carbon and water fluxes. The proposed framework is transferable to other EC sites. It offers the potential to improve the parameterisation of land-surface and dynamic global vegetation models, and ultimately to enhance predictions of biosphere–atmosphere exchange of matter and energy.

How to cite: Tomelleri, E., Candotti, A., Callesen, T., and Montagnani, L.: Disentangling the Effects of Forest Structural Heterogeneity on Observed Ecosystem Carbon and Water Fluxes, EGU General Assembly 2026, Vienna, Austria, 3–8 May 2026, EGU26-17305, https://doi.org/10.5194/egusphere-egu26-17305, 2026.

Atmospheric CO₂ measurements provide essential constraints for carbon-budget estimates and atmospheric modelling. Virtual tall tower (VTT) methods are a promising, but yet underexamined approach for upscaling ecosystem-level CO₂ concentrations measured at eddy covariance (EC) sites (typically 2–50 m above ground) to atmospheric measurements representative of tall towers (TT; ~100 m and higher). Implementing VTT approaches at existing EC stations could therefore expand the currently sparse network of TT observations. In this study, we evaluate the applicability of a VTT approach using collocated EC–TT measurements. We use 2024 data from the combined ecosystem-atmosphere station Svartberget site in northern Sweden (SE-Svb, SVB), part of the ICOS (Integrated Carbon Observation System) network, with brief examples from one or more other sites. A key advantage of the ICOS Svartberget station is that ecosystem EC and atmospheric TT measurements are available at the same location, with EC observations at 35 m and TT measurements at 35 m and 150 m. The 35 m TT measurements are an important asset for post-hoc calibration correction of the concentrations measured by the EC system, since state-of-the-art EC stations typically do not meet the high calibration requirements of a TT measurement. We implemented the VTT method proposed by Haszpra et al. (2015) and tested the gradient functions of Patton et al. (2003) and Wang et al. (2007) to define a base-run configuration. We then performed a sensitivity analysis of key variables in the VTT formulation. Model performance was evaluated using bias, root mean square error (RMSE), and correlation, by comparing VTT-estimated CO₂ concentrations at the TT top height (150 m) against measured TT concentrations. For 2024, approximately 30% of valid hourly data points met the well-mixed criteria required for VTT application. When treating EC calibration and VTT calculations as separate steps, EC calibration exerted the largest influence on estimated CO₂ at TT height, highlighting calibration as a critical prerequisite for reliable mixed-layer concentration estimates. Sensitivity analysis further showed that, when accounting for both numerical perturbations and measurement uncertainty, the planetary boundary layer height was the most influential variable, producing the largest changes in performance statistics relative to the target TT concentrations. Taken together, these results suggest that VTT approaches could increase the coverage of TT-representative atmospheric CO₂ estimates. Improving planetary boundary layer height (PBLH) estimates should further increase VTT accuracy. Further steps, VTT performance should be tested across additional sites and time periods to assess robustness under different conditions.

How to cite: Marcon-Henge, L., Graf, A., and Peichl, M.: Performance of a Virtual Tall Tower (VTT) approach for estimating CO2 concentrations in the mixed layer from eddy covariance measurements near the surface, EGU General Assembly 2026, Vienna, Austria, 3–8 May 2026, EGU26-17469, https://doi.org/10.5194/egusphere-egu26-17469, 2026.

A unified probability density function (PDF) parameterization for subgrid moist convection and turbulence is developed using a Lagrangian stochastic modeling (LSM) approach. The model solves the transport equations of the joint PDF of turbulent velocity and passive scalars by tracking an ensemble of stochastic particles governed by coupled stochastic differential equations (SDEs). Building on previously developed SDEs for particle velocity and temperature, the LSM is extended to represent inhomogeneous stratified turbulence and its entrainment process. Furthermore, using Lagrangian particle tracking data obtained from large-eddy simulations (LES) of boundary layer and moist convection cases, the SDEs are refined and their parameters are optimized to reproduce the Lagrangian statistics diagnosed from the LES. In the proposed model, turbulence statistics and turbulent fluxes are obtained directly from particle ensembles, providing a full representation of the turbulence PDF without invoking traditional closure assumptions for turbulent transport. The proposed model is evaluated against LES results for convective and stable atmospheric boundary layer (ABL) cases, including shallow convection cases. In convective regimes, the LSM realistically captures entrainment processes and reproduces mean thermodynamic profiles and turbulent fluxes that closely agree with LES results. The simulated joint PDFs exhibit pronounced non-Gaussian features and PDF separation in the entrainment zone. In stable ABL simulations, the LSM predicts realistic turbulence intensities and mean profiles, with near-Gaussian PDFs consistent with LES results. In the shallow convection case, the model simulates realistic vertical structures and variability of convection in the cloud layer. These results demonstrate that the proposed LSM framework provides a physically consistent and flexible approach for simulating both moist convection and turbulence with a full representation of the subgrid-scale PDF.

How to cite: Shin, J.: Unified PDF Parameterization of Subgrid Moist Convection and Turbulence Using a Lagrangian Stochastic Approach, EGU General Assembly 2026, Vienna, Austria, 3–8 May 2026, EGU26-18158, https://doi.org/10.5194/egusphere-egu26-18158, 2026.

EGU26-20490 | ECS | Posters on site | AS2.2

Data-Driven Parameterisations for the Multiscale Lorenz 96 System  

Miriam Ridao

Data-driven parameterisations offer a promising route to improving the representation of unresolved processes in geophysical models. In this work, the two-timescale Lorenz 96 system is used as a controlled testbed to systematically compare deterministic, stochastic, and memory-aware machine-learning closures. A range of architectures are implemented, including multilayer perceptrons, convolutional networks, recurrent models, and conditional generative approaches, and are evaluated in both offline and online settings using weather-style forecast metrics and long-term climatological diagnostics. The results show that models incorporating physically motivated inductive biases, such as stochasticity, spatial structure, or temporal memory, outperform simpler deterministic and memoryless closures. In particular, stochastic generative models and recurrent networks better reproduce regime behaviour, spatio-temporal correlations, and long-term statistics, highlighting the importance of representing intrinsic variability and non-Markovian effects. Ongoing and future work will extend this framework to more realistic dynamical systems, including quasi-geostrophic and primitive-equation models, with a focus on enforcing physical consistency, incorporating explicit memory effects, and developing hydrid physics-machine learning closures. 

How to cite: Ridao, M.: Data-Driven Parameterisations for the Multiscale Lorenz 96 System , EGU General Assembly 2026, Vienna, Austria, 3–8 May 2026, EGU26-20490, https://doi.org/10.5194/egusphere-egu26-20490, 2026.

EGU26-20896 | Posters on site | AS2.2

How important is the entrainment flux for characterizing land-atmosphere feedback in the convective boundary layer? 

Volker Wulfmeyer, Frank Beyrich, Thomas Jagdhuber, Harald Kunstmann, Matthias Mauder, Stan Schymanski, Christoph Thomas, Oliver Branch, Verena Rajtschan, Joachim Ingwersen, Natalie Orlowski, Florian Hellwig, Pauline Seeburger, Claudia Voigt, Benjamin Fersch, Anna Winkelmann, Linus von Klitzing, Moritz Schumacher, Andreas Behrendt, and Diego Lange

A high quality of the representation of land-atmosphere (L-A) feedbacks is fundamental for advancing the performance of weather forecasts, seasonal simulations, and climate projections. These feedbacks are due to a highly complex interaction of variables related to the exchange and conservation of momentum, energy, and mass. The Land-Atmosphere Feedback Initiative (LAFI, see https://www.lafi-dfg.de) is the Collaborative Research Unit 5639 funded by the German Research Foundation (DFG). The overarching goal of LAFI is to understand and quantify L-A feedbacks via unique synergistic observations and model simulations from the micro-gamma (» 2 m) to the meso-gamma (» 2 km) scales from diurnal to seasonal time scales.

The fundament to reach this goal is provided by the observation of L-A system processes and feedbacks at the Land-Atmosphere Feedback Observatory (LAFO) of the University of Hohenheim in Stuttgart, Germany. Here, a worldwide-unparalleled synergy of measurements is realized including water stable isotopes, temperature by fiber-optic distributed sensors, and a suite of atmospheric variables with turbulence resolution using scanning lidar systems.

A key research objective of LAFI is to quantify entrainment in the convective boundary layer (CBL), to separate and quantify related processes such as engulfment, and to derive similarity relationships for parameterizing entrainment fluxes. We will present first measurements of entrainment fluxes at LAFO with lidar synergy, which are typically on the order of 100-200 W/m2 around noon with respect to the latent heat. These new measurements allow for quantifying the flux divergences in the CBL that are an essential part of the heat and water-vapor budget equations. Furthermore, we will relate the entrainment flux to surface variables for characterizing feedback metrics such as the relative humidity tendency and the mixing diagram. Finally, we will present an outlook of future work and its collaboration and coordination with the Global Land-Atmosphere System Studies (GLASS) Panel of the Global Energy and Water Exchanges (GEWEX) project.

How to cite: Wulfmeyer, V., Beyrich, F., Jagdhuber, T., Kunstmann, H., Mauder, M., Schymanski, S., Thomas, C., Branch, O., Rajtschan, V., Ingwersen, J., Orlowski, N., Hellwig, F., Seeburger, P., Voigt, C., Fersch, B., Winkelmann, A., von Klitzing, L., Schumacher, M., Behrendt, A., and Lange, D.: How important is the entrainment flux for characterizing land-atmosphere feedback in the convective boundary layer?, EGU General Assembly 2026, Vienna, Austria, 3–8 May 2026, EGU26-20896, https://doi.org/10.5194/egusphere-egu26-20896, 2026.

EGU26-21639 | ECS | Posters on site | AS2.2

Enhancing Great Plains Nocturnal Precipitation and Low-Level Jets in AM4 with an Extended CLUBB Closure 

Emanuele Silvio Gentile, Vince Larson, Ming Zhao, Colin Zarzycki, and Gunilla Svensson

We extend the Cloud Layers Unified by Binormals (CLUBB) turbulence scheme within the GFDL atmospheric model (AM4) by implementing direct momentum-flux prognosis and a multiscale turbulent length scale, to improve the simulation of nocturnal precipitation and associated Low-Level Jets (LLJs) over the Great Plains (GP). Towards this aim, we set up four AM4-CLUBB configurations: diagnosed momentum flux, prognosed momentum flux, diagnosed momentum flux with a multiscale turbulent lengtshcale, and prognosed momentum flux with a multiscale turbulent lengtshcale. Simulations are evaluated against the AM4 control, the Integrated Multi-satellitE Retrievals for GPM (IMERG), and the Doppler wind radar profiles from the Atmospheric Radiation Measurement (ARM) program. Results show that all AM4-CLUBB configurations improve the precipitation timing from the unrealistic midday peak seen in the AM4 control simulation toward the satellite-observed nocturnal maximum. The configuration that prognoses momentum flux and uses a multi-scale turbulent length scale, best matches the timing and intensity of GP precipitation rate. This configuration is also that which more accurately simulates the ARM-observed nocturnal LLJ wind profiles, while increasing the frequency of counter-gradient momentum fluxes near the LLJ core compared to prognosing momentum fluxes with the original AM4-CLUBB turbulent lengthscale. Momentum budget analysis attributes this increase to a nearly fivefold enhancement in the buoyancy production term when using the multiscale formulation, and leads to stronger nocturnal convective activity, as diagnosed from the greater vertical velocity skewness and plume asymmetry.

How to cite: Gentile, E. S., Larson, V., Zhao, M., Zarzycki, C., and Svensson, G.: Enhancing Great Plains Nocturnal Precipitation and Low-Level Jets in AM4 with an Extended CLUBB Closure, EGU General Assembly 2026, Vienna, Austria, 3–8 May 2026, EGU26-21639, https://doi.org/10.5194/egusphere-egu26-21639, 2026.

EGU26-22783 | Posters on site | AS2.2

Towards dynamic closures for higher-order turbulence schemes 

Georgios Efstathiou and Peter Clark

Starting from the spatially filtered equations in the large-eddy simulation (LES) regime,
commonly used turbulence closures assume a local equilibrium between turbulence
production and dissipation, with the closure parameters representing the continuous
cascade of energy from the resolved to the subgrid scales. However, away from grid
resolutions that adequately resolve the inertial subrange of turbulence, this equilibrium
assumption breaks down. Moreover, at such resolutions, the dominant turbulent eddies
are only partially resolved, and the appropriate values of the closure parameters are
generally unknown.
In this study, we explore a dynamic closure for a prognostic turbulent kinetic energy
(TKE) scheme in a quasi-steady convective boundary layer (CBL) case, spanning
resolutions from LES toward the grey zone. The dynamic approach optimises the
closure parameters using information from the resolved small-scale turbulence,
exploiting the assumed similarity between resolved and unresolved scales. Preliminary
results show that the dynamically derived length scales exhibit the desired scale
dependency across resolutions, leading to improved agreement with LES.

How to cite: Efstathiou, G. and Clark, P.: Towards dynamic closures for higher-order turbulence schemes, EGU General Assembly 2026, Vienna, Austria, 3–8 May 2026, EGU26-22783, https://doi.org/10.5194/egusphere-egu26-22783, 2026.

EGU26-23263 | ECS | Orals | AS2.2

A Surface Layer Scheme for an Implicit Large Eddy Simulation Model 

Yuhang Tong, John Thuburn, and Georgios Efstathiou

This research focuses on improving the near-surface performance of an Implicit Large
Eddy Simulation (ILES) model. The ILES model uses the Semi-implicit semi-Lagrangian
numerical method for simulating the atmospheric boundary layer. Moreover, the model
is called an “implicit” model because it includes no explicit scheme to represent
subgrid-scale fluxes but makes use of the numerical dissipation. One of the problems
we’ve met so far is that, for example, in the neutral boundary layer case, some
simulations indicate the weakness of this model in resolving the eddies near the bottom
boundary, which can be reflected by, for example, failure to reproduce a log wind profile
for the neutral case. We hope that this type of issue can be solved by spreading the
eRect of surface flux convergence into several model layers using a surface model. The
purpose of this surface model is to minimize the inability of our ILES model to resolve
the near-surface eddies.

How to cite: Tong, Y., Thuburn, J., and Efstathiou, G.: A Surface Layer Scheme for an Implicit Large Eddy Simulation Model, EGU General Assembly 2026, Vienna, Austria, 3–8 May 2026, EGU26-23263, https://doi.org/10.5194/egusphere-egu26-23263, 2026.

Harmful Algal Blooms (HABs) represent a growing threat to marine ecosystems, aquaculture, and public health in the Central Eastern Arabian Sea (CEAS). This study utilized 18S rRNA metabarcoding to characterize the absolute abundance and community composition of potentially toxigenic diatoms and dinoflagellates in the coastal waters of Goa. The analysis reveals a distinct and alarming prevalence of multiple genera associated with diverse toxin syndromes.

The dataset was dominated by a massive proliferation of the dinoflagellate Karenia (linked to Neurotoxic Shellfish Poisoning and ichthyotoxicity), which reached extreme abundances exceeding 51,000 reads per sample at the most impacted sites. Co-occurring with this bloom, spatially distinct hotspots of Paralytic Shellfish Toxin (PST) producers were identified, specifically Alexandrium and Gymnodinium spp., with Alexandrium counts peaking at over 5,200 reads. Notably, the potent PST producer Alexandrium tamiyavanichii was positively identified, alongside detections of Gymnodinium catenatum.

The diatom community also exhibited significant toxicity potential; the Amnesic Shellfish Poisoning (ASP) genus Pseudo-nitzschia displayed high relative abundance (up to ~3,700 reads), including the presence of P. pungens. Furthermore, vectors for Diarrhetic Shellfish Poisoning (DSP), including Dinophysis spp. and Phalacroma rotundatum, and Yessotoxin producers (Lingulodinium polyedra, Gonyaulax spinifera) were ubiquitously present at lower background levels.

These findings highlight a complex, multi-risk scenario where ASP, PSP, NSP, and DSP vectors coexist within the same coastal system. The distinct spatial separation observed between peak Karenia, Alexandrium, and Pseudo-nitzschia events suggests that heterogeneous environmental drivers are influencing specific HAB assemblages. This data underscores the critical need for broad-spectrum toxin monitoring beyond single-species surveillance in the region.

How to cite: Zedi, S. and Khandeparker, R.: Hidden Hazards in the Central Eastern Arabian Sea: Metabarcoding Reveals Co-occurrence of ASP, PSP, and NSP Vectors in the Coastal Waters of Goa, EGU General Assembly 2026, Vienna, Austria, 3–8 May 2026, EGU26-414, https://doi.org/10.5194/egusphere-egu26-414, 2026.

EGU26-2588 | Posters on site | AS2.3

A study on the drivers of methane emissions in a eutrophic lagoon in the Baltic Sea (Darß-Zingst-Bodden chain) 

Oliver Schmale, Peter Holtermann, Volker Brüchert, Rhena Schumann, and Gerald Jurasinski

Coastal shallow water areas are important carbon dioxide sinks, but their sink strength is significantly reduced by the simultaneous emission of other greenhouse gases such as methane (CH4). These areas are often characterized by strong anthropogenic pressure from adjacent agricultural land use, which leads to increased nutrient input, high biological production, oxygen consumption through remineralization of the organic material produced, and ultimately to increased greenhouse gas production. Despite their outstanding importance for marine greenhouse gas emissions, these areas have been little studied to date and the drivers of the spatial and temporal variability of greenhouse gas distribution are poorly understood. To address this problem, we study a lagoon on the German Baltic Sea coast (Darß-Zingst Bodden chain) using a multidisciplinary approach that combines gas chemical and observational oceanographic methods with modeling. Our investigations in the summer of 2024 and 2025 show that the spatial and temporal variability of CH4 concentration in the water and emissions into the atmosphere are primarily caused by wind-driven oceanographic processes, such as water mass transport and mixing. Notably high CH4 concentrations were recorded primarily in protected reed belts and adjacent drainage ditches, indicating the particular importance of these areas as CH4 sources. The high-frequency measurements of CH4 concentrations (Equilibrator-CRDS) provided evidence that changes in water level and the associated pressure change on the sediment have an impact on the CH4 concentration in the water column. Measurements at the water surface with a floating chamber and an eddy covariance flux tower have shown that gas bubble fluxes play a significant role in atmospheric CH4 fluxes and that the intensity of gas bubble release is influenced by water level fluctuations. Our study thus provides a rare CH4 data set from shallow water areas of the German coast and, through its high-frequency data acquisition, reveals the highly dynamic variability of CH4 concentration development and underscores the importance of oceanographic processes in this context.

How to cite: Schmale, O., Holtermann, P., Brüchert, V., Schumann, R., and Jurasinski, G.: A study on the drivers of methane emissions in a eutrophic lagoon in the Baltic Sea (Darß-Zingst-Bodden chain), EGU General Assembly 2026, Vienna, Austria, 3–8 May 2026, EGU26-2588, https://doi.org/10.5194/egusphere-egu26-2588, 2026.

EGU26-2867 | Posters on site | AS2.3

The importance of short-term variability for constraining methane air–sea exchange in a coastal upwelling region  

Laura Farías, Sandy Tenorio, and Diego Narvaez

Short-term variability plays a key role in controlling air–sea CH₄ exchange in coastal upwelling systems, yet it is largely unresolved by conventional low-frequency sampling. Here, we quantify the influence of synoptic-scale variability on CH₄ content and its air–sea exchange using a buoy-based sensor system in a coastal upwelling bay off central Chile (Coliumo Bay, 36.5°S) during the upwelling season (September 2024–February 2025).

Spectral and wavelet analyses revealed a multiscale structure in surface CH₄ levels and alongshore winds, with variance dominated by periods >10 d and 3–10 d in about ~52-21% and ~40-31%, respectively. The latter variability, comprising synoptic oscillations, was mainly associated with alternating periods of active upwelling and relaxation/downwelling events.

At the synoptic scale, during active upwelling events, CH₄ effluxes averaged 25.38 ± 17.74 μmol m⁻² d⁻¹ whereas during relaxation periods effluxes were reduced by almost half (mean ± SD: 9.16 ± 9.58 μmol m⁻² d-1). These results indicate that during active upwelling events, the advection of subsurface waters rich in CH4 and wind-driven gas transfer are key factors triggering the highest CH₄ effluxes.

When the high-frequency time series is compared with a long-term (2007–2025) monthly time series from the same upwelling system, clear differences in capturing real variability emerge. Based on monthly sampling over 18 years, air–sea CH₄ fluxes were on average 9.43 ± 6.95 μmol m⁻² d-1, with a weak seasonal contrast between upwelling-favorable and non-upwelling seasons (10.5 vs. 7.5 μmol m⁻² d⁻¹). These results demonstrate that synoptic variability in CH₄ concentration and air–sea exchange exceeds seasonal variability.

An uncertainty analysis accounting for aliasing under coastal upwelling conditions indicates that high-frequency observations capture CH₄ dynamics that are otherwise missed, thereby reducing bias in coastal CH4 emission estimates. Our results underscore the need to incorporate high-frequency observations, as episodic events such as wind pulses, extreme rainfall, or atmospheric rivers, together with non-linear surface biogeochemical CH₄ production, are required to achieve a more realistic quantification of CH4 emissions from coastal upwelling systems. Main funding FONDECYT (Chile) N° 1250210

.

How to cite: Farías, L., Tenorio, S., and Narvaez, D.: The importance of short-term variability for constraining methane air–sea exchange in a coastal upwelling region , EGU General Assembly 2026, Vienna, Austria, 3–8 May 2026, EGU26-2867, https://doi.org/10.5194/egusphere-egu26-2867, 2026.

Black carbon (BC) is a strong short-lived climate forcer and an important pathway for atmospheric carbon input to the ocean. Although the Northern Indian Ocean (NIO) receives a strong outflow from the Indian subcontinent (high BC emission region), quantitative estimates of its wet deposition to the oceans which is a dominant atmospheric removal mechanism remains largely unavailable for the Bay of Bengal (BoB) and the Arabian Sea (AS). This study provides the first long-term, basin-scale assessment of BC wet deposition fluxes over the NIO for the period 2002–2022, focusing on their seasonal variability and inter annual trends.
BC wet deposition fluxes were estimated using a parameterized approach in which the flux is defined as the product of BC concentration, an empirical particle washout ratio, and the precipitation rate. Near-surface aerosol mass concentration was derived by normalizing MODIS/Aqua Level-2 MYD04_3K (Collection 6.1) derived columnar mass concentration with boundary layer height from ERA5 reanalysis. These near surface mass concentration is corrected by density followed by hygroscopic growth factor. Surface BC mass concentration is estimated by applying a black carbon mass fraction (f_BC) to the hygroscopicity-corrected near-surface aerosol mass concentrations, which is further used to compute the BC wet deposition fluxes.
Results show strong seasonal variability in BC wet deposition over the NIO, with flux maxima during the southwest monsoon driven mainly by enhanced precipitation. Inter annual variability in BC wet deposition correlates to precipitation variability, confirming rainfall as the dominant controlling factor for BC removal over the region. Basin-scale contrasts show higher wet deposition over the BoB than AS, reflecting closer proximity to major continental emission sources. Spatially, BC wet deposition is enhanced over coastal and nearshore regions compared to the open ocean, reflecting a sharp gradient from the coast toward the open ocean and highlighting a strong influence of meteorology and source proximity in BC deposition across the NIO. These results provide the constrained, long-term estimate of BC wet deposition to the BoB and AS, offering inputs for regional climate modeling and improved understanding of aerosol–monsoon–ocean interactions.

How to cite: K. Singh, S. and Tiwari, S.: Estimation of Black Carbon Wet Deposition Fluxes from the Marine Atmospheric Column over the Northern Indian Ocean, EGU General Assembly 2026, Vienna, Austria, 3–8 May 2026, EGU26-5069, https://doi.org/10.5194/egusphere-egu26-5069, 2026.

EGU26-5384 | Posters on site | AS2.3

DMS, MeSH and nanoparticles in semi-controlled deck-borne experiments using Antarctical seawaters: on the effect of UV light 

Karine Sellegri, Guillaume Chamba, Valérie Gros, Clémence Rose, Elisa Berdalet, Charel Wohl, Manuel Dall'Osto, and Rafel Simo

Among the wide variety of VOCs emitted by the oceans, sulfur-containing compounds such as dimethyl sulfide (DMS) and methanethiol (MeSH) can be particularly important due to their prominent role in the marine sulfur cycle and their fate as secondary aerosol precursors. However the quantification of DMS and MeSH emissions as a function of biological components of the ocean under variable environmental factors are still too scarce for reliable future predictions. In this study we report on measurements of natural DMS, MeSH and nanoparticle concentrations within the deckborne Air-Sea Interfacial Tanks (ASITs) and the effect of UV light on their fluxes and concentrations. These measurements were carried out near the Antarctic Peninsula during the PolarChange campaign in 2023. DMS dissolved concentrations showed maxima in the open Southern Ocean north of the peninsula (2.5-3 nM), minima in the Marginal Ice Zone (MIZ) (1 nM) and moderate along the western coast of the peninsula (around 1.5-2 nM). Fluxes measured inside the ASITs were always positive, i.e. degassing from seawater to air, with equivalent 2 m·s-1 wind speed fluxes averaged from 3.03 pmol·m⁻²·s⁻¹ for DMS to 0.64 pmol·m⁻²·s⁻¹ for MeSH. DMS emissions did not vary significantly between day/night conditions, however the ratio of MeSH to DMS did have a clear maximum at night and a decrease around midday. Cryptophytes, nanophytoplankton, and bacterial concentrations showed positive links with dissolved DMS and MeSH concentrations during the experiments. A clear negative impact of UV light on DMS and MeSH fluxes was observed with DMS net fluxes 24% higher and MeSH net fluxes 58% higher in UV light filtered ASIT, and on new particle formation that surprisingly occurred only in the absence of UV light. Interestingly, the highest impact of UV, especially on MeSH emissions, was seen during the night. UV light had also a negative impact on the development of nanophytoplankton especially in Open Southern Ocean waters, and a slight increase in phytoplankton stress at noon .

How to cite: Sellegri, K., Chamba, G., Gros, V., Rose, C., Berdalet, E., Wohl, C., Dall'Osto, M., and Simo, R.: DMS, MeSH and nanoparticles in semi-controlled deck-borne experiments using Antarctical seawaters: on the effect of UV light, EGU General Assembly 2026, Vienna, Austria, 3–8 May 2026, EGU26-5384, https://doi.org/10.5194/egusphere-egu26-5384, 2026.

EGU26-5715 | Posters on site | AS2.3

Concordia ATmospheric CHemistry – Observatory (CATCH-O): a tighter focus on the atmosphere of the Antarctic Plateau 

Rita Traversi, Silvia Becagli, Mirko Severi, Silvia Nava, Franco Lucarelli, Paolo Cristofanelli, Davide Putero, Mery Malandrino, Marco Grotti, Elena Barbaro, and Marco Roman

Atmospheric chemistry in polar areas is a key determinant for climate evolution, and many sets of data and experimental observations from both hemispheres exist to date. However, data on continuous and long-term studies and monitoring in continental polar areas, such as the Antarctic Plateau, are still very scarce. While presenting significant implementation difficulties, such observations are necessary to understand the current climate system of the Southern Ocean and the environmental variables involved in its evolution on a multi-annual scale. Furthermore, the study of atmospheric chemical composition in continental Antarctica can provide important information for the interpretation of chemical stratigraphies from ice cores, which is made complicated in these areas by post-depositional processes due to atmosphere-snow exchanges. To date, there is no permanent observatory on the Antarctic Plateau dedicated to the study of the chemical properties of atmospheric aerosols, excluding the South Pole Observatory, which is nevertheless focused on the study of climate-altering gases and the physical properties of aerosols, except for a few short-term campaigns.

For these reasons, a New Observatory dedicated to the study of the chemical composition of atmospheric aerosol and ozone at the Concordia station (Dome C), on the Antarctic Plateau (CATCH-O Project) is currently in its first phase of implementation. This facility takes advantage of solid infrastructure set up during previous Italian National Antarctic Programs. It will be able to merge Near-Real Time data (ozone concentration and selected ion markers of atmospheric sources and processes) with off-line chemical composition data obtained from sampling and subsequent chemical analysis of several atmospheric source and process markers.

Due to its central location within the Antarctic continent, its elevation (about 3230 m), its distance from the coast (about 1100 km) and from ocean sources and related biogeochemical processes, Dome C can be considered representative of a background atmosphere. In this way, the Atmospheric Chemistry Observatory of Dome C will represent a relevant research opportunity for obtaining a long-term baseline of atmospheric chemical composition in relation to the entire continent.

Here, the already available data obtained by both off-line and on-line measurements within CATCH-O Observatory will be presented for the first time.

How to cite: Traversi, R., Becagli, S., Severi, M., Nava, S., Lucarelli, F., Cristofanelli, P., Putero, D., Malandrino, M., Grotti, M., Barbaro, E., and Roman, M.: Concordia ATmospheric CHemistry – Observatory (CATCH-O): a tighter focus on the atmosphere of the Antarctic Plateau, EGU General Assembly 2026, Vienna, Austria, 3–8 May 2026, EGU26-5715, https://doi.org/10.5194/egusphere-egu26-5715, 2026.

EGU26-6641 | Posters on site | AS2.3

Extreme events in the Eastern South Atlantic Ocean enhance regional coastal N2O emissions 

Damian Leonardo Arévalo-Martínez, Hermann W. Bange, Peter Brandt, Marcus Dengler, Paula Eisnecker, Carolin R. Löscher, Gregor Rehder, Tina Sanders, Caroline P. Slomp, Tobias Steinhoff, and Peihang Xu

Coastal areas within the Eastern South Atlantic Ocean are known hotspots for production and emissions of climate-relevant trace gases. Local circulation, the occurrence of upward tracer transport events through e.g. coastal upwelling and coastally-trapped waves, and a pronounced oxygen minimum zone are crucial in setting the overall emissions of nitrous oxide (N2O) towards the atmosphere. While previous studies quantified the magnitude of cross- and along-shelf gradients of N2O in the region, its main formation pathways, and its seasonal variability, to date it is unclear at what extent extreme events might affect N2O dynamics. Given the projected increase in frequency and severity of events such as storms and oceanic heat waves, which might temporarily, yet significantly modify environmental conditions under which N2O is produced and transported across the sediment-water-air interfaces, it is therefore critical to assess the role of such events on its distribution and emissions. In this study we combine physical, chemical and microbial observations gathered during two major expeditions in 2018 and 2023 to present evidence of a hitherto unseen enhancement in air-sea fluxes of N2O in association with storm events and mesoscale activity. We show that during periods of sustained winds off Walvis Bay at 23°S, water column mixing down to 100 m depth can lead to a two-fold increase in air-sea N2O fluxes driven by the transport of enriched, near-bottom waters towards the surface, which surpasses by far values observed during typical upwelling events. Observations across a mesoscale cyclonic eddy off Angola centered at 16⎼17°S (a rare feature which is thought to occur in average 2 times per year in the region), show that both extreme warming-driven outgassing at the sea surface and enhanced upward transport of N2O-enriched waters at the eddy core play a role in enhancing the overall emissions from waters otherwise thought to be mostly representative of open ocean conditions (i.e. in near equilibrium with the atmosphere). In this contribution, we discuss the main mechanisms by which these extreme events resulted in enhanced N2O air-sea fluxes and how they might impact current marine N2O emission estimates, which due to the lack of targeted observations, do not capture this source of variability.

How to cite: Arévalo-Martínez, D. L., Bange, H. W., Brandt, P., Dengler, M., Eisnecker, P., Löscher, C. R., Rehder, G., Sanders, T., Slomp, C. P., Steinhoff, T., and Xu, P.: Extreme events in the Eastern South Atlantic Ocean enhance regional coastal N2O emissions, EGU General Assembly 2026, Vienna, Austria, 3–8 May 2026, EGU26-6641, https://doi.org/10.5194/egusphere-egu26-6641, 2026.

EGU26-7048 | Orals | AS2.3 | Highlight

Surges of acidity in UK rainwater: implications for ocean acidification? 

Brian Durham and Christian Pfrang

A low-cost project recorded unexpected surges of acidity in UK rainfall events over eight summer weeks. With hindsight we now convert the pH values to xH, thereby showing that these rain events typically have at least one acid spike-and-decay sequence.  We compared the acid decay curves with that in a solution of carbon dioxide (CO2) exposed to a blustery atmosphere, and have separately recorded similar spikes using CO2 spectrometry in the headspace above incoming rainwater. For one rain event a suite of twelve ion analyses was made at three intervals showing no other significant acid anhydride, again indicating the identity of the acidic agent as CO2.

In our most complete week, a frequency analysis showed that 8,840 of the 10,080 records had acidity of less than 3µmols [H+] per mol H2O, representing the local equilibrium state in the sample well between rain events. The remaining 1240 records show active rainfall with acidity averaging 31.3 µmols [H+] per mol water.  Adopting the conversion curve established by Butler (1982), this would represent dissolved CO2 ten times the measured local equilibrium state, i.e. ten times supersaturated, while including three spikes exceeding thirty-five times supersaturated. 

This kinetic behaviour in dissolved CO2 seems to have escaped scientific notice. If occurring over an ocean such surges would contribute to acidification, defined as `reduction in the pH of the ocean over an extended period of time, caused by uptake of CO2 from the atmosphere’ (NOAA accessed 2/11/2025).  This process is monitored on a three-hourly cycle by Global Ocean Acidification Observing Network, and we have therefore downloaded CO2  measurements for tethered buoys WHOTS and SOTS in case CO2 spikes coincide with lowered salinity as an indicator of local rainfall.

In speculating a concentrating mechanism for CO2 within the precipitating atmosphere we review 20th-century arguments for the capture of anionsby cloud ice against a 21st-century thermodynamic model of the formation of CO2 gas hydrate.

How to cite: Durham, B. and Pfrang, C.: Surges of acidity in UK rainwater: implications for ocean acidification?, EGU General Assembly 2026, Vienna, Austria, 3–8 May 2026, EGU26-7048, https://doi.org/10.5194/egusphere-egu26-7048, 2026.

Atmospheric nitrogen deposition has broad implications for global ecosystems and human health. It is largely influenced by local weather conditions and atmospheric transport, which are in turn controlled by large-scale atmospheric circulation patterns. Due to the absence of long-term atmospheric nitrogen deposition data series, the mechanisms of interannual variation of nitrogen deposition are still poorly understood. Here, we investigate relationships between atmospheric nitrogen deposition and atmospheric circulation variability and explore the underlying mechanisms. We find that there is a growing imbalance between regional nitrogen emissions and deposition in global hotspots. Atmospheric nitrogen deposition variations exhibit significant relationships with atmospheric circulation modes, with predominant influences from the El Niño–Southern Oscillation (ENSO). Additionally, we captured significant nitrogen deposition anomalies during different phases of ENSO years by altering global temperature, precipitation, and atmospheric circulation. Significant effects of ENSO on atmospheric nitrogen deposition were observed in the Eastern United States, Eastern Europe, and East Asia.

How to cite: He, Q.: Atmospheric circulation impacts on terrestrial atmospheric nitrogen deposition under growing imbalance of regional nitrogen emissions and deposition  , EGU General Assembly 2026, Vienna, Austria, 3–8 May 2026, EGU26-7272, https://doi.org/10.5194/egusphere-egu26-7272, 2026.

EGU26-9135 | Orals | AS2.3

Investigation of subcloud precipitation sublimation and evaporation with active remote sensing in Ny-Ålesund 

Andreas Foth, Lukas Monrad-Krohn, Beril Aydin, Sabrina Schnitt, Mario Mech, Kerstin Ebell, Marion Maturilli, Maximilian Maahn, and Heike Kalesse-Los

Precipitation is an essential component of the Arctic climate system as part of the hydrological cycle, linking the atmosphere and cryosphere. Much of the Arctic precipitation sublimates or evaporates before it reaches the ground due to dry sub-cloud layers. The processes are thus controlling the input of the surface mass balance.

We use long-term atmospheric observations at Ny-Ålesund, Svalbard, with vertically-pointing cloud radars and backscattering lidars to identify and quantify atmospheric sublimation/evaporation. Radar observation-based sub-cloud precipitation profiles are studied by employing a virga detection tool, the so-called Virga-Sniffer (Kalesse-Los et al., 2023). The quantification of the sublimation/evaporation is based on sub-cloud vertical gradients of radar moments. First statistical results of precipitation thermodynamical phase, virga depth, and full sublimation/evaporation altitude above ground will be shown.

We will show investigations on wind direction dependence on virga statistics. Air masses advected from the Arctic Ocean are more humid and lead to more precipitation reaching the ground and thus less virga. Air masses advected over Ny-Ålesund from Easterly directions are often characterized by low-humidity subcloud layers leading to more evaporation/ sublimation and hence a higher fraction of virga. Furthermore, the occurrence frequency of virga and surface precipitation observed during different weather regimes such as cyclones, fronts, and atmospheric rivers is contrasted.

This work was supported by the DFG funded Transregio-project TRR 172 “Arctic Amplification (AC)3“.

Refernces:

Kalesse-Los, H., Kötsche, A., Foth, A., Röttenbacher, J., Vogl, T., and Witthuhn, J.: The Virga-Sniffer – a new tool to identify precipitation evaporation using ground-based remote-sensing observations, Atmos. Meas. Tech., 16, 1683–1704, https://doi.org/10.5194/amt-16-1683-2023, 2023.

How to cite: Foth, A., Monrad-Krohn, L., Aydin, B., Schnitt, S., Mech, M., Ebell, K., Maturilli, M., Maahn, M., and Kalesse-Los, H.: Investigation of subcloud precipitation sublimation and evaporation with active remote sensing in Ny-Ålesund, EGU General Assembly 2026, Vienna, Austria, 3–8 May 2026, EGU26-9135, https://doi.org/10.5194/egusphere-egu26-9135, 2026.

EGU26-9820 | ECS | Orals | AS2.3

Eddy covariance CO2 air-sea fluxes under variable surfactant conditions in the Baltic Sea 

Leonie Scheidereit, Yuanxu Dong, Lea Lange, Damian L. Arévalo-Martínez, Hermann Bange, Astrid Klöss, Josefine Karnatz, Theresa Barthelmeß, Anja Engel, and Christa Marandino

The gas transfer velocity k for the air-sea exchange of CO2 is often parameterized as a function of wind speed alone, as wind speed fundamentally controls turbulence at the air-sea interface and thus the flux across it. However, numerous other processes affect the air-sea gas exchange, such as the presence of surface-active substances (surfactants) directly at the interface, the so-called sea surface microlayer (SML). These processes are not explicitly accounted for in the wind speed-only parameterizations. Surfactants in the SML likely reduce k, potentially due to two effects. Firstly, the surfactants represent a physicochemical barrier at the interface, and secondly, they dampen the turbulence at the interface. Consequently, the presence of surfactants leads to lower gas transfer velocities than estimated from the wind speed-only parameterizations of k, especially since the SML can be stable up to medium high wind speeds. The mechanisms that control how exactly surfactants in the SML affect the air-sea gas exchange are, however, not yet fully understood. Therefore, it is important to measure air-sea gas exchange under various surfactant conditions to potentially include the SML effects in future parameterizations of k. During a research cruise to the Gotland Basin in the early summer of 2025, the direct air-sea flux of CO2 was measured using the eddy covariance method. This method is particularly well-suited to study the influence of surface processes on gas exchange, as it can determine k on timescales of 10 minutes and is therefore likely to resolve the variability in different surfactant states. In addition to the direct CO2 flux measurements, a range of other parameters influencing air-sea flux were also measured. In particular, the surfactants in the SML were sampled and analysed during the research cruise. Consequently, we investigate the behaviour of k under not only varying wind speeds, but now also under various surfactant states, including the presence of a surface slick.

How to cite: Scheidereit, L., Dong, Y., Lange, L., Arévalo-Martínez, D. L., Bange, H., Klöss, A., Karnatz, J., Barthelmeß, T., Engel, A., and Marandino, C.: Eddy covariance CO2 air-sea fluxes under variable surfactant conditions in the Baltic Sea, EGU General Assembly 2026, Vienna, Austria, 3–8 May 2026, EGU26-9820, https://doi.org/10.5194/egusphere-egu26-9820, 2026.

EGU26-9885 | Posters on site | AS2.3

Linking Baltic Sea water VOC concentrations with a summertime phytoplankton bloom  

Eve Galen, Kaisa Kraft, Yang Liu, Mari Vanharanta, Pasi Ylöstalo, Lasse Riemann, Heidi Hellén, Jukka Seppälä, and Riikka Rinnan

Long-term nutrient loading and warmer, longer summer temperatures have promoted summer cyanobacteria-dominated phytoplankton blooms in the Baltic Sea, shifting the annual chlorophyll maximum toward peak summer. In turn, organic matter production is increasing, altering the carbon cycle by shifting the bioavailable carbon pool to later in the season and towards microbial heterotrophy. These ecosystem changes may have consequential impacts on the production of trace gases, such as volatile organic compounds (VOC). Enhanced stratification and reduced vertical mixing may further regulate VOC water-air exchange. In the coastal zone, significant changes to macroalgae communities have been observed in association with persistent eutrophication. Shifting coastal dynamics, along with increased warming and, consequently, increased decomposition of organic material, will likely impact VOC production. Therefore, the aim of this study is to evaluate the influence of a summertime phytoplankton bloom on the composition and concentrations of VOCs in seawater, and to examine differences between distinct coastal habitats.

Summer sampling was conducted on Utö Island (59º 46'50N, 21º 22'23E; Archipelago Sea), and samples were processed at the Utö Atmospheric and Marine Research Station. Seawater VOCs were collected using the purge and trap method four times across three habitat types along the open coast—open water (250 m off shore; 4.5 m depth), a cove (15 m off shore; 0.5 m depth), and a vegetated beach (on shore; surface). Samples were stored in stainless steel absorbent cartridges and analyzed with Thermal Desorption Gas Chromatography Mass Spectrometry. Phytoplankton community composition and abundance were captured using an Imaging FlowCytobot, complemented by bacterial abundance from flow cytometry and microscopy.

Preliminary results indicate clear temporal variability in open water VOC concentrations. Some compounds such as isoprene were persistently detected throughout the summer whereas other compounds, e.g. toluene and dimethyl disulfide, varied across the season in association with changes in phytoplankton and bacterial abundance. Taxa-specific links between VOCs and phytoplankton composition, as well as the potential influence of abiotic drivers, including dissolved organic matter and vertical mixing, is still under investigation. Further analysis indicates that VOC concentrations are highly dependent on coastal habitat type, with composition and concentration of VOCs from the vegetated beach showing approximately 10-fold higher values as well as a more unique VOC blend, suggesting contributions from macroalgae and sediment processes. In contrast, the cove was highly dominated by bromoform, comprising >50% of the measured proportional VOC signal throughout the summer.

How to cite: Galen, E., Kraft, K., Liu, Y., Vanharanta, M., Ylöstalo, P., Riemann, L., Hellén, H., Seppälä, J., and Rinnan, R.: Linking Baltic Sea water VOC concentrations with a summertime phytoplankton bloom , EGU General Assembly 2026, Vienna, Austria, 3–8 May 2026, EGU26-9885, https://doi.org/10.5194/egusphere-egu26-9885, 2026.

Methanethiol (MeSH), a reduced sulfur compound, has received far less attention than dimethyl sulfide (DMS) despite its potential importance for atmospheric sulfur cycling and climate-relevant aerosol processes. Compared with DMS, gas-phase oxidation of MeSH yields more SO2 and has a shorter atmospheric lifetime, suggesting a disproportionate influence on new particle formation, aerosol growth, and cloud condensation nuclei (CCN) abundance in the marine atmosphere. Current global estimates of marine MeSH emissions have relied on scaling DMS concentration climatologies using empirical MeSH:DMS ratios, implicitly assuming co-variability between the two compounds.

Here, we present global monthly marine MeSH emissions derived using a machine-learning framework constrained by 27 years of satellite observations, ocean reanalysis products, and shipboard measurements. Key satellite predictors include chlorophyll-a (Chl-a), phytoplankton functional types (PFTs), phytoplankton size classes (PSCs), and photosynthetically active radiation (PAR). Our approach directly predicts MeSH concentrations from environmental drivers, independent of DMS distributions. The regression models were trained and validated using MeSH sea-surface concentration measurements from multiple oceanographic field campaigns.

We estimate a global annual marine MeSH emission of 5.06 Tg S yr-1. Regional emissions were analyzed by dividing the global ocean into nine Longhurst biomes. The largest contributions originate from the Southern Westerlies (29.05%), Pacific Trades (15.22%), and Coastal Ocean regions (14.03%). Both seawater MeSH concentrations and emissions exhibit pronounced seasonal variability, with peak global emissions occurring in October and a minimum in June. These results provide a satellite-based global climatology of marine MeSH emissions and establish a basis for assessing its impacts on atmospheric chemistry and global climate.

How to cite: Zhang, W.: A Global Marine Methanethiol Climatology Estimated Using Machine Learning, EGU General Assembly 2026, Vienna, Austria, 3–8 May 2026, EGU26-9950, https://doi.org/10.5194/egusphere-egu26-9950, 2026.

EGU26-11536 | ECS | Orals | AS2.3

Influence of East Asian Continental Emissions on Marine Atmospheric Chemistry and Ocean Ecosystems in the Northwest Pacific 

Tianle Zhang, Bingxing Zhu, Lin Zhang, Yuntao Wang, Fei Chai, and Mei Zheng

With the acceleration of global economic development and urbanization, the impacts of anthropogenic emissions on the Earth system have intensified. East Asia, as one of the most densely populated and economically active regions in the world, emits substantial amounts of particulate matter into the atmosphere. Influenced by the prevailing westerlies and the East Asian monsoon, these particles are transported downwind to the Northwest Pacific, exerting significant effects on marine atmospheric composition and ocean ecosystems in this region.

Focusing on key marine atmospheric nutrients including iron (Fe) and nitrogen (N), this study employs a multi-platform approach encompassing satellite remote sensing, in situ Argo floats, shipborne observations, and atmospheric chemical transport modeling to investigate the contribution of East Asian continental aerosol outflow to nutrient supply and the subsequent ocean response. A central highlight of this work is quantifying anthropogenic contributions to atmospheric Fe and N over the Northwest Pacific in recent years.

First, by integrating shipborne online measurements (2021–2022) of multiple atmospheric metals with a positive matrix factorization (PMF) model, we developed a high-time-resolution source apportionment framework for marine atmospheric metals including Fe. This approach provides the first observation-based quantification of contributions from several anthropogenic sources to marine atmospheric Fe and soluble Fe at hourly resolution. The results showed land anthropogenic emissions contributed substantially to atmospheric soluble Fe, accounting for 57% in the open Northwest Pacific during spring and increasing to 62% in summer. These results were further cross-validated against advanced Fe isotope–based source apportionment, yielding strong agreement (R2 = 0.94).

Second, for atmospheric nitrogen, shipborne sampling combined with nitrogen isotope analysis revealed sharp spatial gradients in atmospheric nitrate concentrations and sources from the Chinese marginal seas to the open Northwest Pacific. Coupled with an atmospheric chemical transport model, we further quantified the flux and temporal variability of multiple nitrogen species transported from East Asia to the Northwest Pacific during 2005–2019 and assessed the response of marine atmospheric nitrogen deposition to emission reductions in recent years in East Asia. These findings provide novel insights into the important impacts of land-derived emissions on ocean ecosystems, particularly anthropogenic sources, in shaping biogeochemical processes in downwind oceanic regions and advance our understanding of land–ocean interactions under anthropogenic perturbations.

How to cite: Zhang, T., Zhu, B., Zhang, L., Wang, Y., Chai, F., and Zheng, M.: Influence of East Asian Continental Emissions on Marine Atmospheric Chemistry and Ocean Ecosystems in the Northwest Pacific, EGU General Assembly 2026, Vienna, Austria, 3–8 May 2026, EGU26-11536, https://doi.org/10.5194/egusphere-egu26-11536, 2026.

EGU26-13301 | ECS | Orals | AS2.3

Marine Carbohydrates and Other Sea Spray Aerosol Constituents Across Altitudes in the Lower Troposphere of Ny-Ålesund, Svalbard 

Sebastian Zeppenfeld, Jonas Schaefer, Christian Pilz, Kerstin Ebell, Moritz Zeising, Frank Stratmann, Holger Siebert, Birgit Wehner, Matthias Wietz, Astrid Bracher, and Manuela van Pinxteren

Marine carbohydrates are produced by a wide range of micro- and macroorganisms in seawater and are transferred to the atmosphere via sea spray aerosol (SSA). Recent laboratory and modelling studies suggest that these compounds can influence fog and cloud microphysics as ice nucleating particles. However, observational evidence from the atmosphere remains limited, as most field studies have relied on ship- or land-based filter samples, leaving their relevance for cloud processes at cloud-relevant altitudes largely unconstrained.

Here, we present new measurements of marine carbohydrates and other SSA components at altitudes between 300 and 1200 m, obtained using a tethered helium balloon in Ny-Ålesund (Svalbard) during 2021-2022. These observations are compared with fresh SSA directly collected at the Kongsfjorden coast and with surface seawater samples to assess contributions beyond local ocean emissions. Our results highlight the key role of meteorological conditions in lifting and redistributing SSA constituents, including marine carbohydrates, to higher atmospheric layers. The study further examines potential additional sources and formation pathways, providing new insights into the atmospheric behaviour of marine carbohydrates and their implications for cloud microphysics.

We gratefully acknowledge the funding by the Deutsche Forschungsgemeinschaft (DFG, German Research Foundation)—Project Number 268020496—TRR 172, within the framework of the Transregional Collaborative Research Center “ArctiC Amplification: Climate Relevant Atmospheric and SurfaCe Processes, and Feedback Mechanisms (AC)3” 

How to cite: Zeppenfeld, S., Schaefer, J., Pilz, C., Ebell, K., Zeising, M., Stratmann, F., Siebert, H., Wehner, B., Wietz, M., Bracher, A., and van Pinxteren, M.: Marine Carbohydrates and Other Sea Spray Aerosol Constituents Across Altitudes in the Lower Troposphere of Ny-Ålesund, Svalbard, EGU General Assembly 2026, Vienna, Austria, 3–8 May 2026, EGU26-13301, https://doi.org/10.5194/egusphere-egu26-13301, 2026.

EGU26-13392 | Posters on site | AS2.3

Experimental evidence of chemical differences between charged and uncharged snow during blowing snow events 

Kateryna Tkachenko, Denis Pishniak, Se Razumnyi, Hugo El-mansi, Patrick Ginot, and Hans-Werner Jacobi

In this study we tested under field conditions the hypothesis that electrical phenomena may influence chemical composition of snow. The field experiment was conducted at the Akademik Vernadsky Station within the framework of the State Program of Scientific Research of Ukraine in Antarctica during two winter seasons in 2022 and 2023, using a newly designed trap for charged snow. This instrument was constructed to selectively attract charged snow particles from the blowing-snow flux and was deployed during blowing snow events The experiments were performed in winter to ensure that chemical modifications were not affected by photochemical reactions. A similar field experiment was conducted in the Arctic at Ny-Ålesund, Svalbard. Here, we focus on the chemical composition of the snow samples collected by the trap, which were analyzed using ion chromatography and compared with the composition of the background blowing snow.

We found that samples of charged snow were significantly more concentrated than background snow, which is attributed to the sublimation during conditions of blowing snow events. When the measured ion concentrations were compared with the expected concentration ranges and ratios characteristic of sea salt, the charged snow samples were, however, depleted in chloride, with this difference far exceeding the measurement uncertainty. The dependence of chloride “losses” on the fraction of sublimated water indicated a strong change and revealed the presence of a threshold at approximately 80 % sublimated water, beyond which these losses—interpreted as emissions to the atmosphere—increased sharply. Products of chlorine free-radical reactions in the atmosphere have been reported by numerous authors; however, the mechanism responsible for initiating these reactions remains uncertain. The present experiment provides evidence that the charging of snow may serve as such a triggering process. The presence of a similar threshold at 70–80 % sublimated water, after which ion losses increase sharply, was also observed for Br⁻, SO₄²⁻, and Mg²⁺. However, the presence of local sources renders these relationships less significant. The change in the composition at such high sublimation fractions may indicate emission of these ions due to overcoming of the Rayleigh limit indicating that electrical charging affects chemical processes in snow.

In contrast, the experiments conducted in the coastal marine environment at Ny-Alesund indicate that ion ratios characteristic of sea salt were preserved in the charged snow samples, demonstrating that no or only limited chemical transformations took place. The presence of sea ice appears to be critical for the manifestation of chemical effects. When sea ice is present, snow particle charging during blizzards occurs primarily due to frictional and sublimation-driven processes. In the absence of an ice surface, charging is most likely driven by the sorption of marine aerosols maintaining the expected sea salt ratios in the charged snow.

How to cite: Tkachenko, K., Pishniak, D., Razumnyi, S., El-mansi, H., Ginot, P., and Jacobi, H.-W.: Experimental evidence of chemical differences between charged and uncharged snow during blowing snow events, EGU General Assembly 2026, Vienna, Austria, 3–8 May 2026, EGU26-13392, https://doi.org/10.5194/egusphere-egu26-13392, 2026.

Elongated cracks in the Arctic sea-ice cover, so-called leads, expose the cold atmosphere to the relatively warm ocean, and are thus critical to the Arctic energy budget. Here, high-resolution large-eddy simulations (LES) are used to examine the impact of Arctic sea-ice leads on the wintertime lower atmosphere. Fourteen simulated cases representing various realistic atmospheric states are studied based on MOSAiC campaign data, expanding on previous LES studies of leads, which often utilize single idealized conditions. Control runs are contrasted against perturbed runs containing a 1.2 km wide idealized lead, which evolves through a prescribed open–refrozen–closed life cycle. Impacts on the moist static energy budget of the lower atmosphere are then investigated, also in the context of the well-known bimodal state in the surface energy budget in the Arctic. During the lead-open phase, all simulations show large increases in the turbulent heat fluxes, with a slight reversed effect after lead closure. These fluxes are well-predictable from bulk theory applied to a given control atmospheric state. The atmospheric response depends strongly on the initial atmospheric conditions. Cloudy cases remain in a cloudy state, featuring a small increase in near-surface long wave net radiation. The response of clear-sky cases, however, critically depends on initial relative humidity. Moist clear-sky cases can transition to a cloudy state when condensed plumes form, becoming radiatively active and acting as efficient “radiator fins”. Here, energy is efficiently removed from the atmosphere, a surprising behavior argued to have implications for sea-ice melt. In contrast, dry clear-sky cases produce little condensation, and radiative effects remain minimal.

How to cite: Schnierstein, N. and Neggers, R.: Lead Impacts on the Moist Static Energy Budget of the Low-Level Arctic Atmosphere in Large-Eddy Simulations based on MOSAiC Data, EGU General Assembly 2026, Vienna, Austria, 3–8 May 2026, EGU26-13657, https://doi.org/10.5194/egusphere-egu26-13657, 2026.

EGU26-14409 | Posters on site | AS2.3

Influence of Atmospheric Aerosol Deposition and its Elemental Composition on Marine Productivity in the Central Arabian/Persian Gulf  

Ersin Tutsak, Jassem Al-Thani, Çağlar Yumruktepe, Oguz Yigiterhan, Ebrahim M.A.S. Al-Ansari, Yousra Soliman, and Mariem Safi

Influence of Atmospheric Aerosol Deposition and its Elemental Composition on Marine Productivity in the Central Arabian/Persian Gulf The Arabian Gulf is a shallow, warm oligotrophic, and hypersaline marginal sea of the Indian Ocean. Due to intense evaporation, limited freshwater input, recurrent dust event and harsh environmental conditions, nutrient concentrations and productivity are significantly impacted by the harsh and changing environmental conditions. Atmospheric aerosols can impact surface ocean biology and biogeochemical processes in the Arabian Gulf as a result of the dust events and limited inputs. However, the rates of macro- and micronutrient inputs from the atmosphere to the Arabian Gulf are not well constrained. Both inorganic and organic forms of nitrogen and phosphorus may contribute to productivity in the Arabian/Persian Gulf. Productivity and by proxy precious resources such as fisheries can be closely linked to aerosols nutrient deposition. In this study, we use the Arabian Gulf as a natural laboratory for investigating the temporal variability of atmospheric macro- and micronutrients, the partitioning between organic and inorganic forms of nitrogen and phosphorus, and the role of trace metals in marine productivity. Based on annual time-series aerosol measurements, we provide new insights into atmospheric concentrations of macro- and micronutrients in the central Arabian/Persian Gulf. Additionally, using 1-dimensional biogeochemical model simulations, we investigate the influence of atmospheric aerosol deposition on primary productivity in the Gulf. The results obtained suggest that atmospheric deposition is an important process regulating marine productivity in the Arabian Gulf.

How to cite: Tutsak, E., Al-Thani, J., Yumruktepe, Ç., Yigiterhan, O., M.A.S. Al-Ansari, E., Soliman, Y., and Safi, M.: Influence of Atmospheric Aerosol Deposition and its Elemental Composition on Marine Productivity in the Central Arabian/Persian Gulf , EGU General Assembly 2026, Vienna, Austria, 3–8 May 2026, EGU26-14409, https://doi.org/10.5194/egusphere-egu26-14409, 2026.

EGU26-15183 | Posters on site | AS2.3

Variability of Air-Sea Fluxes of CO2 and N2O in Polar Ocean Regions 

Parvadha Suntharalingam, Jayashree Ghosh, Erik Buitenhuis, and Zhaohui Chen

In recent decades the polar oceans have experienced changes in surface temperature and regional circulation associated with large-scale patterns of ocean warming. These ocean regions are important contributors to global budgets of greenhouse gases such as carbon-dioxide (CO2) and nitrous-oxide (N2O), and the regional environmental changes have significant influences on the magnitude, trends and variability of air-sea fluxes of these gases (Yasunaka et al. 2024; Zhan et al. 2020).

The Arctic Ocean has been a net sink of atmospheric CO2 in recent decades, but displays significant heterogeneity in carbon uptake among its regional seas, with changing trends due to regional climate change and sea-ice loss.  The  global ocean is a  net source of N2O to the atmosphere overall; however the distribution of N2O fluxes from the Arctic remains poorly characterized, and regional observations indicate several regions of N2O undersaturation in the surface Arctic Ocean (Kitidis et al. 2010; Zhan et al. 2020).  The Southern Ocean is a major sink for atmospheric anthropogenic CO2 (e.g., ~40% of global uptake according to recent estimates, Dong et al. 2024). Air-sea CO2 fluxes in the Southern Ocean are strongly influenced by circulation patterns associated with oceanographic fronts, and CO2 fluxes display significant seasonal and decadal variability. Flux estimates are subject to uncertainty due to the regional environmental variability and to the sparse network of CO2 measurements available. Estimates of N2O fluxes from the Southern Ocean are also poorly quantified for similar reasons; i.e., limited measurements and significant spatial and temporal variability.  Recent syntheses have suggested the region could contribute ~30% of global ocean N2O emissions (Tian et al. 2020), a disproportionately large component in comparison to the areal extent of the Southern Ocean.

In this work we present recent estimates of air-sea fluxes of CO2 and N2O from these polar regions derived from (i) atmospheric inverse model analyses (using the GEOSChem-LETKF framework of Chen et al. 2021), and (ii) an ocean biogeochemical model (NEMO-PlankTOM; Buitenhuis et al. 2018). We focus on the period 2000-2018, and present estimates for regional fluxes,  decadal trends and  inter-annual variations. We also compare our results to previous estimates derived from surface ocean pCO2 and pN2O data products and ocean biogeochemistry models.

How to cite: Suntharalingam, P., Ghosh, J., Buitenhuis, E., and Chen, Z.: Variability of Air-Sea Fluxes of CO2 and N2O in Polar Ocean Regions, EGU General Assembly 2026, Vienna, Austria, 3–8 May 2026, EGU26-15183, https://doi.org/10.5194/egusphere-egu26-15183, 2026.

EGU26-17322 | ECS | Posters on site | AS2.3

Characterizing the Sources and Transport of Wintertime Ice-Nucleating Particles in Fairbanks, Alaska 

Abdulrahman Younis Alkatheeri, Kathy Law, Diana Francis, Steve Arnold, Emilly Lill, Samantha Greeney, Jessie Creamean, Anderson Da Silva, Jean-Christophe Raut, Tatsuo Onishi, Natalie Brett, William Simpson, and Kerri Pratt


The Arctic is warming at a rate several times faster than the global mean, a phenomenon commonly referred to as Arctic amplification. Short-lived climate forcers, particularly aerosols acting as ice-nucleating particles (INPs), may influence this amplification through aerosol-cloud indirect effects. During the polar night, INPs modulate the ratio of liquid-to-ice in mixed-phase clouds, altering their capacity to trap outgoing longwave radiation and warm the surface. Despite their importance, the sources and transport pathways of INPs in high-latitude regions remain poorly constrained. While truly pristine Arctic environments are rare, cold, polluted sub-Arctic regions such as interior Alaska provide natural laboratories for investigating INP populations under conditions that combine low temperatures with enhanced anthropogenic and regional aerosol influences. Such environments may be particularly relevant to Arctic locations experiencing episodic pollution, long-range aerosol transport, or increasing local emissions. While chemical fingerprinting provides critical insights into particle composition and local abundance, it cannot inherently resolve the geographic origins or transport history of air masses bringing INPs to a given region.

To address this limitation, we apply backward trajectory-based modelling in an attempt to link observed INPs to their potential source regions. We build on recent work investigating the sources of wintertime INPs in the sub-Arctic urban environment of Fairbanks, Alaska, using observations from the Alaskan Layered Pollution and Chemical Analysis (ALPACA) field campaign conducted in January and February 2022. During the campaign, Fairbanks experienced persistent surface-based temperature inversions and extreme cold events that favored the accumulation of locally emitted anthropogenic aerosols. Analysis of ALPACA-2022 data has reported INP concentrations significantly higher at relatively cold freezing temperatures than those typically observed at other high-latitude sites, consistent with three dominant INP classes: heat-labile biological particles, potentially associated with local vegetation such as lichens; organic particles linked to residential wood combustion, supported by correlations with levoglucosan; and a source attributed to road dust, possibly generated by the application of traction gravel on icy roads.

Using a backward trajectory modeling framework, we investigate the spatial origins and atmospheric transport of INP sourced from the Fairbanks region. Backward transport simulations are conducted using the FLEXible PARTicle dispersion model (FLEXPART), driven by 1.33 km resolution wind fields from the Weather Research and Forecasting (WRF) model, including assimilation of meteorological data from the ALPACA campaign. The surface influence and residence time of air masses arriving at the ALPACA measurement site in downtown Fairbanks are quantified. Potential Emission Sensitivity (PES) footprints are calculated by combining with high resolution emissions fields of potential INP sources, based on downscaling emissions using vegetation, road and building datasets. Interpreting PES fields, in conjunction with the observed INP analysis, allows characterization of both the INP sources and their transport pathways in Fairbanks. The results have broad implications for INP sources and aerosol-cloud indirect effects over the wider sub-Arctic and potentially Arctic region.


How to cite: Alkatheeri, A. Y., Law, K., Francis, D., Arnold, S., Lill, E., Greeney, S., Creamean, J., Da Silva, A., Raut, J.-C., Onishi, T., Brett, N., Simpson, W., and Pratt, K.: Characterizing the Sources and Transport of Wintertime Ice-Nucleating Particles in Fairbanks, Alaska, EGU General Assembly 2026, Vienna, Austria, 3–8 May 2026, EGU26-17322, https://doi.org/10.5194/egusphere-egu26-17322, 2026.

EGU26-18714 | Orals | AS2.3

High-resolution air–sea CO₂ observations during the ATL2MED mission: data correction and process variability across the Eastern Atlantic Ocean and the Mediterranean Sea 

Riccardi Martellucci, Carlotta Dentico, Laurent Coppola, Ingunn Skjelvan, Michele Giani, Carolina Cantoni, Sara Pensieri, Vanessa Cardin, Marine Fourrier, Roberto Bozzano, Melf Paulsen, and Elena Mauri

The ATL2MED mission (October 2019–July 2020) investigated air–sea CO₂ exchange across the Eastern Atlantic Ocean and the Mediterranean Sea using high-resolution measurements from Saildrone autonomous surface vehicles (SDs), complemented by fixed stations, gliders, and research vessels. Operating under diverse environmental conditions, the SDs provided detailed observations of seawater CO₂ and hydrographic parameters, although sensor drift and biofouling affected data quality during the long deployment. Dedicated data correction and validation procedures were applied: salinity was corrected using model products and validated against independent observations. Dissolved oxygen was adjusted using the Argo oxygen correction. These efforts compensated for limited discrete sampling during COVID-19 restrictions. The corrected data revealed strong regional contrasts in CO₂ dynamics driven by physical and biogeochemical processes. Intense outgassing occurred in the upwelling regions off northwest Africa, while the western Mediterranean Sea acted as a CO₂ sink during the spring bloom. The Adriatic Sea showed recurrent outgassing episodes linked to stratification, river plumes, and coastal upwelling. The SDs captured sub-mesoscale and short-term variability often missed by traditional platforms and model simulations. The study highlights the importance of high-frequency, multi-platform measurements to resolve the highly variable air–sea CO₂ fluxes occurring at short temporal scales.

How to cite: Martellucci, R., Dentico, C., Coppola, L., Skjelvan, I., Giani, M., Cantoni, C., Pensieri, S., Cardin, V., Fourrier, M., Bozzano, R., Paulsen, M., and Mauri, E.: High-resolution air–sea CO₂ observations during the ATL2MED mission: data correction and process variability across the Eastern Atlantic Ocean and the Mediterranean Sea, EGU General Assembly 2026, Vienna, Austria, 3–8 May 2026, EGU26-18714, https://doi.org/10.5194/egusphere-egu26-18714, 2026.

EGU26-19703 | ECS | Posters on site | AS2.3

A 15-Year Record of Organic–Inorganic Phosphorus Variability in Eastern Mediterranean Wet Deposition  

Kyriaki Papoutsidaki, Maria Tsagkaraki, Kalliopi Violaki, Giorgos Kouvarakis, Nikos Mihalopoulos, and Maria Kanakidou

Wet deposition is a major mechanism of phosphorus (P) deposition to the ultra-oligotrophic Eastern Mediterranean, yet long-term constraints on the relative roles of dissolved inorganic phosphorus (DIP) and dissolved organic phosphorus (DOP) remain limited. In this study, 15-year observations of DIP and DOP variability were conducted at an Eastern Mediterranean regional background site, focusing on the temporal variability, drivers, and deposition. Wet deposition samples were collected on an event basis and analyzed for DIP using a colorimetric molybdate-reactive method. Total dissolved phosphorus (TDP) was determined following oxidative digestion, and DOP was defined by subtracting DIP from TDP. Deposition fluxes were calculated by coupling concentration measurements with precipitation depth, enabling assessment of both concentration-driven and rainfall-driven variability.

Across the 15-year period, both DIP and DOP exhibited pronounced event-to-event variability typical of atmospheric deposition in the region. Preliminary results show that DIP was frequently enhanced during dust outbreak episodes consistent with mineral dust influence, indicating efficient wet scavenging of particulate and soluble inorganic P associated with crustal minerals. In contrast, DOP was more frequently associated with air masses bearing marine and continental/anthropogenic impacts. At the interannual scale, variability in both concentrations and fluxes tracked changes in rainfall intensity and event frequency, as well as the occurrence of dust-transport episodes. To better constrain sources and processes, deposition chemistry was evaluated in tandem with air-mass back trajectories, and, where available, supporting aerosol and meteorological data. The results indicate that dust-driven wet deposition delivers episodic pulses of bioavailable DIP. DOP supplies a more sustained, compositionally diverse pool. This pool may become bioavailable following photochemical and microbial transformation after deposition. Overall, the 15-year record show that the organic fraction is significant and that the annual DIP:DOP partitioning can change depending on the transport pathways and rainfall distribution. This has direct implications for regional external nutrient inputs and their future projections in response to changes in dust emissions and hydroclimate.


Acknowledgments

This work has been supported by the HFRI grant # 4050 BIOCAN.

How to cite: Papoutsidaki, K., Tsagkaraki, M., Violaki, K., Kouvarakis, G., Mihalopoulos, N., and Kanakidou, M.: A 15-Year Record of Organic–Inorganic Phosphorus Variability in Eastern Mediterranean Wet Deposition , EGU General Assembly 2026, Vienna, Austria, 3–8 May 2026, EGU26-19703, https://doi.org/10.5194/egusphere-egu26-19703, 2026.

EGU26-20624 | ECS | Posters on site | AS2.3

Tethered balloon-borne measurements for the characterization of the evolution of the Arctic atmospheric boundary layer at the Villum Research Station (Station Nord, Greenland) 

Henning Dorff, Holger Siebert, Komal Navale, André Ehrlich, Joshua Müller, Michael Schäfer, and Manfred Wendisch

We present a post-processed comprehensive balloon-borne measurement dataset, which was collected from a dedicated Arctic observation campaign conducted from 19 March to 18 April 2024 in the transition from polar night to polar day at the Villum Research Station (VRS, Station Nord, Greenland), as a contribution to the DFG-funded Transregio-project TRR 172 “Arctic Amplification (AC)3. The objective of the balloon-borne observations was to characterize the temporal evolution of the Arctic atmospheric boundary layer (ABL), focusing on key transition periods, including cloud development, low-level jet evolution, and day to night shifts.

The measurements were taken by the Balloon-bornE moduLar Utility for profilinG the lower Atmosphere (BELUGA) tethered-balloon system performing in-situ observations of temperature, humidity, wind speed, turbulence, and thermal infrared irradiance from the surface to several hundred meters altitude, with frequent profiling in high vertical resolution. Twenty-eight research flights delivered more than 300 profiles, with up to 8 profiles per hour, complemented by daily radiosonde launches. For the BELUGA instrumentation at VRS, we specify the data processing procedures. The post-processed Level-2 data (BELUGA and radiosonde) are provided in instrument-separated data subsets listed in a data collection (https://doi.pangaea.de/10.1594/PANGAEA.986431).

One major application of these balloon-borne data is to evaluate different model types—such as numerical weather prediction, single-column models, large-eddy simulations—in representing processes that control the Arctic ABL. As a preparation, we give an overview of the observations, environmental conditions during the campaign, and highlight specific events that are particularly valuable for model comparison. These events include variable cloud scenarios, where transitions between cloudy and cloud-free conditions induce changes in temperature rates and radiative heating rates, thereby influencing the ABL inversion and lapse-rate. Additionally, we examine an observed Arctic low-level jet which we compare with reanalysis. 

How to cite: Dorff, H., Siebert, H., Navale, K., Ehrlich, A., Müller, J., Schäfer, M., and Wendisch, M.: Tethered balloon-borne measurements for the characterization of the evolution of the Arctic atmospheric boundary layer at the Villum Research Station (Station Nord, Greenland), EGU General Assembly 2026, Vienna, Austria, 3–8 May 2026, EGU26-20624, https://doi.org/10.5194/egusphere-egu26-20624, 2026.

EGU26-20888 | Posters on site | AS2.3

Investigating the potential triggering mechanisms of turbulence intermittency in the Arctic Boundary Layer 

Ahana Kuttikulangara, Nikki Vercauteren, Johannes Riebold, Dörthe Handorf, and Sebastian Krumshied

The turbulence in the Arctic is often observed to be intermittent as a result of the interaction with non-turbulent motions. Several studies have examined the triggering mechanisms behind the intermittency, yet the understanding of their influence is still insufficient. In this study, turbulence intermittency in the Arctic stable boundary layer is investigated using observations from the Multidisciplinary drifting Observatory for the Study of Arctic Climate (MOSAiC) expedition, spanning October 2019 to September 2020. Turbulent and sub-mesoscale motions separated using Multi-Resolution Decomposition (MRD) cospectral analysis are used to quantify the strength of turbulent and sub-meso motions. Previous study showed the evolution of intermittency under strong stratification, when sub-mesoscale energy exceeds 10% of the total mean kinetic energy. While such clear indications are not evident in this available data, we further examine the role of additional factors such as radiative forcing or cloud cover, in the triggering of intermittency in turbulence in this region. The triggering mechanisms are analyzed separately for polar night and polar day regimes, using different radiative forcing thresholds. The study is further extended to analyze the stability correction function (φ) and assess the validity of the classic Monin-Obhukov Similarity Theory (MOST) under such motions. These results are compared with the generalized stochastic model to assess its ability to represent these non-stationary motions associated with intermittency. Following the outcome, the stochastic model may be refined to better capture intermittent turbulence processes in the Arctic.

How to cite: Kuttikulangara, A., Vercauteren, N., Riebold, J., Handorf, D., and Krumshied, S.: Investigating the potential triggering mechanisms of turbulence intermittency in the Arctic Boundary Layer, EGU General Assembly 2026, Vienna, Austria, 3–8 May 2026, EGU26-20888, https://doi.org/10.5194/egusphere-egu26-20888, 2026.

EGU26-22179 | ECS | Posters on site | AS2.3

Investigating surface-ocean oxygen dynamics using MIMS-based O₂/Ar measurements 

Ankit Swaraj and Peter Croot

Air–sea gas exchange exerts a critical control on marine biogeochemistry, yet quantifying biologically driven oxygen fluxes in dynamic sea conditions remains challenging. Here, we use membrane inlet mass spectrometry (MIMS) measurements of dissolved gases to estimate net community production (NCP) from biologically driven oxygen anomalies across the Irish Exclusive Economic Zone (EEZ). High-precision dissolved O₂ and Ar measurements were obtained using a Hiden Analytical MIMS system, enabling calculation of O₂/Ar ratios that isolate the biological oxygen signal by normalisation to inert argon and reference to air–sea equilibrium.


Seawater samples collected during multiple research cruises were analysed under controlled temperature conditions. Raw ion currents were corrected using solubility based relative sensitivity factors, and O₂/Ar ratios were converted to biological supersaturation (ΔO₂/Ar) from the temperature and salinity of the sea water sample, providing a robust tracer of biologically driven O₂ fluxes independent of temperature and solubility effects. Data quality was assessed through comparison of flow through cell and dip-probe measurements and analysis of poisoned samples to constrain non-biological influences.


The collected ΔO₂/Ar dataset covers a diverse oceanic condition from coastal to open ocean, from the Irish Exclusive Economic Zone (EEZ) to the North and South Atlantic. Samples were collected in various seasons in 2024, and in 2025, they were collected along the latitudinal transect. The purpose of these observations is to examine the variations in surface-ocean oxygen levels across different regions, seasons, and latitudes, and to analyse the impacts of biological production, stratification, and air-sea gas exchange on different oceanographic conditions. This method will demonstrate how MIMS-based O₂/Ar measurements may assist in identifying short-term air-sea oxygen fluxes and provide more precise constraints on the productivity and carbon cycling of the ocean.


How to cite: Swaraj, A. and Croot, P.: Investigating surface-ocean oxygen dynamics using MIMS-based O₂/Ar measurements, EGU General Assembly 2026, Vienna, Austria, 3–8 May 2026, EGU26-22179, https://doi.org/10.5194/egusphere-egu26-22179, 2026.

EGU26-22600 | Orals | AS2.3

Controls on Benthic Sulfur and Carbon Reservoirs in the Kara Sea: Tracing DMSP and Hydrocarbons across an Ice-Regime Gradient 

Nikolai Pedentchouk, Kai Sun, David Pearce, Jonathan D. Todd, and David J. Lea-Smith

Arctic shelf seas are important sites for global carbon and sulfur cycling, yet their biogeochemical feedbacks are rapidly changing due to climate change. This study characterizes Dimethylsulfoniopropionate (DMSP) and hydrocarbon signatures in surface sediments (0–1 cm) along a six-station transect in the Kara Sea, from the Yenisey River estuary to Novaya Zemlya (from approx. 71°31' to 77°00' N).

The transect spans a distinct environmental gradient from coastal stations dominated by land-fast ice to open-shelf waters characterized by first-year ice or free from ice. By coupling DMSP concentrations with hydrocarbon biomarkers, we differentiate between terrestrial riverine inputs and autochthonous marine production as drivers of the benthic reservoir. DMSP production is low in riverine regions (~2 nmol g-1) but higher in all marine regions (40-80 nmol g-1) with metagenomic analysis suggesting production is primarily from bacteria. Other bacteria contain DMSP catalysis genes encoding proteins converting DMSP to dimethylsulfide (DMS), a global cooling gas. This suggests that production of DMSP and DMS in the Russian Arctic is widespread and large-scale.

Our findings reveal how specific sea-ice regimes and river discharge regulate organic matter provenance and sulfur biochemistry. These baseline data are essential for predicting how Arctic biogeochemical feedbacks — specifically sediment-atmosphere chemical fluxes — will respond to projected declines in sea ice extent and increased river runoff.

How to cite: Pedentchouk, N., Sun, K., Pearce, D., Todd, J. D., and Lea-Smith, D. J.: Controls on Benthic Sulfur and Carbon Reservoirs in the Kara Sea: Tracing DMSP and Hydrocarbons across an Ice-Regime Gradient, EGU General Assembly 2026, Vienna, Austria, 3–8 May 2026, EGU26-22600, https://doi.org/10.5194/egusphere-egu26-22600, 2026.

EGU26-192 | ECS | PICO | AS3.5

Evaluation of WRF-Chem aeolian dust emission and land surface models over the dust belt. 

Semontee Deb, Elena Louca, Angelos Violaris, Pantelis Kiriakidis, Yannis Proestos, and Theodoros Christoudias


Aeolian dust is a key component of the Earth system, influencing biogeochemical cycle, cloud microphysics, and the radiative energy budget and atmospheric dynamics, while also degrading air quality around major source regions. Large uncertainties persist in simulating atmospheric dust emission and transport, arising from the complex coupling between surface properties, boundary-layer processes, and atmospheric forcing. 

Previous efforts to evaluate the dust modelling performance of the Weather Research and Forecasting model coupled with Chemistry (WRF-Chem) have mostly relied on short-term or region-specific case studies, typically focused on individual dust outbreaks or restricted geographical domains.
In this study, we present a comprehensive, year-long evaluation of WRF-Chem (v4.7.1) over the dust belt spanning North Africa, the Middle East, and Central Asia. We evaluate an ensemble of six simulations using three widely applied dust emission schemes (GOCART, AFWA, and UoC) combined with two advanced land surface models (LSM): Noah-MP and CLM4. The ensemble model output is assessed against multiple observation and reanalysis datasets, including AERONET aerosol optical depth (AOD), the MODIS-derived MIDAS dust optical depth product, and ERA5-Land surface fields of soil moisture and wind speed, which control dust emission fluxes. 

Our analysis shows that land-surface representation exerts a strong influence on dust emission magnitude and spatial distribution, with Noah-MP yielding systematically higher agreement with observed meteorology and AOD. Among the dust emission schemes, AFWA performs most consistently, while UoC04 exhibits lower precision. Empirical scaling factors are derived for each dust emissions–LSM pairing.To our knowledge this is the first year-round, multi-scheme assessment of WRF-Chem dust performance, offering guidance for improved dust forecasting and climate applications. 


How to cite: Deb, S., Louca, E., Violaris, A., Kiriakidis, P., Proestos, Y., and Christoudias, T.: Evaluation of WRF-Chem aeolian dust emission and land surface models over the dust belt., EGU General Assembly 2026, Vienna, Austria, 3–8 May 2026, EGU26-192, https://doi.org/10.5194/egusphere-egu26-192, 2026.

Aerosols over the Indian region exhibi large spatial and seasonal Variation, however long-term ground-based Measurements that can consistently illustrate these variations are still limited. In this work, I utilize Level-2 AERONET data from selected locations in India to investigate how aerosol loading and optical attributes have changed during the last decade. The analysis centers chiefly on on Aerosol Optical Depth (AOD), Ångström exponent, and basic inversion products that help identify the dominant aerosol types.

The results indicate a clear seasonal variation at all stations. High AOD values appear during the pre-monsoon months, which is consistent with dust-laden air mass intrusion from arid regions, while winter months present increased fine-mode aerosols linked to vegetation fires and area-specific emission activities. Stations located in the Indo-Gangetic Plain exhibit the highest overall AOD levels, whereas coastal and semi-arid stations demonstrate lower values and more mixed aerosol regimes. Some sites indicate a gradual rise in fine-mode aerosol contribution, suggesting increasing anthropogenic influence, while others show small or no long-term trends.

These observations assist into better understand the aerosol environment over India and also furnish a reliable reference for measuring satellite retrievals. The study highlights how AERONET measurements can support regional climate and air-quality assessments by offering consistent, long-term optical property data that cannot be captured fully by satellites alone.

How to cite: Saxena, A.: Aerosol Characteristics over India Based on Long-Term AERONET Measurements, EGU General Assembly 2026, Vienna, Austria, 3–8 May 2026, EGU26-261, https://doi.org/10.5194/egusphere-egu26-261, 2026.

EGU26-943 | ECS | PICO | AS3.5

UAV observations to reveal new insights into dust particle morphology and orientation 

Kenneth M. Tschorn, Konrad Kandler, Frank Gunther Wienhold, Maria Kezoudi, Alkistis Papetta, Kostas Fragkos, Kilian Schneiders, Zuhir Bona, and Franco Marenco

Atmospheric dust affects the Earth’s radiation budget through scattering and absorption, processes governed by its optical properties linked to their microphysical characteristics (size, shape, refractive index, and orientation). While knowledge of dust particle size has progressed in the last few decades, dust morphology remains poorly constrained beyond the generic category of “irregular particles”. Although some studies suggest that dust particles can exhibit preferred orientations within the atmospheric column, most radiative-transfer models still represent dust as ensembles of randomly oriented spheres or spheroids. The limited availability of direct observational evidence limits our understanding of how dust’s non-sphericity and orientation influence remote-sensing retrievals, atmospheric processes, and aerosol radiative forcing. Given that mineral dust accounts for one of the largest global mass fluxes of primary aerosols, reducing these uncertainties is crucial to better constrain its overall radiative impact.


To address these gaps, we collect new UAV-based datasets on dust particle shape, internal structure, and orientation. In spring 2025, the Cyprus Institute conducted a two-month UAV campaign aiming for two goals: (1) to advance airborne dust-sampling methods, and (2) to investigate dust composition, size, shape, and orientation. Multiple UAV platforms were deployed during eight dust-affected flight days, guided by daily dust and weather forecasts. This strategy enabled sampling of diverse atmospheric conditions, including a strong dust event on 17/05/2025 with total AOD at 500- nm approaching the value of 1. Additional campaigns will further expand the dataset.


The UAV payloads included the Compact Optical Backscatter Aerosol Detector (COBALD) and Giant Particle Collectors (GPAC), supplemented by Optical Particle Counters (OPCs). To detect signatures of particle orientation two COBALD instruments, each operating at two wavelengths (455 and 940 nm), were deployed in a dual-field-of-view configuration pointing horizontally and vertically with two nearly orthogonal viewing directions. GPAC were adapted to carry TEM grids (small, ultra-thin mesh substrates used to collect particles for transmission electron microscopy) enabling airborne dust sampling suitable for high-resolution imaging and 3-D reconstruction of particle morphology. These combined measurements provided a unique dataset for assessing dust particle morphology, size, and potential orientation effects in the atmospheric column.

How to cite: Tschorn, K. M., Kandler, K., Wienhold, F. G., Kezoudi, M., Papetta, A., Fragkos, K., Schneiders, K., Bona, Z., and Marenco, F.: UAV observations to reveal new insights into dust particle morphology and orientation, EGU General Assembly 2026, Vienna, Austria, 3–8 May 2026, EGU26-943, https://doi.org/10.5194/egusphere-egu26-943, 2026.

EGU26-2760 | PICO | AS3.5

Tracing a Northern African Contribution to European Dust During the Last Glacial Maximum 

Denis-Didier Rousseau, Catherine Chauvel, Peter O Hopcroft, Pamela Gutiérrez, Ségolène Saulnier-Copard, Pierre Antoine, Markus Fuchs, and Alicja Ustrzycka

During the Last Glacial Maximum (LGM), global surface air temperatures were up to 6 °C lower than pre-industrial levels, and the mineral dust cycle intensified significantly, with global dust loading two to four times higher than during the Holocene. Loess deposits and Greenland ice cores record peak dust concentrations during this period. While Asian sources were traditionally considered the primary contributors to dust in Greenland, recent geochemical evidence indicates a mixture of Asian, North African, and European origins. Europe itself experienced heightened dust activity, predominantly attributed to local sources. Here, we present trace element data and Sr and Pb isotopic signatures from LGM-aged samples across 15 European sites, from a Western France to Ukraine longitudinal transect, revealing a notable contribution of fine dust from remote sources, particularly Northern Africa. These geochemical findings are corroborated by Earth System model simulations, which underscore Northern Africa's substantial role in dust deposition across the Northern Hemisphere during glacial periods.

Reference: Rousseau et al. (2025). A remote input of African dust to Last Glacial Europe. Comm. Earth & Environ., 6, 847. https://doi.org/10.1038/s43247-025-02888-9

How to cite: Rousseau, D.-D., Chauvel, C., Hopcroft, P. O., Gutiérrez, P., Saulnier-Copard, S., Antoine, P., Fuchs, M., and Ustrzycka, A.: Tracing a Northern African Contribution to European Dust During the Last Glacial Maximum, EGU General Assembly 2026, Vienna, Austria, 3–8 May 2026, EGU26-2760, https://doi.org/10.5194/egusphere-egu26-2760, 2026.

EGU26-3373 | ECS | PICO | AS3.5

New processes to counteract sedimentation of coarse dust particles are required for climate models to agree with observations 

Natalie Ratcliffe, Claire Ryder, Nicolas Bellouin, Martina Klose, Stephanie Woodward, Anthony Jones, Ben Johnson, Lisa-Maria Wieland, Andreas Baer, Josef Gasteiger, and Bernadett Weinzierl

Recent observations show that large mineral dust particles are more abundant in the atmosphere than expected and travel further than their mass and theoretical rapid deposition allow for. The presence of these large particles alters the impact of dust on Earth’s radiative budget, carbon and hydrological cycles, and human health. Research into the impacts of the mechanisms influencing large dust particle lifetime in models is vital in ascertaining how large dust particles travel thousands of kilometres further than expected. We employ a series of model simulations to better understand the long-range transport of large particles from the Sahara to the West Atlantic. We present results from two models—HadGEM3A and ICON-ART—which are run at differing resolutions and with different dust representations (size bins and lognormal modes). Observations are used to verify long-range transport in model simulations, including in-situ aircraft observations at the Sahara, Canary Islands, Cape Verde, and Caribbean. Coarse particle mass loading (validated against observations) is limited by excessively rapid deposition in both models, but is further limited in ICON-ART by a reduced size-range representation, with the coarsest mode having a mean diameter by mass of 14.2 µm, whereas the maximum dust size in HadGEM3A extends to 63.2 µm. The sensitivity of large particle long-range transport to sedimentation, convective and turbulent mixing, shortwave absorption, and impaction scavenging are tested in global HadGEM3A climate simulations. A reduction in sedimentation by 80% is required to bring the modelled large particle transport into agreement with aircraft observations. None of the other processes tested were able to make the multiple order of magnitude changes to long-range large particle concentration in the model required for agreement with the observations. Convective and turbulent mixing in the model have minimal impact on large particle long-range transport, but are key in controlling the vertical distribution in the Saharan air layer and marine boundary layer, respectively. This work adds to the growing body of evidence that points to processes involved in large mineral dust transport and deposition which are not represented accurately or at all in models, which counteract the sedimentation of large particles in the real-world.

How to cite: Ratcliffe, N., Ryder, C., Bellouin, N., Klose, M., Woodward, S., Jones, A., Johnson, B., Wieland, L.-M., Baer, A., Gasteiger, J., and Weinzierl, B.: New processes to counteract sedimentation of coarse dust particles are required for climate models to agree with observations, EGU General Assembly 2026, Vienna, Austria, 3–8 May 2026, EGU26-3373, https://doi.org/10.5194/egusphere-egu26-3373, 2026.

EGU26-3933 | ECS | PICO | AS3.5

Seasonal variability of mineral dust composition on an alpine snowpack in the Tateyama Mountains, Japan  

Pia Ataka, Ryo Sugiyama, Noboru Furukawa, and Nozomu Takeuchi

 Mineral dust deposited on snow surfaces plays an important role in snow and ice melting by reducing surface albedo and modifying surface energy balance. In addition to its direct radiative effects, mineral dust can indirectly enhance snow surface darkening by supplying nutrients that stimulate snow algal activity. Despite its importance, the sources and mineralogical characteristics of dust preserved in alpine snowpacks remain insufficiently constrained, particularly with respect to seasonal changes during the melt period.

 Most previous studies have interpreted mineral dust on snow as long-range transported material originating from continental desert regions. In alpine environments, however, progressive snow retreat during the melt season exposes surrounding ground surfaces and bedrock, potentially increasing contributions from locally derived mineral particles. How these local and remote dust sources vary seasonally, and how they are recorded in the mineralogical composition of snow-surface particles, remains poorly understood. This study aims to clarify the seasonal and spatial variability of mineral dust sources on alpine snow surfaces in the central Japanese mountains.

 We analyzed mineral particles deposited on snow surfaces in the Tateyama Mountains, central Japanese Alps. Surface snow samples collected during the melt season (May–July 2017) were compared with dust-layer samples from a snow pit excavated in April 2008, representing springtime deposition. Mineralogical analyses using X-ray diffraction and optical microscopy show that dust deposited in April and during the early melt season is dominated by quartz and feldspar, consistent with long-range transported mineral dust. As the melt season progressed, the relative abundances of Fe–Mg–bearing minerals, including chlorite, biotite, and amphibole, increased systematically. Spatial variations further reveal localized feldspar enrichment at specific sites, indicating increasing inputs from locally derived mineral particles sourced from surrounding bedrock.

 These results demonstrate a pronounced seasonal shift in mineral dust provenance on alpine snow surfaces, from dominantly long-range transported dust in spring to increasing local geological contributions during the melt season. Such changes in mineralogical composition may alter snow surface albedo and melt processes, highlighting the need to consider mineral dust composition, not only dust loading, when evaluating alpine snowmelt dynamics.


How to cite: Ataka, P., Sugiyama, R., Furukawa, N., and Takeuchi, N.: Seasonal variability of mineral dust composition on an alpine snowpack in the Tateyama Mountains, Japan , EGU General Assembly 2026, Vienna, Austria, 3–8 May 2026, EGU26-3933, https://doi.org/10.5194/egusphere-egu26-3933, 2026.

Sand and dust storms (SDS) are among the most impactful atmospheric hazards, affecting air quality, climate, ecosystems, and socio-economic activities across continents. East Asia is one of the world’s major dust source regions, and recent observations indicate a renewed increase in SDS frequency and intensity since the mid-2010s, with several extreme events occurring in 2021, 2023, and 2025. This contribution presents recent advances in SDS early warning and forecasting developed at the WMO Asian Sand and Dust Storm Warning Advisory and Assessment System (SDS-WAS) Regional Center, hosted by the China Meteorological Administration.


We highlight progress in multi-source monitoring, multi-model forecasting, and artificial intelligence (AI) applications for SDS prediction. Satellite-based minute-scale dust identification has been achieved through multi-sensor data fusion, enabling near-real-time monitoring of dust severity and three-dimensional vertical structure by integrating satellite, lidar, radar, and ground-based observations. On the forecasting side, operational multi-model ensemble systems provide regional dust concentration, optical depth, emission, and deposition products. A machine-learning-based ensemble correction approach further improves surface dust concentration forecasts by optimally combining multiple models based on their historical performance.


In addition, an AI-driven global coupled aerosol–meteorology forecasting system has been developed, delivering 5-day, high-resolution forecasts of dust optical depth and surface concentrations. Case studies demonstrate that this system captures long-range dust transport from both Asian and Saharan sources, including events affecting Europe, with forecast skill exceeding that of several regional numerical models.


As a WMO SDS-WAS Asian Regional Center, we emphasize the importance of strengthening collaboration with the WMO SDS-WAS program and other regional nodes. Enhanced data sharing, harmonized observational datasets, and coordinated multi-model and AI-based forecasting efforts are essential to improve global SDS early warning capabilities. The experience gained in Asia offers valuable insights for Europe and other downwind regions, supporting transboundary aerosol monitoring, risk assessment, and mitigation strategies at the global scale.

How to cite: An, L.: Developments in Monitoring and Multi-Model Applications of Dust Weather in SDS-WAS ASIAN REGIONAL CENTER, EGU General Assembly 2026, Vienna, Austria, 3–8 May 2026, EGU26-4602, https://doi.org/10.5194/egusphere-egu26-4602, 2026.

EGU26-4611 | ECS | PICO | AS3.5

Understanding Global Haboobs Using iDust 

Mei Chong and Xi Chen

Haboobs, dust storms triggered by convective cold pool outflows, contribute significantly to the global dust cycle and cause severe socioeconomic impacts through rapid visibility reduction and health hazards. However, haboob processes are inadequately represented in current reanalysis products (MERRA-2, EAC4) due to insufficient resolution to resolve mesoscale convection and hydrostatic dynamics that cannot properly describe the small-scale vertical motions. To date, haboobs have been studied primarily through individual cases and regional statistics, while systematic global-scale understanding remains lacking. This study investigates the global spatiotemporal patterns of haboobs and quantifies their contributions to dust emissions using the 12.5-km iDust model with analysis wind nudging. We perform multi-year global simulations, validate them against ground-based and satellite observations, and systematically identify and characterize haboob events worldwide. Our findings reveal global haboob patterns and their role in the dust cycle, advancing scientific understanding of convective dust processes.

How to cite: Chong, M. and Chen, X.: Understanding Global Haboobs Using iDust, EGU General Assembly 2026, Vienna, Austria, 3–8 May 2026, EGU26-4611, https://doi.org/10.5194/egusphere-egu26-4611, 2026.

The characteristics and potential influence of dust events under the background of Northeast China Cold Vortex (NCCV) have rarely been investigated. Based on meteorological observational data and ERA5 reanalysis data from 2015 to 2023, we examined the spatiotemporal and environmental characteristics of dust events under NCCV and non-NCCV conditions and explored the potential impacts of the NCCV on dust events. The results indicate that dust days in Northeast China exhibited a trend of first decreasing and then increasing during the study period, and severe dust events mainly occurred in central Inner Mongolia, a key dust source region in China. Dust days associated with the NCCV accounted for 32.7% of the total dust days, and their station-frequency ratio reached 43.7%. Dust events were predominantly concentrated in the southwest quadrant of the NCCV periphery (60.1%), mostly within a range of 1.0–2.6 times the NCCV radius. This distribution pattern can be attributed to the strong baroclinity often related to the low-level shear lines and dry ambient conditions in this region. Moreover, strong downward momentum transfer and weakly stable stratification within the planetary boundary layer under NCCV conditions also facilitated the formation of dust events. This study reveals the important impacts of the NCCV on dust events, thereby providing a scientific basis for further understanding the formation mechanisms of such events.

How to cite: Li, X. and Xu, S.: Characteristics and impacts of dust events under the background of Northeast China Cold Vortex (NCCV), EGU General Assembly 2026, Vienna, Austria, 3–8 May 2026, EGU26-5478, https://doi.org/10.5194/egusphere-egu26-5478, 2026.

EGU26-5689 | ECS | PICO | AS3.5

Re-evaluating Dust Emission Potential from Burned Surfaces on Vegetated Dunes in the Southwest Kalahari 

Rosemary Huck, Giles Wiggs, David Thomas, and Natasha Wallum

Sand dunes are not typically considered a major contributor to atmospheric dust loading due to coarse grain sizes and the infrequent observation of dust emission events. In vegetated dune systems, dust emission is less common as plant cover inhibits wind erosion. However, disturbances, such as fire, can rapidly remove protective vegetation cover which exposes resident fine sediments to wind erosion.

This study investigates dust emission potential following fire-induced de-vegetation in the driest region of the world’s largest sand sea, the southwest Kalahari. Adopting a hybrid approach, we combine remote sensing to characterise fire extent and timing and portable wind tunnel (PI-SWERL) experiments to quantify erosion potential.

A 24-year fire inventory reveals that burning is most frequent during or immediately after La Niña events, although anthropogenic land management significantly influences the spatial and temporal distribution of fires. The period for dust emission potential following fire is short, constrained by rapid vegetation recovery typically within 2 years. Grain size analyses indicate that dust-sized particles (<62.5 μm) are present in both burned and unburned dune surfaces; however, no significant depletion of fine particles from burned surfaces was observed, suggesting minimal loss through aeolian processes.

PI-SWERL experiments confirm that these fine particles can be entrained, yet higher threshold friction velocities are required for erosion at burned sites. The presence of biological soil crusts (biocrust) at all burned sites implies a stabilising influence on the erosion threshold. Where the surface had been disturbed, resulting in the removal of the typically present biocrust, our data suggest that dust emission fluxes are, on average, 8-13 times higher than those of unburned surfaces.

These findings indicate that currently there is little potential for dust emission in the post-fire de-vegetation period. This study provides new insights into the mechanisms controlling dust emissions in partially vegetated dune landscapes and highlights the importance of multiple, interacting, surface properties in governing aeolian processes.

How to cite: Huck, R., Wiggs, G., Thomas, D., and Wallum, N.: Re-evaluating Dust Emission Potential from Burned Surfaces on Vegetated Dunes in the Southwest Kalahari, EGU General Assembly 2026, Vienna, Austria, 3–8 May 2026, EGU26-5689, https://doi.org/10.5194/egusphere-egu26-5689, 2026.

EGU26-6290 | PICO | AS3.5

Aridity record from the western Australia across the Early-Middle Pleistocene Transition 

Terezia Kunkelova, Anna Arrigoni, and Gerald Auer

Australian aridity is primarily governed by large-scale atmospheric circulation and by the influence of the Australian-Indonesian monsoon (AIM). Regional climate variability is further modulated by coupled ocean-atmosphere modes, including the El Niño-Southern Oscillation (ENSO), the Indian Ocean Dipole (IOD), and the Southern Annular Mode (SAM), whose interactions regulate moisture supply and hydroclimatic variability across the Australian continent. Western Australia has experienced pronounced hydroclimatic variability through time, characterized by arid glacial intervals and more humid interglacials, highlighting a strong regional sensitivity to insolation forcing, large-scale atmospheric circulation, and changes in Indo-Pacific climate modes. However, Australian hydroclimate responses during intervals of major climatic reorganization, such as the Early-Middle Pleistocene Transition (EMPT), remain poorly constrained. The EMPT (~1.2-0.6 Ma) marks a fundamental reorganization of the climate system, characterized by intensified glacial-interglacial cycles and a shift toward a ~100-kyr periodicity.

Here, we present a grain size record from IODP Site U1460 spanning the EMPT, reflecting changes in aridity within western Australia. Using a grain-size end-member unmixing model, we aim to distinguish relative changes in the proportions of fine-grained material and coarser-grained sediment as proxies for shifts between humid and arid intervals. Furthermore, we are developing a specialized method to remove biogenic silica from marine sediment, as the site contains a high concentration of sponge spicules. These spicules are particularly challenging to remove due to their chemical resilience. This method is critical to prevent interference with sedimentological measurements and to ensure the accuracy of our grain size end-member modelling and hydroclimatic interpretations. Our grain size record will not only provide a refined biogenic silica removal method but also offer new insights into the evolution of Australian arid environments and the mechanisms linking regional hydroclimate to global climate reorganization during the Pleistocene. These findings will serve as critical analogues for understanding hydroclimatic sensitivity under sustained anthropogenic forcing.

How to cite: Kunkelova, T., Arrigoni, A., and Auer, G.: Aridity record from the western Australia across the Early-Middle Pleistocene Transition, EGU General Assembly 2026, Vienna, Austria, 3–8 May 2026, EGU26-6290, https://doi.org/10.5194/egusphere-egu26-6290, 2026.

EGU26-7051 | ECS | PICO | AS3.5

Dust amplified Glacier Mass Loss in High Mountain Asia 

Xingli Mao

Dust aerosols impact High Mountain Asia (HMA) glacier mass balance through reducing albedo (direct effect) and affecting the accumulation of glacial materials by disturbing precipitation (indirect effect), but the mechanism remains unclear.  Using a regional climate model and coupling it to a glacier energy-mass balance model for the period 2016-2022, we demonstrate that dust amplifies glacier mass loss by 6%, primarily by reducing solid precipitation (46%) and albedo (41%). This dust-induced glacier retreat leads to significant declines in water storage, particularly in the Tarim Basin (-13%). As dust emissions are projected to rise, transboundary mitigation is urgently needed to preserve regional water security.

How to cite: Mao, X.: Dust amplified Glacier Mass Loss in High Mountain Asia, EGU General Assembly 2026, Vienna, Austria, 3–8 May 2026, EGU26-7051, https://doi.org/10.5194/egusphere-egu26-7051, 2026.

EGU26-7253 | PICO | AS3.5

Towards Understanding the Climate Response to the Historical Dust Increase in ICON-XPP 

Claus Sarnighausen, Natalia Sudarchikova, and Stephanie Fiedler

Mineral dust aerosol shapes the global climate, mainly through interactions with radiation and clouds, and especially on the regional level close to major emission sources. However, the Coupled Model Intercomparison Project, phase six (CMIP6) models with coupled dust emission parameterization schemes fail to reproduce the 55 ± 30% increase in atmospheric dust concentration since 1850 (Kok et al. 2023). In the present study, we construct the historically changing monthly 'Dust Plumes' (DuPlumes) climatology (Sudarchikova et al. in prep.) and investigate implications of changing dust aerosol for the global climate in ICON-XPP, Germany's designated model for CMIP7. DuPlumes consists of a parameterized analytical framework, originally designed for anthropogenic aerosols (Stevens et al. 2017).  To create the representation of natural desert-dust aerosols, this study utilizes reanalysis data of dust optical depth, measurement data of scattering properties, and a marine-core-based reconstruction of the historical trend. To constrain the spatial pattern of present-day optical depth by observation, we use data of four reanalysis products (CAMS, MERRA2, JAero, and NAAPS), monthly averaged for the decade around the year 2010 (2004–2015). Plume functions related to ten dust plumes globally are fitted to the data using a gradient descent algorithm. The fit achieves a spatial correlation of r=0.98 with the data, with maximum deviations in summer of 0.08, or 2% of maximum aerosol optical depth, which is smaller than the uncertainty measured across the reanalysis ensemble. Compared to the currently implemented static ICON-XPP dust climatology, the reanalysis ensemble and, subsequently, dust plumes suggest considerably higher optical depth (~0.1) in the Eastern Asian Taklamakan and Gobi Desert regions. The vertical profile is informed by the 2007–2019 climatology derived from Cloud-Aerosol Lidar with Orthogonal Polarization (CALIOP) retrievals. We also include measurements of dust scattering properties from literature, including in-situ data and laboratory measurements. Ongoing work includes ICON-XPP experiments with dust optical properties represented by DuPlumes. These allow us to estimate the spatial pattern of effective radiative effects of the present-day natural dust relative to the pre-industrial levels.

---

Kok, J.F., Storelvmo, T., Karydis, V.A., Adebiyi, A.A., Mahowald, N.M., Evan, A.T., He, C., Leung, D.M.: Mineral dust aerosol impacts on global climate and climate change. Nat Rev Earth Environ. 4, 71–86 (2023). https://doi.org/10.1038/s43017-022-00379-5

Stevens, B., Fiedler, S., Kinne, S., Peters, K., Rast, S., Müsse, J., Smith, S.J., Mauritsen, T.: MACv2-SP: A parameterization of anthropogenic aerosol optical properties and an associated Twomey effect for use in CMIP6. Geoscientific Model Development. 10, 433–452 (2017). https://doi.org/10.5194/gmd-10-433-2017

How to cite: Sarnighausen, C., Sudarchikova, N., and Fiedler, S.: Towards Understanding the Climate Response to the Historical Dust Increase in ICON-XPP, EGU General Assembly 2026, Vienna, Austria, 3–8 May 2026, EGU26-7253, https://doi.org/10.5194/egusphere-egu26-7253, 2026.

EGU26-7557 | ECS | PICO | AS3.5

The impact of grid resolution on global dust emission potential 

Pascal Kunze, Bernd Heinold, and Ina Tegen

Due to its radiative effects, mineral dust constitutes a critical component in global aerosol climate models. However, the representation of dust emissions currently remains a substantial source of uncertainties in dust model simulations. Convective systems are major contributors to dust emission. Moist convection, however, is still a sub-grid scale process in most climate models, which has to be parameterized. Recent comparison studies between high-resolution, convection-resolving simulations and models with horizontal resolutions, that do not allow for considering moist convection explicitly, have revealed the model resolution as a key driver for the model uncertainties.  To further evaluate the impact of model resolution on dust emission, we conducted an analysis based on surface winds from two distinct modeling frameworks: (i) the coarse-resolution CMIP6 model ensemble, where convection is parameterized, and (ii) high-resolution ICON simulations from the DYAMOND (DYnamics of the Atmospheric general circulation Modeled On Non-hydrostatic Domains) project, which explicitly resolve moist convection. An indicator of dust emissions is the so-called dust emission potential, which is calculated offline for these different datasets and systematically evaluated for key global source regions. The analysis reveals pronounced regional and seasonal differences in the magnitude and characteristics of the modeled dust emission proxy. To investigate the origins of these uncertainties, we further compare the model outputs with high-resolution regridded data and analyze the diurnal cycle of dust emissions in selected source regions with a special focused investigation of the Central Asian dust sources. The results highlight the necessity of using high-resolution emission modeling in specific dust source regions to more accurately represent dust-generating processes and their climate impacts.

How to cite: Kunze, P., Heinold, B., and Tegen, I.: The impact of grid resolution on global dust emission potential, EGU General Assembly 2026, Vienna, Austria, 3–8 May 2026, EGU26-7557, https://doi.org/10.5194/egusphere-egu26-7557, 2026.

EGU26-7724 | PICO | AS3.5

Real-time analysis of trace metals in air by microwave induced plasma time-of-flight mass spectrometry (mipTOF) 

Martin Tanner, Alexander Gundlach-Graham, Martin Rittner, Lorenz Gfeller, Jay Slowik, Andre Prevot, Ed Fortner, and John Jayne

Keywords: Mass Spectrometry, Real-Time, Trace Elements, Source Apportionment, Mobile

Determination of the elemental composition of airborne nanoparticles and micro-particles is essential to understand the source(s) of these particles and also to predict potential health effects.1 The most common approach to measure the metal content of air is to collect samples on filters and then analyze digests by ICP-MS; however, this strategy offers poor time resolution (e.g. days) and only provides bulk element composition information. To understand the spatiotemporal characteristics of the emission of metal-containing aerosols, which is key to assessing exposure, real-time analysis strategies are essential. Here, we report on the development of a microwave induced plasma time-of-flight mass spectrometer (mipTOF) used for the direct analysis of metal-containing airborne particles.

The mipTOF is a field-deployable trace-element mass spectrometer. It uses a nitrogen-sustained high-power plasma (MICAP, Radom Instruments)2, 3 to quantitatively vaporize and atomize aerosols with sizes from the ultrafine to PM10. Singly charged atomic ions are generated in the plasma with high efficiency (up to 99%), and then extracted into the mass spectrometer, where they are sorted according to mass-to-charge ratio and recorded. Ambient air is sampled into the plasma via a concentric pneumatic nebulizer set up as a Venturi pump5 at flowrates from 100-200 cm3/min. With the mipTOF, concentration LODs range from 10 ng/m3 (potassium) to 0.05 ng/m3 (lead) with a time resolution of 10 seconds. The high-sensitivity, high-speed metal-aerosol measurements possible with mipTOF enable new research into real-time spatiotemporal analysis of metals in air. We will report on the use of the mipTOF in mobile lab measurements in Switzerland and Massachusetts, USA. In these measurements, we identified several unique sources of airborne metals, including emissions from automotive brake wear, trains, metal-plating industries, cement manufacturers, and light aircraft. In addition to presenting data from these campaigns, we will discuss aspects of instrument design and operation, including power and size requirements, calibration strategies, and instrumental figures of merit.

References:

(1) Daellenbach, K. R. et al. Nature 2020, 587 (7834), 414-419.

(2) Jevtic, J.; Menon, A.; Pikelja, V. PCT/US14/24306, 2015.

(3) Schild, M. et al.  Analytical Chemistry 2018, 90 (22), 13443-13450.

(4) Nishiguchi, K.; Utani, K.; Fujimori, E. J. Anal. Atom. Spec. 2008, 23 (8), 1125-1129.

How to cite: Tanner, M., Gundlach-Graham, A., Rittner, M., Gfeller, L., Slowik, J., Prevot, A., Fortner, E., and Jayne, J.: Real-time analysis of trace metals in air by microwave induced plasma time-of-flight mass spectrometry (mipTOF), EGU General Assembly 2026, Vienna, Austria, 3–8 May 2026, EGU26-7724, https://doi.org/10.5194/egusphere-egu26-7724, 2026.

Dust aerosols are a key component of the Earth's climate system. However, global climate models often depict mineral dust as a uniform aerosol. This simplification limits the physical realism of dust simulations, necessitating comparison with available observations to determine whether mineralogical variability is accurately represented when incorporated into a global climate-aerosol model.

In this study, we examine how well a mineralogical soil database translates into realistic mineral-resolved dust transport and deposition in the global climate model ICON coupled with the aerosol module HAM. This implementation is based on the mineralogical soil database of Journet et al. (2014), as modified by Goncalves-Ageitos et al. (2023), and it explicitly represents 12 individual minerals. Using multi-year global simulations, we evaluate the simulated mineralogical dust cycle with a focus on emission patterns, transport pathways, regional deposition, and the representation of seasonal and interannual variability. Model results are compared with available observations and datasets to assess the added value and limitations of mineral-resolved dust representation.

The evaluation demonstrates where mineralogical information helps to better constrain dust transport and deposition and identifies key uncertainties that remain. These results provide a basis for future work on mineral-specific dust deposition and its role in biogeochemical cycles.

How to cite: Hofmann, E., Wagner, R., and Schepanski, K.: How well does a mineralogical soil database translate into realistic mineral-resolved dust transport and deposition in a global climate model?, EGU General Assembly 2026, Vienna, Austria, 3–8 May 2026, EGU26-7789, https://doi.org/10.5194/egusphere-egu26-7789, 2026.

EGU26-9453 | PICO | AS3.5

Laboratory investigation of the radiative properties of mineral dust across the solar and terrestrial spectrum: key achievements and future directions 

Claudia Di Biagio, Pasquale Sellitto, Bénédicte Picquet-Varrault, Jean-François Doussin, and Paola Formenti

Coarse mineral dust aerosols originating from arid and semi-arid regions worldwide constitute one of the dominant tropospheric aerosol species by mass. Mineral dust both absorbs and scatters solar and terrestrial radiation, thereby influencing the radiance spectrum at the surface and at the top of the atmosphere, as well as the atmospheric heating rate. Dust is a key, yet still highly uncertain, contributor to both historical and contemporary climate change.

Modelling the interaction of dust with atmospheric radiation remains challenging because dust absorption and scattering properties, represented by the complex refractive index, depend on mineralogical composition – which varies with the emission source – and on particle size distribution, which evolves during transport. Climate models and remote-sensing retrievals therefore require accurate, regionally dependent information to improve dust representation and reduce uncertainties in radiative effect estimates.

Laboratory investigation has proven to be a powerful approach for unravelling the optical properties of mineral dust across the solar and terrestrial infrared spectrum. Original experiments based on realistic aerosols generated from natural soils have provided important new insights into the optical properties of global mineral dust in the solar and thermal infrared spectral ranges, as well as their variability with particle composition and during transport. These results have motivated the modelling and remote-sensing communities to revisit dust representation in models, leading to new evaluations of the dust direct radiative effect and its associated uncertainty, as well as to the development of innovative remote-sensing products. Current research is now extending the investigated spectral range toward the far infrared and to emerging source regions, for which knowledge of dust–radiation interactions remains very limited.

This presentation highlights key results and open scientific questions that have driven recent research on the radiative properties of mineral dust, and outlines perspectives for future studies.

How to cite: Di Biagio, C., Sellitto, P., Picquet-Varrault, B., Doussin, J.-F., and Formenti, P.: Laboratory investigation of the radiative properties of mineral dust across the solar and terrestrial spectrum: key achievements and future directions, EGU General Assembly 2026, Vienna, Austria, 3–8 May 2026, EGU26-9453, https://doi.org/10.5194/egusphere-egu26-9453, 2026.

EGU26-10457 | ECS | PICO | AS3.5

Tracing the provenance and evolution of Asian dust fluxes during the Holocene: A geochemical study of sediment archives from Adak Island, Alaska 

Rakesh Kumar Rout, Tolulope Joseph Ayodeji, Nicolas Waldmann, and Daniel Palchan

Asian dust plumes export micronutrients eastward to the Pacific Ocean and are substantial for regulating the marine biogeochemical cycles and productivity. Previous studies from the Gulf of Alaska (a high-nutrient and low-chlorophyll zone) revealed that the dominant nutrient supply during the last deglaciation was primarily sourced from iceberg meltwater instead of local Alaskan dust fluxes. However, attention to distal dust sources from Asia was limited, possibly due to resolution constraints. To address this, we consider here two chronologically well-constrained (by tephrochronology and radiocarbon dating) sedimentary archives from Adak Island (Andrew and Heart lakes), in the central Aleutian Islands, Alaska. These records preserve a high-resolution environmental and climatic history for the last ~10 ka and might also include a continuous record of Asian dust plume sources. Terrigenous materials in these sediments originate from either local weathered basalt units and volcanic ash or from distal Asian dust, comprising erosional products of the granitoid terrane. We studied the siliciclastic fraction of the sediments recovered from both lakes and employed elemental analyses along with radiogenic isotopes (Sr, Nd and Pb) to identify and quantify possible allochthonous dust sources. Our preliminary observations from major and trace elemental ratios and statistical analyses (PCA and factor loadings) suggest that, indeed, there are two dominant sources for terrigenous sediments. The enriched LREE and flat HREE pattern, together with a positive Eu anomaly, further support the mixed source (mafic to felsic) of the sediment supply to the lakes. Additionally, the Chemical Index of Alteration (CIA) and other elemental ratios in both lakes suggest a sharp decreasing trend ca. 4 ka followed by an increasing trend ca. 3.5 ka, which is asynchronous with the increased input of Asian dust and the neoglacial cooling event during this interval. The isotopic and other geochemical studies are in progress, which will further validate these findings.

How to cite: Rout, R. K., Ayodeji, T. J., Waldmann, N., and Palchan, D.: Tracing the provenance and evolution of Asian dust fluxes during the Holocene: A geochemical study of sediment archives from Adak Island, Alaska, EGU General Assembly 2026, Vienna, Austria, 3–8 May 2026, EGU26-10457, https://doi.org/10.5194/egusphere-egu26-10457, 2026.

EGU26-10511 | PICO | AS3.5

Resolving regional controls on dust flux: High-resolution chronostratigraphy of Carpathian loess 

Zoran Perić, Slobodan Marković, Petar Krsmanović, Helena Alexanderson, and Milica Bosnić

Loess-palaeosol sequences (LPS) are vital among terrestrial archives for reconstructing Quaternary palaeoclimates and environmental change. Their extensive distribution across continental mid-latitudes and high sensitivity to atmospheric and surface processes make them indispensable records of past dust cycles, wind regimes, and regional ecosystem dynamics. However, the reliability of these reconstructions, particularly quantitative measures of dust flux variability, is intrinsically limited by the resolution and accuracy of the underlying geochronological framework. Our research directly addresses this chronometric challenge by applying refined luminescence dating techniques and Bayesian age-depth modelling to loess profiles across the Carpathian and Wallachian Basins. This methodological approach enables the construction of high-resolution, probabilistic chronologies that are essential for robust palaeoenvironmental interpretation. The central outcome of this work is a significantly improved, regional reconstruction of dust flux variability. Our integrated analysis demonstrates that dust mass accumulation rates (MARs) across the basins do not conform to a simplified model of peak deposition solely during glacial maxima (MIS 2). This pattern indicates that dust influx was not driven exclusively by global ice volume but was significantly intensified during specific phases of regional climatic amelioration. These findings compel a reinterpretation of regional atmospheric and sediment dynamics. The high dust fluxes during MIS 3 highlight the critical influence of regional controls, such as changes in palaeowind intensity and pathways, episodic sediment supply from major river systems, and the variable dust-trapping efficiency of sparsely vegetated, dynamic landscapes. This underscores the necessity of disentangling the effects of global climate drivers from those of local environmental and geomorphic settings when interpreting the LPS record. The broader objective of this synthesis is to establish a robust, integrated stratigraphic and chronological framework that enables detailed correlation and comparison of loess-derived palaeoenvironmental proxies across the Carpathian and Wallachian Basins. By doing so, we provide new insights into the timing, magnitude, and climatic forcing of past atmospheric dust activity, challenging purely glacially-driven models and contributing to a more nuanced understanding of Quaternary environmental dynamics in Central and Eastern Europe.

How to cite: Perić, Z., Marković, S., Krsmanović, P., Alexanderson, H., and Bosnić, M.: Resolving regional controls on dust flux: High-resolution chronostratigraphy of Carpathian loess, EGU General Assembly 2026, Vienna, Austria, 3–8 May 2026, EGU26-10511, https://doi.org/10.5194/egusphere-egu26-10511, 2026.

EGU26-10600 | ECS | PICO | AS3.5

Improving dust emission in WRF-Chem GOCART scheme using a high-resolution erodibility dataset 

Leandro Segado-Moreno, Juan Pedro Montávez, Eloisa Raluy-López, Ginés Garnés-Morales, Alejandro Cordero, and Pedro Jiménez-Guerrero

Mineral dust is a major atmospheric aerosol, affecting climate, air quality, and human health through radiative and microphysical processes. The Iberian Peninsula is frequently impacted by dust intrusions from North Africa, leading to episodic exceedances of PM10 concentrations that challenge operational air quality forecasts. Accurate simulation of dust emission and transport remains difficult due to uncertainties in soil erodibility, land surface characteristics, and meteorological drivers.

In this study, we assess the impact of two newly developed high-resolution soil erodibility datasets on regional dust simulations using WRF-Chem with the GOCART scheme. The first dataset, EROD, improves dust source representation by integrating fine-resolution topography (GMTED2010), achieving 0.0625° (≈5 km) resolution globally and 1 km locally for the Iberian Peninsula. The second dataset, SOILHD, further refines dust source characterization by incorporating local-scale soil composition (sand, silt, clay fractions) and removing areas erroneously classified as bare soil, reaching 1 km resolution globally. These datasets aim to capture the spatial heterogeneity of dust sources, which is critical in semi-arid regions with sparse vegetation and variable soil properties.

We conduct WRF-Chem simulations for five periods between 2022 and 2025, representing a range of dust episodes with local and long-range transport. Model performance is evaluated against PM10 measurements from the SINQLAIR network across coastal and inland stations in the Region of Murcia. Results indicate that the high-resolution datasets substantially improve the spatial and temporal representation of dust emissions. Inland and low-anthropogenic-influence stations show better agreement with observed PM10 peaks in both magnitude and timing compared to simulations using standard coarse-resolution erodibility fields. At coastal and industrially influenced sites, improvements are more limited due to missing anthropogenic emissions and additional aerosol components, but statistical metrics such as correlation, Mean Bias Error (MBE), and Root Mean Square Error (RMSE) still indicate significant enhancement.

Overall, the results demonstrate that high-resolution, type–aware soil erodibility datasets significantly enhance the skill of dust simulations in WRF-Chem, reducing biases and capturing observed variability more accurately. These findings underscore the importance of detailed soil and topographic information for regional dust modeling and highlight the potential benefits of incorporating such datasets into operational dust forecasting systems.

How to cite: Segado-Moreno, L., Montávez, J. P., Raluy-López, E., Garnés-Morales, G., Cordero, A., and Jiménez-Guerrero, P.: Improving dust emission in WRF-Chem GOCART scheme using a high-resolution erodibility dataset, EGU General Assembly 2026, Vienna, Austria, 3–8 May 2026, EGU26-10600, https://doi.org/10.5194/egusphere-egu26-10600, 2026.

EGU26-11564 | PICO | AS3.5

Dust-driven droplet freezing explains cloud-top phase in the northern extratropics. 

Diego Villanueva, Martin Stengel, Corinna Hoose, Kai Jeggle, Olimpia Bruno, Albert Ansmann, and Ulrike Lohmann

Clouds with temperatures between −39° and 0 °C can be capped by either a liquid or an ice layer, strongly influencing their radiative forcing and precipitation. The cloud-top ice-to-total frequency (ITF) quantifies the occurrence of clouds with ice tops relative to all clouds, yet the processes controlling ITF remain poorly understood. Using 35 years of satellite observations (Cloud_cci v3) and dust reanalysis (MERRA2), we show that in the Northern Hemisphere, at temperatures between −15° and −30 °C, ITF is strongly correlated with dust aerosol variability in both time and space. Moreover, we find that the sensitivities of ITF to temperature and dust occur in a ratio consistent with laboratory measurements of immersion droplet freezing, indicating that dust aerosols impose a logarithmic control on cloud-top phase.

How to cite: Villanueva, D., Stengel, M., Hoose, C., Jeggle, K., Bruno, O., Ansmann, A., and Lohmann, U.: Dust-driven droplet freezing explains cloud-top phase in the northern extratropics., EGU General Assembly 2026, Vienna, Austria, 3–8 May 2026, EGU26-11564, https://doi.org/10.5194/egusphere-egu26-11564, 2026.

EGU26-12006 | PICO | AS3.5

 Dust source transfer from North Africa to the Amazon Basin: geochemical constraints on their long-term sources and composition  

Damien Guinoiseau, Christopher Pöhlker, Anna Kral, Jorge Saturno, Florian Ditas, Paulo Artaxo, Meinrat O. Andreae, and Stephen J.G. Galer

At a global scale, dust can serve as a vector for transferring elements from nutrient-rich soils to nutrient-depleted ecosystems, acting as a natural fertilizer [1]. The Amazonian rainforest, which is partly developed over nutrient-poor lateritic soils, illustrates this concept by receiving annually 8.5 Tg of dust from North African regions [2]. This phenomenon is well-documented and captured by both satellite-derived and in situ observations; however, the documentation of the long-term dust sources in North Africa and their associated chemical composition remains debated today [3,4]. This study presents two chronicles of dust collected at the Atmospheric Tall Tower Observatory (ATTO) during the dust-active season (February to April) in 2016 and 2017. Following a chemical extraction procedure already reported elsewhere [5], the chemical compositions and Sr-Nd-Pb isotope signatures of samples collected during low-dust conditions and dust outbreak events have been analyzed.

Following a statistical ACP and clustering analysis, the extracted water-soluble, acid-soluble, and residual fractions show that dust loading is the main driver of aerosol composition. Carbonated minerals do not survive efficiently in the atmospheric conditions encountered during transatlantic transport within the Saharan Air Layer and are readily solubilized. Most of the silicates and oxides are resistant to atmospheric chemical weathering, with the exception of poorly crystallized Al-Fe oxides. Finally, the geochemical signals of trace metals, potassium, and phosphorus can be complicated by anthropogenic particles or emitted bioaerosols, in addition to dust.

Predominant north African dust sources are identified by combining rare earth element patterns with Sr-Nd-Pb radiogenic isotopes, both of which are clearly diagnostic. A Bayesian mixing model (MixSIAR) is also used to quantify the long-term proportion of each source, while satellite products (CALIPSO, MERRA-2) and back trajectory analyses (HYSPLIT) are used to confirm our observations. Western African soils characterized by alluvial deposits in wadis developed over Phanerozoic terrains are the dominant dust sources (55-90%), while soils associated with Precambrian cratonic areas can act sporadically during significant dust events. As already postulated using a satellite-derived model [3], the Bodélé Depression’s impact on dust reaching the Amazon Basin is negligible, despite its status as the dustiest place on Earth. These results are consistent with conclusions drawn for the Northern Hemisphere, particularly for the Caribbean [5], although dust transport and atmospheric conditions over North Africa differ seasonally (between boreal winter and boreal summer). Finally, the chemical composition of the dust measured for all dust events reaching ATTO in 2016 and 2017 is remarkably uniform and consistent with 2024 and 2025 collected samples from French Guiana and ATTO (Collignon et al., in prep.), allowing for a preliminary estimate of a long-term “averaged North African dust” composition reaching the Amazon Basin.

[1] Reicholf (1986), SNFE, 21, 251-255.

[2] Kok et al. (2021), ACP, 21, 8169-8193.

[3] Yu et al. (2020), GRL, e2020GL088020.

[4] Barkley et al. (2022), GRL, e2021GL097344.

[5] Kumar et al. (2018), EPSL, 487, 94-105.

How to cite: Guinoiseau, D., Pöhlker, C., Kral, A., Saturno, J., Ditas, F., Artaxo, P., Andreae, M. O., and Galer, S. J. G.:  Dust source transfer from North Africa to the Amazon Basin: geochemical constraints on their long-term sources and composition , EGU General Assembly 2026, Vienna, Austria, 3–8 May 2026, EGU26-12006, https://doi.org/10.5194/egusphere-egu26-12006, 2026.

EGU26-12288 | ECS | PICO | AS3.5

The chemical and mineralogical composition of southern African dust aerosols 

Clarissa Baldo, Sophie Nowak, Servanne Chevaillier, Gael Noyalet, Silvia Becagli, Akinori Ito, Sandra Lafon, Claudia Di Biagio, Karine Desboeufs, Remi Stanus, Nadine Mattielli, Heleen C. Vos, Gregory S. Okin, James S. King, Amelie Chaput, Brigitte Language, Stuart Piketh, and Paola Formenti

Southern Africa (SAf) is a key region for dust emissions, characterised by a wide variety of natural and anthropogenic sources, but also a critical knowledge gap in the mineral dust budget of the Southern Hemisphere. Projected climate warming is expected to lead to an increase in mineral dust emissions, which are increasingly linked to human activity. Although the transport and deposition pathways of SAf dust suggest that it can directly affect the regional climate and nearby marine ecosystems through dust-aerosol interaction and indirectly through aerosol-cloud/ice interaction and nutrient deposition, the extent of this impact is highly uncertain due to significant uncertainties in atmospheric loads and climate-relevant properties.

This study provides the first comprehensive characterisation of the chemical and mineralogical composition of SAf dust aerosols. Aerosol samples were laboratory-generated using soils collected from key dust sources in southern Africa, including the Namib gravel plain, coastal ephemeral riverbeds, the Etosha salt pan, the Kalahari Desert, and anthropogenic sources such as agricultural soils from the Free State, savannah soils from the Kruger National Park, and a copper mine in Namibia.

A geographical distribution of the chemical and mineralogical properties of SAf dust was identified based on the elemental ratios Si/Al, (Ca + Mg)/Al, and K/Al. This is influenced by both the regional geology and rainfall distribution, which shows an increase in the Si/Al ratio and a decrease in the (Ca + Mg)/Al and K/Al ratios, in areas with higher rainfall inland compared to the arid coast, while the salt pans exhibit unique features with significantly higher (Ca+Mg)/Al and Si/Al ratios.

The SAf dust appears to be more enriched in Ca, Mg, and K than other dust sources in the Southern Hemisphere and northern African dust. Although Fe, a key micronutrient, occurs at similar levels in dust from both hemispheres, SAf dust contains more P, highlighting its potential significance in biogeochemical cycling. Despite limited mineralogical observations in the Southern Hemisphere, our results indicate that SAf dust contains more feldspar minerals than northern African dust, and may strongly influence the load of ice-nucleating particles over the Southern Ocean and, in turn, the regional radiative budget.

How to cite: Baldo, C., Nowak, S., Chevaillier, S., Noyalet, G., Becagli, S., Ito, A., Lafon, S., Di Biagio, C., Desboeufs, K., Stanus, R., Mattielli, N., Vos, H. C., Okin, G. S., King, J. S., Chaput, A., Language, B., Piketh, S., and Formenti, P.: The chemical and mineralogical composition of southern African dust aerosols, EGU General Assembly 2026, Vienna, Austria, 3–8 May 2026, EGU26-12288, https://doi.org/10.5194/egusphere-egu26-12288, 2026.

In the temperature range between 0 °C and −39 °C, clouds may exist in the liquid phase, the ice phase, or as a mixture of both. Cloud glaciation, defined as the transition from liquid to ice, can be driven by multiple processes. On the one hand, enhanced glaciation may result from secondary ice production. On the other hand, atmospheric aerosols can act as ice-nucleating particles (INPs) and initiate ice crystal formation. Previous studies have highlighted the role of mineral dust as the dominant INP source for cloud glaciation at temperatures below −15 °C.

Although recent findings indicate a correlation between aerosol concentration and cloud glaciation, quantifying aerosol–cloud interactions remains challenging. To better characterize and disentangle the natural spatial and temporal variability of relevant observables governing this relationship, this study combines data from multiple satellite instruments (MSG SEVIRI, MODIS, and IASI). In addition, these observations are compared to ICON model outputs and CAMS reanalysis data. The objective is to provide an assessment of the sensitivity of cloud phase to dust aerosol concentration for given temperatures and synoptic conditions across different datasets.

We primarily investigate the influence of the dust aerosol optical depth (DAOD) in the region between the equator and the subtropical dust belt (0–30° N/S). Our findings highlight the relationship between DAOD and cloud glaciation, characterized by a particularly strong increase in glaciation at high DAOD values. The analysis further includes stratification by large-scale synoptic conditions and cloud type, allowing us to narrow down potential differences between convective and stratiform clouds.

Finally, we examine how the integration of vertical profiles from EarthCARE may facilitate the detection of not only horizontally but also vertically collocated cloud and aerosol layers, thereby improving statistical estimates of aerosol–cloud interactions.

How to cite: Brüning, S., Stengel, M., and Robbins, D.: Investigating dust aerosol effects on mixed-phase cloud glaciation based on an intercomparison of satellite observations, EGU General Assembly 2026, Vienna, Austria, 3–8 May 2026, EGU26-12744, https://doi.org/10.5194/egusphere-egu26-12744, 2026.

EGU26-13178 | ECS | PICO | AS3.5

Impact of iron-containing dust on atmospheric oxidation processes 

Simon Rosanka, Klaus Klingmüller, Rolf Sander, Andrea Pozzer, Jos Lelieveld, and Domenico Taraborrelli

In the atmosphere, organic and inorganic compounds can partition into clouds, fog, raindrops, and aqueous aerosols, where they undergo rapid chemical oxidation, yielding secondary aerosols. This process is governed by the availability of radicals such as hydroxyl (OH) and nitrate (NO3) radicals in the liquid phase. The presence of dissolved iron can boost the OH reactivity via Fenton reactions. Dust is a major source of iron in the atmosphere, occurring primarily in the crystalline lattices of aluminosilicates or as iron oxides. Following its emission, iron tends to be mostly insoluble but can be converted into soluble forms when inorganic acids decrease the pH, and organic ligands create iron complexes during atmospheric transport. In this study, we address the importance of iron in global atmospheric oxidation processes by mechanistically modelling the related chemical processes in the gas and liquid phases within clouds, fog, rain droplets, and, for the first time, aqueous aerosols. We employ the atmospheric chemistry MESSy model infrastructure, coupled to the global general circulation model ECHAM5 (EMAC). We represent three mechanisms of iron dissolution into aerosol water, driven by aerosol acidity, irradiation, and the presence of oxalate in the solution, which acts as an organic ligand. In the atmosphere, oxalate is the dominant dicarboxylic acid, mainly formed via aqueous-phase oxidation of glyoxal and other organic compounds. Our new approach is to explicitly account for oxalate-related aqueous-phase chemistry. Through a series of sensitivity simulations, with and without soluble iron, we address the global impact of iron on aqueous-phase oxidation capacity. We find that iron uptake into aerosol water enhances OH reactivity, particularly in cloud droplets, thereby increasing the aqueous oxidation of isoprene oxidation products and influencing secondary organic aerosol formation.

How to cite: Rosanka, S., Klingmüller, K., Sander, R., Pozzer, A., Lelieveld, J., and Taraborrelli, D.: Impact of iron-containing dust on atmospheric oxidation processes, EGU General Assembly 2026, Vienna, Austria, 3–8 May 2026, EGU26-13178, https://doi.org/10.5194/egusphere-egu26-13178, 2026.

EGU26-13316 | PICO | AS3.5

Transported African Dust in the Lower Marine Atmospheric Boundary Layer is Internally Mixed with Sea Salt Contributing to Increased Hygroscopicity and a Lower Lidar Depolarization Ratio 

Cassandra Gaston, Sujan Shrestha, Robert Holz, Willem Marais, Zachary Buckholtz, Ilya Razenkov, Edwin Eloranta, Jeffrey Reid, Hope Elliott, Nurun Nahar Lata, Zezhen Cheng, Swarup China, Edmund Blades, Albert Ortiz, Rebecca Chewitt-Lucas, Alyson Allen, Devon Blades, Ria Agrawal, Elizabeth Reid, and Jesus Ruiz-Plancarte and the Ragged Point MAGPIE Team

Saharan dust is frequently transported across the Atlantic, yet the chemical, physical, and morphological transformations dust undergoes within the marine atmospheric boundary layer (MABL) remain poorly understood. These transformations are critical for understanding dust’s radiative and geochemical impacts, it’s representation in atmospheric models, and detection via remote sensing. Here, we present coordinated observations from the Office of Naval Research’s Moisture and Aerosol Gradients/Physics of Inversion Evolution (MAGPIE) August 2023 campaign at Ragged Point, Barbados. These include vertically resolved single-particle analyses, mass concentrations of dust and sea spray, and High Spectral Resolution Lidar (HSRL) retrievals. Single-particle data show that dust within the Saharan Air Layer (SAL) remains externally mixed, with a corresponding high HSRL-derived linear depolarization ratio (LDR) at 532 nm of ~0.3. However, at lower altitudes, dust becomes internally mixed with sea spray, and under the high humidity (>80%) of the MABL undergoes hygroscopic growth, yielding more spherical particles, suppressing the LDR to <0.1; even in the presence of  high dust loadings (e.g., ~120 µg/m3). This low depolarization in the MABL is likely due to a combination of the differences between the single scattering properties of dust and spherical particles, and the potential modification of the dust optical properties from an increased hygroscopicity of dust caused by the mixing with sea salt in the humid MABL. These results highlight the importance of the aerosol particle mixing state when interpreting LDR-derived dust retrievals and estimating surface dust concentrations in satellite products and atmospheric models.

How to cite: Gaston, C., Shrestha, S., Holz, R., Marais, W., Buckholtz, Z., Razenkov, I., Eloranta, E., Reid, J., Elliott, H., Lata, N. N., Cheng, Z., China, S., Blades, E., Ortiz, A., Chewitt-Lucas, R., Allen, A., Blades, D., Agrawal, R., Reid, E., and Ruiz-Plancarte, J. and the Ragged Point MAGPIE Team: Transported African Dust in the Lower Marine Atmospheric Boundary Layer is Internally Mixed with Sea Salt Contributing to Increased Hygroscopicity and a Lower Lidar Depolarization Ratio, EGU General Assembly 2026, Vienna, Austria, 3–8 May 2026, EGU26-13316, https://doi.org/10.5194/egusphere-egu26-13316, 2026.

EGU26-13474 | ECS | PICO | AS3.5

Unraveling the geochemical signals from major episodes of Saharan dust at two different locations in the Amazon basin. 

Lea Collignon, Damien Guinoiseau, Kathy Panechou, Cassandra J. Gaston, Sebastian Brill, Stephen J.G. Galer, Suresh Karunanithi, Christopher Pohlker, and Cecile Quantin

Desert dust is the most abundant aerosol by mass in Earth’s atmosphere (global dust loading of 22-29 Tg; [1]). One key region of interest is the Amazon Basin, which acts as a major sink for mineral dust transported from North Africa (deposition flux of ∼10 Tg.yr-1; [1]), impacting the nutrient supply to this rainforest ecosystem [2]. Currently, Western African sources are expected to be the predominant dust source based on previous geochemical studies [3] and atmospheric modeling [4], while the contribution of the Bodélé region is highly debated [4]. However, further constraints are still needed to elucidate the nutrient bioavailability associated with dust and other aerosol types, as well as how chemical transformations may affect the dust geochemical signal during transport and continentalization.

This study focuses on simultaneous high-resolution records of North African dust episodes reaching two different South American locations from January to March 2025. The first location is a coastal observatory in French Guiana (ATMO), while the second is located in the central Amazon forest, in Brazil (ATTO). Although these observatories are separated by more than 1,000 km, they are both influenced by similar transatlantic air mass trajectories, enabling an assessment of the impact of air mass continentalization on the chemical and physical characteristics of the aerosol particles. Aerosol samples have been chemically characterized using a recently developed selective extraction protocol [3], which segregates particles into water-soluble, acid-soluble, and residual material, including the silicate fraction of dust [5].

A 65 % dust loading reduction is observed between ATMO and ATTO sites, accompanied by a decrease in the soluble fraction from 20–50 %, dominated by sea salt at ATMO, to less than 10 % at ATTO. Other constituents originate from the dissolution of carbonates (Ca, Mg) due to atmospheric processes, from the leaching of soot particles or the emission of bioaerosols (K, P), and from the partial dissolution of poorly crystallized oxides (Al, Fe).  

The silicate fraction, which dominates the aerosol mass (50-98%), reveals a remarkable stability in the elemental composition of dust, irrespective of the observatory location, the position within the dust event (onset, peak, or decay), or the meteorological conditions. This compositional consistency exhibits a highly coherent signal when compared with previous dust episodes observed in 2016, 2017, and 2024 [3]. Furthermore, isotopic signatures of Sr, Nd, and Pb, known as efficient proxies for dust sources, are in strong agreement with those measured during these earlier episodes, confirming the dominant role of the West African dust source and the negligible contribution of the Bodélé Depression. Overall, these findings underscore the robust stability of the geochemical signal carried by dust, thereby enhancing our understanding of the average dust composition that reaches the Amazon Basin. In contrast, the focus on more labile components is strategic since these elements are preferentially redistributed into the water- and acid-soluble fractions.


[1] Kok et al. (2021), https://doi.org/10.5194/acp-21-8169-2021

[2] Swap et al. (1992), https://doi.org/10.1034/j.1600-0889.1992.t01-1-00005.x

[3] Collignon et al., submitted.

[4] Yu et al. (2020), https://doi.org/10.1029/2020GL088020

[5] Kumar et al. (2018), https://doi.org/10.1016/j.epsl.2018.01.025


How to cite: Collignon, L., Guinoiseau, D., Panechou, K., Gaston, C. J., Brill, S., Galer, S. J. G., Karunanithi, S., Pohlker, C., and Quantin, C.: Unraveling the geochemical signals from major episodes of Saharan dust at two different locations in the Amazon basin., EGU General Assembly 2026, Vienna, Austria, 3–8 May 2026, EGU26-13474, https://doi.org/10.5194/egusphere-egu26-13474, 2026.

EGU26-14556 | ECS | PICO | AS3.5

Loess deposits record stable Mid-Pleistocene hydroclimate during phases of human occupation of Central Asia 

Ramona Schneider, Ekaterina Kulakova, Daniel Topal, Bjarne Almqvist, Jan-Pieter Buylaert, Farhad Khormali, Mads Faurschou Knudsen, Rezhep Kurbanov, Aske Lohse Sørensen, Gábor Újvári, David Keith Wright, Qiuzhen Yin, and Thomas Stevens

Palaeolithic tools preserved in the loess-palaeosol sections of southern Tajikistan as early as ~800 ka evidence the episodic presence of ancient hominins across major Quaternary climate shifts, such as the Mid-Pleistocene and Mid-Brunhes Transitions (MBT). The richest assemblage of lithic tools found in the region, the Karatau Culture, is found mainly in palaeosols associated with Marine Isotope Stages (MIS) 15, 13, and 11, with intervening glacial periods as well as previous and subsequent interglacial periods characterised by a near absence of tools, except for MIS 14 which contains a smaller number of artefacts. Curiously, the disappearance of the Karatau culture coincides with an abrupt increase in magnetic susceptibility in the palaeosol units. Currently, the cause of the alternating phases of occupation and their possible connection to wider-scale climate remain unclear.

The Khovaling Loess Plateau loess-palaeosol sequences provide an opportunity to understand the climatic and environmental context of the appearance and disappearance of early hominins. Since the Khovaling Loess Plateau is located in a transitional zone between climate systems (Mid-Latitude Westerlies, Siberian High and Indian Monsoon) regional climate may be sensitive to global climate reorganisations within the Quaternary. Based on the observed abrupt increase in magnetic susceptibility following MIS 11, it has been hypothesized that monsoon incursions may have occurred during some interglacials, and that these incursions may have ceased after MIS 11, coinciding with the disappearance of the Karatau culture. However, evidence for potential monsoon incursions is highly debated, and the cause for the change in the magnetic susceptibility record remains unclear. In this study, we apply a novel multi-frequency magnetic susceptibility approach, complemented by elemental composition data from XRF and XRD, and by paleoclimate simulations, to investigate possible variations of the hydroclimate in Central Asia. The simulations, performed with the fully-coupled HadCM3 global climate model, allow us to assess the relative and combined effects of orbital, greenhouse gas and ice sheet forcings on the hydroclimate variability including possible moisture transport pathway changes in Central Asia around MIS 13 and 11.

Based on the combined evidence, we argue that the abrupt increase in bulk magnetic susceptibility after MIS 11, observed across different sites in southern Tajikistan, is best explained by a sediment provenance change. It appears to be unrelated to any change in rainfall seasonality, and to a lesser degree, intensity. We demonstrate that relative frequency dependence of magnetic susceptibility (χFD %) is the most suitable proxy for calculating quantitative palaeoprecipitation estimates in this region. Our magnetic susceptibility results, calibrated against a modern-analogue based transfer function, indicate that the demise of the Karatau culture coincides with an approximate +25% increase in regional annual mean precipitation. Combined with the other proxy data, this result indicates a relatively stable regional climate across periods of hominin occupation and the MBT.

How to cite: Schneider, R., Kulakova, E., Topal, D., Almqvist, B., Buylaert, J.-P., Khormali, F., Faurschou Knudsen, M., Kurbanov, R., Sørensen, A. L., Újvári, G., Wright, D. K., Yin, Q., and Stevens, T.: Loess deposits record stable Mid-Pleistocene hydroclimate during phases of human occupation of Central Asia, EGU General Assembly 2026, Vienna, Austria, 3–8 May 2026, EGU26-14556, https://doi.org/10.5194/egusphere-egu26-14556, 2026.

EGU26-14701 | PICO | AS3.5

Trace metal-containing aerosols in the atmosphere of the Indian Ocean 

Johannes Passig, Aleksandrs Kalamašņikovs, Haseeb Hakkim, Robert Irsig, Sven Ehlert, Andreas Walte, Eric Achterberg, and Ralf Zimmermann

Atmospheric deposition of aerosols constitutes a major source of iron and other micronutrients to remote ocean regions, where nutrient limitation constrains primary productivity and carbon sequestration. However, large uncertainties persist due to sparse observational data and the lack of sensitive techniques capable of resolving metal solubility at low aerosol loadings. Here we present first results from a shipborne campaign conducted aboard R/V Sonne across the Indian Ocean in late 2024 within the framework of the GEOTRACES program.

Aerosol particles were characterized using a novel single-particle mass spectrometer (SPMS) employing resonant laser ionization, enabling the analysis of the chemical composition of several hundred thousand individual particles. While sea spray aerosols dominated the overall particle population, thousands of iron-containing particles were detected, primarily associated with long-range transported mineral dust. Notably, a subset of sea spray aerosol particles exhibited detectable iron signals, suggesting in-cloud mixing or surface re-emission processes as potential sources.

For mineral dust particles, nitrate represented the dominant secondary component even in air masses without continental influence for more than ten days. Elevated iron contents within dust particles frequently coincided with the presence of dicarboxylic acids, whereas Mg/Ca-rich particles were preferentially associated with sulfate, indicating distinct atmospheric processing pathways, transport histories, and likely differences in iron solubility. By resolving such internal mixtures at the single-particle level, the SPMS provides a powerful approach for source attribution and for assessing the potential bioavailability of aerosol-derived metals. These observations reveal an unexpectedly high abundance and chemical diversity of iron-containing aerosols over the Indian Ocean, underscoring their importance for ocean biogeochemistry and nutrient cycling in this understudied region.

How to cite: Passig, J., Kalamašņikovs, A., Hakkim, H., Irsig, R., Ehlert, S., Walte, A., Achterberg, E., and Zimmermann, R.: Trace metal-containing aerosols in the atmosphere of the Indian Ocean, EGU General Assembly 2026, Vienna, Austria, 3–8 May 2026, EGU26-14701, https://doi.org/10.5194/egusphere-egu26-14701, 2026.

EGU26-16641 | ECS | PICO | AS3.5

Size-resolved mineralogy and grain size-shape analysis of airborne and deposited mineral dust in northern China 

Katja Bohm, Hui Tang, Bin Wang, Sergio Andò, Anu Kaakinen, Thomas Stevens, Johanna Salminen, Ove Haugvaldstad, Eduardo Garzanti, and Jianrong Bi

The chemical and physical properties of atmospheric mineral dust play a key role in determining its climatic and environmental effects. These properties also vary globally, highlighting the importance of observational studies and regional investigations in enhancing global models. One of the major global dusty regions is Central-East Asia, where severe dust events occur frequently. It also hosts the largest terrestrial mineral dust record on Earth, the Chinese Loess Plateau (CLP), where dust has been deposited over the past 2.6 million years and beyond. The CLP region thus offers a globally unique archive to investigate the role of dust in both past and present climate states.

In this ongoing project, dust was collected in 2019–2021 by passive and active dust samplers from a total of six locations across the CLP region. Active collectors were placed at the Lanzhou University Semi-Arid Climate and Environment Observatory (SACOL; Gansu) and in the Shapotou District of Zhongwei (Ningxia) in the southeastern margin of the Tengger Desert. Passive samplers were placed at SACOL, Lingtai (Gansu), Yinchuan (Ningxia), Luochuan (Shaanxi), and Fugu (Shaanxi).

Grain size distributions and grain shape parameters (e.g., circularity, convexity, elongation) were measured simultaneously by Dynamic Image Analysis (DIA), while magnetic susceptibility measurements were also applied to the samples. The mineralogy of different size fractions was analysed using a single grain approach by Raman spectroscopy in the 2–10, 10–20, 20–63, and >63 µm grain size windows. Future investigations will include X-ray diffraction mineralogical analysis of the <2 µm fraction.

Temporal variations with up to daily resolution of the above-mentioned dust properties were studied from the Shapotou site, and initial magnetic susceptibility analyses suggest a change in the iron oxide composition and/or grain size during a severe dust storm event in March 2021. Future analyses will combine dust source contribution modelling and sedimentological dust provenance studies to better understand the dust cycle in Central-East Asia and its driving forces. We will also use the information on the modern dust properties and provenance to enhance understanding of the past Central-East Asian dust cycle during varying global climate states in Earth’s history and during the formation of the CLP. These include periods of warmer global climates that can be considered analogous to future conditions on our planet.

How to cite: Bohm, K., Tang, H., Wang, B., Andò, S., Kaakinen, A., Stevens, T., Salminen, J., Haugvaldstad, O., Garzanti, E., and Bi, J.: Size-resolved mineralogy and grain size-shape analysis of airborne and deposited mineral dust in northern China, EGU General Assembly 2026, Vienna, Austria, 3–8 May 2026, EGU26-16641, https://doi.org/10.5194/egusphere-egu26-16641, 2026.

EGU26-17511 | ECS | PICO | AS3.5

Late Pleistocene dust imprint in coastal dune archives spanning from the Canary to the Tyrrhenian Basin - Preliminary results 

Carsten Marburg, Andreas Gärtner, Heino Schäfer, Anja Maria Schleicher, Dominik Faust, and Christopher-Bastian Roettig

Saharan dust input is a well-known phenomenon worldwide but especially concerning landscapes around the Mediterranean Sea and on the Canary Islands since the largest dust source areas on earth are located in the Northern African continent. This dust transport is not just a recent process but has also been going on for the last glacial period with changing intensities. The availability of dust depends mainly on the vegetation cover in the source areas as well as changing wind strengths/pathways and is therefore a function of changing climate. Its effects have been imprinted in several geoarchives and are also well known from aeolianites. These coastal dune archives typically form in dependence of changes in sea level and are comprised of pale coloured carbonate sands, intercalated by reddish silty layers. The reddish silty layers are heavily influenced by dust imprint from the Northern African continent. The presented research project hence focuses on conducting detailed analyses on those layers to reconstruct the local and supraregional environmental conditions during the last glacial.
Our sites on the eastern Canary Islands (Lanzarote, Fuerteventura), SE-Spain, Balearic Islands (Formentera, Eivissa) and Sardinia offer best conditions to
(i) Analyse site-specific characteristics of the dust enriched layers and the stored information about the local environmental conditions,
(ii) Look for differences or systematical similarities in terms of quantities and admixture of dust material when comparing the different silty layers within a single site/profile,
(iii) Identify distinct source areas of dust as well as dominating dust pathways and
(iv) Correlate the different sites from the Canary to the Tyrrhenian basin and deduce supraregional patterns.
So far we conducted extensive fieldwork at all sites and realised a variety of laboratory analyses on samples from the Balearic Islands, for example grain-size specific heavy mineral, XRF-, XRD- and grain-size analysis. With our first results we identified dust enriched layers and utilised analysis of heavy mineral compositions as an additional method to trace possible dust source areas. With this we hope to contribute to the understanding of the large-scale development in the Western Mediterranean region and the Canary Islands during the last glacial.

How to cite: Marburg, C., Gärtner, A., Schäfer, H., Schleicher, A. M., Faust, D., and Roettig, C.-B.: Late Pleistocene dust imprint in coastal dune archives spanning from the Canary to the Tyrrhenian Basin - Preliminary results, EGU General Assembly 2026, Vienna, Austria, 3–8 May 2026, EGU26-17511, https://doi.org/10.5194/egusphere-egu26-17511, 2026.

EGU26-18628 | ECS | PICO | AS3.5

How well do climate models represent dust events over the Mediterranean, North Africa, and the Middle East? 

Faidon Mavroudis, Antonis Gkikas, Donifan Barahona, Marı́a Gonçalves Ageitos, Danny Leung, Carlos Pérez Garcı́a-Pando, Ove Westermoen Haugvaldstad, and Georgia Sotiropoulou

Dust aerosols constitute a key component of the Earth–atmosphere system, affecting the radiation budget, the microphysical and optical properties of clouds, air quality, terrestrial and aquatic processes, and human health. Dust-related impacts are critically governed by the atmospheric load of mineral particles and are amplified when the dust burden substantially exceeds background levels. Such conditions, commonly referred to as episodes or events, are exceptional and characterized by pronounced spatiotemporal heterogeneity.

In this study, we present an intercomparison of three state-of-the-art climate models (EC-Earth3, CESM2, and NorESM2) and the GiOcean Reanalysis in representing dust events over the Mediterranean, North Africa, and the Middle East during the period 2003–2018. A percentile-based threshold methodology is applied to  daily dust optical depth (DOD) and aerosol optical depth (AOD) values, at both the grid-cell and regional scales, to identify three intensity-based episode categories: weak, moderate and extreme.  In addition, the satellite-based MIDAS dataset, which provides columnar DOD at 550 nm, is used as a reference for model evaluation.

The primary objective of this study is to assess inter-model differences in the representation of dust episode frequency of occurrence and intensity across multiple spatiotemporal scales, considering both free-running and nudged model configurations. Our working framework enables a comprehensive analysis by: (i) evaluating the ability of state-of-the-art climate models to represent different dust episode regimes, and (ii) investigating how threshold definitions influence the resulting spatiotemporal patterns of dust episodes. Finally, the outcomes of this study are expected to substantially enhance understanding of the strengths and limitations of climate models in depicting dust episode characteristics, thereby supporting improved projections under different climate scenarios throughout the 21st century.

How to cite: Mavroudis, F., Gkikas, A., Barahona, D., Gonçalves Ageitos, M., Leung, D., Garcı́a-Pando, C. P., Haugvaldstad, O. W., and Sotiropoulou, G.: How well do climate models represent dust events over the Mediterranean, North Africa, and the Middle East?, EGU General Assembly 2026, Vienna, Austria, 3–8 May 2026, EGU26-18628, https://doi.org/10.5194/egusphere-egu26-18628, 2026.

EGU26-18712 | ECS | PICO | AS3.5

A sink-to-source reverse approach to identify dust source regions within the Sahara based on PM₁₀ levels measured on the West African coast 

Marie Madeleine Atome Bassene, Aloys Bory, Moctar Camara, Yevgeny Derimian, Jean-Eudes Petit, Jean-Louis Rajot, Beatrice Marticorena, Laurine Verfaille, Dioncounda Yock, Fode Sambou, Thierno Mamadou Ndiaye, Aboubacry Diallo, and Viviane Roumazeilles

West Africa is a key region for the transport and deposition of Saharan mineral dust, with major impacts on air quality, climate, and ecosystems. Dust sources are numerous within the Sahara and their spatial extent remains poorly constrained, as do their granulometric, mineralogical, and chemical characteristics, which however control their impacts. Moreover, emission maps available in the literature do not allow the relative contribution of different source regions to a given impacted area to be assessed.

This study proposes a sink-to-source reverse approach aimed at improving the characterization of dust emission areas affecting the coastal West Africa. It is based on a three-year time series of PM₁₀ concentrations measured in Casamance, southern Senegal, a region under the influence of easterly winds (Harmattan) responsible for the transport of Saharan dust in the lower troposphere during the dry season. The measurements were conducted at a rural site (Pointe Saint Georges), minimally influenced by local and anthropogenic emissions.

PM₁₀ concentrations were coupled with air mass back-trajectories calculated using the HYSPLIT model and analyzed with the ZeFir software in order to identify potential source regions. Preliminary results suggest that, during high PM₁₀ concentration events observed along the West African coast, dust derived from two dominant sectors : one to the north-east including areas in Mauritania and across the Algerian-Mali border, and one to the east across the Sahelian region, confirming earlier findings (Le Quilleuc et al., 2021, JGR, doi.org/10.1029/2021JD035030). These results will be discussed in the light of emission areas provided by the satellite-based IDDI (Infrared Difference Dust Index) product as well as data on dust sources from the literature.

The results that will be presented highlight the potential of this sink-to-source approach for identifying mineral dust source areas based on airborne concentrations. This methodology, relying on low-cost sensors, is reproducible and applicable to any site located downwind of desert regions.

Keywords : PM₁₀, Saharan dust, Casamance, Senegal, air mass back-trajectories, HYSPLIT, ZeFir software, IDDI, sources

How to cite: Bassene, M. M. A., Bory, A., Camara, M., Derimian, Y., Petit, J.-E., Rajot, J.-L., Marticorena, B., Verfaille, L., Yock, D., Sambou, F., Ndiaye, T. M., Diallo, A., and Roumazeilles, V.: A sink-to-source reverse approach to identify dust source regions within the Sahara based on PM₁₀ levels measured on the West African coast, EGU General Assembly 2026, Vienna, Austria, 3–8 May 2026, EGU26-18712, https://doi.org/10.5194/egusphere-egu26-18712, 2026.

EGU26-19014 | ECS | PICO | AS3.5

Fewer Dust Storms, Greater Dust Concentration in the Air 

Alaa Mhawish, Udaya Bhaskar Gunturu, Saud Alamoudi, Sultan Alduaji, and Jumaan Alqahtani

Recent observations over the Arabian Peninsula reveal an apparent paradox: while the frequency of synoptically forced dust storms has declined since the late 1990s, mean near-surface dust concentrations, poor-visibility events, and chronic air-quality degradation have increased. This contrast is often attributed to changes in emissions or land use. Here, we propose instead that the paradox reflects an abrupt dynamical regime shift in large-scale circulation and boundary-layer ventilation. The Arabian Peninsula is strongly influenced by baroclinic disturbances generated by short-wavelength Rossby waves radiated from the subtropical jet stream (STJ). These disturbances drive deep vertical coupling, strong surface winds, and efficient ventilation of the boundary layer. Multiple independent diagnostics indicate that the regional circulation underwent an abrupt transition in the late 1990s, marked by increased static stability, increased pressure depth of the troposphere, a reduction in the squared meridional temperature gradient, and a corresponding decline in mean available potential energy. These changes are consistent with weakened Rossby wave radiation and reduced baroclinic activity downstream of the STJ.

The consequences of this transition are twofold. First, reduced baroclinic activity suppresses deep convection, strong downdrafts, and synoptically driven high-wind events, leading to a decline in dust storm frequency. Second, and critically, weakened ageostrophic flow at the top of the boundary layer reduces shear-driven turbulence generation, particularly under stable boundary-layer conditions. The resulting collapse of vertical mixing limits ventilation and increases the residence time of dust near the surface, leading to higher mean surface concentrations despite fewer extreme dust events.

This framework extends a dynamical theory previously developed to explain abrupt increases in fog under weakened baroclinic forcing to mineral dust and air quality. The results demonstrate that reduced ventilation alone is sufficient to reconcile declining dust storm frequency with increasing surface dust loading, highlighting the nonlinear sensitivity of boundary-layer processes to large-scale circulation changes. The findings underscore the importance of regime shifts in atmospheric dynamics for understanding long-term changes in dust, pollution, and visibility in arid regions.

How to cite: Mhawish, A., Gunturu, U. B., Alamoudi, S., Alduaji, S., and Alqahtani, J.: Fewer Dust Storms, Greater Dust Concentration in the Air, EGU General Assembly 2026, Vienna, Austria, 3–8 May 2026, EGU26-19014, https://doi.org/10.5194/egusphere-egu26-19014, 2026.

EGU26-19098 | ECS | PICO | AS3.5

Source-Limited Dust Emission in the Tarim Basin, China: Landform-Specific Parameterisation and Wind-Flux Hysteresis 

Yin Guo, Xin Gao, Jiaqiang Lei, and Wim Cornelis

Abstract: Dust emissions from the Tarim Basin, China, are governed by strong surface heterogeneity and finite sediment supply, two pivotal controls that can induce source depletion and wind-flux hysteresis during dust events. In this study, we adopt the source-limited dust emission (SLDE) scheme proposed by Shao (2025) and develop a landform-specific parameterization that couples remotely sensed surface units with field-measured particle-size data. Specifically, we generate a mutually exclusive seven-class geomorphology map in Google Earth Engine via a hierarchical decision tree, which integrates multi-source datasets including topography (MERIT DEM), vegetation coverage (MODIS NDVI), surface water occurrence (JRC Global Surface Water), and Sentinel-1 backscatter texture characteristics. The resultant geomorphological units comprise mobile dunes, vegetated hummock dunes, fixed/semi-fixed sandy lands, interdune areas, gobi/deflation surfaces, fluvial-lacustrine sediments, and mountain/loess terrains. For each unit, class-specific particle-size distributions are compiled from in-situ measurements and converted into discretized lookup tables, which serve as static input parameters for the SLDE scheme. Initial diagnostic experiments at both column and point scales, driven by hourly 10-m wind data from ERA5-Land (for the April 2020 case study), reveal distinct dust emission regimes across different landform types. On supply-limited surfaces-notably gobi/deflation and fluvial-lacustrine units-our simulations demonstrate that dust flux declines markedly under sustained high-wind conditions as the near-surface sediment reservoir becomes depleted, leading to pronounced hysteresis in the wind-flux relationship. The effective emission efficiency decreases from nearly unity at the onset of dust events to ~0.1 by the late stages, even when wind speeds remain above the threshold friction velocity for dust emission. In contrast, transport-limited behavior dominates in regions with ample sediment supply. These findings establish a physically interpretable framework for deriving SLDE parameters from geomorphological classifications and particle-size properties. Ongoing gridded simulations will quantify the extent to which sediment depletion reshapes the spatial contribution of key deflation zones, as well as the event-integrated dust emission budget, relative to results derived under conventional transport-limited assumptions.

Keywords: Source-limited dust emission; Source depletion; Wind-Flux Hysteresis; Particle size distribution

How to cite: Guo, Y., Gao, X., Lei, J., and Cornelis, W.: Source-Limited Dust Emission in the Tarim Basin, China: Landform-Specific Parameterisation and Wind-Flux Hysteresis, EGU General Assembly 2026, Vienna, Austria, 3–8 May 2026, EGU26-19098, https://doi.org/10.5194/egusphere-egu26-19098, 2026.

EGU26-19364 | ECS | PICO | AS3.5 | Highlight

Experimental Characterisation of the Electric and Magnetic Fields Generated by Dust Devils  

David Reid, Karen Aplin, and Nick Teanby

Lofted particulate in dust devils becomes charged through triboelectrification, that is, the exchange of charge in collision between grains. Electric fields from charged dust were first detected in the mid 17th century, with quantitative measurements recording in the region of kilovolts per metre. Magnetic field observations of dust devils are much less common, with the only published terrestrial measurement from 2001 in Arizona. The most complete magnetic field dataset associated with dust devils comes from NASA’s InSight mission to Mars, with 1200 sols of near-continuous observation, and over 15000 convective events detected, likely to be dust devils.  

To better understand the expected electric and magnetic fields generated by these aeolian features, a new apparatus was developed, building upon previous experimental work. The Terrestrial Experimental appaRatus for Investigating the Electric and magnetic fields of dust devils (TERIE) consists of a multi-instrumented 1000 mm diameter, 1200 mm tall tank, lined externally with grounded aluminium foil to act as a Faraday cage, and internally with sand to reduce the impact of tribocharging from particle-wall collisions. 

The apparatus records electric field strength at 4 vertical positions, and the (vector) magnetic field at 3 vertical positions. Through photodiodes, the optical thickness of the dust devil column can be evaluated, and offline sampling of the suspended particles can be used to understand the distribution through the profile of the simulated event. By incorporation of different mast positions, the radial profile of the generated field can also be investigated. 

Initial results from the new experimental apparatus show electric fields exceeding 40~kVm-1 were generated by the rotation of sand, with the distribution of the field broadly matching that expected from simulation. Some low frequency, sub-nanotesla variations in magnetic field were detected in the presence of rotating charged sand, consistent with expectations from models and previous experiments.  

How to cite: Reid, D., Aplin, K., and Teanby, N.: Experimental Characterisation of the Electric and Magnetic Fields Generated by Dust Devils , EGU General Assembly 2026, Vienna, Austria, 3–8 May 2026, EGU26-19364, https://doi.org/10.5194/egusphere-egu26-19364, 2026.

EGU26-19688 | ECS | PICO | AS3.5

The Pb, Nd, and Sr isotopic characterisation of dust sources in North Africa and Western Asia. 

Daniel Howcroft, Anya Crocker, Rex Taylor, Agnes Michalik, J. Andy Milton, Nick Drake, Paul Breeze, Derek Keir, Michael Petraglia, Jaafar Jotheri, Deepak Jha, and Paul Wilson

Mineral dust is a key component of Earth’s climate system; it influences the global radiation budget, fertilises ecosystems, and constitutes a threat to human health. Accumulation of windblown dust in marine archives provides a means to assess past change in Earth’s continental hydroclimate. However, interpretations of these records are often undermined by an attribution problem: the uncertainty of provenance. Here we report new radiogenic isotope data (Sr, Nd, and Pb) from unconsolidated surface sediments sampled from active dust sources and integrate them with published geochemical and satellite-derived datasets (such as dust source activation frequency (DSAF)) to define preferential source areas (PSAs) across the Northern Hemisphere dust belt. Our analysis shows that pairing Pb with Nd or Sr isotope data allows clearer discrimination between source regions that overlap in Nd-Sr space. We also show that Pb data are particularly helpful to discriminate between sources when presented as D207Pb/204Pb and D208Pb/204Pb: deviations of Pb from the Northern Hemisphere Reference Line (NHRL) that defines the Pb isotopic evolution of the Northern Hemisphere’s mantle. Comparison with published Pb isotope data reveals major limitations in spatial coverage and suggests that application of more consistent cleaning protocols is merited including removal of anthropogenic Pb. Nevertheless, our new data help to discriminate among the dust sources of East Africa and Western Asia more clearly than before, improving our ability to interpret past continental hydroclimate change recorded in marine sediment cores from the northern Indian Ocean.

How to cite: Howcroft, D., Crocker, A., Taylor, R., Michalik, A., Milton, J. A., Drake, N., Breeze, P., Keir, D., Petraglia, M., Jotheri, J., Jha, D., and Wilson, P.: The Pb, Nd, and Sr isotopic characterisation of dust sources in North Africa and Western Asia., EGU General Assembly 2026, Vienna, Austria, 3–8 May 2026, EGU26-19688, https://doi.org/10.5194/egusphere-egu26-19688, 2026.

EGU26-20205 | PICO | AS3.5

Selected Mineral Dust Events at the Sonnblick Observatory in 2024: Identification and Characterization Using In-Situ Data, PMF analysis and Atmospheric Transport Modelling 

Gerhard Schauer, Barbara Scherllin Pirscher, Alicja Skiba, Thomas Bachleitner, Kathrin Baumann-Stanzer, Anne Kasper-Giebl, and Julia Burkart

Mineral dust, emitted from soils in arid regions by wind erosion, represents one of the largest fractions of atmospheric aerosol by mass. Once airborne, dust can travel thousands of kilometers, influencing the atmosphere through scattering and absorption of sunlight, acting as ice-nucleating particles, and depositing on the ground where it reduces snow albedo and delivers nutrients to remote regions. High-altitude mountain stations provide a unique opportunity to study dust in the free troposphere and its long-range transport.

The Sonnblick Observatory (3106 m a.s.l.), located on the main ridge of the Austrian Alps, receives dust, particularly from Northern Africa, throughout the year. In this study, we focus on selected dust events during 2024, a year of particular interest due to one of the most intense events (aerosol mass above 700 µg/m3, 30 min averages) detected at the observatory. The observatory is a Global Atmosphere Watch (GAW) station, an Aerosol, Clouds, and Trace Gases Research Infrastructure (ACTRIS) aerosol in situ national facility and hosts a variety of aerosol, cloud and meteorological measurements.

Saharan dust events (SDEs) are initially identified using the “Saharan Dust Event Index,” routinely derived from in-situ optical measurements (nephelometer and aethalometer) at the station (Schauer et al. 2016). In addition, positive matrix factorization (PMF) of in-situ aerosol data is applied, with one significant factor interpreted as mineral dust and used for a second, independent event identification. PMF highlights events that may not be captured by the Saharan Dust Index, illustrating its potential as a complementary approach for dust detection. Individual events are further characterized using the full suite of in-situ measurements and weekly offline chemical composition analyses (inorganic ions, selected elements and carbohydrates as well as elemental and organic carbon) of PM10 filter samples, again combined with PMF analysis to identify major aerosol sources. Particle size distributions up to 100 µm during SDEs are retrieved from multiple instruments, including a mobility spectrometer, optical particle counter, and holographic measurements (SwisensPoleno Jupiter). Average size distributions are calculated for each event. Meteorological and atmospheric conditions are analyzed in relation to particle size distributions and optical properties. Particular attention is given to events identified solely by PMF.

Typical transport pathways are investigated using FLEXPART, and dust concentrations are simulated with WRF-Chem (Weather Research and Forecasting (WRF) model coupled with Chemistry) and compared with in-situ observations. The WRF-Chem simulation considers only dust emissions, generated by the AFWA (Air Force Weather Agency) dust emission scheme. Hourly-resolved surface dust concentration, vertically resolved dust concentration profiles, and dust load are available on a 0.2° x 0.2° latitude-longitude grid. The data also contribute to the Sand and Dust Storms Warning Advisory and Assessment System (SDS-WAS) model ensemble.

We summarize a full season of observed dust events, identify their characteristic features and develop a data analysis strategy applicable to longer time periods. In particular, we examine PMF analysis as a potential tool for SDE detection.

Schauer, G., Kasper-Giebl, A. and Mocnik, G. (2016); https://doi.org/10.4209/aaqr.2015.05.0337

Acknowledgements
The participation of A. Skiba was supported by the program “Excellence Initiative – Research University” for the AGH University of Krakow (ID:13958).

How to cite: Schauer, G., Scherllin Pirscher, B., Skiba, A., Bachleitner, T., Baumann-Stanzer, K., Kasper-Giebl, A., and Burkart, J.: Selected Mineral Dust Events at the Sonnblick Observatory in 2024: Identification and Characterization Using In-Situ Data, PMF analysis and Atmospheric Transport Modelling, EGU General Assembly 2026, Vienna, Austria, 3–8 May 2026, EGU26-20205, https://doi.org/10.5194/egusphere-egu26-20205, 2026.

EGU26-21358 | PICO | AS3.5

The A-LIFE aircraft field experiment in the Eastern Mediterranean: what have we learned about mineral dust mixtures? 

Bernadett Weinzierl, Maximilian Dollner, Josef Gasteiger, Marilena Teri, Manuel Schöberl, Katharina Heimerl, Anne Tipka, Petra Seibert, Heidi Huntrieser, Robert Wagner, Konrad Kandler, Aryasree Sudharaj, Thomas Müller, Sophia Brilke, Nikolaus Fölker, Daniel Sauer, Oliver Reitebuch, Silke Groß, Volker Freudenthaler, and Carlos Toledano and the A-LIFE Science Team

Mineral dust is a key component of the globally-emitted aerosol mass. Although, mineral dust mixes with anthropogenic pollution during its atmospheric lifetime, data on polluted mineral dust layers have been scarce.

In April 2017, the A-LIFE aircraft field experiment (www.a-life.at) was carried out in the Eastern Mediterranean. A-LIFE combined ground-based, airborne, satellite, and modelling efforts to characterize mineral dust mixtures with unprecedented detail. In 22 research flights (~80 flight hours), outbreaks of Saharan and Arabian dust, as well as pollution, biomass burning, and dust-impacted clouds were studied, and a unique aerosol and cloud data set was collected. Aerosol source apportionment was achieved with the Lagrangian transport and dispersion model FLEXPART version 8.2. Based on FLEXPART model results and aerosol measurements, the observations were classified into 12 aerosol types consisting of four main aerosol types (Saharan dust, Arabian dust, mixtures with and without coarse mode). Each of the four main aerosol types was further separated into three sub-classes (clean, moderately-polluted and polluted). For each of the 12 aerosol classes, microphysical and optical aerosol properties were derived.

For the first time, the effect of pollution on the microphysical and optical properties of Saharan and Arabian dust was investigated systematically, revealing significant changes as a function of pollution content. The particle size distribution changes as a function of pollution content with effective diameters systematically decreasing for increasing pollution content. The collected data also provide new insights into the impact of Saharan and Arabian dust on cloud evolution processes, atmospheric radiation budget, and local meteorology. One outstanding finding of A-LIFE is that scattering properties of polluted dust mixtures do not show the typical dust signature, but rather show a wavelength-dependency of the scattering coefficient which is typical for pollution. This means that optical properties of mineral mixtures are frequently dominated by the pollution.

In this presentation, we will show the results of the A-LIFE project including its mission objectives, experimental design, and meteorological conditions; highlight major A-LIFE findings; and feature the available data products on the optical, microphysical, and hygroscopic properties of pure and polluted mineral dust.

How to cite: Weinzierl, B., Dollner, M., Gasteiger, J., Teri, M., Schöberl, M., Heimerl, K., Tipka, A., Seibert, P., Huntrieser, H., Wagner, R., Kandler, K., Sudharaj, A., Müller, T., Brilke, S., Fölker, N., Sauer, D., Reitebuch, O., Groß, S., Freudenthaler, V., and Toledano, C. and the A-LIFE Science Team: The A-LIFE aircraft field experiment in the Eastern Mediterranean: what have we learned about mineral dust mixtures?, EGU General Assembly 2026, Vienna, Austria, 3–8 May 2026, EGU26-21358, https://doi.org/10.5194/egusphere-egu26-21358, 2026.

EGU26-22343 | ECS | PICO | AS3.5

Sub-seasonal WRF-Chem reanalysis of extreme Saharan dust outbreaks in spring-summer 2024: balancing phase consistency and aerosol realism 

Alessandra Chiappini, Umberto Rizza, Giorgio Passerini, and Antonio Ricchi

Saharan dust outbreaks intermittently exert strong radiative, air quality and depositional impacts across the Euro-Mediterranean, due to the intrinsic characteristics of this phenomenon, yet their numerical reproduction remains challenging. Here we investigate modelling strategies that preserve spatio-temporal consistency in sub seasonal integrations with WRF-Chem, focusing on three major dust intrusions affecting Italy in 2024: 25 March to 1 April, 18 to 21 June, and 8 to 14 July. We perform a set of reanalysis driven experiments over a single 5 km grid domain spanning North Africa and the Mediterranean into continental Europe, forced by ECMWF IFS analyses at 6 hourly frequencies. Model performance is assessed against complementary observing systems over the Euro-Mediterranean with emphasis on Italy. Our core objective is to quantify how spectral nudging can mitigate large scale phase errors and long run drift, while avoiding an overly constrained mesoscale circulation that may distort dust emission, uplift and transport. In addition, using a sequence of sensitivity runs initialized at increasing lead times, we estimate event dependent spin-up thresholds that stabilize domain integrated dust mass and optical depth, while maintaining realistic emission timing, intensity and extension, to suggest a transferable good practice workflow for episodic dust reanalysis and for longer sub seasonal experiments. Overall, this study frames spectral nudging not as an arbitrary choice but as a tunable constraint whose optimal setting depends on the intended balance between large scale fidelity and internally generated aerosol meteorology feedback, with clear implications for WRF-Chem based dust assessments over Italy and the central western Mediterranean. The focus is on the fact that, despite an approximate 40% increase in computational time, the use of spectral nudging emerges as an optimized approach, both in terms of physical consistency and final computational cost savings. This technique proves particularly advantageous in reducing the overall number of simulations required within the context of sub-seasonal reanalysis.

How to cite: Chiappini, A., Rizza, U., Passerini, G., and Ricchi, A.: Sub-seasonal WRF-Chem reanalysis of extreme Saharan dust outbreaks in spring-summer 2024: balancing phase consistency and aerosol realism, EGU General Assembly 2026, Vienna, Austria, 3–8 May 2026, EGU26-22343, https://doi.org/10.5194/egusphere-egu26-22343, 2026.

Fires are a significant disturbance in Earth's systems. Smoke aerosols emitted from fires can cause environmental degradation and climatic perturbations, leading to exacerbated air pollution and posing hazards to public health. However, research on the climatic and health impacts of fire emissions is severely limited by the scarcity of air pollution data directly attributed to these emissions. Here, we develop a global daily fire-sourced PM2.5 concentration ([PM2.5]) dataset at a spatial resolution of 0.25° for the period 2000–2023, using the GEOS-Chem chemical transport model driven with two fire emission inventories, the Global Fire Emissions Database version 4.1 with small fires (GFED4.1s) and the Quick Fire Emission Dataset version 2.5r1 (QFED2.5). Simulated all-source [PM2.5] is bias-corrected using a machine learning algorithm, which incorporates ground observations from over 9000 monitoring sites worldwide. Then the simulated ratios between fire-sourced and all-source [PM2.5] at individual grids are applied to derive fire-sourced [PM2.5]. Globally, the average fire-sourced [PM2.5] is estimated to be 2.04 µg m−3 with GFED4.1s and 3.96 µg m−3 with QFED2.5. Both datasets show consistent spatial distributions with regional hotspots in central Africa and widespread decreasing trends over most areas. While the mean levels of fire-sourced [PM2.5] are much higher at low latitudes, fire episodes in the boreal regions can cause PM2.5 levels that are comparable to those of the tropics. This dataset serves as a valuable tool for exploring the impacts of fire-related air pollutants on climate, ecosystems, and public health, enabling accurate assessments and support for decision-making in environmental management and policy.

How to cite: Tian, C.: Global high-resolution fire-sourced PM2.5 concentrations for 2000–2023, EGU General Assembly 2026, Vienna, Austria, 3–8 May 2026, EGU26-741, https://doi.org/10.5194/egusphere-egu26-741, 2026.

EGU26-1836 | Posters on site | AS4.7

Microbial regulation of soil carbon stabilization shapes soil carbon projections 

Dan Liu and Zhang Yichen

Enhancing SOC accumulation is considered as a pathway for mitigating climate change. However, projection of soil organic carbon (SOC) exhibits large uncertainties, and microbial activities, the key regulator of SOC dynamics, are omitted in most Earth System Models (ESMs). Here, we compare the traditional SOC scheme in ESMs (CENURY) with two microbial-explicit models, through constraining SOC stock and its stable component. Unlike net gains of SOC projected by CENTURY, the two microbial models consistently projected turning points of SOC change, and net loss of SOC for 21.9 ~ 61.4PgC were projected under SSP5-8.5 by 2100. SOC loss originates primarily from unprotected SOC in northern high-latitudes. SOC stabilization pathways, instead of the temperature sensitivity of SOC mineralization, drive the divergence among model projections. Our results indicate strong risk of SOC loss in northern high-latitudes, and ESMs should incorporate microbial-regulated SOC stabilization mechanisms as the priority to improve SOC projections.

How to cite: Liu, D. and Yichen, Z.: Microbial regulation of soil carbon stabilization shapes soil carbon projections, EGU General Assembly 2026, Vienna, Austria, 3–8 May 2026, EGU26-1836, https://doi.org/10.5194/egusphere-egu26-1836, 2026.

EGU26-2185 | ECS | Orals | AS4.7

Supporting Blue Carbon Accounting: A Process-Based Productivity Model for Global Salt Marshes 

Zhuoya Zhou, Tingting Li, Xiu­-Qun Yang, Deliang Chen, Guangxuan Han, Xingwang Fan, Xiaosong Zhao, Siyu Wei, Bin He, and Guocheng Wang

Coastal salt marshes (CSMs) are vital blue carbon (BC) reservoirs, yet accurately quantifying their gross primary productivity (GPP) remains challenging due to limitations in terrestrial biosphere models (TBMs), which often overlook coastal-specific processes. Here, we present SAL-GPP, a process-based model that incorporates coastal-specific modules to capture the effects of salinity and temperature stress on photosynthesis, as well as light-use efficiency across salinity gradients in diverse CSM plant species. Model validation showed strong agreement with observations, with R² of 0.82 and model efficiencies of 0.82 and 0.74 for daily and seasonal GPP, respectively. Driven with global inputs, SAL-GPP produced high-resolution global simulations, yielding a mean annual GPP of 66.89 ± 11.68 TgC yr–1 (2011–2020), with 64% concentrated in key hotspots across the southeastern United States, western Europe, southeastern China, and Australia. From 2011 to 2016, global CSM GPP increased by 1.56 TgC yr–1, then declined, rebounded after 2018, and peaked at 71.45 ± 12.02 TgC yr–1 in 2020. Model evaluation showed that SAL-GPP outperformed existing remote sensing-based GPP products and TBMs at both site and grid levels. By explicitly incorporating coastal ecosystem dynamics, SAL-GPP supports global BC accounting and climate mitigation strategies aligned with nature-based solutions for carbon neutrality.

How to cite: Zhou, Z., Li, T., Yang, X.-Q., Chen, D., Han, G., Fan, X., Zhao, X., Wei, S., He, B., and Wang, G.: Supporting Blue Carbon Accounting: A Process-Based Productivity Model for Global Salt Marshes, EGU General Assembly 2026, Vienna, Austria, 3–8 May 2026, EGU26-2185, https://doi.org/10.5194/egusphere-egu26-2185, 2026.

Most existing studies simulate ecosystem influences on atmospheric pollutants using prescribed vegetation datasets, while feedbacks from atmospheric chemistry to terrestrial ecosystems are rarely represented. Here, we couple the chemistry-climate model ECHAM6.3–HAM2.3–MOZ1.0 (ECHAM-HAMMOZ) with the interactive Model for Air Pollution and Land Ecosystems (iMAPLE) to enable fully dynamic, two-way interactions between atmospheric chemistry and terrestrial ecosystems. Biogenic volatile organic compounds, including isoprene (IPP) and monoterpenes (MTP), are simulated by iMAPLE and interactively participate in chemical reactions in HAMMOZ. Simulated leaf area index and stomatal conductance modulate dry deposition velocities, thereby influencing atmospheric chemical concentrations. In turn, the modeled ozone affects vegetation productivity through stomatal uptake. Relative to the original model, the coupled system exhibits notable changes in atmospheric composition and ecosystem productivity. Enhanced IPP and MTP emissions reduce surface ozone concentrations in high-latitude regions, while dynamically simulated ozone variability induces a seasonal reduction in terrestrial gross primary productivity (GPP). In addition, spatial heterogeneity in stomatal conductance alters ozone dry deposition patterns. By explicitly representing these coupled feedback processes, the integrated ECHAM–HAMMOZ–iMAPLE framework improves the realism of biosphere–atmosphere interactions and provides a useful tool for studying atmosphere–terrestrial ecosystem coupling.

How to cite: Zhao, Y. and Yue, X.: Development and evaluation of ecosystem-atmospheric chemistry interactions in the ECHAM-HAMMOZ-iMAPLE model, EGU General Assembly 2026, Vienna, Austria, 3–8 May 2026, EGU26-3305, https://doi.org/10.5194/egusphere-egu26-3305, 2026.

Severe air pollution reduces ecosystem carbon assimilation by damaging vegetation with ozone (O3) and altering climate through aerosol effects, thereby exacerbating global warming. In response, China implemented the Clean Air Action (CAA) plan in 2013 to reduce anthropogenic emissions. Here we assessed the impact of CAA-induced air pollution reductions on net primary productivity (NPP) in China during 2014-2020 using multiple measurements, process-based models, and machine learning algorithms. The CAA plan led to a national NPP increase of 26.3±27.9 Tg C yr-1, with 20.1±10.9 Tg C yr-1 attributed to aerosol reductions, mainly driven by enhanced light availability from decreased black carbon and increased precipitation due to weakened aerosol climatic effects. The impact of O3 amelioration became more significant over time, surpassing the effects of aerosol reduction by 2020. Two machine learning models showed similar NPP recoveries of 42.8±26.8 Tg C yr-1 and 43.4±30.1 Tg C yr-1. Our study highlights significant carbon gains from controlling aerosols and surface O3, underscoring the co-benefits of air pollution regulation for public health and carbon neutrality in China.

How to cite: Yue, X. and Zhou, H.: Improved ecosystem productivity in China driven by declining aerosols and surface ozone, EGU General Assembly 2026, Vienna, Austria, 3–8 May 2026, EGU26-3443, https://doi.org/10.5194/egusphere-egu26-3443, 2026.

Abstract:  Sulfur dioxide (SO₂) is a major air pollutant that damages terrestrial vegetation. It can suppress photosynthesis through sulfite/bisulfite toxicity and ROS-mediated oxidative stress, promoting stomatal closure and impairing chloroplast photochemistry and carbon fixation, as documented in laboratory and field fumigation studies. Here we develop, to our knowledge, the first observation-based parameterization of SO₂-induced photosynthetic damage, derived from 858 measurements compiled from peer-reviewed SO₂ fumigation experiments. The scheme captures observed relationships between accumulated SO₂ exposure above a concentration threshold, ASTα (α, nmol mol⁻¹), and relative leaf photosynthetic rate across broadleaf trees, needleleaf trees, shrubs, C₃ crops, C₄ crops, C₃ grasses, and C₄ grasses. We implement the parameterization in the Common Land Model (CoLM2024). Global simulations for 2003–2021 indicate that, relative to simulations without SO₂ damage, contemporary SO₂ exposure reduces global photosynthetic rate by ~10%. These results highlight the importance of representing SO₂-induced physiological stress in process-based large-scale models to improve assessment and projection of the global carbon cycle.

Keywords: sulfur dioxide (SO2); photosynthesis; terrestrial ecosystem; fumigation experiments; parameterization, land surface model

How to cite: Yuan, X. and Li, F.: Incorporating Experiment-Based SO₂ Damage to Photosynthesis into Regional and Global Land Process Models, EGU General Assembly 2026, Vienna, Austria, 3–8 May 2026, EGU26-4365, https://doi.org/10.5194/egusphere-egu26-4365, 2026.

EGU26-4584 | ECS | Posters on site | AS4.7

Mitigating global drought extremes through stratospheric aerosol geoengineering: spatial and socioeconomic disparities 

Weijie Fu, Chenguang Tian, Rongbin Xu, and Yuming Guo

As global temperature rises, the severity and frequency of droughts are projected to increase. Stratospheric aerosol injection (SAI) has been proposed as a potential solution to reduce surface temperatures, but its effectiveness in alleviating drought extremes remains unclear. Here, we assess the global impacts of SAI on drought extremes based on experiments from the Geoengineering Model Intercomparison Project phase 6 (GeoMIP6) and the Geoengineering Large Ensemble Project (GLENS). By 2100, the frequency of extreme droughts is projected to increase by 7.33 % under the high-emission Shared Socioeconomic Pathways 5 (SSP5-8.5) scenario relative to present day. SAI reduces this increase by 1.99 % in GeoMIP6, and by 1.80 % in GLENS compared with Representative Concentration Pathways 8.5 (RCP8.5). Attribution analyses show that SAI-induced cooling alone reduces extreme drought frequency by 3.42 % in GeoMIP6 and 4.28 % in GLENS relative to their respective high-emission scenarios, outweighing the 2.12 % increase driven by SAI-induced precipitation reductions under the same conditions. However, these rainfall deficits lead to substantial inequities in drought exposures. Compared to developed nations, countries with less development experience smaller reductions, or even increases, in economic and population exposure to extreme drought under SAI relative to SSP5-8.5 or RCP8.5. These findings suggest that the current SAI strategies in GeoMIP6 and GLENS may induce the risk of unintentionally worsening regional hydroclimatic disparities.

How to cite: Fu, W., Tian, C., Xu, R., and Guo, Y.: Mitigating global drought extremes through stratospheric aerosol geoengineering: spatial and socioeconomic disparities, EGU General Assembly 2026, Vienna, Austria, 3–8 May 2026, EGU26-4584, https://doi.org/10.5194/egusphere-egu26-4584, 2026.

EGU26-4794 | Posters on site | AS4.7

Variations and drivers of CO2 fluxes at multiple temporal scales of subtropical agricultural systems in the Huaihe river Basin 

Kaidi Zhang, Yanyu Lu, Yuan Gong, Chunfeng Duan, and Fangmin Zhang

Understanding of the crop carbon balance across different time scales and corresponding responses to abiotic and biotic factors is crucial for improving carbon cycle models in the context of future climate change and management practices. In this study, we employed the Random Forest (RF) algorithm, Kolmogorov-Zurbenko filtering method and structural equation modeling (SEM) to quantify the effects of abiotic and biotic factors on CO2 fluxes at various time scales based on 7-years measurements. Our results revealed that O3 primarily manifested indirect effects on NEE and GPP via altering LAI on the daily and monthly scale, and that overall regulatory effect on CO2 fluxes developed greater as the time scale increased. Net radiation (Rn) was the most critical abiotic factor altering net ecosystem exchange (NEE) and gross primary productivity (GPP) at the half-hourly, daily, and monthly scales, with the exception of photosynthetically active radiation (PAR) controlling daily NEE and GPP in the rice system. It was innovatively found that LAI had little control on detrended daily CO2 fluxes, which was much lower than the monthly CO2 fluxes. Air temperature (Ta) was the most important abiotic factor for ecosystem respiration (Reco) at half-hourly and daily scale.  For NEE, Reco, and GPP, the maximum explanation of SEM models was 70.10%, 79.60% and 76.20%, respectively. The SEM results indicated that at multiple time scales, Rn exerted significant direct and indirect effects on both NEE and GPP. LAI only showed a strong direct leading effect on NEE and GPP on the monthly scale. The findings we reported have the potential to further develop carbon cycle models of cropland ecosystems under climate change by clarifying the influence path of O3 on CO2 fluxes and highlighting the factors that dominate CO2 fluxes on various time scales.

How to cite: Zhang, K., Lu, Y., Gong, Y., Duan, C., and Zhang, F.: Variations and drivers of CO2 fluxes at multiple temporal scales of subtropical agricultural systems in the Huaihe river Basin, EGU General Assembly 2026, Vienna, Austria, 3–8 May 2026, EGU26-4794, https://doi.org/10.5194/egusphere-egu26-4794, 2026.

EGU26-4840 | ECS | Posters on site | AS4.7

Diurnal Ammonia Mapping based on Deep Learning from Geostationary Hyperspectral Infrared Sounder Observations 

Xinran Xia, Min Min, Jun Li, and Ling Gao

Atmospheric ammonia (NH₃) is a key air pollutant with high spatiotemporal variability, challenging the observation of its diurnal cycle. The Fengyun-4B Geostationary Interferometric Infrared Sounder (FY-4B/GIIRS) offers high-frequency measurements that capture this variability. We introduce a novel Multi-modal Fusion Transformer (MF-Transformer) to retrieve NH₃ total columns directly from hyperspectral radiances, meteorology, and ancillary data, circumventing costly radiative transfer simulations. Our retrievals are consistent with the IASI (Infrared Atmospheric Sounding Interferometer) NH₃ product (correlation coefficient, R=0.79) and Optimal Estimation (OE) retrievals (R=0.75), outperform benchmark machine learning models by ~20% in accuracy, and eliminate unphysical negative values. The method is orders of magnitude faster than OE approach, enabling global full-disk processing in tens of seconds. This advance allows the resolution of rapid NH₃ variations, demonstrating a transformative capability for operational monitoring.

How to cite: Xia, X., Min, M., Li, J., and Gao, L.: Diurnal Ammonia Mapping based on Deep Learning from Geostationary Hyperspectral Infrared Sounder Observations, EGU General Assembly 2026, Vienna, Austria, 3–8 May 2026, EGU26-4840, https://doi.org/10.5194/egusphere-egu26-4840, 2026.

EGU26-4888 | ECS | Posters on site | AS4.7

Centennial-scale decline in global fire emissions driven by land use and population growth 

HaiXiao Zhang, Bin He, Jun Zhu, and Chenguang Tian

Fires and their carbon emissions have substantial impacts on land surface, climate systems, and air quality. However, long-term datasets with detailed spatiotemporal fire records remain limited, due to insufficient understanding of the climatic, ecosystem, and societal drivers of fire processes in current process-based models. Here, we employ a data-driven approach that integrates machine learning algorithms with outputs from eight fire models within the Fire Model Intercomparison Project (FireMIP) to reconstruct fire CO2 emissions from 1901 to 2012 and to assess the respective impacts of human activities, climate, and land cover change. Our MLA-based dataset reveals a global decline in fire-emitted CO2 at -7.45 ± 0.12 Tg C yr-2 (-0.29% yr-1), mainly in South America and Africa. Land use change emerges as the primary driver, reducing fire CO2 emissions by -6.07 ± 0.23 Tg C yr-2, followed by population growth, which contributes -3.60 ± 0.54 Tg C yr-2. Population growth typically suppresses fires in agricultural and urban areas but raises fire risks at rainforest edges where deforestation occurs. Although climate change has a limited impact on global fire CO2 reduction (-0.39 ± 0.19 Tg C yr-2), it remains a key driver for boreal fires, strongly influenced by precipitation changes. These findings underscore the need for robust data and informed management to support fire prevention and climate change mitigation efforts.

How to cite: Zhang, H., He, B., Zhu, J., and Tian, C.: Centennial-scale decline in global fire emissions driven by land use and population growth, EGU General Assembly 2026, Vienna, Austria, 3–8 May 2026, EGU26-4888, https://doi.org/10.5194/egusphere-egu26-4888, 2026.

Atmospheric Motion Vector (AMV) provides essential wind field information, playing a key role in typhoon path prediction and intensity analysis. However, the spatial resolution of current mainstream AMV products is relatively low, limiting their ability to meet the high-precision demands of meteorological services. While the China Meteorological Administration's visible channel AMV product achieves a relatively high spatial resolution of 6 km, its long computational time prevents it from being applied in real-time operational scenarios.In this study, we propose a GPU-accelerated high-resolution wind field retrieval algorithm, designed to address the computational bottleneck of the target tracking component within the AMV retrieval process. By decomposing the core calculations into parallel tasks, we leverage OpenACC to efficiently implement parallel computing. Additionally, to overcome the memory limitations of a single GPU, we design a block-based computational strategy, enabling multi-GPU processing for handling larger datasets.Experimental results show that the proposed algorithm achieves significant acceleration, with computational efficiency improved by more than ten times compared to traditional CPU implementations, while maintaining the retrieval accuracy. The algorithm also demonstrates excellent scalability, supporting a wide range of remote sensing data resolutions, from 4000 m down to 500 m. This work presents a feasible technical solution for real-time operational high-resolution AMV retrieval, enhancing the timeliness of typhoon monitoring and numerical weather prediction assimilation.

How to cite: Zhou, R.: Accelerating Target Tracking in Atmospheric Motion Vector Retrieval Using Openacc, EGU General Assembly 2026, Vienna, Austria, 3–8 May 2026, EGU26-6062, https://doi.org/10.5194/egusphere-egu26-6062, 2026.

EGU26-6233 | ECS | Posters on site | AS4.7

Understanding terrestrial ecosystems response to solar radiation modification 

Yuan Zhang, Wenping Yuan, Xiyan Xu, and Dan Liu

Solar Radiation Modification (SRM) ranks among the most promising geoengineering approaches. Given that SRM scenarios are plausible, current understanding of its impacts relies heavily on model projections. However, significant risks emerge from limited knowledge and substantial model uncertainties, especially regarding terrestrial ecosystems, which are intrinsically linked to human well-being. Ecosystem response uncertainties stem from scenarios, atmospheric models, land surface models, etc. Fully coupled simulations make it impossible to disentangle these contributing factors for further refinement. To address this gap, we designed a new set of offline simulations using multiple land surface models to isolate uncertainty sources and refine the ecosystem response to SRM. We will present preliminary results from these experiments.

How to cite: Zhang, Y., Yuan, W., Xu, X., and Liu, D.: Understanding terrestrial ecosystems response to solar radiation modification, EGU General Assembly 2026, Vienna, Austria, 3–8 May 2026, EGU26-6233, https://doi.org/10.5194/egusphere-egu26-6233, 2026.

EGU26-6811 | ECS | Orals | AS4.7

When wuthering winds create fluttering fields: plant canopies under diffuse and fluctuating light 

Maxime Durand, Santa Neimane-Šroma, Alexandra J. Gibbs, Xin Zhuang, Anna Lintunen, Ekaterina Ezhova, Nicole M. Hughes, Yann Salmon, Jonathon A. Gibbs, Erik H. Murchie, and T. Matthew Robson

Natural vegetation is exposed to highly dynamic light environments driven by wind-induced canopy motion, cloud cover, and atmospheric aerosols. These processes generate diffuse radiation and rapid irradiance fluctuations, ranging from sub-second windflecks to hour-long cloudflecks. This variability strongly regulates photosynthesis and transpiration, yet most vegetation models still assume static canopies and instantaneous responses.

At the ecosystem scale, we present long-term observations from a boreal Scots pine forest showing that productivity is most strongly related to the absolute amount of diffuse light rather than diffuse fraction alone. Enhanced ecosystem uptake across both shoots and forest-floor vegetation emphasizes that diffuse radiation not only reorganizes light distribution throughout the canopy but may also modify leaf-level photosynthesis through canopy-mediated effects.

Controlled-environment experiments under defined fluctuating or diffuse irradiance regimes reveal that developmental acclimation to light variability represents a physiological compromise. This trade-off between carbon gain and water loss under realistic light dynamics has direct implications for water-use efficiency and drought responses in a warming climate. In parallel, field measurements reveal order-of-magnitude differences in wind-driven canopy motion among wheat cultivars under comparable wind speeds. Light fluctuations are thus not solely imposed by the atmosphere but are co-determined by plant structure and biomechanics.

Finally, we present new analyses of cloudfleck properties derived from multi-year, high-frequency measurements, revealing cloud-driven spectral irradiance fluctuations in temperate and boreal forests. These data stress that diffuse and direct radiation differ fundamentally in both directionality and spectral composition, extending beyond a simple binary and challenging the traditional direct–diffuse dichotomy used in models. Dynamic light is not noise around a mean state but a fundamental driver of ecosystem function. Accounting for its temporal, structural, and spectral complexity is essential for realistic predictions of vegetation responses to climate change.

How to cite: Durand, M., Neimane-Šroma, S., Gibbs, A. J., Zhuang, X., Lintunen, A., Ezhova, E., Hughes, N. M., Salmon, Y., Gibbs, J. A., Murchie, E. H., and Robson, T. M.: When wuthering winds create fluttering fields: plant canopies under diffuse and fluctuating light, EGU General Assembly 2026, Vienna, Austria, 3–8 May 2026, EGU26-6811, https://doi.org/10.5194/egusphere-egu26-6811, 2026.

EGU26-7447 | ECS | Orals | AS4.7

Interactive versus inventory-based BVOC emissions reshape regional cloud-radiative and ozone feedbacks in EC-Earth3-AerChem-BVOC 

Zhenqian Wang, Twan van Noije, Paul Miller, Philippe Le Sager, and Jing Tang

Biogenic Volatile Organic Compounds (BVOCs) influence aerosol-cloud interactions and climate radiative impacts by changing the formation of Secondary Organic Aerosols (SOA) and atmospheric oxidation capacity. Current Earth System Models (ESMs) typically employ two approaches to BVOC emissions: prescribed offline emission inventories (e.g., MEGAN) or online calculated emissions that do not link to plant physiological processes or vegetation dynamics. To date, most ESMs generally lack a fully interactive coupling of plant BVOC emissions with photosynthesis-based ecosystem processes, vegetation dynamics, meteorology, and atmospheric chemistry, thus the quantified impacts on global/regional radiative forcing and climate patterns remain insufficiently understood.
In this study, we integrated a process-based vegetation BVOC emission scheme that is fully coupled with the TM5 atmospheric chemistry component within EC-Earth3-AerChem. Leveraging this interactive capability, we evaluate the impact by contrasting a simulation driven by prescribed offline inventories against this online experiment. Results for the boreal summer (JJA) indicate that while the online-coupled BVOC scheme captures the general global distribution of BVOCs, it significantly reshapes regional emission hotspots. Specifically, tropical forest source regions exhibit distinct spatial heterogeneity, characterized by an east-west dipole in the Amazon and a core-periphery contrast in the Congo Basin. This emission redistribution caused by online coupling further induces significant changes in SOA optical depth (diagnosed at 550 nm) and Cloud Condensation Nuclei (CCN) concentrations, accompanied by a widespread increase in mid-tropospheric (500 hPa) ozone across the tropics and subtropics.
With an online coupled BVOC scheme, the Shortwave Cloud Radiative Effect (SWCRE) becomes more negative (enhanced cloud cooling) over large areas, consistent with the spatial patterns of net Top-of-Atmosphere (TOA) radiation differences. The surface temperature response presents significant regional divergence, consistent with competing contributions in the radiative budget. Over the Congo Basin, warming signals are linked to widespread reductions in SOA and CCN, which weaken the aerosol cooling effect. In contrast, over parts of the Eastern Amazon, warming occurs despite increased SOA loading, suggesting that the greenhouse effect from enhanced tropospheric ozone overrides the local aerosol cooling potential. Meanwhile, cooling signals appear over ocean regions such as the North Atlantic, consistent with enhanced SWCRE. This suggests that interactive BVOC emissions reshape regional temperature responses primarily through combined BVOC–SOA–cloud and ozone feedbacks.
Overall, compared with the offline inventory approach, online coupled BVOC emissions in EC-Earth3-AerChem significantly change spatial patterns of regional radiative impact and temperature response, indicating that the dynamics in BVOC emissions themselves may be an important source of regional uncertainty in chemistry-coupled climate simulations.

How to cite: Wang, Z., Noije, T. V., Miller, P., Sager, P. L., and Tang, J.: Interactive versus inventory-based BVOC emissions reshape regional cloud-radiative and ozone feedbacks in EC-Earth3-AerChem-BVOC, EGU General Assembly 2026, Vienna, Austria, 3–8 May 2026, EGU26-7447, https://doi.org/10.5194/egusphere-egu26-7447, 2026.

Vegetation plays a fundamental role in the terrestrial carbon-oxygen cycle, with gross primary productivity (GPP) coupled to biospheric O₂ release. Ongoing warming and increasing human activity may perturb this coupling by altering productivity, respiration, and land-surface processes. These effects are of particular concern on the Qinghai–Tibetan Plateau, where such high-elevation regions are highly sensitive to climatic forcing and anthropogenic changes. As a proxy for O2 exchange, near-surface relative oxygen concentration (ROC) reflects the combined effects of biogeochemical processes, anthropogenic activities, and atmospheric transport. Here, we integrate satellite-derived GPP estimates, reanalysis meteorological data, and land-cover classifications to quantify the variability of GPP and ROC across the Qinghai–Tibetan Plateau from 2001 to 2024. We find clear land-use-dependent patterns in the co-variation of GPP and ROC. In natural ecosystems such as grasslands and forests, GPP and ROC increase synchronously, whereas in built-up areas both GPP and ROC decrease. We also find that near-surface air temperature increases across all land-use classes and is strongly correlated with GPP and ROC variability in natural ecosystems. Overall, our results suggest that intensifying human activity simultaneously increase oxygen consumption and reduce the biospheric contribution to O2 production by constraining vegetation productivity. These patterns provide observational evidence of increasingly challenging conditions for livestock in high-elevation regions and of weakened ecosystem functioning under growing human impacts.

How to cite: Zhang, Y., Lee, S., and Zhang, W.: Contrasting productivity–oxygen co-variation in natural and human-influenced areas of the Qinghai–Tibetan Plateau, EGU General Assembly 2026, Vienna, Austria, 3–8 May 2026, EGU26-8267, https://doi.org/10.5194/egusphere-egu26-8267, 2026.

EGU26-8408 | Posters on site | AS4.7

Reliability Assessment and Statistical Calibration of SAI Ensemble Projections in Southeast Asia 

Heri Kuswanto, Hakan Ahmad Fatahillah, Candra Rezzining Utomo, Kartika Fithriasari, and Tintrim Dwi Ary Widhianingsih

Stratospheric Aerosol Injection (SAI) has been widely investigated as a potential Solar Radiation Management (SRM) strategy to offset global warming, with ensemble-based Earth System Model simulations such as the Geoengineering Large Ensemble Simulation (GLENS) providing key evidence for its climatic impacts. However, the reliability of these ensemble projections, particularly at regional scales, remains insufficiently assessed. This study presents a joint evaluation of the projection skill and statistical calibration of GLENS ensemble outputs over Southeast Asia, focusing on precipitation and near-surface temperature variables. First, ensemble skill is assessed against ERA5 reanalysis using rank histograms, confidence interval coverage, Continuous Ranked Probability Score (CRPS), and Brier Score. Results show that raw GLENS projections are systematically underdispersive and biased, with overly narrow uncertainty ranges that frequently fail to capture observations. Projection skill exhibits strong regional contrasts, with poorer precipitation performance over the Maritime Continent and weaker temperature skill over mainland Southeast Asia. These deficiencies indicate overconfident ensemble behavior and limit the direct usability of raw GLENS outputs for impact assessment and decision support. To address these limitations, Bayesian Model Averaging (BMA) is applied as a probabilistic post-processing method to calibrate monthly mean temperature projections. BMA substantially reduces systematic bias, corrects ensemble dispersion, and improves probabilistic reliability across most countries. Post-calibration CRPS values consistently decrease, and predictive distributions better represent observed variability. Overall, the combined results demonstrate that while GLENS captures large-scale climatic signals of SAI, statistical calibration is essential to reduce uncertainty and obtain reliable regional projections. This study highlights the importance of integrating ensemble verification and calibration to support robust interpretation of SRM impacts in climate-sensitive regions such as Southeast Asia.

How to cite: Kuswanto, H., Fatahillah, H. A., Utomo, C. R., Fithriasari, K., and Widhianingsih, T. D. A.: Reliability Assessment and Statistical Calibration of SAI Ensemble Projections in Southeast Asia, EGU General Assembly 2026, Vienna, Austria, 3–8 May 2026, EGU26-8408, https://doi.org/10.5194/egusphere-egu26-8408, 2026.

In this study, we applied the monthly mean near-surface temperatures from the historical and future projections under the SSP585 and G6 sulfur scenarios. The bias-correction and multi-model ensemble averaging were applied to the monthly mean near-surface temperatures from four models and then used to investigate the impact of Stratospheric Aerosol Injection (SAI) on species migration to thermal environments similar to their historical adaptations. Thermal connectivity was used to quantify the migration capacity, with thermal exposure (TE) representing the cumulative temperature difference (°C) along the migration path and thermal velocity (TV) characterizing the minimum migration velocity (km yr⁻¹) required for species to track their historically adapted thermal environments. The results show that SAI exhibits a complex dual effect under the SSP585 scenario. SAI can successfully mitigate thermal stress in more than 80% global land area and provide an additional about 2% of the migratory zone globally. The mitigation effect was most significant in high-latitude regions. On the other hand, implementing SAI under the SSP585 scenario can lead to increased thermal stress in 4% of the land area increasing migration pressure in these regions. The results highlight that temperature response of SAI exhibits heterogeneous impact on thermal environments, necessitating the development of customized adaptation strategies tailored to different geographical regions in the future.

How to cite: Xu, X.: Impact of stratospheric aerosol injection on thermal environment shift, EGU General Assembly 2026, Vienna, Austria, 3–8 May 2026, EGU26-8627, https://doi.org/10.5194/egusphere-egu26-8627, 2026.

EGU26-12802 | Orals | AS4.7

Effects of Warm and Dry Conditions on Ozone Deposition and Biogenic VOC Emissions in the Eastern Mediterranean 

Eran Tas, Qian Li, Maor Gabay, Daniel Choi, and Chen Dayan

Climate change is expected to significantly alter photochemical activity through its impact on biosphere–atmosphere gas exchange. In particular, higher air temperatures and lower relative humidity (RH) over land are projected to enhance biogenic volatile organic compound (BVOC) emissions and surface ozone (O₃) concentrations, while simultaneously suppressing dry ozone deposition via both stomatal and non-stomatal pathways.

This study investigates the effects of warm and dry conditions on dry ozone deposition and BVOC emissions from terrestrial vegetation by synthesizing results from multiple field campaigns conducted between 2013 and 2023 in the eastern Mediterranean. Using eddy covariance and branch-level enclosure measurements, we quantified fluxes and mixing ratios of O₃, VOCs (dominated by BVOCs and measured using PTR-ToF-MS), and nitrogen oxides (NOₓ) across forested, urban, and coastal environments.

Our observations show that under very dry conditions (RH < 30%), the occurrence of positive (upward) O₃ fluxes increases, while the downward ozone deposition velocity increases logarithmically with RH in both urban and rural settings, driven by enhanced surface evaporation and dry air intrusion events from the upper troposphere¹,². Canopy- and branch-level measurements further reveal that under severe drought, instantaneous intraday variations in meteorological parameters serve as better proxies for BVOC emission rates than absolute meteorological values³,⁴. Additional coastal observations indicate substantial marine contributions to isoprene mixing ratios inland, consistent with recent increases in sea surface temperature in the Levantine Basin ⁵.

Collectively, these results point toward enhanced ozone formation and reduced surface removal under future warmer and drier climates, while providing new insights into the modeling of dry ozone deposition and BVOC emissions under warm and dry conditions.


References

1. Choi, D. et al., Sci. Total Environ., 2025. https://doi.org/10.1016/j.scitotenv.2025.180347

2. Li, Q. et al., Sci. Total Environ., 2019. https://doi.org/10.1016/j.scitotenv.2018.12.272

3. Li, Q. et al., Biogeosciences, 2024. https://doi.org/10.5194/bg-21-4133-2024, 2024

4. Li, Q. et al., Sci. Total Environ., 2025. https://doi.org/10.1016/j.scitotenv.2025.180423

5. Dayan, Chen, et al., Atmos. Chem. Phys.,2020. https://doi.org/10.5194/acp-20-12741-2020

How to cite: Tas, E., Li, Q., Gabay, M., Choi, D., and Dayan, C.: Effects of Warm and Dry Conditions on Ozone Deposition and Biogenic VOC Emissions in the Eastern Mediterranean, EGU General Assembly 2026, Vienna, Austria, 3–8 May 2026, EGU26-12802, https://doi.org/10.5194/egusphere-egu26-12802, 2026.

EGU26-16938 | ECS | Orals | AS4.7

Integrating Ozone–vegetation Damage Schemes into SSiB4/TRIFFID: Evaluation of Six Parameterizations and Refinement of Ozone Decay Process Across Plant Functional Types 

Lingfeng Li, Bo Qiu, Siwen Zhao, Xin Miao, Chaorong Chen, Jiuyi Chen, Yueyang Ni, and Weidong Guo

Tropospheric ozone (O3) is a major air pollutant in China that threatens vegetation productivity and ecosystem functions. Quantifying O3-induced impacts on photosynthesis and stomatal conductance is crucial for understanding changes in carbon, water, and energy fluxes between the biosphere and atmosphere on regional and global scales. In recent decades, several parameterization schemes have been developed to describe the photosynthetic and stomatal responses to O3 exposure. However, a significant spread remains when applying different schemes in various model frameworks. In this study, we integrated six flux-based O3-vegetation damage parameterizations into SSiB4/TRIFFID, a well-established land surface model coupled with a dynamic vegetation model, to assess the impacts of O3 pollution on terrestrial ecosystems in China during the 2010s. Our results show that O3 pollution led to approximately a 20% reduction in GPP during the 2010s, with discrepancies ranging from 15% to 31% across different schemes. Comparison of the O3 damage schemes revealed substantial differences in vegetation O3 sensitivity across schemes and plant functional types (PFTs). When compared with observations, the newly developed schemes, such as L2024 and LMA-based approaches, showed more reliable O3 sensitivity, as evidenced by smaller biases relative to peer-reviewed observations. This improved performance can be attributed to the inclusion of a broader range of observational and experimental data, as well as key physiological parameters (e.g., LMA) to better capture O3 sensitivity. Furthermore, we found that the L2024 scheme exhibited strong inhibition of photosynthesis in the late growing season due to cumulative O3 exposure. By refining the "decay" process of O3 accumulation using leaf lifespan parameters and applying the "decay" and "heal" processes across all PFTs, we improved the spatial and temporal distribution of Gross Primary Productivity (GPP) simulations. This study highlights the importance of observational evidence and physiological insights in developing O3-vegetation damage parameterizations. Future efforts should focus on expanding observational and experimental data on O3 responses in China’s natural ecosystems to enhance O3 damage assessment and model development.

How to cite: Li, L., Qiu, B., Zhao, S., Miao, X., Chen, C., Chen, J., Ni, Y., and Guo, W.: Integrating Ozone–vegetation Damage Schemes into SSiB4/TRIFFID: Evaluation of Six Parameterizations and Refinement of Ozone Decay Process Across Plant Functional Types, EGU General Assembly 2026, Vienna, Austria, 3–8 May 2026, EGU26-16938, https://doi.org/10.5194/egusphere-egu26-16938, 2026.

Leaf area index (LAI) is a key indicator of vegetation structure and plays a crucial role in global ecological and climate systems. The accuracy of satellite-based LAI retrievals critically depends on the effective separation of land surface and atmospheric signals in radiation measurements. Most traditional remote sensing algorithms retrieve LAI from land surface reflectance (LSR) products after atmospheric correction. In such schemes, uncertainties in aerosol optical depth (AOD) retrievals are implicitly propagated into LSR and subsequently into LAI estimates, leading to degraded accuracy and reduced spatiotemporal consistency, particularly under conditions of rapidly varying or heavy aerosol loadings.

In this study, we propose a joint retrieval framework that simultaneously estimates AOD, LSR, and LAI directly from FY-3D/MERSI top-of-atmosphere (TOA) reflectance observations. The approach employs an ensemble machine learning–based model, thereby avoiding the conventional decoupled treatment of atmospheric correction and vegetation parameter retrieval. By jointly optimizing atmospheric state variables and land surface biophysical parameters under a unified observational constraint, the method effectively suppresses the propagation of atmospheric correction uncertainties into LAI estimates.

Global retrievals for the period 2020–2023 demonstrate robust performance across a wide range of aerosol loading and observation conditions. The retrieved LAI captures reasonable spatial patterns and seasonal dynamics and shows good consistency with GLASS and MODIS LAI products. This study advances a novel land–atmosphere integrated inversion strategy and establishes a global-scale coupled aerosol-vegetation remote sensing dataset, which can serve as an important technique and data source for improving Earth system models and investigating ecosystem responses to global climate change.

How to cite: Dong, Y. and Li, J.: Joint retrieval of aerosol optical depth and leaf area index from FY-3D/MERSI measurements, EGU General Assembly 2026, Vienna, Austria, 3–8 May 2026, EGU26-17021, https://doi.org/10.5194/egusphere-egu26-17021, 2026.

EGU26-18063 | ECS | Posters on site | AS4.7

Straw-based bioenergy for carbon-neutral agriculture with sustained soil carbon growth 

Xinqing Lu, Yifan Xu, Ziqi Lin, Guocheng Wang, and Rastislav Skalsky

Crop straw management presents a critical trade-off in climate mitigation: balancing straw return for carbon sequestration against conversion into carbon-neutral bioenergy. The potential for agricultural systems to synergistically achieve both ambitious soil carbon growth and substantial greenhouse gas (GHG) reductions remains not fully understood. The integration of the Rothamsted Carbon Model (RothC) and a Bioenergy-Emission-Economic Model (BEE) enabled a systematic evaluation of the carbon balance effects of straw management in China (2021–2100) under varying soil organic carbon (SOC) targets. The results demonstrate that even under an ambitious 4 per mille SOC target, allocating a substantial share of straw resources to bioenergy production still yields robust climate mitigation benefits for the agricultural system. Under this target, the agricultural system exhibits significant climate mitigation potential, capable of fully offsetting China’s total agricultural GHG emissions. Spatial analysis further identifies East and Central China as priority regions for implementing this synergistic pathway, due to their abundant straw resources and relatively high carbon sequestration efficiency. These findings indicate that enhancing soil carbon and deploying straw-based bioenergy are not mutually exclusive, but can act as synergistic pillars for achieving agricultural carbon neutrality through spatially optimized allocation. The agricultural sector has the potential to evolve into a reliable system for climate mitigation that supports carbon neutrality while safeguarding soil health.

How to cite: Lu, X., Xu, Y., Lin, Z., Wang, G., and Skalsky, R.: Straw-based bioenergy for carbon-neutral agriculture with sustained soil carbon growth, EGU General Assembly 2026, Vienna, Austria, 3–8 May 2026, EGU26-18063, https://doi.org/10.5194/egusphere-egu26-18063, 2026.

EGU26-19855 | ECS | Orals | AS4.7 | Highlight

Diffuse radiation and climate feedback effects on the land carbon sink 

Sarah McClory, Andy Wiltshire, Lina Mercado, Steven Hancock, Dominick Spracklen, and Alexandru Rap

Clouds and aerosols influence land carbon uptake by modifying the quantity and quality of light (direct vs diffuse). Diffuse light tends to enhance canopy photosynthesis and vegetation carbon uptake via the diffuse radiation fertilisation effect, but the net response depends on a balance with the concurrent reduction in total radiation. Global and regional effects remain poorly understood, with modelling studies disagreeing on the magnitude, sign, and spatial variability of impacts. One key source of uncertainty lies in ecosystem-climate feedbacks, which are triggered by the initial photosynthesis response to diffuse radiation and can initiate a cascade of effects that further modulate carbon fluxes and light conditions. Despite this potential importance, very few studies have implemented fully coupled simulations.

Here, we use the UK Earth System Model (UKESM), implemented with a coupled interactive diffuse radiation scheme, to investigate global and regional impacts of diffuse radiation on gross primary productivity (GPP). Between 1984-2008, diffuse radiation enhances global GPP by 557.6 PgC. The diffuse radiation effect of the 1991 Mount Pinatubo eruption resulted in substantial productivity effects compared to simulations driven by climatological mean volcanic aerosol. The interactive scheme resulted in similar global GPP compared to the standard UKESM configuration with a fixed diffuse fraction of 0.4, but with important regional differences including greater diffuse radiation fraction and GPP in boreal regions but reductions in the tropics. Climate feedbacks also show considerable regional variation, acting to either enhance or suppress the initial photosynthesis response to diffuse radiation. For example, in the tropics, reduced diffuse fraction leads to lower ET resulting in warming and drying trends that amplify reductions in GPP.

These results highlight how diffuse radiation and resulting climate feedbacks can significantly influence land carbon uptake. These effects may become even more important under potential solar radiation modification (SRM) scenarios. While our results imply that diffuse radiation effects of SRM may increase global GPP, the varying regional impacts indicate that the extent of this influence is likely to be sensitive to how and where additional aerosol forcing is applied. We therefore recommend that fully coupled simulations which include representation of diffuse radiation processes are needed to better evaluate potential ecosystem impacts of SRM, and to improve understanding of the complex relationship between clouds and aerosols and the global carbon cycle.

How to cite: McClory, S., Wiltshire, A., Mercado, L., Hancock, S., Spracklen, D., and Rap, A.: Diffuse radiation and climate feedback effects on the land carbon sink, EGU General Assembly 2026, Vienna, Austria, 3–8 May 2026, EGU26-19855, https://doi.org/10.5194/egusphere-egu26-19855, 2026.

BG2 – Methods in Biogeosciences

EGU26-1857 | ECS | Orals | BG2.1

Using δ¹⁸O(PO4) for historical source apportionment of inorganic phosphates in the eutrophic lake Baldegg, Switzerland 

Ron Heinrich, Terry Cox, Deb Jaisi, Federica Tamburini, and Christine Alewell

The identification of phosphorus (P) sources is critical for implementing effective eutrophication mitigation strategies. Lake Baldegg (Switzerland) has a history of excessive phosphorus inputs leading to severe eutrophication. Here, we utilise the oxygen isotopic composition of inorganic phosphate (δ¹⁸O(PO4)) to discriminate soil-bound phosphate sources (orchard, arable, grasslands and forest; effluents from the local wastewater treatment plant and manure).
Previously, source apportionment using δ¹⁸O(PO4) has been limited by the number of sources exceeding the number of tracers. In attempt to resolve this issue, additional tracers (C, N and geochemical elements) have been incorporated into the mixing models. As these tracers may originate from different sources and/or undergo different biogeochemical cycling than phosphate, their use for phosphate apportionment can potentially lead to erroneous results.
To overcome this issue, we analysed the δ¹⁸O(PO4) values in multiple inorganic phosphate pools: NaOH-extractable (Fe/Al-bound), HCl-extractable (Ca/Mg-bound) and HNO₃-extractable residual inorganic P (modified Hedley sequence). The pools were purified using a zirconium-loaded resin, precipitated as Ag₃PO₄ and analysed for δ¹⁸O(PO₄) via high-temperature pyrolysis based isotope ratio mass spectrometry (TC/EA-IRMS).
Preliminary results show that δ¹⁸O(PO4) values discriminate in each pool between land-uses: forest (NaOH: +10.2‰; HCl: +10.6‰), orchards (NaOH: +15.6‰; HCl: +14.7‰), arable fields (NaOH: +16.0‰; HCl: +14.9‰) and grassland soils (NaOH: +17.0‰; HCl: +16.8‰). As such, multiple pools can be potentially used as tracers for phosphate apportionment and remove the need for additional non-phosphate-specific tracers. While this study demonstrates the discrimination between different sources, analysis of the lake sediments is currently ongoing. We aim to reconstruct 130 years of inorganic phosphate sources and identify key moments the catchment’s history.

How to cite: Heinrich, R., Cox, T., Jaisi, D., Tamburini, F., and Alewell, C.: Using δ¹⁸O(PO4) for historical source apportionment of inorganic phosphates in the eutrophic lake Baldegg, Switzerland, EGU General Assembly 2026, Vienna, Austria, 3–8 May 2026, EGU26-1857, https://doi.org/10.5194/egusphere-egu26-1857, 2026.

Oxygen (O), the most abundant element in the Earth's crust, has an underexplored isotope system in plant and soil sciences compared to carbon and nitrogen, despite its strong potential to serve as a robust proxy for climate, ecohydrology and biogeochemical studies. The stable isotope ratio of O (δ18O) in bulk soil organic matter (SOM) might reflect the isotope composition of soil water during SOM formation. However, this signal is blurred by the presence of O from inorganic minerals and a dynamic exchangeable O fraction that can quickly equilibrate with ambient water. To address these challenges, the O in SOM must be isolated from interfering O-containing inorganic compounds in plant OM and minerals. Moreover, the exchangeable O fraction must be accounted for. Although we hypothesise that the exchangeable O fraction in SOM is smaller than that of H, it can likely not be ignored.

We evaluated two alternative methods to separate organic and inorganic O from the soil: demineralisation (i.e., removal of inorganic compounds using HF and HCl) and removal of the organic compounds by muffling combined with a KCl treatment to remove oxyanions. After isolating the organic fraction, we applied a steam equilibration procedure, in which we equilibrated the samples with different water vapours of known O-isotopic composition to determine the δ18O value of the nonexchangeable O fraction, as has already been similarly established for H. We used standard materials like ethylene glycol, p-Nitro aniline, and Aldrich humic acid (AHA) for the demineralisation method and two O-containing minerals (Goethite and Apatite), both pure and mixed with AHA as model substances for the organic matter removal method and also 18O-spiked chemicals to select the procedure with no (or minimal) alterations of the original O isotope ratios. Our preliminary data reveal an exchangeable O fraction of 1-1.5% in AHA and excluding its effect by using mass balance calculation, the resulting δ18O value of the nonexchangeable fraction of AHA was ~15.2‰, which is significantly depleted relative to the humic acid extracted from natural soil (18.4-24.6‰), a discrepancy attributable to the absence of microbial decomposition and associated isotopic fractionation in our synthetic model compound (AHA). Thus, by quantifying the exchangeable O fraction and assessing the stability of the non-exchangeable O fraction against our treatments, this study provides a methodological prerequisite for the accurate determination of oxygen isotope ratios of the nonexchangeable O fraction in plant and soil science.

How to cite: Ghosh, D., Wilcke, W., and Oelmann, Y.: Decoding the stable isotope signature of the non-exchangeable oxygen fraction of bulk soil organic matter: methodological prerequisites , EGU General Assembly 2026, Vienna, Austria, 3–8 May 2026, EGU26-1885, https://doi.org/10.5194/egusphere-egu26-1885, 2026.

EGU26-2458 | Orals | BG2.1

Integrating Geolocator Tracking and Isotopic Tools to Reveal Winter Foraging Ecology and Mercury Exposure in Arctic Seabirds 

Mi-Ling Li, Sarah Janssen, Michael Tate, Emily Choy, Kyle Elliot, and Marianne Gousy-Leblanc

Winter is a critical yet understudied phase in the annual cycle of Arctic seabirds, largely due to logistical challenges of polar fieldwork. While geolocators have advanced our understanding of migration and overwintering behavior, their cost and technical limitations constrain widespread use. As a complementary and scalable alternative, feather analysis offers integrated insights into both ecology and contaminant exposure at individual and population levels.

In this study, we examined head feathers from thick-billed murres (Uria lomvia) collected at seven colonies spanning West Greenland, the Canadian Arctic, and Svalbard. This species breeds widely across the circumpolar Arctic, but several Atlantic populations are in decline. Because head feathers are grown during the non-breeding season, they reflect mercury exposure at overwintering sites. We measured total mercury concentrations, stable isotopes of carbon (δ¹³C) and nitrogen (δ¹⁵N), and mercury isotope compositions (δ²⁰²Hg, Δ¹⁹⁹Hg) to assess variation in winter foraging habitats and mercury exposure pathways. Our results reveal distinct spatial patterns in δ²⁰²Hg that align with known west-to-east gradients in the Hg isotopic composition of North Atlantic prey fish, suggesting region-specific foraging areas during winter. Intra-colony variation in δ²⁰²Hg further highlights individual-level differences in winter habitat use, consistent with patterns derived from geolocator data. Additionally, the strong positive correlation between total Hg concentration and Δ¹⁹⁹Hg suggests that foraging depth significantly influences mercury uptake. These findings demonstrate that an integrated isotopic-tracking approach advances ecological biogeochemistry by tracing both contaminant pathways and seabird movement using natural isotopic tracers.

How to cite: Li, M.-L., Janssen, S., Tate, M., Choy, E., Elliot, K., and Gousy-Leblanc, M.: Integrating Geolocator Tracking and Isotopic Tools to Reveal Winter Foraging Ecology and Mercury Exposure in Arctic Seabirds, EGU General Assembly 2026, Vienna, Austria, 3–8 May 2026, EGU26-2458, https://doi.org/10.5194/egusphere-egu26-2458, 2026.

Closed-transient chamber systems are widely used to measure the transport of non-reactive greenhouse gases (GHGs) and their stable isotopes between the soil and atmosphere. Technologies used to measure GHGs in chamber-based systems have advanced since their first introduction. In many early systems, gas analysis was performed off-line using gas chromatography and/or mass spectrometry. The introduction of non-dispersive infrared gas analyzers suitable for field deployment allowed CO2 to be measured on-line, but for other GHGs on-line analysis was not possible until the more recent introduction of tunable diode laser absorption spectroscopy (TDLAS)- based gas analyzers. The most recent generations of TDLAS analyzers have extended measurement capabilities from reporting total concentration of a given GHG, to separating concentrations of its most abundant stable isotopologues. For CO2, this advancement makes possible near real-time estimation of isotopic signature (δ13C) of the carbon source pool.

Linear mixing model-based approaches are used to separate the isotopic signature of a source pool from background condition observed during soil chamber measurements. The most common, those proposed by Keeling (1958) and Miller and Tans (2003), uses the relationship between the normalized isotopic ratio (δ) and total concentration, or some derivate term of either, to estimate the source pool conditions. Keeling’s methodology is widely cited but requires extrapolation well beyond measured conditions. The Miller-Tans approach is predicated on the same underlying mass balance as Keeling but uses a solution that estimates the source pool only over measured conditions, reducing uncertainty in final estimates. Both approaches require independent measurement of the total concentration and normalized isotopic ratio, which is not possible with TDLAS based analyzers. TDLAS analyzers measure individual isotopologue mole fractions and use the same set of individual measurements to calculate both total concentration and the normalized isotopic ratio, introducing an inherent autocorrelation between them. Additionally, the δ exhibits a bias as a function of total measured CO2 concentration, introducing an apparent concentration dependence error (CDE) in d reported from TDLAS.

We present an alternative approach to estimating the source pool isotopic composition specific to TDLAS measurements. This alternative approach relies only on measurements of individual isotopologue mole fractions, avoiding autocorrelation, and does not require extrapolation beyond measurement conditions. We include a sensitivity analysis of mixing model approaches and errors common to TDLAS based instruments, using a chamber dataset synthesized from field-based measurements of environmental conditions and physical properties of gas transport.

How to cite: Hupp, J., Belovitch, M., Lynch, D., and Vath, R.: An alternative approach to determine source stable carbon isotope composition for closed-transient chamber measurements using TDLAS analyzers, EGU General Assembly 2026, Vienna, Austria, 3–8 May 2026, EGU26-2823, https://doi.org/10.5194/egusphere-egu26-2823, 2026.

EGU26-3089 | Orals | BG2.1

Taking the Pulse: Tracking Wastewater Nutrients Through a River Using Lagrangian Sampling and Isotopic Tracers 

Daren Gooddy, Alex O'Brien, Mike Bowes, Nick Everard, Cedric Laize, Ponnambalam Rameshwaran, Chris Pesso, Patrick Harrison, James Sorensen, Andi Smith, and Stefan Krause

Effective management of river pollution is often limited by low-frequency monitoring approaches that fail to resolve the spatiotemporal dynamics of nutrient sources, hydrodynamic transport, and in-stream biogeochemical processing. To address this, we applied a high-resolution Lagrangian sampling framework to a well-characterised reach of the River Thames, enabling continuous tracking of water parcels downstream of key nutrient inputs. This approach combined nutrient concentration data, optical characterisation, and stable isotope tracers with detailed hydrodynamic measurements to resolve nutrient sources, mixing behaviour, and short-reach processing. Water samples were collected for conventional nutrient analysis, excitation–emission matrix (EEM) fluorescence, and isotopes of nitrate and phosphate. Field measurements were supported by drone-based infrared imaging to characterise surface flow structure and a remote-controlled survey vessel equipped with Acoustic Doppler Current Profiler, Single Beam Echo Sounder, and GPS to resolve hydrodynamics and channel morphology. In situ sondes and large-volume sampling further captured water-quality variability. Phosphate oxygen isotopes (δ¹⁸Op) were used to directly trace wastewater-derived phosphorus downstream of a wastewater treatment works (WWTW) outfall. Nineteen river samples collected at ~20 m intervals were compared with upstream river and WWTW effluent end members. Effluent phosphate exhibited a distinctly lower δ¹⁸Op value than background river phosphate, enabling a two-endmember isotope mixing model. Results indicate that WWTW-derived phosphate contributed approximately 20–55% of riverine phosphate across most of the reach, with localized zones of near-complete effluent dominance. A pronounced low-δ¹⁸Op anomaly coincident with elevated phosphorus concentrations is interpreted as a localized hydrodynamic pulse of wastewater phosphate superimposed on progressive biological reprocessing. Together, these results demonstrate that wastewater phosphorus can exert strong, spatially heterogeneous control on riverine phosphate over very short distances, even under conditions of active mixing and biological cycling. More broadly, this integrated Lagrangian-hydrodynamic-isotopic framework provides a powerful new basis for quantifying nutrient sources, transport, and transformation in rivers, with direct implications for more effective nutrient management strategies.

How to cite: Gooddy, D., O'Brien, A., Bowes, M., Everard, N., Laize, C., Rameshwaran, P., Pesso, C., Harrison, P., Sorensen, J., Smith, A., and Krause, S.: Taking the Pulse: Tracking Wastewater Nutrients Through a River Using Lagrangian Sampling and Isotopic Tracers, EGU General Assembly 2026, Vienna, Austria, 3–8 May 2026, EGU26-3089, https://doi.org/10.5194/egusphere-egu26-3089, 2026.

EGU26-3304 | Posters on site | BG2.1

GC-IRMS: optimization of injection techniques for analysis of saturated hydrocarbons, VOCs and PAHs 

Stefania Milano, Maria de Castro, and Mario Tuthorn

Rapidly expanding biogeochemical applications based on compound specific isotope ratios require instrumentation versatility to meet different analytical challenges. Here we present features and benefits of using the following GC injection techniques: on-column injection, Large Volume Injection (LVI) Programmed Temperature Vaporization (PTV) technique, Static Headspace Sampling (SHS) injection and conventional Split/Splitless injection. We will demonstrate capability of Thermo Scientific™ GC IsoLink™ II IRMS System to support these injection techniques to properly transfer a representative portion of the sample to the analytical column while avoiding discrimination and isotopic effects.

On-column injection is applied for analysis of thermally labile or unstable compounds, as well as for samples with large analyte-boiling-point differences. It can be advantageous in a wide area of applications, i.e. for investigations of alkenones and alkanes from soils and sediments. We will present an optimized GC-IRMS analytical setup for stable carbon isotope ratios analysis of saturated hydrocarbons.

The LVI PTV is an injection technique which allows the introduction of larger volumes of samples in the GC injector which can be particularly useful for analysis of organic pollutants present in very small quantities. Here we present an optimized methodology for analysis of very small amounts of saturated hydrocarbons.

The SHS injection via split/splitless injector eliminates the need for direct liquid sample injection, reducing column contamination and improving analyte separation and reproducibility of isotope data. Here we demonstrate excellent precision and accuracy for GC-C-IRMS analysis of VOCs by using an optimized method for SHS, including improved sensitivity and lower detection limits.

Finally, we also present an optimized workflow for the analysis of PAHs by GC-IRMS with conventional Splitless injection, including characterization of PAHs standards and data evaluation.

How to cite: Milano, S., de Castro, M., and Tuthorn, M.: GC-IRMS: optimization of injection techniques for analysis of saturated hydrocarbons, VOCs and PAHs, EGU General Assembly 2026, Vienna, Austria, 3–8 May 2026, EGU26-3304, https://doi.org/10.5194/egusphere-egu26-3304, 2026.

EGU26-3928 | Posters on site | BG2.1

Intra-annual tree-ring cellulose δ2H as an indicator of soil drought 

Charlotte Angove, Marco Lehmann, Matthias Saurer, Yu Tang, Elina Sahlstedt, Giles Young, Kerstin Treydte, Kersti Leppä, Pauliina Schiestl-Aalto, Guido Wiesenberg, and Katja Rinne-Garmston

Temporal variability of tree-ring cellulose δ2H (δ2Hring-cel) can be a unique tool for understanding tree physiology and climate. However, we do not fully understand the drivers of temporal variability in δ2Hring-cel. Investigating seasonal δ2Hring-cel in boreal forests is particularly challenging. Previous studies on intra-annual tree-ring δ18Ohave shown that tree-ring isotope variability can result from the combined but opposing effects of source water and leaf assimilates, a dynamic likely relevant for δ2Hring-cel as well. To be able to use δ2Hring-cel as a standalone and reliable bioindicator, it is important to understand the variable hydrogen isotope fractionation between source water and tree rings. Our study aimed to provide context to this variability in a natural forest by tracing intra-annual δ2Hring-cel to the δ2H of its sources (water, sugars & starch), and comparing δ2Hring-cel to physiological and climatic factors.

The δ2H of source water, leaf water and carbohydrate pools (i.e. water-soluble carbohydrates, starch) were analysed from five pine (Pinus sylvestris) trees during 2019 at Hyytiälä forest, Finland. Their δ2H were used to model continuous δ2H of source water (δ2Hsource) and bulk leaf water (δ2Hleaf-water) and photosynthetic water (δ2Hphoto-water). Intra-annual δ2Hring-cel were analysed in 2018 and 2019 at a resolution of 5-10 timepoints per year, and they were allocated to xylogenetic timepoints. They were then compared to time-integrated δ2Hsource, δ2Hleaf-water, δ2Hleaf-sug, net assimilation rate, and various other physiological and climatic factors.

Carbohydrate δ2H was significantly different among leaves, branches and stems. δ2Hring-cel had strong time-integrated relationships to modelled δ2Hsource, net leaf assimilation rate and evapotranspiration, but the direction of their relationships was different between years. At monthly resolution, water-soluble carbohydrate δ2H measured from one year-old needles had a strong, positive relationship to δ2Hring-cel. δ2Hring-cel also had strong relationships to Standardized Soil Moisture Index (SSMI) in both years.

We show that δ2Hring-cel has a potential as an indicator of soil drought conditions, and that this signal is likely mediated by the leaf-level response to soil drought. This clearly support the growing body of evidence that δ2Hring-cel is strongly mediated by physiological processes, while also opening a new avenue for δ2Hring-cel interpretations. Our results show promise for δ2Hring-cel functioning as a bioindicator of soil drought related physiological stress signals in long-term tree ring chronologies.

How to cite: Angove, C., Lehmann, M., Saurer, M., Tang, Y., Sahlstedt, E., Young, G., Treydte, K., Leppä, K., Schiestl-Aalto, P., Wiesenberg, G., and Rinne-Garmston, K.: Intra-annual tree-ring cellulose δ2H as an indicator of soil drought, EGU General Assembly 2026, Vienna, Austria, 3–8 May 2026, EGU26-3928, https://doi.org/10.5194/egusphere-egu26-3928, 2026.

Against the backdrop of climate change, the destructive power of tropical cyclones (TCs) has intensified, highlighting the urgent need for a more comprehensive understanding of tropical cyclone activity beyond the records provided by meteorological observations and historical documents. In this study, we compiled TC events affecting the Hong Kong region of South China since 1980 and investigated their isotopic imprints in precipitation and tree rings. We compared the hydrogen isotopic composition of precipitation (δ2Hppt) during TC-affected and TC-free months. After accounting for the rainfall amount effect and seasonal influences, we demonstrate that δ2Hppt consistently captured the anomalously depleted isotopic signals associated with TC rainfall. Furthermore, robust regression analysis indicated that TC-related precipitation isotopic variability explained approximately 30.5% of the variance in lignin methoxy stable hydrogen isotopes (δ2HLM) of tree-ring latewood in Pinus elliottii Engelm. at the Hong Kong site. Additionally, TC precipitation (TCP) exerted the strongest positive control on TC signals recorded in latewood δ2HLM, with additional contributions from TC intensity (MaxInte) and a significant negative seasonal effect (SeasonalIdx), while storm duration (Days) and distance (MinDist) showed limited independent influence. Overall, TC signals preserved in latewood δ2HLM reflect the integrated hydroclimatic effects of multiple storm characteristics at the annual scale, rather than being controlled by any single statistical descriptor of tropical cyclone activity. Our findings demonstrate that tree-ring latewood δ2HLM in P. elliottii can serve as a robust recorder of tropical cyclone signals. This work broadens the application of tree-ring lignin hydrogen isotopes and provides a novel proxy for improving interpretations of historical TC variability.

How to cite: Wang, Y., Li, W., and Song, X.: Extremely low δ2H signatures in tropical cyclone precipitation recorded by tree-ring lignin methoxy hydrogen isotopes, EGU General Assembly 2026, Vienna, Austria, 3–8 May 2026, EGU26-4359, https://doi.org/10.5194/egusphere-egu26-4359, 2026.

EGU26-4432 | Posters on site | BG2.1

Contrasting isotopic responses of dryland and wetland plants to a century of global anthropogenic changes in nutrient cycling 

Iwona Dembicz, Natalia Chojnowska, Piotr Chibowski, and Łukasz Kozub

The release of carbon dioxide and reactive nitrogen in various forms by humans disrupts the functioning of ecosystems around the world. In Europe, many valuable habitats, particularly wetlands and dry grasslands, are under threat due to eutrophication. However, contrasting water regimes mean that the uptake of anthropogenic nitrogen by plants in these ecosystems differs, and this is also interrelated with an increase in trophic level in both habitats.

In our study, we measured the δ15N and δ13C values, as well as the total nitrogen content (TN), of 99 pairs of foliar samples collected from seven species of vascular plants in dry grasslands and wetlands in Poland. Each pair consisted of a historical sample, collected from a herbarium voucher dating from before 1939 (i.e. before the widespread use of artificial fertilisers in agriculture), and a contemporary sample, collected in 2024, from the same species in a similar location.

We performed t-tests to determine whether there were significant differences in the means of δ15N, TN, and δ13C between samples from the two habitats. Next, we calculated the differences in δ15N, TN, and δ13C between the contemporary and historical samples for each pair. We then tested whether the difference for each species and habitat type was significantly different from zero using 90% confidence intervals. We analysed the relationships between differences in δ15N and TN over time and the following factors using multiple linear regression: habitat type, the proportion of farmland in the landscape, the consumption of synthetic nitrogen fertiliser and NOx deposition. 

The δ15N and TN values were lower for dry grassland species than for wetland species in both the contemporary and historical subsets. For dry grassland species, the mean δ15N value was lower in contemporary samples than in historical ones. For wetland species, however, the opposite was true. The difference in δ15N values between pairs of samples was positively correlated with the proportion of farmland in the landscape. The mean TN value was higher in contemporary wetland samples than in historical ones, but not in dry grassland plants. The mean δ13C value, corrected for the Suess effect, was lower in contemporary samples than in historical ones. The mean difference was −0.51 ‰ for dry grassland species and −3.85 ‰ for wetland species.

Our study revealed that a century of carbon emissions, increased nitrogen input into the environment and the dominance of artificial fertilisers and combustion-derived nitrogen over biological nitrogen sources has not resulted in consistent responses across habitats and species. While the isotopic composition of nitrogen and carbon in plant tissues in Central Europe has undoubtedly changed, this change is context-dependent. Its magnitude and direction are impacted by the habitat and the identity and/or ecology of the species. As expected, man-made alterations appear to be more pronounced in wetland environments than in dryland habitats. Furthermore, the source of disruption may differ between the habitat types. Specifically, wetlands are exposed to a multitude of anthropogenic nitrogen and carbon sources, whereas dry grasslands seem to be predominantly affected by changes in atmospheric composition.

How to cite: Dembicz, I., Chojnowska, N., Chibowski, P., and Kozub, Ł.: Contrasting isotopic responses of dryland and wetland plants to a century of global anthropogenic changes in nutrient cycling, EGU General Assembly 2026, Vienna, Austria, 3–8 May 2026, EGU26-4432, https://doi.org/10.5194/egusphere-egu26-4432, 2026.

EGU26-5063 | Posters on site | BG2.1

Methodological advancements for stable carbon isotope measurement of dissolved inorganic carbon using tunable diode laser absorption spectrometers 

Frank Griessbaum, Jason Hupp, Doug Lynch, Mike Scaboo, Ahlyia Leclerc, and Wei-Jun Cai

Dissolved inorganic carbon (DIC) - including aqueous CO2, carbonic acid, bicarbonate, and carbonate - is often the largest pool of carbon in aquatic systems. Biogeochemical processes result in exchanges of carbon between the various DIC components and may act to move carbon into or out of the DIC pool. The isotopic composition of carbon is a product of both its source and mass-dependent fractionation as carbon changes form through the processes acting on it. Consequently, measurement of the stable carbon isotope composition of DIC is a valuable tool for understanding biogeochemical processes in aquatic systems. However, differences in isotopic composition are small, and separating source contributions requires precise measurement.

Measurement of DIC can be done by conversion to CO2 in the presence of a strong acid and quantification of liberated CO2 by gas analysis. To determine isotopic composition of the liberated CO213C) historical methods used isotope ratio mass spectrometry (IRMS). More recently, tunable diode laser absorption spectrometry (TDLAS) based gas analyzers have been adopted for these measurements but have continued to base methodological considerations on those developed for IRMS. While IRMS and TDLAS can both be used to determine δ13C, there are fundamental differences in the technology, which should be considered during application. In particular, this has meant δ13C - DIC measurements have been unable to take full advantage of TDLAS performance characteristics.  

Here we describe methodological advancements from integration of a TDLAS (LI-7825 carbon isotope analyzer) with a DIC measurement system (LI-5370A), that include changes to the pneumatic and analytical approach used in the DIC system. Pneumatic modifications allow the TDLAS to operate at an independent flow rate from the DIC system and serve to manipulate the residence time for CO2 along the flow path. We describe use of a non-CO2 free carrier gas, which allows the DIC measurement to take full advantage of analyzer precision and minimize errors intrinsic to δ13C as determined by TDLAS. We present data demonstrating measurement precision over a range of conditions and show that under similar conditions, these methodological changes result in precision exceeding that published previously for TDLAS-DIC measurements.

How to cite: Griessbaum, F., Hupp, J., Lynch, D., Scaboo, M., Leclerc, A., and Cai, W.-J.: Methodological advancements for stable carbon isotope measurement of dissolved inorganic carbon using tunable diode laser absorption spectrometers, EGU General Assembly 2026, Vienna, Austria, 3–8 May 2026, EGU26-5063, https://doi.org/10.5194/egusphere-egu26-5063, 2026.

EGU26-5528 | ECS | Orals | BG2.1

Reconstructing hydroclimate across the Pleistocene–Holocene transition in southern Iberia using stable isotopes of gypsum hydration water 

Jorge Cañada-Pasadas, Fernando Gázquez, Lucía Martegani, Claudia Voigt, Ana Isabel Sánchez-Villanueva, Antonio García-Alix, and Gonzalo Jiménez-Moreno

This study examines the stable oxygen and hydrogen isotopic composition of gypsum (CaSO4·2H2O) hydration water (GHW) preserved in sediments from the Laguna de la Ratosa playa lake (Málaga Province, southern Iberian Peninsula). The objective was to reconstruct the lake water isotopic composition between 18.5 and 7.5 ka, reflecting hydroclimate variability in the southern Iberian Peninsula during the Pleistocene-Holocene transition. The GHW proxy relies on the fact that during crystallization, gypsum incorporates water from the solution, allowing the isotopic composition of the paleo-lake water to be directly inferred from that of GHW. This is possible because the oxygen and hydrogen isotope fractionation factors between aqueous solutions and GHW are well constrained and largely insensitive to temperature and salinity. The reconstructed lake-water isotopic values show a progressive decrease (from mean values of 6 to 0‰ for δ¹⁸O and from 10 to –5‰ for δ²H) between 18.5 and 11 ka, coincident with the deglaciation. This trend indicates a transition toward less evaporative conditions associated with increasingly humid climate. Superimposed on this overall trend, however, are three arid intervals centered at ca. 18 ka, 16 ka, and 12–13 ka, during which both δ¹⁸O and δ²H values increased. These arid phases are interpreted as reflecting the influence of the Last Glacial Maximum, Heinrich Stadial 1 (HS1), and the Younger Dryas on lake hydrology. During the Early-Mid Holocene (11–7.5 ka), isotopic values stabilized at the lowest levels of the record (ca. 0‰ for δ¹⁸O and ca. –5‰ for δ²H), suggesting persistently reduced evaporation and the establishment of a more permanent lacustrine system under sustained wetter conditions. Overall, these results demonstrate that gypsum hydration water preserved in playa-lake sediments constitutes a robust proxy for reconstructing paleohydrological variability and associated climatic changes.

Acknowledgments: This study was funded by the GYPCLIMATE (PID2021-123980OA-I00) and PID2021-125619OB-C21 projects of the Spanish Ministry of Economy and Competitiveness and FEDER European Regional Development Funds. J.C.P. acknowledges the Research Teaching Training contract PRE2022-103493 Ministry of Economy and Competitiveness of Spain. L.M. was funded by the FPU21/06924 grant of the Spanish Ministerio de Educación y Formación Profesional. C.V. was funded by the European Comission (Marie Curie postdoctoral fellowship, grant no. 101063961). F.G acknowledges the Ramón y Cajal contract (RYC2020-029811-I) and the PPIT-UAL grant from the Andalusian Regional Government -FEDER2022-2026 (RyC-PPI2021-01).

How to cite: Cañada-Pasadas, J., Gázquez, F., Martegani, L., Voigt, C., Sánchez-Villanueva, A. I., García-Alix, A., and Jiménez-Moreno, G.: Reconstructing hydroclimate across the Pleistocene–Holocene transition in southern Iberia using stable isotopes of gypsum hydration water, EGU General Assembly 2026, Vienna, Austria, 3–8 May 2026, EGU26-5528, https://doi.org/10.5194/egusphere-egu26-5528, 2026.

EGU26-5954 | ECS | Orals | BG2.1

Critical evaluation of internal normalization and standard-sample-bracketing for accurate ⁸⁷Sr/⁸⁶Sr analysis  

Anastassiya Tchaikovsky, Simone Braeuer, Walter Pohl, and Stephan Hann

The strontium isotope ratio 87Sr/86Sr is a key tracer with wide-ranging applications in geochemistry, hydrology, paleoclimatology and migration research. To make sound interpretations of 87Sr/86Sr isotope ratios in the context of biogeosciences, researchers need high quality data. In this contribution, we critically evaluate the accuracy of two conceptually different analytical protocols for 87Sr/86Sr determination on the example of a large dataset (= 135) comprising biogenic and abiogenic materials.  

Water, soil extracts, and hydroxyapatites (tooth enamel) were prepared according to established procedures and analyzed by solution-based multi-collector inductively coupled plasma mass spectrometry (MC ICP-MS). For the calibration we used two protocols: internal normalization (also termed internal mass bias correction or internal calibration) and standard-sample-bracketing (external calibration). Isotope dilution mass spectrometry was not considered suitable, because this calibration approach becomes very time- and cost-intensive when applying to a large sample set.

Analysis of water, soil extracts and hydroxyapatites showed that the majority of 87Sr/86Sr isotope ratios which were determined by internal normalization shifted towards higher values in comparison to data determined by standard-sample-bracketing. Extensive evaluations ruled out sample preparation or measurement errors. Instead, internal normalization yielded biased data, because it is based on the assumption that all samples have the same 88Sr/86Sr isotope ratio, which can be used for normalization. However, in 90% of the investigated samples the 88Sr/86Sr significantly deviated from the assumed invariant value; in particular, the 88Sr/86Sr that is conventionally expressed as δ(88Sr/86Sr)SRM987 ranged from -1.01‰ to 0.20‰. As a consequence, internally normalized 87Sr/86Sr data biased by up to 0.00043, which was 2-times larger than previously predicted by theoretical calculations. These results demonstrate that the choice of calibration method has a much higher impact on the accuracy of 87Sr/86Sr isotope ratios than initially expected. The implication of these findings in biogeoscience applications will be discussed.

This project has received funding from the European Research Council (ERC) under the European Union's Horizon 2020 research and innovation programme (grant agreement n°856453 ERC-2019-SyG).

How to cite: Tchaikovsky, A., Braeuer, S., Pohl, W., and Hann, S.: Critical evaluation of internal normalization and standard-sample-bracketing for accurate ⁸⁷Sr/⁸⁶Sr analysis , EGU General Assembly 2026, Vienna, Austria, 3–8 May 2026, EGU26-5954, https://doi.org/10.5194/egusphere-egu26-5954, 2026.

EGU26-6598 | ECS | Orals | BG2.1

A novel method for simultaneous quantification and isotope analysis of labile soil carbon directly from liquid extracts 

Getachew Agmuas Adnew, Maria de Castro, and Per Lennart Ambus

Quantifying labile soil carbon (C) pools and their stable isotope composition (δ¹³C) is fundamental for elucidating microbially mediated C cycling, soil organic matter turnover, and isotope fractionation during biogeochemical transformations. Extractable C and microbial biomass C are commonly obtained using salt solutions (e.g., 0.25–0.5 M K₂SO₄); however, subsequent determination of C concentrations and isotope ratios typically requires labor-intensive sample preparation steps, including freeze-drying, oven-drying, or desalting by dialysis. These procedures are time-consuming and may result in substantial losses of dissolved organic C, potentially biasing isotopic signatures.

Here, we present a novel analytical method that enables the simultaneous determination of C concentrations and stable isotope composition (δ¹³C) directly from liquid 0.5 M K₂SO₄ soil extracts without any prior sample preparation. This approach allows direct quantification of extractable and microbial biomass C, substantially reducing sample handling and associated analytical uncertainty.

Method validation across contrasting soil types demonstrates high precision and reproducibility for both elemental concentrations and isotope ratios, while avoiding C losses associated with dialysis or concentration procedures. The method facilitates rapid, high-throughput analysis and enhances the temporal and mechanistic resolution of studies on microbial turnover, rhizosphere processes, and soil C dynamics.

Overall, this approach provides a robust new tool for biogeoscience research, enabling integrated assessments of labile C pools and their isotopic signatures and supporting improved process-based understanding of soil biogeochemical cycling.

How to cite: Adnew, G. A., de Castro, M., and Ambus, P. L.: A novel method for simultaneous quantification and isotope analysis of labile soil carbon directly from liquid extracts, EGU General Assembly 2026, Vienna, Austria, 3–8 May 2026, EGU26-6598, https://doi.org/10.5194/egusphere-egu26-6598, 2026.

The biogeochemical cycling of sulfur stands as a cornerstone in the regulation of the Earth's surface redox state, acting as a primary buffer for atmospheric oxygen and a critical player in the burial of organic matter. The formation and subsequent preservation of sedimentary pyrite represents the dominant sink of reduced sulfur from the global ocean. For decades, the sulfur-isotopic composition of pyrite has been utilized by geochemists as a proxy to reconstruct the chemical evolution of earth's oceans and atmosphere. However, the reliability of this isotopic archive is linked to the physical and chemical state of the sediment-water interface, a boundary layer that was radically transformed by the evolution and intensification of bioturbation - the mixing and ventilation of sediments by burrowing animals. While it is often assumed that the onset of benthic faunal activity had a profound effect on the preserved S-isotope ratio (e.g., (Canfield and Farquhar 2009), actual studies exploring the impact of bioturbation are scarce. (Riemer et al. 2023) show experimental data that suggests that bioturbation shifts the isotope ratio of dissolved H2S towards more negative values. This is in contrast to numerical studies that suggest that bioturbation has no effect on the pyrite S-isotope ratio (Mertens, Paradis, and Hemingway 2025). Here we extend the iron-redox shuttle model of (Van de Velde and Meysman 2016) to include iron-monosulfide and pyrite precipitation, dissolution and oxidation reactions. Our model explicitly tracks, O2, SO4, OM, S0, S2-, Fe3+, Fe2+ in liquid and sorbed state, FeS and FeS2 and their respective S-isotope ratios. Model results suggest that bioturbation has either no, or only a very small, impact. However the current model does not yet include sulfur disproportionation and organic sulfur, so these findings are preliminary.

References

Canfield, Donald E., and James Farquhar. 2009. “Animal Evolution, Bioturbation, and the Sulfate Concentration of the Oceans.” Proceedings of the National Academy of Sciences 106 (20): 8123–27. doi:10.1073/pnas.0902037106.

Mertens, Cornelia, Sarah Paradis, and Jordon D. Hemingway. 2025. “Sedimentary Conditions Drive Modern Pyrite Burial Flux to Exceed Oxidation.” Nature Geoscience. doi:10.1038/s41561-025-01855-5.

Riemer, Sydney, Alexandra V. Turchyn, André Pellerin, and Gilad Antler. 2023. “Digging Deeper: Bioturbation Increases the Preserved Sulfur Isotope Fractionation.” Frontiers in Marine Science 9 : 1039193. doi:10.3389/fmars.2022.1039193.

Velde, Sebastiaan van de, and Filip J. R. Meysman. 2016. “The Influence of Bioturbation on Iron and Sulphur Cycling in Marine Sediments: A Model Analysis.” Aquatic Geochemistry 22 (5-6): 469–504. doi:10.1007/s10498-016-9301-7.

How to cite: Wortmann, U.: The impact of bioturbation on pyrite sulfur isotope ratios: A numerical experiment, EGU General Assembly 2026, Vienna, Austria, 3–8 May 2026, EGU26-8048, https://doi.org/10.5194/egusphere-egu26-8048, 2026.

EGU26-9004 | ECS | Posters on site | BG2.1

Tracing twilight zone organic carbon remineralization and paleoproductivity with particulate barium proxies: insights and limitations 

Yi Yuan, Songling Zhao, Zhouling Zhang, Martin Frank, and Zhimian Cao

The biological pump is a fundamental component of the oceanic carbon cycle, in which export production from the euphotic zone and subsequent organic carbon remineralization in the twilight zone jointly regulate carbon sequestration in the ocean interior. However, the magnitude, spatial variability, and tracers of these coupled processes remain incompletely understood. Here, we investigate the linkage between export production, twilight zone remineralization, and particulate barium in the western North Pacific (wNP) and the South China Sea (SCS). Organic carbon remineralization fluxes in the twilight zone (150-600 m) are quantified using a newly developed transfer function relating particulate excess barium (PBaxs) to oxygen utilization rates, revealing pronounced spatial heterogeneity, with PBaxs concentrations and remineralization fluxes increasing from the subtropical gyre to the North Pacific transition zone. Satellite-derived net primary production (NPP) and export production (EP) exhibit spatial patterns broadly consistent with the inferred remineralization fluxes, indicating a strong association between upper-ocean productivity and mesopelagic carbon degradation. Estimates of the e-ratio and r-ratio based on NPP, EP, and remineralization fluxes demonstrate contrasting biological pump efficiencies, with low e-ratios and high r-ratios in the subtropical gyre reflecting weak carbon sequestration, and high e-ratios and low r-ratios in the transition zone indicating a more efficient biological pump. We further evaluate the potential of particulate barium isotopes as tracers of EP by establishing a calibration between twilight zone particulate barium isotopic composition and euphotic-zone EP in the modern ocean, which reveals a significant negative relationship. However, this relationship does not persist in sedimentary archives: barium isotopic compositions show no systematic response to glacial-interglacial variations in paleoproductivity, and EP reconstructed using the modern calibration exhibits no correlation with sedimentary total organic carbon fluxes. Overall, this study provides an integrated assessment of the applicability and limitations of barium-based proxies from the water column to sediments, highlighting the tight association between Ba, export production, and twilight zone remineralization while emphasizing the challenges and limitations in extending modern barium-based proxies to reconstruct past biological pump dynamics.

How to cite: Yuan, Y., Zhao, S., Zhang, Z., Frank, M., and Cao, Z.: Tracing twilight zone organic carbon remineralization and paleoproductivity with particulate barium proxies: insights and limitations, EGU General Assembly 2026, Vienna, Austria, 3–8 May 2026, EGU26-9004, https://doi.org/10.5194/egusphere-egu26-9004, 2026.

EGU26-9124 | Orals | BG2.1

Plant carbon-use efficiency under warming: insights from a ¹³CO2 pulse-chase experiment 

Xiaoying Gong, Ziyi Yang, Qi Liu, and Lei Li

Carbon use efficiency (CUE), defined as the ratio of net primary production (NPP) to gross primary production (GPP), reflects the efficiency of carbon conversion into plant biomass after accounting for respiratory losses. As a key parameter in plant carbon budgeting and terrestrial carbon sequestration assessments, CUE is difficult to measure directly due to the challenges in quantifying gross CO₂ fixation and total respiration. Thus, many carbon cycle models rely on simplified empirical values (e.g., 0.5). Although climate warming may influence CUE due to the widely observed temperature‐sensitivity of respiration, the responses of CUE to warming remain unclear.

In this study, we grew wheat (T. aestivum) and upland rice (O. sativa) in controlled chambers under two temperatures: 25°C (control) and 29°C (+4°C warming). We took advantage of a gas exchange and 13C-labelling facility to estimate the gross photosynthetic rate of individual plants and trace the allocation of fixed carbon to shoot and root growth. A compartment model was fit to the data of tracer dynamic during the chase period to analyze the turnover features of carbon pools.

Both species exhibited physiological acclimation to warming: increased leaf‐level maximum carboxylation rate and specific leaf area, but decreased basal respiration rate. Consequently, whole‐plant CUE did not differ significantly between temperature treatments. ¹³C dynamics further revealed that warming did not alter the turnover rates of carbon pools supporting respiration and growth. These results indicate that +4°C warming did not affect CUE in wheat or upland rice, demonstrating a coordinated acclimation of photosynthesis and respiration to elevated temperature.

How to cite: Gong, X., Yang, Z., Liu, Q., and Li, L.: Plant carbon-use efficiency under warming: insights from a ¹³CO2 pulse-chase experiment, EGU General Assembly 2026, Vienna, Austria, 3–8 May 2026, EGU26-9124, https://doi.org/10.5194/egusphere-egu26-9124, 2026.

EGU26-10602 | Posters on site | BG2.1

Strontium isotopes as geological fingerprints in potatoes cultivated on ocean-island basalts  

Oscar Perdomo-Sosa, Beverley C. Coldwell, Eduardo Lodoso Ruíz, Sttefany Cartaya Arteaga, María Asensio Ramos, Gladys V. Melián, Pedro A. Hernández, and Nemesio M. Pérez

Food fraud related to the geographical origin of high-value agricultural products represents a persistent challenge in regions where local production coexists with large volumes of imported material. In the Canary Islands, potatoes constitute a culturally and economically important crop, with locally grown and traditional cultivars commanding substantially higher market prices than imported varieties, creating clear incentives for mislabelling. 

Strontium isotope ratios (⁸⁷Sr/⁸⁶Sr) represent a metal isotope system that directly links agricultural products to the geological and biogeochemical characteristics of their cultivation environment through soil–plant transfer processes. Applications to plant-based products grown under contrasting agronomic and water-management conditions demonstrate that geological substrates exert primary control on strontium isotopic signatures. Potatoes cultivated on Tenerife display tightly constrained ⁸⁷Sr/⁸⁶Sr ratios between ~0.7046 and ~0.7054, consistent with uptake from low-radiogenic ocean-island basalts characteristic of the island. 

These isotopic values are well separated from those typically associated with continental European agricultural regions and remain coherent across different potato cultivars, despite variability in strontium concentrations (≈410–710 ppb/g). Even within a single basaltic island, small but reproducible variations in ⁸⁷Sr/⁸⁶Sr are observed, reflecting local geological heterogeneity and soil development. 

The results highlight the suitability of strontium isotopes as a geology-driven fingerprint within terrestrial biogeoscience systems and demonstrate their potential for verifying the Canarian origin of potatoes. This approach provides a robust foundation for applied provenance studies and authenticity control in volcanic island agro-ecosystems. 

How to cite: Perdomo-Sosa, O., C. Coldwell, B., Lodoso Ruíz, E., Cartaya Arteaga, S., Asensio Ramos, M., V. Melián, G., A. Hernández, P., and M. Pérez, N.: Strontium isotopes as geological fingerprints in potatoes cultivated on ocean-island basalts , EGU General Assembly 2026, Vienna, Austria, 3–8 May 2026, EGU26-10602, https://doi.org/10.5194/egusphere-egu26-10602, 2026.

EGU26-10623 | ECS | Posters on site | BG2.1

Lignin Methoxyl δ¹³C Reveals Particle-Size–Dependent Sources and Degradation  in Forest Soils 

Terry Cox, Fatima mharchat, and Christine Alewell

Lignin is a major component of plant-derived organic matter in soils, and the stable carbon isotopic composition of lignin-derived methoxyl (δ 13C LMeO) groups provides a distinct molecular fingerprint for identifying sources and their relative contributions to soil organic matter. This study investigates δ 13C LMeO values in soil profiles from surface horizons to bedrock in  a deciduous and coniferous forest in Switzerland, with the aim of estimating the relative contributions of lignin from photosynthetic and non-photosynthetic plant tissues. Analyses were conducted on two particle-size fractions (<63 µm and 63–200 µm), and the influence of ¹³C isotopic fractionation during lignin degradation was evaluated for both size fractions.

Preliminary source apportionment results, not accounting for isotopic fractionation during degradation, indicate that the coarse fraction at the coniferous site is dominated by lignin derived from non-photosynthetic plant tissues, approaching a 100% contribution. In contrast, the fine fraction at the coniferous site and both particle-size fractions at the deciduous site comprise approximately 60% lignin from non-photosynthetic tissues.

In contrast to bulk δ¹³C and other compound-specific stable isotope tracers, δ 13C LMeO  values exhibited a systematic isotopic depletion in the fine (<63 µm) fraction. This depletion suggests preferential stabilization of the more easily degradable lignin from photosynthetic tissues. In the coarse (63–200 µm) fraction, δ 13C LMeO values showed a clear relationship with the extent of degradation, consistent with isotopic fractionation during lignin loss. In contrast, no systematic degradation-related trend was observed in the fine fraction. Together, these results highlight contrasting controls of degradation and stabilization on lignin across soil particle-size fractions and underscore the importance of accounting for isotopic fractionation when applying δ 13C LMeO for soil organic matter source attribution.

How to cite: Cox, T., mharchat, F., and Alewell, C.: Lignin Methoxyl δ¹³C Reveals Particle-Size–Dependent Sources and Degradation  in Forest Soils, EGU General Assembly 2026, Vienna, Austria, 3–8 May 2026, EGU26-10623, https://doi.org/10.5194/egusphere-egu26-10623, 2026.

EGU26-10665 | Orals | BG2.1

Comparing eddy covariance estimates of gross primary production to estimates from stem sap flux and phloem d13C across sites. 

John Marshall, Lasse Tarvainen, Antoine Vernay, Marko Stojanović, Zsofia Reka Stangl, and Tobias Rütting

Gross primary production (GPP) describes ecosystem-scale canopy photosynthesis and provides the foundation of the ecosystem carbon budget. It is often derived from eddy covariance data based on models of the component processes. At several sites in Sweden and the Czech Republic, we have quantitatively tested these GPP estimates against independent empirical data based on stem-scale measurements of xylem water flux and intrinsic water-use efficiency (iWUE), where iWUE is estimated from the stable isotope composition of phloem contents. With one exception, these comparisons have agreed well in the middle of the growing season. On the other hand, at several sites, the methods showed distinct discrepancies either at the beginning or the end of the growing season. We discuss possible causes of these seasonal discrepancies ,including the decoupling of phloem contents from gas-exchange, the scaling of sap flux, mesophyll conductance, decoupling of air masses above and below the canopy, and the inference of GPP from eddy covariance data. Quantitative tests of these methods against independent data will be critical as our need to quantify carbon sources and sinks continues to grow.

How to cite: Marshall, J., Tarvainen, L., Vernay, A., Stojanović, M., Stangl, Z. R., and Rütting, T.: Comparing eddy covariance estimates of gross primary production to estimates from stem sap flux and phloem d13C across sites., EGU General Assembly 2026, Vienna, Austria, 3–8 May 2026, EGU26-10665, https://doi.org/10.5194/egusphere-egu26-10665, 2026.

EGU26-11165 | ECS | Orals | BG2.1 | Highlight

The Geologic Super-Cycle of Chilean Nitrate Deposition 

Camila Riffo Contreras, Guillermo Chong, Swea Klipsch, Michael E. Böttcher, Amelia Davies, and Michael Staubwasser

The Atacama Desert contains the largest natural nitrate accumulations on Earth. Yet, the processes controlling their formation and redistribution remain debated, particularly for nitrate veins hosted in bedrock. In this study, we combine field observations with chemical and stable isotope analyses (δ18O, Δ17O, δ15N) of nitrate from all major deposit types across the Atacama nitrate provinces. All nitrate occurrences display large positive Δ17O values (+13 to +22‰) and elevated δ18O (+43 to +65‰), confirming a unanimous atmospheric origin via ozone-driven photochemical oxidation of NOx.

Vein-hosted nitrates in volcanic and sedimentary rocks show suppressed Δ17O and δ18O values trending toward fossil hydrothermal waters, indicating partial oxygen isotope exchange during interaction with hot, saline, acidic fluids. Field relationships, fault-controlled mineralization, rhyolitic exsolution textures, and sulfate sulfur isotopes independently confirm hydrothermal dissolution, transport, and reprecipitation of originally atmospheric nitrate.

These results define a two-stage geological cycle: long-term atmospheric deposition, groundwater transport, and evaporative concentration under hyperaridity, followed by tectonically driven hydrothermal recycling linked to Andean magmatism. This two-mechanism framework reconciles the isotopic, mineralogical, and spatial diversity of nitrate deposits, demonstrating that the Atacama Desert records a coupled atmospheric–hydrothermal cycle linked to the tectonic and magmatic evolution of the central Andean margin, and providing a template for other nitrate-bearing deserts on Earth and potentially on other planets.

Nitrate deposit δ15N = −8 to +4‰ are slightly higher than in atmospheric nitrate and overlap with the Atacama soil nitrate profile compositions, but in contrast show a positive correlation with δ18O. This excludes humidity driven microbial denitrification and gaseous N loss as a major driver for local secondary composition contrasts.

How to cite: Riffo Contreras, C., Chong, G., Klipsch, S., E. Böttcher, M., Davies, A., and Staubwasser, M.: The Geologic Super-Cycle of Chilean Nitrate Deposition, EGU General Assembly 2026, Vienna, Austria, 3–8 May 2026, EGU26-11165, https://doi.org/10.5194/egusphere-egu26-11165, 2026.

EGU26-11252 | Posters on site | BG2.1

Fully integrated TOC and TNb analysis of estuarine and sea water samples with the Elementar iso TOC cube®  

Mike Seed, Calum Preece, Toby Boocock, and Marian De Reuss

Identifying and quantifying the processes that control the carbon and nitrogen cycling in aquatic systems is important for mitigating urban and agricultural pollution, optimizing environmental policy and understanding global nutrient cycles. The isotopic analysis of dissolved organic carbon (TOC) and total bound nitrogen (TNb) are particularly important to elucidate the different sources, track nutrient cycling processes and help contamination identification.  

Here, we present the δ13C performance of the Elementar iso TOC® cube for <5 mg/L carbon TOC concentrations in estuarine river water samples, highlighting a salinity gradient from 2g/L to 25g/L. We also present determination of TOC concentration and δ13C TOC in seawater, demonstrating the performance of the iso TOC® cube for the analysis of seawater samples.  

The iso TOC cube® elemental analyser has been developed for fully integrated TOC/TNb isotope ratio analysis. Optimised for precise measurements of TC, TOC, TIC and TNb isotope ratios covering a wide range of applications areas. All types of liquids from drinking water, industrial wastewater, soil leachates, or marine samples are determined reliably and with the highest isotopic precision. 

How to cite: Seed, M., Preece, C., Boocock, T., and De Reuss, M.: Fully integrated TOC and TNb analysis of estuarine and sea water samples with the Elementar iso TOC cube® , EGU General Assembly 2026, Vienna, Austria, 3–8 May 2026, EGU26-11252, https://doi.org/10.5194/egusphere-egu26-11252, 2026.

Volcanic hydrocarbon reservoirs are distributed across more than 40 basins in 13 countries globally. In recent years, significant exploration prospects have been identified in Mesozoic volcanic strata within China’s offshore basins, including the Bohai Bay, East China Sea, Pearl River Mouth, and Qiongdongnan basins. The study of volcanic reservoirs remains a frontier topic in petroleum geology. Characterized by strong heterogeneity resulting from the superposition of multiple diagenetic processes and subsequent reformation, these reservoirs pose significant challenges for favorable reservoir prediction. Furthermore, the pronounced intra-volcanic heterogeneity leads to significant variations in hydrocarbon properties within single volcanic edifices, complicating the determination of hydrocarbon sources and the reconstruction of accumulation histories.Taking the BZ8S-A area in the Bozhong Sag of the Bohai Bay Basin as a case study, this research addresses these challenges. The study area is currently drilled by four exploration wells, revealing distinct variations in hydrocarbon composition, reservoir temperature and pressure, gas-oil ratios (GOR), and hydrocarbon column heights. Notably, two of these wells have tested high-yield oil and gas flows. To delineate the hydrocarbon accumulation process, a comprehensive multi-disciplinary approach was adopted, integrating geological background analysis, source rock distribution, hydrocarbon generation evolution in adjacent sags, and seismic interpretation.Advanced geochemical analyses were employed, including compound-specific carbon isotope analysis of oil and gas, monomeric hydrocarbon carbon isotopes, and organic matter stable carbon isotopes. These were combined with biomarker analysis (saturated hydrocarbons, aromatics, and adamantanes) and numerical simulation of hydrocarbon migration pathways. By establishing carbon isotopic cross-plots for source rocks at different stratigraphic levels in the hydrocarbon-generating sags and comparing them with typical generated hydrocarbon samples, the study conclusively determines that the hydrocarbons in the BZ8S-A volcanic reservoir are primarily sourced from the Shahejie Formation. Moreover, the geochemical evidence indicates that hydrocarbons in different well locations originated from distinct hydrocarbon-generating sags, revealing a complex, multi-source charging model for this volcanic reservoir.

How to cite: Shiyang, Z. and Qi, W.: Tracing Multi-Source Mixing in Volcanic Reservoirs Using Biomarkers and Carbon Isotopes: A Case Study of the Bozhong Sag, Bohai Bay Basin, EGU General Assembly 2026, Vienna, Austria, 3–8 May 2026, EGU26-11279, https://doi.org/10.5194/egusphere-egu26-11279, 2026.

EGU26-13059 | Orals | BG2.1

Isotopic fingerprint of heterotrophic nitrification by Alcaligenes faecalis 

Claudia Frey, Wouter B. Lenferink, Maartje A.H.J. von Kessel, Paul M. Magyar, Mike S.M. Jetten, Moritz F. Lehmann, and Sebastian Lücker

The discovery of heterotrophic nitrification has expanded our view of nitrification beyond the canonical chemolithoautotrophs. Yet, the role of heterotrophic bacteria in nitrification across environmental and engineered systems remains unclear, partly due to limited physiological characterization and the absence of robust diagnostic tools. The analysis of nitrogen (N) isotope fractionation effects has been used for tracing biogeochemical N cycle processes and offers the potential to resolve underlying biochemical pathways. While autotrophic nitrification is known to generate substantial N isotope effects during ammonia (NH₃) oxidation to nitrite (NO₂⁻), comparable constraints for heterotrophic nitrifiers are lacking. Here, we report for the first time the N isotope effects associated with heterotrophic nitrification by Alcaligenes faecalis, an organism capable of converting NH₃ into several nitrogenous products. In batch incubations with 2.2 mM ammonium (NH₄⁺) as the sole N source, A. faecalis produced up to 0.67 ± 0.04 mM NH₂OH, 0.11 ± 0.01 mM NO₂⁻, and 12 ± 1.2 µM N₂O, while the remaining NH₄⁺ was assimilated into biomass. Therefore, the main NH4+consumption pathway of A. faecalis is, in fact, best described by ammonium assimilation, which supports previous findings. Total NH₄⁺ consumption showed an isotope effect of 13.8 ± 0.4‰, exceeding that of biomass formation (4.8 ± 0.2‰). Both values fall within the known range for bacterial NH₄⁺ assimilation, but the disparity suggests additional fractionating steps beyond assimilation alone. NH₂OH, NO₂⁻, and N₂O were initially strongly ¹⁵N-depleted relative to the NH₄⁺ source, and became progressively enriched as NH₄⁺ was consumed. N₂O exhibited a variable site preference (24–38‰), indicating contributions from at least two production pathways. Overall, our findings show that heterotrophic nitrification produces N-isotopic signatures fundamentally distinct from canonical ammonia oxidation. These characteristic patterns in both NH₄⁺ and NO₂⁻ pools highlight the diagnostic potential of stable isotopes for identifying heterotrophic nitrification in complex systems.

How to cite: Frey, C., Lenferink, W. B., von Kessel, M. A. H. J., Magyar, P. M., Jetten, M. S. M., Lehmann, M. F., and Lücker, S.: Isotopic fingerprint of heterotrophic nitrification by Alcaligenes faecalis, EGU General Assembly 2026, Vienna, Austria, 3–8 May 2026, EGU26-13059, https://doi.org/10.5194/egusphere-egu26-13059, 2026.

EGU26-14109 | Orals | BG2.1

Simple, Fast, and Highly Precise δ¹³C and δ²H Analysis of Organics via Dual Picarro CRDS Integration 

Jan Wozniak, Sohom Roy, Magdalena E. G. Hofmann, Joyeeta Bhattacharya, and Tina Hemenway

Stable isotope analysis of organic materials is essential in environmental, geochemical, and food authenticity research, offering insights into carbon sources and product origins. Traditional Picarro Combustion Module–Cavity Ring-Down Spectroscopy (CM-CRDS) systems provide reliable, cost-effective δ¹³C analysis; furthermore, enabling simultaneous δ²H measurement greatly expands their utility for many applications.

We present a straightforward extension of the CM-CRDS system, integrating two dedicated analyzers: the Picarro G2201-i for δ¹³C and the Picarro L2130-i for δ²H. Key modifications include removing the water trap, heating the transfer tubing, and adding a heated buffer volume, enabling direct isotopic analysis of water vapor alongside carbon dioxide. This setup maintains the original sample delivery for carbon isotope analysis, while a simple software adjustment allows precise peak integration for hydrogen isotopes.

Performance was validated using a range of international standards representing diverse organic materials: USGS88 (marine collagen), USGS89 (porcine collagen), USGS90 (millet flour), USGS91 (rice flour), and IAEA CH7 (polyethylene foil). The system demonstrated excellent δ²H linearity (with slopes of 1.040, 1.074 and 1.017 on three separate days and R² values exceeding 0.99) while maintaining the high accuracy of δ¹³C measurements. Precision was assessed with hexamethylenetetramine (HMT), yielding a δ²H standard deviation of 0.26‰ and δ¹³C of 0.04‰ over 50 replicates. We chose HMT to determine the precision because it does not exchange hydrogen isotopes during storage and analysis and is used to determine the carbon-bound non-exchangeable hydrogen in fructose and glucose in honey [1]. Calibration procedures and best practices for hydrogen isotope analysis are discussed.

Our findings highlight the potential of combining the G2201-i and L2130-i analyzers with a CM in a coordinated analytical workflow for dual isotope analysis. This methodology opens new opportunities for isotope studies for environmental as well as food authenticity and food origin studies, and is a low-cost, easy to use alternative to IRMS analysis.

Reference

[1] Li et al., 2024, A new approach to detecting sugar syrup addition to honey: Stable isotope analysis of hexamethylenetetramine synthesised from honey monosaccharides (fructose and glucose). Food Chemistry 434.

How to cite: Wozniak, J., Roy, S., Hofmann, M. E. G., Bhattacharya, J., and Hemenway, T.: Simple, Fast, and Highly Precise δ¹³C and δ²H Analysis of Organics via Dual Picarro CRDS Integration, EGU General Assembly 2026, Vienna, Austria, 3–8 May 2026, EGU26-14109, https://doi.org/10.5194/egusphere-egu26-14109, 2026.

EGU26-14217 | Posters on site | BG2.1

Seaweed is a sink for isotopically light molybdenum in temperate coastal environments 

Michael Ernst Böttcher, Vera Winde, Nadja Neubert, Patricia Roeser, and Thomas F. Nägler

The content and stable isotopic (98Mo/95Mo) composition of bladder wrack (Fucus vesiculosus) were investigated for their potential as a sink for dissolved molybdate in coastal environments. The macrophytes were grown in mesocosms fed with brackish coastal waters from a temperate coastal bay (Kiel Bight) under ambient conditions of simulated environmental stress, e.g., enhanced temperature and/or CO2 partial pressure. Conditions were set up to simulate possible future climate change scenarios applying a delta-approach. Dissolved molybdate in brackish Baltic seawater was isotopically found to be close to the open North Sea, with a slight trend towards isotopically more negative values with decreasing salinity. This is in-line with a fresh water contribution originating from weathered minerals in the catchment area. It was found that the organic tissue of Fucus vesiculosus was substantially enriched in 95Mo compared to dissolved seawater molybdate by up to -1.5 mU. Isotope fractionation was slightly enhanced by increasing temperature but no effect was observed for the other or combined treatments. Seasonal effects in the contents and isotope signatures of the tissue were observed with diminished incorporation of Mo during summer time and an associated lowered isotope signature. No clear trend in the fractionation of the different Mo isotopes can be predicted for different complex climate change scenarios, considering an increase in carbon dioxide partial pressure, in combination with temperature. Mainly temperature seems to impact Mo incorporation and associated isotope signature. A mass balance approach indicates, that the impact of Fucus growth on the total Mo budget in the coastal bight is small due to a continuous water exchange. The results for Mo in seaweed are compared to other trace elements and stable isotope signatures (C, N, S) incorporated into the tissue, too. The results from the present study demonstrate the potential of seaweed to act as an environmental multi-element biomonitor.

How to cite: Böttcher, M. E., Winde, V., Neubert, N., Roeser, P., and Nägler, T. F.: Seaweed is a sink for isotopically light molybdenum in temperate coastal environments, EGU General Assembly 2026, Vienna, Austria, 3–8 May 2026, EGU26-14217, https://doi.org/10.5194/egusphere-egu26-14217, 2026.

EGU26-14259 | Orals | BG2.1

Stable silicon isotopes as tracers of Arctic sea ice–ocean macronutrient cycling 

Georgi Laukert, Katharine Hendry, and Tristan J. Horner

Stable silicon isotopes have emerged as powerful tracers of marine biogeochemical processes, yet their application in high-latitude environments remains comparatively underexplored. Here we synthesize silicon isotope observations from the Eurasian Arctic Ocean to show how isotope patterns help disentangle physical transport, including open-ocean circulation, shelf–basin exchange, and river influence, from biological utilization across ice-covered and seasonally ice-free regimes. Using published case studies from the Siberian shelves and the Transpolar Drift, we illustrate how Si isotope signatures resolve coupled physical and biogeochemical controls on nutrient pathways. We then outline key methodological challenges for extending Si isotope work into sea ice, including defining open versus closed brine habitats, linking isotope signals to brine-network connectivity, and avoiding sampling artifacts that integrate unknown source volumes. Finally, we discuss how ongoing Arctic observing efforts, including large international campaigns, open new avenues for applying Si isotope techniques to questions of nutrient availability, ecosystem change, and ice–ocean coupling in a rapidly transforming Arctic system.

How to cite: Laukert, G., Hendry, K., and Horner, T. J.: Stable silicon isotopes as tracers of Arctic sea ice–ocean macronutrient cycling, EGU General Assembly 2026, Vienna, Austria, 3–8 May 2026, EGU26-14259, https://doi.org/10.5194/egusphere-egu26-14259, 2026.

EGU26-14404 | Orals | BG2.1

Stable isotopes in tree rings reveal the role of genetics and phenotypic plasticity in shaping water-use strategies of sessile oak across Europe 

Elisabet Martínez-Sancho, Yann Vitasse, Kerstin Treydte, Matthias Saurer, Marçal Argelich Ninot, Marta Benito-Garzón, Christof Bigler, Patrick Fonti, José Carlos Miranda, Aksel Pålsson, Anne Verstege, and Christian Rellstab

Quantifying the relative contributions of evolutionary mechanisms to tree water-use strategies is critical for predicting species’ responses to climate change and supporting forest management strategies. Common garden experiments can explicitly address the contributions of genetics and plasticity in physiological-related traits. However, these experiments typically focus on young trees, and long-term physiological measurements from common garden experiments are largely lacking. Stable isotope analysis of tree rings bridges this gap by enabling the reconstruction of long-term water-use strategies of mature trees growing in long-term common garden experiments.

In this study, we investigate the evolutionary mechanisms underlying long-term water-use strategies in Quercus petraea across its distribution range by analysing annually-resolved stable isotope ratios (δ¹³C, δ¹⁸O, δ²H) from tree-ring cellulose. We sampled 234 individuals originating from nine provenances grown in four European common gardens (Denmark, France, Poland, and the United Kingdom). For the period 2012–2021, we derived annual carbon isotope discrimination (∆¹³C), intrinsic water-use efficiency (iWUE), and isotopic enrichment relative to precipitation (∆¹⁸O and ∆²H). Linear mixed-effects models were used to quantify the contributions of genetic variation, phenotypic plasticity, and its interaction (i.e. genetically-based plasticity) to variation in iWUE, ∆¹⁸O, and ∆²H. The dual-isotope approach (δ¹³C and ∆¹⁸O) was applied to investigate the provenance-specific adjustments in photosynthetic rate and stomatal conductance across sites.

Our results revealed significant genetic and genetically-based plasticity effects on all isotope ratios whereas phenotypic plasticity had a significant effect only on ∆²H. ∆¹⁸O and ∆²H exhibited distinct patterns related to genetics and phenotypic plasticity effects. Notably, ∆²H variability across sites exceeded provenance-level variation. These results could be indirectly related to the link of ∆²H to primary C metabolism. The dual-isotope analysis (δ¹³C and ∆¹⁸O) further identified adjustments in stomatal conductance as the main plastic response to contrasting environments. The provenance with the least plasticity (originally from the United Kingdom) also showed reductions in photosynthetic rates, indicating a limited capacity to adjust to contrasting environments. Overall, these findings highlight strong genetic and plastic control in water-use traits and demonstrate the potential of stable isotopes in tree rings to unravel evolutionary mechanisms in tree water-use strategies.

How to cite: Martínez-Sancho, E., Vitasse, Y., Treydte, K., Saurer, M., Argelich Ninot, M., Benito-Garzón, M., Bigler, C., Fonti, P., Miranda, J. C., Pålsson, A., Verstege, A., and Rellstab, C.: Stable isotopes in tree rings reveal the role of genetics and phenotypic plasticity in shaping water-use strategies of sessile oak across Europe, EGU General Assembly 2026, Vienna, Austria, 3–8 May 2026, EGU26-14404, https://doi.org/10.5194/egusphere-egu26-14404, 2026.

EGU26-15347 | Orals | BG2.1

Gallium isotopes in silicified microbial hot spring deposits: a potential geochemical biosignature 

Michael C. Rowe, Tak Kunihiro, Ryoji Tanaka, Nghiem V. Dao, Tsutomu Ota, Kathleen A. Campbell, Steven W. Ruff, Ema E. Nersezova, Dominique Stallard, Barbara Lyon, and Andrew Langendam

Non-traditional trace metals are increasingly utilized to evaluate potential microbial processes in the search for evidence of ancient life. Recent investigations of modern terrestrial hot spring silica deposits (sinter), as analogs for early life on Earth or Mars (e.g. Homeplate, Gusev crater), have highlighted unique gallium enrichments associated with silicified microbial filaments and microbially mediated rock textures, such as stromatolites. We used new analytical methodologies for in situ and bulk analysis of gallium isotopes in sinter to better understand the observed Ga enrichment. In situ analysis, by Cameca 1280 ion probe, provides the necessary spatial resolution to target individual microbial filaments with a 10 μm ion beam, but with a lesser precision of ~±3 ‰, compared to the ±0.06 ‰ precision via MC-ICPMS bulk analysis. In situ results indicate heterogeneity of δ71Ga (>10 ‰ variation overall) with silicified microbial filaments on average isotopically lighter than adjacent silica.  Multiple processes may influence the Ga isotopic ratio in sinter including preferential microbial selection, changes in fluid chemistry, and silicification processes. Ongoing experiments on Ga-Si spiked microbial growth and abiotic silica precipitation may further elucidate the cause of isotopic variability as we continue to refine this in situ isotopic methodology and its utility in planetary biosignature detection.

How to cite: Rowe, M. C., Kunihiro, T., Tanaka, R., Dao, N. V., Ota, T., Campbell, K. A., Ruff, S. W., Nersezova, E. E., Stallard, D., Lyon, B., and Langendam, A.: Gallium isotopes in silicified microbial hot spring deposits: a potential geochemical biosignature, EGU General Assembly 2026, Vienna, Austria, 3–8 May 2026, EGU26-15347, https://doi.org/10.5194/egusphere-egu26-15347, 2026.

EGU26-15473 | ECS | Posters on site | BG2.1

Humidity Signal Recorded in δ¹³C of Pine Resin and Leaves in Southwestern China 

Yu Tang, Jiangpeng Cui, Katja T. Rinne-Garmston, and Shilong Piao

Stable carbon isotope compositions (δ13C) in plant materials are an important tool to study variations in the environment that plants live in. δ13C in resin has been less explored than in other extensively studied materials, e.g. tree rings, leaves and n-alkanes, with its temporal and spatial variability poorly quantified. Here, we sampled resin from the breast-height stem and leaves at the lower canopy across 80 pine forest plots in Southwestern China (~ 800,000 km2), and examined the climatic signal recorded in δ13C in resin and leaves. Our results show a clear humidity signal (e.g. precipitation and aridity index) recorded in resin δ13C, much stronger than that preserved in leaf δ13C. The climatic signal was strongest when averaged over the previous two growing seasons, suggesting an average turnover time of two years in the stem resin pool. Our results highlight that resin δ13C is a promising indicator for spatial variability in climatic signals, so resin can serve as a practical alternative to leaves for δ13C-based studies.

How to cite: Tang, Y., Cui, J., Rinne-Garmston, K. T., and Piao, S.: Humidity Signal Recorded in δ¹³C of Pine Resin and Leaves in Southwestern China, EGU General Assembly 2026, Vienna, Austria, 3–8 May 2026, EGU26-15473, https://doi.org/10.5194/egusphere-egu26-15473, 2026.

EGU26-15760 | Orals | BG2.1

Sub-continental patterns of carbon-isotope discrimination across Australia in relation to precipitation and soil nutrients 

Lucas Cernusak, Iftakharul Alam, Graham Farquhar, Thomas Givnish, Martin De Kauwe, Ernst-Detlef Schulze, Andrea Westerband, Ian Wright, and Alexander Cheesman

Carbon isotope ratios of C3 plants can been used to infer intrinsic water-use efficiency. Several transects have been established across Australia to study the sensitivity of intrinsic-water use efficiency to mean annual precipitation. These investigations showed a surprising divergence in the sensitivity of carbon-isotope discrimination to mean annual precipitation among sub-continental regions. Here, we combine previous observations with measurements along a new transect in northeastern Australia to show that such sub-continental scale sensitivity in the response of intrinsic water-use efficiency to precipitation depends on regional-scale soil phosphorus concentrations. The influence of soil phosphorus appears to operate through modulation of stomatal conductance, rather than, or in addition to, photosynthetic capacity. We hypothesize that Australian woody plant species have evolved to use high transpiration rates to facilitate phosphorus foraging in phosphorus-impoverished, ancient soils. Our analyses suggest that this strategy interacts with the well know strategy of increasing intrinsic water-use efficiency in response to decreasing mean annual precipitation.

How to cite: Cernusak, L., Alam, I., Farquhar, G., Givnish, T., De Kauwe, M., Schulze, E.-D., Westerband, A., Wright, I., and Cheesman, A.: Sub-continental patterns of carbon-isotope discrimination across Australia in relation to precipitation and soil nutrients, EGU General Assembly 2026, Vienna, Austria, 3–8 May 2026, EGU26-15760, https://doi.org/10.5194/egusphere-egu26-15760, 2026.

EGU26-20124 | ECS | Posters on site | BG2.1

In situ δ13C analysis of <1mm thick annual growth rings in archaeological wood samples via LA IRMS 

Hanne Marie Ellegaard Larsen, Ciprian Cosmin Stremtan, Cristina Montana Puscas, and Jesper Olsen

Archaeological wood holds value not only as a source of information on how people used to live centuries or millennia ago, it is also a valuable proxy for reconstructing past climatic and environmental changes. When the sample amount available for destructive analytical methods is limited it forces the research team to judiciously prioritize what information to extract and which method to use. When it comes to light stable isotope analyses, the most widely used instrumentation requires rather intensive manual sample preparation and the prepared sample cannot be recuperated after analyses.

The elemental analyzer is currently the go-to sample introduction peripheral for stable isotope analyses of tree rings, but as any analytical method it has its draw-backs and limitations. A key limitation is that each growth ring must be individually separated mechanically and prepared for analysis; this challenge can be managed with sufficient time and manpower. However, very narrow growth rings (<1mm) are a clear limiting factor when each ring needs to be manually removed or when multiple analysis are required for each growth ring. Both issues can easily be circumvented by using a laser ablation (LA) module as sample introduction peripheral. Core segments or wood slices of up to 4.5 cm length can be analyzed in situ (including duplicates and triplicates) without further preparation. For archaeological wood, this method has the added benefits of being minimally invasive, the ablation tracks being practically invisible, and circumventing the need to sacrifice a portion of the artifact for analyses.

Our case study is a fragment of oak wood (Quercus sp.) provided by the National Museum of Denmark. The wood originates from construction timber found during an archaeological excavation of wells located near The Wadden Sea in south-west Denmark. The whole sample contains 199 growth rings and has been dendrochronologically dated to AD 407-605, covering the mid-sixth century where a global climate crisis caused a longer period of cold and wet growth seasons; this is also expressed in archaeological wood by the formation of extremely narrow growth rings. Because of growth ring widths down to 0.49 mm, it is challenging to separate and prepare wood material from each ring for stable isotope analyses using the traditional EA IRMS method.

Our LA IRMS setup comprises the isoScell Δ100 sample chamber (Terra Analitic), LSX 213 G2+ (Teledyne Photon Machines), CryoPrep and HS2022 IRMS (both Sercon). For δ13C a spatial resolution of 60μm is easily achievable, with precision on the QC of 0.08 ‰. Mean δ13C on the analyzed segment is -24.17 ‰ v. VPDB. The dataset is also in acordance with data from wider rings that could be analyzed via EA IRMS.

How to cite: Ellegaard Larsen, H. M., Stremtan, C. C., Puscas, C. M., and Olsen, J.: In situ δ13C analysis of <1mm thick annual growth rings in archaeological wood samples via LA IRMS, EGU General Assembly 2026, Vienna, Austria, 3–8 May 2026, EGU26-20124, https://doi.org/10.5194/egusphere-egu26-20124, 2026.

EGU26-20589 | Orals | BG2.1

Mercury and selenium stable isotopes across contrasting food webs: marine insights, amazon priorities 

Zoyne Pedrero Zayas, Claudia Marchan Moreno, Silvia Queipo Abad, Gabriel Neves, Fernando Barbosa Jr., Warren Corns, Yves Cherel, Paco Bustamante, David Amouroux, Pascale Louvat, and Maite Bueno

Stable isotope approaches are rapidly transforming how we investigate trace-element cycling in living systems, offering information that goes far beyond concentration measurements. Mercury (Hg) stable isotopes, in particular, have proven highly informative across a broad range of environments, and marine studies have highlighted their value for disentangling sources and in vivo processing. Studies on apex marine predators (e.g., seabirds) show that Hg isotopes can track internal processing and trophic transfer. In contrast, selenium (Se) isotopic characterization in biota, more specifically in animals, is still limited and technically challenging, but it opens promising perspectives, especially given Se’s recognized antagonistic role in Hg toxicity.

Key gaps persist in the Brazilian Amazon, where complex Hg (and Se) exposure scenarios call for higher-resolution tracers. Translating Hg and Se isotope approaches to Amazonian freshwater systems, from fish to riverside populations, may clarify bioaccumulation pathways and fate. Recent progress achieved in marine organisms, including compound-specific strategies, will be presented, together with the main analytical challenges and opportunities for extending these approaches to the Amazon.

How to cite: Pedrero Zayas, Z., Marchan Moreno, C., Queipo Abad, S., Neves, G., Barbosa Jr., F., Corns, W., Cherel, Y., Bustamante, P., Amouroux, D., Louvat, P., and Bueno, M.: Mercury and selenium stable isotopes across contrasting food webs: marine insights, amazon priorities, EGU General Assembly 2026, Vienna, Austria, 3–8 May 2026, EGU26-20589, https://doi.org/10.5194/egusphere-egu26-20589, 2026.

EGU26-20811 | ECS | Posters on site | BG2.1

Cd isotopes under extreme euxinia: Tracing productivity and redox in palaeo-oceans 

Sophie Gangl, Claudine Stirling, Don Porcelli, Matt Druce, and Malcolm Reid

Cadmium (Cd) exhibits nutrient-type behaviour in the modern ocean and its isotope system has emerged as a promising tracer of primary productivity and carbon burial. Phytoplankton preferentially assimilate lighter Cd isotopes across a wide range of oceanic conditions, leaving surface waters comparatively enriched in heavier isotopes. This biologically-driven fractionation underlies the application of Cd-isotope ratios as a tracer for nutrient availability and the intensity of primary productivity in both modern marine settings and  palaeo-oceans. However, Cd-isotope systematics are also strongly influenced by redox conditions, specifically through the formation and removal of isotopically light Cd sulphides under euxinic conditions. The extent to which sedimentary Cd-isotope signatures faithfully record overlying water-colum processes under such conditions remains poorly constrained.

Here we present new Cd-isotope data from both the water column and sediments of Framvaren Fjord in Norway, the most intensely reducing modern marine basin. Framvaren Fjord serves as a modern analogue for strongly euxinic marine conditions that prevailed during extreme climate events throughout Earth’s history. Notably, the redoxline separating oxic from anoxic waters is uniquely located within the photic zone, in close proximity to the depth of maximum biological productivity. These data allow us to deconvolve Cd-isotope fractionation associated with biological uptake from that linked to Cd sulphide precipitation, and to shed light on how these processes are transferred to and preserved in the underlying sediment.

How to cite: Gangl, S., Stirling, C., Porcelli, D., Druce, M., and Reid, M.: Cd isotopes under extreme euxinia: Tracing productivity and redox in palaeo-oceans, EGU General Assembly 2026, Vienna, Austria, 3–8 May 2026, EGU26-20811, https://doi.org/10.5194/egusphere-egu26-20811, 2026.

The increasing demand for reliable food authentication highlights the need for scalable and innovative tools to link geochemical fingerprints in food products with their geographic provenance. Food authentication is not only essential for preventing fraud but also offers a unique opportunity to relate agricultural products to their underlying geochemical signatures. Here we present a unified framework that combines stable isotopes (e.g. ⁸⁷Sr/⁸⁶Sr) and trace-element fingerprints measured in food products with explainable and cost-aware machine learning to support provenance verification.


We first develop a cost-aware binary classification model for French sparkling wines, demonstrating how high-precision ⁸⁷Sr/⁸⁶Sr ratios can be partially substituted by low-cost elemental proxies (e.g. Rb) while maintaining strong discriminative power. To address scalability constraints, we extend this approach to a multiclass setting using cost-sensitive logistic regression to classify wines from multiple Portuguese and Chilean regions, explicitly handling class imbalance and feature redundancy. Finally, we introduce TeaPrint, an unsupervised multimodal clustering framework that jointly integrates isotopic, elemental and volatile organic compound data to uncover coherent regional geochemical patterns in international tea samples without requiring prior labels.


Across these case studies, we show that food products carry integrated geochemical signatures that can be exploited for robust provenance authentication across heterogeneous datasets. By bridging forensic geochemistry and explainable machine learning, our approach offers a cost-efficient and scalable pathway towards robust provenance authentication and transparent food supply chains.

How to cite: Lu, Y., Doerr, C., and Sebilo, M.: From Geochemical Fingerprints to Food Authentication: Integrating Explainable and Cost-Aware Machine Learning for Provenance Analysis , EGU General Assembly 2026, Vienna, Austria, 3–8 May 2026, EGU26-21380, https://doi.org/10.5194/egusphere-egu26-21380, 2026.

EGU26-21521 | Posters on site | BG2.1

Hydrogen Isotope Dynamics in Macrocystis pyrifera: Implications for Compound-Specific Isotope Analyses 

Mohammad Ali Salik, Marc-Andre Cormier, Diana Steller, Marco Lehmann, Maya Al-Sid-Cheikh, and Patrick Gagnon

Marine macroalgae are central to coastal carbon cycling and represent a significant portion of global primary production and organic matter export. Giant kelp (Macrocystis pyrifera) forests, in particular, serve as major carbon sinks and influence regional nutrient dynamics. However, the isotopic and biochemical pathways that define these contributions remain poorly constrained. While hydrogen isotope (δ²H) analyses are widely utilised in terrestrial ecology to integrate environmental water signals and metabolic fractionation, their application in marine macroalgae, particularly at the compound-specific level, currently remains underutilised.

Our previous research demonstrated that δ²H values in the soluble sugars of M. pyrifera are highly sensitive to light intensity, which indicates a distinct metabolic imprint tied to photosynthetic carbohydrate supply. We have now expanded this investigation to include lipid biomarkers, specifically focusing on fatty acids (analysed as methyl derivatives) and sterols (analysed as acetate derivatives). Samples were collected across six kelp forest sites in Carmel Bay, California. Preliminary Gas Chromatography-Mass Spectrometry results from three fully processed sites show complex profiles of C12–C26 saturated and unsaturated fatty acids, alongside a range of cholest-, ergost-, and stigmast-based sterols. These molecular distributions vary systematically with site and depth, offering early evidence of biochemical partitioning between photosynthetic and post-photosynthetic pathways under varying natural light regimes.

This presentation will explore new compound-specific δ²H measurements performed on the aforementioned compounds. By doing so, we aim to determine whether δ²H signatures in fatty acids and sterols primarily track photosynthetic fractionation or are shaped by downstream metabolic adjustments. By synthesising isotopic and molecular data, we seek to disentangle external environmental drivers, such as light and water isotopic composition, from intrinsic biochemical controls on compound-specific δ²H values. Refining these relationships is vital for the development of robust δ²H-based paleoenvironmental proxies and for assessing the role of modern and ancient kelp forests as dynamic carbon sinks.

How to cite: Salik, M. A., Cormier, M.-A., Steller, D., Lehmann, M., Al-Sid-Cheikh, M., and Gagnon, P.: Hydrogen Isotope Dynamics in Macrocystis pyrifera: Implications for Compound-Specific Isotope Analyses, EGU General Assembly 2026, Vienna, Austria, 3–8 May 2026, EGU26-21521, https://doi.org/10.5194/egusphere-egu26-21521, 2026.

EGU26-21817 | Orals | BG2.1

Application of EA-IRMS and a LA-GHG-IRMS approach for high-resolution carbon and oxygen isotope analysis in woody biomass 

Irene Tunno, Silvia Portarena, Pasquale Carlino, Ciprian Stremtan, Dario Papale, and Carlo Calfapietra

Isotopic analyses of carbon (δ¹³C) and oxygen (δ¹⁸O) are widely applied in biogeosciences to investigate biogeochemical cycles, ecosystem functioning, and environmental dynamics. Elemental analyzer-isotope ratio mass spectrometry (EA-IRMS) represents one of the most widely applied systems for bulk samples. The laser ablation-IRMS (LA-IRMS) provides the possibility to resolve spatial and temporal variability at high resolution, but also presents some limitations due to gas handling, signal stability, and analytical comparability with conventional approaches.

For this study, we present a methodological comparison between δ¹³C and δ¹⁸O measurements obtained using EA-IRMS and an improved LA-IRMS configuration. In our configuration, the LA is coupled with the IRMS through a greenhouse gas (GHG) analyzer specifically modified to concentrate, purify, and stabilize CO₂ and CO generated during ablation to improve the gas signal for isotope measurements.

Analyses were conducted on hazelnut (Corylus avellana L.) wood slices for EA-IRMS and tree-ring increments for LA-GHG-IRMS. The comparison between the two methods showed main differences related to sampling resolution and analytical configuration. The LA-GHG-IRMS system provided high-resolution isotope measurements that allowed investigations of intra-seasonal patterns.

The application of the LA-GHG-IRMS system extends the analytical utility of laser-based stable isotope measurements in biogeosciences, providing new opportunities for high-resolution studies of ecological processes in terrestrial ecosystems.

How to cite: Tunno, I., Portarena, S., Carlino, P., Stremtan, C., Papale, D., and Calfapietra, C.: Application of EA-IRMS and a LA-GHG-IRMS approach for high-resolution carbon and oxygen isotope analysis in woody biomass, EGU General Assembly 2026, Vienna, Austria, 3–8 May 2026, EGU26-21817, https://doi.org/10.5194/egusphere-egu26-21817, 2026.

Research on the nitrogen (N) cycle in agricultural ecosystem is key to better understand and manage N nutrition of crops and N losses to the environment. Stable isotope tools have been extensively used to identify and quantify N pathways and processes, but suitable methods typically require sophisticated and expensive instrumentation which is not always available and is rarely suitable for in situ analysis. A quadrupole mass spectrometer (GAM200, InProcess, Bremen) was modified to study 15N enrichment in N species and N2 in water and air in the lab and in the field. To establish a membrane inlet mass spectrometer (MIMS) a silicone tubing inlet was added to enable online analysis of dissolved gases. Four applications were established:


  • The MIMS was used to analyze N2 and Ar in groundwater samples to determine excess-N2 from denitrification. In situ online analysis in the Fuhrberger Feld aquifer was conducted at multilevel groundwater monitoring wells, clearly identifying the steep rise in denitrification upon appearance of sulfides.
  • To study N2 production by denitrification the in situ 15N push pull method [1] was used, where 15N labelled NO3- solution is injected to groundwater and subsequently samples containing 15N labelled N2 are analyzed, in this study by the MIMS. This method was automated and tested in lab mesocosms [2].
  • An automated sample preparation unit for inorganic nitrogen (SPIN) was coupled to the MIMS for automated and sensitive determination of the 15N abundances and concentrations of nitrate, nitrite, and ammonium in aqueous solutions. It was based on the principle of the SPIN-MAS [3] but with the advantage to analyze samples online. It provides a wide dynamic range for all three N species for both isotope abundance and concentration measurements [4, 5]. We propose to use this method in conjunction with online sampling of dissolved N species in soil using dialysis membranes [6] which had not been performed until now to our knowledge.
  • The improved 15N gas flux method to measure N2 fluxes from soils under N2 depleted atmosphere has been applied int the field [7] but was complicated by the difficulty to maintain stable background concentrations [8]. A capillary inlet was added to the GAM 200 and used for in situ monitoring of background N2 concentrations in flux chambers.


We conclude the used quadrupole mass spectrometer has been proven as a versatile, economic and easy to use detector for a wide range of applications in N cycle research and is promising for future applications.


References:

  • Well, R. and D.D. Myrold, 1999. doi.org/10.1016/S0038-0717(99)00029-22.
  • Eschenbach, W. and R. Well DOI: 10.1002/rcm.5066
  • Stange, C.F. et al. ,2007 DOI: Doi 10.1080/10256010701550658
  • Eschenbach, W. 2018, DOI: 10.1021/acs.analchem.8b02956
  • Eschenbach, W. et al 2017 DOI: 10.1021/acs.analchem.7b00724
  • Inselsbacher, E., et al. 2011, doi.org/10.1016/j.soilbio.2011.03.003
  • Well, R., et al 2019 doi.org/10.1002/rcm.83638.
  • Eckei, J., et al., 2024. DOI: 10.1007/s00374-024-01806-z


How to cite: Dyckmans, J. and Well, R.: Using a quadrupole mass spectrometer as versatile detector to study N transformations and fluxes  in soils and aquatic systems, EGU General Assembly 2026, Vienna, Austria, 3–8 May 2026, EGU26-21873, https://doi.org/10.5194/egusphere-egu26-21873, 2026.

Subtropical forest soils are global hotspots of nitrous oxide (N2O) emissions and are increasingly exposed to extreme meteorological variation. Episodic drying-rewetting events can strongly alter N cycling, yet the mechanisms by which event-scale precipitation frequency at constant precipitation amount regulate N2O production and reduction in N-saturated forests remain poorly constrained. Here, we conducted an in-situ precipitation simulation after a summer drought at the Tieshanping forest site in Southwest China under three treatments: Control without adding water, single heavy precipitation event (30 mm on the first day), and multiple precipitation event (10 mm d−1 over the first three days; same total amount as the single precipitation event).

We measured N2O fluxes together with the natural abundance N2O isotopes, δ15Nbulk and δ15NSP (i.e. 15Nα15Nβ), as well as soil moisture, KCl-extractable mineral N and water-extractable organic carbon. Isotopocule-based mapping and end-member mixing were used to partition production pathways and quantify the N2O reduction to N2. The single precipitation event rapidly increased water-filled pore space (WFPS) to more than 90% and triggered a pronounced N2O emission peak (more than 200 μg N m−2 h−1) which was dominated by denitrification, while N2O reduction remained limited. Under multiple precipitation events, the peak N2O flux was delayed and followed by strong negative fluxes (−130 μg N m−2 h−1), accompanied by a marked increase in δ15NSP (~40‰), indicating enhanced N2O reduction. Notably, cumulative N2O emissions during this 5-day simulation were highest under single precipitation events (5 mg N m−2), followed by control treatment and multiple precipitation events (3.7 and 0.8 mg N m−2, respectively).

Across all treatments, soil moisture together with availability of soil nitrate and labile carbon controlled the shifts in N2O sources and sinks we observed. Our findings provide process-level constraints on how event-scale precipitation frequency reshape N2O source-sink dynamics in N-saturated subtropical forests, and highlight the importance of incorporating precipitation frequency and intensity into predictions of forest N2O responses under future extreme climate events.

How to cite: Zhang, B., Yu, L., Wang, Y., and Homyak, P.: Precipitation frequency constrains N2O source-sink dynamics in an N-saturated subtropical forest: Insights from natural abundance N2O isotopes, EGU General Assembly 2026, Vienna, Austria, 3–8 May 2026, EGU26-407, https://doi.org/10.5194/egusphere-egu26-407, 2026.

EGU26-2292 | Orals | BG2.2

Tracing anthropogenic nitrogen deposition in Southeast Asian megacities: Isotopic evidence from Singapore and Ho Chi Minh City  

Shaoneng He, Tian-Hao Su, Xia-Yan Zhang, Kun Zhang, Thi Hiend To, Xianfeng Wang, and Xue-yan Liu

Rapid urbanization and industrialization in Southeast Asia have substantially increased emissions of reactive nitrogen (N), raising concerns over atmospheric nitrogen deposition and its environmental impacts in the region. Here, we combine nitrogen stable isotopes measurements with precipitation chemistry and flux observations to investigate the magnitude and sources of wet nitrogen deposition in two major cities, Singapore (SG) and Ho Chi Minh City (HCMC).  Both SG and HCMC exhibit high annual wet nitrogen deposition fluxes of 31.3 and 30.4 kg N ha-1 yr-1, respectively, with ammonium (NH4+) and nitrate (NO3-) as dominant components. Isotope mixing models indicate comparable contributions from fossil and non-fossil fuel sources to NOx emissions in both cities. In SG, combustion-related NH3 sources account for ~66% of NH4+ deposition, whereas in HCMC, volatilized sources such as agriculture and waste play a more significant role. Dissolved organic nitrogen was primarily attributed to biogenic emissions, including plant debris. Seasonal variations in deposition are associated with monsoon-driven transboundary transport, reflecting the regional coupling of nitrogen emissions and deposition. Our findings demonstrate the strong influence of anthropogenic activities and cross-border pollutant transport on nitrogen deposition in tropical megacities, with implications for targeted emission control strategies in rapidly urbanizing regions.

How to cite: He, S., Su, T.-H., Zhang, X.-Y., Zhang, K., To, T. H., Wang, X., and Liu, X.: Tracing anthropogenic nitrogen deposition in Southeast Asian megacities: Isotopic evidence from Singapore and Ho Chi Minh City , EGU General Assembly 2026, Vienna, Austria, 3–8 May 2026, EGU26-2292, https://doi.org/10.5194/egusphere-egu26-2292, 2026.

EGU26-4959 | ECS | Orals | BG2.2

Clumped Isotopes in Source-rock Methane as an Improved Geothermometer for Reconstructing the Thermal History of Sedimentary Sequences 

Jan Meissner, Nico Kueter, Naizhong Zhang, Thorsten Bauersachs, Donka Macherey, Lukas Emmenegger, Joachim Mohn, and Stefano Bernasconi

Thermogenic methane is generated by the thermal breakdown of organic matter during the deep burial of sedimentary sequences. The two doubly substituted (or “clumped”) methane isotopologues, 13CH3D and 12CH2D2, can be used as a geothermometer to reconstruct the gas’s formation temperatures; however, the exact mechanisms controlling methane clumped-isotopic compositions remain unclear(1).

Recent field-based clumped-isotope studies of thermogenic methane primarily relied on samples taken from natural gas reservoirs and oil fields(2, 3). In such settings, reservoir mixing and other kinetic isotope effects (e.g., from leakage or extraction) can distort primary equilibrium signals, thereby biasing the derived clumped-isotope temperatures(1).

Here, we present a new approach to methane clumped-isotope thermometry, which involves the direct recovery and analysis of methane from occluded porosity in source rocks. Because the gas analyzed formed and remained in situ, the clumped-isotope signal obtained is less likely to be altered by post-generation processes than that of reservoir gases, potentially enhancing the reliability of these geothermometers.

Source-rock methane is recovered and purified through acid digestion, amine-based CO2 (and H2S) removal, and cryogen-aided gas chromatographic separation prior to methane bulk and clumped isotope analysis by quantum-cascade laser absorption spectroscopy (QCLAS)(4).

Preliminary methane clumped-isotope data were acquired from bituminous Triassic source rocks (limestones and dolomites) collected along a Southern Alps transect (northern Italy), for which independently-constrained burial temperatures range from less than 100°C to over 250°C(5). The obtained ∆13CH3D and ∆12CH2D2 values are consistent with methane formation under thermodynamic equilibrium conditions. However, the inferred formation temperatures are generally lower than expected peak burial temperatures at the respective locations along the transect. We benchmark these temperatures against carbonate clumped-isotope thermometry and established thermal-maturity proxies, including vitrinite/solid-bitumen reflectance and pyrolysis Rock-Eval Tmax. Interpreting these constraints within the well-studied thermal history of the Southern Alps allows us to further evaluate the utility of clumped isotopes in source-rock methane as an improved geothermometer for reconstructing the thermal evolution of sedimentary basins.


References

(1) Stolper, D.A., Lawson, M., Formolo, M.J., et al. (2018). The utility of methane clumped isotopes to constrain the origins of methane in natural gas accumulations. In: Lawson, M., Formolo, M.J., & Eiler, J.M. (eds). From Source to Seep: Geochemical Applications in Hydrocarbon Systems. Geological Society, London, Special Publications, 468, 23–52.

(2) Stolper, D., Lawson, M., Davis, C., et al. (2014). Formation temperatures of thermogenic and biogenic methane. Science, 344, 1500–1503.

(3) Young, E.D., Kohl, I.E., Sherwood Lollar, B., et al. (2017). The relative abundances of resolved 12CH2D2 and 13CH3D and mechanisms controlling isotopic bond ordering in abiotic and biotic methane gases. Geochimica et Cosmochimica Acta, 203, 235–264.

(4) Zhang, N., Prokhorov, I., Kueter, N, et al. (2025). Rapid high-sensitivity analysis of methane clumped isotopes (Δ13CH3D and Δ12CH2D2) using mid-infrared laser spectroscopy. Analytical Chemistry, 97, 1291–1299.

(5) Fantoni, R. & Scotti, P. (2003). Thermal record of the Mesozoic extensional tectonics in the Southern Alps. Atti Ticinensi di Scienze della Terra, 9, 96–101.

How to cite: Meissner, J., Kueter, N., Zhang, N., Bauersachs, T., Macherey, D., Emmenegger, L., Mohn, J., and Bernasconi, S.: Clumped Isotopes in Source-rock Methane as an Improved Geothermometer for Reconstructing the Thermal History of Sedimentary Sequences, EGU General Assembly 2026, Vienna, Austria, 3–8 May 2026, EGU26-4959, https://doi.org/10.5194/egusphere-egu26-4959, 2026.

EGU26-6762 | Posters on site | BG2.2

Differentiating anthropogenic and geogenic carbon dioxide (CO2) sources in urban and volcanic environments. Case studies from Sicily (Italy), La Palma and Tenerife (Canary Islands, Spain) 

Roberto M. R. Di Martino, Sergio Gurrieri, Marcello Liotta, Nemesio M. Pérez, María Asensio-Ramos, Eleazar Padrón, Gladys V. Melián, Pedro A. Hernández, Carla Méndez-Pérez, Germán D. Padilla, and Beverley C. Coldwell

Although our ability to reconstruct precise atmospheric carbon dioxide (CO2) levels is currently limited to the last 800,000 years, CO2 has played a fundamental role in regulating Earth's climate and biosphere evolution since the Precambrian.

A significant rise in airborne CO2 began with the industrial revolution, driven largely by the byproduct release of hydrocarbon combustion. The resulting increase in tropospheric CO2 concentrations has led to global warming and associated climate change impacts, including rising sea levels, extreme weather events, and biodiversity loss. Urban areas, as major consumers of fossil fuels, are key contributors to rising emissions. However, in geologically active regions, natural volcanic (geogenic) emissions also contribute significantly to the local carbon budget. In such mixed environments, measurements of bulk CO2 concentration alone cannot resolve the source apportionment between geogenic and anthropogenic origins. Consequently, a combination of concentration measurements and stable isotope analysis is required to distinguish these sources effectively.

This study monitors the stable isotope composition and concentration of CO2 in Sicily (Italy) and Canary Islands (Spain). Laser-based isotope analyzers were deployed onsite to detect various CO2 isotopologues. Each instrument measured the various isotopologues of CO2 (e.g., COO, 13COO, and C18OO), and total CO2 concentration. Measurements were conducted at Palermo, in the Madonie Mountains, Puerto Naos (La Palma), and Puerto de la Cruz (Tenerife). Data were referenced hourly and calibrated daily using standard reference materials, achieving an accuracy of ± 0.25‰ for isotope compositions and ±1 ppmv for concentration.

We present a comparison of CO2 isotope compositions across diverse environmental settings. The results demonstrate that volcanic and anthropogenic emissions can be successfully distinguished based on the carbon isotope signature (δ13C-CO2) of atmospheric CO2. Furthermore, variations in both concentration and isotope composition related to latitude (sub-tropical to mid-latitude) and altitude (sea level to approximately one-hundred meters above sea level) were investigated. These findings highlight the necessity of dual-tracer monitoring (concentration and isotopes) in volcanic and urban regions to evaluate greenhouse gas emission dynamics, inform climate mitigation strategies, and assess environmental health risks.

How to cite: Di Martino, R. M. R., Gurrieri, S., Liotta, M., Pérez, N. M., Asensio-Ramos, M., Padrón, E., Melián, G. V., Hernández, P. A., Méndez-Pérez, C., Padilla, G. D., and Coldwell, B. C.: Differentiating anthropogenic and geogenic carbon dioxide (CO2) sources in urban and volcanic environments. Case studies from Sicily (Italy), La Palma and Tenerife (Canary Islands, Spain), EGU General Assembly 2026, Vienna, Austria, 3–8 May 2026, EGU26-6762, https://doi.org/10.5194/egusphere-egu26-6762, 2026.

EGU26-7145 | Posters on site | BG2.2

Development of a Highly Sensitive Laser-Induced Fluorescence Instrument for Isotopologue-resolved Measurements of Atmospheric Nitric Oxide.  

Joanna Alden, Yves Perrette, Quentin Berthome, Basile Faure, Gregoire Souhaité, Graham Boustead, and Ilann Bourgeois

Nitrogen (N) oxides (NOx= NO + NO2) are central to both climate and air quality, acting as short-lived climate forcers while driving the formation of harmful pollutants such as tropospheric ozone (O3) and particulate matter. Although fossil fuel combustion dominates global NO emissions, natural sources—including terrestrial and aquatic ecosystems—contribute an estimated 20–30% to the atmospheric NO budget.1 These natural sources remain poorly constrained, limiting confidence in surface ozone projections under future climate scenarios. Global and regional models are thought to under-estimate terrestrial contributions, particularly from soils, due to poor representation of these sources in emission inventories. Freshwater ecosystems have been considered negligible and are entirely absent from the IPCC AR6 assessment. Improved characterisation of natural NOx emissions requires new measurement approaches capable of distinguishing between different emission sources.

Isotopic analysis of N species provides a powerful tool for source attribution and process identification, as different emission pathways can imprint distinct isotopic composition. We present the development of a laser-induced fluorescence (LIF) instrument for highly sensitive, isotopologue-resolved measurement of atmospheric nitric oxide. The instrument uses a Cavity PQS Nd:YAG Cr⁴⁺:YAG microlaser with precise wavelength control near 214.8 nm to selectively excite ¹⁴N¹⁶O, ¹⁵N¹⁶O, and ¹⁴N¹⁸O by probing distinct rovibrational transitions. Through off-resonance fluorescence detection, the instrument is designed to enable differentiation of isotopologues without signal overlap, providing near-simultaneous, real-time quantification. We expect to achieve sub-pptv sensitivity, enabling measurements of natural NOx emissions in remote environments. Future perspectives include the isotopic fingerprinting of biotic and abiotic NO emissions, with broad applicability in aquatic and terrestrial biogeochemistry studies.

[1] Jaeglé et al. (2005) Faraday Discussions DOI: 10.1039/B502128F

How to cite: Alden, J., Perrette, Y., Berthome, Q., Faure, B., Souhaité, G., Boustead, G., and Bourgeois, I.: Development of a Highly Sensitive Laser-Induced Fluorescence Instrument for Isotopologue-resolved Measurements of Atmospheric Nitric Oxide. , EGU General Assembly 2026, Vienna, Austria, 3–8 May 2026, EGU26-7145, https://doi.org/10.5194/egusphere-egu26-7145, 2026.

EGU26-8150 | ECS | Orals | BG2.2

An intermediary scale setup to measure O2 fractionation factors of aquatic biosphere and application to the interpretation of the δ18O of O2 records found in deep ice cores. 

Nicolas Bienville, Amaelle Landais, Sarah Fiorini, Clément Piel, Joana Sauze, Benoit Lemaire, Nicolas Geyskens, Frédéric Prie, Olivier Jossoud, Clémence Paul, Justin Chaillot, Simon Chollet, Samuel Abiven, and Arnaud Dapoigny

Earth atmospheric O2 is mainly produced by biosphere photosynthesis, and biosphere respiration is also one of the main consumers of this gas. The evolution of atmospheric O2 is thus linked to global biosphere productivity, and in particular the isotopic composition of O218O and δ 17O). Quantitative interpretation of the isotopic composition of O2 in the past relies on robust estimate of oxygen fractionation coefficients associated with the relevant biological processes: photosynthesis and respiration. In the past decades, some determinations of these biological fractionation coefficients were performed in uncontrolled large-scale environments or at the scale of the micro-organisms in conditions very different from the natural environment. There are thus uncertainties in the applicability of the previous determinations of the O2 fractionation for the interpretation of δ18O and δ17O of atmospheric O2.

In order to come up with coherent estimates of oxygen biological fractionation coefficients applicable to the scale of plants or ecosystems, we developed closed biological chambers as a biosphere replica, with controlled environment parameters, and measured the dynamics of O2 concentration and of its isotopic composition.

Our set-up is based on round-bottom stainless steel tube of 10 cm in diameter and 88 cm in height to simulate a water column, on top of which we place a structure equipped with sensors (temperature, CO2 concentration, O2 elemental and isotopic measurements) to obtain a closed system. The multiplexing system that we developed can allow to use 6 tubes simultaneously to run replicate studies in parallel with the same environmental conditions.

We present here 3 measurement series, lasting between 2 and 9 months, run with the freshwater species, chlorella vulgaris. These measurement series permit to optimize the use of our newly developed system for aquatic closed biological chambers. We also determined the isotopic discrimination associated with 18O/16O of O2 during respiration as -30 permil which is higher than most of the previously published values. We will also compare these results with new values measured with our setup for oceanic species (the diatoms Phaeodactylum). Finally, we will use the newly determined fractionation coefficients to improve interpretation of the δ18O of O2 record in air bubbles from ice cores

How to cite: Bienville, N., Landais, A., Fiorini, S., Piel, C., Sauze, J., Lemaire, B., Geyskens, N., Prie, F., Jossoud, O., Paul, C., Chaillot, J., Chollet, S., Abiven, S., and Dapoigny, A.: An intermediary scale setup to measure O2 fractionation factors of aquatic biosphere and application to the interpretation of the δ18O of O2 records found in deep ice cores., EGU General Assembly 2026, Vienna, Austria, 3–8 May 2026, EGU26-8150, https://doi.org/10.5194/egusphere-egu26-8150, 2026.

EGU26-9266 | ECS | Posters on site | BG2.2

Cross-Ecosystem Patterns in Carbonyl Sulfide Exchange 

Felix Spielmann, Albin Hammerle, Anna De-Vries, Karolina Sakowska, and Georg Wohlfahrt

Gross primary production (GPP) is a key driver of the terrestrial carbon cycle, yet it cannot be directly measured at the ecosystem scale. Carbonyl sulfide (COS) has emerged as a promising tracer for GPP because it shares the same leaf-level diffusion pathway as CO₂ and is, with negligible re-emission, irreversibly taken up by plants through carbonic anhydrase. As a result, ecosystem-scale COS fluxes provide an independent constraint on photosynthetic CO2 uptake and offer new opportunities to evaluate and refine GPP estimates derived from eddy covariance and modeling approaches. However, uncertainties remain regarding how vegetation type, canopy structure, and environmental conditions modulate COS uptake across ecosystems. In particular, the leaf relative uptake rate (LRU) of COS and CO2 deposition velocities, commonly used to infer GPP from COS fluxes, varies across species and depends on factors such as photosynthetic active radiation and vapor pressure deficit.

Here, we present a multi-site synthesis of ecosystem-scale COS exchange measurements spanning a broad range of vegetation types and climatic conditions, including savanna (Quercus ilex), temperate mountain grassland, agricultural cropland (Glycine max.), temperate deciduous forest (Fagus sylvatica), and temperate coniferous forest (Pinus sylvestris). These sites differ markedly in plant functional types, leaf morphology, phenology, canopy structure, and typical environmental forcing, providing an ideal framework to investigate controls on COS uptake across ecosystems.

All COS fluxes are derived using eddy covariance measurements and processed with a unified workflow using the EddyUH software, ensuring methodological consistency across sites and enabling robust cross-ecosystem comparisons without confounding effects from data processing choices. This harmonized approach allows us to focus on ecosystem-specific drivers rather than methodological artifacts.

Our analysis explores how differences in plant species influence COS uptake dynamics, and how these interact with environmental drivers such as photosynthetically active radiation, vapor pressure deficit, air temperature and soil moisture.

The results presented will provide new insights into ecosystem-specific COS exchange behavior and its implications for using COS as a tracer for GPP across heterogeneous landscapes. Ultimately, this work aims to improve our understanding of how vegetation and climate jointly regulate COS fluxes and to support the broader application of COS-based approaches for constraining ecosystem-scale photosynthesis.

How to cite: Spielmann, F., Hammerle, A., De-Vries, A., Sakowska, K., and Wohlfahrt, G.: Cross-Ecosystem Patterns in Carbonyl Sulfide Exchange, EGU General Assembly 2026, Vienna, Austria, 3–8 May 2026, EGU26-9266, https://doi.org/10.5194/egusphere-egu26-9266, 2026.

Changes in atmospheric sinks could explain the renewed increase of CH4 and the simultaneous decrease in δ13C(CH4) since 2007. In this work, we present comprehensive numerical sensitivity simulations to explore how atmospheric methane oxidation (both by OH and Cl), uptake by soil, and uncertainties in the kinetic isotope effect (KIE) influence the simulated global atmospheric δ13C(CH4) trend. Furthermore, we examine the sensitivity of the latter to reduced emissions from biomass burning, which have relatively high isotopic source signatures. We use the state-of-the-art global chemistry-climate model EMAC with a simplified approach to simulate CH4 loss. The model considers all four CH4 isotopologues and the (partly temperature-dependent) isotope fractionation during  physical and chemical loss of CH4. Our setup uses recent CH4 emission inventories and accounts for regional differences in the corresponding isotopic signatures depending on source material and type of formation. Our results emphasize the importance of atmospheric sinks when interpreting the global CH4 budget with respect to δ13C(CH4).

How to cite: Nickl, A.-L., Jöckel, P., Winterstein, F., and Schmidt, A.: Modelling the impact of atmospheric sink variability and CH4 biomass burning emissions on the global mean δ13C(CH4) trend with the comprehensive chemistry-climate model EMAC., EGU General Assembly 2026, Vienna, Austria, 3–8 May 2026, EGU26-9958, https://doi.org/10.5194/egusphere-egu26-9958, 2026.

EGU26-10863 | Orals | BG2.2

Anthropogenic perturbations to atmospheric methane reflected in Greenland firn air clumped isotope measurements 

Malavika Sivan, Jiayang Sun, Patricia Martinerie, Maria Elena Popa, James Farquhar, Maarten Krol, Carina van der Veen, Bibhasvata Dasgputa, Mojhgan A. Haghnegahdar, Camilla Marie Jensen, Ji-Woong Yang, Johannes Freitag, Kévin Fourteau, Thomas Blunier, and Thomas Röckmann

Uncertainties regarding the origin of rising atmospheric methane levels underscore gaps in our understanding of the global methane cycle. The clumped isotopic composition (Δ13CH3D and Δ12CH2D2) of methane has recently been developed as an additional tracer to constrain atmospheric methanesources and sinks (1, 2). We present a novel perspective by reconstructing the clumped isotopic composition of atmospheric methane dating back to the early 1990s, based on large-volume firn air samples from the Greenland ice cap. Our measurements indicate that atmospheric ∆12CH2D2 around 1993 was 10 ± 2 ‰ lower than in the mid-2020s.

We used a two-box atmospheric model to investigate the drivers of the observed ∆12CH2D2 evolution. Emission fluxes for 1980–2024 were taken from an inversion constrained by atmospheric CH4, δ13C, and δD observations (3). However, sensitivity experiments show that this large ∆12CH2D2 increase cannot be explained by recent changes in methane source composition, as the globally averaged source ∆12CH2D2 varies by less than 1 ‰ over recent decades. Instead, the signal reflects the long-term source-sink disequilibrium effects (4). Owing to the longer atmospheric lifetime of 12CH2D2 relative to other methane isotopologues, Δ12CH2D2 responds slowly to perturbations and records changes in the methane budget over multi-decadal to centennial timescales, leading to a temporal lag relative to changes in methane concentration and bulk isotopic ratios.

Extending the simulations back to 1200 CE shows that accelerating methane emissions during industrialisation progressively drove atmospheric Δ12CH2D2 to lower values, reaching a minimum of ~40 ‰ in the late 20th century. The subsequent slowdown in methane growth after 1990 allowed partial re-equilibration, leading to the observed increase in Δ12CH2D2.Our results demonstrate that Δ12CH2D2 uniquely records the anthropogenic perturbation of the global methane cycle and suggest that the firn air samples measured in this study capture the lowest Δ12CH2D2 values of the past millennium.


  • M. Sivan, T. Röckmann, C. van der Veen, M. E. Popa, Extraction, purification, and clumped isotope analysis of methane (Δ13CDH3 and Δ12CD2H2) from sources and the atmosphere. Atmos. Meas. Tech. 17, 2687-2705 (2024).
  • M. A. Haghnegahdar et al., Tracing sources of atmospheric methane using clumped isotopes. Proceedings of the National Academy of Sciences 120, e2305574120 (2023).
  • B. Dasgupta et al., Global Methane Emission Estimates from a Dual-Isotope Inversion: New Constraints from δD-CH₄. EGUsphere 2025, 1-21 (2025).
  • P. P. Tans, A note on isotopic ratios and the global atmospheric methane budget. Gl. Biogeochem. Cycles 11, 77-81 (1997).

How to cite: Sivan, M., Sun, J., Martinerie, P., Popa, M. E., Farquhar, J., Krol, M., van der Veen, C., Dasgputa, B., Haghnegahdar, M. A., Jensen, C. M., Yang, J.-W., Freitag, J., Fourteau, K., Blunier, T., and Röckmann, T.: Anthropogenic perturbations to atmospheric methane reflected in Greenland firn air clumped isotope measurements, EGU General Assembly 2026, Vienna, Austria, 3–8 May 2026, EGU26-10863, https://doi.org/10.5194/egusphere-egu26-10863, 2026.

EGU26-11478 | ECS | Orals | BG2.2

Isotopic analysis to identify N2O production pathways and to quantify its reduction in wastewater treatment  

Hannes Keck, Laurence Strubbe, Paul M. Magyar, Andreas Froemelt, Adriano Joss, and Joachim Mohn

Nitrous oxide (N2O) emissions from biological nitrogen removal dominate the carbon footprint of the wastewater treatment (WWT) sector. Understanding both the major N2O production pathways and its reduction to dinitrogen (N2) is essential for effective mitigation. In WWT, N2O is mainly produced via three microbial pathways: (i) hydroxylamine oxidation, (ii) nitrifier denitrification, and (iii) heterotrophic denitrification; only the latter can also reduce N2O to N2. Analysis of the isotopologues, 14N15N16O, 15N14N16O, and 14N14N18O, relative to 14N14N16O, expressed in the δ notation, enables pathway identification by comparing measured signatures to reported endmember values. However, those endmember values are derived from limited pure culture or lab incubations and may not represent complex ecosystems such as those in activated sludge of WWT plants sufficiently, necessitating system-specific source signatures. This study combines isotopic analysis of produced N2O with dedicated process control to disentangle microbial pathways and quantify N2O reduction under realistic operating conditions. Online N2O isotopic measurements were performed over a one-year period using off-axis integrated cavity output spectroscopy (LGR-ABB) at two 8 m3 pilot-scale sequencing batch reactors during aeration phases treating municipal wastewater (Eawag, Dübendorf, Switzerland). Results indicate no significant contribution of hydroxylamine oxidation to N2O production, while both nitrifier and heterotrophic denitrification emit N2O under specific process conditions and are characterized by system specific isotopic endmembers. The availability of NH4+ as an electron donor is a prerequisite for nitrifier denitrification, while heterotrophic denitrification needs low dissolved oxygen (DO) concentration. Process-specific isotopic fingerprints were applied to disentangle active pathways and assess their response to pH, carbon availability, and DO. In parallel, we calculated the fraction of reduced N2O by applying the Rayleigh equation coupled with published fractionation factors to our data. N2O reduction decreased within individual aeration phases and varied between cycles. Preliminary results from explainable machine learning identified pH, temperature, NO3-, DO, and peak NO2- as key drivers of N2O reduction.  This work provides a comprehensive isotopic framework for simultaneously resolving N2O production pathways and N2O reduction dynamics in WWT, advancing process understanding and informing operational strategies to mitigate greenhouse gas emissions in the wastewater sector. 

How to cite: Keck, H., Strubbe, L., Magyar, P. M., Froemelt, A., Joss, A., and Mohn, J.: Isotopic analysis to identify N2O production pathways and to quantify its reduction in wastewater treatment , EGU General Assembly 2026, Vienna, Austria, 3–8 May 2026, EGU26-11478, https://doi.org/10.5194/egusphere-egu26-11478, 2026.

EGU26-11530 | Posters on site | BG2.2

Performance of a Counter-Current Flow Tube Method for Gaseous NH3 Collection and Isotope Analysis 

Yusuke Fujii, Ayumi Tachibana, Mugi Sawabe, Hiroto Kawashima, and Norimichi Takenaka

Ammonia (NH3), the most abundant atmospheric alkaline trace gas, plays a crucial role in fine particulate matter formation and nitrogen cycling. While agriculture is the primary source, recent studies highlight significant contributions from non-agricultural urban sources. However, NH3 spatiotemporal variability is complex and not fully understood, necessitating reliable and high time-resolution data. For more comprehensive source apportionment, combining such data with stable nitrogen isotope ratio (δ15N) analysis serves as a powerful approach.

To enable high time-resolution measurements, we previously developed a continuous measurement system using a counter-current flow tube (CCFT) technique (Huy et al., J. Atmos. Chem. 73, 223-240, 2016). Initially designed for ambient levels, its performance at elevated concentrations typical of emission sources has not yet been evaluated. In this study, we modified the CCFT measurement system to collect NH3 as ammonium (NH4+) in an aqueous solution for δ15N analysis. We evaluated its absorption efficiency and δ15N measurement accuracy across a wide range of NH3 concentrations.

Gaseous NH3 was captured in pure water using the modified CCFT sampling system (Huy et al., 2016). Sample air was drawn at 1.0 L min-1 into a vertical tube, while pure water was introduced from the top at 0.12 mL min-1. NH3 was absorbed by diffusion and dissolution into the counter flowing solution. NH4+ concentrations were determined by ion chromatography; δ15N was measured using the denitrifier method and a GasBench II system coupled to an isotope ratio mass spectrometer. Detailed procedures are provided in Kawashima et al. (Rapid Commun. Mass Spectrom. 35, e9027, 2021). To evaluate the collection efficiency and isotopic accuracy, the modified CCFT system was operated in parallel with a conventional boric acid (BA) trap system as a reference.

For concentrations measured by a BA trap ([NH3]BA) exceeding 600 μg m-3, CCFT absorption efficiencies were clearly below 1.0, whereas efficiencies nearly reached 1.0 below 300 μg m-3. The difference in δ15N of NH3 between the CCFT and BA systems increased with [NH3]BA, reaching 12.17 ‰ at 1307.1 μg m-3. This suggests that within the CCFT sampler, lighter 14NH3 is less efficiently collected than heavier 15NH3. The isotopic difference was particularly pronounced above 400 μg m-3.

How to cite: Fujii, Y., Tachibana, A., Sawabe, M., Kawashima, H., and Takenaka, N.: Performance of a Counter-Current Flow Tube Method for Gaseous NH3 Collection and Isotope Analysis, EGU General Assembly 2026, Vienna, Austria, 3–8 May 2026, EGU26-11530, https://doi.org/10.5194/egusphere-egu26-11530, 2026.

EGU26-11953 | ECS | Posters on site | BG2.2

How Well Do Nitrate Isotopes in Alpine Ice Cores Preserve Atmospheric Signals? 

Jack Saville, Julien Witwicky, Diyanath Attonde, Jiaran Zheng, Elsa Gautier, Patrick Ginot, Nicolas Caillon, and Joël Savarino

In the face of natural and anthropogenic emissions, the habitability of Earth’s atmosphere is maintained thanks to atmospheric oxidants – photochemically produced reactive species which destroy toxic pollutants, remove greenhouse gases and maintain chemical stability. Understanding the chemical dynamics of the atmosphere is hence crucial for accurate predictions of air quality and radiative forcing in a changing climate, as identified in IPCC AR6. Because the species involved are often highly reactive, studying historic atmopsheric chemistry is challenging: consequently, there is no consensus on the magnitude or the sign of the relationship between atmospheric oxidative capacity and global climate.

One avenue for past atmospheric chemistry reconstructions is isotopic analysis of nitrate – an oxidation product of atmospheric NOx – archived in non-polar ice cores. The N and O isotope compositions of ice core nitrate depend on past oxidation reactions and past NOx sources, while newly-accessible nitrate clumped isotopes may provide complementary information on nitrate formation pathways. However, useful signals can be obscured by isotopic fractionation during nitrate transport, deposition and burial, while seasonal variations in atmospheric chemistry or snow accumulation can bias ice core records. These difficulties often make ice core nitrate isotope interpretations non-unique, limiting their utility as investigative tools for past atmospheric chemistry.

To investigate the processes controlling nitrate isotopes archived in non-polar ice cores, we collected firn cores and weekly high-volume atmospheric samples at high altitude sites in the Mont-Blanc massif (France/Italy) and the Cordillera Oriental (Bolivia). Using the newly-adapted Electrospray-Orbitrap mass spectrometer, we investigated the seasonality of atmospheric nitrate isotope ratios δ15N, δ18O and Δ17O, and clumped isotopes Δ15N18O and Δ18O18O, and compared atmospheric isotopic signals to those in contemporaneously-deposited firn over an accumulation season. We find substantial seasonal isotopic variability in atmospheric nitrate, which is partially preserved in firn core records. However, several isotopic disagreements could reflect syn- or post-depositional isotopic fractionation processes, and the isotopic seasonality should be carefully considered when intepreting ice core records where accumulation is seasonal.

How to cite: Saville, J., Witwicky, J., Attonde, D., Zheng, J., Gautier, E., Ginot, P., Caillon, N., and Savarino, J.: How Well Do Nitrate Isotopes in Alpine Ice Cores Preserve Atmospheric Signals?, EGU General Assembly 2026, Vienna, Austria, 3–8 May 2026, EGU26-11953, https://doi.org/10.5194/egusphere-egu26-11953, 2026.

EGU26-12027 | ECS | Orals | BG2.2

Multi-year dual-isotope fingerprinting at South Asian receptor sites constrain carbon monoxide sources and enhanced oxidation 

Peng Yao, Henry Holmstrand, Carina van der Veen, Maria Elena Popa, Chloe A. Brashear, Krishnakant Budhavant, Mohanan Remani Manoj, Joakim Romson, Abdus Salam, Thomas Röckmann, and Örjan Gustafsson

Carbon monoxide (CO) is an indirect short-lived climate forcer with uncertainties both in sources and its role in atmospheric oxidation. Based on nine winter-long dual-isotope campaigns at two South Asian receptor sites intercepting the continental outflow, we quantified CO source contributions and emission–sink dynamics. Combustion accounts for 68–74% of South Asia regional CO (including 34–37% from biomass burning) with secondary atmospheric oxidation contributing 26–32% (dominated by oxidation of non-methane volatile organic compounds NMVOCs at 21–26% with methane oxidation contributing 5.5–6.4%). These isotope-observational constraints suggest a twice higher role for atmospheric oxidation than in model estimates. Spatially, the absolute contributions of both primary and secondary CO decrease from the Indo-Gangetic Plain (IGP) to the northern Indian Ocean, indicating enhanced oxidation near source regions, while the relative contribution of secondary CO increases. Observation-model comparison suggests that continental transport dominates CO over adjacent oceanic regions, while local production is minor. During the COVID-19 pandemic, combustion-derived CO fell sharply, NMVOC-derived CO rose, and CH4-derived CO remained stable, suggesting enhanced oxidation from reduced competition among precursors. Our results reveal a far greater contribution of CO from atmospheric oxidation in South Asia than in current model estimates, highlighting the need for sustained emission controls to deliver concurrent climate and health benefits.

How to cite: Yao, P., Holmstrand, H., van der Veen, C., Elena Popa, M., A. Brashear, C., Budhavant, K., Remani Manoj, M., Romson, J., Salam, A., Röckmann, T., and Gustafsson, Ö.: Multi-year dual-isotope fingerprinting at South Asian receptor sites constrain carbon monoxide sources and enhanced oxidation, EGU General Assembly 2026, Vienna, Austria, 3–8 May 2026, EGU26-12027, https://doi.org/10.5194/egusphere-egu26-12027, 2026.

EGU26-12183 | Posters on site | BG2.2

Towards continuous, long-term eddy covariance measurements of CO2 isotopologues 

Oisín Jelle Boersma, Nicolas Brüggemann, Matthias Claß, Anas Emad, Christian Markwitz, Youri Rothfuss, Edgar Tunsch, and Alexander Knohl

Eddy covariance measurements are a standard practice when measuring fluxes of CO2 between the surface and the atmosphere. However, they may be limited in their use for disentangling and quantifying the different contributors to these fluxes (i.e. sources and sinks). Measuring the stable isotopologue composition of the CO2 flux, using ¹³C and ¹⁸O signatures, allows for a more direct flux partitioning, based on differences in the isotopologue composition of CO2 sources in ecosystems. Yet, studies investigating isotopologue fluxes remain scarce and mostly limited to short time periods on weekly or monthly scales.

Here we present a new setup for continuous, long-term stable isotopologue eddy covariance measurements of CO2 using a quantum cascade laser absorption spectrometer and evaluate ongoing data collection over a two-year period (2025-2027) in a managed beech forest in central Germany. Furthermore, we discuss the calibration strategy and performance requirements necessary to conduct high-frequency isotopologue measurements suitable for eddy covariance applications and present first flux calculation results.

First results show that frequent instrument calibration of the isotope raw reading is critical and must be performed regularly. We identify pressure and temperature fluctuations as major sources of instrumental drift. To address this, we developed an automated calibration system that performs hourly drift corrections and daily concentration-dependence corrections to reach the precision needed for eddy covariance measurements and resolve the subtle differences in the environmental signal.

Our results highlight important methodological requirements, for continuous, long-term, isotopologue eddy covariance measurements. This work can act as a stepping stone toward the implementation of similar measurements into existing flux observation networks such as ICOS or FLUXNET. Furthermore, this represents an important step toward using stable isotopologues to better understand ecosystem-atmosphere exchange processes by characterizing greenhouse gas sources and sinks in ecosystems.

How to cite: Boersma, O. J., Brüggemann, N., Claß, M., Emad, A., Markwitz, C., Rothfuss, Y., Tunsch, E., and Knohl, A.: Towards continuous, long-term eddy covariance measurements of CO2 isotopologues, EGU General Assembly 2026, Vienna, Austria, 3–8 May 2026, EGU26-12183, https://doi.org/10.5194/egusphere-egu26-12183, 2026.

EGU26-12644 | ECS | Orals | BG2.2

High-precision determination of the temperature-dependent kinetic isotope effect for the CH4 + OH reaction 

Chih-Chang Chen, Getachew Adnew, Alexis Gilbert, Carina van der Veen, Marie Mikkelsen, Matthew Johnson, Jianghanyang Li, Maarten Krol, and Thomas Röckmann

Methane (CH4) is a strong greenhouse gas, yet its global budget remains incompletely constrained. The uncertainties in its sources and sinks limit the implementation of successful mitigation. Stable isotope analysis (δ13C-CH4 and δ2H-CH4) offers powerful constraint for methane source attribution, but the accuracy of these constraints depends on accurate values of the kinetic isotope effects (KIEs) associated with its primary removal process, reaction with the OH radical.

Here, we present new laboratory measurements of both carbon and hydrogen isotope fractionation during the CH4 + OH reaction. Our experimental design included extensive control runs to eliminate potential interferences from secondary radical species. In addition, we used kinetic chemical model and a reaction - transport model to verify that the observed fractionation results are exclusively driven by the OH oxidation.

We determined the fractionation across a wide temperature range to cover various atmospheric condition. Our data reveal a moderate but clear temperature dependence for both δ13C-CH4 and δ2H-CH4 fractionation, which is evaluated against theoretical estimates to assess its implications. These findings resolve previous literature discrepancies and provide a refined benchmark for inverse modeling applications.

How to cite: Chen, C.-C., Adnew, G., Gilbert, A., van der Veen, C., Mikkelsen, M., Johnson, M., Li, J., Krol, M., and Röckmann, T.: High-precision determination of the temperature-dependent kinetic isotope effect for the CH4 + OH reaction, EGU General Assembly 2026, Vienna, Austria, 3–8 May 2026, EGU26-12644, https://doi.org/10.5194/egusphere-egu26-12644, 2026.

EGU26-14935 | ECS | Posters on site | BG2.2

Constraining the regional and global hydrogen cycle using stable isotope measurements 

Corstian van Rijswijk, Ceres Woolley Maisch, Thomas Röckmann, and Carina van der Veen

Atmospheric molecular hydrogen (H2) is increasingly being considered as an important energy carrier in future energy systems. Due to leakages during production, storage, transport, and use of H2, a rise in atmospheric H2 levelsis expected. Such an increase may lead to a prolonged lifetime of methane, enhanced tropospheric ozone concentrations, and increased stratospheric water vapor. Although the major sources and sinks of atmospheric hydrogen are relatively well known, large uncertainties remain in the global hydrogen budget due to limited observational constraints and an incomplete understanding of the underlying processes.

Measurements of isotopic signatures of H2 provide a powerful tool to distinguish between different source and sink processes and to better constrain the hydrogen budget, for example by providing improved observational input for atmospheric models. However, recent observations of the hydrogen stable isotope (δD) remain scarce.

Here we present new measurements of atmospheric H2 and its stable isotopologue HD, carried out at the Institute for Marine and Atmospheric research Utrecht (IMAU). The system separates the H2 from the air matrix and determines its isotopic composition using isotope-ratio mass spectrometry (IRMS). The dataset includes atmospheric samples from globally distributed sampling networks, including station data and (Atlantic) ship transects, and local sources.

These new observations contribute to a better observational basis for understanding the regional and global hydrogen cycle and provide valuable input for future studies of atmospheric hydrogen.

How to cite: van Rijswijk, C., Woolley Maisch, C., Röckmann, T., and van der Veen, C.: Constraining the regional and global hydrogen cycle using stable isotope measurements, EGU General Assembly 2026, Vienna, Austria, 3–8 May 2026, EGU26-14935, https://doi.org/10.5194/egusphere-egu26-14935, 2026.

EGU26-17312 | ECS | Posters on site | BG2.2

Investigating Nitrate Formation Pathways Using Isotope Analysis in Controlled Chamber Experiments 

Kathleen A. Alden, Jack Saville, Julien Witwicky, Nicolas Caillon, Mathieu Cazaunau, Prodip Acharja, Edouard Pangui, Damien Lopez, Patrick Dewald, Lucas Beltran, Manuela Cirtog, Bénédicte Picquet-Varrault, and Joël Savarino

Atmospheric nitrate, comprising particulate NO3- and gas-phase nitric acid (HNO3), is a highly significant product of the oxidation of NOx (= NO + NO2). Its isotopic composition (Δ17O, δ18O and δ15N) provides valuable information on NOx sources and atmospheric oxidation pathways, making nitrate preserved in ice cores a proxy for past atmospheric chemical reactivity. However, the interpretation of these ice core records is currently limited by an incomplete understanding of both isotope fractionation and isotope clumping effects associated with different nitrate formation pathways.

To better constrain these effects, we conducted a series of atmospheric chamber experiments in CESAM to investigate atmospheric nitrate production via two major nocturnal formation pathways: N2O5 heterogeneous hydrolysis on aerosol particles and the oxidation of volatile organic compounds by the NO3 radical. Reactant concentrations, temperature, and humidity were monitored and controlled throughout each chamber experiment, and the resulting nitrate was collected on filters for isotope analysis. In addition, particulate NO3- formation and aerosol chemical composition were quantified simultaneously using a high-resolution time-of-flight aerosol mass spectrometer (HR-ToF-AMS), providing process-level constraints on nitrate production for each formation pathway.

This study aims to investigate whether distinct isotopic signatures arise between nitrate produced via N2O5 hydrolysis and NO3-VOC reactions. The isotopic composition of the produced nitrate (Δ17O, δ18O, and δ15N) will be analysed to quantify pathway-dependent isotope effects. In addition, a newly developed methodology using the ESI-Orbitrap mass spectrometer will be applied to measure clumped isotopes (i.e. Δ15N18O and Δ18O18O) in the produced nitrate, to evaluate whether clumped isotope signatures provide an additional constraint on nitrate formation mechanisms.

How to cite: Alden, K. A., Saville, J., Witwicky, J., Caillon, N., Cazaunau, M., Acharja, P., Pangui, E., Lopez, D., Dewald, P., Beltran, L., Cirtog, M., Picquet-Varrault, B., and Savarino, J.: Investigating Nitrate Formation Pathways Using Isotope Analysis in Controlled Chamber Experiments, EGU General Assembly 2026, Vienna, Austria, 3–8 May 2026, EGU26-17312, https://doi.org/10.5194/egusphere-egu26-17312, 2026.

EGU26-18527 | Posters on site | BG2.2

Atmospheric methane sink isotope fractionation throughout last six decades: Projections using new kinetic data and implications for CH4 budget 

Sergey Gromov, Chih-Chang Chen, Matthew Stanley Johnson, Marie Kathrine Mikkelsen, Andrea Pozzer, and Thomas Röckmann

Recent theoretical and laboratory studies [1, 2] provide new and updated estimates of carbon and hydrogen kinetic isotope effects in the gas-phase reactions removing atmospheric methane (CH4). In particular, new temperature dependence of kinetic fractionation in reactions with hydroxyl (OH) and chlorine (Cl) radicals is determined for a range of isotopomers, including the multiply substituted (clumped) ones. In this study, we use the ECHAM/MESSy Atmospheric Chemistry (EMAC) model in a comprehensive chemistry-inclusive hind-cast setup [3] to obtain projections of the nominal and effective sink fractionation in atmospheric CH4 throughout the 1960–2020 period, based on the new isotope kinetic data. Use of EMAC allows to obtain realistic spatiotemporal distribution of fractionation magnitudes resulting from convolution of temperature and sink rate distributions, further modified by atmospheric transport and mixing.

Our simulations yield a range of significantly different projections for most of the isotopomers, compared either to the literature values or to theoretical approach/laboratory data considered. The laboratory and more advanced theoretical approaches yield larger fractionations for both 13CH4 and CH3D in reactions with OH. The opposite is obtained for the reactions with Cl, however with more advanced theory being closer to the laboratory data-based estimates. For clumped isotopomers, comparison to available literature data yields no systematic relationships.

The obtained time series witness a significant (up to 1.5‰) increase in the total nominal 13CH4 sink fractionation during 1960–1990 due to the changes in the stratospheric Cl sink distribution, following the onset of anthropogenic chlorofluorocarbons (CFC) emissions. After the global ban on CFCs, a reverse gradual decrease on the order of 0.1‰/decade is projected. A similar, though much smaller in relative magnitude, evolution is estimated for CH3D. Whilst the mean OH the sink rate-weighted atmospheric temperature exhibits a slight positive trend, the Cl and O(1D) sink rates-weighted temperatures witness larger decreases, in line with tropospheric warming and stratospheric cooling occurring in the last decades. We discuss the implications and uncertainties of our findings for isotope-inclusive efforts to improve past and present CH4 atmospheric budget estimates.

References

1. M. K. Mikkelsen, et al., Kinetic isotope effects in methane oxidation reactions: temperature dependence of the OH and Cl KIEs for 13CH4, CDH3, 13CDH3, CD2H2, CD3H, and CD4 from 100 to 500 K, AGU Fall Meeting, B13N-1736, 2025. https://agu.confex.com/agu/agu25/meetingapp.cgi/Paper/1911885

2. C.-C. Chen, C. van der Veen, G. Adnew, T. Röckmann, Comparative analysis of 13CKIE and DKIE in CH4-OH reaction, AGU Fall Meeting, A21M-2178, 2025. https://agu.confex.com/agu/agu25/meetingapp.cgi/Paper/1944364

3. P. Jöckel, et al., RD1SD: EMAC CCMI-2022 hindcast simulations with specified dynamics, ERA-5, 1979-2019. World Data Center for Climate (WDCC) at DKRZ. Deposited 18 June 2024. https://doi.org/10.26050/WDCC/ESCiMo2_RD1SD


How to cite: Gromov, S., Chen, C.-C., Johnson, M. S., Mikkelsen, M. K., Pozzer, A., and Röckmann, T.: Atmospheric methane sink isotope fractionation throughout last six decades: Projections using new kinetic data and implications for CH4 budget, EGU General Assembly 2026, Vienna, Austria, 3–8 May 2026, EGU26-18527, https://doi.org/10.5194/egusphere-egu26-18527, 2026.

Atmospheric reactive nitrogen oxides including NOₓ and nitrate acquire oxygen isotope anomalies (Δ17O = δ17O - 0.52 × δ18O) through ozone-driven chemistry. Prior chemical transport modeling studies have investigated the spatiotemporal patterns of Δ17O of atmospheric nitrate, yet these approaches remain fundamentally localized as they neglect inter-grid transport effects (Alexander et al., 2020; Walters et al., 2024). Transport process can influence Δ17O both directly through mixing and indirectly by altering precursor concentrations, thereby modulating isotopic transfer during chemical reactions. However, integrating transport into Δ17O modeling has been hindered by the requirement to track multiple isotopologues per species, which would substantially increase the complexity in chemical mechanism and computational cost.

This study introduces a novel, computational efficient Δ17O modeling framework with the transport effect incorporated, in which Δ17O is treated directly as prognostic variable. The contributions of chemical and transport processes to Δ17O evolution are separated using operator splitting. The Δ17O transfer during chemistry is computed explicitly following the method of Morin et al. (2011). The Δ17O transport equations are solved using a similar numerical scheme for the Eulerian transport equation. We apply this framework within an adapted version of the PACT-1D model (Tuite et al 2021) to examine how boundary layer dynamics impact the Δ17O variability in reactive nitrogen oxides. In particular, modeled Δ17O values of atmospheric nitrate are evaluated against recent vertical profile observations. This comparison aims to improve our understanding of the controlling factors on nitrate Δ17O and to assess its utility as a proxy for atmospheric oxidation capacity.

How to cite: Jiang, Z. and Geng, L.: Exploring the impact of boundary layer dynamics on the Δ17O of reactive nitrogen oxides with the PACT-1D model, EGU General Assembly 2026, Vienna, Austria, 3–8 May 2026, EGU26-18848, https://doi.org/10.5194/egusphere-egu26-18848, 2026.

EGU26-19689 | ECS | Orals | BG2.2

Preparation and calibration of O-17 enriched nitrite isotope standards 

Tao Zhou, Sarah Albertin, Zhuang Jiang, Joel Savarino, and Lei Geng

The oxygen-17 isotope anomaly (Δ17O) serves as a powerful tool to elucidate the chemical transformation mechanisms of atmospheric reactive nitrogen species such as NO2 and HONO. Current studies employ the denuder collection methods to convert atmospheric NO2 and HONO into nitrite for isotopic analysis. However, accurate Δ17O measurement of atmospheric NO2 and HONO is hampered by the lack of internationally recognized nitrite isotope reference materials with applicable Δ17O signals. In this study, we prepared new nitrite isotope standards with nonzero Δ17O signals through oxygen isotope exchange between high-purity nitrite reagents and 17O-enriched water. Using a developed ozone oxidation calibration method, the Δ17O values of a newly prepared nitrite standard (i.e., N-Δ17O-1) and the international nitrite reference material RSIL-N10219 were determined as (69.7 ± 1.0) ‰ (n = 10, 1σ) and (-8.7 ± 0.3) ‰ (n = 11, 1σ), respectively. The two additional O-17 enriched nitrite standards were then measured and calibrated against RSIL-N10219 and N-Δ17O-1, yielding Δ17O values of (34.5 ± 0.3) ‰ (n = 6, 1σ) and (6.4 ± 0.1) ‰ (n = 8, 1σ), respectively. The δ15N and δ18O values of the three home-made nitrite isotope standards were also calibrated against international nitrite reference materials. This study introduces a new and reliable method to obtain the Δ17O values of nitrite, and the establishment of Δ17O values of nitrite standards provides a foundation for accurately assessing Δ17O variations atmospheric NO2 and HONO. The latter will facilitate the application of the Δ17O tracer in investigating atmospheric cycling of reactive nitrogen and radicals.

How to cite: Zhou, T., Albertin, S., Jiang, Z., Savarino, J., and Geng, L.: Preparation and calibration of O-17 enriched nitrite isotope standards, EGU General Assembly 2026, Vienna, Austria, 3–8 May 2026, EGU26-19689, https://doi.org/10.5194/egusphere-egu26-19689, 2026.

EGU26-22195 | ECS | Orals | BG2.2

Semi-continuous automated Δ47 measurements of atmospheric CO2 

Henrik Eckhardt, Martina Schmidt, Thomas Röckmann, and Norbert Frank

Stable isotope measurements of atmospheric CO2 are a powerful tool for partitioning contributions of different CO2 sources and sinks. In addition to the conventional tracers δ13C and δ18O, the “clumped isotope” tracer Δ47 can improve the distinction between high- and low-temperature sources of atmospheric CO₂ in urban studies. Despite its potential, Δ₄₇ measurements of atmospheric CO₂ remain sparse, particularly from long-term observations. One reason for this may be the high effort of manually processing samples for the measurement of Δ47 in atmospheric CO₂, with high precision analysis typically require several hours per sample. Here, we present an automated preparation line coupled with a dual inlet isotope ratio mass spectrometer (MAT253+). This setup enables automated extraction and purification of atmospheric CO2 and measurement of approximately five atmospheric CO₂ samples per day with sample preparation time of about 90 minutes. Over a 10-month period, the system achieved a reproducibility of ∼ 0.005 ‰ for δ13C, ∼ 0.01 ‰ for δ18O, and ∼ 0.011 ‰ for Δ47.

Regular measurements using this setup provided insight into the temporal change in atmospheric Δ47 in the semi-urban area of Heidelberg (Germany). In addition to the technical challenges, also the scientific interpretation of atmospheric Δ47 data is not straightforward, because this “clumped isotope” tracer exhibits nonlinear behavior during air-mass mixing. Consequently linear extrapolation approaches such as the traditional Keeling plots can yield biased source signature estimates. We therefore present a thorough correction procedure applicable to cases where CO₂ enhancements are too small to allow a direct nonlinear fit.

How to cite: Eckhardt, H., Schmidt, M., Röckmann, T., and Frank, N.: Semi-continuous automated Δ47 measurements of atmospheric CO2, EGU General Assembly 2026, Vienna, Austria, 3–8 May 2026, EGU26-22195, https://doi.org/10.5194/egusphere-egu26-22195, 2026.

Extreme climate events are increasingly altering biosphere–geosphere exchanges, particularly through their impacts on vegetation productivity and carbon uptake. In this study, we evaluate how multi-dimensional climate extremes shape the spatiotemporal dynamics of Gross Primary Productivity (GPP) across India, a region characterized by strong hydroclimatic variability and rapidly changing land–atmosphere feedbacks. We used FLUXCOM-X GPP estimates (0.25°, 2001–2021) and ERA5-based meteorological variables to derive key climate extremes indices including temperature extremes (TX10P, TX90P), vapor pressure deficit extremes (VPDX90P), soil moisture extremes (SMX10P), and extreme precipitation indicators (RX5day, R20mm). Long-term changes in vegetation productivity were quantified using the Mann-Kendall test and Sen’s slope estimator, while wavelet power spectrum (WPS) and wavelet coherence (WTC) analyses were employed to explore dominant periodicities of GPP variability and its coupling with extreme climatic drivers at seasonal, annual, inter-annual, and long-term timescales. Results reveal widespread increasing trends in GPP across India over the past two decades, driven primarily by intensification of monsoon-season productivity. However, seasonal analysis identifies emerging constraints during the dry season, reflecting the increasing dominance of evaporative stress and atmospheric water demand on vegetation functioning. The impacts of extremes are strongly heterogeneous: heat and VPD extremes exhibit a pronounced negative influence on GPP in central and semi-arid zones with limited water availability; cold extremes reduce productivity in northern and northeastern ecosystems with winter-dominated phenology; soil moisture deficits consistently suppress carbon assimilation across all vegetated systems, while wet anomalies provide strong productivity enhancement; and intense precipitation events generally increase GPP by alleviating moisture stress except in temperate northern regions and north-eastern parts of India, where intense flooding and lower temperatures suppress net growth. Dominant annual cycles in croplands highlight strong synchronization with monsoon-driven growing seasons, whereas forests dominated regions demonstrate inter-annual to long-term modes, reflecting deeper rooting strategies, structural inertia, and ecological memory. WTC results indicate that GPP coherence with high temperature, VPD extremes and low soil moisture extremes is frequently strong and negative, suggesting that future warming and humidity stress may offset current productivity gains. Meanwhile, positive coupling with precipitation extremes implies a growing reliance of ecosystem carbon uptake on episodic wet events. Overall, the findings demonstrate that intensifying climate extremes are actively reshaping the carbon cycle in India by altering both the magnitude and stability of vegetation productivity. As land–atmosphere interactions become increasingly governed by high-impact events rather than gradual change, monitoring multi-scale GPP response and ecosystem sensitivity will be crucial for predicting future terrestrial carbon feedbacks and supporting climate-resilient land management strategies in vulnerable tropical and subtropical regions.

How to cite: Mutyala, P. and Ghosh, P. S.: Climate Extremes Reshape Carbon Uptake in India: A Multi-Scale Assessment of Vegetation–Climate Interactions, EGU General Assembly 2026, Vienna, Austria, 3–8 May 2026, EGU26-635, https://doi.org/10.5194/egusphere-egu26-635, 2026.

EGU26-940 | ECS | Orals | BG2.4

Hybrid modeling of the active root zone storage and its capacity 

Georgios Blougouras, Shijie Jiang, Alexander Brenning, Mirco Migliavacca, Louise Slater, Jialiang Zhou, Rohini Kumar, Lu Tian, Chao Wang, and Markus Reichstein

The active root zone storage (aSrz) is a critical yet unobservable quantity in the water cycle. It represents the dynamic component of subsurface water that can be accessed by ecosystems for evapotranspiration (ET), directly linking water, energy and carbon exchanges across the land-atmosphere interface. In this study, we propose a catchment-scale, ecosystem-oriented hybrid model to understand the spatiotemporal dynamics of aSrz. We introduce aSrz as a latent soil moisture state in the model; without explicitly prescribing soil layers or providing rooting depth information, the model diagnoses aSrz (and its capacity) by relying on first-order ecohydrological principles and multi-source observational constraints (ET, runoff, snow and terrestrial water storage). We train the model across hundreds of U.S. catchments over the period 1985–2020 and then upscale to a 0.25° grid, finding that the inferred root zone storage peaks in transitional regions. We explore the interplay of vegetation, atmospheric demand and water supply, seasonality and topography in modulating the root zone storage dynamics. Furthermore, aSrz capacity reveals the long-term ecosystem adaptation to hydroclimate and substrate conditions. By investigating the differences between aSrz dynamics and its capacity across catchments, we uncover divergent ecosystem strategies for managing water resources, especially along the aridity gradient. Overall, our parsimonious hybrid model structure provides a physically consistent and observationally constrained roadmap for diagnosing ecosystem processes that cannot be directly observed.

How to cite: Blougouras, G., Jiang, S., Brenning, A., Migliavacca, M., Slater, L., Zhou, J., Kumar, R., Tian, L., Wang, C., and Reichstein, M.: Hybrid modeling of the active root zone storage and its capacity, EGU General Assembly 2026, Vienna, Austria, 3–8 May 2026, EGU26-940, https://doi.org/10.5194/egusphere-egu26-940, 2026.

EGU26-1073 | ECS | Posters on site | BG2.4

Assessing GHG Emissions from Forest Fire and Stubble Burning using Satellite Remote Sensing 

Pulakesh Das, Pramit Debburman, Mukunda Dev Behera, and Vemuri Muthayya Chowdhary

Stubble burning has become a recurrent event in many parts of India, including the central Indian state of Madhya Pradesh. The farmers burn the crop residue in the post-harvest period of the Kharif and Rabi seasons, to quickly prepare fields for the next cropping cycle. This study used MODIS satellite data-derived burned area product and Sentinel-5P derived NO2 column number density to identify fire burned areas and assess the corresponding GHG emission, respectively. The uncertainty layer was utilized in the MODIS data pre-processing, followed by monthly data aggregation. The ESRI land use land cover (LULC) layer was used to differentiate the burned areas in cropland and forest. The study observed a total of 5787 sq km fire-affected area in 2024, wherein crop residue burned area was 5346 sq km that was more than 12 times the forest fire area (441 sq km). More than 75% of the forest fire burning occurred in March, April, and May; with around 15% in post-monsoon November and December. Similarly, more than 74% of the crop residue burning occurred in March, April, and May; and around 20% in post-monsoon November. Overall, the maximum total fire events occurred in April (42%), followed by March (18%) and May (15%). On the contrary, the maximum NO2 concentration was recorded in May and June, followed by November and December. The study hypothesizes that the temporal lag in NO2 concentration relative to the total burned area may indicate the accumulation of NO2 along with the contributions from neighboring states with higher anthropogenic GHG emissions. Moreover, the forest dwellers in central India often apply surface fire for forest floor cleaning during the peak summer months (May and June) before minor forest product collection. These under canopy surface fire events often remain undetected due to dense forest canopy, although they emit a significant amount of GHG. Thus, the GHG emissions from surface fire events remain unaccounted for. The study proposes developing a citizen science-based surface forest fire monitoring module. The accurate canopy and surface fire events, and the crop residue burned area would help assess GHG emission. Such as robust data can be used to develop predictive models for future surface fire risk estimation and quantification of the associated GHG emissions.

How to cite: Das, P., Debburman, P., Behera, M. D., and Chowdhary, V. M.: Assessing GHG Emissions from Forest Fire and Stubble Burning using Satellite Remote Sensing, EGU General Assembly 2026, Vienna, Austria, 3–8 May 2026, EGU26-1073, https://doi.org/10.5194/egusphere-egu26-1073, 2026.

Gross primary productivity (GPP) is widely assumed to drive annual tree growth, an assumption embedded in many terrestrial ecosystem models. Yet, empirical evidence from boreal forests often shows weak coupling between eddy-covariance GPP and tree growth, a pattern attributed to physiological constraints and mismatched measurement scales. We revisited this relationship using harmonized datasets of eddy-covariance GPP and tree-ring basal area increments (BAI) from six boreal flux sites spanning diverse structural and climatic conditions, combined with a continental-scale tree-ring width network covering Canada encompassing >40,000 tree samples from >4,500 sites. Tree-ring widths were converted to BAI and detrended using species-specific generalized additive mixed models (GAMMs) to isolate abiotic/biotic-driven growth anomalies. Growth anomalies were aggregated within radii optimized to match flux tower footprints and expressed as annual percent deviations from expected growth. Eddy-covariance GPP was derived from long-term flux records following standardized gap-filling and filtering protocols, and annual sums were computed from monthly fluxes. Pairwise correlations between GPP and growth anomalies were assessed using Pearson coefficients with bootstrap confidence intervals to account for temporal autocorrelation. Spatial correlation fields were constructed by correlating site-level GPP time series with gridded growth anomalies to evaluate regional coherence. Contrary to previous findings, five boreal flux sites exhibited significant positive correlations between annual growth anomalies and GPP (r = 0.69–0.85, p < 0.05), while one northern black spruce site showed no association. Spatial correlation fields revealed that growth–GPP coupling extends well beyond flux tower footprints, forming coherent regional patterns across hundreds of kilometers. These results challenge the prevailing view of universal source–sink decoupling and highlight the importance of scale and representativeness in diagnosing carbon allocation. Our findings have implications for improving terrestrial ecosystem models by replacing fixed allocation coefficients with formulations that incorporate sink controls, lags, and storage dynamics. This work demonstrates that harmonizing multi-scale observations can uncover robust linkages between photosynthetic carbon supply and wood production, advancing our understanding of biosphere–atmosphere interactions under climate variability.


How to cite: Girardin, M. and Metsaranta, J.: Bridging scales: Regional coherence between gross primary productivity and boreal tree growth revealed by harmonized flux and dendrochronological data, EGU General Assembly 2026, Vienna, Austria, 3–8 May 2026, EGU26-2597, https://doi.org/10.5194/egusphere-egu26-2597, 2026.

EGU26-2935 | ECS | Orals | BG2.4

The seismic fingerprint of wind-induced tree sway   

Josefine Umlauft, Karin Mora, Fabian Limberger, Kilian Gerberding, Christian Wirth, Christiane Werner, and Teja Kattenborn

Climate change is increasing the frequency and intensity of extreme events like heat waves, droughts and storms, placing forests under growing physiological and mechanical stress.

Common indicators of tree stress, such as sap flow, stomatal conductance, water potential or photosynthetic activity, provide valuable insights but are costly, maintenance-intensive and difficult to scale for continuous, long-term observation. We propose a novel alternative approach: tracking tree sway through its seismic ground motion signature, referred to as the tree's seismic fingerprint. These wind-induced sway signals are intrinsically linked to the mechanical properties of leaves, branches and trunks, which change under environmental stress. Seismometers offer key advantages: they are non-invasive, low-maintenance and easily scalable for tree monitoring across forest plots.

Using observations from ground-based seismometers and trunk-mounted accelerometers at the ECOSENSE site in the Black Forest, we isolated and analysed tree sway signals based on spectral decomposition and vibrational mode tracking. We identified consistent tree-dependent sway frequencies around 0.2 Hz and demonstrated that ground-based sensors can capture sway dynamics without direct attachment. Using machine learning, we further showed that wind speed can be reliably predicted from seismic features, revealing that wind-induced mechanical input is encoded in ground motion.

These findings show that seismometers can passively monitor both environmental forcing and tree biomechanical response. As such, seismic sensing offers a powerful, scalable tool for forest monitoring, with the potential to capture both structural stability and stress-related changes under climate extremes.

How to cite: Umlauft, J., Mora, K., Limberger, F., Gerberding, K., Wirth, C., Werner, C., and Kattenborn, T.: The seismic fingerprint of wind-induced tree sway  , EGU General Assembly 2026, Vienna, Austria, 3–8 May 2026, EGU26-2935, https://doi.org/10.5194/egusphere-egu26-2935, 2026.

EGU26-3517 | ECS | Orals | BG2.4

Tree and leaf: merging multi-stream data, models and citizen science for phenological detection 

Midori Yajima, Luke Daly, Michael Rzanny, Jana Wäldchen, Patrick Mäder, Jacob A. Nelson, and Silvia Caldararu

Accurately quantifying phenological dynamics in vegetated systems is essential as the timing of seasonal plant activity drives water, nutrient, and carbon cycling, but it is also one of the processes most disrupted by environmental changes. Land Surface Models (LSMs) integrate phenology to represent these feedback loops between terrestrial ecosystem functioning and the global climate, but their performance relies on the type and quality of data used for evaluation. Traditional phenological datasets span from point observations (e.g. leaf-on, leaf-off dates), to high resolution ground measurements of greenness and productivity (e.g. GCC), to time series of remote sensed vegetation indexes (e.g. EVI). However, each observation type measures distinct ecosystem properties, and no single data source provides both the temporal and spatial coverage needed to fully represent phenology at regional and global scales. Here we integrate growing season metrics for 89 European temperate forests sites across scales, derived from eddy covariance measurements, phenocam time series, and MODIS remote sensed vegetation indexes. For the first time, we incorporate phenological dates derived from citizen science, drawing data from the Flora Incognita app, GBIF and iNaturalist, to calculate species-specific annual observation curves for 11 characteristic understory species spanning 2020-2024. By combining data streams, we evaluate the advantages and limitations of each for data-model integration, and further assess the potential of opportunistic species observations to scale up non-overlapping phenological data to ecosystems. By simulating the same sites with the QUINCY LSM we also investigate the role of process-based models to bridge between datasets, as the processes underlying growing season that they provide aid the interpretation of differences between observed phenological metrics. This work highlights the potential of integrating multi-scale phenological information, including underutilised contribution from citizen science, to improve our understanding of phenological dynamics. We additionally explore how LSMs can be leveraged together with data for ecological insight beyond evaluation, moving away from the traditional one-way relationship between data and models.

How to cite: Yajima, M., Daly, L., Rzanny, M., Wäldchen, J., Mäder, P., Nelson, J. A., and Caldararu, S.: Tree and leaf: merging multi-stream data, models and citizen science for phenological detection, EGU General Assembly 2026, Vienna, Austria, 3–8 May 2026, EGU26-3517, https://doi.org/10.5194/egusphere-egu26-3517, 2026.

EGU26-4304 | ECS | Posters on site | BG2.4

Recent water cycle changes in Spanish forests are driven by stand structure more than climatic changes 

Jesus Sánchez, Miquel De Cáceres, Jordi Vayreda, and Javier Retana

The water cycle in forests of many regions is being impacted by climatic changes, often including a decrease in precipitation and an increase in temperature, leading to an increase in green water (evapotranspiration) and a decrease in blue water (runoff + drainage). Additionally, forest expansion and development are prevailing processes in many rural areas due to the abandonment of traditional land uses. Stand leaf area growth further amplifies green water and reduces blue water availability. However, the interaction between climate change and stand structure changes is not well understood at large scales. We modeled Spanish forest water cycle using national inventories (1990–2020), analyzing climate and forest structure trends at plot level. Using three inventory surveys, we assessed green and blue water changes across forest types and compared managed vs. unmanaged forests. Results show green water increased and blue water decreased over time. Leaf area index (LAI) growth (trees and shrubs) had a stronger effect on green water than climate change. These factors, along with recent precipitation declines (2010–2020), also significantly reduced blue water. Basal area reduction improved blue water yield, but only in the short- mid-term, as stand LAI tended to recover over time. This study demonstrates that changes in stand structure can be as important, if not more so, than climatic changes in influencing the water cycle at the regional level. Moreover, our results support the idea that effective basal area reduction can enhance blue water production, but only if basal reduction practices are consistently maintained.

How to cite: Sánchez, J., De Cáceres, M., Vayreda, J., and Retana, J.: Recent water cycle changes in Spanish forests are driven by stand structure more than climatic changes, EGU General Assembly 2026, Vienna, Austria, 3–8 May 2026, EGU26-4304, https://doi.org/10.5194/egusphere-egu26-4304, 2026.

EGU26-4762 | Orals | BG2.4

Improved Estimation of Terrestrial Gross Primary Production Using a Mechanistic Light Reaction Model 

Fangmin Zhang, He Ma, Yulong Zhang, Yanyu Lu, Songhan Wang, and Jimei Han

Accurate quantification of global terrestrial gross primary production (GPP) is critical for understanding the carbon cycle, yet significant discrepancies persist in current estimates regarding their magnitude and spatiotemporal patterns. Solar-induced chlorophyll fluorescence (SIF) has emerged as a promising proxy for GPP; recent mechanistic light reaction (MLR) theories have successfully elucidated the mechanistic SIF-GPP link, while their applicability at the global scale remains unclear. Here, we propose an improved mechanistic light reaction model, qMLR, designed to apply the mechanistic SIF-GPP relationship for global GPP estimation. Building upon the original leaf-scale MLR theory, the model integrates GOSIF with flux tower-based parameter calibration; by implementing a climate-zone-specific calibration strategy based on the Köppen-Geiger system and employing Genetic Algorithms and Bayesian Optimization, we precisely characterized the nonlinear responses of maximum quantum yield of photochemistry (ΦPSIImax) and the fraction of open PSII reaction centers (qL) to environmental gradients, factors previously unaccounted for in global SIF-based GPP estimations. This approach generated a global 0.1° monthly GPP product for the period of 2004-2024. Validation against 425 eddy covariance sites demonstrates that qMLR matches or outperforms existing benchmark products in overall accuracy (R2=0.70), with a regression slope (0.93) closer to unity. The model's mechanistic framework corrects the systematic underestimation prevalent in traditional (e.g., FLUXCOM GPP and MODIS GPP) models over tropical regions: across 7 tropical forest validation sites, qMLR achieved a mean bias of -3.29%, markedly outperforming other mainstream products (mean bias of -28.21%). Our results reveal a global multi-year average GPP of approximately 152.03 ± 4.42 PgC yr-1, higher than the conventional estimate of ~120 PgC yr-1, and show an increasing trend of 0.642 PgC yr-2. This study successfully brings MLR model to global scale and provides a long-term global GPP dataset based on MLR model for the first time, highlights the central role of tropical forests in the global carbon cycle, and offers a new physical benchmark for accurately assessing global vegetation productivity.

How to cite: Zhang, F., Ma, H., Zhang, Y., Lu, Y., Wang, S., and Han, J.: Improved Estimation of Terrestrial Gross Primary Production Using a Mechanistic Light Reaction Model, EGU General Assembly 2026, Vienna, Austria, 3–8 May 2026, EGU26-4762, https://doi.org/10.5194/egusphere-egu26-4762, 2026.

EGU26-10567 | Posters on site | BG2.4

Reconciling Cross-Scale Discrepancies in CO₂ Fluxes. Preliminary Findings from the BenchFlux Project 

Emma Izquierdo-Verdiguier, Alvaro Moreno-Martinez, Paul Stoy, Oliver Sonnentag, Christopher Pal, Yanghui Kang, Trevor Keenan, Ankur R Desai, Stefan Metzger, Matthew Fortier, Maoya Bassiouni, Sadegh Ranjbar, Samuel Bower, Sophie Hoffman, Danielle Losos, and Jingfeng Xiao

The BenchFLUX project represents an important advance in evaluating nature-based climate solutions (NbCS) to address the growing climate crisis. The benchmarking of CO₂ fluxes using flux tower measurements and Earth Observation (EO) data is the project's aim, employing multiple approaches to introduce, compare, and integrate temporal and spatial scales. The methods used account for the nonlinear behavior of carbon flux dynamics across scales. Therefore, measurement harmonizations are fundamental for aligning ground and atmospheric measurements. And thus, BenchFLUX provides reliable models and products that accurately track carbon emissions from small local areas to the global scale.

To achieve this goal, the project combines eddy covariance flux tower ground data with multi-source EO data to create harmonized datasets for various advanced machine learning models at different scales. The processes use cloud computing technologies, such as Google Earth Engine and cloud-optimized workflows, to produce spatial CO₂ flux data at multiple spatial resolutions. The proposed methods, including Bayesian and knowledge-guided approaches to achieve accurate and consistent results, and the final products are nested across different temporal and spatial scales among the six international research teams, serving as an integrated element for cross-scale continuity.

The spatial scalability of these methods is analyzed in the project prototype results. Preliminary monthly average CO₂ exchange (GPP) results are provided from the highly standardized NEON sites database for the higher spatial resolution models, revealing discrepancies at multiple scales during both the growing and non-growing seasons. The initial results will also compare coarser spatial resolution models with the eddy covariance ground truth data. All these ongoing comparisons aim to identify the most reliable methods for scaling carbon flux estimates. This will help determine the best combination of techniques to ensure high local precision and global consistency, ultimately supporting continuous cross-scale resource management.

How to cite: Izquierdo-Verdiguier, E., Moreno-Martinez, A., Stoy, P., Sonnentag, O., Pal, C., Kang, Y., Keenan, T., Desai, A. R., Metzger, S., Fortier, M., Bassiouni, M., Ranjbar, S., Bower, S., Hoffman, S., Losos, D., and Xiao, J.: Reconciling Cross-Scale Discrepancies in CO₂ Fluxes. Preliminary Findings from the BenchFlux Project, EGU General Assembly 2026, Vienna, Austria, 3–8 May 2026, EGU26-10567, https://doi.org/10.5194/egusphere-egu26-10567, 2026.

EGU26-10652 | Orals | BG2.4

A 15-year XCO2-based assessment of the terrestrial carbon-cycle  

Sanam Noreen Vardag, Sourish Basu, Eva Mandel, Robin Grauer, Eva-Marie Metz, and André Butz

The GOSAT satellite is in orbit since 2009 and now allows a robust evaluation of interannual variability (IAV) in land–atmosphere exchange with global coverage over a period of 15 years.  We use monthly net land CO2 fluxes for 2009–2024 inferred from assimilation of GOSAT XCO2 together with in-situ CO2 data in the global inversion system TM5-4DVAR to provide a global overview of IAV of different regions and an in-depth understanding of the long-term carbon cycle over Australia.   

At the global scale, we compare the net ecosystem exchange (NEE) based on TM5-4DVAR to the ensemble mean of dynamic global vegetation model (DGVM) estimates from TRENDY v13. We find that DGVMs typically exhibit weaker IAV than XCO2 inversion-based fluxes suggesting that the modelled sensitivity of NEE to hydroclimatic variability remains underestimated in DGVMs.

Following the data fusion approach of our previous studies on semiarid ecosystems (Metz et al., 2023, Metz et al., 2025, Vardag et al., 2025), we then analyse the carbon cycle over Australia, where precipitation dynamics strongly control biogenic fluxes. For Australia, the inversion indicates a pronounced sink during La Niña conditions, but also reveals an exceptionally strong sink anomaly in 2022 to 2024. We investigate the origin of these anomalies using sun-induced fluorescence (SIF) and the gross fluxes of selected DGVMs. We find that GPP has increased strongly in 2022 to 2024 and discuss the role of climate and environmental disturbances for this increase.

Overall, the extended satellite record provides a novel opportunity for improving ecosystem parameterizations and finally reducing uncertainty in the global carbon budget.

References:

Metz, E.-M., Vardag, S.N.,  Basu, S., Jung, M., ... , Butz, A. Soil respiration–driven CO2 pulses dominate Australia’s flux variability. Science, 379, 1332-1335, https://doi.org/10.1126/science.add7833, 2023.

Metz, E.-M., Vardag, S. N., Basu, S., Jung, M., Butz, A.: Seasonal and in terannual variability in CO2 fluxes in southern Africa seen by GOSAT. Biogeosciences, 22, 555–584, https://doi.org/10.5194/bg-22-555-2025, 2025.

Vardag, S. N., Metz, E.‐M., Artelt, L., Basu, S., Butz, A. (2025). CO2 release during soil rewetting shapes the seasonal carbon dynamics in South American Temperate region. Geophysical Research Letters, 52, https://doi.org/10.1029/2024GL111725, 2025. 


How to cite: Vardag, S. N., Basu, S., Mandel, E., Grauer, R., Metz, E.-M., and Butz, A.: A 15-year XCO2-based assessment of the terrestrial carbon-cycle , EGU General Assembly 2026, Vienna, Austria, 3–8 May 2026, EGU26-10652, https://doi.org/10.5194/egusphere-egu26-10652, 2026.

EGU26-12874 | Orals | BG2.4

From Global to Local: Precision Carbon Flux Mapping for Natural Climate Solutions 

Alvaro Moreno-Martinez, Emma Izquierdo-Verdiguier, Jordi Muñoz-Mari, Johannes Hirn, Arthur Endsley, Ankur Desai, Stefan Metzger, Samuel James Bower, Nathaniel Robinson, Steve Greenberg, Nicholas Clinton, and Gustau Camps-Valls

Accurate monitoring of terrestrial CO₂ uptake is essential for Natural Climate Solutions and reducing carbon accounting uncertainty. Project-scale certification protocols can provide robust estimates but often depend on costly site-level measurements and are difficult to scale. Global carbon flux models provide continuous coverage, but their coarse resolution cannot represent heterogeneous land management. Bridging these approaches requires high-resolution, scalable carbon monitoring with transparent uncertainty estimates.

Within the BenchFlux project, we present initial results from a High-Resolution Carbon Flux Monitoring framework based on the Global Estimation Model (CARBON-GEM). CARBON-GEM integrates (i) surface reflectances from the HISTARFM data-fusion approach (Moreno-Martinez et al., 2020), (ii) meteorological drivers, and (iii) eddy-covariance (EC) observations to estimate both gross primary production (GPP) and net ecosystem exchange (NEE) daily at 30 m resolution. The approach utilizes machine-learning methods, such as neural networks, to capture nonlinear responses, and is implemented in Google Earth Engine for scalable mapping. The workflow also delivers pixel-level uncertainty quantification, moving beyond categorical quality flags to support auditability and interpretation.

In addition to standard out-of-sample cross-validation to assess robustness and generalization, we validate CARBON-GEM against independent, scale-aware FluxMapper ground truth (Metzger, S., 2018) provided by BenchFlux’s SpatialEddy component. FluxMapper couples next-generation EC processing with flux spatialization to enable explicit space-time matching and local-to-regional nesting. In this context, CARBON-GEM extends the FluxMapper-scale structure beyond individual stations, allowing continuity across diverse landscapes. Complementing this, FluxMapper provides a novel, independent benchmark for high-resolution carbon-flux estimates and serves as a robust reference point, alleviating standard EC spatial-resolution constraints and facilitating the decomposition of aggregate point measurements into fine-grained spatial patterns. CARBON-GEM and FluxMapper together establish a foundation for scalable, uncertainty-aware 30-meter monitoring of GPP and NEE. This approach captures essential spatial heterogeneity necessary for large-scale real-world auditing in NCS planning, reporting, and verification.


  • Moreno-Martínez, Á., Izquierdo-Verdiguier, E., Maneta, M. P., Camps-Valls, G., Robinson, N., Muñoz-Marí, J., ... & Running, S. W. (2020). Multispectral high-resolution sensor fusion for smoothing and gap-filling in the cloud. Remote Sensing of Environment, 247, 111901.
  • Metzger, S. (2018). Surface-atmosphere exchange in a box: Making the control volume a suitable representation for in-situ observations. Agricultural and Forest Meteorology, 255, 68-80.

How to cite: Moreno-Martinez, A., Izquierdo-Verdiguier, E., Muñoz-Mari, J., Hirn, J., Endsley, A., Desai, A., Metzger, S., Bower, S. J., Robinson, N., Greenberg, S., Clinton, N., and Camps-Valls, G.: From Global to Local: Precision Carbon Flux Mapping for Natural Climate Solutions, EGU General Assembly 2026, Vienna, Austria, 3–8 May 2026, EGU26-12874, https://doi.org/10.5194/egusphere-egu26-12874, 2026.

EGU26-13243 | ECS | Posters on site | BG2.4

Impact of compound soil heat and drought on terrestrial vegetation productivity 

Ankit Shekhar

Compound climate extremes are projected to increase in both intensity and frequency under future climate scenarios. While atmospheric heatwaves are well-documented, recent evidence suggests that soil temperature extremes can be more persistent and prominent than air temperature, leading to devastating compound soil heat and drought (CSHD) events. Despite their potential severity, our understanding of how these soil compound extremes impact terrestrial vegetation productivity remains limited.

This study utilizes high-frequency datasets from a global network of eddy covariance towers—including AmeriFlux, FLUXNET-2015, ICOS, and JapanFlux—to quantify the impact of CSHD on Net Ecosystem Productivity (NEP). We employ a data-driven machine learning framework to isolate and estimate the productivity losses specifically attributable to the compound soil heat and drought stress. We move beyond and use an explainable machine learning approach (XAI) to identify the primary drivers and reveal the non-linear sensitivities of various ecosystems to these extremes. Our findings provide critical insights into the resilience of the terrestrial biosphere and improve our ability to predict ecosystem responses to increasingly complex climate stressors.

How to cite: Shekhar, A.: Impact of compound soil heat and drought on terrestrial vegetation productivity, EGU General Assembly 2026, Vienna, Austria, 3–8 May 2026, EGU26-13243, https://doi.org/10.5194/egusphere-egu26-13243, 2026.

EGU26-13745 | Posters on site | BG2.4

Impacts of the 2024 Extreme Flooding Disaster on Greenhouse Gases Exchanges in Rice Floodplains of Southern Brazil 

Debora Regina Roberti, Alecsander Mergen, Cristiano Maboni, Tamires Zimmer, Maria Eduarda Oliveira, Daniel M. dos Santos, Eberton C. de Souza, Murilo Lopes, Michel B. Stefanello, João Victor Basso, Vitório L. Sathres, João V. da Silva, Hector V. B. da Rosa, and Rodrigo R. J. Jacques

Extreme hydrometeorological events have become more frequent and intense, with direct implications for carbon, water, and energy exchanges between the biosphere and the atmosphere. Decades ago, extensive areas of natural wetlands in southern Brazil were converted into flooded rice paddies. The extreme floods that affected the state of Rio Grande do Sul in 2024 highlighted the critical regulatory role of these areas. Even when used for agriculture, wetlands acted as natural hydrological buffers, attenuating flood peaks. However, prolonged inundation can substantially alter greenhouse gas exchanges, particularly methane (CH₄), under anaerobic soil conditions. This study quantified the impacts of the extreme floods of 2024 on ecosystem–atmosphere exchanges of CO₂, CH₄, and H₂O, based on continuous eddy covariance measurements conducted in an irrigated rice lowland in southern Brazil. The site is managed under a typical intensive regional system and followed the crop rotation sequence: flood-irrigated rice (December 2023 to April 2024); winter fallow due to prolonged flooding (May to October 2024); rainfed soybean (December 2024 to April 2025); and forage crops with cattle grazing (May to October 2025). The study compared the May–October period of 2024 (flood year) with the same period in 2025 (non-flood year). During the prolonged inundation period in 2024, the system exhibited higher CO₂ and CH₄ emissions compared to the corresponding non-flooded period in 2025, while Evapotranspiration was similar. The absence of flooding and the cultivation of forage crops in 2025 resulted in reductions of up to 20% in CO₂ emissions and 60% in CH₄ emissions relative to the flooded fallow period of 2024. These results demonstrate that extreme hydrological disturbances can induce short but intense pulses of greenhouse gas emissions, with persistent effects on annual carbon balances. At the same time, adaptive management practices, such as crop rotation and the reduction of fallow periods, show potential to mitigate these effects and enhance agroecosystem resilience. The findings contribute to the derivation of local emission factors, the development of climate-adaptive agricultural strategies, and integrated assessments of extreme events at local and regional scales.

How to cite: Roberti, D. R., Mergen, A., Maboni, C., Zimmer, T., Oliveira, M. E., dos Santos, D. M., de Souza, E. C., Lopes, M., Stefanello, M. B., Basso, J. V., Sathres, V. L., da Silva, J. V., da Rosa, H. V. B., and Jacques, R. R. J.: Impacts of the 2024 Extreme Flooding Disaster on Greenhouse Gases Exchanges in Rice Floodplains of Southern Brazil, EGU General Assembly 2026, Vienna, Austria, 3–8 May 2026, EGU26-13745, https://doi.org/10.5194/egusphere-egu26-13745, 2026.

EGU26-14420 | ECS | Posters on site | BG2.4

An innovative experimental design based on Uber Hexagons for strategic IoT sensor placement across contrasting remote forest ecosystems: a proposal from the RemoTrees project 

Cristian Mestre Runge, Christoph Reudenbach, Davide Andreatta, Luca Belelli Marchesini, Benjamin Brede, Fernando Camacho, David Löening, Christoph Lotz, Riccardo Valentini, Loris Vescovo, and Lars Opgenoorth

Forest monitoring under climate change and extreme events remains constrained by the scarcity of continuous in-situ observations in remote areas introducing spatial bias in reference networks, weakening disturbance attribution, and limiting calibration and validation of Earth Observation (EO) products. The EU project RemoTrees addresses this limitation by developing an autonomous forest monitoring system that combines low-power IoT sensing with satellite communication tested across sites representing contrasting forest biomes.

We present the deployment framework to (i) select monitoring domains and (ii) define harmonized sensor installation on stems, in soils, and for reference radiation measurements under consistent criteria across sites. At Level-1 sites, prototypes are benchmarked against established reference instrumentation and protocols to quantify accuracy, drift, reliability, and sensitivity to environmental conditions. Resulting performance and calibration diagnostics guide the transfer to Level-2 sites, which are more remote and demanding, evaluating operational robustness and calibration stability under extreme conditions, including sensor nonlinearities, power and performance limitations, and communication reliability.

Spatial sampling is formalized through a hierarchical hexagonal tessellation based on H3 indexing. Nested hexagons define spatial units from the installation scale to the domain scale, generating an internal network with homogeneous spatial coverage and explicit neighbourhood relations and, by providing scale-compliant aggregation units aligned with EO pixel footprints and uncertainty cores, enable statistically comparable in situ–EO matching beyond single-point validation. This H3-based spatial framework links point measurements with EO products at pixel resolution and enables coherent aggregation from tree to domain while reducing reliance on single-point observations. Domain selection and installation location choice are driven by a multi-criteria spatial decision analysis that integrates: (1) crown-scale structural phenotyping and geo-environmental covariates derived from airborne laser scanning surface models; and (2) Sentinel-2 space–time data cubes aggregated to individual crown objects, including spectral indices and biophysical/-chemical variables i.e. fAPAR, LAI, leaf chlorophyll, and canopy chlorophyll content selected for their functional linkage to photosynthesis, radiation use efficiency, and water stress as well as relatability to in situ measurements of radiation, sap flow, and radial growth. Decisions are implemented as a two-step process: minimum suitability filtering followed by a weighted, normalized composite ranking applied consistently to both domains and candidate crowns/trees, to capture intra-domain variability and optimize final tree and soil-point selection. 

The resulting design turns sensor placement into an explicit, transferable multi-scale sampling scheme supporting continuous time series of key variables, including fAPAR; multispectral measurements of incident, canopy reflected and transmitted solar radiation, tree stem radial growth and motions, sap flow, soil temperature and moisture, besides air temperature and humidity below and above the forest canopy. In parallel, the workflow consolidates a traceable inventory of the monitoring domain and instrumented locations, structured as metadata for database integration and analytical use, thereby supporting cross-site comparability and transfer of the design to Level-2 deployments under FAIR principles, and interoperability between in situ and EO systems.

How to cite: Mestre Runge, C., Reudenbach, C., Andreatta, D., Belelli Marchesini, L., Brede, B., Camacho, F., Löening, D., Lotz, C., Valentini, R., Vescovo, L., and Opgenoorth, L.: An innovative experimental design based on Uber Hexagons for strategic IoT sensor placement across contrasting remote forest ecosystems: a proposal from the RemoTrees project, EGU General Assembly 2026, Vienna, Austria, 3–8 May 2026, EGU26-14420, https://doi.org/10.5194/egusphere-egu26-14420, 2026.

EGU26-14463 | ECS | Posters on site | BG2.4

Extreme weather event responses of collocated forest, lake and peatland ecosystems 

Abin Thomas, Eyrún Gyða Gunnlaugsdóttir, Marta Fregona, and Ivan Mammarella

The frequency and intensity of extreme weather events (EWEs) have increased in recent decades and are projected to continue rising globally. The impact of EWE on boreal ecosystems can be disproportionate. In forests, the exchange of CO2  is affected by droughts depending on their timing and severity. In lakes, heatwaves might strengthen stratification and trigger oxygen depletion, with consequences on greenhouse gas (GHG) dynamics. Excessive heat and winds can also increase GHG emissions from peatlands and lakes. The driving mechanisms of GHG exchange in these three ecosystems differ, and their responses to EWE also vary. 

Long-term flux data, obtained with the Eddy covariance (EC) technique, enable us to establish a baseline response and analyse how these different ecosystems react to EWE. The EC technique measures the vertical exchange of gases, particles, and energy at an ecosystem scale, with a 30-minute interval, demonstrating the instantaneous response of the ecosystem.

Here, we analysed the effect of EWE on GHG dynamics from adjacent forest (Hyytiälä), lake (Kuivajärvi) and peatland (Siikaneva) ecosystems, where long-term EC flux measurements are available. EWE, such as heatwaves, dry spells, excessive rainfall, prolonged high wind spells, and compound events, have been identified in the last decade using both in situ and ERA5 reanalysis Land hourly datasets. The ecosystems exhibit contrasting responses to the EWEs. For instance, during the 2018 heatwave, the forest exhibited enhanced CO2 uptake, while both the lake and the peatland showed increased emissions relative to the reference period (2013-17).

How to cite: Thomas, A., Gunnlaugsdóttir, E. G., Fregona, M., and Mammarella, I.: Extreme weather event responses of collocated forest, lake and peatland ecosystems, EGU General Assembly 2026, Vienna, Austria, 3–8 May 2026, EGU26-14463, https://doi.org/10.5194/egusphere-egu26-14463, 2026.

EGU26-14806 | ECS | Orals | BG2.4

Partitioning NEE Uncertainty Sources Using a FLUXCOM-X Ensemble 

Qi Yang, Sophia Walther, Jacob Nelson, Gregory Duveiller, Zayd Hamdi, and Martin Jung

Quantifying uncertainties in data-driven upscaling of biogenic carbon fluxes is essential for improving our understanding of global carbon cycle processes and for providing robust priors to atmospheric inversion systems. However, most existing global carbon flux products derived from data-driven approaches either provide no uncertainty assessments, or are limited to incomplete sources.

In this study, we developed an ensemble of net ecosystem exchange (NEE) estimates within the FLUXCOM-X framework to systematically quantify uncertainty contributions from multiple sources across the entire carbon flux upscaling workflow. These sources include choices regarding eddy covariance (EC) measurement post-processing, meteorological forcing, predictor set, training data splitting, and machine-learning model. Specifically, we post-processed raw EC data using a Monte Carlo approach that randomly selects the friction velocity (u*) threshold for each site to quantify uncertainty related to the EC measurement. Meteorological uncertainty was represented using a 10-member, 3-hourly ERA5 ensemble. Predictor selection uncertainty was assessed by applying a hybrid genetic algorithm to select multiple “equally good” predictor combinations used to train predictor ensembles. In addition, uncertainties related to site representativeness and model structure were captured through alternative training data splits and by training machine-learning models (i.e., xGBoost, RF, and MLP) with different random seeds. As a result, a large ensemble of spatiotemporally explicit NEE estimates at hourly and 0.05 deg resolution was generated.

We further analyzed the relative contributions of these uncertainty sources to the total spatial and temporal uncertainty of NEE. Results for Europe indicate that predictor selection uncertainty dominates the upscaling uncertainty, followed by training data splitting uncertainty and EC post-processing uncertainty. In contrast, the ensemble spread associated with meteorological forcing and XGBoost models is relatively small, whereas MLP models exhibit substantially larger spread. The total uncertainty of the ensemble is not uniformly distributed across the study region; instead, it exhibits spatial hotspots particularly in Ireland, west of the United Kingdom, and the northern coast of Africa. The same ensemble-based methodology will next be applied globally to quantify and attribute regional NEE uncertainties worldwide.

How to cite: Yang, Q., Walther, S., Nelson, J., Duveiller, G., Hamdi, Z., and Jung, M.: Partitioning NEE Uncertainty Sources Using a FLUXCOM-X Ensemble, EGU General Assembly 2026, Vienna, Austria, 3–8 May 2026, EGU26-14806, https://doi.org/10.5194/egusphere-egu26-14806, 2026.

EGU26-15071 | Orals | BG2.4

Assessing the Potential of UAV Thermal Imagery for Upscaling Tree-Level Physiological Measurements 

Quddus Busari, Rachel Gaulton, and Paul Brown

Forests worldwide are increasingly threatened by biotic and abiotic stressors, yet many operational monitoring approaches rely on visual surveys or spectral and structural proxies that often reflect anomalies only after physiological dysfunction has become pronounced. Wireless sensor networks such as TreeTalker[1] enable continuous observation of tree physiological and hydrological states that may reveal stress responses before visible symptoms emerge. However, the individual tree-level nature of these observations necessitates upscaling approaches capable of extending physiological insights to unsensed trees across forest stands. In this study, we present thermal infrared remote sensing as a promising method for this purpose, as canopy temperature is theoretically linked to transpiration and stomatal regulation[2].

A physiological and hydrological baseline was first established using TreeTalker observations collected between July 2021 and August 2022 across two temperate forest plantations (Long and Belt plantations, UK). Soil moisture dynamics were characterised using changepoint-based segmentation to describe event-scale drydown behaviour, rainfall response timing, and drought occurrence. At the tree level, soil-stem coupling was quantified using night-time stem water content, while sap flow regulation and recovery were examined using cross-correlation and Granger causality frameworks that incorporated atmospheric demand via vapour pressure deficit. Together, these analyses revealed strong inter-tree and seasonal variability in hydraulic coupling and regulation strategies, providing a baseline characterisation of site and tree condition.

Building on the TreeTalker baseline, thermal surveys were conducted in May 2025 using a laboratory-calibrated DJI Matrice 210-mounted Zenmuse XT sensor over the same plantations. Tree-level mean canopy temperatures were then extracted from processed thermal orthomosaics and compared with contemporaneous TreeTalker measurements of sap flow and stem water content acquired at or near the UAV overpass. Results show that an inverse relationship between canopy temperature and sap flow is more consistently expressed among Belt Plantation trees, although notable exceptions indicate heterogeneous regulation strategies. In Long Plantation, this pattern is not dominant across the population and is largely driven by a single high-sap flow tree exhibiting a markedly cooler canopy, while most other trees show substantial scatter. No clear relationships between canopy temperature and stem water content are observed at both sites. Additional information from visual surveys of tree condition indicates that some trees exhibiting pronounced structural symptoms deviate from the general thermal-sap flow tendency, suggesting that canopy structure may contribute to tree-specific decoupling without explaining site-wide patterns.

These results indicate that UAV-derived canopy temperature primarily reflects instantaneous hydraulic flux and regulatory behaviour rather than buffered internal water storage. By anchoring thermal observations within a multi-season physiological baseline, this work demonstrates how thermal imagery can be used to upscale continuous tree-level sap flow measurements.

References

[1] Valentini, R., Belelli, M.L., Gianelle, D. et al. New tree monitoring systems: from Industry 4.0 to Nature 4.0. Ann. Silvic. Research 43(2), 84–88 (2019). https://doi.org/10.12899/asr-1847

[2] Smigaj, M., Agarwal, A., Bartholomeus, H. et al. Thermal Infrared Remote Sensing of Stress Responses in Forest Environments: a Review of Developments, Challenges, and Opportunities. Curr. For. Rep. 10, 56–76 (2024). https://doi.org/10.1007/s40725-023-00207-z

How to cite: Busari, Q., Gaulton, R., and Brown, P.: Assessing the Potential of UAV Thermal Imagery for Upscaling Tree-Level Physiological Measurements, EGU General Assembly 2026, Vienna, Austria, 3–8 May 2026, EGU26-15071, https://doi.org/10.5194/egusphere-egu26-15071, 2026.

To clarify the impacts of drought, high temperature, and nitrogen application on the growth, yield, and grain quality of spring maize, the variety "Danyu 405" was used as the test material. Experiments involving drought stress, high temperature stress, and nitrogen addition were conducted during key growth stages such as jointing, tasseling, and flowering. The study systematically revealed the comprehensive effects of drought, high temperature, and nitrogen fertilization on spring maize (variety 'Danyu 405'). In the water-nitrogen interaction experiments, it was found that compared with the control under adequate water conditions without nitrogen, moderate drought combined with nitrogen application at the jointing or tasseling stages increased plant height, barren tip ratio, amino acid content, and crude protein content. However, it significantly suppressed the leaf area index, biomass, hundred-grain weight, and theoretical yield, while reducing grain fat and starch content. Drought at the tasseling stage was particularly detrimental to yield, with an average reduction of 40.8% in theoretical yield. Furthermore, as nitrogen application increased, most yield-related indicators showed a declining trend, while some quality indicators (such as starch) improved, indicating that nitrogen application under drought conditions could enhance certain quality traits while inhibiting yield. In experiments combining temperature and water stress, it was further demonstrated that drought, high temperature, and their combined stress significantly reduced the maximum carboxylation rate of leaves (by 23.3% to 33.2%) and yield. Drought alone reduced yield by 40.0%, while the combined effect of high temperature and drought was less severe than that of drought alone. Additionally, the combined stress significantly altered grain quality, manifesting as increased fat and amino acid content and decreased starch content. The findings provide a theoretical basis for spring maize production in Northeast China to address climate change and optimize water and nitrogen management.

How to cite: Chen, N.: Effects of Drought, High Temperature, and Nitrogen Application on the Growth, Yield, and Grain Quality of Spring Maize in Northeast China, EGU General Assembly 2026, Vienna, Austria, 3–8 May 2026, EGU26-15781, https://doi.org/10.5194/egusphere-egu26-15781, 2026.

EGU26-16346 | ECS | Posters on site | BG2.4

A TLS-Based Framework for Individual-Tree Structural Reconstruction and Improved Biomass Estimation 

Boda Vinesh and Mukund Dev Behera

Accurate representation of forest structure and above-ground biomass (AGB) at the individual-tree scale is essential for improving carbon cycle assessments and enabling emerging forest Digital Twin applications. Terrestrial Laser Scanning (TLS) provides high-resolution three-dimensional observations of vegetation structure; however, transforming dense point clouds into biologically meaningful and computationally efficient tree-level models remains challenging. Here, we present a TLS-based end-to-end framework for individual-tree structural reconstruction and component-wise AGB estimation using high-density point cloud data acquired over a small forest copse within the Indian Institute of Technology Kharagpur campus using a Terrestrial Laser Scanning system.


The workflow begins with multi-scan point cloud registration and preprocessing, including noise removal, ground filtering, and vegetation isolation. Multi-view acquisition is employed to mitigate occlusion, and residual data gaps are addressed through model-based structural interpolation of woody elements. Individual trees are delineated using geometric clustering-based instance segmentation (TreeIso), with segmentation quality assessed against field-mapped stem locations. Leaf and woody components are separated using a combination of graph-based structural analysis. Woody architecture, including stems and branches, is reconstructed using quantitative structure modelling (TreeQSM), where adaptive cylinder fitting is applied to derive branching topology and woody volume. Leaf biomass is estimated independently by converting classified leaf points into a voxel-based crown representation from which leaf area is derived. Leaf mass is then calculated using species-specific specific leaf area (SLA) values obtained from field sampling. Species identity and corresponding wood density values are assigned using concurrent field inventory data. Component-wise woody and foliar masses are combined to obtain tree-level AGB estimates. Each stage is implemented using alternative models and parameterisations. Selected models are regionally calibrated to improve performance under the conditions of the study area.


To ensure biological realism, reconstructed tree geometry is validated against field measurements and reference allometry using stem diameter at breast height (DBH), tree height, and crown metrics, and sensitivity analyses are conducted to quantify uncertainty propagation from segmentation, classification, and QSM parameterisation into final biomass estimates. The final framework demonstrates the potential of TLS-derived point clouds to produce validated, structurally explicit tree-level models that support carbon accounting, ecosystem modelling, and calibration of airborne and satellite-based biomass products, thereby bridging in situ measurements and multi-scale Earth observation systems.


Keywords : Terrestrial Laser Scanning (TLS); Individual-tree segmentation; Leaf–wood separation; TreeQSM; Above-ground biomass (AGB).

How to cite: Vinesh, B. and Behera, M. D.: A TLS-Based Framework for Individual-Tree Structural Reconstruction and Improved Biomass Estimation, EGU General Assembly 2026, Vienna, Austria, 3–8 May 2026, EGU26-16346, https://doi.org/10.5194/egusphere-egu26-16346, 2026.

EGU26-16479 | ECS | Orals | BG2.4

Determining the controlling factors for carbon sequestration in two contrasting forests in the Boreal and semi-arid Mediterranean regions (Part II) 

Laura Rez, Timo Vesala, Pasi Kolari, Eli Tziperman, Rachamim Rubin, and Dan Yakir

Evergreen needleleaf forests span a wide climatic range, yet their carbon sequestration is increasingly constrained by climate-driven environmental limits. Building on results presented at EGU 2025, which showed a shift in the dominant seasonal control on productivity from atmospheric moisture in the Boreal Hyytiälä forest (Finland, HYY) to soil moisture in the semi-arid Yatir forest (Israel, YAT), we identify the environmental boundary conditions underlying this contrast.

Using PAR-saturated conditions to isolate eco-physiological controls on productivity, we derive key climatic and hydrological thresholds from SHAP-based analyses. In YAT, productivity is strongly constrained by deep soil water availability, with a clear threshold at ~15.8 %vol in the deepest measured soil layer (~45 cm). This threshold reflected a seasonal transition where deep soil moisture shifts from limiting productivity (ineffective water retention and root resistance) to supporting shallow root water uptake and productivity during the wet season. This transition coincides with the seasonal minimum in soil temperature imposing peak root resistance, indicating a compounded control on the onset of productivity in this water-limited ecosystem.

In contrast, seasonal productivity in HYY is dominated by precipitation, which both sustains evapotranspiration, closely linked to net ecosystem productivity (R=0.96), and likely reflects a favorable cloud and radiation regime. The high historical ratio of diffuse to direct shortwave radiation in HYY (Sdiff:S ~ 3:4) helps to buffer canopy conductance against high vapor pressure deficit (VPD), consistent with the high sensitivity observed at this site (negative productivity response at VPD > 1 kPa). Such atmospheric constraints are lacking in YAT, where diffuse radiation is limited  (Sdiff:S ~ 1:4) and VPD shows an order of magnitude larger range.

Despite adaptation to such contrasting environments, both forests exhibit a similar optimal air temperature range for productivity (14–20 °C), which highlights a shared physiological optimum across the divergent environmental limitations. Overall, our results demonstrate that carbon sequestration in these systems is not controlled by universal drivers, but by site-specific boundary conditions, such as deep soil water availability in semi-arid Mediterranean forests and precipitation-linked atmospheric regimes in Boreal forests.

How to cite: Rez, L., Vesala, T., Kolari, P., Tziperman, E., Rubin, R., and Yakir, D.: Determining the controlling factors for carbon sequestration in two contrasting forests in the Boreal and semi-arid Mediterranean regions (Part II), EGU General Assembly 2026, Vienna, Austria, 3–8 May 2026, EGU26-16479, https://doi.org/10.5194/egusphere-egu26-16479, 2026.

Accurately representing terrestrial carbon fluxes from local ecosystems to continental scales is a central challenge for land-ocean interface, particularly concerning the fate of carbon transformed during transportation. It is required to apply robust validation to accurately project continental carbon fluxes, yet the ultimate fate of carbon exported from land to ocean remains a key uncertainty. While marine sedimentary archives provide an integrated, long-term record of this flux, our ability to interpret those after degradation and diagenetic processes is paramount. Fluorescence EEM-PARAFAC is a promising technique for the source identification in water column, but we argue its application in sedimentary organic matter.

The conventional use of EEM-PARAFAC assigns fluorescent components (C, A, M) to specific terrestrial or marine sources, underpinning popular indices like the Humification Index (HIX). However, we show this source-centric view is incomplete for three key reasons. First, the diagenetic environment can overwrite source signals; anoxic processing of terrestrial matter, for example, can mimic a 'marine' low-HIX signature. Second, key indices like HIX are inherently sensitive to organic matter concentration, requiring careful re-calibration to separate measurement artifacts from true biogeochemical change. Third, thermal alteration during deep burial further degrades and distorts these fluorescent signals.

Instead of viewing these sensitivities as confounding factors, we propose repurposing them as diagnostic tools based on the results of indoor incubation monitoring and in-situ profiles combining paleoenvironmental analysis. In this new framework, fluorescent signatures become proxies for the environment itself with correction and background information: HIX, AC/M, and P/H can trace paleoenvironments, e.g., historical redox conditions, paleo-thermometers.

By embracing this holistic approach, we transform EEM spectroscopy from a simple source-tracker into a dynamic environmental recorder. This study unlocks a richer, multi-layered narrative of carbon's journey from source to sequestration, providing a powerful new set of process-based constraints. 

How to cite: Gan, S.: Bridging Molecular Signatures from Terrestrial to Continental: A Critical Re-evaluation of EEM-PARAFAC as a Diagnostic Tool for Carbon Source Fingerprints, EGU General Assembly 2026, Vienna, Austria, 3–8 May 2026, EGU26-17050, https://doi.org/10.5194/egusphere-egu26-17050, 2026.

EGU26-17114 | ECS | Orals | BG2.4

Using Atmospheric COS–CO₂ Seasonal Amplitude Ratios to Quantify C4 Contributions to GPP 

Yasmin L Bohak, John B. Miller, Stephen A. Montzka, Bharat Rastogi, Aleya Kaushik, and Dan Yakir

Enhanced photosynthetic CO₂ uptake (gross primary productivity; GPP) by terrestrial plants in response to rising atmospheric CO₂ concentrations constitutes the largest and most uncertain ecosystem feedback on climate. Direct measurement of GPP at scales above the leaf is not possible due to co-occurring respiratory fluxes. Carbonyl sulfide (COS) has emerged as a promising tracer of GPP across scales because of its predominantly one-way flux into leaves and the use of leaf relative uptake (LRU) to convert COS uptake into GPP. However, differences in the relative uptake of COS to CO₂ between C3 and C4 vegetation across scales must be accounted for in the application of COS as a tracer and could potentially be applied to detect climate-driven shifts in C3/C4 vegetation distributions. These aspects have largely been ignored, with most COS measurements focusing on C3 vegetation, and only limited C4 COS measurements available.

Here, we develop an atmospheric-based approach to identify and quantify C4 vegetation contributions to large-scale photosynthetic uptake using existing COS and CO₂ concentration measurements from multiple NOAA Global Monitoring Laboratory (GML) network sites. We analyze the seasonal cycle amplitudes of COS as a function of CO₂, defined as atmospheric relative uptake (ARU), and identify sites that deviate from the regression line describing the majority of sites. We derive an analytical framework linking leaf-, ecosystem-, and atmospheric-scale relative uptake, explaining how shifts in physiological traits characteristic of C3 and C4 vegetation influence atmospheric COS and CO₂ signals. Using this framework together with gridded fluxes from the land surface model: Simple Biosphere Model (version 4; SiB4), we show that sites influenced by C4 vegetation exhibit systematic deviations in ARU relative to predominantly C3-influenced sites. These results demonstrate that ARU provides a viable means of detecting and quantifying C4 vegetation contributions to GPP at regional scales (102 – 103 km2), and can be used to detect climate-driven shifts in C3/C4 distributions. Our study advances the use of COS as a tracer of GPP and of C3 and C4 photosynthesis across scales.   

How to cite: Bohak, Y. L., Miller, J. B., Montzka, S. A., Rastogi, B., Kaushik, A., and Yakir, D.: Using Atmospheric COS–CO₂ Seasonal Amplitude Ratios to Quantify C4 Contributions to GPP, EGU General Assembly 2026, Vienna, Austria, 3–8 May 2026, EGU26-17114, https://doi.org/10.5194/egusphere-egu26-17114, 2026.

Accurate prediction of carbon exchange in the Central Indian Himalaya, a global biodiversity hotspot with extreme vertical gradients and monsoon variability, remains critical for regional carbon assessments. Despite substantial sequestration potential in Himalayan pine forests, mechanistic drivers of net ecosystem exchange (NEE) are poorly constrained, while alpine grassland carbon dynamics remain enigmatic due to observational scarcity at high elevations. Here, we integrate bidirectional long short-term memory (BiLSTM) networks with SHAP explainability to predict hourly NEE and quantitatively rank environmental controls across contrasting ecosystems. Continuous eddy covariance data from a needleleaf forest (Kosi-Katarmal, 1217 m; April-October 2020-2022) and alpine grassland (Darma Valley, 3240 m; July-October 2022-2023) were analyzed using air temperature, relative humidity, net radiation, soil conditions, vapor pressure deficit, NEE derivatives, and multi-scale lag features (1-24 h). The BiLSTM model achieved exceptional performance (forest: R² = 0.94-0.95, RMSE = 2.18-2.86 μmol m⁻² s⁻¹; grassland: R² = 0.95-0.96, RMSE = 1.09-1.73 μmol m⁻² s⁻¹). Critically, SHAP attribution unveiled fundamentally divergent control mechanisms: forest NEE was governed by rapid temporal dynamics (NEE derivative, SHAP: 0.70) and radiation-temperature coupling (SHAP: 0.02 each), signifying energy-driven photosynthetic control. Conversely, grassland NEE exhibited strong short-term memory (1-h lag, SHAP: 0.35) and atmospheric constraint dominance (temperature, SHAP: 0.06, humidity: 0.03), reflecting stomatal regulation and evaporative demand at high elevation. These findings demonstrate that forest carbon exchange operates as an energy-limited, dynamically responsive system, whereas grasslands function as atmospheric-demand limited systems with pronounced temporal persistence. Our results provide a mechanistic framework for ecosystem-specific carbon flux modeling and demonstrate the efficacy of explainable AI for process understanding in data-sparse mountain regions.

How to cite: Lohani, P. and Mukherjee, S.: Prioritizing Ecosystem-Specific Carbon Exchange Drivers in Central Himalayan Forest and Grassland Using Bidirectional LSTM and SHAP Analysis, EGU General Assembly 2026, Vienna, Austria, 3–8 May 2026, EGU26-17852, https://doi.org/10.5194/egusphere-egu26-17852, 2026.

EGU26-17965 | ECS | Posters on site | BG2.4

Litter nutrient turnover influences soil CO2 emissions in oak-dominated ecosystems  

Stavroula Zacharoudi, Gavriil Spyroglou, Mariangela Fotelli, and Kalliopi Radoglou

Global biochemical cycles in forest ecosystems may shift as a result of climate change conditions. It is essential to comprehend how biogeochemical cycles and environmental factors control nutrient releases and storage in soils and forest ecosystems. Moreover, soil is the largest storage pool of carbon and nutrients. Nutrient availability, particularly in litter and soil, directly influences tree growth and biomass accumulation, which in turn impacts forest structure, productivity, nutrient cycling, and soil CO2 emissions.

In this work, we investigate how the litter nutrient dynamics and turnover can influence the soil CO2 emissions in Mediterranean oak-dominated ecosystems with a soil manipulation experiment in the Xanthi region of northern Greece. We studied soil CO2 efflux under three organic matter input treatments: Control [CON] (undisturbed), No-Litter [NL] (aboveground litter excluded) and No-Litter-No-Roots [NLNR] (both litter and roots excluded). Monitoring plots were established in a broadleaf evergreen ecosystem dominated by Quercus coccifera L. and Phillyrea latifolia L. Equal plots were established in a deciduous oak forest dominated by Quercus frainetto Ten., followed by Quercus cerris L. and Quercus petraea (Matt.). Using a Li-8100 automated soil CO2 efflux system, soil respiration, moisture and temperature measurements were conducted at 54 points in total, once every three months for two years (2023-2024). We also analyzed a range of nutrients in litterfall and forest floor and estimated their turnover rates to determine their effect on soil respiration. Our results showed that in both ecosystems, soil temperature and moisture predominantly controlled soil CO2 effluxes. Litter turnover was identified as a key driver of soil CO2 efflux in broadleaf evergreens linked to the nutrient dynamics of carbon (C), nitrogen (N), manganese (Mn), and calcium (Ca). Similarly, in deciduous oaks, litter turnover significantly influenced soil CO2 efflux, particularly in relation to C, N, C/N, and potassium (K). This work supports our better understanding of the influence of nutrient cycling on soil emissions in Mediterranean forest ecosystems.

How to cite: Zacharoudi, S., Spyroglou, G., Fotelli, M., and Radoglou, K.: Litter nutrient turnover influences soil CO2 emissions in oak-dominated ecosystems , EGU General Assembly 2026, Vienna, Austria, 3–8 May 2026, EGU26-17965, https://doi.org/10.5194/egusphere-egu26-17965, 2026.

EGU26-18260 | Posters on site | BG2.4

Changing vegetation-carbon-climate relationships in India during recent decades  

Jayanarayanan Kuttippurath and Rahul Kashyap

India is the second largest contributor to the global greening, which is situated in the higher carbon uptake tropical region. We find that India has been greening with a marked enhancement in Normalised Difference Vegetation Index (NDVI, 10%), Leaf Area Index (LAI, 11%) and Solar Induced Fluorescence (SIF, 13%) in recent decade (2010 to 2019) as compared to previous decade (2000 to 2009). This greening is largely cropland-based where croplands exhibit twice the greening magnitude of forests. Cropland greening driven by improved irrigation facilities, better farm mechanisation, enhanced land management and use of nitrogen fertilisers contributes 86.5% to India’s net greening. To comprehend the translation of this greening into ecosystem health and functionality, we assess the Carbon Use Efficiency (CUE), and Water Use Efficiency (WUE). Soil moisture (SM) exhibits direct causal relationships with CUE and its determinants, with SM being the primary driver of both CUE and WUE. The coupling of the carbon and water cycles in India has intensified in recent decades, particularly in croplands. We find hindered ability of Indian forests to translate the structure (greenness) into functioning (carbon uptake) recent decades. To further decipher this, we for the first time estimated the Ecosystem Photosynthetic Efficiency (EPE) for Indian forests. Our recent study explicitly highlights the weakening of Indian forests as carbon stocks in the recent decade (2010–2019) from the previous decade (2000–2009) due to reduction in the translation factor i.e., EPE. This decline in EPE is predominant in the pristine forests of eastern Himalaya and Western Ghats due to enhanced moisture stress, rising aridity and increased wildfires, in the warming climate. We find just 16% of the Indian forests maintain high ecological integrity or intactness.


How to cite: Kuttippurath, J. and Kashyap, R.: Changing vegetation-carbon-climate relationships in India during recent decades , EGU General Assembly 2026, Vienna, Austria, 3–8 May 2026, EGU26-18260, https://doi.org/10.5194/egusphere-egu26-18260, 2026.

EGU26-18587 | ECS | Posters on site | BG2.4

 Early detection of cork oak decline in Mediterranean forests using TreeTalker®Cyber physiological monitoring 

Salvatore Riggi, Bruno Scanu, Fabio Salbitano, Mauro Lo Cascio, Donatella Spano, Riccardo Valentini, and Costantino Sirca

Mediterranean cork oak forests are increasingly threatened by abiotic and biotic stressors, with Phytophthora emerging as a major cause of tree decline. This study presents preliminary results from an ongoing monitoring experiment aimed at investigating the effects of Phytophthora infection on hydraulic functioning and growth dynamics of cork oak (Quercus suber L.) in a stand located in central Sardinia (Italy). Two experimental theses were considered: healthy trees and declining trees affected by Phytophthora.

Ten trees were continuously monitored starting from May 2025 using TreeTalker®Cyber devices (five per thesis) to measure sap flow velocity, stem radial growth, and microclimatic variables, including air temperature, relative humidity, and vapour pressure deficit (VPD). High-frequency physiological data were integrated with atmospheric conditions to assess differences in tree water use and growth performance between the two theses.

Preliminary results showed a substantial reduction in sap flow magnitude and altered diurnal patterns in declining trees compared to healthy individuals. In addition, declining trees exhibited a pronounced reduction in stem radial growth compared to healthy individuals, indicating a combined impairment of hydraulic functioning and growth processes associated with Phytophthora infection. These findings demonstrate the potential of IoT-based proximal sensing for detecting early physiological signals of tree decline and support its application in forest health monitoring.


How to cite: Riggi, S., Scanu, B., Salbitano, F., Lo Cascio, M., Spano, D., Valentini, R., and Sirca, C.:  Early detection of cork oak decline in Mediterranean forests using TreeTalker®Cyber physiological monitoring, EGU General Assembly 2026, Vienna, Austria, 3–8 May 2026, EGU26-18587, https://doi.org/10.5194/egusphere-egu26-18587, 2026.

EGU26-18972 | ECS | Orals | BG2.4

Towards a mature framework for integrating bottom-up and top-down constraints in a data-driven ecosystem-level CO2 model 

Samuel Upton, Markus Reichstein, Wouter Peters, Santiago Botia, Auke van der Woude, Jacob A Nelson, Sophia Walther, Martin Jung, Fabian Gans, Laszlo Haszpra, and Ana Bastos

    The net ecosystem exchange of CO2 (NEE) between the land and the atmosphere is a critical term in the global carbon budget. Because of the complexity of modeling NEE across scales, global estimates of NEE are subject to large uncertainties. The two major data-driven approaches to modeling NEE are commonly described as top-down and bottom-up. Top-down models create a estimate of NEE which is optimally consistent with observations of atmospheric CO2 from tower, aircraft, and increasingly satellite sensors. Bottom-up NEE models learn a statistical relationship between a set of ecosystem-level biophysical drivers and observations of NEE, often from the global eddy-covariance network. These models are then upscaled to the globe using remotely sensed data. These systems are critical to earth system science. However, both are subject to limitations and disagreement based on the particular view which they represent.

    In previous work we presented two frameworks for integrating top-down and bottom-up approaches. Both studies build a data-driven bottom-up NEE model trained from eddy-covariance data, which is also constrained by atmospheric information. The atmospheric constraint in the first study, derived statistically from an ensemble of atmospheric inversions, created a model which strongly adjusted regional and global model results towards top-down and independent estimates of NEE, albeit with limited improvement in the model’s spatial and temporal representation of NEE. The atmospheric constraint in the second study, derived from direct observations of atmospheric CO2 using a Lagrangian atmospheric transport model, improved the representation of NEE in biomes which are under represented in the eddy-covariance record. This resulted in an improved representation of the dynamics of NEE, producing spatial and temporal variability which better represents independent estimates and our current ecological understanding. However, the second atmospheric constraint produced a model with high internal uncertainty, and which underperformed at the regional and latitudinal scale, producing less plausible annual timeseries and mean seasonal cycles when compared with other bottom-up data-driven models.

    In the current work, we present a model which combines these two constraint techniques: The model uses 1) a core constraint from eddy-covariance, 2) A statistical constraint from atmospheric inversions to limit the possible solutions, reducing uncertainty, and improving regional results, and 3) an atmospheric constraint from direct observations of atmospheric CO2 to improve the representation of the regional and global dynamics of NEE. Using the three constraints in parallel, the new model produces an estimate of global NEE which preserves the strengths of the two previous studies. When compared with state-of-the-art bottom-up models, it produces improved regional results, consistent spatial and temporal dynamics, and lower internal uncertainty. When transported through the atmosphere, the new model produces realistic estimates of atmospheric CO2. In this way, we demonstrate the progress towards a mature hybrid framework, which can inherit the strengths of both bottom-up and top-down approaches.

How to cite: Upton, S., Reichstein, M., Peters, W., Botia, S., van der Woude, A., Nelson, J. A., Walther, S., Jung, M., Gans, F., Haszpra, L., and Bastos, A.: Towards a mature framework for integrating bottom-up and top-down constraints in a data-driven ecosystem-level CO2 model, EGU General Assembly 2026, Vienna, Austria, 3–8 May 2026, EGU26-18972, https://doi.org/10.5194/egusphere-egu26-18972, 2026.

EGU26-19925 | ECS | Orals | BG2.4

Impact of extreme temperature events on CO2 uptake in a hemiboreal forest in North America  

Phoebe Seely, Andrew Ouimette, Roel Ruzol, and Manuel Helbig

Forested areas are a primary contributor of the terrestrial carbon sink; however, extreme temperature events, including both warm and cool anomalies, have been shown to influence carbon dioxide (CO2) uptake in forested ecosystems. With the frequency and severity of these extreme temperature events increasing due to climate change, the CO2 uptake response of forested ecosystems to these extreme temperature events may become increasingly impactful. Hemiboreal forests are of particular interest due to their unique geographical location in which the forests’ tree species are situated in their climatic limit; thus, hemiboreal forests have an increased susceptibility to the effects of climate change due to their location in the transition zone between temperate and boreal forests.

To quantify the response of forest-atmosphere CO2 exchange of hemiboreal forest ecosystems to extreme temperature events, we analysed daily eddy-covariance net CO2 fluxes, quantified by the net ecosystem exchange (NEE), measured at Howland Forest (Maine, U.S.A.) and the derived component fluxes gross primary production (GPP) and ecosystem respiration (Reco). Using the 29-year dataset of daily CO2 fluxes and corresponding meteorology, we derived daily CO2 flux and temperature anomalies to assess the impact of extreme temperature events (i.e., days with air temperature greater than 2 standard deviations above/below the mean air temperature for that day of year).

Our results indicate that, on average, net CO2 uptake is reduced in response to both extreme warm and cool events in the hemiboreal forest. We observed a statistically significant decrease in net CO2 uptake (corresponding to positive NEE anomalies) during extreme warm and cool events in seven and five of the nine non-winter months (i.e., March to November), respectively. Particularly in the summer months, both extreme warm and cool events were associated with less CO2 uptake. The NEE response in the non-winter months resulted from reduced GPP during both extreme warm and cool events as well as elevated Reco during extreme warm events. Future analyses will investigate the impact of the frequency and magnitude of extreme temperature events on monthly and annual CO2 budgets of this hemiboreal forest ecosystem.

These results demonstrate a decrease in net CO2 uptake in response to extreme temperature events with potentially negative effects on the CO2 sink strengths of hemiboreal forest ecosystems; this may reinforce a positive feedback loop with increasing air temperature decreasing CO2 uptake in forested ecosystems, contributing again to increasing air temperatures. Our research helps to gain a more thorough understanding into the role that forested ecosystems play in terrestrial CO2 sequestration in today’s changing climate.

How to cite: Seely, P., Ouimette, A., Ruzol, R., and Helbig, M.: Impact of extreme temperature events on CO2 uptake in a hemiboreal forest in North America , EGU General Assembly 2026, Vienna, Austria, 3–8 May 2026, EGU26-19925, https://doi.org/10.5194/egusphere-egu26-19925, 2026.

EGU26-20113 | Posters on site | BG2.4

Exploring Drivers of Forest Microclimates in Central Italy 

Autumn Elizabeth Mannsfeld, Nafeesa Samad, and Maria Vincenza Chiriacò

Climate across the globe is continuing to change drastically, and ecosystems are being affected through seasonal and inter-annual climate changes and extreme weather events, with the global averaged temperatures reaching record-breaking highs every year, with 2024 being the warmest on record since 1850.

It is known that forest ecosystems play a key role in mitigating temperature, buffering it within the forest microclimate compared to the macroclimate, thus dampening the effects of extreme temperature conditions. But the extent of the effect of these drivers and macroclimate conditions on microclimate conditions is not well understood.

Macroclimate is defined as the set of meteorological variables on a large spatial scale (up to hundreds of kilometers), whereas microclimate is defined by climatic conditions on small spatial scales that result from the interaction between the macroclimate, and forest and topography factors.

As the climate continues to change, learning which features of microclimates help buffer against intense macroclimatic conditions will be paramount. The aim of this study is to quantify the relative effect of macroclimate conditions, forest structure measures, and topographical variables on the microclimatic conditions, through machine learning with gradient boosting machines, and further, to explore how remote sensing data can be used to predict the buffering capacity of microclimates with future macroclimatic conditions. A pilot test is conducted specifically in a mixed forest in Piegaro, central Italy.

With the use of innovative IoT (Internet of Things) sensors, the temperature, relative humidity, and spectral data for selected trees is measured from underneath the canopy. These microclimatic measurements are used to find relationships with macroclimate and other data sources, including NDVI measurements, hourly climate datasets, downscaled- and projected-hourly climate data, and a digital terrain model (DTM). Utilizing data at different scales, from meters to several kilometers, allows the elements of the climate to be explored at varying resolutions, and the differences between these can further uncover the drivers of microclimatic conditions and the importance of including microclimates within climate studies.

It is well understood that the most influential variables on the microclimatic conditions are the corresponding macroclimatic conditions, and it is expected that elements such as relative elevation and aspect play an influential role in microclimatic buffering. Quantifying these relationships can help improve modelling forecasts that generally make use of climate measured on a larger scale, as they disregard the intricacies of microclimates and the possible effects that microrefugia have on species preservation. With further knowledge of microclimates comes a better understanding of how we can prepare for individually-experienced changes in the climate, in a way that promotes native landscapes as well as conserving biodiversity and enhancing local species.

How to cite: Mannsfeld, A. E., Samad, N., and Chiriacò, M. V.: Exploring Drivers of Forest Microclimates in Central Italy, EGU General Assembly 2026, Vienna, Austria, 3–8 May 2026, EGU26-20113, https://doi.org/10.5194/egusphere-egu26-20113, 2026.

EGU26-20320 | ECS | Orals | BG2.4 | Highlight

RemoTrees: advancing scalable ground validation of satellite products with a new generation of autonomous satellite forest sensor nodes 

Valerio Coppola, Francesco Renzi, Filippo Tagliacarne, Jim Yates, Luca Belelli Marchesini, and Riccardo Valentini

Forests are pivotal components of the global carbon cycle, yet satellite Earth Observation (EO) products for canopy condition, disturbance, and carbon flux proxies remain challenging to validate in remote and hard-to-reach regions where continuous ground measurements are scarce. The RemoTrees project was launched to bridge this gap by developing and deploying autonomous, low-power IoT, satellite enabled, multi-sensor systems and a harmonized data workflow that couples in-situ observations with EO information to improve the robustness and interpretability of carbon-cycle assessments under increasing climate extremes.

After the initial project phase focused on requirements, baseline demonstrations, and integration concepts, RemoTrees has progressed over the last two years to a technology maturation stage with successive device generations. A beta version of the RemoTrees node has been engineered and validated through laboratory characterization and pilot field deployments, enabling end-to-end testing of sensing, power autonomy, telemetry, remote management, and data continuity in operational forest conditions. These results directly informed iterative improvements leading to a gamma (final) version, targeting higher reliability, easier field maintainability, and improved data quality for EO calibration/validation use cases. Across these iterations, the project has refined a modular sensor approach to capture key variables relevant to forest functioning and stress—combining under-canopy VIS–NIR radiometric observations with complementary eco-physiological and environmental measurements (e.g., soil moisture, sap flow, and microclimate context)—and has strengthened data handling through structured metadata, quality control, and alignment with satellite acquisition constraints.

We present the RemoTrees mid-term status, highlighting the transition from concept to validated beta deployments and the consolidation into the gamma platform. Finally, we outline the next project steps: scaling deployments across different forest types, consolidating calibration and validation protocols, and advancing data-fusion strategies so that continuous ground observations can more effectively reduce uncertainties in EO-based carbon monitoring and support resilient forest management.

How to cite: Coppola, V., Renzi, F., Tagliacarne, F., Yates, J., Belelli Marchesini, L., and Valentini, R.: RemoTrees: advancing scalable ground validation of satellite products with a new generation of autonomous satellite forest sensor nodes, EGU General Assembly 2026, Vienna, Austria, 3–8 May 2026, EGU26-20320, https://doi.org/10.5194/egusphere-egu26-20320, 2026.

EGU26-20737 | Orals | BG2.4

Optimising the ICOS ecosystem network for satellite cal/val activities by adding new sensors and technologies.  

Bert Gielen, Simone Sabbatini, Maarten Op de Beeck, Giacomo Nicolini, and Dario Papale

The Integrated Carbon Observation System (ICOS) is a European Research Infrastructure (RI) with the goal is to provide high quality greenhouse gasses data collected according to standard protocols and distribute them in real-time with an open data access according to FAIR principles through its dedicated data portal. The terrestrial component of ICOS consists of a distributed network of monitoring stations across Europe covering the most representative ecosystem types (forests, grasslands, croplands, mires,lakes and urban). These stations provide a broad, high-standard ecological assessment of the target ecosystem: measurements are based on the eddy covariance technique from highly equipped flux towers, while a large set of meteorological variables and vegetation related parameters like Leaf Area Index, biomass that are collected according to strict protocols.. The network is currently fully operational with >100 stations delivering data across 16 countries. 

This presentation focuses on the potential of the ICOS for serving as a reference in-situ network for satellite product Cal/Val activities, highlighting how the ICOS ecosystem network can be optimised for the CalVal community by adding new sensors and technologies for new variables like Land Surface Temperature (LST), optimising the network of below canopy PAR sensors for estimating fAPAR in forest ecosystems or using Terrestrial Laser Scanning (TLS) for characterizing canopy structure and forest biomass. We also highlight how the cal/val community in particular can contribute through the design, discussion and implementation of specific protocols to match the possible requirements. 

How to cite: Gielen, B., Sabbatini, S., Op de Beeck, M., Nicolini, G., and Papale, D.: Optimising the ICOS ecosystem network for satellite cal/val activities by adding new sensors and technologies. , EGU General Assembly 2026, Vienna, Austria, 3–8 May 2026, EGU26-20737, https://doi.org/10.5194/egusphere-egu26-20737, 2026.

EGU26-20952 | Posters on site | BG2.4

Daily GPP of natural vegetation from new generation vegetation indices. Comparison with MOD17 

Sergio Sánchez-Ruiz, Manuel Campos-Taberner, Beatriz Martínez, Adrián Jiménez-Guisado, F. Javier García-Haro, and M. Amparo Gilabert

Gross Primary Production (GPP), the amount of CO2 that plants absorb due to photosynthesis, is the biggest carbon flux between biosphere and atmosphere. The current study investigates the estimation of daily GPP of natural vegetation from new generation vegetation indexes (VIs) and compares their performance to the production efficiency model of MODerate resolution Imaging Spectroradiometer (MODIS), MOD17. Two VIs are considered: the kernel version of Normalized Difference Vegetation Index (kNDVI), and the near infrared reflectance of vegetation (NIRV).

kNDVI exploits the higher order relations between the reflectance in the NIR and red regions by defining NDVI in Hilbert spaces and using the radial basis function reproducing kernel. It uses a length-scale parameter (σ) that can be defined conveniently for a specific purpose. NIRV is the product of NIR reflectance and NDVI. It represents the proportion of pixel reflectance attributable to the vegetation in the pixel.

VIs are calculated from MODIS daily continuous surface reflectance in red and NIR (FluxnetEO dataset version 2). This dataset offers quality checked and gap-filled daily MODIS surface reflectance observations during the 2000-2022 period centered in 647 eddy covariance (EC) sites located around the world. Different linear models are trained using VIs alone and combined with photosynthetically active radiation (PAR) measured at EC sites. Observations from 34 EC sites during the 2016-2020 period are used to optimize regression parameters and σ for three different biomes: grasslands, deciduous broadleaved forests, and evergreen needleleaved forests.

The daily GPP estimates are added to 8-day periods according to MOD17 frequency. The three GPP series are validated against EC observations and their results are compared. Using VIs alone, kNDVI achieved correlation R ϵ [0.79,0.87], relative mean bias error rMBE (%) ϵ [-9,6], and relative root mean squared error rRMSE (%) ϵ [52,60]; NIRVR ϵ [0.79,0.87], rMBE (%) ϵ [-8,7], rRMSE (%) ϵ [52,60]. In combination with PAR: kNDVI R ϵ [0.81,0.88], rMBE (%) ϵ [-9,14], rRMSE (%) ϵ [52,58]; NIRVR ϵ [0.81,0.88], rMBE (%) ϵ [-9,22], rRMSE (%) ϵ [51,61]. MOD17: R ϵ [0.41,0.70], rMBE (%) ϵ [-34,18], rRMSE (%) ϵ [35,56].

How to cite: Sánchez-Ruiz, S., Campos-Taberner, M., Martínez, B., Jiménez-Guisado, A., García-Haro, F. J., and Gilabert, M. A.: Daily GPP of natural vegetation from new generation vegetation indices. Comparison with MOD17, EGU General Assembly 2026, Vienna, Austria, 3–8 May 2026, EGU26-20952, https://doi.org/10.5194/egusphere-egu26-20952, 2026.

EGU26-21013 | Orals | BG2.4

An innovative IoT system for wildfire detection 

Francesco Renzi, Valerio Coppola, Raffaele Cerreta, and Riccardo Valentini

Europe has witnessed a significant increase in the number and ferocity of so-called ‘mega-fires’, a phenomenon linked with climate change. Edge/IoT devices, coupled with AI/ML, can play an important role in preventing and fighting wildfires. Information gathered from environmental sensors deployed in the forest not only offers better monitoring but also helps to predict, detect, and manage wildfires. By using a traditional cloud-centric model, near-real-time analytics on the behavior and spread of wildfires cannot be achieved effectively due to the large amount of information to be transmitted. Improving the data processing capabilities of edge applications that are closer to the response teams deployed on the ground can provide a powerful tool for real-time assessment of wildfires.

We have developed an innovative sensor which is capable of continuous monitoring of IR temperature with a 768-pixel image for flame detection. It is able to capture a 3MP RGB image under flame trigger and report data on CO2, PM1, PM2.5 and PM10 concentrations and the air quality index. Data are transmitted by NB-IoT LTE and CAT-M2 bands to a cloud server for alarm verification and fire time evolution. Edge AI algorithms are used to detect the onset of the flame. Field tests show the ability to detect a flame at a 90m distance with approximately 50 x 50 x 50 cm flame dimensions. The system has been designed to run with ultra-low power processors and electronics with a battery power supply lasting 6 months. A low-cost design for industrial production was also considered for the potential of large-scale deployments.

How to cite: Renzi, F., Coppola, V., Cerreta, R., and Valentini, R.: An innovative IoT system for wildfire detection, EGU General Assembly 2026, Vienna, Austria, 3–8 May 2026, EGU26-21013, https://doi.org/10.5194/egusphere-egu26-21013, 2026.

EGU26-21125 | ECS | Orals | BG2.4

Flash drought alters immediate growth rather than tree water relations: A case study from central Italy. 

Nafeesa Samad, Autumn Mannsfeld, Jim Yates, and Maria Vincenza Chiriacò

The ecological resilience of Mediterranean forests is increasingly challenged by the rising frequency, severity, and unpredictability of drought events driven by climate change (IPCC, 2021). In recent years, flash droughts, characterized by their rapid onset and short duration, have emerged as a significant climatic stressor. Understanding how different tree species respond to these abrupt drought events is essential for predicting forest vulnerability and resilience under future climate scenarios and for translating physiological responses into effective forest conservation and management strategies.

This study aims to: (1) analyze the temporal characteristics of flash drought events, including their onset, duration, and intensity, using atmospheric indicators; and (2) assess species-specific responses of stem radial growth (SRG), tree water deficit (TWD), and stem water transport (sap flow) during and after flash drought episodes, with a comparison between coniferous and broadleaves species.

The research was conducted in the Piegaro Forest, located in the Umbria region of central Italy (42.96°N, 12.06°E; 430 m a.s.l.). The study site is dominated by deciduous broadleaved stands, mainly oaks (Quercus cerris and Quercus petraea) and wild cherry (Prunus avium), alongside conifer plantations of Douglas-fir (Pseudotsuga menziesii) and Scots pine (Pinus sylvestris). An IoT-based monitoring platform, the TreeTalkerCyber device, was installed on selected trees to continuously record individual tree physiological functioning and microclimatic conditions.

Our findings show that flash drought period significantly suppressed stem radial growth in conifer species, whereas this suppression was not significant in broadleaved species, despite that all species maintaining sap flow during the flash drought. Notably, sap flow played a critical role in sustaining growth during flash drought periods. However, the effects of drought stress were more pronounced in the post-drought period, with reduced stem growth and sap flow compared to pre-drought conditions. Overall, stem radial growth emerged as the most sensitive and responsive indicator, revealing persistent internal water stress that extended beyond drought termination.

These results provide valuable insights into species-specific drought resilience and have important implications for sustainable forest management and silvicultural practices under increasing climate variability and the intensification of flash drought events.

How to cite: Samad, N., Mannsfeld, A., Yates, J., and Chiriacò, M. V.: Flash drought alters immediate growth rather than tree water relations: A case study from central Italy., EGU General Assembly 2026, Vienna, Austria, 3–8 May 2026, EGU26-21125, https://doi.org/10.5194/egusphere-egu26-21125, 2026.

EGU26-21643 | ECS | Posters on site | BG2.4

Explainable Machine Learning for diagnosing Data Quality Issues in Dendrometer-Based Tree Growth Time Series 

Valentina Disarlo, Anahid Wachsenegger, Jasmin Lampert, and Anita Zolles

High-frequency dendrometer measurements provide valuable insights into short-term and seasonal tree growth dynamics, enabling detailed analyses of forest responses to climatic variability. At the same time, their practical use is strongly limited by data quality issues. Sensor freezing during cold periods, signal drift, data gaps, and site-specific artefacts introduce substantial noise and uncertainty into dendrometer time series. These effects persist even after expert-based corrections and challenge standard assumptions about the availability of reliable ground truth observations.

In this study, we investigate how data quality and model performance can be evaluated when both predictions and reference measurements are affected by uncertainty. We analyse multi-year, hourly dendrometer records of individual tree radial growth collected at forest monitoring sites in Austria, combined with in-situ environmental variables such as air temperature, precipitation, and soil moisture. As a modelling baseline, we employ statistically grounded time-series approaches, including exponential smoothing and seasonal autoregressive integrated moving average models with exogenous variables (SARIMAX). Lagged environmental predictors are incorporated to capture delayed physiological responses of trees to climatic drivers and to reflect the strong temporal dependencies present in the data.

Rather than focusing exclusively on predictive accuracy, we place emphasis on diagnosing data reliability and understanding how observational noise propagates through time-series models. We show that classical evaluation metrics are often insufficient when the target variable itself is noisy or partially unreliable. To address this, we adapt anomaly detection concepts to the specific characteristics of dendrometer data, developing season-aware diagnostics that help identify implausible growth patterns, abrupt regime changes, and periods of degraded sensor performance while preserving biologically meaningful variability.

In addition, we explore how model-based explanations can support data quality assessment in a diagnostic sense. Feature attribution analyses computed over multi-lag input structures are used to examine when model behaviour is driven by consistent environmental signals and when it becomes unstable or difficult to interpret. Rather than treating explainability as an end in itself, we use these attribution patterns as indicators of potential data issues, such as sensor artefacts or inconsistent environmental responses, that warrant closer expert inspection.

The combined use of anomaly-aware diagnostics and explanation-informed analysis provides complementary perspectives on uncertainty and noise in high-frequency ecological time series. Our results highlight the importance of data-centric evaluation strategies for tree growth modelling and demonstrate that interpretable statistical baselines remain essential tools when working with noisy environmental sensor data. The proposed framework supports more robust and transparent downstream applications, including growth forecasting, stress detection, and climate impact assessment under increasing climatic variability.

How to cite: Disarlo, V., Wachsenegger, A., Lampert, J., and Zolles, A.: Explainable Machine Learning for diagnosing Data Quality Issues in Dendrometer-Based Tree Growth Time Series, EGU General Assembly 2026, Vienna, Austria, 3–8 May 2026, EGU26-21643, https://doi.org/10.5194/egusphere-egu26-21643, 2026.

EGU26-22183 | ECS | Posters on site | BG2.4

Thermal buffering by forest canopies investigated through remote sensing and IoT sensor networks. 

Davide Andreatta, Luca Salvino, Michele Dalponte, Mirco Rodeghiero, and Luca Belelli Marchesini

Forests exert a strong buffering effect on below canopy air temperature, lowering daytime maxima and increasing winter minima. Moreover, forest composition and structure deeply condition the microclimate within and above the forest environment, affecting all its living organisms and their biological processes. Standard meteorological measurements of air temperature—according to WMO recommendations—are not performed under forest cover, thus not adequately representing the temperature regimes driving processes such as photosynthesis, respiration, transpiration, and which serves as environmental cues in regulating leaf and growth phenology. Current forest biogeochemical models rely on gridded temperature data derived from standard meteorological stations and satellite-derived land surface temperatures as drivers to simulate how carbon, nitrogen and water cycles are affected by climate change, potentially leading to biased estimates. Recent availability of low-cost IoT temperature sensors enables the development of dense networks within forest environments, making multi-year, multi-site, high-spatiotemporal resolution microclimate monitoring increasingly feasible.

In this ongoing study focusing on six sites in northeastern Italian Alps, we compared in-situ air temperature data collected by IoT based sensors below canopies with measurements collected on towers above forest canopies, and with canopy surface temperatures estimated from remote sensing. By integrating these datasets with tree forest inventory data and LiDAR-derived canopy structure metrics, we aimed to quantify the magnitude of canopy thermal buffering and its variation across forest types, canopy structures, diurnal and seasonal cycles and microclimatic conditions. Additionally, we explored the resistance of the buffering effect during drought and heatwave periods. 

By yielding more realistic temperate values at which functional processes occur, this research will improve our capacity to study forest ecophysiological responses to climate warming.

How to cite: Andreatta, D., Salvino, L., Dalponte, M., Rodeghiero, M., and Belelli Marchesini, L.: Thermal buffering by forest canopies investigated through remote sensing and IoT sensor networks., EGU General Assembly 2026, Vienna, Austria, 3–8 May 2026, EGU26-22183, https://doi.org/10.5194/egusphere-egu26-22183, 2026.

EGU26-456 | ECS | Orals | BG2.7

Reconstructing human-environment interactions in the Maya lowlands using lipid biomarkers 

Benjamin Gwinneth, Kevin Johnston, Andy Breckenridge, Isabel Strachan, Alexis Marcoux, Haydar Martínez Dyrzo, Priyadarsi Roy, and Peter Douglas

The lowland Maya of Mesoamerica were affected by multiple environmental stresses throughout their history, and many experienced a major demographic and political decline, or collapse, during a period of inferred intense multidecadal drought, approximately 1200- and 1000-years BP. Given regional variation in the timing and character of the collapse (Demarest, 2004; Hodell et al., 2007; Webster et al., 2007; Kennett and Beach, 2014; Douglas et al., 2015), much remains to be discovered about the complex interactions between climate and society in the Maya lowlands. To this end, we combine carbon and hydrogen isotopic analyses of leaf wax n-alkanes with quantification of faecal stanols and polycyclic aromatic hydrocarbons from a lake sediment core from the southwest lowlands to assess whether (1) palaeoecological evidence of land use is related to population change; and (2) whether population and land use are linked to changing precipitation. Our data reveal a transition from generally more intense fire use and C4 plant agriculture during the Preclassic (3500–2000 BP) to dense populations and reduced fire use during the Classic (1600–1000 BP). This is consistent with other evidence for a more urbanised and specialised society in the Classic. We do not find evidence of drought in the hydrogen isotope leaf wax record (δDlw), implying that local drought was not a primary driver of observed variability in land use or population change in the Classic-period southwestern lowlands. We present preliminary data from lake sediment cores from the northern lowlands. 

How to cite: Gwinneth, B., Johnston, K., Breckenridge, A., Strachan, I., Marcoux, A., Martínez Dyrzo, H., Roy, P., and Douglas, P.: Reconstructing human-environment interactions in the Maya lowlands using lipid biomarkers, EGU General Assembly 2026, Vienna, Austria, 3–8 May 2026, EGU26-456, https://doi.org/10.5194/egusphere-egu26-456, 2026.

EGU26-1451 | ECS | Posters on site | BG2.7

Seasonality of Group I alkenone production and in-situ UK37-Temperature calibrations for mid-latitude Swiss lakes 

Lisa Marchand, Céline Martin, Nora Richter, Linda Amaral-Zettler, and Nathalie Dubois

Climate models are based on our understanding of the Earth climate system. To improve their accuracy, we rely on regional paleotemperature reconstructions, that can also be used to validate model outputs. Many existing paleoclimate proxies reconstruct mean annual or summer temperatures. Spring, which is essential for biodiversity and agricultural activities, is underrepresented, resulting in an incomplete perception of past climate, especially regarding seasonal variations. Lacustrine alkenones are lipid biomarkers that appear as a promising paleothermometer to quantitatively record spring temperatures in freshwater lakes. They are long chain ketones (35 to 42 carbons) with a varying number of double bonds (2 to 4) produced exclusively by the haptophyte phytoplankton in the Order Isochrysidales. These algae were found to respond to water temperature changes by altering relative proportions of the produced alkenones. The UK37 index has been extensively used to reconstruct sea surface temperatures in the past. Alkenone producing algae are divided into three major phylogenetic groups shaped largely by salinity. Among these groups, Group I dominate freshwater lakes, making them potential powerful tools for reconstructing continental spring temperatures. Alkenone seasonality was resolved in several studies conducted in high-latitude lakes which found alkenones occurring at the ice-off (spring-summer). The question arises regarding which seasonal temperatures are recorded by the UK37 index in mid latitude lakes? When other proxies show great uncertainty, three robust in-situ calibrations with low uncertainties were developed for the correlation of UK37 values to temperatures in high-latitude lakes. However, so far, no monitoring studies have been conducted in mid-latitude lakes, and no in-situ calibration has been established. Therefore, we conducted high-frequency monitoring of alkenone production in two Swiss lakes with very distinct settings for comparison: Greifensee (453masl, lowland and not ice-covered), and Lake St. Moritz (1768masl, alpine and ice-covered). The monitoring consisted in taking water samples over a full year on Greifensee, and from spring to summer in Lake St. Moritz, and retrieving sediment traps regularly to study alkenone deposition into the sediments in parallel with production in the water. We also collected environmental data such as salinity, nutrient contents, chlorophyll concentrations, temperature, and light radiation. We describe the seasonality of alkenone production in these two lakes and draw the first calibrations between the UK37 and temperature. The timing of alkenone production will be compared with variations in the environmental parameters to estimate the bloom drivers. With this work, we aim to establish a reliable continental spring temperature proxy. 

How to cite: Marchand, L., Martin, C., Richter, N., Amaral-Zettler, L., and Dubois, N.: Seasonality of Group I alkenone production and in-situ UK37-Temperature calibrations for mid-latitude Swiss lakes, EGU General Assembly 2026, Vienna, Austria, 3–8 May 2026, EGU26-1451, https://doi.org/10.5194/egusphere-egu26-1451, 2026.

EGU26-3374 | ECS | Orals | BG2.7

Towards quantifying Younger Dryas cooling in Europe using lipid biomarkers archived in lake sediments 

Chanamon Panbut, Pien Hendriks, Christine S. Lane, Stefan Engels, Dirk Sachse, Wim Z. Hoek, and Francien Peterse

The Younger Dryas (YD, 12,900-11,700 cal. yr BP) was a major abrupt cooling event caused by a slowdown of the Atlantic Meridional Overturning Circulation (AMOC), which sharply reduced heat transport in the Northern Hemisphere. However, the magnitude, temporal pattern and seasonality expression of the YD cooling across Europe remain difficult to constrain due to the lack of quantitative proxies and confounding factors on proxy responses. Here, we aim to reconstruct YD mean annual temperatures of months above freezing (MAF) using temperature-sensitive bacterial membrane lipids, so-called branched glycerol dialkyl glycerol tetraethers (brGDGTs), stored in lake sediments from Retournemer (eastern France) and Steisslingen (southern Germany). In both lakes, brGDGT-derived MAFs show only a minor cooling (~1-2C) during the YD, whereas more established GDGT-based proxies indicate a deeper oxic layer and shifts in lake microbial communities consistent with colder and windier conditions across Europe. As such, our brGDGT records confirm that most of the cooling was expressed during winters, in line with previously suggested seasonality patterns. Subsequent examination of the much less explored branched glycerol monoalkyl glycerol tetraethers (brGMGTs) that are characterized by an additional carbon–carbon bond between their alkyl chains reveals a stronger response during the YD in both lakes. However, translation to absolute temperature is hampered by their distinct composition from that in East African lakes on which the only currently existing transfer function is based. Regardless, our results show that brGMGTs have potential as indicators of YD cooling in future studies.

How to cite: Panbut, C., Hendriks, P., Lane, C. S., Engels, S., Sachse, D., Hoek, W. Z., and Peterse, F.: Towards quantifying Younger Dryas cooling in Europe using lipid biomarkers archived in lake sediments, EGU General Assembly 2026, Vienna, Austria, 3–8 May 2026, EGU26-3374, https://doi.org/10.5194/egusphere-egu26-3374, 2026.

EGU26-3820 | ECS | Orals | BG2.7

Understanding Microbial Lipid (GDGTs and 3-OH FAs) Responses Across Arctic Ecological Gradients 

Vishal Kumar, Biswajit Roy, Manish Tiwari, Meloth Thamban, and Prasanta Sanyal

Lipid biomarkers such as glycerol dialkyl glycerol tetraethers (GDGTs) and 3-hydroxy fatty acids (3-OH FAs) are widely used proxies for paleoenvironmental reconstruction. To evaluate their applicability in high-latitude environments, we analyzed samples from seven soil trenches collected at 5 cm intervals to a depth of ~40 cm, fifteen surface soils, and nine fjord sediments from the Ny-Ålesund region of Svalbard. The datasets were compared to assess the relative performance of lipid-based proxies under Arctic conditions. Soils from Svalbard display higher proportion of 6-methyl branched GDGTs compared to most global soils. Although the overall concentrations of branched and isoprenoid GDGTs are relatively low, likely due to the cold climate and short growing season. The microbial lipid derived pH proxy, performs reliably in extreme setting. In contrast, the temperature index, MBT′5ME values show substantial variability despite limited temperature variation, suggesting that temperature is not the sole factor affecting the lipid distribution. Depth-profile analyses of brGDGTs in moss-dominated soils reveal that moss-covered areas contribute significantly to brGDGT abundance. Moss-derived organic matter enhances bacterial activity and lowers the fungal-to-bacterial ratio within the microbial community. This interpretation is supported by stable carbon isotope (δ¹³C) and total organic carbon (TOC) data, which suggest that mosses are the primary source of organic carbon supporting brGDGT production. Overall, finding highlight the important role of moss cover in regulating microbial processes and GDGT distributions in Arctic soils, emphasizing the need to consider vegetation effects when applying lipid-based proxies in high-latitude paleoclimate reconstructions.

How to cite: Kumar, V., Roy, B., Tiwari, M., Thamban, M., and Sanyal, P.: Understanding Microbial Lipid (GDGTs and 3-OH FAs) Responses Across Arctic Ecological Gradients, EGU General Assembly 2026, Vienna, Austria, 3–8 May 2026, EGU26-3820, https://doi.org/10.5194/egusphere-egu26-3820, 2026.

EGU26-7259 | Posters on site | BG2.7

Isotope dilution to enhance δD measurability in low-abundance n-alkane samples 

Rachel Lupien, Julian Traphagan, and Dieter Juchelka

Compound-specific stable isotope analysis (CSIA) of organic biomarkers enables reconstruction of past environmental and climatic conditions by resolving the isotope composition of individual molecular compounds. Among these applications, hydrogen isotope (δD) measurements of leaf wax n-alkanes are widely used to infer changes in hydroclimate, including variations in precipitation isotopic composition, moisture source, and evaporative conditions. Because long-chain n-alkanes are resistant to degradation and preserve a terrestrial signal in sedimentary archives, their δD values provide a robust proxy for past continental hydroclimate across a wide range of depositional settings.

Despite this utility, CSIA of organic biomarkers is frequently limited by the low abundance of target compounds, particularly in sedimentary archives where concentrations vary strongly across stratigraphy and compound class. This limitation is especially acute for δD measurements, which typically require injected analyte masses of several hundred nanograms to achieve acceptable precision on gas chromatography-isotope ratio mass spectrometry (GC-IRMS) systems. Because hydrogen isotope analysis relies on pyrolytic conversion to H2, δD measurements generally operate at lower absolute signal intensities than compound-specific δ13C analyses, placing them closer to instrumental sensitivity limits where background correction, baseline placement, and nonlinear response exert a proportionally greater influence on measured isotope ratios. As a result, δD analysis of individual low-abundance compounds is often precluded, necessitating pooled samples or coarse sampling intervals that suppress short-duration climate signals and limit the achievable resolution of paleoclimate reconstructions.

Here, we assess the feasibility, limitations, and uncertainty structure of isotope dilution (ID) for δD measurements of leaf wax n-alkanes using internationally recognized, isotopically characterized n-alkane standard mixtures. Isotope dilution offers a potential strategy to stabilize isotope measurements through controlled mixing of a low-abundance analyte with an isotopically characterized spike, thereby increasing the total amount of analyte contributing to the measurement and reducing uncertainty associated with low signal intensities. Controlled mixing experiments isolate the effects of nominal mixing ratio, isotope contrast between spike and sample, and signal intensity on back-calculated isotope values. These tests provide a framework for quantifying uncertainty propagation in ID-CSIA and for defining practical constraints on its application. Our results establish conditions under which isotope dilution can yield accurate and precise δD measurements for low-abundance compounds and provide methodological guidance for extending CSIA into concentration regimes that are otherwise analytically inaccessible, enabling higher-resolution paleoclimate reconstructions and expanding the range of sedimentary archives amenable to biomarker isotope analysis.

How to cite: Lupien, R., Traphagan, J., and Juchelka, D.: Isotope dilution to enhance δD measurability in low-abundance n-alkane samples, EGU General Assembly 2026, Vienna, Austria, 3–8 May 2026, EGU26-7259, https://doi.org/10.5194/egusphere-egu26-7259, 2026.

The Tortonian stage (11.6–7.2 Ma) represents a warm interval preceding the Late Miocene Cooling (7.5–5.5 Ma), during which high-latitude temperatures exceeded modern values by up to ~17°C. Atmospheric CO2 reconstructions during the Tortonian are poorly constrained, with existing proxy records suggesting either high CO2 levels, reaching ~790 ppm at ~11 Ma (Mejia et al., 2017), or more moderate and relatively stable CO2 conditions.

Here, we present new high-latitude pCO2 reconstructions based on alkenone carbon isotopic fractionation (εp) from Ocean Drilling Program (ODP) Site 1088 in the subantarctic South Atlantic, covering the interval from 11.6 to 9.0 Ma. Combined benthic and bulk carbonate δ13C and δ18O records are used to identify the Tortonian thermal maximum and to guide targeted, higher-resolution sampling. Sea surface temperatures are reconstructed from alkenone Uk′₃₇ ratios using the Bayspline calibration (Tierney et al., 2018), and εp is calculated from compound-specific δ13C measurements of the C37:2  alkenone. The isotopic composition of dissolved inorganic carbon is estimated from planktonic foraminiferal (G. bulloides) δ13C, accounting for the temperature-dependent fractionation between DIC and aqueous CO2.

pCO2 concentrations are then reconstructed using a probabilistic εp model (Stoll et al., 2019) that explicitly incorporates coccolithophore cell size, growth rate, and light availability. Coccolith size and thickness distributions are quantified from circular polarized image analyses, while growth rates are inferred from temperature and nutrient availability.

How to cite: Santos, M., Wijker, R., and Stoll, H.: Reconstructing sea surface temperature and atmospheric CO₂ across the Tortonian using alkenone εp records from South Atlantic ODP Site 1088, EGU General Assembly 2026, Vienna, Austria, 3–8 May 2026, EGU26-7288, https://doi.org/10.5194/egusphere-egu26-7288, 2026.

EGU26-7314 | ECS | Posters on site | BG2.7

Phylogenetic effects of alkenone unsaturation in cultured Group II and Group III haptophytes 

Addison Rice, Ismael Torres-Romero, Hongrui Zhang, Reto S. Wijker, Alexander J. Clark, Madalina Jaggi, and Heather M. Stoll

Certain haptophyte algae produce a recalcitrant suite of long-chain (C37-C39) methyl and ethyl ketones called alkenones. These compounds are widely applied in paleoclimate studies due the temperature sensitivity of the ratio of di- to tri- unsaturated alkenones, most commonly quantified in the UK’37 index. However, phylogenetic effects and other physiological effects can alter the intercept of the UK’37 relationship to temperature, complicating the application to past climates. Here we present results of two strains of Group II (brackish) and four strains of Group III (open marine) haptophytes batch cultured under different temperatures, light levels, and CO2 (aq) concentrations. One Group III strain was also continuously cultured in a turbidostat.

The alkenone response to temperature differs per strain, as has previously been found in culture studies. Additionally, when applying core top calibrations commonly used in paleoclimate studies, UK’37 consistently under-predicts batch culture growth temperature. We further find no systematic control on the offset between alkenone unsaturation calibrations from core top and expected values in batch culture for a given strain. When considering data from multiple strains, the offset from expected values in UK’37 and UK38Me, but not UK38Et, correlate to ratio of the alkenone concentration relative to particulate organic matter. In cells harvested with a higher proportion of alkenones relative to particulate organic carbon, this cold offset is diminished and temperature prediction for UK’37 and UK38Me is more consistent with core top calibrations.

In addition, we compare nutrient replete continuous culture results to batch culture of the same strain to assess if the alkenone unsaturation response to temperature similar.

How to cite: Rice, A., Torres-Romero, I., Zhang, H., Wijker, R. S., Clark, A. J., Jaggi, M., and Stoll, H. M.: Phylogenetic effects of alkenone unsaturation in cultured Group II and Group III haptophytes, EGU General Assembly 2026, Vienna, Austria, 3–8 May 2026, EGU26-7314, https://doi.org/10.5194/egusphere-egu26-7314, 2026.

EGU26-7602 | ECS | Posters on site | BG2.7

Sedimentary faecal biomarkers in European lakes: tracing land-use activity during the medieval agricultural revolution 

Tobias Schneider, Antony, G. Brown, Helen Mackay, Andreas Lang, Helena Hamerow, Ondřej Mottl, and Nathalie Dubois

Present-day biodiversity and landscapes in Europe reflect millennia of human influence. Particularly, the ‘medieval agricultural revolution’ marked large-scale movements of people, plants, and livestock, and major shifts in agricultural practices, coinciding with the Medieval Climate Anomaly. Understanding how this biodiversity emerged, and how it contributes to the resilience of socio-ecological systems is critical for future climate-adaptive land-use planning and management. Existing human-ecodynamic reconstructions are largely based on archaeological sites and mires, and therefore often lack the spatial representativeness beyond an individual site, continuous depositional archives, or the temporal resolution and ecological breadth needed to assess biodiversity, land-use history, and species vulnerability in detail.

The ERC synergy project “MEMELAND – Molecular Ecology of Medieval European Landscapes” addresses these gaps through an interdisciplinary multi-lake, multiproxy framework. As part of this project, we will investigate lake sediment records from 50 lake pairs across a latitudinal gradient in Europe. Each pair consists of one lake located near a high-status (elite) site and one “control” lake from a nearby area lacking direct archaeological evidence for medieval elite activity. Such baselines from nearby “pristine” lakes are rarely established but are essential for disentangling natural from anthropogenic drivers of change.

Here we present our faecal biomarker framework to reconstruct grazing and manuring intensity during the medieval period using sterols, stanols, and bile acids measured as concentrations and depositional fluxes. To improve source attribution, we are developing a diet-controlled livestock reference library that characterizes sterol/stanol and bile-acid fingerprints and diagnostic ratios under historically plausible feeding regimes. We further leverage MEMELAND’s sedaDNA component to benchmark biomarker-derived livestock inputs against taxonomically resolved signals of domestic animals and land-use indicators. In this complementary approach, faecal biomarkers constrain the magnitude of livestock input, while sedaDNA refines the source and ecological context.

We ask which faecal biomarkers and diagnostic ratios are most robust across heterogeneous European lake systems, whether paired-lake comparisons reveal consistent spatio-temporal contrasts in land use during the medieval period, and whether eutrophication trajectories track enhanced nutrient loading associated with grazing and manuring. Besides the sedaDNA data, biomarker results are further integrated with palynological proxies, hyperspectral imaging, geochemistry (µXRF), and chronostratigraphic approaches to identify and contextualize land-use signatures in sediment archives.

On our poster, we present an overview of this biomarker contribution to MEMELAND and look forward to discussing it with you.

How to cite: Schneider, T., Brown, A. G., Mackay, H., Lang, A., Hamerow, H., Mottl, O., and Dubois, N.: Sedimentary faecal biomarkers in European lakes: tracing land-use activity during the medieval agricultural revolution, EGU General Assembly 2026, Vienna, Austria, 3–8 May 2026, EGU26-7602, https://doi.org/10.5194/egusphere-egu26-7602, 2026.

EGU26-9089 | Posters on site | BG2.7

Lipid Biomarkers Respond to Seasonal Blooms of Methane Oxidizing Bacteria in a Eutrophic Lake 

Lorenzo Cellino, Cindy De Jonge, Fatemeh Ajallooeian, Nathalie Dubois, and Nora Richter

Lakes are key components of global carbon cycling, accounting for 6-16 % of natural methane (CH4) emissions. Methane release from lakes is largely regulated by aerobic methane oxidizing bacteria (MOB), which oxidize up to 75% of the methane produced in lakes to CO2. Over the past two centuries, anthropogenic environmental change and climate forcing have led to rapid changes in lake systems including eutrophication and stronger stratification. The implications of these ongoing processes for MOB communities and the key methane sink they represent remains unclear. A deeper understanding of how MOB communities in lakes responded to systemic change in the past is essential for discerning their future dynamics. This highlights the need for a reliable biomarker that can track changes in MOB communities in lakes across timescales. The hopanoid bacterial membrane lipids, bacteriohopanepolyols (BHPs), exhibit specificity to MOB types and genera, therefore holding potential as biomarkers allowing us to track community assemblages. The peri-alpine lake Rotsee, located in central Switzerland, is a prime example of a monomictic eutrophic lake, making it an ideal study site to further understand and develop BHPs as biomarkers for MOB communities. Here we present initial results of a seasonal study of Rotsee where we used BHPs coupled with eDNA to investigate the MOB assemblages in the lake’s present-day water column, allowing us to ascertain how rapidly seasonally changing conditions affect MOB communities and the lipid biomarker assemblages they produce. We carried out intact polar lipid (IPL) extraction on suspended particulate matter (SPM) filtered from Rotsee’s 16-meter-deep water column at three-meter intervals and at the oxycline, from August 2025 to January 2026, and at two depths (surface and 15 meters) from May to December 2019. IPLs were measured on an Ultra High Precision Liquid Chromatography-Quadrupole-Orbitrap High-Resolution Mass Spectrometer (UHPLC-Orbitrap-HRMS). Genetic material was extracted from the SPM samples and sequenced targeting bacterial 16S rRNA. Preliminary results show that MOB-specific BHPs: aminotriol, aminotetrol, and aminopentol, are present in the Rotsee water column. The relative abundances of BHPs in the epilimnion remains low and steady during spring and summer but spike during lake overturn in November, whereupon most of the methane is released and oxidized after accumulation in the hypolimnion. 16S rRNA data indicates that the MOB communities are entirely made up of Gammaproteobacteria and match BHP seasonal trends with MOB-specific sequences being more abundant during overturn in the surface water. Additionally, surface waters in November are characterized by a higher abundance of aminopentol, which is scarcely found during spring and summer. Interestingly surface water 16S rRNA data also show that the MOB community compositions change considerably in November and December, shifting from Methylomonas to Methylobacter-dominated. Therefore, preliminary results show that BHP abundances respond to seasonal MOB blooms and show promise towards tracking seasonal community dynamics in eutrophic stratified lakes.

How to cite: Cellino, L., De Jonge, C., Ajallooeian, F., Dubois, N., and Richter, N.: Lipid Biomarkers Respond to Seasonal Blooms of Methane Oxidizing Bacteria in a Eutrophic Lake, EGU General Assembly 2026, Vienna, Austria, 3–8 May 2026, EGU26-9089, https://doi.org/10.5194/egusphere-egu26-9089, 2026.

EGU26-9870 | Posters on site | BG2.7

Reconstruction of ancient land-use in the Orkhon Valley, Central Mongolia, by waste markers: phosphorous, sterol and bile acid analyses 

Inga Koch, Ramona Mörchen, Jan Bemmann, Susanne Reichert, and Wulf Amelung

The Mongol Empire (13th - 14th century CE) was the largest contiguous land empire in world history. However, it is not yet known how an urban lifestyle in its first capital Karakorum was sustained in the heart of the Mongolian steppe. One aspect of this is how food supply and subsequent delivery of raw materials was secured.

Therefore, we aimed at characterizing soil resources in Sarlag Tolgoi, an ancient settlement about 50 km northwest of Karakorum. We took samples of a transect through the settlement and reference samples of undisturbed soil, serving as control. We (i) analyzed these samples regarding their phosphorus concentration as waste marker and (ii) the sterol and bile acid concentration in cases where phosphorus levels were elevated, in order to reconstruct past settlement structures and the fingerprint they left on the surrounding environment.

We found a tenfold increase of phosphorus concentrations from 2 to 20 mg P kg-1 in the topsoil from the surrounding area compared to the soil within the settlement itself. This clearly supports the hypothesis of anthropogenic influence at this site. A closer examination of those samples with increased phosphorus concentration by sterol and bile acid analysis revealed hotspots of an ancient faecal input by grazing animals - mainly cattle and sheep - within the settlement. Furthermore, the applied ratio (epi-5β-stigmastanol/5β-stigmastanol + epicroprostanol/coprostanol) revealed no indication of faecal input from horses, whereas low proportions of coprostanol suggested limited human faecal input. Therefore, we suppose that horses and ditches for human waste were outside of the settlement area.

In conclusion, our results demonstrate that Mongolian steppe soils preserve ancient fingerprints of human settlement associated with the Mongol Empire, expressed through changes in both, their morphology, and chemical signature. These findings highlight the considerable potential of basic soil science approaches to refine and strengthen archaeological interpretations in this region. Moreover, complementary chemical analyses provide valuable insights into past lifeways and human-environmental interactions. While the unambiguous attribution of signals to specific historical periods remains challenging, future integration of compound-specific biomarker dating in the vicinity of archaeological findings holds strong promise for achieving more robust chronological resolution.

How to cite: Koch, I., Mörchen, R., Bemmann, J., Reichert, S., and Amelung, W.: Reconstruction of ancient land-use in the Orkhon Valley, Central Mongolia, by waste markers: phosphorous, sterol and bile acid analyses, EGU General Assembly 2026, Vienna, Austria, 3–8 May 2026, EGU26-9870, https://doi.org/10.5194/egusphere-egu26-9870, 2026.

EGU26-10003 | ECS | Posters on site | BG2.7

Beyond microbes: mapping soil food web biodiversity via lipid fingerprinting 

Rahul Samrat and Wolfgang Wanek

Unlocking the functional complexity of soil ecosystems requires robust methods for characterizing the diverse communities residing within them. While phospholipid fatty acid (PLFA) analysis has long served as a standard tool for quantifying soil microbial community composition, it is inherently constrained by low taxonomic resolution and a historical bias toward bacteria and fungi, often obscuring the contributions of other critical soil organisms. To address this gap, intact polar lipid analysis offers potentially deeper and more detailed insight into the soil (micro)biome. Here, we present a comprehensive lipidomic reference library built from intact polar lipids extracted from pure isolates and individual species spanning the tree of life, including bacteria, archaea, fungi, protists, plants, and soil fauna to enable high-resolution, culture-independent biodiversity assessments.

Using reversed phase UPLC separation followed by dual-polarity, high-resolution Orbitrap MS/MS and molecular networking, we captured over 140,000 molecular features and organized them into approximately 10,000 molecular families. This library covers ~30 phyla and >50 lipid classes, extending the analytical window far beyond PLFA to include diverse glycerophospholipids, glycolipids, sphingolipids, and neutral lipids. Hierarchical analyses reveal distinctive lipidomic architectures across taxonomic levels, with over half of the detected compounds appearing exclusive to single phyla. Beyond standard microbial signals, we identified rich lipid fingerprints specific for faunal and protist groups (e.g., Arthropoda, Nematoda, Mollusca, Amoebozoa), plastid-associated glycolipids in photosynthetic lineages, and characteristic archaeal membrane compositions. Clustering these features yielded thousands of phylum-exclusive molecular families, providing candidate biomarkers with built-in signal redundancy.

As a proof-of-concept, we detected these signatures in heterogeneous soil samples, supporting the feasibility of the approach while highlighting the need for broader validation of potential biomarker families. These findings establish a path toward high-resolution lipid-based mapping of soil community composition and food-web structure, offering a powerful, functional complement to existing genomic and biochemical approaches.

How to cite: Samrat, R. and Wanek, W.: Beyond microbes: mapping soil food web biodiversity via lipid fingerprinting, EGU General Assembly 2026, Vienna, Austria, 3–8 May 2026, EGU26-10003, https://doi.org/10.5194/egusphere-egu26-10003, 2026.

EGU26-11129 | ECS | Posters on site | BG2.7

A Workflow for Combining microscale Imaging Techniques in Paleoclimatology 

Yannick Zander, Weimin Liu, Lars Wörmer, and Kai-Uwe Hinrichs

Paleoclimatic and paleoenvironmental reconstructions rely on proxies derived from physical, chemical or biological properties of the investigated archive. In order to achieve the highest spatial (hundreds of micrometers), and thus temporal resolution (subannual), various imaging techniques, such as hyperspectral imaging, computed tomography, mass spectrometry imaging (MSI), X-ray, and µXRF can be employed. However, proxies generally respond to multiple environmental variables (e.g., the GDGT-based proxy CCat is influenced by both water column temperature and nutrient concentrations). Multi-proxy studies are necessary to obtain a comprehensive understanding of past conditions and to disentangle individual biogeochemical processes.

A major roadblock in multi-proxy studies is the alignment of data across multiple datasets since manual matching of ‘wiggles’ (1D time series) can be deceptive. With imaging data this issue can be avoided since data can be matched in 2D space. Moreover, RGB images are routinely obtained alongside each method. This provides a shared data layer between methods.

Not all imaging methods can be performed on the exact same sample slice, and MSI even requires multiple samples from the same core depth to cover multiple mass windows. Consequently, four aspects are taken into account in our proposed workflow: (I) subsamples need to be referenced back to the core; (II) datasets are obtained at different positions and can have vastly different resolutions; (III) samples may be distorted during sample preparation - so even two MSI measurements from the same sediment section at the same resolution cannot be mapped directly onto each other. And although these distortions are generally small, investigating seasonal variations requires consistency at the scale of hundreds of micrometers; (IV) after a transformation between images has been found, the data needs to be transformed (i.e., resampled). This requires interpolation, which can alter properties such as sparsity. Hence, interpolation targets as well as the interpolation methods need to be selected with care.

In this work, we present a workflow capable of semi-automatically combining image datasets from (sections of) sediment cores from any two imaging methods. Advanced methods for laminated sediments are also presented, as they are particularly suitable for fine-scale matching. With this workflow we aim to replace the tedious manual teaching point selection by providing robust image registration methods for routine multi-proxy studies on subannual scales.

How to cite: Zander, Y., Liu, W., Wörmer, L., and Hinrichs, K.-U.: A Workflow for Combining microscale Imaging Techniques in Paleoclimatology, EGU General Assembly 2026, Vienna, Austria, 3–8 May 2026, EGU26-11129, https://doi.org/10.5194/egusphere-egu26-11129, 2026.

EGU26-11425 | Orals | BG2.7

New lipid-based proxies for past cyanobacterial abundance  

Nemiah Ladd, Antonia Klatt, Daniel Nelson, Jan Wälchli, Theresa Wietelmann, and Nathalie Dubois

Throughout the past century, eutrophication and climate change have strongly impacted temperate lakes, resulting in greater algal productivity and shifts in phytoplankton community composition. In many lakes cyanobacterial blooms have become more common, reducing water quality, negatively impacting aquatic food webs, and affecting the cycling of carbon and other nutrients. Appropriate management of aquatic systems to mitigate and avoid these problems is informed by monitoring data, but direct observations are often limited to recent decades. Paleolimnological approaches can extend the observational window and contextualize long-term changes of algal communities in response to climatic and environmental forcings. However, it remains challenging to reconstruct changes in algal productivity and community assembly, particularly the relative abundance of cyanobacteria to eukaryotic algae, throughout the geologic past.

Here, we present two recently developed lipid-based proxies that can be used to reconstruct broad shifts in algal community composition: (1) the Phytol:Sterol Index (PSI), which represents the relative abundance of the chlorophyll side-chain, phytol, to phytosterols from eukaryotic algae and (2) hydrogen isotope offsets between phytol and the common membrane lipid C16 fatty acid (δ2HC16:0 Acid/Phytol), which is higher for lipids produced by cyanobacteria and green algae than for other eukaryotic algae. We demonstrate the utility of these proxies in a collection of short sediment cores from lakes in the Swiss Plateau (Murtensee, Greifensee, and two hydrologically distinct basins of Zugersee), all of which experienced extreme eutrophication in the mid- to late 20th century, followed by partial recovery to lower nutrient levels. We found significant changes in lipid distributions coincident with the main period of increasing total phosphorus inputs. During this time, PSI increased in all four lake records, indicating that more of the algal biomass accumulating in the sediments was derived from cyanobacteria. In Murtensee, PSI and δ2HC16:0 Acid/Phytol co-varied, while in Greifensee the initial increase in cyanobacteria was followed by a period of low PSI and high δ2HC16:0 Acid/Phytol values, consistent with observations of abundant green algae during this later period.

We cross-compared our lipid biomarker data with cyanobacterial and plastid 23S rRNA amplicon sequencing variants (ASVs) of DNA extracted from the cores. In general, there was good agreement between PSI and the abundance of cyanobacterial ASVs. However, during periods when the cyanobacterial DNA was primarily from small-celled taxa such as Synechococcus, such as the early 20th century in Murtensee, PSI was low relative to the abundance of cyanobacterial ASVs. This suggests that small but numerous cyanobacteria might be overrepresented in sedimentary DNA relative to their biomass, likely related to the polyploidy of their chromosomes.

Overall, sedimentary PSI appears to be a robust and analytically straight-forward indicator of cyanobacterial abundance. Due to the greater mass of phytol needed for δ2H measurements, chromatographical challenges can limit the application of δ2HC16:0 Acid/Phytol in some sediments, such as those from Zugersee. The combination of these new lipid-based proxies with other tools, including sedimentary DNA, pigments, and microfossil analyses can provide the most comprehensive picture of past algal community composition.

How to cite: Ladd, N., Klatt, A., Nelson, D., Wälchli, J., Wietelmann, T., and Dubois, N.: New lipid-based proxies for past cyanobacterial abundance , EGU General Assembly 2026, Vienna, Austria, 3–8 May 2026, EGU26-11425, https://doi.org/10.5194/egusphere-egu26-11425, 2026.

EGU26-11753 | ECS | Orals | BG2.7

South Asian monsoon response to the ~74 ka Toba super-eruption revealed by µm-scale imaging on Arabian Sea sediment 

Jinheum Park, Weimin Liu, Lars Wörmer, Enno Schefuß, Andreas Lückge, Jenny Altun, Heidi Taubner, Kai-Uwe Hinrichs, and Igor Obreht

As the largest volcanic eruption in the Quaternary period, the ~74 ka Toba super eruption’s impact on the global heat budget and monsoon systems has been prominently debated. Despite particular focus on its consequences in India as one of the key regions of early modern human dispersal — ranging from catastrophic to minimal — high-resolution proxy evidence from geological archives that empirically support the claims has been scarce. In this study, we trace pre- and post-Toba monsoonal dynamics from a finely laminated sedimentary section from the Arabian Sea that brackets Toba tephra as an event marker of the eruption. The sediment core SO130-289KL was retrieved from the northeastern margin of the Arabian Sea outside of the upwelling zone (Sindh continental margin), at a water depth of 571 m, which today lies within the oxygen minimum zone (OMZ). The site is sensitive to both monsoon seasons, as the South Asian summer monsoon controls sedimentary dynamics, whereas the wind strength of the winter monsoon primarily influences the sea surface temperatures (SSTs). Thus, the sediment core sensitively records the evolution of South Asian summer and winter monsoons. In order to reconstruct the regional climatic response to Toba at near-annual resolution, we produced time-series data of elemental and SST variations using µm-scale measurements (100–200 µm resolution) by x-ray fluorescence (µXRF) scanning and mass spectrometry imaging (MSI) techniques, respectively. The µXRF elemental data trace terrestrial components primarily sourced by runoff from the summer monsoon, which are complemented by the glycerol dialkyl glycerol tetraether-based SST calculations from MSI that are affected by OMZ intensity. On the other hand, the alkenone measurements from MSI more sensitively trace SST variations that are primarily governed by the winter monsoon. Supplemented by conventional biomarker and stable hydrogen and carbon isotope measurements, which trace precipitation and vegetation dynamics over the Indus River catchment, respectively, our multi-proxy data contribute to a better understanding of the impact that the Toba eruption had on the regional climate, environment, and eventually, contemporaneous humans.

How to cite: Park, J., Liu, W., Wörmer, L., Schefuß, E., Lückge, A., Altun, J., Taubner, H., Hinrichs, K.-U., and Obreht, I.: South Asian monsoon response to the ~74 ka Toba super-eruption revealed by µm-scale imaging on Arabian Sea sediment, EGU General Assembly 2026, Vienna, Austria, 3–8 May 2026, EGU26-11753, https://doi.org/10.5194/egusphere-egu26-11753, 2026.

EGU26-12957 | ECS | Posters on site | BG2.7

Intact polar lipids as biomarkers for nitrogen fixation and nitrification in European soils  

Franz Philip Kerschhofer, Nora Richter, Dajana Radujković, Erik Verbruggen, M. Angeles Muñoz-Martín, Elvira Perona, Yolanda Cantón Castilla, Thorsten Bauersachs, Su Ding, and Cindy De Jonge

Rising atmospheric CO2 levels are enhancing primary production, which could result in higher carbon sequestration in biomass (C-fixation). This higher primary productivity, however, relies on a sustained supply of soil nutrients, particularly nitrogen (N). To understand whether climate change and rising CO2 levels have an impact on soil nitrogen availability on centennial to millennial timescales, a geological perspective can be used. For instance, the glacial-interglacial warming, and Holocene warm periods provide valuable natural analogues for investigating these long-term interactions. However, currently no quantitative methods exist to reconstruct soil nitrogen availability through time. To address this, we propose to develop novel proxies based on lipid biomarkers for essential processes in the soil N-cycle.

In aquatic systems, microbial membrane lipids are well established as biomarkers for specific steps in the N-cycle: for instance, heterocyte glycolipids (HGs), produced by heterocytous cyanobacteria, indicate biological nitrogen fixation. Further, microbial intact polar lipids (IPL), isoprenoid glycerol dialkyl glycerol tetraethers (isoGDGTs) and bacteriohopanepolyols (BHPs) are promising proxies for archaeal ammonia oxidation and bacterial nitrite-oxidation, respectively. We propose to test for these N-cycle biomarkers in soils. A pilot sample set of European surface soils was selected, consisting of both N-limited (N-) dryland (n = 8) and N-replete (N+) grassland soils (n = 4). Lipid extracts were analysed by UHPLC-HRMS to generate a high-resolution dataset of the complete lipidome. As a first step in the proxy development, we here present the BHP composition and changes in their relative distribution between in N- and N+ soils.

A total of 47 different BHPs were tentatively identified. In all samples, hydroxy BHPs are predominant components (50-60%). BHtetrol (BHT) is most abundant and all samples contain BHpentol and BHhexol. Amino-BHPs are less abundant in N- soils compared to N+ (2-7%; 10%). For example, aminotriol BHP is relatively increased in N+ soils. A total of 22 nucleoside BHPs were identified with either an adenine (adenosylhopanes) or inosine (inosylhopanes) headgroup that differ in amount and position of methylation on the BHP core or in the headgroup structure. Adenosylhopanes are relatively more abundant in N- than N+ soils (N-: 40-45%, N+: 20%). Inosylhopanes are present at a lower abundance, with 0-5% in N- and up to 10% in N+ soils. Based on changes in their occurrence, four adenosylhopanes and two inosylhopanes are tentatively proposed as N-cycle biomarkers. Specifically, three adenosylhopanes (diMe-adenosylhopane, diMe-adenosylhopane-headgroup-Me, Me-adenosylhopane-headgroup-diMe) and one Me-inosylhopane are exclusively found in N- soils. Likewise, an early adenosylhopane-headgroup-Me and an inosylhopane-headgroup-diMe only occur in N+ soils.

These results highlight the potential N-cycle lipid biomarkers in soils. The occurrence of other potential biomarkers (isoGDGTs, HGs) for the N-cycle will be tested for on the same soils. Moreover, we will apply an untargeted approach via computational MS to comprehensively characterize the whole soil microbial lipidome and evaluate the suite of potential lipid biomarkers associated with nitrogen cycling.

How to cite: Kerschhofer, F. P., Richter, N., Radujković, D., Verbruggen, E., Muñoz-Martín, M. A., Perona, E., Cantón Castilla, Y., Bauersachs, T., Ding, S., and De Jonge, C.: Intact polar lipids as biomarkers for nitrogen fixation and nitrification in European soils , EGU General Assembly 2026, Vienna, Austria, 3–8 May 2026, EGU26-12957, https://doi.org/10.5194/egusphere-egu26-12957, 2026.

EGU26-17006 | ECS | Orals | BG2.7

Increased typhoon activity led to higher land-to-sea organic carbon export in the deglacial northwest subtropical Pacific: Insights from lipid biomarkers and sediment geochemistry 

Pierrick Fenies, Sze Ling Ho, Maria-Angela Bassetti, Natalia Vazquez Riveiros, Jens Hefter, Yuan-Pin Chang, Ludvig Löwemark, Nathalie Babonneau, Gueorgui Ratzov, Shu-Kun Hsu, and Chih-Chieh Su

The evolution of typhoon activity in Taiwan at glacial-interglacial timescales remains poorly constrained, as modelling past typhoon trajectories is challenging and terrestrial archives rarely extend beyond the Holocene due to high erosion rates. However, the land-to-sea transfer of terrestrial material is mainly controlled by typhoons, with more than 75% of the annual flux occurring within less than 1% of the year. Particulate organic carbon (POC) transferred during typhoon-induced floods represents 77 to 92% of the annual biospheric (vegetation- and soil-derived) POC flux. Consequently, investigating changes in the flux of biospheric terrestrial POC in marine sediments off eastern Taiwan, where rivers connect directly to the canyon regardless of the relative sea-level due to the absence of a broad continental shelf, provides an opportunity to assess past variations in typhoon activity.

At this end, we analyzed lipid biomarkers together with sedimentological and geochemical parameters from a sediment core collected offshore eastern Taiwan. Coarser grain sizes, higher TOC, long chain n-alkanes and soil-derived brGDGTs (IIIa/IIa < 0.59) accumulation rates during the deglaciation relative to the Holocene indicate substantially enhanced land-to-sea carbon transport linked to more frequent and/or more energetic turbidity activity. In addition, higher CPI values and reduced age offsets between planktonic foraminifera and bulk organic matter radiocarbon dating over the same interval point to a larger fraction of biospheric terrestrial POC transfer to the marine sediments compared to the Holocene. Together, these results point to an enhanced typhoon activity affecting Taiwan during the deglaciation, in agreement with recent model simulations indicating a higher typhoon genesis potential at that time. Given the difficulties in simulating past typhoon activity in Taiwan, or in recording it from terrestrial archives, our approach provides an alternative way to constrain past changes in typhoon activity affecting the island. This also raises the possibility that, if typhoon activity affecting Taiwan were to increase due to a northward shift in typhoon pathways as projected under ongoing global warming, the eastern margin of Taiwan could turn into a carbon sink.

How to cite: Fenies, P., Ho, S. L., Bassetti, M.-A., Vazquez Riveiros, N., Hefter, J., Chang, Y.-P., Löwemark, L., Babonneau, N., Ratzov, G., Hsu, S.-K., and Su, C.-C.: Increased typhoon activity led to higher land-to-sea organic carbon export in the deglacial northwest subtropical Pacific: Insights from lipid biomarkers and sediment geochemistry, EGU General Assembly 2026, Vienna, Austria, 3–8 May 2026, EGU26-17006, https://doi.org/10.5194/egusphere-egu26-17006, 2026.

EGU26-17016 | ECS | Orals | BG2.7

 Environmental and ecological change across Angkor’s transition inferred from untargeted molecular fingerprints 

Weimin Liu, Yanming Ruan, Enno Schefuß, Ainara Sistiaga, Thorfinn Sand Korneliussen, Nicolaj Krog Larsen, Abigail Daisy Ramsøe, Anthony Ruter, Marie-Louise Siggaard-Andersen, Fabrice Demeter, Chea Socheat, Christoph Pottier, Kurt Kjaer, Kai-Uwe Hinrichs, Eske Willerslev, and Lars Wörmer

Angkor was the capital of the Khmer Empire during approximately 9th to 15th CE. It relied on a sophisticated water management system to sustain a vast low-density urban population. For the last two decades, the decline of Angkor has been linked to hydroclimatic instability in combination with infrastructural failure. Recent archaeological evidence suggests that the decline of elite occupation within the civic-ceremonial core may have begun earlier, resulting from additional social, political, or economic drivers. Understanding the timing and potential causes of such changes is crucial for assessing the vulnerability of complex urban systems.

Sedimentary molecular biomarkers can provide insights into paleoenvironmental and anthropogenic changes. In particular, untargeted molecular fingerprinting is not constrained by predefined compound lists and analyzes thousands of molecular features simultaneously. This enables the detection of complex and overlapping source inputs and facilitates the identification of broader molecular shifts potentially associated with changing land use, ecosystem functioning, and anthropogenic activity.

Here we apply an untargeted molecular fingerprinting framework using comprehensive two-dimensional gas chromatography coupled to time-of-flight mass spectrometry (GC×GC-TOFMS) to characterize sedimentary organic matter in lipid extracts from a sediment core retrieved from a pond inside the temple of Angkor Wat. GC×GC substantially increases chromatographic resolution and enables the detection of thousands of chemical features without a priori hypotheses and is thus suitable for the untargeted analyses. We investigate temporal shifts in molecular composition across the Angkorian and post-Angkorian periods to evaluate changes in organic matter inputs, microbial processing, and water quality, and discuss their implications for changes in urban land use and occupation patterns at the temple complex.

How to cite: Liu, W., Ruan, Y., Schefuß, E., Sistiaga, A., Korneliussen, T. S., Larsen, N. K., Ramsøe, A. D., Ruter, A., Siggaard-Andersen, M.-L., Demeter, F., Socheat, C., Pottier, C., Kjaer, K., Hinrichs, K.-U., Willerslev, E., and Wörmer, L.:  Environmental and ecological change across Angkor’s transition inferred from untargeted molecular fingerprints, EGU General Assembly 2026, Vienna, Austria, 3–8 May 2026, EGU26-17016, https://doi.org/10.5194/egusphere-egu26-17016, 2026.

EGU26-17853 | ECS | Posters on site | BG2.7

Assessing sedimentary proxies to reconstruct the occurrence and extent of harmful algal blooms 

Theresa Wietelmann, Daniel B. Nelson, Mainak Dutta, Nancy Leon, Douglas Wood, Christopher Scholz, Elizabeth Thomas, and Sarah Nemiah Ladd

During the recent decades, human activity led to vast and rapid changes in algal communities through pollution, alteration of catchment areas and climate change. As a consequence of such stressors, lake conditions can offer favourable conditions for the formation of harmful algal blooms (HABs) of cyanobacteria. The rise of bloom-forming taxa and toxin-producing taxa are threatening ecosystem services provided by lakes. Understanding the dynamic nature of algae and these stressors is crucial for developing effective mitigation strategies to preserve or potentially restore the integrity of aquatic ecosystems. Monitoring data is limited to a relatively recent period and thus sedimentary proxies facilitating the reconstruction of past cyanobacteria abundances are necessary to provide historical context for modern observations.

Recently, the phytol:sterol index (PSI), which corresponds to the ratio of phytol (produced by all algae including cyanobacteria) and specific phytosterols (produced only by eukaryotic algae) was proposed as a proxy for the relative abundance of cyanobacteria within the overall algal community (Klatt et al., 2025). Here, we aim to test the suitability of the PSI alongside other emerging sedimentary proxies to record cyanobacteria abundances and the abundance of HABs. To this end, we extracted short cores covering the past ~250 years from two of the Finger Lakes, Owasco and Skaneateles, in Upstate New York (USA) using a universal coring system in spring 2024. While Owasco Lake has experienced progressive eutrophication since the 1960s, nearby Skaneateles Lake with a much smaller watershed to lake surface area ratio remains oligotrophic. HAB occurrences in Owasco began several years before Skaneateles, but since 2017, HABs have occurred in both lakes, with greater prevalence in Owasco.

Bulk sediment analyses (% total organic carbon, C/N ratios) indicate an increase of algae productivity coinciding with the reported progressive eutrophication of Owasco Lake, while Skaneateles Lake shows rather stable conditions. This stability is also reflected in the PSI, which is about 0.25 in Skaneateles Lake throughout our record, indicating relatively low abundance of cyanobacteria. In Owasco Lake, on the other hand, PSI values reveal a marked increase to 0.45 after ~1950, consistent with a shift in community composition towards Cyanobacteria mid-20th century. We compare these results to compound-specific hydrogen isotope measurements of fatty acids and phytol, and the offsets between them, to further distinguish ecological changes in the lakes. Finally, we use sedimentary DNA (sedDNA) metabarcoding to validate our lipid data by assessing changes in the phytoplankton community and to identify the presence of bloom forming taxa. Overall, the combined results of our proxies are in accordance with observations, and further extend our knowledge of algal community composition prior to the monitoring period. This emphasises the potential of this proxy and the strength of multiproxy approaches.


Klatt, A., De Jonge, C., Nelson, D.B., Reyes, M., Schubert, C.J., Dubois, N., Ladd, S.N., 2025. Algal lipid distributions and hydrogen isotope ratios reflect phytoplankton community dynamics. GCA 394, 205–219. https://doi.org/10.1016/j.gca.2025.02.013

How to cite: Wietelmann, T., Nelson, D. B., Dutta, M., Leon, N., Wood, D., Scholz, C., Thomas, E., and Ladd, S. N.: Assessing sedimentary proxies to reconstruct the occurrence and extent of harmful algal blooms, EGU General Assembly 2026, Vienna, Austria, 3–8 May 2026, EGU26-17853, https://doi.org/10.5194/egusphere-egu26-17853, 2026.

EGU26-18675 | ECS | Orals | BG2.7

Source-to-sink controls on lipid biomarkers and temperature signals in the Atlantic Iberian margin 

Nadee U.Nanayakkara, Clayton R. Magill, Cindy De Jonge, Timothy Eglinton, Reto S. Wijker, Heather Stoll, David Hodell, Francisco J. Sierro, and Blanca Ausin

Lipid biomarkers preserved in marine sediments provide powerful tools for reconstructing past climate and environmental change. However, their interpretation critically depends on understanding the processes governing their production, transport, and preservation, as different water-column processes can substantially modify the environmental signals transferred to sedimentary archives. This study investigates four different lipid biomarkers (long-chain fatty acids [LCFA], n-alkanes, alkenones, and glycerol dialkyl glycerol tetraethers [GDGTs]) at three key stages of their source-to-sink pathway: production, transport in the water column, and deposition and preservation in surface sediments to shed light on their controlling processes factors. A particular focus is placed on tracking sea surface temperature (SST) signals encoded in some of these lipids at each key stage, thereby refining the current framework for biomarker-based paleotemperature reconstruction in the study region.

We collected suspended particulate matter from six southwest Iberian Margin stations (JC089 cruise, August 2013) using in situ filtration pumps yielding 38 samples (~1188 L on average per sample) from surface to ~3000 m depth at discrete fluorescence and turbidity maxima. Surface sediments from the same locations and 25 additional core-top samples were also analyzed. LCFA, n-alkanes, and alkenones were quantified using GC-FID, while GDGTs were analyzed by HPLC. Associated SSTs were reconstructed using the Uk′₃₇ and TEX₈₆ indices, with Bayesian calibrations applied to both proxies.

In the water-column, concentrations of terrestrial lipids (n-alkanes and LCFA) are highest in the upper photic zone with no clear onshore–offshore trend, reflecting mixed atmospheric and riverine inputs. Alkenones are predominantly found in nearshore waters within the photic zone and decrease in concentration with distance offshore, reflecting in situ production linked to primary productivity. Elevated GDGT concentrations are found above ~2000 m within the warm, saline, and relatively turbid Mediterranean Outflow Water (MOW). While this distribution suggests some lateral transport, the absence of alkenones at these depths points to substantial in situ GDGT production.

Both alkenone (12.6–22.3 °C) and GDGT-derived SSTs (14.6–20.0 °C) exhibit a cold bias relative to surface CTD measurements in the water column. A similar cold bias is observed in surface sediments, where reconstructed SSTs (15.7–19.0 °C for alkenones; 14.6–19.2 °C for GDGTs) are lower than World Ocean Atlas annual mean values. We attribute these differences to variations in production depth and seasonal bias and furthermore rule out a significant influence from terrestrial GDGT input or riverine nutrients.

Future application of compound-specific radiocarbon and stable isotope analyses (δ¹³C, δ²H) on alkenones will further strengthen the mechanistic link between modern lipid cycling and paleoenvironmental reconstructions.

How to cite: U.Nanayakkara, N., R. Magill, C., De Jonge, C., Eglinton, T., S. Wijker, R., Stoll, H., Hodell, D., J. Sierro, F., and Ausin, B.: Source-to-sink controls on lipid biomarkers and temperature signals in the Atlantic Iberian margin, EGU General Assembly 2026, Vienna, Austria, 3–8 May 2026, EGU26-18675, https://doi.org/10.5194/egusphere-egu26-18675, 2026.

EGU26-19917 | Orals | BG2.7

Development of a global lacustrine temperature calibration based on 3-hydroxy fatty acid membrane lipids 

Sai Ke, Pierre Sabatier, Christelle Anquetil, and Arnaud Huguet

Lakes play an important role in paleoclimate studies as they archive high-resolution and continuous records. However, the climatic proxies developed for lake settings are limited. Among all, the lipid biomarkers have been widely studied, as they are ubiquitously distributed and efficiently carry environmental information. One prominent example is the branched glycerol dialkyl glycerol tetraethers (brGDGTs), produced by bacteria, use to quantitatively reconstruct the temperature and pH based on lake sediment. However, due to the influence of confounding factors and not fully determined producer species, temperature reconstruction based on brGDGTs could yield uncertainties as large as 4°C. Having complementary and independent temperature proxies appears to be essential.

3-hydroxy fatty acids (3-OH FAs) were recently proposed as temperature and pH proxies in soils and may hold the potential to be also applied to lakes. These compounds are membrane lipids produced by Gram-negative bacteria. Similar to brGDGTs, their distribution was related to environmental variables. To date, 3-OH FAs were mainly investigated in soils [1] with only 3 studies, all in the Chinese region, in lakes. A linear correlation between some of the 3-OH FA isomers (i.e. the Ratio of Anteiso-C13 to Normal-C13  ̶   RAN13)and mean annual air temperature (MAAT) was observed in Chinese lakes  [2]. In contrast, we did not observe such a correlation in 52 lake sediments of the French Alps and 20 lakes of Southern Chile [3]. This suggests that the relationship between MAAT and 3-OH FA distribution in lakes is complex and cannot be systematically reflected by a linear correlation. Nevertheless, this relationship needs to be further investigated using additional samples from all over the world.

This study aims to present the first global analysis of lacustrine 3-OH FAs and their relationship with MAAT. In addition to first studies, we analyzed these lipids in 220 lakes distributed worldwide over a large range of latitude and elevation, with MAATs ranging from -14.2°C to 27.7°C. Principal Component Analysis (PCA) was first applied to the whole dataset (220 lakes) to investigate the changes in 3-OH FA distribution with location. In addition, both linear (including the RAN13 index) and non-linear models (based on machine learning algorithms) are currently used to examine the relationship between 3-OH FA distribution and MAAT. This will bring new insights into the applicability of the 3-OH FAs as lacustrine temperature proxies at the global scale. 3-OH FAs could then be applied to paleotemperature reconstructions from lake sediment cores, complementarily of and independently from existing proxies such as brGDGTs.

References: [1] Véquaud et al. (2021). Biogeosciences 18, 3937-3959. [2]Yang et al. (2021). Org. Geochem. 160, 104277. [3] Ke et al., Org Geochemistry, under revision.

How to cite: Ke, S., Sabatier, P., Anquetil, C., and Huguet, A.: Development of a global lacustrine temperature calibration based on 3-hydroxy fatty acid membrane lipids, EGU General Assembly 2026, Vienna, Austria, 3–8 May 2026, EGU26-19917, https://doi.org/10.5194/egusphere-egu26-19917, 2026.

EGU26-20044 | Posters on site | BG2.7

Biomarker record in the Hupo Trough of the southwestern East Sea since the late Pleistocene 

Yu-Hyeon Park and Boo-Keun Khim

The East Sea, located on the northwest continental margin of the Pacific Ocean, acts an important marine environment sensitive to the global/regional climate change including the East Asian monsoon. GDGT (glycerol dialkyl glycerol tetraether), one of the membrane lipids originated from archaea or bacteria, has been broadly used as a ubiquitous biomarker for the paleoceanogprahic reconstruction. Although the numerous paleoceanographic results in the East Sea have been reported, the GDGT records and its application to the East Sea paleoceanography are still limited. In this study, we reconstructed the late Pleistocene seawater temperatures using hydroxylated and isoprenoid GDGTs using a sediment core 19ESDP-101 from the Hupo Trough of the southwestern East Sea (Japan Sea). Several temperature proxies were compared, alongside additional GDGT-derived indices and mean grain size. The temperature proxies yielded broadly consistent temperatures during the warm periods, but diverged in cooler intervals, where RI-OH′ values decreased sharply. These discrepancies reflect the different sensitivity to temperature, salinity, and depositional conditions. Proxy-derived temperatures were inversely correlated with sediment grain size, implying linkage between hydrographic and depositional environments. During the glacial periods, coarse-grained particles, low TEX86L values, and high terrestrial input were correlated, suggesting the sea-level control on environmental conditions. Nevertheless, the integration of multiple GDGT proxies from core 19ESDP-101 highlights the significance of local oceanographic settings in paleoenvironmental reconstruction and supports the selective use of TEX86L and OH-GDGTs.

How to cite: Park, Y.-H. and Khim, B.-K.: Biomarker record in the Hupo Trough of the southwestern East Sea since the late Pleistocene, EGU General Assembly 2026, Vienna, Austria, 3–8 May 2026, EGU26-20044, https://doi.org/10.5194/egusphere-egu26-20044, 2026.

EGU26-20214 | Orals | BG2.7

Back to alkenone sources: molecular profiling of alkenone-producing Isochrysidales in Swiss lakes using targeted DNA amplicon sequencing  

Céline Martin, Lisa Marchand, Nora Richter, Nathalie Dubois, and Linda Amaral-Zettler

Paleoclimate records play a crucial role in improving the performance of climate models by enhancing our mechanistic understanding of climate dynamics and providing an independent framework for evaluating model simulations through model–data comparisons. However, for such comparisons to be successful, reliable climate reconstructions are required, particularly with respect to their seasonal sensitivity. To achieve this, we need robust proxies supported by a solid mechanistic understanding.

In this work, we aim to provide a solid foundation for the use of the lacustrine alkenone paleothermometer in mid-latitude freshwater lakes. Alkenones are temperature-sensitive molecules produced by haptophyte algae from the order Isochrysidales. The alkenone unsaturation degree has been linked to temperature and has been widely used to reconstruct past sea surface temperatures. Alkenones are also present in lakes, although they do not occur in all lakes. In freshwater lakes, alkenone-producing Isochrysidales belong to a phylogenetically distinct group compared to those found in saline lakes and marine environments. Previous work on Swiss lakes has shown that alkenones are relatively common in mid-latitude European lakes, are produced between ice-out and the establishment of lake stratification, and record water temperature, as found in high-latitude lakes. However, this group remains poorly characterized, particularly regarding its life cycle and genetic diversity, which limits our understanding of the lacustrine alkenone proxy in freshwater lakes.

To address these knowledge gaps, we monitored two Swiss lakes, Lake St. Moritz, an alpine lake, and Lake Greifen, a lowland lake, by combining alkenone characterization with DNA sequencing of small subunit (18S), internal transcribed spacers (ITS 1 and ITS2) and large subunit ribosomal RNA (5.8S and 28S) marker genes targeting Isochrysidales. Using this approach, we aim to: (i) refine the identification of the Isochrysidales present in both lakes; (ii) characterize the temporal dynamics of the Isochrysidales community in terms of structure and abundance throughout the bloom period; (iii) identify the life cycle stage during which alkenones are produced; and, (iv) determine the environmental controls on the Isochrysidales bloom timing.

How to cite: Martin, C., Marchand, L., Richter, N., Dubois, N., and Amaral-Zettler, L.: Back to alkenone sources: molecular profiling of alkenone-producing Isochrysidales in Swiss lakes using targeted DNA amplicon sequencing , EGU General Assembly 2026, Vienna, Austria, 3–8 May 2026, EGU26-20214, https://doi.org/10.5194/egusphere-egu26-20214, 2026.

EGU26-20912 | ECS | Posters on site | BG2.7

Holocene temperature and environmental reconstruction from Llanos de Moxos in western Amazon based on GDGTs 

Petter Hällberg, Umberto Lombardo, Giovanni Manzella, Enno Schefuß, Thomas Stevens, and Francien Peterse

The Holocene temperature history of the lowland Amazon Basin remains poorly constrained, even though the region plays a key role in global climate, carbon cycling, and biodiversity. We present a Holocene record of glycerol dialkyl glycerol tetraethers (GDGTs) from a lake sediment core in the westernmost Amazon Basin, Bolivia, providing new constraints on regional temperature evolution and lake environmental conditions. The brGDGT based temperature reconstruction reveal a low amplitude, gradual warming trend throughout the Holocene. This pattern is consistent with other terrestrial records from tropical South America but contrasts with compiled tropical and global temperature reconstructions that suggest more pronounced early to mid-Holocene warmth followed by cooling. Our results therefore support the hypothesis that Holocene temperature evolution in tropical South America was distinct from that of other low latitude regions and from the global mean, highlighting the importance of regional climate dynamics and land surface feedbacks in shaping tropical climate trajectories.

In addition to temperature, GDGT distributions indicate four distinct phases of changing lake conditions over the Holocene, characterized by shifts in productivity and bottom water redox conditions. These variations likely reflect changes in local landscape development and catchment processes, as well as alterations in wind driven lake mixing. The most recent interval shows signatures consistent with enhanced productivity which may be linked to human activity in the catchment.

Together, these results provide new insights into the long-term temperature history of the western Amazon Basin and demonstrate the value of GDGTs for simultaneously reconstructing regional climate trends and lake environmental change in tropical lowland settings.

How to cite: Hällberg, P., Lombardo, U., Manzella, G., Schefuß, E., Stevens, T., and Peterse, F.: Holocene temperature and environmental reconstruction from Llanos de Moxos in western Amazon based on GDGTs, EGU General Assembly 2026, Vienna, Austria, 3–8 May 2026, EGU26-20912, https://doi.org/10.5194/egusphere-egu26-20912, 2026.

EGU26-8947 | ECS | PICO | BG2.10

Latest updates to the goFlux R package: new functionalities and improvements 

Karelle Rheault, Camille Minaudo, Jesper Riis Christiansen, and Klaus Steenberg Larsen

The goFlux R package was designed as an all-inclusive flux calculation tool to calculate chamber GHG fluxes. goFlux allows for an easy import of raw data directly into R from a variety of instruments; simplifies identification of start and end times of individual flux measurements; quality checks the results based on objective criteria that goes beyond simply using R2; and provides the user with a recommendation for the best flux estimate.

In the last year, goFlux has been improved with new functionalities and additional ongoing improvements, including auto.ID for an automatic selection of the observation window (no more clicking!), iso.comp for isotopic composition determination of different isotope ratios (13C, 15N or 18O), crop.meas for additional pre-processing of data after import (e.g., adding a deadband or cropping measurements), and auto.deadband for an automatic detection of the best deadband per measurement. Furthermore, goFlux is now compatible with a larger selection of instruments from LI-COR, LGR, GAIA2TECH, Gasmet, Picarro, Aeris, PP-Systems, Earthbound Scientific Ltd, Healthy Photon, Eosense, and PRI-ECO. Finally, goFlux now integrates new functionalities for reproducible calculation of GHG fluxes from static or floating chamber measurements in aquatic ecosystems, also accounting for ebullition events and separating total fluxes into diffusive and ebullitive components.

Further improvements are being made to the automatic selection of the best flux estimate using the function best.flux. In goFlux, a central element is to constrain the maximal curvature allowed due to non-linearity, by using the parameter of kappa-max (k), first introduced in Hüppi et al. (2018). The advantage of the k parameter is that it is based on objective metrics of instrument precision and chamber specific dimensions and applying k essentially avoids excessive flux overestimation, especially for noisy or small fluxes which often appear in chamber-based applications. Similar to the kappa-max parameter, we are developing the kappa-min parameter, which indicates a minimum threshold under which the best flux estimate will automatically default to the non-linear model.

In summary, goFlux is meant to be “student proof”, meaning that no extensive knowledge or experience is needed for data import and pre-processing in R, and selecting the best flux estimate (linear or non-linear models). This poster presentation will highlight new functionalities and improvements made to the goFlux R package in the last year, as well as ongoing developments, that have been made to improve the "user-friendliness" of the package. Come see us at our poster session to discuss new features you would like to see added in the future!

For more information, visit our webpage: https://qepanna.quarto.pub/goflux/

How to cite: Rheault, K., Minaudo, C., Riis Christiansen, J., and Steenberg Larsen, K.: Latest updates to the goFlux R package: new functionalities and improvements, EGU General Assembly 2026, Vienna, Austria, 3–8 May 2026, EGU26-8947, https://doi.org/10.5194/egusphere-egu26-8947, 2026.

EGU26-9304 | PICO | BG2.10

Rethinking soil incubation greenhouse gas monitoring: How the Picarro G2508 coupled with the Sage gas autosampler compares against gas chromatography analysis 

Magdalena E. G. Hofmann, Jan Woźniak, Joyeeta Bhattacharya, Tibisay Perez, and Whendee L. Silver

High‑precision greenhouse gas (GHG) measurements are essential for accurately assessing soil carbon and nitrogen cycling. Traditionally, gas chromatography (GC) with autosamplers has been the standard for soil incubation studies due to its accuracy and high‑throughput capability. Recent advances in laser‑based systems, such as Picarro’s G2508 Cavity Ring‑Down Spectroscopy (CRDS) analyzer, now enable continuous, real‑time monitoring of CO₂, CH₄, N₂O, and other gases. When paired with Picarro’s new Sage gas autosampler, the system supports automated, high‑throughput measurements of discrete, small‑volume gas samples using only zero air (or N₂) for flushing and requiring minimal maintenance.

To evaluate performance relative to GC, we conducted an intercomparison study using 60 mL samples split into two equal aliquots—one measured with the G2508–Sage system and one with GC. Certified reference gases (9.9 ppm N₂O, 10 ppm CH₄, 1008 ppm CO₂) and their 10–80% dilutions were analyzed. Both systems achieved coefficients of variation (CVs) below 5%, with the G2508–Sage consistently showing lower CVs when sample concentrations were within the analyzer’s dynamic range. Strong linear correlations (R² > 0.99) were observed across all gases.

For soil incubation headspace samples containing elevated GHG concentrations, the two systems generally agreed within CVs <5%. The G2508–Sage delivered more precise CH₄ measurements, while CO₂ and N₂O occasionally showed higher CVs—likely due to sample carryover, concentrations exceeding the CRDS dynamic range, or insufficient flush times between variable samples. We present best-practice recommendations to ensure the highest accuracy and precision with the G2508-Sage system.

Overall, the Picarro G2508–Sage autosampler system provides a robust, cost‑effective, and user‑friendly alternative to GC for soil GHG analysis, especially for concentrations within the CRDS optimal range. Its low consumable requirements, reduced installation and maintenance demands, and suitability for both headspace and high‑throughput flux studies expand instrumentation options for soil biogeochemistry research.

How to cite: Hofmann, M. E. G., Woźniak, J., Bhattacharya, J., Perez, T., and Silver, W. L.: Rethinking soil incubation greenhouse gas monitoring: How the Picarro G2508 coupled with the Sage gas autosampler compares against gas chromatography analysis, EGU General Assembly 2026, Vienna, Austria, 3–8 May 2026, EGU26-9304, https://doi.org/10.5194/egusphere-egu26-9304, 2026.

Chamber-based in situ measurements of greenhouse gas (GHG) fluxes have been widely applied in numerous studies. However, with the increasing applications of online optical GHG analyzers, the chamber system designs and measurement protocols are quite diverse and also uncertain.

Here, we compared various measurement approaches for soil CO2, CH4, and N2O fluxes, by optimizing the chamber base collar, chamber volume, within-chamber fan, fertilizer treatments and integration time for flux calculation. Additionally, we conducted a flux monitoring campaign over 80 hours with both automated multi-chamber system (M16 multiplexer + LI-COR 7810&7820) and discrete sampling with offline measurement by gas chromatography (GC; Agilent 8890). Fluxes were computed from concentration time series and evaluated using goodness-of-fit and error diagnostics (e.g., R2, CV, RMSE, MAE) and by systematically varying the regression time window to quantify window dependence. In parallel, soil water status (WFPS) and rainfall were monitored, and soil inorganic N (NH4+ and NO3-) was measured at selected rounds to interpret event-driven responses. 

The results showed that base collar installation and internal fan is highly necessary in assuring good linearity of concentration measurement along time and minimizing disturbance upon chamber closure. Regarding the integration time for flux calculation, the length of datasets markedly affected fitting performance and flux magnitude, which are mostly critical for CH4 and N2O. During the 80 h automated deployment, fertilized plots exhibited pronounced, pulse peaks of N2O emissions (hot moments) superimposed on chamber-cycle oscillations, while CH4 displayed stronger shared background variability across chambers. These N2O pulses coincided with wetting-related dynamics indicated by WFPS or rainfall patterns and concurrent shifts in inorganic N. Cross-validation between online (LI-COR) and offline (GC) fluxes showed a general agreement for N2O but a weaker association for CH4, indicating systematic bias and limited explanatory power of sparse offline point sampling under rapidly changing conditions. Together, our results provide practical, species-specific guidance for chamber-based flux measurements and highlight the need for harmonized synchronization and computation protocols when integrating online and/or offline approaches, especially during event-driven flux dynamics.   

Keywords: Static Chamber; Greenhouse Gas Flux; Online–offline Comparison; Hot Moments

How to cite: Wu, L. and Yu, L.: Method optimization and comparison for high-frequency static-chamber measurements of CO2, CH4 and N2O fluxes from soil, EGU General Assembly 2026, Vienna, Austria, 3–8 May 2026, EGU26-10028, https://doi.org/10.5194/egusphere-egu26-10028, 2026.

EGU26-11210 | ECS | PICO | BG2.10

Effects of Medium- and Long-Term Soil Warming on Plant Photosynthesis in a Subarctic Grassland 

Ruth Tchana Wandji, Timon Callebaut, Iolanda Filella, Peter Lootens, and Bjarni D. Sigurdsson

High-latitude ecosystems are already experiencing accelerated warming, and predictions indicate that those areas will warm more than the global average in the coming decades. There is a lack of long-term manipulation experiments in Arctic and subarctic grasslands that can help with predictions on how these changes will affect those keystone ecosystems.

Here, we investigate the effects of medium-term (16 years) and long-term (>60 years) soil warming on leaf-level gas exchange measured in situ on Ranunculus acris L. (R. acris) growing at unmanaged grasslands at the ForHot soil warming infrastructure in southern Iceland. Measurements were done in plots having no additional warming (ambient) or with an increase in mean annual soil temperature of +8°C. Clamp-on measurements as well as response curves for both intracellular CO₂ (A/Ci) and light (A/I) were done, and non-linear modelling and the Farquhar model were used to estimate different physiological or photosynthetic traits. Finally, chemical analyses on the measured leaves were executed to gain further insights into apparent changes.

Our results showed little to no significant effect of prolonged soil warming on the characteristics of the A/Ci or A/I curve parameters, indicating a conservative response in C uptake per unit leaf area. Also, no significant effects were found for stomatal conductance (gs), stable isotope ratio (δ¹³C) and leaf-N between the soil warming treatments, indicating that the expected indirect effects of the prolonged soil warming were not apparent. However, across the entire experiment (i.e., across all soil temperature plots), R. acris showed a strong positive response to leaf-N concentrations across almost all estimated traits. Indicating that variability in plant N status was still the primary indirect driver of photosynthetic capacity in these ambient and warmed subarctic grasslands, irrespective of soil warming or duration of warming.

Our findings suggest that R. acris already had high photosynthetic capacity in soils at ambient conditions, and it may therefore have allocated additional nutrients acquired in warmer soils to other growth-related processes rather than to enhancing the photosynthetic system at a leaf level.

How to cite: Tchana Wandji, R., Callebaut, T., Filella, I., Lootens, P., and D. Sigurdsson, B.: Effects of Medium- and Long-Term Soil Warming on Plant Photosynthesis in a Subarctic Grassland, EGU General Assembly 2026, Vienna, Austria, 3–8 May 2026, EGU26-11210, https://doi.org/10.5194/egusphere-egu26-11210, 2026.

EGU26-12634 | ECS | PICO | BG2.10

An Innovative IoT-Based Automated Flux Chamber for Continuous Monitoring of CO2 and VOC Emissions from the Subsurface 

Nicolò Tonolo, Sergio Teggi, Simona Berardi, Maria Paola Bogliolo, and Iason Verginelli

Natural attenuation process occurring at hydrocarbon-impacted sites are driven by biogeochemical interactions between the subsurface, microbial communities, and environmental conditions. Beyond direct volatile organic compounds (VOCs) volatilization from the contamination source, aerobic biodegradation pathways lead to the consumption of hydrocarbons and the production of gaseous emission from the subsurface, including CO₂. Current monitoring campaigns for evaluating gas fluxes are generally conducted periodically, relying on either soil-gas sampling and subsequent laboratory analysis or the use of high-cost instrumentation for rapid and expedited concentration measurements. These methods, while providing representative results of average values over specific and narrow time intervals, do not allow for an accurate description of the temporal dynamics of VOC biodegradation and the consequent CO₂ emissions, which are known to exhibit significant fluctuations on both daily and seasonal scales. To overcome this limitation, there has been growing interest in recent years in developing low-cost systems that allow for continuous monitoring of gas emissions.

This work, conducted as part of a research project funded by INAIL (BRiC ID21-2022),  presents the development and application of a self-designed automated static flux chamber for real-time and continuous monitoring of biodegradation-related gas emissions from the subsurface. The system integrates low-cost Non-Dispersive Infrared (NDIR) sensors for CO₂ measurement, together with a Photoionization Detector sensor (PID) for VOC concentration measurements, and is additionally equipped with sensors for environmental parameters (i.e. temperature, relative humidity and atmospheric pressure). The chamber is equipped with two air pumps dedicated to periodic automatic air exchange, ensuring operational continuity and allowing the acquisition of one flux measurement every 20 minutes. The electronic hardware is managed by an ESP32 microcontroller and is completed with an SD card for raw data storage and with a LoRaWAN transmission module for real-time data visualization and management in remote IoT clouds. Furthermore, the system is externally powered by an AGM lead-acid battery, connected to a photovoltaic panel, enabling energy self-sufficiency during field deployments.

The system was calibrated with a commercial multi-gas analyzer through a series of laboratory tests, with results comparable to those of commercially available instruments. Furthermore, experimental tests were conducted using the developed flux chamber prototype to investigate the biodegradation dynamics of soils artificially contaminated with two different fuel types. Continuous monitoring over a two-month period enabled the observation of biodegradation-related processes and the associated emissions of VOCs and CO2. Subsequently, the automated chamber was employed in a two-week monitoring campaign at a contaminated site, to evaluate its efficiency in real contamination scenarios.

The system developed in this work represents a promising step toward an economical and scalable solution for a deeper understanding of soil biodegradation processes and the resulting gas emissions at contaminated sites, accounting for correlations with environmental parameters as temperature, humidity and atmospheric pressure. Furthermore, the integration with IoT environments, together with full system automation and energy self-sufficiency, provides a significant contribution to the digitalization and automation of subsurface monitoring techniques.

How to cite: Tonolo, N., Teggi, S., Berardi, S., Bogliolo, M. P., and Verginelli, I.: An Innovative IoT-Based Automated Flux Chamber for Continuous Monitoring of CO2 and VOC Emissions from the Subsurface, EGU General Assembly 2026, Vienna, Austria, 3–8 May 2026, EGU26-12634, https://doi.org/10.5194/egusphere-egu26-12634, 2026.

EGU26-12931 | PICO | BG2.10

Carbon flux in Icelandic heathlands; a contribution to LULUCF Tier 2 emission factors 

Sigurlaug Birna Gudmundsdottir, Solveig Sanchez, Elva Bjork Benediktsdottir, Hrafnhildur Vala Fridriksdottir, and Johann Thorsson

Climate change due to anthropogenic factors is of global concern. Monitoring and reporting all potential carbon sinks and sources are therefore important. Iceland adopted the Paris Agreement in 2016 and decided in 2019 to participate jointly with the EU in meeting the Paris Agreement commitments. This requires compiling and reporting emission data for the whole country. Land use, land use change and forestry (LULUCF) is the main contributing factor of GHG emissions in Iceland. However, heathlands are the spatially largest of the LULUCF grassland category although not the largest contributor to CO2 emissions, as that is the wetland converted to grassland subcategory. Emission from the heathlands subcategory is currently uncertain and still rely on the IPCC default Tier 1 emission factors. In this ongoing research the aim is to improve the understanding of the carbon processes in Icelandic heathlands and to push the national accounting for grasslands to a higher tier. Since 2022 CO2 emissions have been measured weekly at different heathland sites during the summer months; May to September. Currently, around 50 plots are active. Each plot is comprised of 9 to 12 hollow 12 cm cylinders driven roughly 10 cm into the ground in clusters of 3. EGM-5 portable CO2 gas analyzer with a CPY-5 transparent chamber is used for field measurements, first with the chamber uncovered then covered. Other measurements include soil temperature, soil moisture, air temperature and PAR. Preliminary results show a seasonal trend of sequestration increase later in the summer. There is a high variability in the data but an overall higher sequestration rate than emission rate is detected. Cloud cover and weather conditions have a clear effect on the carbon flux. This variability underlines the importance of long-term series for such datasets.

How to cite: Gudmundsdottir, S. B., Sanchez, S., Benediktsdottir, E. B., Fridriksdottir, H. V., and Thorsson, J.: Carbon flux in Icelandic heathlands; a contribution to LULUCF Tier 2 emission factors, EGU General Assembly 2026, Vienna, Austria, 3–8 May 2026, EGU26-12931, https://doi.org/10.5194/egusphere-egu26-12931, 2026.

Continuous automated measurements are essential for quantifying the spatial and temporal variability in soil greenhouse gas fluxes and for resolving “hot spot” and “hot moments” that contribute disproportionately to ecosystem-scale emissions. This is especially important for methane (CH4) and nitrous oxide (N2O), where short-lived emission pulses can account for a substantial fraction of the annual mean and are readily missed by low-frequency sampling.

We found that hot moments accounted for <5% of the measurements but contributed ~71% of the annual N2O flux from a wheat cropland soil in a high-emission year, and CH₄ hot moments ranged from ~100% to >700% of seasonal means. Similarly, in peatland maize system, hot spots and hot moments accounted for <2% of the measurements but were 45 ± 1% of mean annual N2O fluxes and up to 140 ± 9% of mean annual CH4 fluxes. Automated chamber systems can provide multiple flux estimates per hour and dense concentration time series within each enclosure, increasing the likelihood of capturing short-lived pulses, diurnal dynamics, and event-driven responses.

Quantifying extreme flux events is not without challenges, however. Deriving fluxes from automated chamber time series requires careful and transparent processing. Non-linear concentration trajectories may arise from diffusion and certain chamber-soil geometries, in which case linear regressions can underestimate fluxes. Conversely, apparent non-linearity can result from artifacts (e.g., inadequate mixing, leaks, or collar effects), and thus non-linear models may yield good statistical fits but biased flux estimates. High flux events can cause carryover of gases between consecutive chamber measurements and generate substantial artifacts, often appearing as inflated concentrations at the start of the next measurement and, in some cases, as subsequent apparent negative fluxes when the system “recovers.

Relating fluxes to drivers presents additional challenges. Continuous measurements of key environmental variables, such as soil oxygen, moisture, and temperature, are required at the same temporal and spatial scale as greenhouse gas fluxes to accurately capture relationships. Data on soil pH and mineral nitrogen also significantly improve model prediction, although few studies sample with sufficient intensity to provide strong inference.

In this work, we provide a roadmap for improving the utility of automated measurements at ecosystem scales, assessing transparent, physics-based selection of linear vs. nonlinear models, the adoption of standardized, community-aligned flux processing workflows, quality control diagnostics, and recommended sensor suites to improve comparability across studies and strengthen inference about hot moments and hot spots in soil greenhouse emissions.

How to cite: Silver, W., Perez, T., and Kwong, C.: Hot spots, hot moments, or hot mess: determining the patterns and drivers of greenhouse gas emissions using continuous automated measurements, EGU General Assembly 2026, Vienna, Austria, 3–8 May 2026, EGU26-13287, https://doi.org/10.5194/egusphere-egu26-13287, 2026.

EGU26-14340 | PICO | BG2.10

Automating Analyzer Background Calibration for a Long-Term Flux Chamber System 

Nicholas Nickerson, Chance Creelman, Mara Taylor, Heidi Maxner, Sami Ketonen, Allan Bradey, Alex Marshall, and Greg Covey

The use of in-situ high precision gas analyzers for soil flux chamber measurements has dramatically improved the quality of collected data compared to manual sampling. When deployed in the field long-term, these systems can provide high resolution monitoring of both baseline and event-driven emissions. These environments pose challenges to maintaining complex instrumentation however, especially in humid or varying temperature conditions. These physical factors can accelerate calibration drift, and thus require more frequent intervention to correct this effect.

We present a methodology for automating this recalibration in-situ as applied to a Gasmet GT5000 Terra FTIR Gas Analyzer coupled with an Eosense autochamber system. Through the use of a simple hardware module, nitrogen gas based background calibrations can be scheduled alongside soil flux chamber measurements without the need for manual intervention such as changing fittings or opening tanks. This combined system allows for reference gas corrections at pre-planned intervals, or reactively in response to changes in ambient temperature or sampled water content.

How to cite: Nickerson, N., Creelman, C., Taylor, M., Maxner, H., Ketonen, S., Bradey, A., Marshall, A., and Covey, G.: Automating Analyzer Background Calibration for a Long-Term Flux Chamber System, EGU General Assembly 2026, Vienna, Austria, 3–8 May 2026, EGU26-14340, https://doi.org/10.5194/egusphere-egu26-14340, 2026.

EGU26-14871 | ECS | PICO | BG2.10

Short-term impacts of prescribed fire and invasive grass on net ecosystem CO2 exchange (NEE) in sagebrush ecosystems: quantifying NEE drivers through automated plot-scale chamber measurements 

Nina V. Bohlmann, Nicholas D. Beres, John (Jay) A. Arnone III, Richard L. Jansoni, and Andrew J. Andrade

It is widely known that the increasing presence of invasive annual grasses (IAG), such as Bromus tectorum (cheatgrass), is reshaping landscapes through positive fire-IAG feedback loops across the ~520,000 km2 sagebrush ecosystems of the western US. However, the short-term effects of invasive annuals and fire cycles on net ecosystem COexchange (NEE) and their controlling mechanisms remain poorly quantified, partly due to limited observations able to resolve heterogeneity in plant community composition, fire effects, and soil-vegetation interactions. The objectives of this study were (1) to quantify how fire, plant community species composition, IAG presence, plant canopy greenness (NDVI), and environmental drivers influence late season NEE; and (2) to compare 4x3 meter plot-level NEE values measured with an automated mobile transparent ecosystem gas exchange chamber with simultaneously collected NEE measured across the entire study site using eddy covariance.  We measured diel NEE using the automated chamber system on 20 4x3 m experimental plots, which were categorized into pairs according to their plant compositions, namely the varying amounts of B. tectorum, perennial native herbaceous species, and native perennial grasses. In late autumn 2025, one plot within each pair was experimentally burned, allowing for comparison of burned and unburned plots with similar pre-fire vegetation.  Repeated pre- and post-burn CO2 flux measurements were collected and analyzed in relation to key NEE drivers, including photosynthetically active radiation (PAR), air temperature, and vegetation composition. Nighttime NEE ranged from 0.62 to 1.48 µmol CO2 m⁻² s⁻¹, consistent with net CO2 release via ecosystem respiration, while daytime NEE ranged from 0.32 to −4.36 µmol CO2 m⁻² s⁻¹, indicating net CO2 uptake. Negative daytime NEE was observed on all measurement dates for most plots, including post-fire burned plots, coincident with late-season germination of B. tectorum. Daytime NEE measured in burned plots actually became more negative relative to values measured in these plots before they were burned, whereas nighttime values remained unchanged. These patterns highlight the importance of IAGs in mediating short-term carbon exchange in recently disturbed sagebrush ecosystems. This work aims to provide new insight into the short-term carbon dynamics of fire-prone sagebrush systems and improve mechanistic understanding of disturbance-driven changes in ecosystem CO2 exchange. 

How to cite: Bohlmann, N. V., Beres, N. D., Arnone III, J. (. A., Jansoni, R. L., and Andrade, A. J.: Short-term impacts of prescribed fire and invasive grass on net ecosystem CO2 exchange (NEE) in sagebrush ecosystems: quantifying NEE drivers through automated plot-scale chamber measurements, EGU General Assembly 2026, Vienna, Austria, 3–8 May 2026, EGU26-14871, https://doi.org/10.5194/egusphere-egu26-14871, 2026.

EGU26-17029 | PICO | BG2.10

Evaluation of low-cost sensors for measurement of CO2 and CH4 fluxes at a Finnish wetland 

Claire C. Treat, Moritz Gehlmann, Federico Dallo, Benoit Wastine, Bakhram Gaynullin, Huy Duong Gia, and Tuan-Vu Cao

Northern wetlands are an important sink of atmospheric CO2 and source of methane (CH4) to the atmosphere but many uncertainties remain in the magnitude of fluxes due to high spatial, temporal, and methodological variability. Chamber measurements are an important method to link CO2 and CH4 fluxes to underlying soil processes. While high-frequency laser gas analyzers have been crucial for improving the number and quality of flux measurements, costs for purchase and maintenance of these systems are still cost-prohibitive for widespread applications of this method for quantification of fluxes.

In the MISO project, we test a low-cost NDIR-based portable sensor for flux measurements at a wetland site in Finland. We deployed the new MISO sensor in a two existing automated chambers (one transparent, one opaque) and evaluated the performance of the low-cost sensor for quantifying fluxes of CO2 and CH4 during a three-week period in July 2025. The results indicate that CO2 fluxes can be measured well with the sensor setup. Methane fluxes show strong variability in the raw signal; calibrated values are highly dependent on methods used to correct for interference from water vapor and temperature. These findings indicate that this method is promising for applications in wetlands and would provide an important step forward in enabling widespread flux monitoring networks.

How to cite: Treat, C. C., Gehlmann, M., Dallo, F., Wastine, B., Gaynullin, B., Gia, H. D., and Cao, T.-V.: Evaluation of low-cost sensors for measurement of CO2 and CH4 fluxes at a Finnish wetland, EGU General Assembly 2026, Vienna, Austria, 3–8 May 2026, EGU26-17029, https://doi.org/10.5194/egusphere-egu26-17029, 2026.

EGU26-17474 | ECS | PICO | BG2.10

Relative importance of soil temperature and soil moisture on GHG fluxes is site specific: Results from three drying-rewetting experiments in Austrian forests 

Dylan Goff, Dirnböck Thomas, Djukic Ika, Gorfer Markus, Kitzler Barbara, Kobler Johannes, Schloegl Mathias, and Diaz-Pinés Eugenio

Climate change has increased the frequency and intensity of extreme weather events, including droughts and heavy rainfall, across large parts of Central Europe. Forest ecosystems in this region remain exposed to elevated nitrogen inputs from agricultural and industrial sources, despite declining atmospheric N deposition. The combined effects of altered precipitation regimes and N deposition are expected to modify key soil biogeochemical processes and greenhouse gas (GHG) fluxes, yet their interactive impacts remain poorly constrained.

We investigated soil GHG responses to combined drying–rewetting (DRW) cycles and N addition across three representative Austrian broadleaf forest sites. DRW treatments excluded natural rainfall during the growing season, thereby inducing soil drought, and redistributed long-term mean precipitation into three extreme rainfall events, thereby rewetting the dry soil. Nitrogen addition was applied at a rate of 40 kg N ha⁻¹ yr⁻¹. Soil CO₂, N₂O, and CH₄ fluxes were measured at high temporal resolution using automated chamber systems, alongside continuous soil moisture and temperature measurements, during the years 2021, 2022, and 2025. Ancillary soil chemical and biological data were collected to support field observations.

Soil GHG fluxes were analysed using empirical modelling and Bayesian inference. Drying–rewetting treatments led to reduced soil CO₂ emissions and strongly suppressed N₂O fluxes, as drought-induced reductions in these fluxes outweighed the rewetting pulses, while CH₄ uptake was enhanced compared to ambient conditions. During naturally dry periods, N₂O emissions converged between DRW and control plots. Nitrogen addition exerted only modest effects on GHG fluxes across sites. Modelling results revealed site-specific differences in the relative importance of soil moisture and temperature as drivers of GHG fluxes, linked to soil type and hydrological context.

Our findings highlight the importance of high-frequency automated chamber measurements combined with empirical modelling approaches for assessing the relative importance of extreme precipitation regimes and N deposition on forest soil GHG budgets, with implications for understanding ecosystem–climate feedbacks under future climate scenarios.

How to cite: Goff, D., Thomas, D., Ika, D., Markus, G., Barbara, K., Johannes, K., Mathias, S., and Eugenio, D.-P.: Relative importance of soil temperature and soil moisture on GHG fluxes is site specific: Results from three drying-rewetting experiments in Austrian forests, EGU General Assembly 2026, Vienna, Austria, 3–8 May 2026, EGU26-17474, https://doi.org/10.5194/egusphere-egu26-17474, 2026.

EGU26-17636 | ECS | PICO | BG2.10

Low-cost, high-frequency greenhouse-gas flux observations in wetlands using automated and portable chamber systems 

Huy Duong Gia, Federico Dallo, Torbjørn Heltne, Moritz Gehlmann, Benoit Wastine, Bakhram Gaynullin, Claire Treat, Stephen Matthew Platt, and Tuan-Vu Cao

Wetlands are among the most dynamic and climate-relevant biogeochemical reactors on Earth, acting simultaneously as strong sinks and sources of carbon dioxide (CO2) and methane (CH4). Their gas exchange with the atmosphere is controlled by interacting hydrological, biological, and physical drivers operating on timescales from minutes to seasons. Capturing this complexity requires high-frequency flux measurements across space and time, yet traditional chamber and analyzer systems remain expensive, power-intensive, and difficult to deploy in remote or waterlogged environments, limiting spatial coverage and long-term observations.  

Within the MISO project[1], we developed and tested a new generation of low-cost, autonomous greenhouse-gas sensing systems integrated with state-of-the-art automated wetland chambers and with new portable manual chambers designed specifically for hard-to-reach ecosystems. Our approach combines compact multi-gas NDIR sensors capable of measuring CO2, CH4, and H2O with robust calibration pipelines based on co-location with reference-grade analyzers and machine-learning-driven correction models. By explicitly modelling nonlinear effects of humidity, temperature, and pressure, these data-driven calibrations enable low-cost sensors to reproduce reference-quality gas concentration dynamics under the high-humidity and rapidly changing conditions typical of wetlands.  

Field deployments in boreal peatlands demonstrate that calibrated low-cost sensors integrated inside automated chambers closely track reference CO2 and, in some conditions, even CH4 concentrations during chamber closure cycles, enabling reliable flux estimation under both light and dark conditions. This performance is achieved with hardware that consumes far less power and is far easier to deploy and maintain than conventional high-end gas analyzers. In parallel, we developed a portable, lightweight manual chamber system prototype that combines the same low-cost sensing technology with a rugged, field-ready enclosure. This system would enable rapid, flexible flux measurements at sites that are inaccessible to heavy infrastructure, such as floating peat mats, remote fen systems, or seasonally flooded areas.  

Beyond hardware, MISO places strong emphasis on data usability and transparency. We created a user-friendly interactive annotation platform[2] that allows operators to visually inspect high-frequency chamber time series and label key events such as chamber closure, background periods, disturbances, or sensor transitions directly on the timeline. These annotations are stored in a structured format and propagated into downstream flux calculations, providing traceability and reproducibility that are often missing in automated chamber datasets. Together, these developments demonstrate how low-cost sensors, when combined with advanced calibration, automated chambers, and intuitive data tools, can ease wetland GHG monitoring. By lowering logistical and financial barriers, portable and autonomous systems make it feasible to expand flux measurements into previously under-sampled wetland regions, improving spatial representativeness and analyses of GHG production, consumption, and transport. This integrated approach supports the transition from sparse, site-specific flux measurements toward dense, process-oriented wetland GHG observing networks capable of capturing the true complexity of ecosystem–atmosphere exchange. 

[1] https://cordis.europa.eu/project/id/101086541 

[2] https://github.com/theRosyProject/MISOChambers-GUI-APP  

How to cite: Duong Gia, H., Dallo, F., Heltne, T., Gehlmann, M., Wastine, B., Gaynullin, B., Treat, C., Matthew Platt, S., and Cao, T.-V.: Low-cost, high-frequency greenhouse-gas flux observations in wetlands using automated and portable chamber systems, EGU General Assembly 2026, Vienna, Austria, 3–8 May 2026, EGU26-17636, https://doi.org/10.5194/egusphere-egu26-17636, 2026.

EGU26-17931 | ECS | PICO | BG2.10

Assessing soil carbonic anhydrase activity using CO₂ and COS exchange across tree–mycorrhizal associations 

Eva Demullier, Jérôme Ogée, Paul Arette-Hourquet, Nicolas Devert, Yangyang Dong, Debora Millan-Navarro, Sylvie Milin, and Lisa Wingate

Carbonic anhydrases (CAs) are ubiquitous metalloenzymes found in plants and soil microbes. They play an important role in the cycling of carbon within terrestrial ecosystems by catalyzing the rapid conversion of CO₂ into bicarbonate. CAs also catalyse the irreversible hydrolysis of carbonyl sulfide (COS) and the oxygen isotope exchange between atmospheric CO₂ and terrestrial water pools (CO18O + H₂O <-> CO₂ + H₂18O). Soil CA activity and its drivers can therefore be studied by using gas exchange systems that measure soil-air fluxes of COS and CO18O.

Soil CA activity is commonly quantified using such gas exchange systems that allow the retrieval of macroscopic rates of COS hydrolysis (kh) and ¹⁸O exchange between CO₂ and soil water (kiso). These macroscopic rates can be related to soil properties such as soil moisture and temperature, as well as average enzyme kinetic parameters at the soil microbial community level. These ‘community-level’ enzymatic parameters (kmax/Km) are expected to vary across contrasted ecosystems and soil microbial communities. However, microbial communities could also vary at a finer scale, between tree species, and particularly between different types of mycorrhizal symbioses, which reflect contrasting nutrient acquisition strategies and metabolic pathways.

In this study, we tested this hypothesis by measuring COS and CO18O fluxes in intact soil monoliths collected in a common garden under different tree species growing within the same climate and pedological context. This approach allowed us to characterize how soil CA activity (kh and kiso) vary between tree species and mycorrhizal types.

Contrary to our initial hypothesis, we found no difference between ‘community-level’ enzymatic parameters from different tree species or types of mycorrhizal associations. By measuring the monoliths at different soil temperature and soil moisture levels, we were also able to validate for the first time how the macroscopic rates kh and kiso can be related to these two abiotic factors, and estimate ‘community-level’ kmax/Km for this particular ecosystem.

This improved understanding of soil CA activity can help refine the representation of soil processes in large-scale models and better constrain the contribution of soils to the global CO₂ and COS mass balance.

How to cite: Demullier, E., Ogée, J., Arette-Hourquet, P., Devert, N., Dong, Y., Millan-Navarro, D., Milin, S., and Wingate, L.: Assessing soil carbonic anhydrase activity using CO₂ and COS exchange across tree–mycorrhizal associations, EGU General Assembly 2026, Vienna, Austria, 3–8 May 2026, EGU26-17931, https://doi.org/10.5194/egusphere-egu26-17931, 2026.

EGU26-21102 | ECS | PICO | BG2.10

Measuring complex structural emissions with inverse dispersion method and correcting for deposition in the case of ammonia 

Alex Valach, Weigeng Qin, Christoph Häni, Simon Bowald, and Thomas Kupper

Measuring trace gas exchanges from structural sources and surfaces with complex topography remains a challenge. The inverse dispersion method provides a suitable option that allows long-term monitoring without interfering with the system. In the case of ammonia emissions such as from animal housings and slurry storage tanks the inverse dispersion method is beneficial compared to other methods which can interfere with daily operations over longer time periods. Ammonia emissions from agriculture can constitute up to 80-90% of reactive N inputs in nearby ecosystems, especially in areas with high livestock densities such as Switzerland. Almost half of these originate from animal housings, which can be difficult to quantify in order to investigate and test mitigation options. However, when measuring emissions from housing and slurry storage facilities, it is necessary to install the instruments at some distance downwind of the structures to avoid turbulence interferences. Since ammonia strongly adsorbs to surfaces immediately following emission, this can lead to a considerable loss before the point of measurement.

Deposition models can be used to correct for this loss. Most models consist of a series of resistances to deposition that must be overcome to estimate the total loss. However, the calculation of the bulk canopy resistance requires significant additional site information, which even with its incorporation results in a relatively high uncertainty. Here we present measurements of ammonia emissions from animal housings using the inverse dispersion method which includes a simplified deposition correction. Based on multiple measurement campaigns we show this method to provide a reasonable estimate without the need for additional data while remaining within the same uncertainty range. We further discuss the importance of small-scale deposition from large point sources using controlled release experiments and highlight future development opportunities.

How to cite: Valach, A., Qin, W., Häni, C., Bowald, S., and Kupper, T.: Measuring complex structural emissions with inverse dispersion method and correcting for deposition in the case of ammonia, EGU General Assembly 2026, Vienna, Austria, 3–8 May 2026, EGU26-21102, https://doi.org/10.5194/egusphere-egu26-21102, 2026.

EGU26-22189 | ECS | PICO | BG2.10

Effect of biogenic structures on greenhouse gases emissions in wetlands of La Cruz Lagoon, Gulf of California, Sonora 

José Miguel Gutiérrez Rongel, Francisco Elizandro Molina Freaner, and Blanca González Méndez

Greenhouse gases (GHGs) are responsible for global warming, which has intensified due to human activities over the past few decades. Coastal wetlands—mangroves and salt marshes—represent an alternative for mitigating the negative effects of GHGs due to the ecosystem services they provide, especially carbon storage. However, they can act as sources or sinks of GHGs, but studies in Mexico are scarce and limited to the tropical and subtropical climates of the country, while the arid ecosystems of the northwest are understudied. This study was conducted in mangroves and salt marshes of Laguna La Cruz, Gulf of California, to understand the temporal and spatial dynamics, as well as the relationship between biogenic structures (crab burrows, and pneumatophores) and abiotic factors that influence GHG fluxes. Monthly measurements were taken during June, October, and November (2024) using static chambers coupled to an infrared spectrophotometer (FTIR, Gasmet DX4015) to simultaneously measure CO2, CH4, and N2O. Eight chambers per site were used under three treatments: the presence of burrows, and pneumatophores, and the absence of these structures. Fluxes were estimated using the Rfluxes package, and data were analyzed using REML and PCA (RStudio 2024). CO2, CH4, and N2O fluxes ranged from -53.53 to 437.13, -0.0899 to 0.0413, and -0.0325 to 0.0213 mg m-2 h-1, respectively. The most relevant factors for CO2 and CH4 were month, soil temperature, and biogenic structures. Biogenic structures facilitate the interaction between the soil and the atmosphere, while the month and soil temperature affect the metabolic activity of GHG-producing microorganisms. N2O did not show a clear relationship with any of the studied variables. GHG fluxes showed temporal variation and seem to be influenced by the presence of biogenic structures. However, more samples are needed to understand the annual variation of GHG, as well as to consider other variables that better explain the N2O variation.

How to cite: Gutiérrez Rongel, J. M., Molina Freaner, F. E., and González Méndez, B.: Effect of biogenic structures on greenhouse gases emissions in wetlands of La Cruz Lagoon, Gulf of California, Sonora, EGU General Assembly 2026, Vienna, Austria, 3–8 May 2026, EGU26-22189, https://doi.org/10.5194/egusphere-egu26-22189, 2026.

BG3 – Terrestrial Biogeosciences

EGU26-1550 | ECS | Orals | BG3.1

Canadian net forest CO2 uptake enhanced by heat-drought via reduced respiration 

Guanyu Dong and Fei Jiang

The response of net forest carbon uptake to warm extremes remains elusive. The year 2023 was at the time “the hottest year on record” globally, with Canada’s forests experiencing warm anomalies of above 2 °C and unprecedented drought and wildfires, providing a unique case to examine the response of boreal forest net carbon uptake to climate extremes. Here we combine satellite-based atmospheric CO2 flux inversions, and ground in-situ observations of CO2 fluxes and concentrations to investigate Canada’s forest net carbon uptake and its underlying mechanisms in 2023. We find that compared to 2015–2022, the Canada’s forest net carbon uptake was enhanced by 0.28 ± 0.23 PgC, offsetting 38–48% of Canadian wildfire emissions in 2023. This enhanced net uptake was dominated by large ecosystem respiration reductions, mainly attributable to severe root-zone soil moisture deficits and the unimodal temperature response of respiration. However, most dynamic global vegetation models failed to simulate the respiration reductions and the responses to hydrothermal conditions well. This study improves our understanding of boreal forest net carbon uptake in response to climate extremes and highlights an urgent need to improve vegetation models under global warming.

How to cite: Dong, G. and Jiang, F.: Canadian net forest CO2 uptake enhanced by heat-drought via reduced respiration, EGU General Assembly 2026, Vienna, Austria, 3–8 May 2026, EGU26-1550, https://doi.org/10.5194/egusphere-egu26-1550, 2026.

EGU26-1555 | Posters on site | BG3.1

Temperature Thresholds Drive Latitudinal Divergence In Herbaceous Ecosystem Carbon Balance 

Hang Li, Fei Jiang, and Guanyu Dong

Shrub–grassland (SGL) ecosystems cover over 40% of Earth’s vegetated land and play a crucial role in regulating the global carbon cycle, yet their large-scale responses to recent warming remain poorly constrained. Here we integrate satellite-derived gross primary productivity (GPP) and fire emissions with top-down estimates of net biosphere production (NBP) from OCO-2 XCO₂ inversions using the GCASv2 assimilation framework to quantify latitudinal trends in SGL net ecosystem production (NEP) from 2015 to 2024.

We find a clear latitudinal divergence in carbon dynamics. NEP has increased in equatorial SGLs but declined in mid-latitude regions. In equatorial areas, persistent increases in GPP surpass modest rises in total ecosystem respiration (TER), resulting in net carbon gains. In contrast, mid-latitude ecosystems experience stronger increases in TER, particularly heterotrophic respiration (Rh), than in GPP as temperatures approach the optimal range for Rh (15–23 °C). This imbalance leads to net carbon losses.

These findings reveal nonlinear, hydrothermal-threshold-driven carbon responses across SGL biomes and emphasize the need to incorporate such temperature–moisture constraints into Earth system models to improve projections of future carbon–climate feedbacks.

How to cite: Li, H., Jiang, F., and Dong, G.: Temperature Thresholds Drive Latitudinal Divergence In Herbaceous Ecosystem Carbon Balance, EGU General Assembly 2026, Vienna, Austria, 3–8 May 2026, EGU26-1555, https://doi.org/10.5194/egusphere-egu26-1555, 2026.

EGU26-2730 | ECS | Posters on site | BG3.1

Temperature constraints of terrestrial ecosystem respiration in global biomes 

Zhenhai Liu, Jiquan Chen, Bin Chen, and Shaoqiang Wang

Ecosystem respiration (Re) plays a critical role in the global carbon cycle, but is conventionally modelled with temperature response functions that do not adequately account for the limiting effects of high temperature on Re. Using Re data from the FLUXNET2015 network, we compared the conventional exponential temperature response function with a unimodal function that incorporates these effects. We found that the conventional function significantly underestimates the sensitivity of Re to temperature, potentially leading to overestimation of future carbon emissions. The activation energy (Ea) estimated by the unimodal function averaged 0.97 ± 0.44 eV, substantially higher than the 0.58 ± 0.27 eV calculated by the exponential function. The temperature threshold (Tth) for Re inhibition was identified at an average of 26.58°C across biomes. The largest Re increase occurs under SSP585, reaching 147.85% and 153.81% for the exponential and unimodal functions, respectively, by 2100 relative to Re simulated using the exponential function in 1990. As rising temperatures push ecosystems toward their thermal optimum, greater overestimation beyond the divergence threshold in SSP585 reduces the difference between the two functions compared to SSP245 and SSP370. These findings emphasize an underestimated temperature dependence and inaccurate trends in ecosystem respiration, highlighting the necessity of integrating high-temperature inhibition effects into Re models to improve projections of carbon dynamics.

How to cite: Liu, Z., Chen, J., Chen, B., and Wang, S.: Temperature constraints of terrestrial ecosystem respiration in global biomes, EGU General Assembly 2026, Vienna, Austria, 3–8 May 2026, EGU26-2730, https://doi.org/10.5194/egusphere-egu26-2730, 2026.

EGU26-4148 | ECS | Posters on site | BG3.1

Sensitivity of Global Terrestrial Gross Primary Productivity to Nitrogen Deposition Changes 

Shiliang Chen, Bin Chen, and Shaoqiang Wang

Global nitrogen deposition has escalated steadily since the 1980s, peaking around 2015 before stabilizing. However, global atmospheric chemical transport models often underestimate their magnitude, limiting the accurate assessment of their impact on terrestrial gross primary productivity (GPP). In this study, we elucidated the drivers of interannual GPP variability and quantified the contribution of nitrogen deposition from 1980 to 2020 using the latest global nitrogen deposition dataset, the TRENDY GPP products, and an interpretable machine learning framework (SHAP). Our findings revealed a consistent expansion in global GPP over the past four decades, averaging 156.95 ± 6.4 Pg C yr⁻¹. Intriguingly, although nitrogen deposition has recently plateaued, its relative influence on GPP has increased. Although climatic factors, primarily temperature and precipitation, dominate interannual GPP fluctuations across plant functional types (PFTs), nitrogen deposition explains 6.5% ± 3.6% of global variability. Notably, its impact is disproportionately pronounced in shrublands, savannas, grasslands, and croplands. Specifically, nitrogen enrichment stimulated GPP in grasslands and croplands but had an inhibitory effect in tropical forests. We identified a non-linear, hump-shaped response of vegetation to nitrogen loading, with an ecological threshold of 13.4 kg N ha⁻¹ yr⁻¹, beyond which the stimulatory effects diminished. Furthermore, the direct effect of nitrogen deposition on GPP outweighed its synergistic interactions with climate and CO₂, suggesting that nitrogen availability independently modulates terrestrial carbon sinks. This study underscores the biome-specific sensitivities to nitrogen loading and highlights the necessity of incorporating nitrogen saturation thresholds into the predictions of ecosystem feedbacks to global change.

How to cite: Chen, S., Chen, B., and Wang, S.: Sensitivity of Global Terrestrial Gross Primary Productivity to Nitrogen Deposition Changes, EGU General Assembly 2026, Vienna, Austria, 3–8 May 2026, EGU26-4148, https://doi.org/10.5194/egusphere-egu26-4148, 2026.

EGU26-4617 | Orals | BG3.1

Soil moisture thresholds for the temperature sensitivity of ecosystem respiration 

Qin Zhang, Song Wang, Qinyu Zheng, Jinsong Wang, Chuixiang Yi, and Shuli Niu

Ecosystem respiration (ER) is the largest source of biogenic CO₂ to the atmosphere, and its temperature sensitivity (Q₁₀) is key to land–climate feedback. However, despite decades of studies finding that Q₁₀ varies considerably across space, time, and biomes, the drivers controlling this variation remain unclear. Here we show that Q10 variability of can be unified within a common hydrothermal framework. Using data from 142 eddy covariance sites around the world, we reveal that Q₁₀ exhibits unimodal responses to soil moisture. At each site, Q₁₀ first increases with soil moisture, peaks at a threshold (SMₜₕ), and then declines. This SMth is ecosystem-specific, which emerges from coordinated plant–soil–microbial interactions, shaped by long-term hydroclimatic regimes and soil physical constraints. Global mapping of SMₜₕ shows that about 25% of the planet’s vegetated land currently has a soil moisture level that exceeds SMₜₕ, including many carbon-rich peatlands and tropical forests, where moderate drying could enhance temperature sensitivity and carbon loss. Our findings establish that moisture thresholds offer an ecological framework that unifies the regulation of carbon fluxes through water and heat. Incorporating this framework into Earth system models will fundamentally improve predictions of carbon–climate feedback under accelerating hydroclimatic change.

How to cite: Zhang, Q., Wang, S., Zheng, Q., Wang, J., Yi, C., and Niu, S.: Soil moisture thresholds for the temperature sensitivity of ecosystem respiration, EGU General Assembly 2026, Vienna, Austria, 3–8 May 2026, EGU26-4617, https://doi.org/10.5194/egusphere-egu26-4617, 2026.

EGU26-5784 | ECS | Orals | BG3.1

Plant responses to rainfall frequency and intensity variations from field to global scales 

Andrew Feldman, Alexandra Konings, Xue Feng, Andrew Felton, Alan Knapp, Joel Biederman, Pierre Gentine, Mitra Cattry, Lixin Wang, William Smith, Abhishek Chatterjee, Joanna Joiner, Benjamin Poulter, and Shawn Serbin

Regardless of annual rainfall amount changes, daily rainfall events are becoming more intense but less frequent across Earth’s land surfaces. Larger rainfall events and longer dry spells ­have complex and sometimes opposing effects on plant photosynthesis and growth, challenging abilities to understand broader consequences on the carbon cycle. Cross-scale analyses are ultimately needed to quantify responses of vegetation function to fewer, larger rainfall from different data sources, disentangle the complex driving mechanisms of the plant responses, and scale findings from field to global scales.

Here, we ask, to what degree is global vegetation function sensitive to shifts in daily rainfall frequency and intensity, especially when compared with variations in annual rainfall totals? Is global vegetation function (and terrestrial carbon uptake via photosynthesis) higher or lower in years with less frequent, more intense rainfall?

First, we collate field, model, and satellite studies that investigate the effects of fewer, larger rainfall events, while controlling for annual rainfall amounts. Plant function responses vary between -28% to 29% (5th to 95th percentile) in years with fewer, larger rainfall events compared to nominal years, with the sign of response contingent on climate; productivity increases are more common in dry ecosystems (46% positive; 20% negative), whereas responses are typically negative in wet ecosystems (28% positive; 51% negative) in years with fewer, larger rainfall events. Field scale analyses and analytical models applied to site data reveal that non-linear plant responses to soil moisture are a major mechanism responsible for these differences in sign. Second, using vegetation indices from four different satellites and a statistical approach, we draw similar conclusions about the changing sign of response across dry to wet ecosystems. Furthermore, the satellite analysis reveals that global vegetation is sensitive to daily rainfall variability across 42% of Earth’s vegetated land surfaces. Surprisingly, vegetation is almost (95%) as sensitive to daily rainfall variability as vegetation is to annual rainfall totals.

These findings across scales suggest that daily rainfall variability impacts on terrestrial ecosystems are likely having a substantial impact on the global carbon cycle and food security. Observational results, included mechanisms revealed in these analyses, are pivotal for benchmarking models and an analysis on this topic is ongoing.

How to cite: Feldman, A., Konings, A., Feng, X., Felton, A., Knapp, A., Biederman, J., Gentine, P., Cattry, M., Wang, L., Smith, W., Chatterjee, A., Joiner, J., Poulter, B., and Serbin, S.: Plant responses to rainfall frequency and intensity variations from field to global scales, EGU General Assembly 2026, Vienna, Austria, 3–8 May 2026, EGU26-5784, https://doi.org/10.5194/egusphere-egu26-5784, 2026.

EGU26-7186 * | Orals | BG3.1 | Highlight

When Nitrogen Retention Fails: Carbon Losses in a Warming Arctic 

Sara Marañon

High-latitude ecosystems play a central role in the global carbon cycle, yet their responses to climate warming remain one of the largest sources of uncertainty in Earth system projections. Most models assume that warming accelerates nitrogen (N) cycling, alleviates plant N limitation, and enhances vegetation productivity, thereby buffering warming-induced soil carbon (C) losses. This paradigm implies that nutrient feedbacks stabilize ecosystem C storage under rising temperatures. However, growing experimental evidence challenges this assumption.

In this talk, I synthesize results from long-term soil warming studies along natural geothermal gradients in subarctic ecosystems to reassess how warming reshapes C–N coupling, nutrient retention, and ecosystem resilience. Across years to decades of sustained warming, we observe large and proportional losses of soil C and N, despite increased microbial activity and N mineralization. Crucially, enhanced N availability does not translate into sustained plant growth or long-term ecosystem C gains.

Our findings reveal a mechanistic shift in ecosystem functioning under warming: increased microbial metabolic costs and carbon limitation reduce microbial biomass and weaken key nitrogen stabilization pathways. Microbial and fine-root N pools, critical short- and long-term N reservoirs in cold ecosystems, decline with warming, particularly during winter and snowmelt periods when plant uptake is low. Seasonal increases in plant N uptake during the growing season are too small and too transient to compensate for these losses. This leads to an effective “opening” of the N cycle, increased N losses, and stoichiometrically coupled soil C losses.

Although microbial communities eventually reorganize toward more conservative N cycling under long-term warming, this physiological adjustment stabilizes fluxes rather than restoring depleted soil C and N stocks. As a result, early warming-induced losses may be effectively irreversible, even under later ecosystem acclimation.

Taken together, these results suggest a fundamental conceptual shift: warming does not simply accelerate biogeochemical cycles but erodes the mechanisms that retain nutrients and carbon in high-latitude soils. This challenges the widespread assumption that nitrogen feedbacks buffer carbon losses and highlights the need to explicitly represent microbial physiology, nutrient retention, and seasonal asynchronies in Earth system models to improve predictions of carbon–climate feedbacks.

How to cite: Marañon, S.: When Nitrogen Retention Fails: Carbon Losses in a Warming Arctic, EGU General Assembly 2026, Vienna, Austria, 3–8 May 2026, EGU26-7186, https://doi.org/10.5194/egusphere-egu26-7186, 2026.

EGU26-7603 | ECS | Posters on site | BG3.1

TECO-CNP Sv1.0: a coupled carbon-nitrogen-phosphorus model  with data assimilation for subtropical forests 

Fangxiu Wan, Chenyu Bian, Ensheng Weng, Yiqi Luo, Kun Huang, and Jianyang Xia

Subtropical forests play a crucial role in the global carbon cycle, yet their carbon sink capacity is significantly constrained by phosphorus availability. Models that omit phosphorus dynamics risk overestimating carbon sinks, potentially undermining the scientific basis for carbon neutrality strategies. In this study, we developed TECO-CNP Sv1.0, a coupled carbon-nitrogen-phosphorus model based on the Terrestrial ECOsystem (TECO) model, which explicitly captures key biogeochemical interactions and nutrient-regulated carbon cycling. The model simulates how plant growth and carbon partitioning respond to both external soil nutrient availability and internal physiological constraints, enabling plant acclimation to varying nutrient conditions. Using observations from a phosphorus-limited subtropical forest in East China, we first evaluated the model’s performance in estimating state variables with empirically calibrated parameters. Compared to the C-only and coupled C-N configurations, the CNP model more accurately reproduced the observed pools of plant and soil C, N, and P. To systematically optimize model parameters and reduce uncertainties in predictions, we further incorporated a built-in data assimilation framework for parameter optimization. The CNP model with optimized parameters significantly improved carbon flux estimates, reducing root mean square errors and enhancing concordance correlation coefficients for gross primary productivity, ecosystem respiration, and net ecosystem exchange. By explicitly incorporating phosphorus dynamics and data assimilation, this study provides a more accurate and robust framework for predicting carbon sequestration in phosphorus-limited subtropical forests.

How to cite: Wan, F., Bian, C., Weng, E., Luo, Y., Huang, K., and Xia, J.: TECO-CNP Sv1.0: a coupled carbon-nitrogen-phosphorus model  with data assimilation for subtropical forests, EGU General Assembly 2026, Vienna, Austria, 3–8 May 2026, EGU26-7603, https://doi.org/10.5194/egusphere-egu26-7603, 2026.

EGU26-7608 | ECS | Orals | BG3.1

Microbial controls on soil carbon mobilization under global warming along the West Antarctic Peninsula 

Jacopo Brusca, Gabriella Gallo, James Bradley, and Donato Giovannelli

The West Antarctic Peninsula is among the fastest-warming regions on Earth and may be approaching a climatic tipping point [1,2]. Ongoing warming threatens the stability of frozen ground and permafrost, with potentially important consequences for terrestrial carbon and nutrient cycling. In Antarctic terrestrial ecosystems soil microorganisms represent the dominant biological drivers of biogeochemical processes. However, their role in regulating carbon turnover and greenhouse gas production during summer thaw remains poorly constrained. Here, we present observations from eight terrestrial sites along the West Antarctic Peninsula, where the last seven years have been the warmest on record [2]. Soil surface temperatures ranged from 2.3 to 17.1 °C (mean 8.5 °C). We combined shotgun metagenomics with soil geochemistry, geological context, and interstitial soil gas composition and isotopic fingerprint to characterize microbial taxonomic and functional diversity and its environmental controls. Microbial community composition and metabolic potential differed markedly among sites and showed a strong relationship with soil temperature. Metagenomic data reveal widespread genetic potential for the degradation of complex and refractory organic matter, indicating that Antarctic soil microbial communities actively contribute to carbon mobilization and greenhouse gas production under sustained warming. By integrating microbial, geochemical, and geological observations, this study provides new process-level insights into terrestrial ecosystem responses to climate change in polar regions. Our results offer empirical constraints on microbial-driven soil carbon dynamics that are currently underrepresented in ecosystem and Earth system models, highlighting the need to explicitly account for Antarctic soil microbial processes when predicting future biogeochemical cycling in a warming climate.

  • Masson-Delmotte, V. et al. (eds) IPCC (Cambridge University Press, 2021).
  • Gorodetskaya, I.V., Durán-Alarcón, C., González-Herrero, S. et al. npj Climate and Atmospheric Science 6, 202 (2023).

How to cite: Brusca, J., Gallo, G., Bradley, J., and Giovannelli, D.: Microbial controls on soil carbon mobilization under global warming along the West Antarctic Peninsula, EGU General Assembly 2026, Vienna, Austria, 3–8 May 2026, EGU26-7608, https://doi.org/10.5194/egusphere-egu26-7608, 2026.

EGU26-8464 | ECS | Posters on site | BG3.1

Possibility of Summer Drought Due to the Recently Reinforced Growth of Vegetation in Spring in Korea  

Ha-Neul Kim, Min-Seok Kim, Sung-Ho Woo, and Jee-Hoon Jeong

Under the global trend of increased vegetation growth due to global warming, spring vegetation in South Korea and East Asia has shown a pronounced greening trend since the 2000s. Interestingly, during the same period, soil moisture in South Korea during the summer season has exhibited a distinct drying trend. This study confirms through observations and model experiments that these two trends may not be simply coincidental. Instead, they could be the result of the advancement of vegetation growth onset due to the warming trend, leading to increased spring vegetation and evapotranspiration, subsequently resulting in reduced summer soil moisture. The negative correlation between spring vegetation and summer soil moisture has linearly strengthened from the late 20th century to the present.

In the 2000s, while the variability of summer soil moisture has decreased, the impact of spring vegetation variability on summer soil moisture has been confirmed to increase. CLM5 (Community Land Model 5) Model experiments conducted to verify the mechanism of the changing relationship between spring vegetation and summer soil moisture have shown that an increase in spring vegetation leads to increased evaporation the following month, followed by a decrease in soil moisture the subsequent month, consistent with observations. Furthermore, it has been confirmed that with the projected increase in insolation forcing in the future, the East Asian summer monsoon will intensify, and overall summer precipitation in South Korea is expected to increase. However, it has also been confirmed that the greening trend of vegetation may consistently contribute to the occurrence of summer droughts. Therefore, it is essential to consider the interaction with vegetation when predicting and addressing future drought changes.

How to cite: Kim, H.-N., Kim, M.-S., Woo, S.-H., and Jeong, J.-H.: Possibility of Summer Drought Due to the Recently Reinforced Growth of Vegetation in Spring in Korea , EGU General Assembly 2026, Vienna, Austria, 3–8 May 2026, EGU26-8464, https://doi.org/10.5194/egusphere-egu26-8464, 2026.

EGU26-8692 | ECS | Posters on site | BG3.1

Vegetation water stress relief by rainfall pulses in a semi-arid region 

Zhongli Liu, Grzegorz Skrzypek, Okke Batelaan, and Huade Guan

Understanding how rainfall alleviates vegetation water stress is critical for predicting ecosystem functioning in semi-arid regions under future climate conditions. This study quantifies vegetation water stress relief using the Crop Water Stress Index (CWSI) over the past 24 years in the Wanna Munna Flats of the Pilbara Basin, Western Australia, a semi-arid region characterized by a mean annual precipitation of 381 mm, a mean air temperature of 24 °C, and a potential evapotranspiration of approximately 2850 mm.

A modified Run Theory framework was employed to characterize individual stress relief events, defined as deviations of a reconstructed CWSI time series for a representative woody species (Mulga, Acacia aneura) from a reference stress condition (mean CWSI = 0.68). The results indicate that this woody species experiences persistent water stress, with a long-term mean CWSI of 0.52. In total, 191 stress relief events were identified over the 24-year study period.

On average, a relief event persists for 19 days (interquartile range: 8–36 days) and exhibits a relief magnitude of 1.9 CWSI·stress·day (range: 0.7–6.1), generated by 13.4 mm of cumulative precipitation (range: 3.8–42.6 mm) distributed over several days. Event-scale cumulative precipitation is the dominant control on both relief magnitude and duration. However, for comparable annual precipitation totals, higher rainfall intensity reduces stress relief efficiency.

Random Forest analyses further indicate that vegetation growth responses are primarily triggered by stress relief events associated with precipitation exceeding 17 mm, which account for 41.9 % of all recorded events. A pronounced step change in stress relief occurs when event-scale precipitation exceeds 56 mm, although only 42 such events were observed during the 24-year period.

Overall, this study provides a quantitative framework for characterizing water stress relief dynamics and reveals the nonlinear vegetation responses to rainfall in natural semi-arid ecosystems.

How to cite: Liu, Z., Skrzypek, G., Batelaan, O., and Guan, H.: Vegetation water stress relief by rainfall pulses in a semi-arid region, EGU General Assembly 2026, Vienna, Austria, 3–8 May 2026, EGU26-8692, https://doi.org/10.5194/egusphere-egu26-8692, 2026.

EGU26-8737 | ECS | Posters on site | BG3.1

Evidence for widespread and strong canopy photosynthetic acclimation to diffuse light 

Xuan Gui and Xiangzhong Luo

Increased diffuse radiation is known to enhance plant photosynthesis instantaneously, yet its role in regulating photosynthetic light acclimation over long-term remains elusive. Using global eddy-covariance observations and the accompanied diffuse and direct radiation measurements, we investigated how diffuse radiation controls canopy-scale light acclimation rates across diverse ecosystems. Our results showed that the maximum photosynthetic assimilation rate (Amax) is on average 40% higher under diffuse than direct radiation, consistent with the instantaneous diffuse radiation fertilization effect. As for light acclimation, we found the acclimation rate driven by diffuse light (1.8 μmol m⁻² s⁻¹ per mol photon m⁻² d⁻¹) is more than twice those under direct light (0.8 μmol m⁻² s⁻¹ per mol photon m⁻² d⁻¹). Statistical analysis showed that diffuse radiation fraction is important in determining canopy-scale light acclimation rate. The benefits from diffuse light on light acclimation weakened under high air temperature and elevated vapor pressure deficit but increased strongly with absorbed light. These findings demonstrate that diffuse radiation enhances ecosystem photosynthesis not only instantaneously but also by accelerating long-term light acclimation. Given ongoing changes in atmospheric aerosol loading and cloud cover, accounting for this photosynthetic acclimation effect of diffuse light is essential for improving predictions of terrestrial carbon uptake under changing atmospheric conditions.

Keywords: Light acclimation rate; FLUXNET; diffuse fertilization effects

How to cite: Gui, X. and Luo, X.: Evidence for widespread and strong canopy photosynthetic acclimation to diffuse light, EGU General Assembly 2026, Vienna, Austria, 3–8 May 2026, EGU26-8737, https://doi.org/10.5194/egusphere-egu26-8737, 2026.

EGU26-9066 | ECS | Posters on site | BG3.1

Achieving grain security and carbon neutrality: Challenges from carbon allocation  

Fan Liu, Yucui Zhang, Yanjun Shen, and Hongjun Li

Climate change and management practices influence crop allocation of carbon (C), and consequently can alter grain yield and the magnitude of C sequestration (or release) from agroecosystems. However, few in situ longitudinal studies are available to quantify these changes. Here, we combined the results from 13 years (from October 2007 to September 2020) of eddy covariance data and detailed crop production measurements to investigate changing climate and C allocation in a typical wheat (Triticum aestivum L.) and maize (Zea mays L.) double cropping agroecosystem in the North China Plain. We found that the agroecosystem on average acted as a slight C sink, i.e., net ecosystem carbon balance (NECB) is 36 g C m-2 yr-1) across the study period. Increased CO2 led to a rising trend of gross primary production (GPP, 72 g C m-2 yr-2), ~35% of which led to increased NECB (the slope is 25 g C m-2 yr-2). However, concomitant increases in temperature and decreases in surface soil moisture caused higher partitioning of GPP to autotrophic respiration, leading to lower increases in net primary production and grain yield. Summer maize experienced a greater risk of C source increase, as well as greater grain yield reduction than winter wheat, most likely due to higher temperatures and drought in summer. Overall, our observational evidence suggests that current management and ongoing climate change increase the ability of the agroecosystem to increase NECB, but does not enhance crop production in this intensively managed high yield agroecosystems. However, C allocation strategies are unlikely to maintain constant in the future as multiple climate change factors act on the agroecosystem.

How to cite: Liu, F., Zhang, Y., Shen, Y., and Li, H.: Achieving grain security and carbon neutrality: Challenges from carbon allocation , EGU General Assembly 2026, Vienna, Austria, 3–8 May 2026, EGU26-9066, https://doi.org/10.5194/egusphere-egu26-9066, 2026.

EGU26-9954 | ECS | Orals | BG3.1

Using process-based models to enhance observations from distributed drought experiments. 

Luke Daly, Silvia Caldararu, Camille Audrey Abadie, Melinda Smith, and Timothy Ohlert

Distributed experimental networks (DENs) provide unprecedented opportunities to quantify how ecosystem responses to global change across gradients. Process-based models have been previously used together with such manipulative experiments to identify knowledge gaps in models. However, experiments suffer from their own limitations in terms of what, and when, measurements can be taken. Models can offer a powerful tool to provide additional information and key insight into different stages of such experiments. Here we demonstrate that DENs and process-based models can serve a bi-directional diagnostic role: testing model fidelity while revealing where experimental design may systematically bias inference

We simulated ‘International Drought Experiment’ (IDE) drought treatments at grassland site lasting over two growing seasons using QUINCY, a land-surface model of coupled C-N-P cycling, and compared simulated aboveground net primary productivity (ANPP) responses with experimental observations. The model can reproduce the observed relationship between ANPP drought response and drought severity, with overlapping slope confidence intervals (experimental: 0.60 [0.30-0.90]; simulated: 0.79 [0.40-1.18]). Mean simulated ANPP reductions (36%) aligned with IDE synthesis estimates (21-38%), although site by site comparison shows a poorer fit.

Beyond this simple model-data comparison, we can use the model to explore aspects of ecosystem behaviour that cannot easily be measured. We performed model simulations over a range of drought intensities for each site and show that multiple sites exhibited a threshold behaviour – abrupt productivity declines over narrow exclusion ranges. Second, 63% of simulated sites displayed growing season shifts (≥1 month) during drought, with 29% in the first year. The interplay between these two mechanisms – threshold like responses and phenological shifts – produced a critical effect: depending on harvest timing, the magnitude and in some cases the sign of apparent ANPP changes varied substantially.

On the basic model evaluation side, site-level mismatches reflect potential structural constraints in the model (coarse plant functional types, absent competition dynamics producing threshold-like responses). Critically, and in addition to simple model evaluation, the widespread prevalence of growing-season shifts (63% of sites) demonstrates that point sampling could systematically bias inference even in well-designed, standardized experiments – a constraint that cannot be detected from the experimental data alone. This demonstrates that models can enhance the information from manipulative experiments and could either be used post-hoc, as in our study, to add insights to experimental data or prior to experiments to guide design and sampling regimes.

How to cite: Daly, L., Caldararu, S., Audrey Abadie, C., Smith, M., and Ohlert, T.: Using process-based models to enhance observations from distributed drought experiments., EGU General Assembly 2026, Vienna, Austria, 3–8 May 2026, EGU26-9954, https://doi.org/10.5194/egusphere-egu26-9954, 2026.

EGU26-9993 | ECS | Orals | BG3.1

Ectomycorrhizal Decomposition Responses to Nutrient Addition in a Mature Temperate Deciduous Forest 

Xianbang Feng, Sami Ullah, Liz Hamilton, Rob Mackenzie, Andy Smith, Hasan Akhtar, Richard Tennant, Lina Mercado, and Iain Hartley

Rising reactive nitrogen (N) deposition and corresponding shifting phosphorus (P) availability can alter plant carbon (C) allocation belowground and modify soil fungal communities, with uncertain consequences for decomposition of soil organic matter (SOM) and hence C storage. Ectomycorrhizal (ECM) fungi are a major pathway for plant C to enter soils and can regulate SOM decomposition through opposing mechanisms, either stimulating free-living microbial activity (Priming effect) or suppressing decay via competition with saprotrophs (Gadgil effect). However, how N and P addition shifts the balance between these pathways remains unresolved, particularly in mature forests that are likely nutrient limited.

We investigated hyphal-mediated controls on decomposition under a factorial N and P addition experiment (control, +N, +P, +N+P) in a mature temperate oak forest, using nested in-growth bags containing either oak leaf litter (litter) or tongue depressor fragments (wood). Two outer mesh sizes manipulated hyphal ingrowth, with a 41-µm mesh allowing fungal entry and a 1-µm mesh largely excluding fungi and roots. Because ECM hyphae can forage over large areas and proliferate through nutrient-poor substrates, we expected this manipulation to mainly affect ECM contributions. Microbial respiration, C-based mass loss, hyphal biomass, potentials enzyme activities of peroxidase (PEROX) and phenol oxidase (PHENOX), and substrate-induced respiration were quantified, and fungal communities of wood were profiled by ITS1 amplicon sequencing.

The mesh treatments generated clear differences in hyphal biomass (p = 0.002) without altering bag moisture or pH (p > 0.05). By the second sampling, linear mixed models showed substrate- and nutrient- specific ECM effects on decomposition. For litter, fungal inclusion increased mass loss by 15.83% compared with exclusion bags (p = 0.012) and substrate-induced respiration by 31.82% (p = 0.019), whereas N enrichment decreased microbial respiration by 16.45% (p = 0.030). In contrast, fungal inclusion did not significantly affect wood mass loss (p = 0.562). Instead, N fertilisation reduced mass loss by 37.84% compared with controls (p = 0.048) and was associated with lower oxidative enzyme potentials (PHENOX: p = 0.085, PEROX: p = 0.15). Similarly, PERMANOVA analysis on fungal communities of wood reflect significant effects of nutrient addition (p = 0.002) and ANCOM-BC analysis shows that N addition significantly altered many fungal classes in wood.

These findings suggest that ECM controls on decomposition are substrate-dependent, and that nutrient supply can redirect fungal foraging and competition with saprotrophs. In mature forests, fertilisation may decouple carbon inputs to the mycorrhizal association from decay responses by reducing plant investment belowground and by reshaping fungal communities. This context dependence helps explain why fertilisation experiments often yield inconsistent soil carbon outcomes. Therefore, to improve projections of forest carbon cycling under rising N deposition and shifting P availability, mycorrhizal effects on decomposition should be linked with nutrient availability and substrate quality.

How to cite: Feng, X., Ullah, S., Hamilton, L., Mackenzie, R., Smith, A., Akhtar, H., Tennant, R., Mercado, L., and Hartley, I.: Ectomycorrhizal Decomposition Responses to Nutrient Addition in a Mature Temperate Deciduous Forest, EGU General Assembly 2026, Vienna, Austria, 3–8 May 2026, EGU26-9993, https://doi.org/10.5194/egusphere-egu26-9993, 2026.

EGU26-10189 | Orals | BG3.1

Modelling tropical forest responses to elevated CO2 in a nutrient-limited environment: JULES simulations at the AmazonFACE site 

Peter Anthony Cook, Richard Betts, Mahdi Andre Nakhavali, Jefferson Goncalves De Souza, Alexander Kurganskiy, Lina Mercado, and Maria Carolina Duran-Rojas

The AmazonFACE programme (Free-Air CO2 Enrichment) will subject areas of old-growth forest in the Amazon basin near Manaus to elevated (+200ppmv) CO2 concentrations to determine the effects on vegetation.  While elevated CO2 is assumed to have significant fertilisation effects, both increasing productivity and reducing transpiration, this needs to be measured in the field.  The fertilisation effects may not be as great as predicted due to limitations from the available nutrients, and soil in this part of the Amazon is known to be poor in phosphorus.  The programme will be supported by modelling, including a version of JULES (the Joint UK Land Environment Simulator) called JULES-CNP which includes phosphorus dynamics and its interactions with the nitrogen and carbon cycles.  Here this version has been especially set up to work in the forest near Manaus by using observation-based soil chemistry and weather data.  JULES shows large increases in productivity (and in litter, soil carbon and respiration from the soil) with elevated CO2 without the phosphorus limitations, but significantly smaller increases in productivity when the phosphorus dynamics and interactions are included.  The current JULES setup and configuration can be used with experimental investigation in AmazonFACE to inform future model improvements.

How to cite: Cook, P. A., Betts, R., Nakhavali, M. A., Goncalves De Souza, J., Kurganskiy, A., Mercado, L., and Duran-Rojas, M. C.: Modelling tropical forest responses to elevated CO2 in a nutrient-limited environment: JULES simulations at the AmazonFACE site, EGU General Assembly 2026, Vienna, Austria, 3–8 May 2026, EGU26-10189, https://doi.org/10.5194/egusphere-egu26-10189, 2026.

Pyrogenic carbon (PyC), the residues produced by the incomplete combustion of organic matter, is widely reported to play an important role in long term terrestrial carbon storing owing to its potential for millennial scale turnover when incorporated into soils.   

The Amazon has been subjected to infrequent anthropogenic fires within the past 10,000 years, as well as more recurrent and higher impact wildfires within the modern period. These fires have contributed PyC to the soil carbon stocks at varying rates across the Amazon basin, as revealed by extensive soil sampling across a range of locations with varying meteorological, soil, vegetation and land use conditions.

This dataset, accompanied by radiocarbon dating, reveals key information about the fire regime of the amazon basin (e.g. fire recurrence). However, some key aspects of the fire and PyC patterns require further investigation to gain further understanding of the Amazon fire regime and its carbon cycling significance. Additionally, research into the carbon cycling significance of PyC in the Amazon is currently limited and requires further assessment, as well as the role it may play under future climate changes.

Here, the RothC soil carbon model is used to evaluate:

  • The specific conditions required to produce the observed soil organic carbon and PyC stocks per site
  • The carbon cycling significance of PyC in the Amazon and under projected climate scenarios

This study uses site specific data (e.g. soil clay levels and site meteorology) as well as a range of modelled fire/PyC scenarios to reconstruct past conditions and evaluate soil PyC up to 2100. The investigation points to Amazon basin PyC stocks in the range of 100-1000’s of megatonnes with a millennial scale turnover rate, indicating that this is a key carbon store that needs to be considered under future climate modelling for the Amazon.

How to cite: Kennedy-Blundell, O.: Simulating pyrogenic carbon in old growth Amazon forest sites with the RothC model, EGU General Assembly 2026, Vienna, Austria, 3–8 May 2026, EGU26-10310, https://doi.org/10.5194/egusphere-egu26-10310, 2026.

EGU26-11363 | ECS | Orals | BG3.1

Interaction with elevated CO2 and disturbances on belowground processes in a mature temperate forest  

Hasan Akhtar, Iain Hartley, Sami Ullah, Liz Hamilton, Carolina Mayoral, Robert Grzesik, Robert Mackenzie, Andy Smith, Angeliki Kourmouli, and Michaela Reay

Temperate forests are a significant terrestrial carbon sink and can help mitigate rising CO2 concentrations in the atmosphere. Under elevated CO2 (eCO2) conditions, a higher rate of photosynthesis can drive forest biomass productivity; however, this response can be constrained by the availability of soil nutrients, namely nitrogen (N) and phosphorus (P). To alleviate these deficiencies, increased allocation of carbon (C) belowground could drive processes which can enhance nutrient uptake, thereby supporting the growth of mature forests under eCO2. However, the belowground processes and their interactions with above-ground disturbances (e.g. moth infestation) driving this change remain unclear. These belowground processes may involve fine root biomass growth, soil nutrient cycling, extracellular enzymatic activities, microbial biomass, and their interactions.

Here, we investigated whether eCO2 affects belowground processes and their interaction with disturbances (moth outbreak). The experiment was conducted at the Birmingham Institute for Forest Research Free Air Carbon Dioxide Enrichment (BIFoR FACE) facility, which comprises six experimental arrays surrounding woodland patches of c. 30 m diameter. Three of these arrays are enriched with eCO2 (+150 ppm above ambient), and three are under ambient CO2 levels. Within all six arrays, soil and root samples were collected from the top 0-30 cm covering O, A and B horizons. Fine root biomass stocks, soil N and P levels, root C, N and P content, microbial biomass C, N and P concentration, and extracellular enzymatic activities were quantified from 2017 to 2022.

We found that under eCO2, root biomass and microbial biomass were significantly greater, especially in the O soil horizons. No change in microbial biomass C: N: P stoichiometry was observed, but root P concentrations declined, and root C: N and C:P ratios increased under eCO2. In addition, while ammonium concentrations were significantly greater under eCO2, there was a trend towards lower phosphate and nitrate concentrations under eCO2. Potential C, N and P cycle enzyme activities increased under eCO2, and the LAP: AP ratio declined under eCO2. Overall, the changes observed under eCO2 suggest greater belowground C allocation under eCO2, and changes in nutrient cycling, which may have resulted in P becoming relatively less available than N. However, during the summers of 2018 and 2019, moth outbreaks caused widespread oak defoliation and reduced forest productivity substantially. The available data from this period suggests that soil nutrient availability increased substantially, likely as a result of leaf litter and frass inputs and low tree nutrient uptake following defoliation. Greater soil nutrient availability resulted in microbial biomass N pools and fine roots proliferation in the O soil horizon. These results may suggest that the insect outbreak had substantial impacts on tree responses to eCO2 over an extended time period, potentially controlling whether eCO2 productivity gains were allocated to long versus short-lived tissues.

How to cite: Akhtar, H., Hartley, I., Ullah, S., Hamilton, L., Mayoral, C., Grzesik, R., Mackenzie, R., Smith, A., Kourmouli, A., and Reay, M.: Interaction with elevated CO2 and disturbances on belowground processes in a mature temperate forest , EGU General Assembly 2026, Vienna, Austria, 3–8 May 2026, EGU26-11363, https://doi.org/10.5194/egusphere-egu26-11363, 2026.

Climate-induced interannual volatility in crop production poses a growing threat to global food security, underscoring the critical need to enhance agricultural resilience alongside maintaining reliable food supplies. Although soil organic carbon (SOC) sequestration is advocated as a nature-based solution for climate adaptation, quantifying its stabilizing benefits remains constrained by small-scale in-situ trials, simplistic linear assumptions and confounding environmental factors in previous studies.
Here, we integrated two decades (2001-2020) of high-resolution remote sensing data with a two-stage analytical framework to quantitatively characterize the stabilizing effect of SOC across China’s maize and wheat croplands. Vegetation indices (NIRv), Solar-Induced Chlorophyll Fluorescence (SIF), and MODIS gross primary productivity (MODIS GPP) were used as proxies for crop productivity, while their detrended interannual coefficient of variation (CV) served as a measure of stability. First, the generalized additive mixed model (GAMM) and XGBoost model are utilized in parallel to evaluate relationships between SOC content and crop productivity stability. Across model types, results consistently shows that maintaining higher SOC content in croplands is more beneficial for crop to buffer from external volatility. We observed critical thresholds of SOC content (maize: 10.2 – 13.4 g/kg; wheat: 8.6 – 9.9 g/kg), above which high SOC leads to more stable crop productivity. Furthermore, after determining the relationships, we employ causal forest double machine learning models (CF-DML) to isolate the marginal causal effect of SOC. Results indicate that increasing unit (g/kg) SOC can reduce the CV of crop productivity by 1.09% to 2.08% on average nationally. Specially, in regions with lower SOC levels, the marginal benefits of increasing SOC are more pronounced, particularly in areas characterized by lower soil structure and greater climate variability. In these environment-limited croplands, increasing SOC can play a more significant role in maintaining sustainable agriculture.
Our results emphasize SOC’s role in building resilient food systems. This improved understanding can refine the representation of soil carbon in earth system models and highlight the importance of soil carbon sequestration in croplands under climate change.

How to cite: Huang, Y., Shi, Z., and Chen, S.: Non-linear thresholds and spatial heterogeneity define the stabilizing benefits of soil organic carbon on the stability of crop productivity, EGU General Assembly 2026, Vienna, Austria, 3–8 May 2026, EGU26-11436, https://doi.org/10.5194/egusphere-egu26-11436, 2026.

EGU26-11533 | Posters on site | BG3.1

Terrestrial Geo-Biosphere Interactions in a Changing World: Concepts, Challenges, and Opportunities 

Michaela A. Dippold, Kira Rehfeld, and Olaf Cirpka

The air we breathe, the water we drink, the food we eat, and other resources we use, have resulted from interactions between the Earth’s geosphere and biosphere. Understanding these interactions is thus essential for human wellbeing, which is endangered by anthropogenically induced climate and land-use change. While contemporary anthropogenic pressures are unprecedented, the processes and natural laws governing the Earth System remain universal. Interactions between the geosphere (rocks, soils, water, atmosphere and the Earth’s surface) and the biosphere (microorganisms, fungi, plants, and animals) determine how the Earth System responds to change. Past research has largely considered geosphere and biosphere responses to Earth-System change separately. The new cluster of excellence TERRA at the Univesity of Tübingen develops an integrated understanding of how geo-biosphere interactions in terrestrial systems induce and respond to environmental changes, using evidence from both the geological past and the present to improve projections of future global change impacts and assess the effectiveness of mitigation and adaptation strategies. Understanding feedbacks between diversity and stability in the geosphere and the biosphere lies at the heart of TERRA. In particular, we hypothesize that diversity in the geosphere stabilizes the biosphere, and that vice versa biodiversity is key to stabilizing the geosphere.

TERRA represents an interdisciplinary Earth-System-Science approach. We will integrate observational, experimental, and modeling approaches spanning different periods of Earth history, incorporating the full spectrum of geological and biological sciences. We will analyze past geo-biosphere interactions preserved in geological records to elucidate how the Earth System responded to conditions that have not yet been encountered in historical times but may be encountered in the future. A mechanistic understanding of processes will be achieved by studying contemporary geo-biosphere interactions on different spatial scales. The newly established Diversitorium will facilitate field and laboratory experiments where the diversity of one sphere is selectively manipulated to study effects on the other sphere. Synthesis across spatio-temporal scales will be provided by developing and advancing integrative models merging machine learning and process-based approaches. These models will be used to evaluate the effectiveness of mitigation and adaptation measures to cope with global change.

How to cite: Dippold, M. A., Rehfeld, K., and Cirpka, O.: Terrestrial Geo-Biosphere Interactions in a Changing World: Concepts, Challenges, and Opportunities, EGU General Assembly 2026, Vienna, Austria, 3–8 May 2026, EGU26-11533, https://doi.org/10.5194/egusphere-egu26-11533, 2026.

EGU26-12993 | Orals | BG3.1

Amazon forest's carbon sink strength depends on plant nutrient efficiency at the root-soil interface 

Nathielly P. Martins, Lucia Fuchslueger, Laynara F. Lugli, Anja Rammig, Iain P. Hartley, Richard J. Norby, Florian Hofhansl, and Carlos A. Quesada and the AmazonFACE team

The impact of enhanced atmospheric CO2 (eCO2) concentrations on the Amazon forest's capacity to continue acting as a carbon (C) sink largely depends on soil nutrient availability. In particular, phosphorus (P) and the ability of plants to balance the extra CO2 with the additional nutrient demand play an important role in highly weathered tropical soils. We hypothesize that plants may allocate the extra C belowground to different nutrient acquisition mechanisms, thereby alleviating nutrient limitation. Potential changes in nutrient acquisition mechanisms include an increase in fine root productivity, adjustments in root morphological traits, and investment in arbuscular mycorrhizal fungi symbioses that will enhance nutrient foraging capacity. Additionally, the plant community could increase root labile C exudation, which can be utilized by the microbial community as an energy source, leading to increased extracellular enzyme production and enhanced nutrient mineralization. Furthermore, it is important to highlight the litter layer as a significant nutrient source, and root mats growing in the litter layer allow roots to intercept newly mineralized nutrients before they reach the soil.

Here, we increased atmospheric CO2 by ~300 ppm in situ, in a P-depleted Amazonian forest understory using open-top chambers, which not only increased plant C assimilation but also promoted aboveground biomass growth. Therefore, our primary goal was to better understand the mechanisms and adaptations at the root-soil interface that facilitated this positive CO2 fertilization response. Our results show that in the litter layer, eCO2 did not change net root productivity, but increased specific root length, indicating an enhanced foraging strategy. In contrast, in soil, eCO2 caused a decrease in root productivity, but an increase in arbuscular mycorrhizal fungi colonization, which may represent an alternative foraging strategy for plant communities. Simultaneously, eCO2 induced a significant decrease in the soil enzyme C and P stoichiometry, and a decline of the soil organic P fraction. One year later, a decrease in leaf litter P was observed under eCO2, which suggests that the adaptations of litter-based fine roots to eCO2 may have longer-term consequences for litter P recycling.

Taken together, our experiment provides in situ evidence that eCO2 promotes different root responses along the litter-soil continuum, which may alter P availability and intensify competition between plant roots and soil microorganisms. Such multiple spatial adaptations in root P acquisition strategies may strongly regulate plant-soil belowground dynamics and need to be considered to better understand the resilience of the Amazon forest to future climate change.

How to cite: P. Martins, N., Fuchslueger, L., F. Lugli, L., Rammig, A., P. Hartley, I., J. Norby, R., Hofhansl, F., and A. Quesada, C. and the AmazonFACE team: Amazon forest's carbon sink strength depends on plant nutrient efficiency at the root-soil interface, EGU General Assembly 2026, Vienna, Austria, 3–8 May 2026, EGU26-12993, https://doi.org/10.5194/egusphere-egu26-12993, 2026.

EGU26-13940 | Orals | BG3.1

AmazonFACE: Current status and scientific objectives of the large-scale Free Air CO2 Enrichment Experiment in the Amazon rainforest 

Anja Rammig, David Lapola, and Richard Betts and the AmazonFACE Team

The AmazonFACE experiment is a large-scale Free-Air CO₂ Enrichment (FACE) experiment designed to assess the responses of Amazonian tropical rainforests to elevated atmospheric carbon dioxide concentrations. As the world’s first FACE experiment in a mature tropical forest, AmazonFACE addresses a critical gap in our understanding of how these ecosystems will function under future climate conditions. The primary objective is to quantify the impacts of elevated atmospheric CO₂ concentration on forest carbon cycling, productivity, nutrient dynamics, biodiversity, and ecosystem resilience. The experiment is currently in the construction phase, with infrastructure installation, site preparation, and system testing actively underway. In parallel, extensive baseline measurements of atmospheric, ecological, and biogeochemical variables are being conducted to characterize pre-treatment conditions. Recent years have seen a growing body of scientific publications, technical reports, and outreach materials that document the experimental design, methodological challenges, and expected research outcomes, and the importance of AmazonFACE for policy making. These contributions highlight the complexity of operating FACE technology in remote tropical environments and the innovative solutions being developed. Once operational, AmazonFACE will enable the assessment of ecosystem responses to elevated CO2 under realistic field conditions. The data generated are expected to substantially improve Earth system models and projections of the global carbon cycle. Overall, AmazonFACE represents a major international research effort with far-reaching implications for climate change science and tropical forest management.

How to cite: Rammig, A., Lapola, D., and Betts, R. and the AmazonFACE Team: AmazonFACE: Current status and scientific objectives of the large-scale Free Air CO2 Enrichment Experiment in the Amazon rainforest, EGU General Assembly 2026, Vienna, Austria, 3–8 May 2026, EGU26-13940, https://doi.org/10.5194/egusphere-egu26-13940, 2026.

EGU26-14070 | Orals | BG3.1

Are soil and vegetation responses to precipitation changes coupled? 

Stefano Manzoni, Maja Siegenthaler, Sini Talvinen, Marleen Pallandt, Daniela Guasconi, Xiankun Li, Paola Montenegro, Larissa Frey, Rebecca Varney, Ingo Fretzer, and Maria Faticov

Droughts and extreme precipitation alter soil and vegetation functions, but the joint responses of these two ecosystem components are not well understood. To assess how much soil and vegetation responses to precipitation changes are coupled, we collated data from more than 150 precipitation manipulation experiments where both soil (carbon and nitrogen contents, microbial biomass, respiration) and vegetation responses (biomass, nutrient contents, productivity, respiration) were assessed. We found that soil and vegetation responses were sometimes coupled, while often only soil or vegetation responded. If responses were coupled, drought tended to reduce, and increased precipitation enhance, both soil and plant storages and fluxes. In addition, drought and increased precipitation changed more often vegetation and microbial biomass than soil organic matter pools. Several response combinations were underrepresented, indicating a knowledge gap that we need to fill to quantify the coupling of different ecosystem components in the face of extreme events.

How to cite: Manzoni, S., Siegenthaler, M., Talvinen, S., Pallandt, M., Guasconi, D., Li, X., Montenegro, P., Frey, L., Varney, R., Fretzer, I., and Faticov, M.: Are soil and vegetation responses to precipitation changes coupled?, EGU General Assembly 2026, Vienna, Austria, 3–8 May 2026, EGU26-14070, https://doi.org/10.5194/egusphere-egu26-14070, 2026.

EGU26-14745 | Posters on site | BG3.1

Mapping Global Carbon Flux in Species across Terrestrial Biomes Under Climate Extremes 

Shakirudeen Lawal and Wayne Stewarts

Terrestrial ecosystems currently absorb a substantial proportion of anthropogenic carbon dioxide (CO₂) emissions, yet the persistence of this land carbon sink under accelerating climate change remains largely uncertain. While process-based vegetation models project continued enhancement of carbon uptake through CO₂ fertilization, there are growing observational evidence that suggests that climate extremes, particularly 3oC global warming level, may substantially constrain or reverse these gains through droughts and heatwaves. Recent global carbon budget assessments also show a rapid weakening of the land carbon sink, with dynamic global vegetation model ensembles and atmospheric inversions indicating a large decline in net land uptake between 2022 and 2023. Here we present an observation-constrained, species-specific quantification of global terrestrial carbon fluxes across major terrestrial biomes. We integrate a combination of satellite-derived vegetation indices, a geo-referenced global database of climate-induced tree mortality, and dynamic global vegetation models from the TRENDY intercomparison models to map spatial and temporal variability in carbon uptake, storage, and loss under historical and future climate conditions. Model simulations are forced with regionally downscaled climate projections and explicitly constrained using observed mortality signals to quantify the effects of CO₂ fertilization. Our results reveal a widespread divergence between modelled and observation-constrained carbon fluxes, with some biomes exhibiting a reduced carbon sink. Species adapted to moderately moist climate conditions show strong sink-to-source transitions, while drought-tolerant species exhibit greater resilience but limited long-term sequestration capacity. These findings demonstrate that climate extremes impose substantial limits on terrestrial carbon sequestration. By linking species-level ecological responses with carbon flux dynamics, our study provides a more realistic assessment of the future role of terrestrial ecosystems in regulating the global carbon cycle under ongoing climate change, as well as show species and regions for optimal sequestration.

Key words: Carbon Flux, Carbon Dioxide Removal, Biomes, Dynamic Vegetation Models, Drought, Heatwave

How to cite: Lawal, S. and Stewarts, W.: Mapping Global Carbon Flux in Species across Terrestrial Biomes Under Climate Extremes, EGU General Assembly 2026, Vienna, Austria, 3–8 May 2026, EGU26-14745, https://doi.org/10.5194/egusphere-egu26-14745, 2026.

EGU26-15935 | Orals | BG3.1

The researcher effect can outweigh the original effect in meta-analyses of global change experiments 

Sebastian Leuzinger, Kevin van Sundert, Martin Bader, Yalin Hu, Scott Chang, Jeff Dukes, Adam Langley, and Zilong Ma

During meta-analyses, a critical stage consists of the numerical extraction of the data from the original publications. While in the medical disciplines, there are often stanard operating procedures on how exactly to extract those numbers that are then expressed as effect sizes. Because in global change ecology, we mostly lack such rules on data extraction, we often rely on the judgement of the researcher. For example, 'micro-decisions' have to be made as to what time window is averaged, or whether species are pooled or not. In an effort to create the over-arching MESI database (see van Sundert et al. 2023 GCB), amalgamating four existing data-bases, we identified a substantial 'researcher effect', which occasionally outweighs the originally observed effect of global change on ecosystems. For instance, we identified a substantial discrepancy between what different meta-analyses found in regards to the effect of rising atmospheric CO2 and warming on below ground biomass, ranging from net negative to net positive effects. Importantly, the meta-analyses are largey based on the same original data. We discuss this issue, which likely exists in other disciplines and show possible ways forward.

How to cite: Leuzinger, S., van Sundert, K., Bader, M., Hu, Y., Chang, S., Dukes, J., Langley, A., and Ma, Z.: The researcher effect can outweigh the original effect in meta-analyses of global change experiments, EGU General Assembly 2026, Vienna, Austria, 3–8 May 2026, EGU26-15935, https://doi.org/10.5194/egusphere-egu26-15935, 2026.

EGU26-16065 | Orals | BG3.1

Clear-Cutting and Carbon Balance in Boreal Forests: Evidence from a Natural Experiment 

Line Nybakken, Rieke Lo Madsen, O. Janne Kjønaas, Håvard Kauserud, Tone Birkemoe, Lisa Fagerli Lunde, and Johan Asplund

Boreal forests store approximately one-third of the global carbon (C) pool, and the C sink capacity of Fennoscandian boreal forests has increased steadily over the past century. However, recent evidence indicates a marked decline in C uptake during the last decade, with some areas transitioning to net C sources. The drivers of these changes are complex, involving interactions between forest management and climate change.

Fennoscandian forests have been intensively managed for centuries, with only small remnants remaining virgin. Since World War II, stand-based forestry dominated by clear-cutting and planting has become the prevailing practice, enhancing timber production and tree C uptake. Yet, its long-term effects on soil C dynamics, ecosystem functioning, and resilience remain poorly understood.

The EcoForest project investigates the long-term impacts of clear-cutting on biodiversity, carbon dynamics, and ecosystem functions in Norway spruce (Picea abies) forests along climatic gradients. We established paired plots of mature forests: one previously clear-cut (CC) and one near-natural (NN), matched for macroclimate, topography, and soil properties. CC stands had higher tree density, while NNs exhibited greater structural heterogeneity, light variability, and crown length. Deadwood volume was three times higher in NNs than in CCs.

We monitored tree litterfall continuously for two years and measured soil respiration monthly during one snow-free season. Ground vegetation litterfall was estimated via destructive sampling. CC stands exhibited 12% higher annual soil respiration, 20% greater tree litterfall, and a tendency toward higher total aboveground litterfall (12%), whereas NNs had 45% greater ground vegetation litterfall. Deadwood from CC stands showed higher respiration rates in laboratory assays, likely due to differences in wood properties that, in turn, led to different fungal decomposer communities. Overall, current net soil C balance appears similar between CC and NN stands.

Our findings demonstrate that management history exerts a lasting influence on key ecosystem processes, including litterfall composition, deadwood decomposition, and soil respiration—factors often overlooked in current carbon models that treat forests as homogeneous units. By integrating these dynamics, models can better capture variability in carbon fluxes across clear-cut and near-natural stands. The EcoForest project provides a unique natural experiment, offering critical insights for improving ecosystem models and enhancing predictions of boreal forest carbon balance under future climate and management scenarios.

How to cite: Nybakken, L., Madsen, R. L., Kjønaas, O. J., Kauserud, H., Birkemoe, T., Lunde, L. F., and Asplund, J.: Clear-Cutting and Carbon Balance in Boreal Forests: Evidence from a Natural Experiment, EGU General Assembly 2026, Vienna, Austria, 3–8 May 2026, EGU26-16065, https://doi.org/10.5194/egusphere-egu26-16065, 2026.

EGU26-16694 | ECS | Posters on site | BG3.1

Investigating the impact of nitrogen deposition on the emergent forest ecosystem 

Liangzhi Chen, Jelle Lever, Mark Anthony, Charlotte Grossiord, Yiqi Luo, Shuli Niu, Fons van der Plas, Benjamin Stocker, and Arthur Gessler

Forests provide a wide range of ecosystem services, including the provision of natural resources, regulation of atmosphere–land surface interactions, and support of social and cultural activities. Atmospheric deposition of reactive nitrogen (N deposition) represents an important nutrient input to forest ecosystems; however, most nitrogen-addition experiments fail to emulate the chronic, canopy-level inputs that occur under real-world conditions. Across the Alps, total nitrogen deposition has steadily declined since the late 1980s, but current annual deposition remains at medium to high levels (on average ~15 kg N ha⁻¹ yr⁻¹). Understanding how nitrogen deposition affects Alpine forests—particularly against a backdrop of declining inputs—is therefore critical for anticipating future forest functioning and ecosystem service provision. Meanwhile, most existing studies examine the effects of nitrogen deposition on a limited number of forest functions, implicitly assuming that, after accounting for (a)biotic drivers, residual variation in the focal functions is independent of other, unexamined forest functions. Given the complexity of forest ecosystems and the exchange of mass and energy across ecological processes, this assumption of independence of intrinsic interactions among forest functions is likely violated, potentially leading to biased inference. Here, we leverage long-term Swiss forest inventory data spanning broad environmental gradients and jointly model 13 forest functions within a multivariate framework that explicitly captures trade-offs and latent relationships among functions. We show that inference on the effects of nitrogen deposition differs substantially between univariate and multivariate models, including a sign flip of the inferred impact of nitrogen deposition on some key functions (such as bird diversity). Our results highlight the importance of viewing forests as emergent ecosystems and demonstrate that multivariate approaches provide a suitable basis for assessing global change effects. By integrating expert-based evaluations of the relative importance of individual forest functions to different ecosystem services, we further quantify the marginal impacts of historical nitrogen deposition on forest ecosystem services, offering insights directly relevant to forest management and policy.

How to cite: Chen, L., Lever, J., Anthony, M., Grossiord, C., Luo, Y., Niu, S., van der Plas, F., Stocker, B., and Gessler, A.: Investigating the impact of nitrogen deposition on the emergent forest ecosystem, EGU General Assembly 2026, Vienna, Austria, 3–8 May 2026, EGU26-16694, https://doi.org/10.5194/egusphere-egu26-16694, 2026.

EGU26-17116 | Posters on site | BG3.1

Physiological Responses of Green Alder (Alnus alnobetula) to Drought 

Andreas Gruber, Gerhard Wieser, and Walter Oberhuber

Due to land-use change and the abandonment of mountain pastures, green alder (Alnus alnobetula (Ehrh.) K. Koch; former Alnus viridis (Chaix) DC.) has been reported to invade abandoned grassland in the Alps on a wide scale. Once restricted to north-facing slopes, with high water availability, it is now expanding into sites with impaired water availability. To identify possible restrains for a further expansion of the species, we evaluated drought tolerance using a greenhouse experiment where saplings were exposed to drought periods of different lengths, monitoring transpiration (E) and maximum (Fv/Fm) and effective (ϕ) quantum yield of photosystem II. E declined markedly once volumetric soil water content (SWC) dropped below 10%. After reirrigation E recovered quickly, but remained reduced for several weeks, indicating a post-drought legacy effect. Fv/Fm was rather insensitive to drought showing no significant changes until SWC fell below 5%. However, in correlation with photosynthetically active radiation (PAR), ϕ proved to be a useful indicator to detect moderate drought stress. When the plants were exposed to a second drought period, E reacted more sensitive to reduced soil water availability and was significantly reduced at a moderate SWC of 28%. Fv/Fm also showed an early decline at SWC of 15%, both indicating a short-term adjustment in stomatal regulation induced by the first drought. Plants lost 70% of their leaves after 12 days of SWC < 15% in the first drought. However, about 6 days after re-irrigation they started to grow new leaves. After the second prolonged drought the saplings had lost most leaves and less than a quarter survived the following winter. Green alder has shown the capacity to adapt to moderate drought, indicating a potential to persist on drier sites.


This research was funded in whole by the Austrian Science Fund (FWF) (Grant-DOI: 10.55776/P34706).

How to cite: Gruber, A., Wieser, G., and Oberhuber, W.: Physiological Responses of Green Alder (Alnus alnobetula) to Drought, EGU General Assembly 2026, Vienna, Austria, 3–8 May 2026, EGU26-17116, https://doi.org/10.5194/egusphere-egu26-17116, 2026.

EGU26-18159 | Orals | BG3.1

Similar Climate, Different Carbon Uptake: Ecophysiological and Phenological Controls on Interannual Variability in Nearby Evergreen and Deciduous Forests of East Asia 

Jeonghyun Hong, Hojin Lee, Sukyung Kim, Minsu Lee, Juhan Park, Ryuichi Hirata, and Hyun Seok Kim

Global warming has extended the growing season in temperate forests, and this trend is expected to continue. While changes in forest physiological processes enhance our understanding of carbon uptake and phenology, the mechanisms underlying interannual variability in carbon balance across adjacent different forest types under similar monsoon-influenced climatic conditions, particularly in East Asia, remain unclear. This study aimed to identify the ecophysiological and phenological drivers of net carbon uptake based on eddy covariance flux observations from adjacent temperate forest ecosystems in East Asia, affiliated with the KoFlux and JapanFlux networks: evergreen forests and deciduous forests. The interannual variability of net ecosystem production (NEP) in evergreen needleleaf forests (ENF) was generally dominated by environmental controls, particularly water availability and temperature. In contrast, in deciduous forests—including both deciduous broadleaf and deciduous needleleaf forests (DBF and DNF)—interannual variability of NEP was largely regulated by environmental conditions but consistently modulated by phenology, with the timing and duration of carbon uptake playing an additional and critical role across East Asia. The results of this study are expected to have high applicability as a foundational dataset for future improvements in global carbon budget predictions driven by climate change. Not only do they provide scientific data to support future carbon neutral, but they also reveal the interannual variability characteristics of carbon uptake through the integrated consideration of ecophysiological and phenological factors.

How to cite: Hong, J., Lee, H., Kim, S., Lee, M., Park, J., Hirata, R., and Kim, H. S.: Similar Climate, Different Carbon Uptake: Ecophysiological and Phenological Controls on Interannual Variability in Nearby Evergreen and Deciduous Forests of East Asia, EGU General Assembly 2026, Vienna, Austria, 3–8 May 2026, EGU26-18159, https://doi.org/10.5194/egusphere-egu26-18159, 2026.

EGU26-19109 | Orals | BG3.1

Assessing the role of tree mortality in shaping ecosystem functional properties 

Negin Katal, Clemens Mosig, Miguel D. Mahecha, Daniel Lusk, Janush Vajna Jehle, Paul Neumeier, Mattis Pfenning, Mirco Migliavacca, Talie Musavi, Jacob A. Nelson, and Teja Kattenborn

Tree mortality is increasing globally due to climate extremes, disturbances, and biotic stressors, with profound consequences for ecosystem carbon cycling. However, the extent to which spatial patterns and temporal dynamics of tree mortality influence the functioning of ecosystems as a whole remains poorly quantified. 

In this study, we investigate how tree mortality impacts  key ecosystem functional properties, focusing on light-saturated gross primary productivity (GPPsat) and maximum net ecosystem production (NEPmax). Ecosystem functional properties were derived from long-term, half-hourly eddy covariance measurements across a range of forest ecosystems. Spatially explicit information on forest cover and tree mortality was obtained from satellite-based predictions of the deadtrees.earth initiative, which integrates drone-based observations with Earth observation data to produce multitemporal mortality and forest cover estimates at global  scale.

We assessed whether including tree mortality information in addition to environmental drives improves the explanation and prediction of global and site-level variability in the flux-derived ecosystem functional properties; GPPsat and NEPmax. Model performance and variable importance patterns were compared between scenarios with and without forest cover and mortality dynamics to quantify the added explanatory power.

This study aims to provide the first systematic assessment of how spatially explicit tree mortality information contributes to ecosystem functional properties derived from eddy covariance data, and to evaluate whether integrating tree mortality observations can improve our understanding of the controls of ecosystem productivity and carbon balance under ongoing climate change.


How to cite: Katal, N., Mosig, C., Mahecha, M. D., Lusk, D., Jehle, J. V., Neumeier, P., Pfenning, M., Migliavacca, M., Musavi, T., Nelson, J. A., and Kattenborn, T.: Assessing the role of tree mortality in shaping ecosystem functional properties, EGU General Assembly 2026, Vienna, Austria, 3–8 May 2026, EGU26-19109, https://doi.org/10.5194/egusphere-egu26-19109, 2026.

EGU26-20330 | Posters on site | BG3.1

The TERRA approaches to unravel the interactions between the geo- and the biosphere in a changing world 

Khatab Abdalla, Olaf Cirpka, Kira Rehfeld, and Michaela A. Dippold

Interactions between the living and non-living components of the Earth system—the biosphere and the geosphere—are the prerequisites for a habitable planet and provide the resources required by humans. Although the scale of anthropogenic global change is unprecedented, the fundamental laws of nature governing the responses of the geo- and biosphere remain unchanged. The TERRA Cluster of Excellence will investigate how geo-biosphere interactions respond to and influence environmental change. TERRA tests the hypothesis of whether the geosphere’s diversity stabilizes the biosphere and, vice versa, whether biodiversity stabilizes the geosphere – and asks: if this is the case, how? To target this challenge, one primary goal of TERRA will be to generate a discipline-overarching concept on system’s stability, applicable to the geo- and the biosphere, to quantitatively integrate the stability concept into predictive models. Based on that, the quantitative description of diversity-stability interrelationship within and across spheres is the overarching goal of TERRA.

TERRA’s four research themes are organized along the continuum of different temporal and spatial scales. Theme 1 “Geo-Biosphere Interactions in the Geological Past” involves investigations at sites where high-fidelity records of past geo-biosphere interactions are well preserved across key time intervals. In one project, we will focus on the paleo-biodiversity hotspot at the Miocene site Hammerschmiede in Southern Germany. Understanding past Geo-Biosphere Interactions provides the baseline of geo-biosphere interactions without anthropogenic influence, and thus a foundation for identifying and quantifying anthropogenic impacts under contemporary and future conditions.

Theme 2 “Large-Scale Contemporary Geo-Biosphere Interactions” develops a process-based understanding of present-day geo-biosphere interactions on spatial scales on which experimental manipulation is impossible. In our initial projects we aim to disentangle Geo-Biosphere Feedbacks in the FynBOS biome, a mediterranean biodiversity hotspot, and will assess how anthropogenically-enhanced species invasion can be analyzed as “local experiments” to understand self-organizational patterns in novel ecosystems.

Theme 3 focuses on “Small-Scale Contemporary Geo-Biosphere Interactions” to provide mechanistic understanding of feedbacks between the geo and the biosphere on scales small enough to allow well-controlled experiments (µm to 100 m). The central field plots of our Diversitorium infrastructure form a large geodiversity manipulation experiment, modulating mineralogy, texture and climate variability independently. We will, in first projects, also investigate sites with high spatial geological heterogeneity, such as Alpine peatlands, to assess how geodiversity shapes geo-bio-systems and their stability.

Across scales, Theme 4 “Geo-Biosphere Interactions in the Future” shall build and investigate future scenarios based on observational, experimental, and modeling results, guided by the principle of ’past extremes informing the future’. Using machine learning, climate and vegetation modelling, we aim to advance our understanding of past and present vegetation changes identifying the underlying complex and cascading series of biosphere-geosphere feedbacks. Model-based comparison of past and present Earth-System states allows deciphering systematic differences between dynamics under natural conditions and anthropogenic 

How to cite: Abdalla, K., Cirpka, O., Rehfeld, K., and A. Dippold, M.: The TERRA approaches to unravel the interactions between the geo- and the biosphere in a changing world, EGU General Assembly 2026, Vienna, Austria, 3–8 May 2026, EGU26-20330, https://doi.org/10.5194/egusphere-egu26-20330, 2026.

EGU26-21587 | Orals | BG3.1

Phosphorus limitation constrains microbial carbon–nitrogen cycling in a Eucalyptus forest under elevated CO2: evidence from EucFACE 

Manon Rumeau, Fotis Sgouridis, Catriona A. Macdonald, Paola Pisetta Raupp, Charles Warren, Michaela K. Reay, A. Rob MacKenzie, Sami Ullah, and Yolima Carrillo

Phosphorus (P) can restrict the capacity of forests to store additional carbon (C) with increasing carbon dioxide (CO2) concentration. Although P limitation is widespread, P addition experiments in mature forests are rare, leaving large uncertainties about whether alleviating P limitation under elevated CO2 (eCO2) will enhance C storage or instead shift limitation toward nitrogen (N). Here, we used a parallel P-fertilization x eCO2 manipulation in a mature forest to investigate the acute nutrient cycling response to P fertilization under eCO2 with a particular focus on N cycling. In April 2023, a mature P-limited Eucalyptus Forest at the Euc-Free Air CO2 Enrichment (Euc-FACE) experiment in Australia, was fertilized with 1.5 g P m-2 following 10 years of CO2 enrichment. We measured soil gross N mineralization and compound-specific depolymerization rates – offering novel insights into microbial metabolic pathways – alongside extracellular enzymatic activities, and nutrient pools in the top 10 cm of soil before P addition, 10 days and two months afterwards. We found that P addition decreased extracellular soil enzymatic activities associated with C-N-P-mining (50%), increased microbial NH4+ retention (immobilization: mineralization ratio; + 23%) and microbial C use efficiency (CUE; + 12%), causing a reduction in plant-available N (─ 30%) independently from eCO2. Under eCO2, P addition stimulated protein depolymerization and C-P enzyme activities. Compound specific analyses revealed increased microbial biosynthesis with P addition via the assimilation of key amino acids such as alanine, glycine and glutamate. These findings indicate that P limitation constrains microbial C-N cycling under eCO2 by diverting microbial C investment toward P acquisition rather than growth. While alleviating P limitation can rapidly stimulate microbial cycling and promotes microbial C retention under eCO2, this response may only be transient, as enhanced microbial growth drives the system towards N limitation.

How to cite: Rumeau, M., Sgouridis, F., A. Macdonald, C., Pisetta Raupp, P., Warren, C., K. Reay, M., MacKenzie, A. R., Ullah, S., and Carrillo, Y.: Phosphorus limitation constrains microbial carbon–nitrogen cycling in a Eucalyptus forest under elevated CO2: evidence from EucFACE, EGU General Assembly 2026, Vienna, Austria, 3–8 May 2026, EGU26-21587, https://doi.org/10.5194/egusphere-egu26-21587, 2026.

EGU26-21875 | Posters on site | BG3.1

Sulfur Redox Status in Peatland Soil and Outflow Waters Diverge with Climate Warming 

Brandy Toner, Caroline Pierce, Sona Jedinak, Brandy Stewart, Kolka Randall, Stephen Sebestyen, Natalie Griffiths, and Jessica Gutknecht

Boreal peatlands are important continental reservoirs of carbon and other elements. Changes in climate, especially increasing temperatures and more variable precipitation, alter oxidation-reduction (redox) conditions and fluxes of atmospheric and aquatic pollutants from peatlands. Here, we measure the effect of warming and elevated carbon dioxide on the speciation of sulfur in boreal peatland soil and outflow water over three years. In whole ecosystem warming experiments, with temperature levels of +0 °C (control), +2.25 °C, +4.5 °C, +6.75 °C, and +9 °C above ambient, water table height was negatively correlated with warming. Warming was correlated with changes in the size of sulfur pools, specifically, sulfur content (weight%) decreased in soils and sulfate (SO 4 2- aq) concentrations increased in outflow. Reflecting the warmer and drier conditions, the percentage of oxidized sulfur in soil, as
measured by X-ray absorption near edge structure (XANES) spectroscopy, increased with warming. Sulfur speciation in soil showed increases in ester-sulfate (R-O-SO 3 - ) content at the expense of organic disulfide (R-S-S-R’) content. In contrast to the soil, the percentage of oxidized sulfur decreased in outflow with warming. The changes in sulfur speciation in outflow were characterized by increased organic monosulfide (R-S-R’, R-S-H) content at the
expense of ester-sulfate. Overall, the peatland sulfur pools are becoming more oxidized in the soil and more chemically reduced in the outflow water in response to soil and air warming. The connection between these opposite redox trends is likely due to enhanced microbial activity in porewaters and outflow with warming. Specifically, we observed that ester-sulfate partitions from soil to outflow waters during heavy rainfall periods (based on weekly
precipitation). We surmise that increases in ester-sulfate in outflow make it available for microbial sulfur reduction processes that are also enhanced at warmer temperatures. Our study indicates that the peatland response to climate warming is complex: oxidation of sulfur in soil and the chemical reduction of sulfur in the outflow water are both correlated with warming. Notably, no significant effect of elevated carbon dioxide on sulfur pools was detected. Our findings are consistent with a net export of organic sulfur from the peatland to receiving surface waters. Furthermore, the overall loss of sulfur from this peatland is consistent with enhanced decomposition and increased plant available nutrients reported previously for this whole ecosystem warming experiment. Warming-induced changes to sulfur pools in peatlands affect the fluxes of other constituents, such as organic carbon and the pollutant methyl-mercury, that have downstream consequences for climate and water quality.

How to cite: Toner, B., Pierce, C., Jedinak, S., Stewart, B., Randall, K., Sebestyen, S., Griffiths, N., and Gutknecht, J.: Sulfur Redox Status in Peatland Soil and Outflow Waters Diverge with Climate Warming, EGU General Assembly 2026, Vienna, Austria, 3–8 May 2026, EGU26-21875, https://doi.org/10.5194/egusphere-egu26-21875, 2026.

EGU26-23021 | ECS | Orals | BG3.1

Effect of experimental warming on sources of soil respiration in a tropical forest 

Rachel Cruz-Pérez, Tatiana Barreto-Vélez, Deyaneira A. Ortiz-Iglesias, Laura C. Rubio-Lebrón, Karis McFarlane, Molly Cavaleri, Sasha Reed, Tana E. Wood, and Jason Kaye

Soil respiration (Rs) is the largest terrestrial flux of carbon dioxide (CO2) to the atmosphere, with tropical forests contributing disproportionately to global Rs. Rising temperatures associated with climate change are expected to substantially alter tropical soil carbon (C) cycling by stimulating microbial activity and accelerating organic matter decomposition and influencing plant and root respiration. However, the extent to which warming alters the relative contributions of autotrophic (Ra) and heterotrophic (Rh) respiration remains poorly constrained. Distinguishing these sources is necessary to understand the mechanisms underlying their responses. Radiocarbon (14C) analyses provide a powerful approach for resolving respiration sources and assessing the age of respired C. Here, we used 14C measurements to examine how experimental warming alters source contributions at the Tropical Responses to Altered Climate Experiment (TRACE) in Puerto Rico, where infrared heaters increase understory and surface soil temperatures by 4°C above ambient conditions. Surface soil gas samples were collected for 14C analysis of Rs, soil incubations were used to constrain the Rh end-member, and atmospheric samples represented the Rₐ end-member. All gas samples were purified for CO2, graphitized, and analyzed by accelerator mass spectrometry. Soil respiration in control plots exhibited a modern radiocarbon signature, whereas warmed plots showed significantly higher Δ14C values, indicating increased contributions from decades-old C (“bomb C”). The Rₕ end-member also became significantly older under warming. Isotope mixing models revealed a pronounced shift in source contributions, with Ra decreasing and Rh approximately doubling under warming. These results indicate that increased temperatures enhanced microbial decomposition of older soil C, altering the balance between autotrophic and heterotrophic respiration. Such warming-induced shifts in respiration sources are not detectable from measurements of total CO2 fluxes alone and highlight the importance of source partitioning for assessing the vulnerability of tropical soil C under sustained warming. These findings also provide critical constraints for improving Earth system model representations of tropical soil C-climate feedbacks.

How to cite: Cruz-Pérez, R., Barreto-Vélez, T., Ortiz-Iglesias, D. A., Rubio-Lebrón, L. C., McFarlane, K., Cavaleri, M., Reed, S., Wood, T. E., and Kaye, J.: Effect of experimental warming on sources of soil respiration in a tropical forest, EGU General Assembly 2026, Vienna, Austria, 3–8 May 2026, EGU26-23021, https://doi.org/10.5194/egusphere-egu26-23021, 2026.

EGU26-430 | ECS | Posters on site | BG3.2

Understanding Time-Lagged Causal Effects of Environmental Drivers on Vegetation Carbon Uptake 

Arup Babu and Chandrika Thulaseedharan Dhanya

Global warming, primarily caused by rising levels of carbon dioxide (CO₂) concentration in the atmosphere, poses a severe threat to the Earth. Perhaps the most effective and important strategy is achieving carbon neutrality. While a reduction in carbon emissions is a go-to approach for achieving carbon neutrality, enhancing or conserving carbon uptake or sequestration through land vegetation—via photosynthesis, commonly known as gross primary production (GPP)—is equally crucial in reducing atmospheric CO₂ concentrations and mitigating global warming. Beyond direct and indirect human interventions, environmental drivers such as temperature, rainfall, vapor pressure deficit (VPD), solar radiation, and soil moisture (SM) significantly influence vegetation dynamics, influencing carbon sequestration. Therefore, identifying the interactions among various environmental drivers and GPP is vital for enhancing the accuracy of carbon budget estimations and refining climate-carbon feedback models to better project land-based carbon sinks under climate change. Despite this fact, there are very limited studies, especially in India, to investigate these relationships. Consequently, to ascertain the links between environmental drivers and GPP, we have adopted the data-driven causal technique rather than the conventional correlation approach. The results for average conditions in India indicate that root-zone SM has a strong connection with GPP, while rainfall presents a weaker connection with a larger lag than SM. It emphasizes the significance of irrigation in India's vegetation, as the country's land is predominantly occupied by shallow-rooted crops. Mean VPD demonstrates a moderate influence; in contrast, both mean temperature and net solar radiation show weaker effects, with almost equal lag time.  The overall findings reveal the varying influences of different environmental variables on the GPP, offering crucial insights for improved regional land-atmosphere modeling to better replicate the carbon balance, thereby reducing the uncertainty associated with current estimates.

Keywords: Causal inference, climate-vegetation interactions, gross primary production (GPP)

How to cite: Babu, A. and Dhanya, C. T.: Understanding Time-Lagged Causal Effects of Environmental Drivers on Vegetation Carbon Uptake, EGU General Assembly 2026, Vienna, Austria, 3–8 May 2026, EGU26-430, https://doi.org/10.5194/egusphere-egu26-430, 2026.

EGU26-2236 | Posters on site | BG3.2

Chlorophyll fluorescence–based assessment of carbon sink–source shifts in Arctic tundra during the growing season 

Neus Sabater, Ella Kivimäki, Antti Lipponen, Shari Van Wittenberghe, Pekka Kolmonen, Tea Thum, and Antti Arola

The Arctic is warming approximately four times faster than the global average, driving rapid transformations across Arctic and Boreal ecosystems. Among these, modifications in vegetation structure, shrubbification, and changes in photosynthetic activity are particularly relevant, as vegetation strongly influences ecosystem–atmosphere carbon exchange. A warmer and increasingly CO₂-rich environment has stimulated photosynthetic activity and widespread greening; however, the persistence of these responses under continued climate warming remains uncertain.

In the ArcticSIF project, we investigate how tundra vegetation landscapes have evolved over the past two decades by examining multiple datasets of solar-induced chlorophyll fluorescence (SIF), gross primary productivity (GPP), ecosystem respiration (ER), and net CO₂ ecosystem exchange (NEE). Assessing the dynamics of these complementary records with meteorological datasets, we evaluate how carbon uptake and emission have shifted across different Arctic tundra regions during the growing season and to what extent SIF records support such an observation.

Our results show that in the circumpolar region, tundra landscapes exhibit a higher sensitivity to variations in air temperature compared to boreal ecosystems, with pronounced NEE shifts in graminoid and prostrate-shrub tundra environments modulated by growing season length. This study contributes to determining the speed at which some Arctic tundra ecosystems may shift from carbon sinks to carbon sources during the growing season in the context of Arctic warming and its influence on high-latitude carbon dynamics.

How to cite: Sabater, N., Kivimäki, E., Lipponen, A., Van Wittenberghe, S., Kolmonen, P., Thum, T., and Arola, A.: Chlorophyll fluorescence–based assessment of carbon sink–source shifts in Arctic tundra during the growing season, EGU General Assembly 2026, Vienna, Austria, 3–8 May 2026, EGU26-2236, https://doi.org/10.5194/egusphere-egu26-2236, 2026.

The land carbon cycle-climate change (C4) feedback, which partially determines the future level of climate warming, depends on the temperature sensitivity of ecosystem respiration (ER). Most of Earth System Models (ESMs) predict a strong C4 feedback by using monotonic response functions, whereas recent empirical evidence strongly suggests that ER does not monotonically increase with temperature. Here we used a Data-Informed Ecosystem Respiration Model (DIERM) to estimate global ER, and found that ESMs in Coupled Model Intercomparison Project Phase 6 (CMIP6) CMIP 6 (i.e., Can-ESM5, CESM2-WACCM, CMCC-ESM2, MPI-ESM1-2, and Nor-ESM2) generally overestimate ER in places with high air temperatures (e.g., tropical and temperate regions). Moreover, the overestimation of ER by ESMs increases with the increasing air temperature under future climate scenarios. Compared with our data-driven approach, Can-ESM5, CESM2-WACCM, CMCC-ESM2, MPI-ESM1-2, and Nor-ESM2 over-estimated global ER by 98.7%, 45.0%, 31.5%, 51.4%, and 64.8%, respectively, under the SSP585 scenarios by 2100. Overall, this study highlights the importance of accounting for the unimodal (functions with one maximum) temperature response pattern on ER and suggests that current models do not accurately represent the response of ER to warming, which may contribute to the large uncertainty of projected warming in the future. 

How to cite: Wang, S. and Niu, S.: Overestimating global ecosystem respiration by Earth System Models under future warming, EGU General Assembly 2026, Vienna, Austria, 3–8 May 2026, EGU26-4634, https://doi.org/10.5194/egusphere-egu26-4634, 2026.

EGU26-5022 | Orals | BG3.2

Large and Increasing Biospheric Productivity of Northern Ecosystems 

Matthias Cuntz, Benjamin Smith, Josep G. Canadell, Jürgen Knauer, and Vanessa Haverd

Plants take up carbon dioxide (CO2) through photosynthesis. How this will change with rising CO2 concentrations in the atmosphere will strongly determine future climate change. Yet, this is a process critically unconstrained at the global scale. An increase in the seasonal variations of atmospheric CO2 in recent decades indicates a positive trend in photosynthetic carbon uptake and a lengthening of the growing season in northern extra-tropical ecosystems. However, the biospheric characteristics behind these changes have not yet been fully explained.

We combined data‐driven seasonal cycles of plant productivity with carbon sinks across the range predicted by current biospheric process models to explain the seasonal variations of CO2 at high and low northern latitudes over the past 40 years. We find that increases in seasonal variations can only be explained by a larger gross primary productivity (GPP) of northern ecosystems than most current estimates, equivalent to (51 ± 2) Pg(C) a−1 around 2007, and by an increase of GPP about proportional (1.1 ± 0.3) to the increase in atmospheric CO2, also larger than most current estimates. Our results highlight the importance of the interplay between vegetation productivity and its seasonal variations, providing an improved constraint to estimate the future behaviour of the terrestrial carbon sink.


Reference

Cuntz M, Smith B, Canadell JG, Knauer J, and Haverd V (2025) Large and increasing biospheric productivity of northern ecosystems. Geophysical Research Letters, 52(14), e2025GL115983. https://doi.org/10.1029/2025gl115983

How to cite: Cuntz, M., Smith, B., Canadell, J. G., Knauer, J., and Haverd, V.: Large and Increasing Biospheric Productivity of Northern Ecosystems, EGU General Assembly 2026, Vienna, Austria, 3–8 May 2026, EGU26-5022, https://doi.org/10.5194/egusphere-egu26-5022, 2026.

EGU26-5289 | ECS | Orals | BG3.2

Multi-angle measurements of solar-induced chlorophyll fluorescence in tropical forest canopy 

Minlan Chen, Zhaoying Zhang, Yongguang Zhang, Linsheng Wu, and Yunfei Wu

Solar-induced chlorophyll fluorescence (SIF) is an electromagnetic signal emitted by photosynthetically active plants, serving as a proxy for photosynthesis. However, SIF measurements in tropical forests, which are vital carbon sinks, remain underexplored. This study conducted continuous multi-angle far-red SIF measurements in a tropical forest in Xishuangbanna, China, from July 2023 to August 2024, using a Multi-Fluo system. We retrieved SIF with four widely used algorithms, including three-band Fraunhofer Line Discrimination (3FLD), Band Shape Fitting (BSF), Spectral Fitting Method (SFM), and Singular Vector Decomposition (SVD). Results showed that BSF outperformed the others, with the strongest correlations with near-infrared radiance of vegetation (NIRvR) (R² = 0.89), absorbed photosynthetically active radiation (APAR) (R² = 0.86), and gross primary production (GPP) (R² = 0.66) at half-hourly scale. Furthermore, diurnal patterns of SIF, SIF yield and NIRvR-derived fluorescence yield (ΦF) were analyzed on cloudy and clear sky conditions. Interestingly, a hysteresis was observed in SIFBSF yield on sunny days. In addition, averaging data from 17 viewing azimuth angles (VAAs) could explain over 10% improvement for SIF-related relationships compared with single-angle results such as VAA of 0°. This study demonstrates the applicability of BSF for SIF retrieval in tropical forests and highlights the value of multi-angle measurements, providing foundational insights into understanding SIF dynamics in complex tropical ecosystems.

How to cite: Chen, M., Zhang, Z., Zhang, Y., Wu, L., and Wu, Y.: Multi-angle measurements of solar-induced chlorophyll fluorescence in tropical forest canopy, EGU General Assembly 2026, Vienna, Austria, 3–8 May 2026, EGU26-5289, https://doi.org/10.5194/egusphere-egu26-5289, 2026.

The P model is a parameter-sparse model for gross primary production (GPP) based on eco-evolutionary optimality principles. Here we describe a global implementation of the sub-daily P model, which separates the acclimation response of photosynthetic parameters to environmental variations (with an e-folding time scale of 15 days) from the rapid response of photosynthesis (with a time step of 30 minutes), together with a daily soil-moisture accounting scheme (SPLASHv1.0) and a semi-empirical response function describing how the influence of soil moisture on GPP varies systematically with climatic aridity. We assess the model’s ability to reproduce seasonal cycles of net ecosystem exchange (NEE), as inferred from spaceborne atmospheric CO2 measurements via the Global Carbon Assimilation System version 2 (GCAS2021). For simplicity, we assume net primary production (NPP) is a constant fraction of GPP, and constrain total annual heterotrophic respiration (RH) to match total annual NPP at each 0.5˚ grid cell. The response of RH to environmental variations is represented via a model that links RH to physical and biological processes involving oxygen transport and microbial activity, influenced by the soil water content and the temperature. This model mechanistically represents the nonlinear coupling of moisture and temperature dynamics, replacing the canonical “function times function” approach. The coupled model reproduces the observed spatial variation in amplitude and timing of NEE, with excellent agreement in extratropical regions. It also captures the interannual differences (over a time span of 10 years) in the seasonal cycle aggregated by the Fifth Assessment Report (AR5) geographic reference regions. In the tropics and some Southern regions, however, the large interannual variability in the inversion products results in a signal of the climatological seasonal cycle of NEE that is too small to assess model performance. Our results suggest that the temperature and moisture dependences of heterotrophic respiration, as well as primary production, are major controls of the seasonal cycle of NEE and that the observed global patterns in this cycle can be well captured by an extremely parameter-sparse model.

How to cite: Mengoli, G., Harrison, S. P., and Prentice, I. C.: A simple approach to apply an eco-evolutionary optimality model with a global climatological aridity function to predict the spatial and seasonal dynamics of net ecosystem exchange , EGU General Assembly 2026, Vienna, Austria, 3–8 May 2026, EGU26-5848, https://doi.org/10.5194/egusphere-egu26-5848, 2026.

EGU26-5890 | Orals | BG3.2

First Global Retrievals of Solar Induced Chlorophyll Fluorescence from the SIFIS Instrument onboard the Chinese Goumang Satellite 

Zhaoying Zhang, Gregory Duveiller, Yongguang Zhang, Anmin Fu, Jie Xu, Jun Lin, and Xinwei Zhang

In recent years, solar-induced chlorophyll fluorescence (SIF) has emerged as a powerful indicator for observing terrestrial photosynthesis. However, most existing satellite-based SIF retrievals are characterized by relatively coarse spatial resolutions, typically at the kilometer scale or coarser. The Chinese Terrestrial Ecosystem Carbon Inventory Satellite, Goumang, launched in August 2022, addresses this limitation by carrying the SIF Imaging Spectrometer (SIFIS), the first spaceborne instrument specifically developed for global SIF observations. SIFIS offers both high spatial resolution (370 m × 800 m) and high spectral resolution (0.24 nm across 664–786 nm), while achieving SIF retrieval uncertainties (~0.48 mW m⁻² nm⁻¹ sr⁻¹) comparable to those of existing satellite SIF products. The radiance measurements and SIF retrievals from SIFIS were initially evaluated using airborne AisaIBIS observations. Furthermore, SIFIS-derived SIF exhibits strong spatial and temporal consistency with independent satellite SIF datasets, as well as high correlations with flux tower estimates of gross primary production (R² = 0.87). Overall, this novel SIF product provides new opportunities to investigate photosynthetic processes at fine spatial scales from space.

How to cite: Zhang, Z., Duveiller, G., Zhang, Y., Fu, A., Xu, J., Lin, J., and Zhang, X.: First Global Retrievals of Solar Induced Chlorophyll Fluorescence from the SIFIS Instrument onboard the Chinese Goumang Satellite, EGU General Assembly 2026, Vienna, Austria, 3–8 May 2026, EGU26-5890, https://doi.org/10.5194/egusphere-egu26-5890, 2026.

EGU26-8895 | Posters on site | BG3.2

Multi-scale observations of carbon and water fluxes from a Mediterranean woodland ecosystem 

Caitlin Moore, Jaco Zandberg, Prajaya Prajapati, William Woodgate, and Jason Beringer

Australia’s Mediterranean ecosystems are among the most climate-variable on Earth, experiencing recurrent droughts and heatwaves that strongly regulate carbon uptake and water use. Long-term eddy covariance measurements from Australia’s Terrestrial Ecosystem Research Network (TERN) and OzFlux provide critical observations of net ecosystem exchange (NEE) from several Mediterranean woodlands, yet major uncertainties remain in partitioning these fluxes into gross primary productivity (GPP) and ecosystem respiration (ER), and in separating transpiration from total evapotranspiration. Improving these estimates is essential for understanding how Mediterranean ecosystems respond to climate extremes and for constraining regional contributions to the global carbon and water cycles.

As part of TERN activities in Western Australia, we have deployed additional research infrastructure to improve and constrain ecosystem photosynthesis, respiration and transpiration measurements over several endemic Mediterranean woodland ecosystems. Instrumentation includes fixed terrestrial laser scanners to quantify daily changes in canopy structure, hyperspectral sensors to derive vegetation indices and measure sun-induced chlorophyll fluorescence (SIF), and distributed quantum sensor nodes to characterise within-canopy light absorption and scattering. Together, these measurements provide direct information on canopy architecture, photosynthetic activity, and radiation use efficiency – all of which are key drivers of carbon and water cycling.

We demonstrate how these novel observations improve interpretation of eddy covariance fluxes at the Boyagin wandoo woodland TERN site, as well as enhance constraints on photosynthetic dynamics during periods of heat and water stress. This work highlights the value of integrating proximal sensing with flux measurements to reduce uncertainty in ecosystem carbon and water fluxes and to strengthen links between ground-based observations and satellite-based products.

How to cite: Moore, C., Zandberg, J., Prajapati, P., Woodgate, W., and Beringer, J.: Multi-scale observations of carbon and water fluxes from a Mediterranean woodland ecosystem, EGU General Assembly 2026, Vienna, Austria, 3–8 May 2026, EGU26-8895, https://doi.org/10.5194/egusphere-egu26-8895, 2026.

Gross primary productivity (GPP) is the largest terrestrial carbon flux and is highly sensitive to global warming. Despite global warming, relationships of the optimum temperature of GPP and the maximum GPP rate remain uncertain. We investigated the drivers of maximum GPP trends during 2000-2019 using global observations of ground-based eddy-covariance and satellite-based sun-induced chlorophyll fluorescence. Although maximum GPP increased worldwide, its optimum temperature increased only in tropical and temperate regions, but remained unchanged globally, and in arid and cold regions. Thermal acclimation via shifting optimum temperature was constrained by atmospheric and soil dryness, explaining less than a fifth of the global rise in maximum GPP. In contrast, increasing maximum GPP trends were more strongly driven by stomatal regulation improving water-use efficiency (as determined by the stomatal slope at the ecosystem scale, G1) and canopy development (as determined by the leaf area index). These results challenge the expectation that thermal acclimation is essential for terrestrial carbon uptake, and reveal that dynamic plant physiological and structural trends are critical for improving carbon cycle predictions at the ecosystem to global scales.

How to cite: Grünzweig, J. and Xu, C.: Physiological and structural trends rather than photosynthetic optimum temperature explain the recent increase of terrestrial carbon uptake, EGU General Assembly 2026, Vienna, Austria, 3–8 May 2026, EGU26-9048, https://doi.org/10.5194/egusphere-egu26-9048, 2026.

EGU26-9625 | Orals | BG3.2

Evaluation of JULES-SIF against TROPOMI data 

Tristan Quaife, Natalie Douglas, and Patrick McGuire

The use of SIF to evaluate land surface models shows considerable promise to help constrain estimates of, and elucidate the processes that control Gross Primary Productivity (GPP) on large spatial scales. To use SIF effectively for this purpose, we argue that forward modelling of the observations from the land surface model – as opposed to, say, relying on empirical relationships with the modelled GPP – is desirable if we wish to understand structural deficiencies in the land surface model.

This presentation describes the prediction of SIF from JULES, the Joint UK Land Environment Simulator, which is the land surface scheme of the Hadley Centre climate models, and the UK Earth System Model (UKESM). We explain how we couple leaf-level SIF models to the biochemistry routines in JULES, and how we scale the emitted SIF to the canopy level using a vegetation radiative transfer scheme (L2SM) that is consistent with the physics inside JULES but also allows for radiative emissions within the canopy. The SIF scheme includes attenuation within the leaf, utilizing either modelled or observed leaf reflectance and transmittance spectra and can make predictions of the canopy leaving SIF at arbitrary wavelengths. Downregulation of fluorescence by water stress is also included.

We show results from JULES-SIF at regional and global scales, and make comparisons against TROPOSIF data. The results show generally good agreement and are sufficiently aligned with the observations that they are able to highlight areas where JULES is not correctly modelling the relevant environmental processes. Future directions for the JULES SIF module are explained, including accounting the directional component of the canopy leaving SIF.

How to cite: Quaife, T., Douglas, N., and McGuire, P.: Evaluation of JULES-SIF against TROPOMI data, EGU General Assembly 2026, Vienna, Austria, 3–8 May 2026, EGU26-9625, https://doi.org/10.5194/egusphere-egu26-9625, 2026.

Gross primary productivity (GPP) represents the largest and one of the most dynamic components of the global carbon cycle, yet quantifying its magnitude and future trajectory remains a significant challenge due to the lack of direct measurements at scales beyond the leaf. Over the past 15 years, Solar-Induced chlorophyll Fluorescence (SIF) has emerged as a powerful photosynthetic tracer to bridge this gap, offering a unique opportunity to advance our predictive understanding of carbon-climate feedbacks and food security.

Technological advances have enabled the remote sensing of SIF from satellite platforms with unprecedented precision and resolution. When integrated with terrestrial biosphere models (TBMs), SIF provides a critical constraint for improving the parameterization of global photosynthesis and the coupled dynamics of the carbon and water cycles across both natural and managed ecosystems.


In this presentation, I will share our recent findings that empower SIF for multi-scale applications: (1) quantifying global GPP from tower networks to satellite over the globe, (2) enabling scalable crop yield predictions across diverse croppying systems management practices, and (3) partitioning net ecosystem exchange (NEE) and evapotranspiration (ET) across NEON sites spanning a wide range of hydroclimates and plant functional types. Central to these applications is the development of a Mechanistic Light Reaction (MLR) model that establishes a theoretical link between SIF and the actual electron transport rate. We demonstrate that this theory-informed approach significantly improves accuracy, scalability, and interpretability compared to conventional linear scaling and advanced machine learning algorithms, providing a robust framework for reducing uncertainties in ecosystem-scale flux estimates.

How to cite: Sun, Y., Luo, Z., Lee, S., and Kira, O.: Probing Global Photosynthesis for Food Security and Climate Mitigation: The Lens of Solar-Induced Chlorophyll Fluorescence (SIF), EGU General Assembly 2026, Vienna, Austria, 3–8 May 2026, EGU26-11840, https://doi.org/10.5194/egusphere-egu26-11840, 2026.

EGU26-15001 | ECS | Orals | BG3.2

Quantifying the impact of high night temperature on NPQ dynamics using canopy reflectance 

Insu Yeon, Clara García-Martínez, Eva Neuwirthová, Adrián Moncholi-Estornell, Mª Pilar Cendrero-Mateo, Sara Pescador-Dionisio, and Shari Van Wittenberghe

High night temperatures (HNT) can depress the photosynthetic performance of the plants, with consequential reductions in crop yield. To quantify the impact of HNT on plant photosynthesis, understanding non-photochemical quenching (NPQ) behavior is crucial given its mechanistic link to the downregulation of photosynthesis. Yet, how HNT alters the dynamics of NPQ remains poorly understood. In this study, we used a controlled walk-in growth chamber with phenotyping equipment for whole plants to obtain NPQ and the quantum yield of photosynthesis (ΦPSII) images combined with imaging spectroscopy to investigate NPQ under controlled temperature conditions (pre-HNT and HNT). Tomato plants were consecutively exposed to 3-day phases with day/night temperatures of 35/20°C (pre-HNT, day 1-3), 35/28°C (HNT, day 4-6) and 35/20°C (recovery, day 7-9). HNT induced nocturnal NPQ elevation that persisted in the following day, resulting in consistently higher NPQ throughout the diurnal cycle compared to the pre-HNT (t-test, p<0.05). This carryover effect suggests a prolonged photoprotective state triggered by nighttime heat stress. Meanwhile, ΦPSII showed no nighttime difference among phases, but exhibited decreases near peak daytime temperatures. HNT further shifted the ΦPSII-fluorescence yield curve downward, resulting in lower fluorescence yield at similar ΦPSII values. A further objective was to monitor the change in NPQ through non-destructive image spectroscopy wherefore we employed partial least squares regression (PLSR) to estimate NPQ with using canopy reflectance (450-780 nm). Our PLSR results confirmed that NPQ can be estimated with an R2 of 0.93 based on canopy reflectance, and the predicted NPQ captured the HNT-induced increase during both night and day. From the variable importance in projection (VIP) analysis, we found that nighttime and daytime NPQ shared similar VIP peaks in green (500-600 nm) and red-edge (680-750 nm) region, indicating that consistent spectral features underlie NPQ dynamics regardless of light conditions. Our findings extend the understanding of how increased temperature activates NPQ dynamics and highlight that spectral reflectance contains informative signals for capturing temperature-driven photoprotective responses. 

How to cite: Yeon, I., García-Martínez, C., Neuwirthová, E., Moncholi-Estornell, A., Cendrero-Mateo, M. P., Pescador-Dionisio, S., and Van Wittenberghe, S.: Quantifying the impact of high night temperature on NPQ dynamics using canopy reflectance, EGU General Assembly 2026, Vienna, Austria, 3–8 May 2026, EGU26-15001, https://doi.org/10.5194/egusphere-egu26-15001, 2026.

EGU26-15310 | ECS | Orals | BG3.2

Towards multi-tracer constraints on photosynthesis: unifying solar-induced chlorophyll fluorescence, carbonyl sulfide flux and carbon isotope discrimination in BESS framework 

Helin Zhang, Huaize Feng, Myunghan Son, Youngryel Ryu, Joseph Berry, and Jennifer Johnson

Photosynthesis governs terrestrial carbon uptake and tightly couples carbon, energy and water exchange. However, any single observation has limited spatiotemporal coverage. Eddy-covariance CO2 exchange measurements, for instance, are still underrepresented in the tropics. At the global scale, model-based estimates of photosynthesis, often quantified as gross primary productivity (GPP), remain highly uncertain. Solar-induced chlorophyll fluorescence (SIF), carbonyl sulfide (COS or OCS), and carbon isotope discrimination (Δ¹³C) provide complementary windows into photosynthesis. They offer partially independent constraints on energy partitioning, conductance limitations, and diffusion–carboxylation controls. Breathing Earth System Simulator (BESS) is a remote-sensing-driven, process-based model that couples canopy carbon assimilation, evapotranspiration, and surface energy balance. Building on BESS, we (1) incorporate the Johnson–Berry model to provide a mechanistic yet parsimonious description of energy conversion within the electron transport system, enabling SIF simulation while accounting for photosynthetic control, cyclic electron flow, and non-photochemical quenching; (2) couple OCS exchange to BESS through shared conductance pathways (stomatal and boundary-layer) and biochemical capacity (Vcmax25℃), and implement an explicit mesophyll conductance scheme so that net CO₂ assimilation is computed from chloroplastic CO₂ concentration (Cc); (3) integrate a ¹³C discrimination module that mechanistically estimates Δ¹³C along the explicitly simulated CO₂ diffusion pathway from the atmosphere to the chloroplast, accounting for fractionation during boundary layer, stomatal, and mesophyll diffusion, as well as Rubisco carboxylation. By coupling SIF, OCS exchange, and Δ¹³C within a shared canopy gas-exchange and energy-balance framework, BESS is extended into a multi-tracer forward framework that generates internally consistent predictions of these tracers together with carbon-water fluxes. Based on this framework, we aim to: (1) evaluate whether multi-tracer integration improves simulations of carbon-water fluxes; (2) explore multi-constraint parameter optimization or data assimilation using independent observations to reduce uncertainty in photosynthesis estimates; and (3) quantify relationships between tracer signals and fluxes (e.g., GPP–SIF, GPP–OCS, SIF–OCS, Δ¹³C–GPP) and their responses to environmental variability.

How to cite: Zhang, H., Feng, H., Son, M., Ryu, Y., Berry, J., and Johnson, J.: Towards multi-tracer constraints on photosynthesis: unifying solar-induced chlorophyll fluorescence, carbonyl sulfide flux and carbon isotope discrimination in BESS framework, EGU General Assembly 2026, Vienna, Austria, 3–8 May 2026, EGU26-15310, https://doi.org/10.5194/egusphere-egu26-15310, 2026.

EGU26-18455 | Posters on site | BG3.2

Real-time monitoring of plant CO2 exchange using a direct absorption-based optical sensor 

Mariagrazia Olivieri, Andrea Zifarelli, Angelo Sampaolo, Vincenzo Spagnolo, and Pietro Patimisco

Understanding CO2 plant exchange is essential for quantifying its role in the global carbon cycle, predicting ecosystem responses to environmental change, and evaluating long-term growth under varying environmental conditions across several types of photosynthesis[1,2]. Plants exchange carbon dioxide with the atmosphere through three primary physiological processes: photosynthesis, which assimilates CO₂ during daylight to produce glucose and release O2 as a byproduct; photorespiration, a light-dependent process that recycles harmful byproducts of photosynthesis while releasing excess energy and CO2; mitochondrial respiration, which releases CO₂  and consume O2 to produce energy, occurring both day and night. These CO₂ fluxes are coupled with transpiration that facilitates the loss of water vapor from leaves through stomata[1]. These processes can be accurately quantified using gas-exchange techniques, in which a gas analyzer measures the exchange of CO₂ and H₂O between leaves and the atmosphere.
In this study, we employed a self-calibrated, optical sensor based on tunable diode laser spectroscopy to monitor plant CO₂ exchange in real time. The sensor consists of a quantum cascade laser emitting at 4.234 μm as the light source and a photodetector to measure CO2 absorption along an open optical path of 10 cm. Measurements were performed using an amplitude modulation approach with first-harmonic detection at 10 kHz, employing a phase-sensitive lock-in amplifier. The optical sensor was placed inside a transparent plexiglass enclosure (525x375x300 mm3) containing a plant to monitor CO₂ exchange with the surrounding environment. A temperature and humidity sensor was also installed inside the enclosure, while a non-dispersive infrared CO₂ sensor (SEFRAM 9825) outside the enclosure was used to track ambient CO₂, temperature, and humidity. Continuous measurements were performed over approximately 20 days, covering both daytime and nighttime periods outside the laboratory, in a dedicated open area to minimize disturbances from nearby activity. Measured CO₂ concentrations inside the enclosure reflected both plant exchange and diffusive transport driven by the concentration gradient with the external environment. A differential equation model accounting for these processes was developed and applied to the experimental data to quantitatively determine the plant’s net CO₂ exchange rate.

References

  • Niu, Z., Ye, Z. W. Y., Huang, Q., Peng, C. & Kang, H. Accuracy of photorespiration and mitochondrial respiration in the light fitted by CO2 response model for photosynthesis. Front. Plant Sci. 16, 1455533 (2025).
  • Busch, F. A., Ainsworth, E. A., Amtmann, A., Cavanagh, A. P., Driever, S. M., et al. A guide to photosynthetic gas exchange measurements: Fundamental principles, best practice and potential pitfalls. Plant Cell Environ. 47, 3344–3364 (2024).

How to cite: Olivieri, M., Zifarelli, A., Sampaolo, A., Spagnolo, V., and Patimisco, P.: Real-time monitoring of plant CO2 exchange using a direct absorption-based optical sensor, EGU General Assembly 2026, Vienna, Austria, 3–8 May 2026, EGU26-18455, https://doi.org/10.5194/egusphere-egu26-18455, 2026.

EGU26-20622 | ECS | Posters on site | BG3.2

Species-specific coupling of transpiration and radial growth to climate in temperate forests of Korea 

Minsu Lee, Hojin Lee, Jeonghyun Hong, and Hyun Seok Kim

Tree growth and water use are fundamental indicators of forest ecosystem functioning and are expected to respond differently to ongoing climate change. We analysed continuous stem radial growth and sap flow data from long-term monitoring sites at Mt. Taehwa and the Gwangneung forest in Korea, focusing on Pinus koraiensis and Quercus spp. stands at Mt. Taehwa during the period 2013–2024. Stem diameter growth was measured using custom dendrobands. To identify both short-term and carry-over climatic controls, annual transpiration and radial growth were related to air temperature, photosynthetically active radiation (PAR), and precipitation using a multi-window framework that distinguished current-year from previous-year climate effects. For P. koraiensis, annual transpiration showed a strong positive relationship with early-summer precipitation, indicating a direct water-supply control on water use. In contrast, transpiration in the oak stand was only weakly related to precipitation. Despite these contrasting transpiration responses, stem radial growth of both pine and oak species exhibited pronounced sensitivity to antecedent-year climate, demonstrating substantial carry-over effects. These results reveal a temporal decoupling between transpiration and growth and highlight the importance of climate memory in regulating stem growth across temperate forest types, providing new insights into forest vulnerability under increasing hydroclimatic variability.

How to cite: Lee, M., Lee, H., Hong, J., and Kim, H. S.: Species-specific coupling of transpiration and radial growth to climate in temperate forests of Korea, EGU General Assembly 2026, Vienna, Austria, 3–8 May 2026, EGU26-20622, https://doi.org/10.5194/egusphere-egu26-20622, 2026.

EGU26-21999 | ECS | Posters on site | BG3.2

Assessing the impact of an explicit representation of the nitrogen cycle on SIF and GPP dynamics across European sites 

Léo Tuffery, Cédric Bacour, David Martini, Georg Wohlfahrt, Nicolas Vuichard, Vincent Tartaglione, Nicolas Viovy, and Fabienne Maignan

The representation of gross primary production (GPP) in land surface models remains highly uncertain, despite GPP being a key driving component of the terrestrial carbon cycle (Gier et al., 2024). These uncertainties mainly arise from both the lack of direct measurements of GPP above the leaf scale and an incomplete representation of plant physiological processes (in terms of both parameter values and equations), in particular the links between carbon assimilation and nutrient availability.

Solar-induced chlorophyll fluorescence (SIF) has therefore emerged as a proxy of photosynthetic activity and of GPP by terrestrial ecosystems (Li et al., 2018). To further constrain parameters controlling photosynthetic activity, satellite-based SIF observations can be assimilated (from the TROPOSIF product, and, in the near future, the FLEX fluorescence product), as SIF provides information on plant physiological traits that regulate photosynthetic activity and GPP.

A fluorescence module previously developed for ORCHIDEE (Bacour et al., 2019) enables the simulation and assimilation of SIF observations. The ORCHIDEE-N land surface model now includes an explicit representation of the nitrogen cycle (Vuichard et al., 2019), allowing a more mechanistic description of photosynthesis through nitrogen limitations on key leaf traits controlling GPP, such as chlorophyll and Rubisco contents.

Integrating the fluorescence module into a model that explicitly represents leaf nitrogen limitation is expected to improve the simulation of both SIF and GPP by providing a more realistic description of chlorophyll content and photosynthetic capacity. In this study, an updated fluorescence module is implemented in ORCHIDEE-N to consistently link nitrogen availability, SIF, and photosynthetic activity. 

We present a first intercomparison of these two model versions (with and without the nitrogen cycle) based on the seasonal cycles of GPP and SIF at seven observational sites in Europe. These sites are drawn from the AustroSIF database (Martini et al., in prep.), which integrates in situ measurements of eddy-covariance fluxes (used to estimate GPP), SIF, and pulse-amplitude modulated fluorescence measurements. 

So far, neither the fluorescence model parameters nor those of the nitrogen-explicit module have been optimised in this new version. This preliminary study paves the way for assimilating both site-level data and satellite-derived SIF retrievals to further constrain the model.

Bacour, C., Maignan, F., et al. (2019). Improving estimates of gross primary productivity by assimilating solar‐induced fluorescence satellite retrievals in a terrestrial biosphere model using a process‐based SIF model. Journal of Geophysical Research: Biogeosciences, 124(11), 3281-3306.

Gier, B. K., et al. (2024). Representation of the terrestrial carbon cycle in CMIP6. Biogeosciences, 21(22), 5321-5360.

Li, X., et al. (2018). Solar‐induced chlorophyll fluorescence is strongly correlated with terrestrial photosynthesis for a wide variety of biomes: First global analysis based on OCO‐2 and flux tower observations. Global change biology, 24(9), 3990-4008.

Martini, D., et al., (in prep.). AustroSIF — A compilation of combined passive and active fluorescence data at flux tower sites across Europe.

Vuichard, N., et al. (2019). Accounting for carbon and nitrogen interactions in the global terrestrial ecosystem model ORCHIDEE (trunk version, rev 4999): Multi-scale evaluation of gross primary production. Geoscientific Model Development, 12(11), 4751-4779.

How to cite: Tuffery, L., Bacour, C., Martini, D., Wohlfahrt, G., Vuichard, N., Tartaglione, V., Viovy, N., and Maignan, F.: Assessing the impact of an explicit representation of the nitrogen cycle on SIF and GPP dynamics across European sites, EGU General Assembly 2026, Vienna, Austria, 3–8 May 2026, EGU26-21999, https://doi.org/10.5194/egusphere-egu26-21999, 2026.

EGU26-2554 | ECS | Orals | BG3.3

Wood You Be-Leaf It? The First Trait-Based Map of Global Vegetation Water Storage 

Laura Stewart, David Chaparro, Rafael Poyatos, Teresa Gimeno, Maurizio Mencuccini, and Oliver Binks

Climate change is drastically affecting the health and composition of terrestrial vegetation through increasing average temperatures and altered water availability. Terrestrial vegetation is a key mediator of global water fluxes through processes such as evapotranspiration and photosynthesis, meaning that the peril posed by the degradation of vegetation will be felt at the global scale. Because of this, there is mounting interest in modelling global vegetation water storage (Sveg) as a means to understand the role that vegetation plays in maintaining a stable climate and how this will be affected by the climate crisis.

Currently, estimates of global Sveg can be derived from satellite imagery using microwave remote sensing. The microwave signal is attenuated by the amount of water contained in vegetation and is then related to Sveg through a look-up table of land cover-specific values, known as the b parameter. Along with water storage, the b parameter is influenced by the biomass and structure of the vegetation, however the interaction between these variables and their influence on the b parameter is poorly understood. Therefore, to further elucidate the physiological component that the b parameter represents in satellite derived estimates of Sveg, it is necessary to generate independent physiologically derived Sveg estimates. Here, we present the first globally explicit trait-based map of Sveg, with vegetation separated into two physiological components: wood and leaf tissue. Phylogenetically imputed species-level values for wood density (WD) and specific leaf area (SLA) were used for 46,309 plant species, derived from field and laboratory-measured data. Wood water storage was estimated through a linear relationship with WD and biomass. Leaf water storage was estimated through a non-linear relationship with SLA and scaled to the canopy with leaf area index. Comparing our Sveg estimates with independently derived plot-level trait-based estimates demonstrated a strong correlation (R2 0.94), suggesting our phylogenetic imputation approach to be robust and scalable.

How to cite: Stewart, L., Chaparro, D., Poyatos, R., Gimeno, T., Mencuccini, M., and Binks, O.: Wood You Be-Leaf It? The First Trait-Based Map of Global Vegetation Water Storage, EGU General Assembly 2026, Vienna, Austria, 3–8 May 2026, EGU26-2554, https://doi.org/10.5194/egusphere-egu26-2554, 2026.

EGU26-2968 | ECS | Orals | BG3.3

Winter climate or species-specific traits? Controls on tundra winter nitrogen uptake along an Arctic climate gradient 

Laura Helene Rasmussen, Louise Rütting, and Anders Michelsen

Nitrogen (N) availability is a point of competition between tundra plants in a warming Arctic, where shrubs are spreading. Soil N mobilization from microbial mineralization can happen year round, and if some plants are able to access N during winter, they will have competitive advantages during warming winters with more N turnover. We therefore compared access to and retention of N during freeze-in to late winter in tundra plants from different tundra sites and explored how this may be linked to root biomass and plant functional type specific traits.

 We used 15N tracers in mesocosms from around Greenland, spanning a climate gradient from High- to Subarctic climates, and analyzed N uptake and retention species-specifically in stems and leaves, and in roots, microbes and in soil solution at four different winter stages along the climate gradient. We further measured the N uptake during a simulated late winter warming event.

We found that roots and aboveground biomass took up and retained 3-8 % of the early winter-released tracer N, but that early microbial N recovery of up to 50% dominated the ecosystem N retention. Most root N uptake was found in the Low Arctic, where continuous uptake was indicated. Least winter-released 15N overall was recovered in the High Arctic ecosystem, whereas the Subarctic ecosystem had the highest 15N recovery in plant biomass, especially in stems of deciduous shrubs. While evergreen shrubs, especially Empetrum nigrum, were overall most successful at acquiring and retaining winter-released  N with the current vegetation composition, the deciduous shrub Salix arctica stood out as most effective per unit biomass. 

We conclude that plant-specific traits and strategies, as well as climate, controlled tundra plant N access and retention during winter. Our results reveal that tundra plants access N during winter, but that plants in the Subarctic could be better adapted to access future increased winter N compared to the High Arctic. Across climates, species-specific winter N acquisition must be considered when explaining the expansion of shrubs in the Arctic tundra.

tundra plant N access and retention during winter is controlled by plant-specific traits and strategies as well as climate. Furthermore,  species-specific winter N access and acquisition must be considered when explaining the expansion of shrubs in the Arctic tundra.

How to cite: Rasmussen, L. H., Rütting, L., and Michelsen, A.: Winter climate or species-specific traits? Controls on tundra winter nitrogen uptake along an Arctic climate gradient, EGU General Assembly 2026, Vienna, Austria, 3–8 May 2026, EGU26-2968, https://doi.org/10.5194/egusphere-egu26-2968, 2026.

EGU26-3039 | Posters on site | BG3.3

Life started by self-organization 

Karin Dr.Moelling

 The Early World was an RNA world and started with non-coding RNA, which we know today from viroids and ribozymes. Viroids/ribozymes are the most ancient entities which can replicate, undergo mutations and evolve. They may have been autonomous in the Early World,  helping build up larger structures, protocells and cells. A model how life may have evolved has been designed by Manfred Eigen by demonstrating chemical evolution with prebiotic molecules. This occurs before  the biological evolution of living matter. Furthermore,  M. Eigen designed  a Hypercycle, an abstract model where autocatalytic self-organization occurs,  self-replicating members cooperate and are linked in a positive feedback loop. It can be applied to primordial RNA molecules such as ribozymes which are essential throughout evolution of life until today. What can one learn from such a principle for extraterrestrial origin of life?


How to cite: Dr.Moelling, K.: Life started by self-organization, EGU General Assembly 2026, Vienna, Austria, 3–8 May 2026, EGU26-3039, https://doi.org/10.5194/egusphere-egu26-3039, 2026.

EGU26-3165 | Orals | BG3.3

Optimal photosynthetic strategies 

Nicholas Smith

Leaf traits collectively offer valuable insight into a plant’s photosynthetic strategy under varying environmental conditions. Eco-evolutionary optimality (EEO) theory can be used to predict photosynthetic trait variation, offering insight into the underlying mechanisms beyond what can be gleaned from data alone. EEO has been used to explore mechanisms underlying the variation in individual photosynthetic traits across space and time. Here, I extend this approach to (1) examine global variability in biochemical, stomatal, chemical, and morphological traits that collectively define an optimal photosynthetic strategy and (2) within-site variability in optimal photosynthetic strategies across different ecosystems. The global analysis revealed that the primary axis of variation was defined by differences in C3 and C4 plants with C4 plants displaying greater optimal intrinsic water use efficiency and higher amounts of photosynthetic nitrogen that generally conveyed faster rates of photosynthesis. This reflects the unique, fast-efficient strategy employed by C4 plants. The secondary axis of variation was defined by a correlation between optimal photosynthetic nitrogen use efficiency and optimal stomatal conductance. This was common across all plant types, with increasing aridity driving lower optimal stomatal conductance and nitrogen use efficiency, following expectations from photosynthetic least-cost theory. At the site-level, I generally found greater within-site than across-site variability in optimal photosynthetic strategy, suggesting a wide range of successful strategies within sites. The major site separator was between C4 grasslands and C3-dominated ecosystems, primarily because of greater water use efficiency and photosynthetic nitrogen investment at C4 sites. The results indicate that EEO theory can reproduce patterns of photosynthetic strategies across global gradients, while also revealing new insights into the clustering of these strategies. These results can be used to better understand photosynthetic trait data and, ultimately, plant physiological functioning.

How to cite: Smith, N.: Optimal photosynthetic strategies, EGU General Assembly 2026, Vienna, Austria, 3–8 May 2026, EGU26-3165, https://doi.org/10.5194/egusphere-egu26-3165, 2026.

EGU26-3812 | ECS | Posters on site | BG3.3

Aridity threshold triggers abrupt increase in shrub biomass through changes in leaf functional traits 

Guangshuai Cui, Lin Zhang, Francisco I. Pugnaire, and Eryuan Liang

Increases in aridity due to climate change in global drylands have led to changes in ecosystem structural and functional attributes, including shrub biomass. However, little is known about climate triggers of change in shrub biomass and the potential mechanism driving this process. Herein, we measured variations in shrub biomass and leaf functional traits in a dominant leguminous shrub species, Caragana versicolor Benth., along an aridity gradient in high-elevation regions of the southwestern Tibetan Plateau. We found an abrupt increase in C. versicolor cover and biomass beyond an aridity point of 0.35, at which C. versicolor leaf functional traits shifted from allocating N to the leaf (increasing Nmass) to modifying leaf anatomical structure (decreasing SLA) in response to increasing aridity. Leaf Pmass paralleled the changes of Nmass, while leaf N:P ratio maintained a constant value along the aridity gradient. Increased Nmass and decreased SLA consequently led to an increase in leaf δ13C (i.e., an indicator of water-use efficiency). Furthermore, aridity showed direct and indirect effects through interactions with leaf functional traits on C. versicolor biomass across the aridity gradient. Overall, our data show that shrub species in drylands cope with increasing aridity through changes in leaf functional traits, thereby formulating a leaf traits-biomass linkage. This process is crucial to understand plant dynamics under increases in aridity expected with climate change in many drylands.

How to cite: Cui, G., Zhang, L., Pugnaire, F. I., and Liang, E.: Aridity threshold triggers abrupt increase in shrub biomass through changes in leaf functional traits, EGU General Assembly 2026, Vienna, Austria, 3–8 May 2026, EGU26-3812, https://doi.org/10.5194/egusphere-egu26-3812, 2026.

EGU26-4051 | Orals | BG3.3

Evolutionary stomatal adaptations to CO2 impact carbon fluxes and stocks under future climate 

Silvia Caldararu and William J Matthaeus

Current vegetation models represent photosynthetic and stomatal responses to environmental conditions, including atmospheric CO2 concentrations, as nearly instantaneous, perfectly plastic, and reversible. However, the fossil record shows that plants can exhibit slower, developmental- or evolutionary-scale adaptations through changes in leaf anatomy, including reduced stomatal density under higher atmospheric CO2 concentrations. If such responses were to occur on the timescale of current anthropogenic global change that could have implications for our predictions of terrestrial carbon storage as well as plant response to water stress.

We implement a representation of long-term adaptation to CO2 concentrations in the QUINCY land surface model (LSM) by imposing a maximum stomatal conductance calculated as a function of long-term average CO2 concentration, following the Medlyn stomatal model. This is a functional representation of changes in leaf anatomy that integrates with current representations of leaf level processes in LSMs. We show that even for long response times (100 years), the model predicts changes in carbon and water fluxes, with more pronounced responses for shorter response times (<40 years). While the introduction of this long-term response leads to increased water use efficiency across the globe, the direction of the response in plant growth differs between plant functional types (PFT). Broadleaf deciduous forests show decreased productivity, while evergreen needleleaf forests show increased productivity This pattern is driven by PFT-specific parameters, including the g1 slope parameter as well as PFT-environment interactions like growing season length. Further, the magnitude of the change in productivity is modulated by nutrient availability, with more nutrient-limited regions showing a smaller change in productivity.

These findings highlight the importance of incorporating long-term plastic plant responses to environmental change to vegetation models and differentiating between such responses, short-term acclimation, and interactions between plant function and environment.

How to cite: Caldararu, S. and Matthaeus, W. J.: Evolutionary stomatal adaptations to CO2 impact carbon fluxes and stocks under future climate, EGU General Assembly 2026, Vienna, Austria, 3–8 May 2026, EGU26-4051, https://doi.org/10.5194/egusphere-egu26-4051, 2026.

EGU26-5302 | ECS | Orals | BG3.3

Addressing the underrepresentation of African ecosystems in plant traits, adaptation, and biogeochemical cycles: Mapping traits for model parameterisation 

Enimhien F. Akhabue, Andrew M. Cunliffe, Karina Bett-Williams, Anna B. Harper, Petra Holden, and Tom Powell

Plant trait observations provide a critical bridge between organismal strategies and ecosystem-scale biogeochemical cycling, yet trait coverage and the evidence base used for land-surface model (LSM) parameterisation remain geographically uneven. Current LSM parameterisations are biased because African floras and trait data are underrepresented in global syntheses. This limits how well LSMs represent the diversity of plant strategies across African landscapes, contributing to uncertainty and regional bias in simulations of carbon and water cycling under rapid environmental change. A key need is therefore a transparent measurements-to-models pathway that converts heterogeneous trait and botanical information into model-ready functional groupings that can directly support parameterisation and evaluation of LSMs.

Here we operationalise a transparent trait-to-PFT translation layer for LSM parameterisation. We used reproducible, rule-based workflow that could be applied across floristic regions to map African plant species represented in the TRY plant trait database to the Joint UK Land Environment Simulator (JULES) plant functional types (PFT) taxonomy. We assigned classification attributes including growth form, leaf type, leaf phenology, photosynthetic pathway, and climatic zone, and implemented decision rules to generate consistent PFT assignments. This process mapped 1603 plant species from 137 families to JULES PFTs. Our output provides JULES-ready PFT labels alongside decision metadata that document classification rules, provenance, and the inputs that supported each assignment, enabling reuse across different PFT taxonomies, as well as sensitivity testing of alternative classification choices.

Building on the capabilities of the existing TRY categorical lookup table, this exercise has yielded a five-fold increase in the number of plant trait observations linked with JULES PFTs across the continent of Africa. Using these records, we derive PFT-level trait distributions for Africa and translate them into trait-informed ranges for critical JULES vegetation parameters. We quantify how these Africa-specific ranges differ from current global default PFT values. These constraints provide a practical route to more defensible parameter choices and more targeted sensitivity analyses. Together, the dataset and parameter summaries support improved integration of existing and future plant trait data into PFT parameterisations in land surface models and similar large scale modelling exercises, to enhance the representation of African ecosystems and better constrain the uncertainty when modelling global systems.

How to cite: Akhabue, E. F., Cunliffe, A. M., Bett-Williams, K., Harper, A. B., Holden, P., and Powell, T.: Addressing the underrepresentation of African ecosystems in plant traits, adaptation, and biogeochemical cycles: Mapping traits for model parameterisation, EGU General Assembly 2026, Vienna, Austria, 3–8 May 2026, EGU26-5302, https://doi.org/10.5194/egusphere-egu26-5302, 2026.

The search for predictors of plant diversity has challenged scientists for decades. The purpose of this study was to understand the relationship between plant species richness and solar radiation in global grasslands.

We collected standardized plant species richness and plant aboveground biomass data at 150 natural and semi-natural grasslands on six continents and analyzed them together with different measures of photosynthetically active radiation (PAR) and UV-B radiation derived from satellite data (with a temporal resolution of three hours covering several decades) as well as other environmental variables.

We identified PAR as a major factor constraining plant species richness in global grasslands. We show that the strength of the negative relationship between species richness and PAR increases with increasing elevation and that species richness is more strongly correlated with intense PAR than with UV-B radiation, climate variables, and atmospheric nitrogen deposition. In addition to species richness, plant biomass was also negatively correlated with PAR at higher elevations, indicating that intense PAR also constrains plant biomass in montane grasslands.

Furthermore, we show that the decrease in plant species richness with increasing PAR is mainly caused by a decrease in species richness of forbs, sedges, and rushes. In contrast, species richness of grasses was only negatively correlated with PAR at high elevations, and species richness of legumes was not significantly correlated with PAR. The reason why species richness of grasses was not correlated with PAR across all sites is likely that grasses are better adapted to high PAR than plants of other plant functional groups. The leaf area of grasses is negatively correlated with PAR globally, and grasses accumulate larger amounts of silicon than forbs, legumes, and rushes. Silicon forms silicate minerals, so-called phytoliths, in grass leaves, which play an important role in diffusing solar radiation inside the leaves before it hits the photosystems.

Our results suggest that PAR constrains plant species richness in global grasslands and limits the extent to which plant species of specific functional groups can migrate uphill in response to climate warming.


Reference

Spohn et al.:  Intense solar radiation constrains plant species richness in global grasslands. PNAS (in press).


How to cite: Spohn, M.: Intense solar radiation constrains plant species richness in global grasslands, EGU General Assembly 2026, Vienna, Austria, 3–8 May 2026, EGU26-5789, https://doi.org/10.5194/egusphere-egu26-5789, 2026.

EGU26-5894 | ECS | Orals | BG3.3

Seasonal drought leads to contrasting nonstructural carbohydrate dynamics but stable phenolic defense in tall-canopy and short-understory tropical trees 

Chenna Sun, Yajun Chen, Qinghai Song, Zexin Fan, Guorui Xu, Jie Yang, Yanqiang Jin, Shuxin Wang, Jonathan Gershenzon, David Herrera‐Ramírez, Christine Römermann, Susan Trumbore, and Jianbei Huang

Carbon allocation plays an important role in determining tree productivity and survival under environmental change. However, our understanding of how allocation patterns and their responses to drought vary among diverse functional types in tropical forests remains limited. In a tropical forest equipped with an 80-m canopy crane, we measured leaf gas exchange and water status, leaf nonstructural carbohydrates (NSCs) and phenolics, stem growth, and crown characteristics of mature trees from 18 species spanning different canopy positions, water-use and growth strategies during both the wet and dry seasons. The results show that tall canopy trees experienced stronger VPD and water stress and greater reductions in leaf gas exchange than short understory trees, leading to declines in NSCs (particularly starch) in canopy trees but increases in understory trees in the dry season. Despite changes in carbon supply, leaf phenolic levels remained remarkably stable across species, with species-specific variation explained by tree height and herbivory. With increasing height, both whole-tree leaf phenolics and NSCs increased whereas stem growth varied among canopy species. We highlight that canopy position–driven differences in resource availability and environmental stress are key for understanding and predicting carbon balance and allocation strategies in tropical forests experiencing seasonal droughts.

How to cite: Sun, C., Chen, Y., Song, Q., Fan, Z., Xu, G., Yang, J., Jin, Y., Wang, S., Gershenzon, J., Herrera‐Ramírez, D., Römermann, C., Trumbore, S., and Huang, J.: Seasonal drought leads to contrasting nonstructural carbohydrate dynamics but stable phenolic defense in tall-canopy and short-understory tropical trees, EGU General Assembly 2026, Vienna, Austria, 3–8 May 2026, EGU26-5894, https://doi.org/10.5194/egusphere-egu26-5894, 2026.

EGU26-6753 | ECS | Posters on site | BG3.3

Radiocarbon measurements of saprobiotic (wood-decomposing) fungi provide insights into the age distribution of decomposing wood 

Tamás Varga, Carlos A. Sierra, Angela Günther, David Herrera-Ramirez, and Susan Trumbore

Fungi are one of the key components in the terrestrial carbon cycle, performing a significant part of the decomposition process. Without them, the degradation of organic matter would be much slower and more limited. While fungi consume large amounts of C in forested ecosystems, quantifying how much this contributes to the overall decomposition-derived CO2 is difficult.  Here, we show that radiocarbon can be a useful tool both for understanding more about the activity of these fungal species and how they contribute to the transit time of C in forested ecosystems. Since the cessation of atmospheric nuclear testing, the declining level of atmospheric 14C has made it possible to date when carbon was fixed from the atmosphere with even annual precision (Hua et al., 2022). Atmospheric 14C is naturally incorporated into recent biological materials through photosynthesis, naturally labelling them and indicating how long-ago C in different tree organs and tissues was fixed.  Radiocarbon measurements have shown that some mycorrhizal fungal species use carbon that is quite recently fixed, while saprophytic fungi that mainly consume dead organic matter incorporate C fixed years to decades previously in their tissues (Hobbie et al., 2002).

For our studies, we selected saprobiotic, wood-decomposing fungi from forests in Thuringia, Germany. Our results using 14C analysis by accelerator mass spectrometry show that even when growing on living trees, these fungi use carbon fixed up to ~30 years ago to produce their fruiting bodies. Fungi sampled on dead trees can use carbon fixed on average <60 but > 40 years ago to create their fruiting bodies. For four selected trees, we compared the age of the trees estimated from tree rings with the mean radiocarbon age of xylophagous fungi. It was determined that the 14C age of the fungi was closely aligned with the mean age of the tree, thereby indicating a widespread infection within the tree prior to the formation of a fruiting body. These results provide information on the age and the physical location of C substrates used by wood-decomposing fungi and provide a tracer to indicate the importance of decades-old wood decomposition to the overall transit time of C in forested ecosystems.

References

Hobbie, E. A., Weber, N. S., Trappe, J. M., & Van Klinken, G. J. (2002). Using radiocarbon to determine the mycorrhizal status of fungi. New Phytologist, 156(1)

Hua, Q., Turnbull, J. C., Santos, G. M., Rakowski, A. Z., Ancapichún, S., De Pol-Holz, R., Hammer, S., Lehman, S. J., Levin, I., Miller, J. B., Palmer, J. G., & Turney, C. S. M. (2022). Atmospheric radiocarbon for the period 1950–2019. Radiocarbon

How to cite: Varga, T., Sierra, C. A., Günther, A., Herrera-Ramirez, D., and Trumbore, S.: Radiocarbon measurements of saprobiotic (wood-decomposing) fungi provide insights into the age distribution of decomposing wood, EGU General Assembly 2026, Vienna, Austria, 3–8 May 2026, EGU26-6753, https://doi.org/10.5194/egusphere-egu26-6753, 2026.

Phosphorus (P) is vital to plant growth and is involved in different leaf physiological processes. However, whether plants strategically allocate P among distinct functions across species and habitats remains unresolved. By synthesizing a global dataset of leaf P fractions across 252 species spanning 8 biomes, we employ a Bayesian phylogenetic Dirichlet framework to decode the rules of relative allocation of leaf P fractions across species and environments. We found that leaf P partitioning is highly phylogenetically structured but also significantly shaped by soil total P. Specifically, the proportions of nucleic acids and metabolites P increase, while phospholipids decrease with soil total P concentration, suggesting a trade-off in the investment between physiological metabolism and membrane structure. Furthermore, lower investment in phospholipids is consistently associated with both higher photosynthetic P-use efficiency and internal leaf P resorption, but balances differently in the investment in other fractions. Crucially, the relationships between leaf P allocation and leaf economic traits challenge the classic growth rate hypothesis, with species possessing conservative traits, such as higher leaf mass per area and lower nutrient concentration, generally showing higher proportional P investment in metabolically active biochemicals. Notably, the directional trade-off in leaf P partitioning appears to be ecologically effective only in evergreen species. These findings are central to understanding how plants adapt to P deficiency through efficient nutrient allocation, with further implications for crop breeding and biodiversity maintenance.

How to cite: Ao, G. and zhu, B.: Leaf phosphorus fractionation underlies the plant phosphorus niche and functional adaptation globally, EGU General Assembly 2026, Vienna, Austria, 3–8 May 2026, EGU26-7624, https://doi.org/10.5194/egusphere-egu26-7624, 2026.

EGU26-8162 | ECS | Orals | BG3.3

Safe Operating Regimes for Phloem Carbon Transport: A Bifurcation Framework 

Mazen Nakad, Louis Youssef, Jean-Christophe Domec, Sanna Sevanto, and Gabriel Katul

A mathematical framework is developed to quantify the stability of phloem transport and delineate “safe operating” regimes using bifurcation analysis. Sucrose production is linked to leaf photosynthesis using stomatal optimality, while sucrose translocation follows pressure-driven flow based on the Munch mechanism. The model couples xylem water potential, osmotic driving force, hydraulic resistance (using a sucrose-dependent viscosity), and distributed sink removal along the transport pathway. Systematic variation of key carbon transport controls, such as xylem water potential and sink strength, reveals multiple equilibria and stability boundaries beyond which phloem transport becomes unstable to small carbon loading fluctuations. Phloem failure emerges through a saddle-node bifurcation, yielding two stable sucrose loading states separated by an unstable branch where the lower equilibrium falls within reported sucrose loading ranges. The resulting stability maps provide a mechanistic basis for phloem vulnerability and suggest that vascular safety requires coordination between photosynthetic supply (e.g., $V_{c,max}$), pathway length, and transport capacity as water potential declines. This stability map provides a mechanistic constraint that can inform trait-based ecosystem modeling and provide hypotheses about acclimation and vulnerability across environments.

How to cite: Nakad, M., Youssef, L., Domec, J.-C., Sevanto, S., and Katul, G.: Safe Operating Regimes for Phloem Carbon Transport: A Bifurcation Framework, EGU General Assembly 2026, Vienna, Austria, 3–8 May 2026, EGU26-8162, https://doi.org/10.5194/egusphere-egu26-8162, 2026.

EGU26-8942 | Posters on site | BG3.3

TRY Plant Trait Database – the upcoming version and further development 

Jens Kattge, David Schellenberger Costa, Sandra Díaz, Sandra Lavorel, Iain Colin Prentice, Paul Leadley, and Christian Wirth

Plant traits - morphological, anatomical, biochemical, physiological, or phenological features measurable at the individual level (Violle et al., 2007) - connect species richness with ecosystem functional diversity. Focusing on traits and trait syndromes is seen as a promising foundation for a more quantitative and predictive approach to biodiversity, ecology, and global change science. Although plant traits have been compiled for many years, a comprehensive database has been lacking. In 2007, the IGBP and DIVERSITAS initiative ‘Refining Plant Functional Classifications’ asked the Max Planck Institute for Biogeochemistry to develop a global plant trait database to support biodiversity research, functional biogeography, and vegetation modelling. The initiative was named TRY. With contributions of several original datasets and the most extensive integrated datasets at the time, the TRY Database immediately achieved unprecedented data coverage (Kattge et al., 2011). Since 2015, dataset owners have been able to make datasets in TRY public, and since 2019, data in TRY are freely available by default under a CC-BY license (Kattge et al., 2020). Since then, the database has received around 40,000 requests - about 20 per day. In summary, TRY has become a central hub for plant trait data.

In the context of TRY, trait data are curated to some extent: taxonomy and trait names are consolidated; for continuous traits with over 1000 records, units are standardized, major errors are corrected, and flags for outliers and duplicates are added. Data are provided in a versioned format. The current version, TRY vs. 6.0, was released in 2022. It is based on 707 datasets and contains 15.4 million trait records for 2675 traits and 306,000 taxa - mostly species.  

The upcoming version, TRY vs. 7.0, is expected to be released in spring or summer 2026. It will be based on 907 datasets and include about 23.4 million trait records across 3317 traits. The presentation will focus on the upcoming version, providing details on the new coverage and outlining plans to further develop the TRY Database.

References:

Violle, C., Navas, M. L., Vile, D., Kazakou, E., Fortunel, C., Hummel, I., & Garnier, E. (2007). Let the concept of trait be functional! Oikos, 116(5), 882–892. https://doi.org/10.1111/j.2007.0030-1299.15559.x

Kattge, J., Díaz, S., Lavorel, S., Prentice, I.C., Leadley, P., Bönisch, G. et al. (2011) TRY – a global database of plant traits. Global Change Biology 17:2905–2935. https://doi.org/10.1111/j.1365-2486.2011.02451.x 

Kattge, J., Bönisch, G., Díaz, S., Lavorel, S., Prentice, I.C., Leadley, P. et al. (2020) TRY plant trait database – enhanced coverage and open access. Global Change Biology 26: 119– 188. https://doi.org/10.1111/gcb.14904

How to cite: Kattge, J., Schellenberger Costa, D., Díaz, S., Lavorel, S., Prentice, I. C., Leadley, P., and Wirth, C.: TRY Plant Trait Database – the upcoming version and further development, EGU General Assembly 2026, Vienna, Austria, 3–8 May 2026, EGU26-8942, https://doi.org/10.5194/egusphere-egu26-8942, 2026.

EGU26-9593 | ECS | Orals | BG3.3

Are diurnal stomatal dynamics governed by Cowan-Farquhar optimality principles? 

Pauline Seeburger and Stanislaus J. Schymanski

Despite the critical role of stomata in regulating plant water use (transpiration) and carbon uptake (assimilation) during diurnal fluctuations, current land surface models rely on plant functional type-specific parameterization of stomatal conductance (gsw) that often struggles to reproduce observed stomatal dynamics. In particular, most established models ignore potential feedback between stomatal conductance and the within-canopy air space: an increase in gsw humidifies and cools the air surrounding the leaf, and decreases the vapor pressure deficit of the leaf (VPDleaf), which can further increase gsw. This creates a positive feedback loop that complicates distinguishing whether stomatal dynamics are a simple response to environmental variations (e.g. VPDair or light intensity) or a result of stomatal optimization in the presence of leaf-air feedback. A thorough understanding of these processes is crucial for modeling water and carbon fluxes under changing environmental conditions.

We measured continuous in situ gas exchange from individual leaves of wheat (Triticum aestivum) during multiple diurnal cycles under natural fluctuations of VPDleaf and light intensity driven by cloud cover. By adjusting chamber air exchange rate, we manipulated the strength of the experimental leaf-airfeedback, given that a low exchange rate makes the air inside the measurement cuvette more sensitive to leaf heat and gas exchange. Diurnal variations in gsw spanned an order of magnitude multiple times during the day, demonstrating the responsiveness of gsw to fluctuating environmental conditions and feedback strengths.

The stomatal optimality principle of Cowan and Farquhar (1977) predicts that gsw adjusts dynamically to environmental conditions to maximize the time-integral of carbon gain under constrained water availability by maintaining a constant marginal water cost (∂E) per carbon uptake (∂A) (λ = ∂E/∂A). According to the theory, the operational slope λ is constant among leaves of the same plant and responds only to soil moisture (θ). By measuring E and A simultaneously and calculating λ at stable light conditions (≥ 5 min), we test, in both laboratory and field studies, whether the operational slope λ converges to a similar value among leaves of the same plants, remains constant throughout a day and declines with reduced θ.

If λ proves to be stable between leaves of the same plant while responding to θ, an empirical relation between λ and θ within the root zone could serve as a powerful trait for predicting stomatal dynamics in wheat plants. It remains to be assessed how λ(θ), and therefore optimality principles, vary among cultivars and generations, whether it is equally useful for other species, and whether it is conserved under environmental change. The new method of measuring leaf-scale λ presented here opens the path to such studies.

How to cite: Seeburger, P. and Schymanski, S. J.: Are diurnal stomatal dynamics governed by Cowan-Farquhar optimality principles?, EGU General Assembly 2026, Vienna, Austria, 3–8 May 2026, EGU26-9593, https://doi.org/10.5194/egusphere-egu26-9593, 2026.

EGU26-10247 | ECS | Posters on site | BG3.3

Mapping plant traits on the Tibetan Plateau: towards a robust upscaling framework for diverse vegetation landscapes 

Yili Jin, Jens Kattge, Nuno Carvalhais, Kai Li, and Jian Ni

Upscaling traits from plant-level measurements to grid-scale predictions is crucial for accounting for biodiversity when simulating and predicting the impacts of climate change and human activities on ecosystems at large scales. However, current trait upscaling frameworks face limitations, particularly the scarcity of trait observations. Based on a dense sampling strategy on the Tibetan Plateau, this study aims to develop a robust upscaling framework that (1) provides reliable trait predictions for this region and (2) enables analysis of how sampling density affects trait prediction.

The Tibetan Plateau, known as the Roof of the World with an average elevation above 4,000 m, supports diverse zonal vegetation, both horizontally and vertically. This significant environmental and vegetation heterogeneity, combined with sparse in situ trait measurements, currently leads to high prediction uncertainty in existing global and Chinese trait maps for this region, limiting their ecological accuracy for spatial scaling on the Tibetan Plateau.

Our approach toward a more robust trait upscaling includes: 1) performing standardized trait measurements on 3,961 species-level leaf samples and 504 site-level fine root samples collected from 650 sites between 2018 and 2024, covering 12 morphological and chemical traits; 2) constructing predictor sets that include bioclimate, soil, topography, and vegetation indices; 3) training machine learning models (such as random forest, boosted regression trees, and generalized additive models), using cross-validation to evaluate performance and select optimal parameters for each trait; 4) refining plant functional type (PFT) based on regional vegetation characteristics and aligning them with a detailed 10 m resolution land cover map of the Tibetan Plateau; 5) predicting traits for each PFT and aggregating them into grid-level values using PFT abundance weighting; and 6) generating a suite of 1 km resolution trait maps. We expect this work to establish a reproducible methodological framework for trait upscaling in heterogeneous landscapes, yielding more reliable trait maps for the Tibetan Plateau and providing further insight into how sampling density influences trait upscaling.

How to cite: Jin, Y., Kattge, J., Carvalhais, N., Li, K., and Ni, J.: Mapping plant traits on the Tibetan Plateau: towards a robust upscaling framework for diverse vegetation landscapes, EGU General Assembly 2026, Vienna, Austria, 3–8 May 2026, EGU26-10247, https://doi.org/10.5194/egusphere-egu26-10247, 2026.

EGU26-11831 | ECS | Posters on site | BG3.3 | Highlight

Can trait plasticity across a pedo-climatic gradient predict future-climate suitability in non-native tree species? 

Ginevra Fabiani, Yann Vitasse, Eliot Perrin, Pierre Vollenweider, Jonas Glatthorn, Nico Frischbier, Norbert Wimmer, and Petra D'Odorico

Phenotypic plasticity describes the ability of a species to adjust its phenotype in response to environmental variation. While functional trait plasticity is well documented for several native European tree species (e.g., Fagus sylvatica, Quercus petraea), much less is known about the capacity of non-native species to adjust to contrasting pedo-climatic conditions. This knowledge gap is increasingly relevant because species originating from drought-prone regions are receiving growing attention as potential candidates for assisted migration strategies aimed at mitigating climate-change impacts on forests.

To evaluate trait plasticity and drought tolerance in non-native tree species, we take advantage of a multi-site plantation established in 2012 along a hydroclimatic gradient spanning Switzerland and Germany. For each species, individuals from the same source population were planted after 2–3 years of nursery growth at each site in a randomized block design. The study sites differ strongly in long-term precipitation (1984–2024), with the Swiss site Mutrux being the wettest (MUT, 1324 mm), followed by the German sites Schmellenhof (SCH, 750 mm), Grossostheim (GRO, 635 mm) and Oldisleben (OLD, 481 mm). In addition, sites vary in subsurface properties and soil texture, which ultimately modulate plant-available water.

Across 2024 and 2025, we monitored key meteorological variables (air temperature, precipitation, relative humidity and photosynthetically active radiation), soil water potential and soil temperature, and we used phenocams to assess the timing of phenological events over the growing season. In summer 2024, we sampled branches from five non-native species (Tilia tomentosa, Fagus orientalis, Abies bornmuelleriana, Cedrus libani and Tsuga heterophylla) and a native reference species (Quercus robur in GRO and SCH, and Quercus petraea in MUT and OLD). We assessed predawn leaf/needle water potential and collected vegetative material to examine the hydraulic, morphological and anatomical properties of photosynthetic organs. In summer 2025, we revisited the same individuals to determine the turgor loss point (TLP) of leaves and needles as a functional proxy for drought tolerance. We also use tree growth (diameter and height) and vitality inventories as traditional indicators of species performance.

We hypothesize that species showing greater trait plasticity across sites represent better candidates for assisted migration, as they may display higher adaptive potential to local pedo-climatic conditions.

How to cite: Fabiani, G., Vitasse, Y., Perrin, E., Vollenweider, P., Glatthorn, J., Frischbier, N., Wimmer, N., and D'Odorico, P.: Can trait plasticity across a pedo-climatic gradient predict future-climate suitability in non-native tree species?, EGU General Assembly 2026, Vienna, Austria, 3–8 May 2026, EGU26-11831, https://doi.org/10.5194/egusphere-egu26-11831, 2026.

EGU26-12589 | Orals | BG3.3

CO₂- or water-limited? Plant trait and physiological responses to reduced atmospheric pressure 

Georg Niedrist, Silvia Lembo, Marta De Giuli, Bouchra El Omari, Nadine Präg, Paul Illmer, Dolores Asensio, and Matteo Dainese

Climate induced upslope migration of alpine plants is accompanied by a decline in atmospheric pressure, raising the question of whether plant performance at higher elevations is constrained by carbon availability and/or by water-related stress. Decreasing air pressure alters gas diffusivity, evaporative demand, and the partial pressure of CO₂, potentially shifting limitation from carbon acquisition towards plant water relations. However, in the field the impact of reduced air pressure is hardly to detect because it covaries with temperature, humidity, and radiation along natural elevational gradients.

We thus addressed this question using ecotron experiments that isolate air-pressure effects from co-varying climatic factors. Mountain grassland species and model plants with contrasting functional strategies (Arabidopsis thaliana, Trifolium pratense, Hieracium pilosella, Brachypodium rupestre) were grown under atmospheric pressures corresponding to ~1,500–4,000 m a.s.l. (85–62 kPa), while temperature, radiation and air humidity were kept equal among the treatments. We quantified traits related to gas exchange (stomatal conductance, carbon isotope discrimination), carbon acquisition and allocation (photosynthetic efficiency, carbohydrate storage, biomass production), and nutrient status (leaf nitrogen and chlorophyll).

Across species, reduced air pressure consistently lead towards higher photosynthetic energy-use efficiency and increased leaf carbohydrate pools (up to +40%), while aboveground biomass decreased. Gas-exchange revealed species-specific strategies: stomatal conductance increased or remained stable under low pressure in forb species, whereas grass responses depended on interactions with water availability. After 4 weeks results indicated a decreased carbon assimilation efficiency under low air pressure and a higher vulnerability to drought because of the higher Vapour-pressure deficit (VPD)

These short- term results suggest that reduced air pressure is a relevant parameter for upwards-migrating mountain plants and may play an underestimated role in shaping composition and performance of alpine ecosystems.

How to cite: Niedrist, G., Lembo, S., De Giuli, M., El Omari, B., Präg, N., Illmer, P., Asensio, D., and Dainese, M.: CO₂- or water-limited? Plant trait and physiological responses to reduced atmospheric pressure, EGU General Assembly 2026, Vienna, Austria, 3–8 May 2026, EGU26-12589, https://doi.org/10.5194/egusphere-egu26-12589, 2026.

EGU26-13058 | Posters on site | BG3.3

Comparing approaches for fast estimation of photosynthesis parameters 

Benjamin Dechant

The maximum carboxylation rate (Vcmax) and maximum electron transport rate (Jmax) are key parameters characterizing the photosynthetic performance of plants. To inform modelling efforts and improve our understanding of spatiotemporal variations of these key plant traits, it is important to increase measurement efforts. However, measuring these parameters is challenging due to the expensive gas exchange equipment involved as well as the time needed for the response curve measurements. While there have been recent advances in faster measurement/estimation protocols such as the one-point method and other estimation approaches based on spectral reflectance measurements, direct comparisons of these approaches have not been reported. Furthermore, there appears to be untapped potential using chlorophyll fluorescence-based approaches. Key aspects for comparing methods beyond the accuracy of estimation include the speed and cost of measurement instruments.

Here, we evaluate and compare approaches based on gas exchange, chlorophyll fluorescence and spectral reflectance measurements for estimating Vcmax and Jmax parameters using data from 37 broadleaf tree species grown in an arboretum. We found that active chlorophyll fluorescence had the best performance for Jmax, while for Vcmax, single point gas exchange measurements could be used in ways that considerably improve over the one-point method. The spectral reflectance-based approach had comparable performance as the conventional one-point method.

How to cite: Dechant, B.: Comparing approaches for fast estimation of photosynthesis parameters, EGU General Assembly 2026, Vienna, Austria, 3–8 May 2026, EGU26-13058, https://doi.org/10.5194/egusphere-egu26-13058, 2026.

EGU26-13934 | ECS | Orals | BG3.3

Ecosystem-scale crassulacean acid metabolism (CAM) gas exchange of a sisal (Agave sisalana) plantation 

Angelika Kübert, Kukka-Maria Kohonen, Annalea Lohila, Lutz Merbold, Matti Räsänen, Mikko Skogberg, Ilja Vuorinne, Petri Pellikka, and Timo Vesala

Plants using crassulacean acid metabolism (CAM) for photosynthesis are adapted to dry conditions by taking up carbon at night. Gas exchange measurements of CAM plants at the ecosystem level are rare, with only a few studies to date reporting CO2 exchange using the eddy covariance (EC) method. We monitored the ecosystem CO2 exchange of Agave sisalana using the EC method in an agricultural field in semi-arid Kenya over 65 days, starting in a wet period that gradually transitioned to a dry period. High productivity occurred during the wet period, with a mean net CO2 uptake of −1.1 µmol m⁻² s⁻¹ (dry period: +0.3 µmol m⁻² s⁻¹). This was linked to significant day- and nighttime CO2 uptake, indicating direct CO2 fixation via the C3 photosynthetic pathway during daytime. As soil moisture decreased, mean daytime net CO2 exchange increased considerably, from +1.0 to +4.0 µmol m⁻² s⁻¹, suggesting a shift towards strict CAM photosynthesis in response to soil drying. Our results demonstrate the high photosynthetic plasticity of A. sisalana with changing soil moisture and its significance for ecosystem-scale CO2 fluxes.

How to cite: Kübert, A., Kohonen, K.-M., Lohila, A., Merbold, L., Räsänen, M., Skogberg, M., Vuorinne, I., Pellikka, P., and Vesala, T.: Ecosystem-scale crassulacean acid metabolism (CAM) gas exchange of a sisal (Agave sisalana) plantation, EGU General Assembly 2026, Vienna, Austria, 3–8 May 2026, EGU26-13934, https://doi.org/10.5194/egusphere-egu26-13934, 2026.

EGU26-14248 | Posters on site | BG3.3

On the relationship between root economics and plant hydraulic traits 

Anvar Sanaei, Srijna Saxena, Kevin E. Mueller, M. Luke McCormack, Bernhard Schuldt, Daniel C. Laughlin, Bruno HP Rosado, Gregoire T. Freschet, Shalom D. Addo-Danso, Kathryn E. Barry, Joana Bergmann, Nico Eisenhauer, Jaeger Florentin Clemens, Hendrik Poorter, Harry Olde Venterink, Jorad De Vries, Monique Weemstra, Liesje Mommer, and Alexandra Weigelt and the Anvar Sanaei, anvar.sanaei@uni-leipzig.de

Drought stress constrains the productivity of terrestrial ecosystems and distribution of plant species. To withstand drought stress, plants have evolved a wide range of water-use strategies. Despite the critical function of roots in whole-plant water regulations, drought strategies have been primarily studied from an aboveground perspective. Our knowledge of how fine-root traits are related to aboveground hydraulic traits remains limited. Here, we compiled a global dataset comprising five aboveground plant hydraulic traits (the xylem water potential at 50% loss of hydraulic conductivity [P50], the water potential at turgor loss point [πtlp], maximum xylem conductivity per unit sapwood area [Ks], the leaf-to-sapwood area ratio [Al:As], and wood density [WD]) associated with water-use strategies and the four fine-root traits from the root economics space (mean root diameter [MRD], specific root length [SRL], root tissue density [SRL], and root nitrogen concentration [RN]). We then investigated how and to what extent the global diversity in ecological strategies of four root economics space traits relate to aboveground hydraulic traits contributing to drought resistance. We found a slight trend towards acquisitive woody species with higher RNC and lower RTD having lower drought resistance in aboveground tissues (less negative P50 and πtlp and higher Ks and Al:As). Outsourcing woody species with thicker roots displayed a tendency towards slightly higher drought resistance (more negative P50 and πtlp and higher Ks and Al:As) than thin-rooted woody species. The weakness of these relationships highlights that aboveground plant adaptations to drought might be largely independent from classical axes of fine root ecological strategies. This could indicate a decoupling between above- and belowground strategies of drought adaptations, or that other root traits could provide more efficient adaptations to drought stress and be more strongly coordinated with aboveground hydraulics.

How to cite: Sanaei, A., Saxena, S., Mueller, K. E., McCormack, M. L., Schuldt, B., Laughlin, D. C., Rosado, B. H., Freschet, G. T., Addo-Danso, S. D., Barry, K. E., Bergmann, J., Eisenhauer, N., Florentin Clemens, J., Poorter, H., Olde Venterink, H., De Vries, J., Weemstra, M., Mommer, L., and Weigelt, A. and the Anvar Sanaei, anvar.sanaei@uni-leipzig.de: On the relationship between root economics and plant hydraulic traits, EGU General Assembly 2026, Vienna, Austria, 3–8 May 2026, EGU26-14248, https://doi.org/10.5194/egusphere-egu26-14248, 2026.

EGU26-14444 | ECS | Orals | BG3.3

Adaptability of self-rooted and grafted Vitis vinifera cv. Fortana to marginal sandy soils in coastal Emilia-Romagna (Italy) 

Matteo Ballestriero, Elena Marrocchino, Luigi Sansone, Roberto Carraro, Paola Tedeschi, and Lorenzo Ferroni

Eurasian grapevine (Vitis vinifera L.) is one of the fruit crops affected by the ongoing climate change, which is characterized by an increased frequency of heat waves and drought events. In most viticultural areas, V. vinifera is cultivated grafted onto American rootstocks resistant to phylloxera. Only rare grapevine varieties are still cultivated ungrafted, typically in soils inhospitable to this pest and generally considered marginal for agriculture. Historic ungrafted grapevines could be a valuable genetic resource to face the climate change. On the sandy coast of Emilia-Romagna region (Italy), “Fortana” is one such variety, cultivated either self-rooted or grafted, and described as resistant to drought by local farmers. In this environment, the grafting is not necessary for plants to resist phylloxera, but could lead to some other advantages, e.g., related to the water balance.

This study aims to verify whether grafting Fortana vines in a mature vineyard has brought physiological advantages compared to self-rooting. The study took place in July 2025 in a coastal vineyard in the Ferrara province (Italy) comprising both ungrafted and grafted plants (up to 50 years old) grown without artificial irrigation. Ampelographic observations and molecular analyses (SSR) confirmed the identity of Fortana and identified the rootstock as “Kober 5BB”, known for its good adaptability to sandy soils and moderate drought tolerance. Fast chlorophyll a fluorescence was measured using a Handy-PEA fluorometer, gas exchange was assessed with a CIRAS2 Portable Photosynthesis System, and stem water potential (ψstem) was determined with a Scholander pressure chamber. Fluorometric and gas exchange determinations were performed in the morning, at midday and in the afternoon to detect possible differences in photosystem II (PSII) photoinhibition and water stress during the day.

Fluorometric analyses revealed that all plants experienced a slight degree of daily photoinhibition, although the grafted performed slightly better than the self-rooted. Gas exchange showed pronounced diurnal variations, with decreasing stomatal conductance (gs) and net photosynthesis (Pn), but without major differences between grafted and ungrafted plants. The ψstem was stable all day long, with values indicating a slight water stress in all plants. The results suggest that grafting Fortana plants could have led to a negligible benefit compared to self-rooted, unless their tendency to be less susceptible to photoinhibition may have a cumulative effect that finally results biologically relevant. To investigate more deeply such aspect, integrated information on the plant performance has been planned using carbon and nitrogen isotopic analyses of mature grapevine canes, which will be related to reference values in soil.

Acknowledgements

This research was funded by the Ministry of Research of Italy through the project PRIN2022 « Soil, water, sun: Exploring Ungrafted indigenous Italian Vitis vinifera L. varieties as a resilient resource against the effects of global climate change (EU-vitis) » (CUP F53C2400120).
  • 1Department of Environmental and Prevention Sciences, University of Ferrara, Ferrara, Italy (bllmtt2@unife.it)
  • 2Council of Agricultural Research and Economics, Research Centre for Viticulture and Enology, Conegliano (Treviso), Italy
  • 3Department of Chemical, Pharmaceutical and Agricultural Sciences, University of Ferrara, Ferrara, Italy

How to cite: Ballestriero, M., Marrocchino, E., Sansone, L., Carraro, R., Tedeschi, P., and Ferroni, L.: Adaptability of self-rooted and grafted Vitis vinifera cv. Fortana to marginal sandy soils in coastal Emilia-Romagna (Italy), EGU General Assembly 2026, Vienna, Austria, 3–8 May 2026, EGU26-14444, https://doi.org/10.5194/egusphere-egu26-14444, 2026.

EGU26-14796 | ECS | Orals | BG3.3

Linking leaf area index measurements across scales from smartphone LiDAR to multi-source remote sensing observations.   

Shunan Feng, Simon Nyboe Laursen, Federico Grillini, and Andreas Westergaard-Nielsen

Leaf Area Index (LAI) is a fundamental biophysical parameter for land surface process models and remote sensing applications. Accurate quantification of leaf area and biomass is essential for understanding vegetation's role in the regional carbon balance and for models simulating biogeochemical processes. Remote sensing data have been widely used in long term and large-scale LAI estimations but the critical ground truth for developing and validating LAI estimations remains challenging especially in remote areas such as Arctic regions.   

This study evaluates the efficacy of low-cost proximity sensing with consumer-grade smart phone LiDAR and structure-from –motion (SfM)  sampling method to derive high resolution 3D plant modelsin Kobbefjord, Greenland. These innovative ground-based datasets were compared against manual in situ LAI measurements to assess their accuracy in tundra ecosystems. We further integrated these high-resolution point clouds into a multi-tiered, data-driven framework, upscaling the measurements through UAV (drone) imagery to satellite observations. This multi-scale approach enhances our ability to e.g. monitor rapid Arctic greening and improves the precision of biophysical inputs for climate and emission models. 

How to cite: Feng, S., Laursen, S. N., Grillini, F., and Westergaard-Nielsen, A.: Linking leaf area index measurements across scales from smartphone LiDAR to multi-source remote sensing observations.  , EGU General Assembly 2026, Vienna, Austria, 3–8 May 2026, EGU26-14796, https://doi.org/10.5194/egusphere-egu26-14796, 2026.

EGU26-14885 | ECS | Orals | BG3.3

Integrating Hyperspectral, LiDAR, and Radiative Transfer Modeling to Predict Forest GPP 

Zachary Butterfield, Kyla Dahlin, Meicheng Shen, Aaron Kamoske, Scott Stark, Shawn Serbin, Chris Gough, and Hideki Kobayashi

Understanding forest carbon fluxes is crucial for monitoring and predicting the global carbon cycle and climate-carbon interactions. Plant physiological and structural traits (PSTs) strongly influence canopy-light interactions and, in turn, forest productivity. Hyperspectral and LiDAR observations from the US National Ecological Observatory Network’s Airborne Observation Platform (NEON AOP) enable the mapping of three-dimensional (3D) spatial variability of PSTs across observed sites. PSTs (e.g. leaf nitrogen, leaf mass area, leaf area density, woody area density) determine the optical and geometric characteristics of the canopy and have a nontrivial relationship with the distribution of photosynthetically active radiation (PAR) within the canopy, the magnitude and distribution of absorbed PAR (APAR), and the influence of the diffuse PAR fraction. Therefore, linking mapped traits to total APAR and gross primary productivity (GPP) requires the modelling of within-canopy radiative transfer as well as ecosystem function. With 3D PST estimates derived from NEON AOP data alongside measurements of PAR from the AmeriFlux network, we used the Forest Light Environmental Simulator (FLiES) to model APAR in two North American deciduous broadleaf forest sites at the University of Michigan Biological Station in the northern Lower Peninsula of Michigan (US-UMB, US-UMd) with a 30-minute temporal resolution over two months centered on the NEON AOP flight period. We then trained a random forest (RF) model using AmeriFlux daytime-partitioned (DT) eddy covariance estimates of GPP, modelled APAR, and meteorological and solar data. Our results show that our RF model reliably reproduces DT GPP (R2 > 0.8) and that FLiES-derived APAR is a key predictor of GPP. Lastly, we explore how the vertical and diurnal distributions of APAR vary with canopy structural differences, and how these structural differences relate to disturbance history.

How to cite: Butterfield, Z., Dahlin, K., Shen, M., Kamoske, A., Stark, S., Serbin, S., Gough, C., and Kobayashi, H.: Integrating Hyperspectral, LiDAR, and Radiative Transfer Modeling to Predict Forest GPP, EGU General Assembly 2026, Vienna, Austria, 3–8 May 2026, EGU26-14885, https://doi.org/10.5194/egusphere-egu26-14885, 2026.

EGU26-15425 | ECS | Orals | BG3.3

Linking Plant Trait Variability to Biogeochemical Cycling in High-Latitude Heathlands 

Sonya Geange, Kristine Birkeli, Marine Dange, Hilary Rose Dawson, Victoria Haaversen Møllerbaug, Mika Kirkhus, Akuonani Phiri, Jeanne Rezsöhazy, Bente Sagabraaten, Maria Steinli, Inge Althuizen, Dagmar Egelkraut, Aud Halbritter, and Vigdis Vandvik

In many high-latitude ecosystems, ericaceous dwarf-shrubs play a dominant role influencing patterns of biodiversity and driving ecosystem functioning. Despite this importance, dwarf-shrubs are underrepresented when modelling how vegetation influences fluxes of carbon, water and energy in land surface models. To create new plant functional types that better represent these important species and processes, we use plant functional traits to explore responses and effects to environmental and biotic interactions. While current land surface models rely on fixed trait parameters, understanding the range and drivers of intraspecific variation is essential for selecting representative values and improving predictions of biogeochemical fluxes. In the DURIN project, we examine intraspecific variability in plant functional traits focusing on the dwarf shrubs Calluna vulgaris, Empentrum nigrum, Vaccinium myrtillus and Vaccinium vitis-idaea which represent both evergreen and deciduous species and a range of the leaf economics spectrum. These keystone species were sampled in paired forested and open heathlands located at coastal and inland sites distributed in southern and northern Norway. Here we found high levels of intraspecific variation across our species, with more conservative trait expression typically exhibited in open habitats, inland and northern sites. Next we seek to investigate how these shifts in trait variation may influence carbon cycling via in-situ assessments of leaf-level thermal tolerance limits for photosynthesis and a litter transplant experiment to understand rates of litter decomposition. Developing these integrated understandings of how leaf traits influence the broader biogeochemical cycle at both local and regional scales, will provide critical insights into not only the adaptive potential of these key species, but also provide more robust parameters for inclusion in land surface models improving our vegetation-climate predictions under ongoing global change.  

How to cite: Geange, S., Birkeli, K., Dange, M., Dawson, H. R., Haaversen Møllerbaug, V., Kirkhus, M., Phiri, A., Rezsöhazy, J., Sagabraaten, B., Steinli, M., Althuizen, I., Egelkraut, D., Halbritter, A., and Vandvik, V.: Linking Plant Trait Variability to Biogeochemical Cycling in High-Latitude Heathlands, EGU General Assembly 2026, Vienna, Austria, 3–8 May 2026, EGU26-15425, https://doi.org/10.5194/egusphere-egu26-15425, 2026.

EGU26-16246 | ECS | Posters on site | BG3.3

Advancing grassland process representation in the dynamic vegetation model LPJ-GUESS to evaluate management impacts 

Anna-Kristina Voss, Stefan Olin, David Wårlind, Torbern Tagesson, Jürgen Knauer, and Jonas Ardö

Grassland ecosystems dominated by herbaceous plants provide essential ecosystem services, most prominently food provision, and play a key role in the global carbon cycle and in sustaining biodiversity. They are therefore central to both human well-being, and Earth system functioning. Despite their ecological importance, grassland ecosystems and herbaceous species are insufficiently represented in dynamic global vegetation models, limiting our ability to project their responses to climate and land-use change. For example, a realistic representation of phenology of grassland ecosystems is needed for analysing management practices including grazing, cutting and ploughing. However, many vegetation models lack key grass-specific processes that determine vegetation persistence and regrowth both in unmanaged and managed grasslands. As a consequence, it remains difficult to analyse feedbacks between grassland vegetation, soils and the atmosphere and the effect management has on them.

   In this study, we address these limitations by advancing the representation of herbaceous species in the dynamic global vegetation model LPJ-GUESS. We implemented a daily carbon allocation scheme, grass-specific traits for i.e. allometry and life-cycle dynamics to better capture growth and seasonal development of grassland vegetation. Model performance was assessed using European grassland FLUXNET sites. We evaluated the effects of the new model representation on biomass accumulation, carbon stocks and fluxes, both in absence of management and under different management scenarios.  These developments allow for a more mechanistic simulation of grassland responses to different management regimes.

How to cite: Voss, A.-K., Olin, S., Wårlind, D., Tagesson, T., Knauer, J., and Ardö, J.: Advancing grassland process representation in the dynamic vegetation model LPJ-GUESS to evaluate management impacts, EGU General Assembly 2026, Vienna, Austria, 3–8 May 2026, EGU26-16246, https://doi.org/10.5194/egusphere-egu26-16246, 2026.

Leaf Chlorophyll Content (LCC) is an important proxy for photosynthetic capacity. Despite a large body of literature on the LCC estimation, how and why changes in foliar structure influence LCC estimation remain uncertain. This uncertainty is particularly relevant for crops, in which foliar structure undergoes distinct transitions across growth stages.  As a result, the dynamics of the vegetative stage and the stability of the reproductive stage might cause different performances of LCC estimation approaches. To address this issue, here we aim to understand the impact of the crop growth phase on the LCC estimation performance and underlying mechanisms. We measured hyperspectral reflectance data and collected chlorophyll content destructively from the Seoul National University’s experiment farm in Suwon, South Korea. Using the dataset, we tested empirical, statistical, physical, and machine learning-based approaches for estimating rice LCC throughout the season from emergence to maturity. Our preliminary findings revealed that the estimation in the post-heading (i.e., reproductive) phase outperforms the pre-heading (i.e., vegetative) phase in all approaches. We further examine the mechanisms responsible for this phase-dependent performance difference and discuss strategies to achieve more robust LCC estimation. This study highlights the importance of understanding crop phenological dynamics in LCC estimation and will contribute to the improved monitoring of crop productivity as well as crop growth modeling.


This work was supported by NRF, SNU Creative Pioneering Research, KEITI, LS Mtron.

How to cite: Ryu, S., Park, H., and Kimm, H.: Impacts of Phenological Dynamics on the Estimation of Leaf-scale Chlorophyll Content in Rice Using Hyperspectral Spectroscopy, EGU General Assembly 2026, Vienna, Austria, 3–8 May 2026, EGU26-16583, https://doi.org/10.5194/egusphere-egu26-16583, 2026.

EGU26-16975 | Posters on site | BG3.3

Attributing Global Carbon and Water Cycle Trends Using Factorial Ecosystem Simulations 

Ananda Kurth, Francesco Grossi, Fabian Bernhard, and Benjamin David Stocker

Satellite observations show widespread vegetation greening over the last few decades, which is partially due to intensified agricultural activity, longer growing seasons, and the CO₂ fertilization effect (Zhu et al., 2016). At the same time, changes in drought and heat stress show a strong spatial heterogeneity, which complicates the attribution of observed trends in the carbon and water cycles (Greve et al., 2014). To better understand these apparently contrasting signals, we calculate trends in variables affected by water-stress dynamics and assess how trends in greenness, climate, and CO₂ influence these patterns.
To analyze these coupled processes and disentangle the effects of individual forcing variables on simulated ecosystem responses, we perform global simulations using a version of the P-model that is coupled with a Penman-Monteith evapotranspiration scheme, thereby explicitly representing coupled carbon-water processes at the land surface (Stocker et al., 2020). The model is driven by a satellite-derived, natural-vegetation-only fAPAR dataset. Within these simulations (1982 - 2024 at 0.5° spatial resolution), transpiration is separated from soil evaporation; a fixed leaf area index is used, and carbon pool dynamics are omitted. A factorial design is utilized, in which one factor (greenness, climate, or CO₂) is held constant at a time to identify the primary drivers of change. These simulations address our research question of which drivers, including CO₂, Vapor Pressure Deficit (VPD), precipitation, and Fraction of Absorbed Photosynthetically Active Radiation (fAPAR), contribute to changes in variables that are likely to respond differently to drought trends, such as gross primary productivity (GPP), evapotranspiration (ET), soil moisture, runoff, and water-use efficiency of photosynthesis.
This study provides a consistent quantification of trends across multiple interrelated variables associated with global water and carbon cycling and clarifies the mechanistic basis for apparently contrasting trends reported for individual variables. 

Sources 

Zhu, Z. et al. (2016) “Greening of the Earth and its drivers,” Nature Climate Change, 6(8), pp. 791–795. doi: 10.1038/nclimate3004.
Greve, P. et al. (2014) “Global assessment of trends in wetting and drying over land,” Nature Geoscience, 7(10), pp. 716–721. doi: 10.1038/ngeo2247.
Stocker, B. D. et al. (2020) “P-model v1.0: an optimality-based light use efficiency model for simulating ecosystem gross primary production,” Geoscientific Model Development, 13(3), pp. 1545–1581. doi: 10.5194/gmd-13-1545-2020. 

How to cite: Kurth, A., Grossi, F., Bernhard, F., and Stocker, B. D.: Attributing Global Carbon and Water Cycle Trends Using Factorial Ecosystem Simulations, EGU General Assembly 2026, Vienna, Austria, 3–8 May 2026, EGU26-16975, https://doi.org/10.5194/egusphere-egu26-16975, 2026.

EGU26-17102 | ECS | Posters on site | BG3.3

Inter- and Intraspecific Acclimation of Hydraulic Functions to Low Temperature in Temperate Tree Species 

Yating Li, Eryuan Liang, and Guenter Hoch

Low temperature is one of the main factors affecting plant growth and propagation, and determining species-specific high elevation and high latitudinal limits of temperate trees. Chilling generally refers to low but nonfreezing temperatures, ranging from 0°C to 15°C, that negatively impact biological processes. While our understanding of the direct cold temperature induced restrictions of cambial and meristematic activity has increased substantially over the last decades, other physiological effects that might also contribute to the cold temperature limit of tree growth have gained much less attention so far. Especially, the potential effects of restricted water uptake and deteriorated hydraulic relations at low root zone temperatures might be additional drivers for the cold limit of tree growth. To explore how low temperatures limit growth by restricting root hydraulic conductance in temperate trees, we applied 2H‐H2O pulse‐labelling to quantify the water uptake and transport velocity from roots to leaves in seedlings exposed to constant 15°C, 7°C or 2°C root temperature, but identical aboveground temperatures between 20°C and 25°C in greenhouse. This study aimed to specifically explore (1) if hydraulic constrains induced by low root temperatures can be a cause for the species-specific elevational distribution limits of European temperate tree species; (2) if physiological adjustments of root water uptake in response to a short-term low root temperature stress of up to 20 days can be identified in different functional plant types; and (3) if there is a potential for cold acclimation of root water uptake in tree seedlings that acclimated at cold and warm conditions. This study firstly highlighted low temperature‐induced hydraulic constraints contribute to the cold distribution limits of temperate tree species and are a potential physiological cause behind the low temperature limits of plant growth in general. We additionally confirmed the accumulation of cold effects on water permeability of cell membrane in roots, or a controlled reduction of root water conductivity would be a potentially physiological reason causing winter dormancy in temperate trees. We finally revealed that lower montane temperate tree species possess a greater capacity to acclimate to long-term cold acclimation, potentially enabling them to migrate to higher elevations through improved cold sensitivity of root hydraulic conductance while lacking in upper montane species. This study largely concur with the existing concepts of the biological mechanisms responsible for the cold‐temperature limits of temperate trees.

How to cite: Li, Y., Liang, E., and Hoch, G.: Inter- and Intraspecific Acclimation of Hydraulic Functions to Low Temperature in Temperate Tree Species, EGU General Assembly 2026, Vienna, Austria, 3–8 May 2026, EGU26-17102, https://doi.org/10.5194/egusphere-egu26-17102, 2026.

EGU26-17553 | Posters on site | BG3.3

Identifying heatwave resilient genotype-rootstock combinations in pear orchards through integrated soil and physiological analyses 

Lorenzo Ferroni, Marcello Bigoni, Irene Viola, Marzio Zaccarini, Andrea Farinelli, and Elena Marrocchino

Italy leads the production of pears (Pyrus communis L.) in Europe, with Emilia-Romagna as the national hub; however, for some years the sector has been facing a severe decline due to rising cultivation costs, phytopathologies, and climate instability. Since 2018, the area occupied by pear orchards has shrunk from 18,300 to 10,500 hectares.  The strong prevalence of few traditional varieties (most notably the stress-susceptible Abbé Fétel) severely limits genetic diversity and adaptive capacity, underscoring the urgent need for diversified germplasm and optimized rootstock-scion combinations suited to specific pedoclimatic conditions.​
To diversify the pear tree germplasm cultivated in Emilia-Romagna, comparative research focused on rootstock–genotype combinations was undertaken. This in-field study specifically aims to identify the most heatwave-resistant genotype-rootstock combinations in an experimental orchard located in the Po River Plain near Ferrara. Twenty pear genotypes (including reference cultivars Abbé Fétel and Williams), grafted on seedling rootstock, or BA29, or BA29/BH rootstocks, were planted in 2023. Soil characterization included textural, calcimetric, pH, and loss-on-ignition (LOI) analyses, together with multi-element profiling by X-ray fluorescence (XRF) and stable isotope determination (δ¹³C and δ¹⁵N ratios) by elemental analysis–isotope ratio mass spectrometry (EA-IRMS). During winter dormancy (December 2024), the youngest branches were likewise sampled to assess δ¹³C isotopic composition and C/N content. Plant physiological performance was subsequently evaluated through fast chlorophyll a fluorescence of leaves in May, June, and July 2025 to capture seasonal heatwave effects. LOI and calcimetric analyses confirmed organic carbon and carbonate contents compatible with adequate soil functionality. δ¹³C in branches ranged within a physiological range, from -28.3‰ to -25.7‰, across genotype/rootstock combinations. Chlorophyll fluorescence parameters, particularly the total performance index PItot showed marked variability among combinations and differentiated plant responses to the intense heatwave affecting Northern Italy in 2025.

These preliminary results, which are undergoing further elaboration, suggest that multi-temporal PItot determinations combined with branch δ¹³C analyses can provide a tool for the identification of optimal heatwave-resistant genotype-rootstock combinations.  However, the result must be considered specific to the Ferrara orchard context, characterized by well-defined soil properties within the alluvial Po River Plain, which is intrinsically heterogenous because of sediments of different origin and strong anthropic action. Further research will look for validation of the result in other soil contexts that are relevant to periculture in Emilia-Romagna.


Research funded by the European Union – NextGenerationEU, Ministero dell’Università e della Ricerca - Piano Nazionale di Ripresa e Resilienza, D.M. 630/2024.

How to cite: Ferroni, L., Bigoni, M., Viola, I., Zaccarini, M., Farinelli, A., and Marrocchino, E.: Identifying heatwave resilient genotype-rootstock combinations in pear orchards through integrated soil and physiological analyses, EGU General Assembly 2026, Vienna, Austria, 3–8 May 2026, EGU26-17553, https://doi.org/10.5194/egusphere-egu26-17553, 2026.

EGU26-17652 | ECS | Orals | BG3.3

Population temporal stability in grasslands increases with root outsourcing to mycorrhizae 

Sepideh Golshani, Joana Bergmann, Johanne Gresse, Pierre Liancourt, and Maria Májeková

Understanding which plant belowground foraging strategies promote long-term population temporal stability is critical for understanding species coexistence in grassland ecosystems. Root trait variation is increasingly framed within a multidimensional root economics spectrum that contrasts do-it-yourself (DIY) soil exploration via fine, acquisitive roots with outsourcing of resource acquisition to mycorrhizal symbionts. While these strategies are known to shape belowground resource use, their consequences for temporal population stability remain poorly understood.
Here, we tested whether root strategies predict long-term population stability using 16 years of annual vegetation data from 150 plots in three regions of temperate grasslands in Germany. Temporal stability was quantified as the coefficient of variation in species cover and related to a comprehensive set of belowground and aboveground functional traits measured for 82 species. 
Populations investing in outsourcing showed higher temporal stability, while populations with stronger DIY strategies exhibited lower temporal stability. At the trait level, collaboration-related anatomical traits, particularly cortex fraction, consistently promoted stability, while acquisitive fine-root traits were associated with higher variability. In contrast, aboveground leaf economic traits showed little explanatory power.
Our results demonstrate that root outsourcing to micorrhizal symbionts enhances long-term population stability in temperate grasslands, identifying belowground collaboration as a key axis of temporal niche partitioning and offering new insight into mechanisms underpinning species coexistence and grassland ecosystem functioning.

How to cite: Golshani, S., Bergmann, J., Gresse, J., Liancourt, P., and Májeková, M.: Population temporal stability in grasslands increases with root outsourcing to mycorrhizae, EGU General Assembly 2026, Vienna, Austria, 3–8 May 2026, EGU26-17652, https://doi.org/10.5194/egusphere-egu26-17652, 2026.

EGU26-17742 | ECS | Posters on site | BG3.3

Leaf trait responses to soil nutrient gradients across contrasting rainfall regimes in Western Australia 

Daniil Scheifes, Jan Lankhorst, Jisun Kim, Shu Tong Liu, Catherine Morfopoulos, Hans Lambers, Paul Drake, Karin Rebel, and Hugo de Boer

Understanding how the relative availability of nitrogen (N) and phosphorus (P), together with water supply, influences plant photosynthesis and carbon allocation is crucial for accurate land surface models. Eco-evolutionary optimality theory provides a theoretical framework to model ecosystem responses and posits that carbon assimilation is optimized through coordinated investments in photosynthetic capacity and transpiration by minimizing their combined costs. Yet, it remains unclear how the availability of water and nutrients influences the leaf-level investments in photosynthetic capacity and transpiration.

We measured photosynthetic and leaf structural traits across N to P availability gradients in the ecosystems of Jurien Bay and Warren River in Western Australia. Both systems occur on soils developed on coastal sands and are arranged along chronosequences, but differ markedly in climate. Mean annual rainfall increases from 533 mm y⁻¹ at Jurien Bay in the north to 1185 mm y⁻¹ at Warren River in the south, while mean annual temperature decreases from 19.0 °C at Jurien Bay to 15.2 °C at Warren River.

Across gradients of N and P availability, photosynthetic capacity traits (Asat, Amax, Vcmax, Jmax) showed relatively modest variation compared with leaf structural traits (leaf N, leaf P, LMA) in both ecosystems. The ratio of leaf interior to atmospheric CO2 concentrations (Ci / Ca) showed a positive relationship with the balance of N versus P availability in Warren River, but not in Jurien Bay. Differences in Ci / Ca between ecosystems suggest shifts in the coordination between carbon gain and water loss that were not fully explained by differences in photosynthetic capacity alone, and suggest interaction between water and nutrient availability.

Our work presents new observations on leaf trait responses across natural nutrient gradients that contribute to our understanding of how nutrient and water availability jointly shape the coordination between photosynthetic capacity and stomatal regulation.

How to cite: Scheifes, D., Lankhorst, J., Kim, J., Liu, S. T., Morfopoulos, C., Lambers, H., Drake, P., Rebel, K., and de Boer, H.: Leaf trait responses to soil nutrient gradients across contrasting rainfall regimes in Western Australia, EGU General Assembly 2026, Vienna, Austria, 3–8 May 2026, EGU26-17742, https://doi.org/10.5194/egusphere-egu26-17742, 2026.

EGU26-17823 | Posters on site | BG3.3

Stable isotope signatures of Asparago Verde di Altedo PGI (Asparagus officinalis) along an inland-coastal soil gradient at the Po River Delta (NE Italy) 

Elena Marrocchino, Angela Martina, Marcello Bigoni, Irene Viola, and Lorenzo Ferroni

Climate change is intensifying environmental pressures on coastal agroecosystems, particularly through increased salinization, drought, and soil degradation. These processes strongly affect soil–plant interactions and may alter the biogeochemical signatures of crops, with direct implications for food quality, traceability, and territorial resilience. Stable isotope analysis provides a sensitive integrative tool to link climatic drivers, soil properties, and plant metabolic responses.

This study investigates soil–plant continuity in Asparago Verde di Altedo PGI (Asparagus officinalis) cultivated in the eastern Po River Delta (Ferrara province, NE Italy), a low-lying coastal area highly vulnerable to climate-driven salinization, saltwater intrusion, and historical land reclamation. The PGI production area is characterized by sandy to sandy–clayey soils forming a marked inland–coastal gradient, which offers an ideal natural laboratory to assess environmental controls on isotopic signatures. Specifically, it was hypothesized that the inland-coastal gradient in soil properties had a counterpart in asparagus.

Soils were characterized from different fields cultivated with asparagus with respect to pH and elemental composition using X-ray fluorescence and ICP-MS, with particular attention to salinity-related markers (e.g. Na enrichment) and trace elements. Stable carbon and nitrogen isotope ratios (δ¹³C, δ15N) and C/N ratio were determined in soils and asparagus turions by EA-IRMS to evaluate isotopic transfer and the influence of soil geochemistry and water availability on plant metabolism. To complement isotopic evidence, the turions were phenotyped through JIP-test parameters calculated from fast chlorophyll a fluorescence induction, a non-destructive technique providing insights into photosynthetic efficiency.

Multivariate analysis shows that isotopic signatures effectively capture environmental gradients associated with salinization and soil heterogeneity, enabling discrimination of asparagus samples according to their geographical origin even at local spatial scales. Variations in δ¹³C reflect differences in water-use efficiency and carbon assimilation linked to salinity and drought stress, while δ¹⁵N records soil-related and anthropogenic influences within the PGI area. C and N parameters had interesting relationships with JIP-test parameters, strengthening their anticipated link with photosynthetic modulations as determined by soil features.

The results demonstrate the potential of stable isotope approaches to connect climate change impacts with crop biogeochemistry and metabolism, supporting food traceability, PGI valorization, and adaptive management strategies in vulnerable coastal agricultural systems.

This research was allowed by PhD fellowship granted by the EUROPEAN SOCIAL FUND P L U S - The ESF+ 2021-2027 Programme of the Regione Emilia Romagna.

How to cite: Marrocchino, E., Martina, A., Bigoni, M., Viola, I., and Ferroni, L.: Stable isotope signatures of Asparago Verde di Altedo PGI (Asparagus officinalis) along an inland-coastal soil gradient at the Po River Delta (NE Italy), EGU General Assembly 2026, Vienna, Austria, 3–8 May 2026, EGU26-17823, https://doi.org/10.5194/egusphere-egu26-17823, 2026.

EGU26-17983 | Posters on site | BG3.3

Physiological adaptability and soil-plant interaction of ungrafted vs. grafted Vitis vinifera L. in the Mediterranean context: a case study on “Magliocco Dolce” in Calabria (Southern Italy) 

Lorenzo Ferroni, Andrea Bloise, Ilaria Fuoco, Giovanni Vespasiano, Luigi Sansone, Roberto Carraro, Matteo Ballestriero, and Carmine Apollaro

In the current scenario of global warming, Mediterranean viticulture is increasingly facing severe stressors that threaten the sustainability and quality of production. The interaction between root system and soil profile plays a key role in regulating plant physiological resilience. While the use of rootstocks has been the standard solution against phylloxera for over a century, recent investigations are refocusing on the agronomic potential of ungrafted grapevines and their tolerance to environmental stress. In the Calabria region (Southern Italy), the local variety “Magliocco Dolce” is cultivated both self-rooted and grafted. Evaluating whether grafting provides distinct physiological advantages related to water balance and stress tolerance compared to self-rooting is crucial for future adaptive strategies.

This study aims to verify the performance of these vines. Fieldwork was initiated in July 2025 in a vineyard comprising both young ungrafted and adult grafted plants (approx. 10-15 years old). Ampelographic observations and molecular analyses (SSR) were performed to confirm the varietal identity. Physiological performance was assessed by fast chlorophyll a fluorescence using a Handy-PEA fluorometer. Furthermore, to characterize the pedological environment, soil profiles were excavated and described in both grafted and ungrafted plots, considering slope positions (upslope and downslope) to evaluate soil spatial variability.

The identity of “Magliocco Dolce N.” was confirmed and the rootstock was identified as Paulsen clones 1103 or 775. Physiological monitoring revealed a higher photosynthetic efficiency in the grafted plants . Analysis of the chlorophyll fluorescence transient (JIP test parameters) indicated that, while both plant types showed a typical morning-to-afternoon decline in performance , ungrafted vines were more susceptible to diurnal photoinhibition. The Performance Index (PITot), a sensitive indicator of plant vitality, was significantly higher in grafted vines. Similarly, energy flux parameters per photosystem II reaction center (ABS/RC, TR/RC, ET/RC) confirmed the more light energy conservation in the grafted samples. The pedological survey involved the analysis of four soil profiles in grafted and self-rooted vineyards. Results indicated that the self-rooted vineyard soils were poorly developed and weakly structured in both downslope and upslope positions. Conversely, the grafted vineyard showed significant spatial variability: the downslope profile revealed a more developed soil characterized with a well-defined structure, whereas the upslope profile presented a less evolved structure. Grafted vines generally outperformed self-rooted ones, particularly in the downslope section where developed soil profiles offer superior nutrient and water availability. The “soil-effect” cannot be overlooked when comparing grafted and ungrafted plants. However, despite exhibiting lower electron transport chain efficiency compared to the older, more established grafted plants, the self-rooted vines did not exceed critical failure thresholds, demonstrating an ability to survive in the sandy substrates.


This research was funded by the Ministry of Research of Italy through the project PRIN2022 « Soil, water, sun: Exploring Ungrafted indigenous Italian Vitis vinifera L. varieties as a resilient resource against the effects of global climate change (EU-vitis) » (CUP F53C2400120).

How to cite: Ferroni, L., Bloise, A., Fuoco, I., Vespasiano, G., Sansone, L., Carraro, R., Ballestriero, M., and Apollaro, C.: Physiological adaptability and soil-plant interaction of ungrafted vs. grafted Vitis vinifera L. in the Mediterranean context: a case study on “Magliocco Dolce” in Calabria (Southern Italy), EGU General Assembly 2026, Vienna, Austria, 3–8 May 2026, EGU26-17983, https://doi.org/10.5194/egusphere-egu26-17983, 2026.

EGU26-19064 | ECS | Posters on site | BG3.3

Water Use Efficiency content under fertilization schemes in an elevational gradient– Preliminary results from Nutrient Manipulation Experiment in Ecuador 

Andrea Chávez-Pacheco, Marijn Bauters, Selene Báez, Susana León-Yánez, Jürgen Homeier, Ximena Palomeque, and Hans Verbeeck

Water-use efficiency (WUE) is a key physiological trait for understanding forest adaptation to rising atmospheric CO₂.   However, under conditions of elevated CO₂ and increasing atmospheric deposition of nitrogen (N) and phosphorus (P), the responses of vegetation in tropical montane forests in terms of WUE remain understudied. This study investigates WUE, estimated from stable carbon (δ¹³C), and also analyzes oxygen (δ¹⁸O) isotope compositions across six tree species in a long-term Nutrient Manipulation Experiment (NUMEX) located along an elevational gradient (1000, 2000, and 3000 m a.s.l.) in Ecuador. We assessed whether nutrient addition influences tree physiological responses in terms of iWUE and how these responses vary across elevations.

Preliminary results indicate species-specific and elevation-dependent differences in isotopic composition and intrinsic water-use efficiency (iWUE). Nutrient addition treatments (N and P) did not result in statistically significant changes in iWUE compared to control plots, suggesting that nutrient availability is not the primary driver of iWUE variability in the studied species. However, δ¹⁸O appeared more sensitive to nutrient inputs than iWUE. Pouteria torta, Alchornea lojanensis, and Myrcia sp., exhibited significant δ¹⁸O responses under nutrient addition, reflecting contrasting physiological strategies among taxa. These responses may indicate compensatory mechanisms that help maintain relatively stable iWUE across treatments. However, this interpretation remains preliminary and requires further analysis.

Isotopic composition and iWUE varied consistently along the elevational gradient. Both iWUE and δ¹³C followed an inverted U-shaped pattern, with slightly higher values at 2000 m. On the other hand, δ¹⁸O values were more enriched and similar at 1000 m and 2000 m, consistent with higher temperatures and evaporative demand at lower elevations. Overall, climatic factors associated with elevation exert stronger control over iWUE and isotopic signatures than nutrient availability.

Although preliminary, these findings provide new insights into water-use strategies of tropical montane tree species and highlight the importance of long-term nutrient manipulation experiments for addressing knowledge gaps in tropical forest eco-physiology under environmental change.

How to cite: Chávez-Pacheco, A., Bauters, M., Báez, S., León-Yánez, S., Homeier, J., Palomeque, X., and Verbeeck, H.: Water Use Efficiency content under fertilization schemes in an elevational gradient– Preliminary results from Nutrient Manipulation Experiment in Ecuador, EGU General Assembly 2026, Vienna, Austria, 3–8 May 2026, EGU26-19064, https://doi.org/10.5194/egusphere-egu26-19064, 2026.

In light of the observed changing conditions of forest growth, it is important to develop up-to-date forest growth models at the level of entire ecosystems, individual stands, and single trees. The aim of the study was to determine how multi-source variables explain the radial growth of Pinus Sylvestris and Norway spruce trees. Models for Scots Pine were developed based on over 100 000 annual observations of tree ring width from 6749 trees across 301 plots located in Poland, and for Norway Spruce, based on over 15 000 observations, 1090 trees across 57 plots. The analyzed period spanned from 2005 to 2022. Data from airborne laser scanning was used to calculate tree height, various competition indices, crown volume, and relative sunlight exposure. Other variables included: diameter at breast height, stand stock and age, climatic variables describing vegetation season and soil characteristics. Random forest models were developed. Cross-validation was applied, selecting one year of observations and random 20% of plots as test data per iteration. Models trained on all data reached around 70% explained variability, however after cross-validation explained variability dropped to around 18% and 7% for tree ring width of Scots Pine and Norway Spruce respectively. Despite the use of an extensive set of explanatory variables, big part of the variability in growth was determined by other factors and remained unexplained. The obtained results indicate the need for further research in the field of modeling diameter growth of individual trees.

How to cite: Zdunek, N., Hawryło, P., and Socha, J.: Modelling single-tree diameter increment of Scots pine and Norway spruce using multi-source tree, stand, soil, and climatic data, EGU General Assembly 2026, Vienna, Austria, 3–8 May 2026, EGU26-19870, https://doi.org/10.5194/egusphere-egu26-19870, 2026.

EGU26-21330 | Orals | BG3.3

Increasing plant functional diversity in dryland plant patches enhances ecohydrological source-sink contribution to patch productivity 

Susana Bautista, Valeriia Nazarova, David Fuentes, Francisco Fornieles, and Francisco Rodríguez

Dryland vegetation is typically organized into discrete plant patches separated by bare soil. Vegetated patches function as resource sinks by capturing water, dust, and sediments, whereas bare areas act as sources of runoff and sediment. Although observational and trait-based studies generally indicate positive effects of plant functional diversity on dryland ecosystem functioning, identifying causal relationships and underlying mechanisms requires experimental approaches that explicitly manipulate biodiversity. Such experiments remain scarce in dryland ecosystems, particularly those addressing hydrological and geomorphological processes. Here, we present results from a large-scale biodiversity-ecosystem functioning experiment investigating how within-patch diversity, ranging from monospecific to highly diverse patches (either 1, 2, 4 or 8 species, organized in functionally contrasting groups), modulates runoff-driven source-sink dynamics in dryland systems. Using more than 600 vegetation patches established by planting one-year-old seedlings in manually dug holes, we quantified source-sink dynamics by relating vegetation productivity metrics (mean and maximum NDVI, changes in patch height, and changes in patch cover) to the characteristics of upslope bare-soil micro-catchments draining into each patch (micro-catchment area and mean and maximum flowlength). All metrics were derived from drone-based surveys conducted over a three-year period. Both source-area size and maximum flow length were positively correlated with all assessed patch performance metrics. Diversity significantly modulated the strength of these relationships, with patches containing four and eight species consistently exhibiting the strongest source-patch coupling, whereas two-species treatments showed the weakest relationships. Among patches composed of a single functional group (one or two species), small shrubs were most sensitive to source-area size, while perennial grasses showed little to no response. Overall, our results support the hypothesis that within-patch plant functional diversity enhances runoff capture and use, although some functional groups alone can also strongly increase patch sink capacity. These results have direct applications for dryland restoration, as provide evidence that planting several functionally contrasting species in a shared planting hole could promote a more efficient sink function in the vegetation patches.

How to cite: Bautista, S., Nazarova, V., Fuentes, D., Fornieles, F., and Rodríguez, F.: Increasing plant functional diversity in dryland plant patches enhances ecohydrological source-sink contribution to patch productivity, EGU General Assembly 2026, Vienna, Austria, 3–8 May 2026, EGU26-21330, https://doi.org/10.5194/egusphere-egu26-21330, 2026.

Ning Dong1, Wang yiru1, Yuki Tsujii2, Ian Wright3, David Ellsworth3, Sandy P. Harrison4 , Iain Colin Prentice5

1College of Resources and Environment, Huazhong Agricultural University, Wuhan, 430070, China

2Forestry and Forest Products Research Institute (FFPRI), 1 Matsunosato, Tsukuba, Ibaraki, 305-8687 Japan

3 Hawkesbury Institute for the Environment, Western Sydney University, Penrith, NSW, 2751, Australia

4Department of Geography and Environmental Science, University of Reading, Whiteknights, Reading RG6 6AB, United Kingdom

5Georgina Mace Centre for the Living Planet, Department of Life Sciences, Imperial College London, Silwood Park Campus, Ascot, UK

Phosphorus (P) can be separated into five functional fractions: orthophosphate P (Pi), metabolite P (PM), nucleic acid P (PN), lipid P (PL), and residual P (PR). These fractions regulate vital functional processes, such as photosynthesis, protein synthesis, dark respiration. We have compiled a comprehensive global P fractional dataset along with leaf spectrum traits, such as LMA and leaf N. We found that leaf exists P allocation pattern according to plant function group as expected. PM shows an independent dimension, and increase toward hot and dry condition, and PN is closed related to LES traits. Soil P increase all P fractions and leaf P. lipid P (PL) decline with VPD and soil CN ratio, and increase with soil P. Together, these various environmental factors explain almost 50% of global variation in both PL and organic P. These findings provide a promising route towards an optimality-based approach to modelling leaf P and their relationships to properties of climate and soils.

How to cite: Dong, N.:  Phosphorus fractions allocation patterns based on optimality theory: a global analysis , EGU General Assembly 2026, Vienna, Austria, 3–8 May 2026, EGU26-21422, https://doi.org/10.5194/egusphere-egu26-21422, 2026.

EGU26-22811 | Posters on site | BG3.3

Leaf age controls photosynthetic efficiency and energy partitioning in Amazonian trees 

Izabela Aleixo, Leonardo Ziccardi, Sabrina Garcia, Amanda Damasceno, Bruna Lima, José Carlos Soares, Bruno Takeshi, Tomas Ferreira Domingues, David Lapola, Carlos Alberto Nobre Quesada, and Bruce Nelson and the AmazonFACE team
Seasonal variability in photosynthesis across old-growth Amazonian forests challenges classical paradigms linking productivity primarily to climatic constraints. Satellite observations of solar-induced chlorophyll fluorescence (SIF) and eddy-covariance measurements indicate that ecosystem-scale photosynthesis is maintained or even enhanced during the dry season, yet the physiological mechanisms underlying this pattern remain poorly constrained. Increasing evidence suggests that canopy phenology and leaf demography, rather than changes in leaf area index (LAI), play a central role in regulating seasonal productivity. However, the functional consequences of leaf aging for photosynthetic energy allocation and its implications for SIF–GPP relationships are still largely unknown.
 
Here, we investigate how leaf age controls photosynthetic efficiency and the partitioning of absorbed light energy in Amazonian trees. We measured chlorophyll content, leaf temperature, linear electron flow (LEF), and the yields of photochemistry (ΦPSII), regulated heat dissipation (ΦNPQ), and nonregulated energy losses (ΦNO) in 2,323 leaves from 61 trees (27 species) across multiple canopy strata at two sites in Central Amazonia: the Amazon Tall Tower Observatory (ATTO) and the AmazonFACE experiment. Measurements were conducted under ambient and high photosynthetically active radiation (PAR = 2000 µmol m⁻² s⁻¹) using a MultispeQ device, allowing us to quantify leaf “light potential”, defined as the capacity to respond to rapid increases in irradiance. Leaf age was assessed both as categorical classes (young, mature, old) and, for a subset of leaves, as continuous age in days based on long-term demography monitoring.
 
Our results show that leaf age strongly regulates photosynthetic energy partitioning. ΦPSII increased during early leaf development, peaked at intermediate ages, and declined steadily in older leaves, while ΦNO increased with age. ΦNPQ decreased during early development but increased again in older leaves, indicating a shift toward enhanced photoprotective dissipation. Older leaves also exhibited greater light potential, with higher NPQ and sustained LEF under high light, suggesting increased capacity to cope with sunflecks and transient irradiance.
 
We demonstrate that leaf age is a key state variable linking canopy demography, photosynthetic energy allocation, and ecosystem-scale SIF–GPP relationships. Incorporating leaf-age dynamics into ecosystem and Earth system models is essential to improve predictions of tropical forest productivity under current and future climate conditions.

How to cite: Aleixo, I., Ziccardi, L., Garcia, S., Damasceno, A., Lima, B., Soares, J. C., Takeshi, B., Ferreira Domingues, T., Lapola, D., Nobre Quesada, C. A., and Nelson, B. and the AmazonFACE team: Leaf age controls photosynthetic efficiency and energy partitioning in Amazonian trees, EGU General Assembly 2026, Vienna, Austria, 3–8 May 2026, EGU26-22811, https://doi.org/10.5194/egusphere-egu26-22811, 2026.

EGU26-527 | ECS | Posters on site | BG3.4

Increase in carbon sink in a protected tropical seasonal rainforest in southwestern China over 20 years 

Yaqi Liu, Linjie Jiao, Jing Zhang, Xuefei Li, Huixu Zheng, Boonsiri Sawasdchai, Yaoliang Chen, Yiping Zhang, Palingamoorthy Gnanamoorthy, and Qinghai Song

Tropical forests play a pivotal role in the global carbon cycle, but the lack of long-term in-situ datasets renders our understanding of the specific carbon dynamics in tropical forests uncertain. In this study, we analyzed two decades (2003–2022) of eddy-covariance measurements from a primary tropical seasonal rainforest reserve in Xishuangbanna, southwest China, to characterize long-term trends in gross primary productivity (GPP), ecosystem respiration (Reco), and net ecosystem productivity (NEP). The protected rainforest functioned as a modest but steadily strengthening carbon sink (annual mean NEP = 157.9 ± 56.7 g C m⁻² year⁻¹, growth rate = 3.4% year⁻¹), consistent with an observed increase in carbon use efficiency (CUE) (annual mean CUE = 5.9% ± 1.8%, growth rate = 2.4% year-1), which reflects increasingly efficient carbon utilization and aligns with rising aboveground biomass. The enhancement of the interannual carbon sink was mainly driven by increasing GPP (mean = 2658.1 ± 254.5 g C m⁻² year⁻¹, growth rate = 1.0% year⁻¹). With the same 6-month duration, the tropical seasonal rainforest exhibited a stronger carbon sink during the dry season (148.3 g C m-1 season-1) than during the rainy season, with the dry season accounting for 93.9% of the annual carbon sink. The enhanced dry season radiation and precipitation throughout the two decades positively affected the upward trend of the carbon sink. Notably, the annual carbon sink showed a temporary decline approximately two years after droughts, suggesting a lagged ecosystem response to climatic disturbances. Overall, these findings underscore the long-term carbon sequestration potential of well-preserved tropical rainforests and provide critical empirical evidence for improving carbon budget assessments in tropical regions under ongoing climate change.

How to cite: Liu, Y., Jiao, L., Zhang, J., Li, X., Zheng, H., Sawasdchai, B., Chen, Y., Zhang, Y., Gnanamoorthy, P., and Song, Q.: Increase in carbon sink in a protected tropical seasonal rainforest in southwestern China over 20 years, EGU General Assembly 2026, Vienna, Austria, 3–8 May 2026, EGU26-527, https://doi.org/10.5194/egusphere-egu26-527, 2026.

EGU26-958 | Posters on site | BG3.4

Unravelling the response of Global Vegetation to Climate Change during recent decades  

Rahul Kashyap and Jayanarayanan Kuttippurath

The atmosphere–land interaction is crucial to the climate and earth system through the exchange of energy, water, momentum and carbon among vegetation and atmosphere. In recent times, a great deal of variability in anthropogenic land use along with climate variability has greatly altered the terrestrial biosphere all around the globe. The global vegetation dynamics has garnered substantial attention due to its potential impact on food security, water cycle and terrestrial carbon sinks. The non-climatic factors have a very straightforward and regional impact on vegetation. However, there remains uncertainty regarding the response of the terrestrial ecosystems to climate change as vegetation-climate interactions is very intricate and intriguing. In the recent times, higher temperature (T) and evapotranspiration (ET) accompanied by insufficient precipitation (P) has depleted soil moisture (SM). We find temperature (T) is the dominant driver of global photosynthesis. Across biomes and land cover types, moisture availability (P and SM) is the key climatic control in tropical and arid but T in temperate and cold biomes. For croplands and forests, T is the predominant driver, but P is the key driver for grasses suggests Machine Learning (ML) based Random Forest (RF) model. However, there is decline in the control of temperature on photosynthesis due to saturation of boreal warming-induced greening and increasing dryness stress. The influence of water availability and energy has substantially grown on global photosynthesis. Interestingly, in regions where both increase in energy and decrease in water availability is present, the photosynthetic activity is largely moisture controlled. Therefore, the global photosynthesis is largely driven by moisture ahead of warmth and energy in the drying world.

How to cite: Kashyap, R. and Kuttippurath, J.: Unravelling the response of Global Vegetation to Climate Change during recent decades , EGU General Assembly 2026, Vienna, Austria, 3–8 May 2026, EGU26-958, https://doi.org/10.5194/egusphere-egu26-958, 2026.

EGU26-1507 | ECS | Posters on site | BG3.4

Higher aboveground carbon stocks in edge forests. 

Antoine Harel, Evelyne Thiffault, David Paré, Guillaume Moreau, Alexis Achim, Florence Leduc, Maude Larochelle, and Yann Chavaillaz

On a global scale, human activities have significantly fragmented forest landscapes, resulting in over 20 % of the remaining forests being located within 100 meters of an edge. Forests adjacent to disturbances experience edge effects that can affect aboveground carbon storage through changes in forest structure. Our main objective was to assess aboveground carbon stocks and their drivers in edge forests across a large bioclimatic gradient of upland sites in the temperate and boreal forests of Eastern Canada, using powerline rights-of-way as a case study. We quantified the carbon stocks contained in living and dead trees of all sizes and measured tree growth at the stand and tree levels in forests adjacent to powerline rights-of-way. Compared with control forests (> 50 m from right-of-way), aboveground carbon stocks in edge forests (< 20 m) were up to 60 – 75 % higher in boreal spruce forests, 30 % higher in temperate forests, but only 2 % higher in boreal fir forests. Higher carbon stocks were linked to increased stand density, and thus a higher stand basal area, rather than larger tree diameters. Edge effects on tree characteristics (diameter, total height, crown length and area, and basal area increment) showed no clear pattern and depended on the characteristics of the forest. No edge effect was found in a stand with a recently established right-of-way (less than three years), suggesting that the magnitude of the edge effect varies over time. This study will improve the assessment of the carbon footprint of fragmented forest landscapes.

How to cite: Harel, A., Thiffault, E., Paré, D., Moreau, G., Achim, A., Leduc, F., Larochelle, M., and Chavaillaz, Y.: Higher aboveground carbon stocks in edge forests., EGU General Assembly 2026, Vienna, Austria, 3–8 May 2026, EGU26-1507, https://doi.org/10.5194/egusphere-egu26-1507, 2026.

EGU26-2488 | Posters on site | BG3.4

Vegetation biogeography is a main source of uncertainty in modelling the land carbon cycle 

Xiangzhong Luo, Ruiying Zhao, Anthony Walker, Forrest Hoffman, and Lian Pin Koh

The terrestrial biosphere exchanges a large amount of CO2 with the atmosphere through photosynthesis and respiration, determining the magnitude of land carbon sink and consequently influencing the rate of global warming. The magnitudes of global photosynthesis and respiration, however, vary widely across models (100-200 PgC/year), constituting a key and persistent source of uncertainty in carbon cycle and climate modelling. Here, we argue that the uncertainty in the land carbon cycle modelling is largely attributable to the uncertainty in biogeography – the distribution of plant functional types (PFTs). Using an ensemble of dynamic global vegetation models (DGVMs), we find a strong dependence of total photosynthesis on total area for each PFT. The dependence allows us to reduce the spread of land carbon cycle estimates by ~75% using remote sensing-based PFT maps. We further find that 56 ± 21% of climate-driven changes in global photosynthesis modelled by DGVMs are caused by changes in PFT distribution in the last two decades. Our study identifies vegetation biogeography as a main controlling factor of uncertainty in land carbon cycle modelling and highlights the importance of biogeography-climate interactions in carbon cycle and climate studies.

How to cite: Luo, X., Zhao, R., Walker, A., Hoffman, F., and Koh, L. P.: Vegetation biogeography is a main source of uncertainty in modelling the land carbon cycle, EGU General Assembly 2026, Vienna, Austria, 3–8 May 2026, EGU26-2488, https://doi.org/10.5194/egusphere-egu26-2488, 2026.

EGU26-2872 | ECS | Posters on site | BG3.4

Drivers of individual tree mortality across the US coasts  

Chi Hang Yeung and Xi Yang

Coastal forests are carbon-dense ecosystems providing critical services, including storm protection, water filtration, timber, and fisheries, to millions of people living in vulnerable low-lying regions. Increasing evidence suggests that tree mortality is accelerating across these habitats, driven by rising water tables (leading to anoxia), salinization, and extreme weather events such as droughts and storms. These stressors are triggering rapid shifts in coastal forest structure, function, and carbon balance. Yet, the spatial extent of coastal tree mortality remains poorly mapped due to the heterogeneity of coastal landscapes. Consequently, it becomes challenging to elucidate the pace and mechanisms behind such die-off patterns, particularly in areas beyond sea-level rise hotspots. Here, we present a deep learning–based approach for tracking individual tree mortality biennially between 2010 and 2023 using sub-meter aerial imagery across the coastal United States, spanning the Atlantic, Gulf, and Pacific coasts, as well as the Great Lakes region. By tracking over 200 million individual tree mortalities over the past decade, we captured signals of canopy stress and decline across at-risk forests, which enabled us to elucidate the underlying mortality drivers. We identified many mortality hotspots not captured by traditional remote sensing approaches or surveys. This approach offers a scalable framework for identifying emerging mortality hotspots and understanding how climate and hydrological stressors are reshaping forest resilience. Such insight is crucial for informing adaptive coastal management and anticipating ecosystem transformation under accelerating climate change.

How to cite: Yeung, C. H. and Yang, X.: Drivers of individual tree mortality across the US coasts , EGU General Assembly 2026, Vienna, Austria, 3–8 May 2026, EGU26-2872, https://doi.org/10.5194/egusphere-egu26-2872, 2026.

EGU26-3036 | ECS | Orals | BG3.4

Natural disturbances increasingly affect Europe’s most mature and carbon-rich forests  

Simon Besnard, Alba Viana-Soto, Henrik Hartmann, Marco Patacca, Viola H. A. Heinrich, Katja Kowalski, Maurizio Santoro, Wanda De Keersmaecker, Ruben Van De Kerchove, Martin Herold, and Cornelius Senf

Europe's forests store nearly 40 PgC and provide a critical carbon sink of ~0.2 PgC yr-1, yet climate-driven disturbances increasingly threaten this capacity. Although disturbance rates from windthrow and bark beetle outbreaks have risen in recent decades, it remains unclear whether these events increasingly affect the oldest and largest trees, which store a disproportionate share of carbon. Here, we combine three decades of satellite-derived disturbance maps with spatially explicit data on forest age, biomass, and species composition to reveal patterns of structural selectivity across Europe. We show that natural disturbances have shifted toward older, carbon-rich stands, with disturbed forest area > 60 years old nearly tripling since 2010 (from 0.38 to 1.06 Mha). This structural shift is most pronounced in spruce-dominated regions of Central Europe (effect size = 1), where compound heat and drought events have amplified susceptibility to bark beetles. Biomass losses from natural disturbances in spruce forests increased eightfold between the early (2011-2016) and recent (2017-2023) periods. Trend-based projections indicate that, if current patterns of structural selectivity persist, natural disturbances could expose biomass carbon stocks equivalent to approximately 20 % of Europe’s contemporary forest carbon sink by 2040 (~0.05 PgC yr -1 or ~0.7 PgC cumulative). Our findings reveal a previously unquantified vulnerability: climate-driven disturbances increasingly affect forest structures with high per-hectare carbon stocks, amplifying disturbance-related carbon exposure and weakening the long-term effectiveness of Europe’s forest carbon sink. Adaptive management strategies that promote structural and compositional diversification in high-risk regions will be critical to stabilise forest carbon storage under continued climate change.

How to cite: Besnard, S., Viana-Soto, A., Hartmann, H., Patacca, M., Heinrich, V. H. A., Kowalski, K., Santoro, M., De Keersmaecker, W., Van De Kerchove, R., Herold, M., and Senf, C.: Natural disturbances increasingly affect Europe’s most mature and carbon-rich forests , EGU General Assembly 2026, Vienna, Austria, 3–8 May 2026, EGU26-3036, https://doi.org/10.5194/egusphere-egu26-3036, 2026.

EGU26-4036 | ECS | Orals | BG3.4

Inter-annual variation in carbon allocation explains partial decoupling between assimilation and growth in six forest sites 

Jeanne Poughon, Maxime Cailleret, Nicolas Delpierre, Daniel Berveiller, Christophe Chipeaux, Pascal Courtois, Matthias Cuntz, Jean-Christophe Domec, Joannes Guillemot, Emilie Joetzjer, Jean Kempf, Sébastien Lafont, Guerric Le Maire, Olivier Marloie, Alexandre Morfin, Yann Nouvellon, Jean-Marc Ourcival, Guillaume Simioni, and Jean-Marc Limousin

Predicting the future carbon balance of forests, and their carbon sequestration capacity, requires a precise understanding of how gross primary productivity (GPP) is partitioned among autotrophic respiration and the different compartments of the net primary productivity (NPP). Studies show an important variability of the NPP:GPP ratio across forest, and a partial decoupling between GPP and wood production in forest ecosystems. This suggests an interannual variation of carbon allocation among tree functions and organs, which is generally not accounted for in most dynamic vegetation models. Using GPP estimated from eddy-covariance measurements and independent above-ground NPP measured over 6 to 20 years on six forest sites (5 sites in France belonging to the ICOS network and one site in Brazil), we explored the interannual variations in GPP partitioning to aboveground growth and its distribution among years and aboveground organs (wood, leaves, fruits, flowers).

The partitioning of GPP to aboveground biomass varied considerably across sites, with Mediterranean evergreen forests showing the lowest values (15% and 18%), temperate forests intermediate values (21-37%), and the tropical eucalypt site showing the highest fraction (48%). At four of the sites, biomass production exhibited a larger inter-annual variability than did GPP, suggesting a greater sensitivity to environmental controls of the carbon sinks than the carbon source. All sites but one exhibited a significant correlation between annual aboveground NPP and annual GPP, but with small R² values between 0.2 and 0.6, thus showing a rather weak coupling between the two productivities. The coupling was generally even weaker for wood production alone (generally considered as the main carbon sequestration in forests) than for total aboveground NPP (which also includes short-lived organs such as leaves that will rapidly decompose). Finally, we observed that the inter-annual correlations between GPP and biomass production varied depending on the onset of the GPP integration time-window, indicating different temporal lags between assimilation and growth according to species and organs.

This works highlights the necessity to take into account inter-annual variations of carbon allocation in forest carbon balances, and to better understand of the climatic drivers of sink activity including potential lags between assimilation, storage and growth.

How to cite: Poughon, J., Cailleret, M., Delpierre, N., Berveiller, D., Chipeaux, C., Courtois, P., Cuntz, M., Domec, J.-C., Guillemot, J., Joetzjer, E., Kempf, J., Lafont, S., Le Maire, G., Marloie, O., Morfin, A., Nouvellon, Y., Ourcival, J.-M., Simioni, G., and Limousin, J.-M.: Inter-annual variation in carbon allocation explains partial decoupling between assimilation and growth in six forest sites, EGU General Assembly 2026, Vienna, Austria, 3–8 May 2026, EGU26-4036, https://doi.org/10.5194/egusphere-egu26-4036, 2026.

EGU26-4586 | ECS | Posters on site | BG3.4

Satellite data for carbon sequestration accounting: enhancing spatial and temporal resolution in harmony with the European ecosystem typology 

Filipe Bernardo, Andrea Peters, Michelle Watson, Lori Giagnacovo, Bruno Smets, Marcela Quiñones, Diego Barbulo, Boris Kooij, Artur Gil, Panayotis Dimopoulos, and Ioannis Kokkoris

The Horizon Europe SELINA project (project-selina.eu) supports evidence-based decision-making for the sustainable use of natural capital by advancing the integration of information on biodiversity, ecosystem condition, and ecosystem services across Europe, contributing to the EU Biodiversity Strategy for 2030, the European Green Deal, and national ecosystem reporting.
As part of SELINA’s demonstration phase, advanced methods were tested to improve the spatial and temporal resolution of the three key ecosystem accounting components—extent, condition, and services — focusing on the capacity of forests, heathlands and peatlands to capture and store carbon on two test sites: São Miguel Island (Azores, Portugal) and Peloponnese, Greece.
Ecosystem extent mapping employed a dual approach: (i) national-centric, enhancing existing datasets with Copernicus Land Monitoring Service (CLMS) data; and (ii) vegetation-centric, classifying EUNIS habitats from remote-sensing-derived features. Forest condition was assessed using the PEOPLE-EA index, integrating multiple indicators relative to an optimal reference state. Carbon accounting also followed a dual approach: (i) a remote sensing–based method (GEDI, LiDAR, Sentinel-1) to map above-ground biomass, estimate carbon stock/fluxes, and detect deforestation; (ii) a GPP-based approach applying a Light Use Efficiency (LUE) model with Sentinel-2 and climate data, subsequently converted to biome-specific NPP.
These methods produced wall-to-wall 10 m resolution maps harmonized with the European ecosystem typology, enabling scalable, cost-effective, and policy-relevant ecosystem monitoring, particularly in typically underrepresented small-medium islands from the European outermost regions.

How to cite: Bernardo, F., Peters, A., Watson, M., Giagnacovo, L., Smets, B., Quiñones, M., Barbulo, D., Kooij, B., Gil, A., Dimopoulos, P., and Kokkoris, I.: Satellite data for carbon sequestration accounting: enhancing spatial and temporal resolution in harmony with the European ecosystem typology, EGU General Assembly 2026, Vienna, Austria, 3–8 May 2026, EGU26-4586, https://doi.org/10.5194/egusphere-egu26-4586, 2026.

EGU26-5076 | ECS | Orals | BG3.4

Future Forests Start with Seeds: Warming-Driven Disruption of Forest Fecundity 

Jessie Foest, Jakub Szymkowiak, and Michał Bogdziewicz

Forest resilience under climate change depends on adequate seed production, yet it remains largely unclear how tree fecundity is changing and how this may constrain current and future range expansion. Using a long-term dataset spanning broad climatic gradients, we show that climate warming is already disrupting reproductive synchrony and fecundity across Europe.

In European beech (Fagus sylvatica), we analysed seed production records from 341 sites (mean record length 31.7 years) to test how climate change is altering masting dynamics. We show that increasing frequency of the main reproductive cue strongly erodes year-to-year variability and synchrony in seed production, particularly at colder, high-latitude and high-elevation sites. In these regions, masting variability has declined by up to ~54%, with SSP2.45 projections for 2070 indicating reductions of up to ~83%. With masting underpinning the production of pollinated, unpredated seeds, this challenges the assumption that cold-range margins are refugia from climate impacts and indicates that disruption of reproductive dynamics is likely to become the norm for this species.

Extending beyond a single species, we used a temporal attribution framework to analyse three decades of fecundity change in five dominant taxa (40,530 annual observations, 348 sites) for oaks (Quercus robur, Q. petraea), European beech, Scots pine (Pinus sylvestris), and silver fir (Abies alba). Across all species, viable seed production declined by 32–65%, with summer warming emerging as the dominant driver. Growing season drought and spring temperature had comparatively minor effects. Weather effects varied with climate, indicating diverging short-term (within-site) and long-term (across-site) sensitivities, and suggesting potential for local adaptation or acclimation.

Together, these results show that reproduction may emerge as a key bottleneck for forest resilience under climate change, as warming drives populations beyond their optimum reproductive niches. Integrating reproductive processes into forest projections and management is needed to avoid overlooking critical transitions in forest dynamics.

How to cite: Foest, J., Szymkowiak, J., and Bogdziewicz, M.: Future Forests Start with Seeds: Warming-Driven Disruption of Forest Fecundity, EGU General Assembly 2026, Vienna, Austria, 3–8 May 2026, EGU26-5076, https://doi.org/10.5194/egusphere-egu26-5076, 2026.

EGU26-7621 | ECS | Orals | BG3.4

Climate and vegetation jointly govern continental-scale patterns of plant phenology and vegetation greenness 

Cedric J. Hagen, Katya R. Jay, Henry W. Loescher, Bailey A. Murphy, Alison K. Post, Andrew D. Richardson, Michael D. SanClements, and Christina L. Staudhammer and the GERI Phenology Team

Phenological change is among the clearest biological fingerprints of climate change, shaping carbon cycling, ecosystem productivity, and trophic interactions. In this work, we synthesize more than 2,400 site-years of high-frequency phenocam imagery—from the PhenoCam Network, Australia’s Terrestrial Ecosystem Research Network, and Europe’s Integrated Carbon Observation System—to evaluate continental-scale patterns in phenology and vegetation greenness. We show that phenological and greenness metrics differ markedly across primary vegetation types and climate zones, with baseline phenology varying strongly across vegetation–climate combinations, revealing substantial ecological structuring of seasonal dynamics. In contrast, temporal trends are generally modest, heterogeneous, and seldom statistically distinguishable from zero; only a small number of vegetation–climate subgroups display detectable directional change. Generalized additive models fitted to multi-year mean site values indicate that climate and vegetation type together explain up to 58% of cross-site deviance, and that climate–vegetation interactions improve model performance by ~10% on average—most strongly for length-of-season metrics. Because Earth system models depend on realistic seasonal dynamics to constrain carbon–climate feedbacks, our results identify where model representation most needs improvement and which components of vegetation seasonality are most sensitive to climate forcing. Taken together, the findings suggest that spatial variation in plant phenology is strongly governed by vegetation–climate coupling, whereas coherent phenological shifts over time have yet to emerge at continental scales. We highlight the value of harmonized phenocam data for detecting early signals of ecological change and the need for continued international coordination toward a global phenocam dataset.

How to cite: Hagen, C. J., Jay, K. R., Loescher, H. W., Murphy, B. A., Post, A. K., Richardson, A. D., SanClements, M. D., and Staudhammer, C. L. and the GERI Phenology Team: Climate and vegetation jointly govern continental-scale patterns of plant phenology and vegetation greenness, EGU General Assembly 2026, Vienna, Austria, 3–8 May 2026, EGU26-7621, https://doi.org/10.5194/egusphere-egu26-7621, 2026.

EGU26-9784 | ECS | Posters on site | BG3.4

Global patterns of forest greening and browning: the imprint of land-use change, management, and fire 

Santiago Schauman, Daniel García, Fernando Aguilar, and Aleixandre Verger

Forests are under increasing pressure from climate change, land-use transformation, and human activities, threatening their capacity to regulate climate, store carbon, and sustain biodiversity. Detecting long-term changes in forest canopy structure and productivity is therefore essential. Leaf Area Index (LAI) is a widely used proxy of vegetation structure and function and serves as a key indicator of forest productivity. It captures greening associated with canopy densification and potential carbon uptake, and browning linked to forest degradation, disturbance, or loss. However, global assessments of forest greening and browning and their spatial determinants remain limited.

Here, we present a global analysis of forest LAI trends over the last ~25 years using the High-Quality Reprocessed MODIS LAI dataset (HiQ-LAI; 8-day, 500 m; 2000–2024). The analysis is restricted to pure forest pixels derived from Hansen’s 30 m global forest cover map. Trends were quantified using Sen’s slope estimator and their significance assessed with the Mann–Kendall test. Globally, 21 % of forest areas exhibited significant greening, while 8 % showed browning, revealing strong regional contrasts. Browning patterns in tropical and subtropical forests are predominantly associated with land-use change, whereas in boreal regions they are largely driven by fire disturbances. In contrast, greening hotspots extend beyond climatic and CO₂ fertilization effects and strongly overlap with intensively managed forests, including plantation-dominated regions in China and Europe.

Our findings demonstrate that land-use change, forest management, and disturbance regimes are key spatial determinants of observed forest greening and browning patterns. However, these processes remain underrepresented in many Earth system models. By providing a spatially explicit global baseline, this study supports improved representation of human and disturbance processes in climate–vegetation modelling and informs conservation, climate mitigation, and sustainable forest management strategies under accelerating global change.

How to cite: Schauman, S., García, D., Aguilar, F., and Verger, A.: Global patterns of forest greening and browning: the imprint of land-use change, management, and fire, EGU General Assembly 2026, Vienna, Austria, 3–8 May 2026, EGU26-9784, https://doi.org/10.5194/egusphere-egu26-9784, 2026.

EGU26-9817 | ECS | Orals | BG3.4

Constraining Hourly to Decadal Forest Carbon Fluxes with European National Forest Inventories 

Marnix A. J. van de Sande, Auke M. van der Woude, Joram J. D. Hooghiem, Sara Filipek, Mart-Jan Schelhaas, Pieter A. Zuidema, Gert-Jan Nabuurs, and Wouter Peters

Accurate monitoring of forest CO2 sequestration is essential for the European Union’s mission to achieve carbon neutrality. However, current estimates of the European forest carbon sink vary greatly depending on the methodology used. In particular, forest dynamics, such as harvest, disturbances and regrowth, are poorly captured by current approaches. Inverse modelling based on observations of atmospheric CO2 is a key approach to constraining global and regional carbon budgets and quantifying the forest CO2 uptake. CO2 inversions capture hourly-to-seasonal variability in surface CO2 fluxes well, such as during droughts. Nevertheless, due to the rapid mixing of atmospheric CO2, inverse modelling systems require additional information from local observations to capture the effects of forest dynamics over longer timescales and across space. National forest inventories (NFIs) provide a promising and underused observational data stream of aboveground biomass, biomass increment, and forest demography across space and time.

Here, we integrate forest demography data from NFIs with a biosphere model to constrain European-wide land carbon fluxes from hourly to decadal scales. Our approach combines the Simple Biosphere Model 4 (SiB4) with European forest inventory data and the forest resources model EFISCEN-Space. Including forest demography in our simulations leads to an average increase in the total European land sink strength of roughly 50 TgC yr-1 over 2000-2020, compared to a baseline simulation without demography. This additional uptake is mainly attributed to managed forests in Central Europe. Climate extremes such as the 2018 and 2022 droughts introduce additional variability in European forest carbon fluxes, which we show both spatially and temporally in our optimised net ecosystem exchange (NEE) fluxes. Finally, we evaluate the simulated CO2 mole fractions from our modelling system across the network of European atmospheric monitoring sites. This analysis marks an important step towards including NFIs as an additional constraint in our inverse modelling system for the carbon cycle, CarbonTracker Europe. With this development, we aim to bridge atmospheric and ground-based data in estimating the European forest carbon sink.

How to cite: van de Sande, M. A. J., van der Woude, A. M., Hooghiem, J. J. D., Filipek, S., Schelhaas, M.-J., Zuidema, P. A., Nabuurs, G.-J., and Peters, W.: Constraining Hourly to Decadal Forest Carbon Fluxes with European National Forest Inventories, EGU General Assembly 2026, Vienna, Austria, 3–8 May 2026, EGU26-9817, https://doi.org/10.5194/egusphere-egu26-9817, 2026.

EGU26-9880 | ECS | Posters on site | BG3.4

Improved representation of Arctic tundra landcover in global data sets  

Helena Bergstedt, Annett Bartsch, Chiara Gruber, and Tamara Emmerichs

Landsurface cover and hydrology is crucial information in modelling attempts on local to global scales. Arctic tundra regions are distinct in their plant communities and composition from Boreal or temperate regions and often underserved by globally available landcover data sets. Recent advances in mapping landcover units in Arctic tundra regions have allowed researchers to study and quantify landscape composition and wetness gradients on different scales. The Circumarctic Landcover Units (CALU) data set provides landcover information based on Sentinel – 1 and Sentinel – 2 at 10m resolution (ESA CCI+ Permafrost landcover). It also provides tundra specific landcover units not present in conventional data sets which improves the overall representation of tundra landscapes.

Global landcover data sets, such as the CCI Landcover, are available at coarser scales. To harness the potential of the CALU data set for usage in global applications, it is necessary to aggregate the 10m resolution to a coarser scale (300m in this case). In addition, the CCI Landcover includes different classes compared to the CALU data sets, which requires additional harmonization.

Here we present a harmonization effort between CALU and ESA CCI Landcover data sets. The result is a global landcover data set at 300m scale, with Arctic regions based on the dedicated CALU data. As a second step, novel classes in addition to the existing CCI Landcover classes are being suggested to improve representation of tundra landscapes in the harmonized data set. This harmonized landcover data set will allow for a more realistic representation of the Arctic landcover in land models which has the potential to improve the model estimate of the land carbon sink. Applications of the harmonized data set will be discussed.

How to cite: Bergstedt, H., Bartsch, A., Gruber, C., and Emmerichs, T.: Improved representation of Arctic tundra landcover in global data sets , EGU General Assembly 2026, Vienna, Austria, 3–8 May 2026, EGU26-9880, https://doi.org/10.5194/egusphere-egu26-9880, 2026.

EGU26-10304 | Posters on site | BG3.4

Reconstructing European forest age maps at 100 m resolution from 1900 to 2019 

Rui Ma, Philippe Ciais, Wei Li, Agnès Pellissier-Tanon, François Ritter, Yidi Xu, Karlheinz Erb, Simon Besnard, Jingfeng Xiao, Lei Zhu, and Nan Meng

Variation in forest age can contribute to differences in biomass accumulation, making it useful for understanding forest recovery and carbon dynamics. In Europe, centuries of forest use, diverse management regimes, and disturbance histories have produced a heterogeneous age structure. Yet a temporally consistent, high-resolution, and spatially explicit forest-age dataset has been lacking for the continent. Here we reconstruct a long-term (1900–2019), annually resolved forest-age record for 38 European countries. To map high-stand forest age, we implement a 100 m backcasting framework initialized from a 2020 reference map and constrained by natural disturbances, rotation-based harvesting, and historical forest-area change. In parallel, we reconstruct coppice age at 5 km resolution for 1900–2010 to represent short-rotation management and its gradual conversion to high-stand forests. Validation against National Forest Inventory data shows good agreement for young and middle-aged forests (R² = 0.77 and 0.92, respectively). At the continental scale, high-stand forests experienced pronounced rejuvenation around the mid-twentieth century and have aged gradually since then. In contrast, former coppice forests shifted from widespread young stands (5–25 yr) in 1900–1950 to a smaller extent and an increasingly older age structure in later decades as coppice was progressively converted to high stand. This dataset provides the first Europe-wide, spatiotemporally consistent, annually resolved record of forest-age dynamics, supporting assessments of management legacies, recovery trajectories, and long-term carbon-cycle impacts.

How to cite: Ma, R., Ciais, P., Li, W., Pellissier-Tanon, A., Ritter, F., Xu, Y., Erb, K., Besnard, S., Xiao, J., Zhu, L., and Meng, N.: Reconstructing European forest age maps at 100 m resolution from 1900 to 2019, EGU General Assembly 2026, Vienna, Austria, 3–8 May 2026, EGU26-10304, https://doi.org/10.5194/egusphere-egu26-10304, 2026.

EGU26-10329 | ECS | Posters on site | BG3.4

VODCA2GPP: High Resolution GPP Estimation in the Mediterranean basin from Vegetation Optical Depth Using Machine Learning 

Moritz Müller, Ruxandra Zotta, Pierre Laluet, and Wouter Dorigo

Gross Primary Production (GPP) serves as a critical indicator of ecosystem function and its response to climate change. While numerous GPP estimates from different sources (model data, satellite derived, flux tower) exist, discrepancies between these datasets remain, emphasizing the need for new datasets and continuous improvement, particularly in understanding carbon-climate feedbacks and ecosystem resilience.
By refining the VODCA2GPP product  [Wild et al., 2022], which estimates GPP using Vegetation Optical Depth (VOD) from microwave remote sensing, we present an enhanced version with four key methodological improvements.
First, we enhanced the spatial resolution from 0.25° to 0.1°, enabling finer scale detection of spatial heterogeneity in vegetation productivity and improving representation of local ecosystem dynamics. Additionally, we transitioned from X-band to Ku-band VOD observations due to their superior signal to noise ratio in the Mediterranean region, enhancing data quality while maintaining overall model performance.
Second, we integrated land cover information to improve model generalizability across different biomes, addressing the imbalanced distribution of in-situ validation stations and enhancing the model's ability to capture ecosystem specific carbon uptake patterns. 
Third, we incorporated soil moisture data to account for water availability, which is the primary constraint on vegetation productivity in many biomes and is particularly crucial for understanding drought responses and ecosystem stress. 
Fourth, we utilized ESA CCI Biomass observations to better capture biomass accumulation patterns.
The enhanced model was validated using an expanded set of in-situ measurements, including data from WARM Winter, AmeriFlux, JapanFlux, and CH4 datasets, which significantly extends our validation capabilities across different climatic zones and ecosystem types. Validation against FLUXNET in situ measurements and comparisons with leading datasets, including MODIS and FLUXCOM, demonstrate that the finer spatial resolution better captures local scale variability while maintaining strong model accuracy and reliability. This updated VODCA2GPP version offers a valuable resource for analyzing global vegetation dynamics, enabling better monitoring of ecosystem responses to environmental change and improving our understanding of the terrestrial carbon cycle.


This research has been funded through the GLANCE project.

References:

Bernhard Wild, Irene Teubner, Leander Moesinger, Ruxandra-Maria Zotta,
Matthias Forkel, and Wouter A Dorigo. Vodca2gpp–a new, global, long-
term (1988–2020) gross primary production dataset from microwave re-
mote sensing. Earth System Science Data, 14(3):1063–1082, 2022. doi:
10.5194/essd-14-1063-2022

How to cite: Müller, M., Zotta, R., Laluet, P., and Dorigo, W.: VODCA2GPP: High Resolution GPP Estimation in the Mediterranean basin from Vegetation Optical Depth Using Machine Learning, EGU General Assembly 2026, Vienna, Austria, 3–8 May 2026, EGU26-10329, https://doi.org/10.5194/egusphere-egu26-10329, 2026.

EGU26-10408 | ECS | Posters on site | BG3.4

Towards Understanding the Inter-Annual Variation of Model Parameters Used to Simulate Gross Primary Productivity 

Ranit De, Alexander Brenning, Markus Reichstein, Ladislav Šigut, Borja Ruiz Reverter, Mika Korkiakoski, Eugénie Paul-Limoges, Peter D. Blanken, T. Andrew Black, Bert Gielen, Torbern Tagesson, Georg Wohlfahrt, Leonardo Montagnani, Sebastian Wolf, Jiquan Chen, Michael Liddell, Ankur R. Desai, Sujan Koirala, and Nuno Carvalhais

A persistent challenge for models simulating carbon fluxes, such as gross primary productivity (GPP), is that the inter-annual variability (IAV) is currently not well-represented, often underestimating the peak GPP values, while also struggling with representing the onset and end of vegetation activity. We hypothesize that the difficulty with representing IAV can be attributed to temporally fixed model parameters, and yearly varying parameters can partially alleviate it. We test this hypothesis using two models: a simple light-use efficiency (LUE) model with response functions of solar radiation, air temperature, vapor pressure deficit, cloudiness, and soil water content, and an optimality-based model that includes parameter acclimation and drought stress. These functions have multiple parameters requiring calibration.

First, we calibrated all the model parameters per site-year and found that both models can simulate annual GPP better with annually calibrated parameters (median normalized Nash-Sutcliffe efficiency, viz. NNSE: 0.74 for the LUE model) compared to parameter calibration per site (median NNSE: 0.5) or per plant functional types (median NNSE: 0.23). Thereafter, we focused on calibrating parameters of one environmental response function as year-specific (one function at a time), while simultaneously calibrating year-invariant parameters for all other functions. These exercises were conducted for 198 eddy-covariance sites. The ability to represent IAV of GPP in arid sites was substantially improved when hydrological parameters were allowed to vary between years, both for herbaceous and forest ecosystems. However, for tropical, temperate and boreal climates, improvements in IAV emerged from parametric variability controlling the GPP responses to temperature, light or atmospheric dryness. Given the paucity of arid and semi-arid sites in the dataset, allowing year-specific parameters for vapor pressure deficit and atmospheric CO2 effects yielded a median annual NNSE of 0.73 across the whole dataset for the LUE model. These results challenge our perception on temporally static parameterizations, reflecting the need to learn the empirical relationships between observations and temporally-varying parameters, or improve the representation of missing state variables. It further suggests that these may be strongly linked to below-ground plant dynamics, largely unobserved in current Earth observation networks.

However, by analyzing mean absolute deviation of parameter values from per site and per site-year model calibrations, we found that temporal variation of parameters was lower than their spatial variation. For example, spatial variability of parameters, such as optimal temperature for photosynthesis, was 82.6% higher than temporal variability. Though we show that the temporal variability of model parameters is important to better capture the IAV of GPP flux, our analyses are currently limited to eddy-covariance sites, and only for the measurement periods at these sites.

As a next step, further research is needed to explain or statistically learn the temporal variability of model parameters using environmental variables, which can be used to predict the spatiotemporal variability of model parameters at sites with no observational data or predict the future temporal trend of model parameters. This, in turn, will likely improve the performance of simulated IAV of GPP and, consequently, enhance our ability to represent unknown linkages between IAV and longer time scales.

How to cite: De, R., Brenning, A., Reichstein, M., Šigut, L., Ruiz Reverter, B., Korkiakoski, M., Paul-Limoges, E., Blanken, P. D., Black, T. A., Gielen, B., Tagesson, T., Wohlfahrt, G., Montagnani, L., Wolf, S., Chen, J., Liddell, M., Desai, A. R., Koirala, S., and Carvalhais, N.: Towards Understanding the Inter-Annual Variation of Model Parameters Used to Simulate Gross Primary Productivity, EGU General Assembly 2026, Vienna, Austria, 3–8 May 2026, EGU26-10408, https://doi.org/10.5194/egusphere-egu26-10408, 2026.

EGU26-10478 | ECS | Orals | BG3.4

Forest responses to global change: reconciling evidence from tree to continental scales in Europe 

Danielle Creek and the COST Action CA21138 CLEANFOREST Working Group 2

Information on forest responses to global change drivers remains fragmented across scientific disciplines, spatial scales, and methodological approaches, limiting our ability to understand and predict forest vulnerability and resilience. Reconciling ground-based physiological observations with landscape- to continental-scale evidence from modelling and remote sensing is essential to advance our understanding and inform effective policy for forest management.

Here, we synthesise current knowledge on how European forest condition has changed over recent decades by integrating evidence across spatial scales and methodological frameworks. We focus on three key metrics: tree growth, water-use efficiency (WUE), and tree mortality, which together link physiological processes to ecosystem-level responses and forest health. These metrics were assessed in relation to major global change drivers, including climate change (drought and climate extremes) and atmospheric pollution (rising CO₂ concentrations and changing nitrogen and sulphur deposition).

As part of Working Group 2 of the COST Action CA21138 CLEANFOREST, we conducted a systematic review of trends in European forest growth, WUE, and mortality reported since 1990. We extracted the direction of reported trends (positive, negative, or neutral) from more than 500 peer-reviewed studies, spanning dendrochronology, ecosystem flux measurements, forest inventories, modelling, and remote sensing, alongside detailed information on forest type, climate zone, tree species/genus, and site characteristics. The resulting database comprises over 1,300 observations across Europe.

Our synthesis reveals pronounced spatial, temporal, and ecological asymmetries in the European forest evidence base. Studies are heavily concentrated in Central Europe, with substantial gaps in Mediterranean, Eastern European, and high-latitude regions. Reported trends indicate predominantly negative growth and increased mortality in southern Europe, in contrast to more neutral or positive signals in central and northern regions. Across scales, tree-level observations often suggest physiological compensation (e.g. increasing WUE), whereas landscape-scale assessments more frequently reveal stagnating growth and intensified mortality, highlighting a mismatch between local adjustments and ecosystem-level responses.

By reconciling evidence across scales, this systematic review draws a comprehensive picture of the complex response of European forests to the changing climate, identifies key knowledge gaps, biogeographic biases, and opportunities to better integrate long-term monitoring networks with emerging approaches. Such integration is essential for understanding mechanisms underpinning forest responses to climate extremes and atmospheric deposition, and for improving projections of future forest functioning under global change conditions.

How to cite: Creek, D. and the COST Action CA21138 CLEANFOREST Working Group 2: Forest responses to global change: reconciling evidence from tree to continental scales in Europe, EGU General Assembly 2026, Vienna, Austria, 3–8 May 2026, EGU26-10478, https://doi.org/10.5194/egusphere-egu26-10478, 2026.

EGU26-10545 | ECS | Orals | BG3.4

Environmental controls on carbon stock recovery rates in Afrotropical secondary forest 

Viktor Van de Velde, Pascal Boeckx, Isaac Makelele, Corneille Ewango, Amani Bienvenu, Anny Estelle N'Guessan, Justin Kassi N'Dja, Bruno Hérault, and Marijn Bauters

Tropical forests are rapidly changing due to land-use conversion, with major consequences for biodiversity and the terrestrial carbon balance. Secondary (regrowth) forests now cover a larger global area than primary forests, making their carbon accumulation central to the future strength of the terrestrial carbon sink. In sub-Saharan Africa, slash-and-burn agriculture remains the dominant disturbance and is expected to intensify as the human population triples by 2100. As a result, secondary forests are increasingly reshaping regional vegetation structure, yet biomass recovery rates, drivers, and uncertainties remain poorly constrained, limiting carbon stock estimates and vegetation model performance.

We compiled a new pan-African field dataset of aboveground carbon (AGC) stocks across Afrotropical secondary forest succession using 969 inventory plots from 31 sites in 12 countries. AGC recovery trajectories were modeled within a hierarchical Bayesian framework that propagates observational and process uncertainty. Median times to recover 90% of old-growth AGC (t90) ranged from 36 to 91 years, with uncertainty intervals at some sites extending beyond a century. The early-successional AGC accumulation (first 20 years) varied widely, from 12 to 100 Mg C ha-1. Mean annual precipitation emerged as a dominant control on AGC recovery, outperforming other climatic (temperature, photosynthetically active radiation, seasonality, and maximum climatic water deficit), soil (chemical and physical), and landscape predictors (forest cover and distance metrics). Absolute AGC accumulation during the first two decades was more predictable (R² = 0.56) than recovery relative to old-growth reference conditions (R² = 0.21), a pattern especially relevant for carbon sequestration assessments.

Overall, forest carbon recovery across the Afrotropics is relatively slow, heterogeneous, and often highly uncertain. By synthesizing extensive field data, this study provides empirical benchmarks for validating vegetation models and improving projections of the terrestrial carbon sink. However, the large uncertainties underscore the need to expand long-term forest inventories and reinforce the importance of conserving the remaining old-growth forests alongside the carbon sequestration potential of natural regeneration.

How to cite: Van de Velde, V., Boeckx, P., Makelele, I., Ewango, C., Bienvenu, A., N'Guessan, A. E., N'Dja, J. K., Hérault, B., and Bauters, M.: Environmental controls on carbon stock recovery rates in Afrotropical secondary forest, EGU General Assembly 2026, Vienna, Austria, 3–8 May 2026, EGU26-10545, https://doi.org/10.5194/egusphere-egu26-10545, 2026.

EGU26-10688 * | Orals | BG3.4 | Highlight

Summer solstice orchestrates the subcontinental-scale synchrony of European beech (Fagus sylvatica) mast seeding 

Jakub Szymkowiak, Valentin Journé, Jessie Foest, Andrew Hacket-Pain, Dave Kelly, and Michał Bogdziewicz

Tree mast seeding i.e., synchronous, highly variable seed production among years, has wide consequences for ecosystem functioning. In a large-seeding year, a pulse of resources is made available to wildlife over the large spatial scale by virtue of the synchronous reproduction by millions of trees. But how trees synchronize masting over the vast geographical areas? A major mechanism governing the annual allocation of resources to seed production is weather variation. If individuals respond to the same “weather cue” across extensive regions, masting synchrony can emerge. This requires, however, the timing of the cue window being well conserved across species range, but mechanisms facilitating such stability remain unknown. Here, we investigated factors driving masting synchrony in European beech, which extends to the thousands of kilometres throughout its geographic range. We used a moving window analysis to determine how correlations between annual seed production and mean temperatures in 61 populations of European beech sampled across the species' range fluctuate at a fine temporal scale. We found that correlation coefficient values between seed production and temperature rapidly increased after the summer solstice, compared to before it. Moreover, using temporally-restricted permutation tests we showed that this abrupt increase in masting-weather correlations at the solstice is not driven purely by chance. Beech achieves high spatial synchrony in seed production by anchoring the weather cue window to the summer solstice - the longest day of the year that occurs simultaneously across the whole Northern Hemisphere. Beech abruptly opens its temperature-sensing window on the solstice, hence widely separated populations all start responding to weather signals in the same week. This enables cohesive timekeeping across distant populations inhabiting diverse climatic regions and creates a high precision timing of the Moran effect, leading to the subcontinental-scale synchrony of beech mast seeding.

How to cite: Szymkowiak, J., Journé, V., Foest, J., Hacket-Pain, A., Kelly, D., and Bogdziewicz, M.: Summer solstice orchestrates the subcontinental-scale synchrony of European beech (Fagus sylvatica) mast seeding, EGU General Assembly 2026, Vienna, Austria, 3–8 May 2026, EGU26-10688, https://doi.org/10.5194/egusphere-egu26-10688, 2026.

EGU26-11409 | ECS | Orals | BG3.4

When models meet data: Limits to detecting CO₂ effects in tropical forests 

Sophie A. Zwartsenberg, Jorad de Vries, Frank J. Sterck, Niels P.R. Anten, and Pieter A. Zuidema

Photosynthetic theory predicts that rising atmospheric CO₂ should enhance photosynthesis in tropical trees, potentially increasing stem growth and strengthening the tropical forest carbon sink. However, consistent positive CO₂ effects on stem growth are rarely detected in observational studies. Here, we investigate whether tree light exposure, climatic variability, and statistical limitations can explain this apparent discrepancy.

We used a previously parameterised and tested forest model to simulate tropical tree populations under fixed and rising historical CO₂ and climate representative for SE Asian lowland tropical forest. To represent realistic variation in light availability, trees were simulated in gaps of different sizes, explicitly resolving height-dependent light gradients, constraints on maximum canopy size, and dynamic changes in light conditions as trees grow. Simulations were conducted under source-limited conditions.

Across simulations, CO₂ effects on growth were weak compared to the effects of climate and light availability. The simulated CO₂ response was comparable in magnitude to effects reported in temperate forest FACE experiments, but substantially stronger than those typically inferred from tree-ring studies. CO₂ effects were amplified in cooler years but showed little sensitivity to precipitation variability.

Using the simulated data, we then evaluated whether recommended statistical approaches for the detection of CO₂ effects in tree rings could recover the CO₂ signal obtained from the model simulations. We found that, despite its relatively strong magnitude, the CO₂ effect was difficult to detect reliably. Two out of four tried methods detected a CO₂ effect, but its presence and strength were strongly dependent on the statistical model assumptions.  

These results highlight the challenges of attributing CO₂ effects on tree growth in real-world observational data, which are subject to substantial noise and may exhibit weaker responses. Progress in detecting CO₂ effects may benefit from closer integration of simulation experiments and statistical inference to guide study design and interpretation.

How to cite: Zwartsenberg, S. A., de Vries, J., Sterck, F. J., Anten, N. P. R., and Zuidema, P. A.: When models meet data: Limits to detecting CO₂ effects in tropical forests, EGU General Assembly 2026, Vienna, Austria, 3–8 May 2026, EGU26-11409, https://doi.org/10.5194/egusphere-egu26-11409, 2026.

EGU26-12467 | ECS | Orals | BG3.4

Recent intensification of forest disturbances in the Alps and implications for carbon dynamics 

Anna Candotti, Siyuan Wang, Nuno Carvalhais, and Enrico Tomelleri

Changes in forest disturbances can have strong impacts on forest structure and carbon dynamics. Yet, we lack consistent long-term data on forest disturbance regime shifts and their implications for carbon stocks. Observational evidence is mandatory for developing adaptation strategies in vulnerable regions such as the European Alps. Here, we present an observation-based, alpine-scale characterization of forest disturbances and their temporal evolution, together with modelled impacts on above-ground biomass (AGB) under different disturbance regimes. We applied a Landsat-based time series change detection approach to classify stand-replacing disturbances across the Alps for the period 1984-2024. Disturbance regimes were characterized using metrics such as event frequency, severity, return intervals and temporal trends. Disturbance regime parameters (probability scale, clustering degree and intensity slope) were derived by decade and used in a model inversion framework to assess AGB responses under different disturbance regimes. Our results indicate a marked intensification of disturbances in recent years. While disturbance peak years were synchronized between the western and the eastern Alpine ranges, the western Alps did not exhibit an increasing disturbance trend. In contrast, disturbance severity in the eastern Alps has significantly changed in the last decade compared to previous decades with both a mean rise in disturbances and a higher frequency of years characterized by an extreme number of disturbance events. Spatially, this increase was widespread across the eastern Alps and not confined to distinct hotspot areas. Outputs from dynamic carbon simulations showed that under the current disturbance regime (2014-2024) AGB can be reduced by 25% relative to the past disturbance regime (1984-1994), with convergence times between regimes spanning between 10 to 100 years. Overall, our findings provide robust observational evidence of an ongoing forest disturbance regime shift in the eastern Alps and demonstrate its substantial impacts on forest carbon dynamics. This work provides spatial and temporal information for understanding changes in carbon dynamics in alpine forests as well as an empirical foundation for improving disturbance-aware carbon modelling. The outcomes can inform adaptation and management strategies.

How to cite: Candotti, A., Wang, S., Carvalhais, N., and Tomelleri, E.: Recent intensification of forest disturbances in the Alps and implications for carbon dynamics, EGU General Assembly 2026, Vienna, Austria, 3–8 May 2026, EGU26-12467, https://doi.org/10.5194/egusphere-egu26-12467, 2026.

EGU26-12959 | Orals | BG3.4

Climate Controls on Canopy Turnover: The Role of Atmospheric Demand and Hydrological Legacies in an Amazonian Lowland Forest 

Katrin Fleischer, Juliëtte Bleichrodt, Florian Hofhansl, Amanda Damasceno, Iokanam Pereira, Lucia Fuchslueger, Oscar J. Valverde-Barrantes, Nathielly P. Martins, Izabela F. Aleixo, Laynara F. Lugli, Ana Caroline Miron, and Sabrina Garcia and the AmazonFACE team

The Amazon rainforest, home to nearly 40% of Earth’s tropical forest biomass, plays a central role in the global carbon sink. Recent observations indicate a decline in net carbon uptake, attributed to intensifying hydro-climatic extremes, deforestation, and forest degradation. Seasonal droughts are lengthening, wet-season onsets are delaying, and strong El Niño events are becoming more frequent, yet the mechanisms by which these changes influence ecosystem processes remain poorly understood.

Leaf litterfall is a major pathway of carbon and nutrient transfer from vegetation to soils, integrating climate seasonality, atmospheric demand, and plant physiological strategies. Here, we analyze eight years of litterfall observations from a lowland Amazon rainforest together with meteorological data to identify seasonal and interannual climate controls on canopy turnover.

We find that litterfall dynamics differ systematically between years with typical and anomalous litterfall patterns. In years with typical seasonality, litterfall patterns are well explained by atmospheric moisture and pressure variables, with maximum relative humidity and barometric pressure emerging as dominant predictors. In contrast, anomalous years show distinct responses depending on hydro-climatic context: wetter wet seasons followed by intense dry seasons are associated with elevated litterfall, best explained by cumulative water deficit, whereas drier wet seasons are linked to suppressed litterfall driven by high evaporative demand, captured by potential evapotranspiration. Across all conditions, litterfall reflects the combined influence of antecedent hydrological states and immediate atmospheric demand, challenging phenology frameworks based primarily on precipitation or temperature alone.

Moisture-demand and pressure variables such as vapor pressure deficit, potential evapotranspiration, and barometric pressure may thus provide powerful yet underutilized insights into vegetation turnover, although better models will emerge from the integration of other biological processes such as stem flow and root dynamics. As climate change alters seasonality and increases hydro-climatic extremes, disruptions in canopy turnover are likely to influence vegetation dynamics, nutrient cycling, and the future resilience of the Amazon forests.

How to cite: Fleischer, K., Bleichrodt, J., Hofhansl, F., Damasceno, A., Pereira, I., Fuchslueger, L., Valverde-Barrantes, O. J., P. Martins, N., Aleixo, I. F., F. Lugli, L., Miron, A. C., and Garcia, S. and the AmazonFACE team: Climate Controls on Canopy Turnover: The Role of Atmospheric Demand and Hydrological Legacies in an Amazonian Lowland Forest, EGU General Assembly 2026, Vienna, Austria, 3–8 May 2026, EGU26-12959, https://doi.org/10.5194/egusphere-egu26-12959, 2026.

EGU26-12999 | ECS | Orals | BG3.4

Pan-European forest stand age estimates using field-based and earth observation data 

Marina Rodes-Blanco, Julen Astigarraga, Thomas Pugh, and Paloma Ruiz-Benito and the ClimbForest (stand age)

Forest stand age is a key variable in modeling carbon storage and uptake in forest ecosystems. However, consistently estimating stand age across Europe remains challenging due to labor-intensive field measurements and heterogeneous estimation methods. In addition, the availability and coverage of stand age field data vary widely across countries, with some lacking data entirely. Here, we present a spatially explicit forest stand age dataset for 2010 across Europe at multiple spatial resolutions. For regions with field data, stand age was estimated by integrating national forest inventory data with satellite-based disturbance information. For regions without field data, we used machine-learning models combining climate variables, satellite-derived tree height, and other Earth observation metrics to generate continent-wide stand age estimates. The resulting datasets provide the spatial distribution of forest stand age across Europe at 0.5° resolution for continental-scale analyses and ~ 1 km² resolution for regional applications, including associated uncertainty estimates, highlighting regions where old-growth forests are more likely to persist. By leveraging one of the largest compilations of forest field observations together with Earth observation data, our approach substantially reduces uncertainty relative to previous spatially explicit stand-age products, enabling their use in ecosystem modeling, biodiversity conservation, and climate adaptation planning across multiple scales.

Funding acknowledgement:
CLIMB-FOREST Horizon Europe project (No. 101059888), European Union.

How to cite: Rodes-Blanco, M., Astigarraga, J., Pugh, T., and Ruiz-Benito, P. and the ClimbForest (stand age): Pan-European forest stand age estimates using field-based and earth observation data, EGU General Assembly 2026, Vienna, Austria, 3–8 May 2026, EGU26-12999, https://doi.org/10.5194/egusphere-egu26-12999, 2026.

EGU26-13930 | Orals | BG3.4

Tracking terrestrial biomass from space: patterns, trends, and uncertainties 

Maurizio Santoro, Oliver Cartus, Samuel Favrichon, Viola Heinrich, Mikhail Urbazaev, Arnan Araza, and Martin Herold

The proliferation of satellite missions targeting observations of terrestrial land surfaces has substantially increased efforts to map and monitor carbon stored in vegetation using remote-sensing datasets. One such effort, ESA’s Climate Change Initiative (CCI) Biomass project, is about to release an 18-year record of global aboveground biomass (AGB) maps covering the periods 2005–2012 and 2015–2024 at a spatial resolution of 1 hectare. This latest release (version 7.0) significantly extends previous data records and reduces temporal inconsistencies caused by the diverse set of satellite observations required to construct such a long time series. With this release, the CCI Biomass dataset enables the tracking of carbon dynamics in terrestrial vegetation over the past two decades and is now comparable with other global, satellite-based, spatially explicit datasets.

In this presentation, we highlight three key findings derived from the CCI Biomass dataset.

  • We identify spatially consistent biomass accumulation in tropical secondary forests in Brazil, in agreement with sample-based estimates derived from in situ measurements where available. Spatially resolved growth trends, combined with forest age information from the MapBiomas dataset, indicate higher growth rates in the western Amazon, with peaks of up to 10 Mg ha⁻¹ yr⁻¹ at approximately 10–15 years of forest age. In contrast, growth rates in the eastern Amazon do not exceed 5 Mg ha⁻¹ yr⁻¹.
  • We detect contrasting biomass trends in primary forests of the Brazilian Amazon. Below a biomass threshold of 250 Mg ha⁻¹, forests exhibit an average accumulation of approximately 1–2 Mg ha⁻¹ yr⁻¹, whereas above this threshold high-biomass forests show a decline of around −1 Mg ha⁻¹ yr⁻¹. These findings are consistent with recent evidence suggesting a weakening of the Amazon carbon sink. However, they remain unconfirmed and will need further investigation, particularly with respect to statistical significance, given the substantial pixel-level uncertainty in the CCI Biomass estimates.
  • A comparison among several global AGB datasets derived from satellite data (e.g., Xu et al., Boitard et al., Li et al., Santoro et al.), including CCI Biomass, reveals broad agreement in the spatial distribution of biomass. However, absolute AGB estimates can differ by up to 100% among datasets, irrespective of geographic location. Moreover, temporal biomass trajectories often diverge, showing differences in the magnitude of fluctuations and, in some cases, opposing growth trends. Overall, our analysis underscores the need for a systematic intercomparison of remote-sensing-based AGB datasets using a common framework to assess their accuracy and uncertainty.

How to cite: Santoro, M., Cartus, O., Favrichon, S., Heinrich, V., Urbazaev, M., Araza, A., and Herold, M.: Tracking terrestrial biomass from space: patterns, trends, and uncertainties, EGU General Assembly 2026, Vienna, Austria, 3–8 May 2026, EGU26-13930, https://doi.org/10.5194/egusphere-egu26-13930, 2026.

EGU26-14168 | ECS | Posters on site | BG3.4

Drivers and patterns of forest above-ground biomass carbon losses in the conterminous USA 

Guohua Liu, Shengli Tao, Laura Eifler, Philippe Ciais, and Ana Bastos

Rising tree mortality threatens the forest carbon sink and may destabilize the global carbon cycle. Because tree mortality is driven by diverse disturbance agents (e.g., drought, insects, wind, fire), its impacts on above-ground biomass carbon (AGC) and its controlling factors vary widely and remain poorly constrained. Based on a consistent, multi-decadal record of biomass carbon from radar backscatter, we quantify AGC losses associated with specific disturbance agents in conterminous USA. We then develop agent-specific machine-learning models that relate mortality-driven AGC dynamics to climatic drivers (e.g., temperature, moisture deficits), vegetation characteristics, and soil properties. This framework could reveal how sensitivities and thresholds differ among agents and identify regions and conditions where forests are most vulnerable to mortality-related carbon losses. Our results support improved representation of tree mortality processes and associated carbon fluxes in Earth System Models, strengthening projections of present and future vegetation dynamics and carbon stocks under changing disturbance regimes.


How to cite: Liu, G., Tao, S., Eifler, L., Ciais, P., and Bastos, A.: Drivers and patterns of forest above-ground biomass carbon losses in the conterminous USA, EGU General Assembly 2026, Vienna, Austria, 3–8 May 2026, EGU26-14168, https://doi.org/10.5194/egusphere-egu26-14168, 2026.

EGU26-14440 | ECS | Posters on site | BG3.4

Impacts of Shrub Coverage for modeled arctic Ecosystem Carbon Uptake and Storage 

Tamara Emmerichs, Fabrice Lacroix, Victor Brovkin, Cheng Gong, Soenke Zaehle, Carolina Voigt, Klaus Steenberg Larsen, Sofie Sjogersten, and Eeva-Stiina Tuittila

Shrub vegetation has been expanding across Arctic regions in response to climate warming. However, its effects on terrestrial carbon cycling remain poorly understood. Moreover, shrubs are often underrepresented in land surface models. Here, we incorporated two shrub functional types—deciduous and evergreen, which exhibit distinct strategies from trees—into the nutrient-enabled QUINCY model.

The updated model simulates gross primary production (GPP) at site level in broad agreement with recent observations. Model simulations suggest that shrub expansion into needle-leaved forests or grasslands increases GPP by an average of 13% and 40%, respectively. Shrubs also produce substantial above-ground biomass—lower than in needle-leaved forests but higher than in grasslands—with these differences partly driven by both CO₂ and climate effects.

Our analyses reveal a strong model sensitivity to nitrogen availability. While the model applying unlimited nitrogen supply leads to an overestimation of maximum GPP at most study sites, activating the interactive nitrogen cycle suppresses GPP by up to 50% relative to flux-based observational constraints (ABCfluxnet). An additional sensitivity experiment, introducing permafrost nutrient inputs, improves soil carbon estimates but still results in GPP overestimation.

How to cite: Emmerichs, T., Lacroix, F., Brovkin, V., Gong, C., Zaehle, S., Voigt, C., Steenberg Larsen, K., Sjogersten, S., and Tuittila, E.-S.: Impacts of Shrub Coverage for modeled arctic Ecosystem Carbon Uptake and Storage, EGU General Assembly 2026, Vienna, Austria, 3–8 May 2026, EGU26-14440, https://doi.org/10.5194/egusphere-egu26-14440, 2026.

EGU26-14844 | Orals | BG3.4

Lianas reshape tree height allometry across tropical forests 

Hans Verbeeck, Sruthi M. Krishna Moorthy, and Félicien Meunier and the Data contributors and collaborators

Lianas exist in virtually every tropical forest, play a vital role for their functioning but also exert a strong pressure on their hosting trees. The exact influence of lianas on tree structure is poorly understood, despite its potential implications. Here, we investigated the relationship between liana infestation and tree height across the pantropics. Our analysis based on 50,473 tree records revealed substantial individual tree height reduction with liana infestation. Controlling for species, size and site, trees were on average 4.2% and 7.8% shorter when moderately and heavily infested by lianas compared to their liana-free counterparts. Substantial tree height reduction for heavily infested trees was found in a majority of the abundant species in our dataset, as well as in 46 of the 66 sites that we compiled in this study. Among the sites where a substantial liana-induced tree height reduction was identified, its magnitude varied between 3.6% and 39.3% for a 50 cm DBH tree under heavy liana infestation. Liana impact on tree height varied with disturbance, elevation and climate. In lowland, old-growth forests, liana impacts on tree height strengthened under drier conditions and warmer temperature regimes, particularly in sites characterised by higher minimum temperatures, warmer warm-season conditions, and reduced thermal seasonality. As global warming is predicted to exacerbate these climatic drivers, individual tree height reduction with heavy liana infestation could aggravate pantropically by 48% (middle of the road emission scenario) to 92% (business as usual) by the end of this century. Given the central role of tropical forest structure in governing carbon sequestration and climate feedback, these findings, coupled to the globally observed increase in tropical liana abundance, suggests that lianas could disproportionately influence Earth system functioning under future climate change.

How to cite: Verbeeck, H., Krishna Moorthy, S. M., and Meunier, F. and the Data contributors and collaborators: Lianas reshape tree height allometry across tropical forests, EGU General Assembly 2026, Vienna, Austria, 3–8 May 2026, EGU26-14844, https://doi.org/10.5194/egusphere-egu26-14844, 2026.

EGU26-14847 | Posters on site | BG3.4

Influence of Species Distribution, Site Conditions, and Model Structure on Carbon Stock and Sequestration Estimates in German Forests 

Rüdiger Grote, Hassane Moutahir, Yanick Ziegler, Martin Thurner, Ralf Kiese, and Nadine Ruehr

Forests play a central role in climate change mitigation through carbon sequestration and storage, yet spatial estimates remain highly uncertain due to variability in species composition, site conditions, and model representations of ecosystem processes. An example is presented as carbon stocks and sequestration rates are estimated for all forests in Germany using the process-based LandscapeDNDC model. This demonstrates the dependence on dominant tree species considering beech (Fagus sylvatica), oak (Quercus spp.), spruce (Picea abies), and pine (Pinus sylvestris), as well site conditions. Regarding the latter, the spatial resolution of 10 × 10 km enables to evaluation the role of soil fertility and water storage as well as precipitation and temperature effects.

The example also illustrates that the model is not able to represent the large carbon losses that have occurred during and after the extreme dry years 2018/2019 and neglects potential legacy effects. Therefore, it is suggested relating tree mortality and tree water deficit (TWD). Physically determined thresholds as well as theoretical concepts are available to principally derive the probability of mortality in cohort-based forest models. The new module provides a physically-based mechanism that very much depends on species-specific traits such as sapwood longevity and rooting intensity, but is robust against uncertainties in soil texture initialization. Furthermore, it is shown that it can easily be evaluated with micro-dendrometer data which are increasingly available.

How to cite: Grote, R., Moutahir, H., Ziegler, Y., Thurner, M., Kiese, R., and Ruehr, N.: Influence of Species Distribution, Site Conditions, and Model Structure on Carbon Stock and Sequestration Estimates in German Forests, EGU General Assembly 2026, Vienna, Austria, 3–8 May 2026, EGU26-14847, https://doi.org/10.5194/egusphere-egu26-14847, 2026.

EGU26-15263 | Orals | BG3.4

TIPMIP-BIO: Towards a unified simulation protocol to assess potential tipping behavior in the biosphere and associated feedbacks and processes 

Delphine Tardif, Anna B. Harper, Marina Hirota, Boris Sakschewski, Goran Georgievski, José Licon Salaiz, Sina Loriani, Donovan P. Dennis, Jonathan F. Donges, and Ricarda Winkemann

The terrestrial biosphere plays a crucial role in regulating biogeochemical cycles, storing carbon, and providing essential ecosystem services, yet the land carbon sink remains a large source of uncertainty in future climate projections. Under the combined pressures of climate change, land use, pests, and fire, major biomes such as the Amazon and boreal forests face widespread degradation and may exhibit tipping behavior. The Tipping Points Modelling Intercomparison Project (TIPMIP) brings together the modelling community to develop unified simulation protocols for Earth System Models and standalone models, including Dynamic Global Vegetation Models. In this context, TIPMIP-BIO aims at running idealized experiments of climate overshoot and stabilizations scenarios, in order to assess climatic and deforestation thresholds that could trigger nonlinear biosphere responses. The framework provides opportunities to examine key processes and feedbacks, including CO₂ fertilization and physiological responses, and to explore emerging questions such as plant trait variability and the impact of compound climate events.

How to cite: Tardif, D., Harper, A. B., Hirota, M., Sakschewski, B., Georgievski, G., Licon Salaiz, J., Loriani, S., Dennis, D. P., Donges, J. F., and Winkemann, R.: TIPMIP-BIO: Towards a unified simulation protocol to assess potential tipping behavior in the biosphere and associated feedbacks and processes, EGU General Assembly 2026, Vienna, Austria, 3–8 May 2026, EGU26-15263, https://doi.org/10.5194/egusphere-egu26-15263, 2026.

To mitigate damage from increasingly frequent and severe floods under climate change, the use of riparian corridors as flood buffers has been expanding. In particular, as part of Nature-based Solutions (NbS), growing efforts have focused on designing flood-buffer areas that reflect natural landscapes and geomorphic settings while actively incorporating natural attributes such as existing ecological conditions and vegetation distribution. In parallel, in response to carbon-neutrality policies, NbS-based flood-buffer spaces are increasingly being designed to include riparian vegetation communities—especially willows—so that these areas can also function as carbon sinks. Among willow species, Salix nipponica is the dominant riparian species in Korea; however, quantitative information on its age-dependent carbon dioxide uptake remains insufficient. Because carbon dioxide uptake can vary substantially with plant age, assessing uptake by growth stage or age class provides an important basis for characterizing carbon-sequestration potential and informing NbS design. In this study, we established a field-scale, grid-based cultivation system that enables annual destructive biomass sampling of Salix nipponica, with the ultimate objective of estimating age-dependent carbon dioxide uptake from the collected biomass data.

The field-scale grid-based cultivation system was established at the River Experiment Center of the Korea Institute of Civil Engineering and Building Technology using seeds of Salix nipponica collected from the Nakdonggang River. To identify growth characteristics, the basal diameter and height of sample trees were measured annually. Biomass for carbon dioxide uptake estimation was measured after uprooting sample trees and oven-drying to constant weight. Carbon dioxide uptake calculated from these directly measured biomass data corresponds to a measurement-based Tier 3 approach under the IPCC (Intergovernmental Panel on Climate Change) guideline. Associated with growth was estimated by applying the carbon fraction of dry matter and the mass ratio of CO₂ to C provided in the IPCC guideline.

The results of this study are presented for years 1–3 after planting in the cultivation system. Average individual biomass increased from 37 g (one-year) to 847 g (two-year) and 2,526 g (three-year), while average annual CO₂ uptake increased from 0.3 to 4 and 8 ton·ha⁻¹·yr⁻¹ over the same period. The increase in both biomass and average annual CO₂ uptake from one-year to two-year was larger than that from two-year to three-year. Compared with a previous study that estimated age-dependent CO₂ uptake for major forest tree species, CO₂ uptake in Salix nipponica was 1.2 times higher in two-year than that of same-aged softwood species and 1.3 times higher in three-year than that of same-aged hardwood species. The results quantitatively present the carbon sequestration potential of riparian willow stands in Korea. The identified age-dependent carbon dioxide uptake characteristics of Salix nipponica would demonstrate applicability to the development of river management strategies for climate change adaptation.


Acknowledge

This research was funded by the Korea Environment Industry & Technology Institute (KEITI) through the Smart Water-supply Service Research Program, funded by the Korea Ministry of Climate, Energy, Environment (MCEE)(RS-2022-KE002091).

How to cite: Park, Y., Ryu, J., and Ji, U.: Age-dependent CO2 uptake of Salix nipponica estimated from annual destructive biomass sampling in a field-scale grid-based cultivation system, EGU General Assembly 2026, Vienna, Austria, 3–8 May 2026, EGU26-16156, https://doi.org/10.5194/egusphere-egu26-16156, 2026.

EGU26-16286 | Orals | BG3.4

How changes in vegetation cover affect nutrient dynamics of forest ecosystems 

Katarína Merganičová, Juraj Lieskovský, Adrienne Ortmann-Ajkai, Dominik Kaim, Krzysztof Ostafin, Premysl Stych, Hrvoje Marjanovic, Dóra Hidy, Zoltán Barcza, and Ján Merganič

Understanding how changes in vegetation cover affect nutrient dynamics is essential for predicting future ecosystem responses to environmental change. In this study, we integrated ground-based observations, remote sensing data, and dynamic process-based modelling to investigate vegetation dynamics under changing environmental conditions and disturbances driven by both natural processes and human activities. Our primary objective was to assess how land-use change, disturbances, and management practices influence nutrient cycling in plant ecosystems.

To address this objective, we compiled detailed land-use and land-cover data for 270 currently forested sites across five European countries (Croatia, Hungary, Slovakia, Czech Republic, and Poland). Data sources spanned from the second half of the 18th century to the present and included historical military maps, aerial photographs, satellite imagery, and forest management plans. The analysis revealed that 84% of sites experienced a vegetation change, while one third of them underwent multiple types of change. Management interventions were the most common driver occurring on more than a half of sites, followed by shifts in tree species composition at over one third of sites and deforestation observed at one quarter of sites. Natural disturbances were identified only at one fifth of sites.

Subsequently, we simulated vegetation dynamics using the process-based model Biome-BGCMuSo. Each site was modelled under two simulation set-ups: one considering only the current ecosystem state, and another incorporating the documented vegetation changes over the past 200 years. This design enabled us to isolate the effects of historical vegetation dynamics on ecosystem stocks and fluxes. In total, 40 variables related to carbon, nitrogen, and water cycling were analysed. The magnitudes of differences between the two set-ups varied among ecosystem components, sites, and species, and were strongly linked to the type and frequency of vegetation changes. The most pronounced negative effects, reaching up to 50% difference, were observed in soil, litter, and coarse woody debris carbon and nitrogen stocks, as well as in net ecosystem exchange and heterotrophic respiration following deforestation.

Our results highlight the critical importance of accounting for historical vegetation changes in ecosystem modelling. By demonstrating how legacy effects shape present-day nutrient dynamics, this study underscores that ecosystem functioning reflects not only current conditions but also the cumulative influence of past land use, management, and disturbance history.

The study was funded by the EU NextGenerationEU through the Recovery and Resilience Plan for Slovakia under the project No. 09I03-03-V04- 00130.

How to cite: Merganičová, K., Lieskovský, J., Ortmann-Ajkai, A., Kaim, D., Ostafin, K., Stych, P., Marjanovic, H., Hidy, D., Barcza, Z., and Merganič, J.: How changes in vegetation cover affect nutrient dynamics of forest ecosystems, EGU General Assembly 2026, Vienna, Austria, 3–8 May 2026, EGU26-16286, https://doi.org/10.5194/egusphere-egu26-16286, 2026.

EGU26-18460 | Posters on site | BG3.4

Unraveling Post-fire Forest Recovery in Russia: Spatial Heterogeneity and Climatic Constraints 

nan meng, yidi xu, agnes pellissier-tanon, philippe ciais, and nicolas viovy

Wildfires are intensifying across boreal regions under climate warming, causing biomass losses, yet post-fire forest recovery and its drivers remain poorly quantified at large spatial scales in Russia. Here, we delineated forest fire disturbances by integrating multiple satellite-derived burned-area datasets with a consensus-based approach to reduce dataset uncertainties. We then applied a space-for-time substitution framework integrating forest fire disturbance, forest age, and aboveground biomass to quantify key forest recovery metrics for forest biomass recovery: AGBmax (potential maximum aboveground biomass), R30 (recovery rate at 0-30 yr), and T90 (recovery time to reach 90% of AGBmax). These metrics were validated against field measurements, and their environmental drivers were further explored using machine learning models. Forest fire hotspots were concentrated in central Russia, 151.3 Mha of cumulative burned area during 1985-2022. The median values of AGBmax, R30, and T90 were 99.7 Mg ha-1, 1.83 Mg ha-1 yr-1, and 127 yr, respectively. Spatial patterns were highly heterogeneous, with southern and western regions showing higher AGBmax and faster R30, while eastern and southwestern regions exhibited longer T90. Validation against field observations confirmed that the fitted curves closely reproduced observed recovery trajectories. Climate conditions, especially drought and low solar radiation, strongly constrain R30 and AGBmax, and while also prolonging T90. These findings enhance our understanding of post-fire forest resilience and the climatic controls on recovery across Russia, providing a robust foundation for future assessments of ecosystem carbon dynamics.

How to cite: meng, N., xu, Y., pellissier-tanon, A., ciais, P., and viovy, N.: Unraveling Post-fire Forest Recovery in Russia: Spatial Heterogeneity and Climatic Constraints, EGU General Assembly 2026, Vienna, Austria, 3–8 May 2026, EGU26-18460, https://doi.org/10.5194/egusphere-egu26-18460, 2026.

EGU26-18502 | ECS | Orals | BG3.4

Integrating remote sensing-based maps of biomass and disturbances for future forest carbon sequestration scenarios in France 

Agnès Pellissier-Tanon, Yidi Xu, François Ritter, Nikola Besic, and Philippe Ciais

Forests play a central role in climate change mitigation, yet large uncertainties persist in quantifying their future carbon sequestration potential, particularly under increasing disturbance pressure. Here we develop a spatially explicit, species-resolved assessment of present and future forest carbon dynamics in France by integrating high-resolution Earth observation products with national forest inventory data. Using 10–30 m maps of above-ground biomass, tree species composition, and disturbance history derived from satellite observations, we reconstruct species- and region-specific forest growth curves through a space-for-time approach, independently constrained using field measurements from the French National Forest Inventory. These growth curves are assimilated into a data-driven bookkeeping model that tracks annual biomass gains and losses from growth, harvest, and natural disturbances across metropolitan France from 2020 to 2050.

Our results indicate that, in the absence of disturbances, French forests could increase above-ground carbon stocks by up to 32% by 2050, driven primarily by the growth of young conifer stands. However, when realistic disturbance and harvest regimes extrapolated from recent trends are accounted for, net carbon accumulation is reduced to 23%, highlighting the strong moderating influence of unplanned disturbances and management. Carbon sequestration potential and resilience vary markedly across species and regions: mixed and deciduous stands generally exhibit greater robustness, whereas intensively managed conifers—particularly fir–spruce, Douglas fir, and maritime pine—are disproportionately vulnerable to combined disturbance and harvest pressures.

By explicitly representing forest demography, species composition, and disturbance regimes at high spatial resolution, our framework delivers a realistic projection of the French forest carbon sink to mid-century. These results provide actionable insights for forest-based mitigation strategies, revealing where carbon storage can be enhanced, where resilience is limited, and how current management trajectories may constrain future climate benefits.

How to cite: Pellissier-Tanon, A., Xu, Y., Ritter, F., Besic, N., and Ciais, P.: Integrating remote sensing-based maps of biomass and disturbances for future forest carbon sequestration scenarios in France, EGU General Assembly 2026, Vienna, Austria, 3–8 May 2026, EGU26-18502, https://doi.org/10.5194/egusphere-egu26-18502, 2026.

EGU26-19021 | Orals | BG3.4

Increasing carbon storage capacity across global forest biomes 

Benjamin D. Stocker and Laura Marqués and the Global Forest Inventory Data Analysis Team

The carbon (C) sink in aboveground woody biomass (B) of mature forests remains one of the most uncertain components of the global C budget, with contrasting estimates from forest inventories, remote sensing, and ecosystem models, and an uncertain contribution from environmental change. The self-thinning relationship—describing the decline in tree density as mean tree size increases—encapsulates the carrying capacity for B and varies across forest types and environments. Assessing its temporal stability enables the separation of C uptake driven by changes in forest area or recovery from past disturbance from changes in the carrying capacity of mature forest biomass, potentially induced by environmental change.

Here, we compiled 105,763 inventories in natural forests spanning all major forest biomes worldwide to quantify temporal changes in the self-thinning relationship at the global scale. We detected a gradual and pervasive upward shift of the tree density–size relationship across all biomes, suggesting a thickening of mature forests and a partial relaxation of self-thinning constraints. The most pronounced thickening occurred in forests located in warm, dry climates and in regions with low nitrogen deposition and high soil phosphorus availability, whereas forests characterized by high soil C:N ratios and elevated organic carbon content showed the weakest responses. The observed shift in the self-thinning relationship implies a global C sink of 1.9 Pg C yr-1 [95% confidence interval: 1.77-2.07 Pg C yr-1], highlighting the changing carrying capacity of aboveground biomass stocks in mature forests as a key mechanism underlying the persistent terrestrial C sink.

How to cite: Stocker, B. D. and Marqués, L. and the Global Forest Inventory Data Analysis Team: Increasing carbon storage capacity across global forest biomes, EGU General Assembly 2026, Vienna, Austria, 3–8 May 2026, EGU26-19021, https://doi.org/10.5194/egusphere-egu26-19021, 2026.

EGU26-20254 | ECS | Orals | BG3.4

Physical limits of carbon storage on land under present and future climate 

Caspar Roebroek, Luca Caporaso, Alessandro Cescatti, Gregory Duveiller, Edouard Davin, and Sonia Seneviratne

Forest ecosystems are the main terrestrial carbon sinks and therefore play a critical role in global climate mitigation strategies. However, their long-term maximum capacity to store carbon under present and future climate conditions remains uncertain. To address this knowledge gap, we investigated the limits of above-ground biomass accumulation in existing forests and non-forested areas, and predicted how climate change scenarios could impact this carbon storage capacity. We evaluate the physical constraints on carbon accumulation, using a machine learning framework that integrates climate, pedologic, and hydrological parameters with natural forest disturbances, and CO₂ fertilization effects on forest growth. The results show that relying on forests to offset business-as-usual carbon emissions is possible only to a very limited extent. Projections of future forest carbon in existing forests remain highly uncertain and critically dependent on the methods and assumptions used for the assessments. Climate model-based estimates–which are often used in international policy and IPCC reports–suggest substantial future increases in carbon storage capacity, mainly driven by a strong CO₂ fertilisation effect. On the contrary, experimental and satellite-based evidence suggests much weaker increases or even a stabilisation of the terrestrial sink. Furthermore, our results suggest that ecosystem vulnerability to climate extremes will increase the frequency and severity of natural disturbances in the tropical and mid-latitude regions, ultimately reducing the effective long-term capacity of forests to store carbon. Potential increases in the carbon storage of boreal ecosystems could partially offset these losses, but only over longer timescales that cannot compensate for near-term declines elsewhere. These results highlight the need to reframe the potential of forest-based solutions for climate mitigation: not as an offset for anthropogenic carbon emissions, but as an essential buffer that helps prevent the land sector from becoming a net carbon source. For this purpose, forest conservation and sustainable management aimed at increasing ecosystem resilience to climate should be prioritised as transitional measures that support emission reductions, rather than substitutes for them.

How to cite: Roebroek, C., Caporaso, L., Cescatti, A., Duveiller, G., Davin, E., and Seneviratne, S.: Physical limits of carbon storage on land under present and future climate, EGU General Assembly 2026, Vienna, Austria, 3–8 May 2026, EGU26-20254, https://doi.org/10.5194/egusphere-egu26-20254, 2026.

EGU26-20906 | ECS | Posters on site | BG3.4

Global Disturbance Regimes: Patterns, Climatic Drivers, and Carbon Budget Implications 

Siyuan Wang, Hui Yang, and Nuno Carvalhais

Forest disturbances are fundamental drivers of accelerated ecosystem carbon turnover and massive carbon storage losses. At the landscape level, disturbance regimes characterized by their spatial extent (μ), frequency (α), and intensity (β) of disturbance histories, together with background mortality (Kb), are essential for understanding forest carbon sink dynamics. However, global patterns of these disturbance regimes and their climatic drivers, as well as their corresponding impacts on regional and global carbon budgets in the context of climate change, remain poorly understood.

Building upon our recently developed global dataset of these disturbance regimes data at 0.25° resolution, derived from high-resolution biomass observations (Wang et al., under review), this study aims to resolve the following three questions: (1) What disturbance characteristics have forests in different regions of the world experienced historically? (2) How do climate change and climate extremes influence these observed disturbance regimes? (3) To what extent do these disturbances directly or indirectly alter regional and global carbon budgets?

First, we applied K-Means clustering to the disturbance regime data using multivariate similarity. The optimal numbers of clusters were determined by the Elbow Method, allowing us to classify global ecosystems into 12 distinct disturbance-regime groups. The largest  cluster (17.83%) is primarily distributed in temperate regions, while specific biomes, such as wet tropical forests, are dominated by 3 clusters (14%) characterized by relatively high extent and frequency but low-intensity disturbance regimes. These groups exhibit strong spatial coherence, closely mapping onto distinct biomes and climate zones.  

Second, we developed cluster-specific Random Forest models to assess the primary climatic drivers associated with these regime types. Integrating ERA5 reanalysis data, we examined both long-term climatic means and a suite of extreme indices (e.g., heatwaves, precipitation anomalies). The feature importance of these variables reveals the distinct hierarchy of climatic drivers for each regime.  This analysis differentiates the influence of baseline climatic conditions from extreme events, helping to identify the specific environmental factors most strongly associated with disturbance dynamics in different global regions.

Third, we plan to examine the potential implications of these regimes for the carbon cycle. We will analyze the regional carbon budgets from atmospheric inversions, linking them to disturbance regime characteristics, specifically investigating how shifts in disturbance intensity and frequency relate to regions transitioning between carbon sources and sinks.

This study systematically addresses how global ecosystems can be functionally grouped by their disturbance regimes, identifies the specific climatic factors driving these patterns, and quantifies the impact of regime shifts on the carbon budget. By linking these elements, our findings provide essential empirical constraints for Earth System Models (ESMs), particularly for representing the stochastic nature of disturbances and predicting their feedback to the global carbon cycle in a changing climate.

How to cite: Wang, S., Yang, H., and Carvalhais, N.: Global Disturbance Regimes: Patterns, Climatic Drivers, and Carbon Budget Implications, EGU General Assembly 2026, Vienna, Austria, 3–8 May 2026, EGU26-20906, https://doi.org/10.5194/egusphere-egu26-20906, 2026.

EGU26-21719 | Posters on site | BG3.4

TRENDY-Emulator: A Bias-Corrected Deep Learning Emulator of Terrestrial Carbon and Water Dynamics 

Eamon Nils O Cathain, Alex Winkler, and Christian Reimers

Terrestrial biosphere models are central to quantifying the global land carbon sink, with the TRENDY ensemble of Dynamic Global Vegetation Models (DGVMs) providing the land-surface estimates underpinning the annual Global Carbon Budget. Despite their widespread use, TRENDY models exhibit well-documented biases in simulated leaf area index (LAI), including errors in both magnitude and phenological phase, which propagate into uncertainties in carbon and water flux estimates.

Deep-learning emulators of Earth system models are increasingly adopted to improve computational efficiency, yet their potential as a structured mechanism for integrating process-based and data-driven approaches remains underexplored. Here, we use a deep-learning emulator not only to reproduce TRENDY ensemble behaviour, but also as a controlled framework to correct inherited LAI biases using observations, without discarding underlying process relationships. We first pre-train an emulator on the TRENDY ensemble mean across 14 carbon- and water-related key variables, and subsequently apply transfer learning using satellite-derived LAI observations. Training across all four TRENDY factorial experiments isolates the causal effects of CO₂ fertilisation, climate change and variability, and land-use change, thereby expanding the training space and improving extrapolation potential. The emulator uses a transformer architecture and is formulated as a point model, run independently at each location, with temporal memory carried only through autoregressively propagated state variables.

Emulating the TRENDY ensemble mean is largely successful. High accuracy is achieved for non-disturbance, deterministic fluxes (mean R² = 0.94), including gross and net primary production, ecosystem respiration, evapotranspiration, and surface runoff. State variables, including carbon pools, soil moisture, and LAI, show a modest reduction in performance due to autoregressive drift, but remain well constrained (mean R² = 0.87). In contrast, disturbance-related fluxes—specifically fire and land-use change emissions—are reproduced with substantially lower skill (mean R² = 0.27). The emulator accurately reproduces the effects of CO₂ fertilisation and climate change and variability across scenarios.

Transfer learning substantially reduces LAI errors in magnitude, phase, and spatial distribution, decreasing the mean LAI bias from 1.13 in the TRENDY ensemble mean to 0.01, while maintaining performance across other variables. The resulting emulator provides a highly computationally efficient predictor of land-surface dynamics, with improved LAI–evapotranspiration and LAI–gross primary production relationships relative to observations. This work highlights the potential of deep learning as a controlled bridge between process-based and data-driven land-surface modelling, with potential to extend the work toward multiple observational constraints.

How to cite: O Cathain, E. N., Winkler, A., and Reimers, C.: TRENDY-Emulator: A Bias-Corrected Deep Learning Emulator of Terrestrial Carbon and Water Dynamics, EGU General Assembly 2026, Vienna, Austria, 3–8 May 2026, EGU26-21719, https://doi.org/10.5194/egusphere-egu26-21719, 2026.

Phenological development in semi-arid landscapes is susceptible to climatic variability, making it a powerful early indicator of climate stress. The Bundelkhand region of Central India—characterised by erratic monsoon rainfall, frequent droughts, high atmospheric dryness, and fragile agroecosystems—offers a critical natural laboratory for assessing climate-driven phenological changes. This study develops an integrated framework that combines multi-sensor remote sensing, phenology–climate machine learning models, and bias-corrected CMIP6 projections to quantify how vegetation dynamics and crop productivity in Bundelkhand will evolve under future climate scenarios. A multi-year phenology record was constructed using Sentinel-2 NDVI/EVI (10 m) and MODIS MCD12Q2 phenometrics to derive start-of-season (SOS), end-of-season (EOS), length-of-season (LOS), and peak greenness. Temporal smoothing using harmonic regression and double-logistic models enabled robust extraction of phenological markers for croplands (rice, wheat, pulses), natural vegetation, and fallow systems. Historical climate variables—temperature extremes, monsoon onset variability, vapour pressure deficit (VPD), heatwave duration, and solar radiation—were obtained from IMD and NASA POWER datasets. Climate–phenology linkages were quantified using generalized additive models, Random Forest, LightGBM, and LSTM networks to capture nonlinear responses and climate lag effects.

Future projections were developed using five CMIP6 GCMs (ACCESS-CM2, MPI-ESM1-2-HR, MIROC6, NorESM2-LM, and FGOALS-g3) under SSP2-4.5 and SSP5-8.5 scenarios. Bias correction followed the ISIMIP3BAS protocol. ML-derived phenology models were then forced with CMIP6 futures to simulate phenological trajectories for the 2030s, 2050s, and 2080s. SHAP sensitivity analysis identified VPD, Tmax anomalies, and pre-monsoon rainfall deficits as dominant drivers controlling phenological timing in Bundelkhand’s water-limited environment. Results reveal region-wide advancement of SOS by 10–25 days, shortening of LOS by 6–20 days, and reductions in peak greenness due to compounded heat and moisture stress—particularly under SSP5-8.5. Projected declines in vegetation productivity range from 12–30%, with drought-prone districts (Tikamgarh, Chhatarpur, Mahoba, Hamirpur) emerging as phenological stress hotspots. These shifts threaten major rabi crops (wheat, gram, mustard) and already stressed natural vegetation. By integrating phenology–climate modelling, remote-sensing dynamics, and CMIP6 climate trajectories, this study provides a first-of-its-kind, high-resolution assessment of how Bundelkhand’s vegetation will respond to future climate change. The framework supports climate-smart agricultural planning, phenology-based early-warning systems, and long-term drought adaptation strategies in one of India’s most climate-vulnerable regions.
Keywords: Vegetation Phenology; Climate Change; Bundelkhand; CMIP6 Projections; SHAP sensitivity analysis

How to cite: Singh, P. N. and Pipil, S.: AI-Enabled Climate–Phenology Coupling and Future Productivity Assessment for Semi-Arid Bundelkhand under CMIP6 Forcings, EGU General Assembly 2026, Vienna, Austria, 3–8 May 2026, EGU26-22038, https://doi.org/10.5194/egusphere-egu26-22038, 2026.

EGU26-1911 | Orals | BG3.5

Trait-based representation of drought-deciduous phenology in a demographic vegetation model 

Junyan Ding, Nate McDowell, Alexandria Pivovaroff, Chonggang Xu, Guangqin Song, Jin Wu, Eugenie Mas, Yilin Fang, and Charles Koven

Drought-deciduous phenology is a key adaptive strategy shaping growth, mortality, and competitive dynamics in tropical forests, yet it remains poorly represented in most vegetation models. We introduce a mechanistic drought-deciduous phenology module in FATES-Hydro that links canopy leaf loss and refoliation directly to plant hydraulic states, enabling trait-based representation of drought responses within a vegetation demographic framework.
Leaf shedding is driven by the fraction of the canopy experiencing critically low leaf water potential, while refoliation is permitted only after sustained hydraulic recovery above a second threshold for multiple consecutive wet days. This formulation captures both rapid drought-induced canopy loss and delayed recovery constrained by hydraulic and carbon availability, and operates consistently with size-structured demography and carbon allocation.
We evaluate the model across six tropical forest sites spanning a strong moisture gradient and focus on a sensitivity analysis to identify trait-mediated controls on phenology and demographic outcomes. At seasonal dry sites, phenological parameters dominate canopy dynamics. The leaf-off water-potential threshold exerts first-order control over both leaf shedding and refoliation timing by regulating dry-season soil moisture depletion. The recovery threshold further delays or accelerates leaf-on timing, while the assumed distribution of leaf water potential within the crown primarily controls whether canopy loss occurs gradually or abruptly.
These phenological controls generate pronounced growth–mortality trade-offs along the moisture gradient. At dry sites, delayed leaf shedding enhances carbon uptake during the wet season but increases drought exposure and mortality, whereas earlier shedding reduces productivity while maintaining hydraulic safety.
Hydraulic trait sensitivities are strongly site dependent. Root distribution is the dominant control at seasonal sites, with deeper roots delaying leaf-off, shortening leaf-off duration, and advancing refoliation. This effect weakens in wetter forests. Rooting depth has little influence on canopy phenology at wet sites but increases gross primary productivity and evapotranspiration. Stomatal sensitivity (P50gs) plays a secondary role, regulating carbon gain and mortality differently across climates: risky stomatal strategies increase wet-season carbon fixation but elevate leaf loss and mortality at dry sites, while conferring higher growth without increased mortality at wet sites. In contrast, maximum xylem conductance has negligible influence on phenology, growth, or mortality. The lack of sensitivity differences between two wet sites with contrasting rainfall seasonality further indicates that light, rather than water, constrains wet tropical forest dynamics. These results highlight how integrating hydraulics, phenology, and demography enables trait-based predictions of tropical forest responses to increasing drought stress.

How to cite: Ding, J., McDowell, N., Pivovaroff, A., Xu, C., Song, G., Wu, J., Mas, E., Fang, Y., and Koven, C.: Trait-based representation of drought-deciduous phenology in a demographic vegetation model, EGU General Assembly 2026, Vienna, Austria, 3–8 May 2026, EGU26-1911, https://doi.org/10.5194/egusphere-egu26-1911, 2026.

Nitrate leaching is a major form of agricultural non-point source pollution and a critical source of groundwater contamination. Clarifying its occurrence characteristics is a prerequisite for formulating targeted measures to control nutrient losses from cropland. This study employed and improved a hydrological model (Soil and Water Assessment Tool-Freeze-Thaw; SWAT-FT) to investigate the driving effect of freeze-thaw cycles on soil hydrothermal dynamics and nitrate vertical migration within the 0-2 m soil layer in the Upper Mississippi River Basin under future climate change. The results showed that the fully calibrated SWAT-FT model, which considered the insulating effect of winter snow cover and water-ice phase change processes, provided more physically meaningful simulations of soil hydrothermal processes in winter compared to the original SWAT model. In the future, SWAT-FT predicted higher winter surface soil temperatures and greater fluctuations in deeper soil temperatures, along with lower soil water content than SWAT, fully demonstrating the key role of a physically based process mechanism model in simulating soil hydrological processes. Moreover, nitrate leaching peaked at approximately 33.7 kg ha-1 in May following fertilization but was confined to the surface soil layer. Furthermore, nitrate leaching in November, March, and April, which the months associated with freeze-thaw cycles, was similarly elevated, with migration into deeper soil layers further influenced by legacy soil nitrogen. Particularly in April, the amount of nitrate finally leached out of the soil layer accounted for approximately 50% of the total annual leaching. These results reveal a “dual risk” in nitrate losses: the immediate risk post-fertilization and the long-term risk from legacy soil nitrogen. This highlights the vital role of freeze-thaw cycles on nitrate losses and underscores the necessity of developing targeted management measures.

How to cite: Zhang, Y. and Chen, Y.: Assessing the impact of freeze-thaw cycles on nitrate leaching in the Mollisol regions under global warming, EGU General Assembly 2026, Vienna, Austria, 3–8 May 2026, EGU26-4706, https://doi.org/10.5194/egusphere-egu26-4706, 2026.

EGU26-4744 | ECS | Posters on site | BG3.5

Calibrating the dynamic vegetation model LPJ-GUESS for crop yield simulation in southern Sweden using observed crop yield and satellite-based evapotranspiration data 

Xueying Li, Wenxin Zhang, Minchao Wu, Stefan Olin, Hao Zhou, Xin Huang, Shangharsha Thapa, El Houssaine Bouras, and Zheng Duan

Process-based crop models are extensively used to assess the impacts of climate change, environmental variations, and management practices on crop yields. However, parameters sourced from the literature are often not universally applicable, necessitating calibration to enhance the model performance. The in-situ observed crop yield (hereafter referred to as “observed crop yield”) is commonly used for model calibration. Satellite-based data, such as evapotranspiration (ET), offers additional insights into plant growth and holds significant potential for enhancing calibration efforts. The LPJ-GUESS (Lund-Potsdam-Jena General Ecosystem Simulator) model has been applied extensively to simulate crop yields across various scales, but it has not been calibrated for the regional-scale yield simulation. This study aims to enhance the performance of LPJ-GUESS in simulating crop yields in southern Sweden through calibration using observed crop yield and satellite-based ET data. Results demonstrated that calibrating with observed crop yield substantially improved simulation accuracy for both spring barley and winter wheat, reducing the normalized root mean square error (nRMSE) from 50.3% to 12.8% and from 15.5% to 12.2%, respectively. Sensitivity analysis identified four key parameters influencing yield simulations: minimum C:N ratio (CNmin), N demand reduction by leaves (Ndred), and the retranslocation of nitrogen and carbon (Nret and Cret). Calibration using the Penman-Monteith-Leuning Version 2 (PML-V2) ET product moderately enhanced yield simulation accuracy, particularly for winter wheat, achieving an nRMSE of 14.2%, demonstrating its potential as an alternative when especially when the long-term and continuous observed crop yield is not available. The calibrated LPJ-GUESS model effectively simulated crop yield for both crop types under drought and normal conditions, highlighting its robustness across varying environmental scenarios.

How to cite: Li, X., Zhang, W., Wu, M., Olin, S., Zhou, H., Huang, X., Thapa, S., Bouras, E. H., and Duan, Z.: Calibrating the dynamic vegetation model LPJ-GUESS for crop yield simulation in southern Sweden using observed crop yield and satellite-based evapotranspiration data, EGU General Assembly 2026, Vienna, Austria, 3–8 May 2026, EGU26-4744, https://doi.org/10.5194/egusphere-egu26-4744, 2026.

Phosphorus (P) loss from agricultural lands is a major contributor to surface water quality deterioration. Elevated atmospheric CO2 concentrations (eCO2) may affect P loss directly by altering hydrological processes and indirectly by influencing soil P cycling. However, the combined effects of these two mechanisms on P loss remain considerably uncertain. This study employed a more physically-based SWAT-CO2 model, which incorporates a nonlinear gs-CO2 and a LAI-CO2 function, to project P loss from corn fields in the macro-scale watershed (~500,000 km2) of the Upper Mississippi River Basin (UMRB) under eCO2 and future climate change. Results showed that the modified SWAT-CO2 model predicted 7.9% less total phosphorus (TP) loss than the original SWAT at 825 ppm CO2 during the baseline (1985-2014). Future TP loss projections deviated between models compared to the baseline (30.3% increase by the modified SWAT-CO2 vs 40.1% increase by the original SWAT under high emission scenario in the 2071-2100 period). Moreover, different forms of P loss exhibited distinct change patterns over time for both models. Soluble phosphorus (SOLP) loss increased 16.5%-58.8%, while organic phosphorus (ORGP) loss changed from -11.1% to 38.8% across all SSP scenarios. As a result, economic costs for reducing TP loss to low risk were projected to rise, with costs during the 2071-2100 period exceeding those during both 2041-2070 and the baseline periods, particularly under SSP5-8.5 scenario. These findings highlight the importance of eCO2 in predicting P loss and underscore the need for increased economic investment to achieve P-related sustainable environmental development goals.

How to cite: Wen, N.: Improving hydrological modeling to close the gap between elevated CO2 concentration and crop response: Implications for water resources and water quality, EGU General Assembly 2026, Vienna, Austria, 3–8 May 2026, EGU26-5245, https://doi.org/10.5194/egusphere-egu26-5245, 2026.

EGU26-5613 | ECS | Orals | BG3.5

High-temperature responses of photosynthetic parameters 

Jierong Zhao and Iain Colin Prentice

Terrestrial ecosystems currently absorb approximately one-third of anthropogenic CO₂ emissions, constituting a central component of the global carbon cycle. However, the persistence of terrestrial carbon uptake under future warming and extreme heat events remains highly uncertain, in part due to limited understanding of how photosynthetic processes respond to thermal stress. In current land surface models, the temperature sensitivity of photosynthesis is often represented using simplified empirical formulations that inadequately capture physiological failure under extreme conditions.

The widely applied Farquhar–von Caemmerer–Berry (FvCB) framework commonly employs Arrhenius-type temperature response functions with fixed parameters derived from empirical fitting, which perform reasonably well near moderate temperatures but struggle to represent rapid declines in photosynthetic capacity at high temperatures. Moreover, how these limitations differ between C₃ and C₄ plants, despite their contrasting photosynthetic pathways and thermal strategies, remains poorly constrained at the global scale.

Here, we integrate a global meta-analysis drawing on published and newly compiled datasets within a mechanistic framework to assess the thermal responses of photosynthetic processes across C₃ and C₄ species. Our results indicate that even C₄ plants, despite their comparatively high thermal tolerance, exhibit pronounced enzymatic constraints under extreme heat. We further identify a coherent pattern in which biochemical and photochemical processes respond over a similar temperature range; however, biochemical limitations consistently arise at lower temperatures than photochemical limitations, suggesting that heat stress leads to metabolic failure prior to photochemical impairment.

These findings suggest that current temperature response formulations in land surface models may systematically overestimate photosynthetic stability under extreme heat, underscoring the need for improved mechanistic representation of thermal sensitivity to better project terrestrial carbon uptake under future climate extremes.

How to cite: Zhao, J. and Prentice, I. C.: High-temperature responses of photosynthetic parameters, EGU General Assembly 2026, Vienna, Austria, 3–8 May 2026, EGU26-5613, https://doi.org/10.5194/egusphere-egu26-5613, 2026.

EGU26-6381 | ECS | Posters on site | BG3.5

Drought stress in LPJmL-5: benchmarking and model improvements 

Denise Ruijsch, Sandra Hauswirth, Hester Biemans, Maik Billing, Christoph Müller, Werner von Bloh, and Niko Wanders

Climate change is expected to increase the frequency and severity of Multi-Year Droughts (MYDs), yet their impacts on vegetation remain poorly understood. While satellite records provide valuable insights, they span only recent decades, limiting the number of MYDs available for analysis. Dynamic global vegetation models (DGVMs), such as LPJmL-5 (von Bloh et al., 2018), can help overcome this limitation by simulating vegetation dynamics over longer timescales. However, their ability to capture drought impacts has not yet been systematically evaluated. In this study, we benchmarked LPJmL-5 against MODIS-derived Gross Primary Production (GPP) to assess how well it captures vegetation responses to (multi-year) droughts. We show that LPJmL-5 reproduces GPP reasonably well, but there is a performance decline in parts of the Southern Hemisphere and in regions with croplands. During MYDs, the model captures the main spatial and temporal patterns of GPP decline, yet it tends to overestimate vegetation resilience at drought onset and simulates rapid post-drought recovery, leading to muted overall drought impacts. These biases appear to arise from a simplified representation of vegetation mortality processes in the model. As a result, long-term losses in biomass and shifts in ecosystem structure are often underestimated. To improve this behaviour, we incorporated a drought mortality function into LPJmL-5. This links mortality to water stress and vapour pressure deficit, with vegetation specific parameterization. We calibrated and evaluated its performance across known drought events. With the extended drought mortality representation in LPJmL-5, we refine the process representation, which in turn leads to more realistic vegetation dynamics and ultimately greater confidence in predictions of ecosystem responses under a changing climate.

How to cite: Ruijsch, D., Hauswirth, S., Biemans, H., Billing, M., Müller, C., von Bloh, W., and Wanders, N.: Drought stress in LPJmL-5: benchmarking and model improvements, EGU General Assembly 2026, Vienna, Austria, 3–8 May 2026, EGU26-6381, https://doi.org/10.5194/egusphere-egu26-6381, 2026.

EGU26-6727 | ECS | Posters on site | BG3.5

Seeing through the canopy: COS-constrained SCOPE modelling to investigate plant drought responses  

Anna de Vries, Felix M. Spielmann, Alexander Platter, Albin Hammerle, Christiaan van der Tol, and Georg Wohlfahrt

Understanding plant biophysical and biochemical responses to drought is essential for predicting ecosystem carbon–water exchange and gross primary productivity (GPP) under a changing climate. Here, we investigate stomatal and non-stomatal responses to natural drought events by integrating carbonyl sulfide (COS) fluxes as a novel observational constraint into the Soil–Canopy Observation of Photosynthesis and Energy fluxes (SCOPE) model. Because plants take up COS in parallel with CO2 via practically similar pathways but do not re-emit COS, it can be used as promising proxy for GPP and stomatal conductance. SCOPE is a physically based land-surface model that links plant processes to spectrally resolved within-canopy radiative transfer; adding COS provides an independent constraint on canopy conductance and carbon uptake. We leverage multiple years of concurrent COS and CO2 flux as well as hyperspectral reflectance measurements from a Scots pine dominated montane forest in Austria, including naturally occurring drought periods, to refine model representations of stomatal regulation, internal conductance, and water-stress responses at the ecosystem scale. This model–data integration framework improves detection and prediction of drought impacts on canopy function and enhances constraints on ecosystem carbon–water dynamics.

How to cite: de Vries, A., Spielmann, F. M., Platter, A., Hammerle, A., van der Tol, C., and Wohlfahrt, G.: Seeing through the canopy: COS-constrained SCOPE modelling to investigate plant drought responses , EGU General Assembly 2026, Vienna, Austria, 3–8 May 2026, EGU26-6727, https://doi.org/10.5194/egusphere-egu26-6727, 2026.

EGU26-7019 | ECS | Posters on site | BG3.5

Using Physics-Informed Machine Learning to Partition Eddy Covariance based Evapotranspiration 

Emma Cochran and Elke Eichelmann

Due to the coupling of gas exchange in terrestrial ecosystems, transpiration (T) estimates are a key insight into global climate, water, and carbon patterns. While extensive datasets of evapotranspiration (ET) are abundant, largely due to global eddy covariance networks, independent measurements of T are relatively sparse. As such, there is a need to partition T out of eddy covariance-measured ET so that we can better understand how the individual components of the terrestrial water vapor flux are contributing to the global water cycle and changing under a warming climate. Physics-informed machine learning (PI-ML) presents a novel way to partition eddy covariance-measured ET even without extensive T datasets for validation. PI-ML works to constrain the model to obey underlying governing equations driving the system dynamics, giving unique insights into model estimates. Here, PI-ML is introduced to estimate the ecosystem transpiration ratio (T/ET) using eddy covariance data collected from a soybean field in Ontario, Canada. The model, founded on the principle that transpiration follows a sine curve over a 24hr period, constrains both the upper and lower bounds of T/ET by assuming transpiration is negligible overnight and that the agricultural site has periods with negligible soil evaporation. The PI-ML model was validated against leaf-level transpiration measurements collected over the 2025 growing season as well as compared to results from other eddy covariance-based ET partitioning methods.  Preliminary results for the 2019 growing season showed the PI-ML estimated a daytime average T/ET of 0.584 in the soybean field, compared to 0.468 estimated from an underlying water use efficiency-based method and 0.653 estimated from a method using data-driven machine learning. The physically realistic T estimates produced by the PI-ML show the model’s ability to accurately represent the ecosystem dynamics of the soybean site where it was applied. Accurate T estimates give way for better management of our limited water resources, leading to increased water quality and food security when used in agricultural settings.

How to cite: Cochran, E. and Eichelmann, E.: Using Physics-Informed Machine Learning to Partition Eddy Covariance based Evapotranspiration, EGU General Assembly 2026, Vienna, Austria, 3–8 May 2026, EGU26-7019, https://doi.org/10.5194/egusphere-egu26-7019, 2026.

EGU26-7417 | Orals | BG3.5

Environmentally dependent wood density reshapes forest structure and carbon storage in a demographic vegetation model 

Annemarie Hildegard Eckes-Shephard, Anna Christina Voss, Hao Zhou, Patrick Fonti, and Stefan Olin

Wood density is a key functional trait influencing tree growth, forest dynamics and carbon storage, yet dynamic global vegetation models (DGVMs) typically represent it as a fixed parameter for each plant functional type. This assumption neglects well-documented environmental and interannual variability in wood density and its potential feedbacks of forest dynamics.

In this study, we explore the consequences of environmentally dependent wood density for tree- and forest-level carbon storage by integrating a temperature-response function of wood density into the DGVM LPJ-GUESS. Using a well-documented relationship between temperature and latewood density extracted from tree ring data from 52 sites, we simulate forest recovery following stand-replacing disturbance and compare model behaviour with and without dynamic wood density.

We show that allowing wood density to vary with temperature alters tree growth and carbon content, with cascading effects on within-cohort competition, forest structure, and stand-level carbon storage. Warmer conditions produce higher wood density, leading to slower diameter and height growth and thus smaller trees relative to simulations with fixed wood density, while lower wood density promotes taller trees that overall capture more carbon. These effects depend strongly on tree life stage and forest recovery phase: before canopy closure, climate-driven variability in wood density induces large divergence in individual tree carbon content (up to 32%), whereas after canopy closure, competitive interactions dominate and climate effects stabilise. Overall, dynamic wood density alters the size distribution of the forest compared to constant wood density simulations. The implications are that by shifting carbon storage, from relatively more small trees to fewer large trees (or vice versa),  other processes are influenced such as tree mortality and the resulting flux of carbon through deadwood to soil pools.

Our study demonstrates that environmentally driven variation in wood density constitutes an important, yet overlooked, mechanism shaping forest structure and carbon dynamics. Incorporating dynamic wood density into DGVMs may therefore be a useful avenue to explore for improving ecological feedbacks and realism of forest carbon storage predictions, particularly in young and regenerating forests under a changing climate.


How to cite: Eckes-Shephard, A. H., Voss, A. C., Zhou, H., Fonti, P., and Olin, S.: Environmentally dependent wood density reshapes forest structure and carbon storage in a demographic vegetation model, EGU General Assembly 2026, Vienna, Austria, 3–8 May 2026, EGU26-7417, https://doi.org/10.5194/egusphere-egu26-7417, 2026.

EGU26-7465 | ECS | Orals | BG3.5

Environmental resource perspective on plant green-up and green-down 

Xiaoyu Cen, Nianpeng He, Matteo Campioli, Lorène Marchand, Daijun Liu, Claire Treat, Kailiang Yu, Yuanyuan Huang, Liyin He, Jie Li, Jiahui Zhang, Chaolian Jiao, Sheng Wang, and Klaus Butterbach-Bahl

Global climate change has led to changes in plant phenology, potentially altering growing season length and the productivity of plants. Simulating phenological changes is fundamental to predicting changes in ecosystem function. However, the existing methods have not adequately represented the joint control of plant development by multiple environmental resources, including temperature, precipitation and photoperiod. In this study, we introduce the concept of an “environmental resource space” (ERS) and present generic algorithms for interpreting and predicting plant green-up and green-down. We found that the ERS-derived indices, including quantity (S) and synergistic efficiency (V) of resources, had a greater importance than other environmental variables in explaining variations in the green-up and green-down periods of natural ecosystems. Ground and satellite observations in the mid- and high latitudes of the Northern Hemisphere supported a significant positive relationship between phenological period length and the S:V ratio. An ERS-based model can predict the green-up and green-down periods of plants with an accuracy of 0.7-0.8 at a hemispheric scale. The ERS framework and algorithms could help predict the combined effects of multiple environmental changes on the phenology and function of natural ecosystems.

How to cite: Cen, X., He, N., Campioli, M., Marchand, L., Liu, D., Treat, C., Yu, K., Huang, Y., He, L., Li, J., Zhang, J., Jiao, C., Wang, S., and Butterbach-Bahl, K.: Environmental resource perspective on plant green-up and green-down, EGU General Assembly 2026, Vienna, Austria, 3–8 May 2026, EGU26-7465, https://doi.org/10.5194/egusphere-egu26-7465, 2026.

Peatlands are crucial for the regulation of the land carbon cycle and for the atmospheric methane budget. In Earth system models, improving wetland biogeochemistry and the representation of peat-specific processes has been shown to strengthen the realism of carbon-methane feedbacks and hence, the response of high-latitude land to climate warming in future simulation scenarios. We aimed to implement an explicit peatland representation in the University of Victoria Earth System Climate Model (UVic ESCM) by enhancing the WETMETH wetland methane framework to better account for the unique characteristics of peat soils and their associated carbon and methane cycling. The peatland development is based on two main components: (i) the integration of a high-resolution peatland distribution dataset (GPM 2.0) aggregated to the UVic ESCM grid using sub-cell fractional coverage, and (ii) the introduction of peatland-specific parameterizations within peat-designated grid cells to constrain key biogeochemical rates controlling long-term carbon storage and methane emissions. A 5000-year spin-up was carried to establish stable peat carbon and methane baselines, and two key peat-specific parameters were calibrated against independent global constraints.

The peatland configuration reproduces an equilibrium global peat carbon stock of 599.7 Pg C (target ≈600 Pg C) and a pre-industrial CH₄ concentration of 809.2 ppbv (target ≈808 ppbv), with negligible long-term drift. The implementation of explicit peatlands resulted shows, relative to a 1995–2015 baseline, global peat carbon changes are ~0%, 0%, −1%, and −1% by 2100 and ~0%, −4%, −12%, and −37% by 2300, for SSPs 1-2.6, 2-4.5, 4-6.0 and 5-8.5 respectively, while peatland methane emissions increase by ~+6%, +15%, +19%, and +37% by 2100 and ~+4%, +10%, +16%, and +54% by 2300. In summary, the explicit peatland implementation has successfully constrained peat carbon and methane to observationally consistent baselines, which now yield a robust peatland carbon-methane climate sensitivity and a reduced capacity of peatlands to retain carbon while amplifying their contribution to atmospheric methane under sustained warming.

How to cite: Guo, X. and MacDougall, A.: Peat carbon persistence and methane amplification under warming: explicit peatlands in UVic ESCM–WETMETH constrained by global targets, EGU General Assembly 2026, Vienna, Austria, 3–8 May 2026, EGU26-8165, https://doi.org/10.5194/egusphere-egu26-8165, 2026.

Dynamic Global Vegetation Models (DGVMs) play a central role in assessing ecosystem responses to climate change, yet their increasing complexity and technical requirements often limit their accessibility beyond specialist communities. In this presentation, I introduce SEIB-Explorer, a standalone platform that couples the execution of the individual-based SEIB-DGVM with interactive three-dimensional visualization and lightweight analysis tools. The software provides a graphical user interface that streamlines model execution and result exploration, lowering the barrier to entry for non-specialists.

SEIB-Explorer enables users to visualize forest structure at a single site as a virtual stand, with plant functional types clearly distinguished and temporal changes examined through an interactive time slider. Multiple information panels summarize model metadata, annual fluxes, and time series of carbon, water, and vegetation-related variables. A visually enhanced display mode further supports interpretability for educational use and public engagement.

By integrating model execution, visualization, and basic exploratory analysis within a single environment, SEIB-Explorer reduces technical and cognitive overhead while promoting reproducible workflows and interdisciplinary exchange. This approach demonstrates how improved accessibility and interpretability can broaden the impact of DGVMs in research, education, and outreach contexts.

Figure 1.
SEIB-Explorer execution view (standard display mode). This example shows a mixed conifer–broadleaf forest in northern Hokkaido, Japan, after 100 simulation years from bare ground under late-20th-century climate conditions (e.g., 1981–2000).


Figure 3. Eight example views from the left-hand information panel. All panels correspond to the same simulation year and output as Fig. 1: (a) legend, (b) annual flux summary, (c) seasonal cycle of carbon variables, (d) seasonal cycle of water variables, (e) seasonal cycle of atmospheric variables, and (f) seasonal cycle of radiative balance.

How to cite: Sato, H.: Making Dynamic Vegetation Models More Accessible: The SEIB-Explorer Run-and-View Environment, EGU General Assembly 2026, Vienna, Austria, 3–8 May 2026, EGU26-8479, https://doi.org/10.5194/egusphere-egu26-8479, 2026.

EGU26-8646 | ECS | Orals | BG3.5

Crop spectral data reconstruction and classification based on temporal masked autoencoder 

Zehao Liu, Wenzhi Zeng, Chang Ao, Tao Ma, Haoze Zhang, Yingxuan Wu, and Yi Sun

Satellite imagery holds immense potential for crop monitoring due to its wide coverage and long-term stable historical data. However, frequent cloudy and rainy weather results in extremely fragmented optical remote sensing data in the temporal dimension, creating numerous observation gaps. This study proposes a temporal masked auto-encoder (T-MAE) framework that treats cloud occlusion as a natural mask. By performing self-supervised pre-training on large-scale unlabeled Sentinel-2 imagery, the model is forced to learn the intrinsic temporal dependencies and spectral evolution patterns of crop growth. Furthermore, the reliability of the reconstructed spectral data is evaluated by generating plot-level crop type maps using the reconstructed spectral time-series. The research results indicate that: T-MAE can reconstruct complete crop growth curves with high precision even under extreme conditions with only 20% valid observations. In downstream classification tasks, the classifier based on T-MAE pre-trained features achieved higher accuracy compared to bidirectional long short-term memory (Bi-LSTM) and Temporal Convolutional Neural Network (Temp-CNN) models (which rely on linear interpolation and Whittaker smoothing algorithms to handle cloud occlusion). Moreover, the model pre-trained with a 75% masking rate yielded higher classification accuracy than those pre-trained with 25% and 90% masking rates. In conclusion, T-MAE not only outperforms existing methods in crop classification accuracy but also demonstrates superior spatiotemporal generalization and robustness against interference. This work provides a new paradigm for addressing the dual challenges of label scarcity and cloud interference in agricultural remote sensing.

How to cite: Liu, Z., Zeng, W., Ao, C., Ma, T., Zhang, H., Wu, Y., and Sun, Y.: Crop spectral data reconstruction and classification based on temporal masked autoencoder, EGU General Assembly 2026, Vienna, Austria, 3–8 May 2026, EGU26-8646, https://doi.org/10.5194/egusphere-egu26-8646, 2026.

EGU26-8663 | ECS | Orals | BG3.5

Field-Level Agricultural Disaster Warning and Loss Assessment Based on Multi-Spatio-Temporal Fusion Network 

Yingxuan Wu, Wenzhi Zeng, Chang Ao, Tao Ma, and Jing Huang

Extreme weather poses a severe challenge to global food security, and timely, accurate agricultural disaster warnings can effectively mitigate crop yield losses. Traditional agricultural disaster warning models often rely on sparse meteorological station observations, making it difficult to capture micro-meteorological variations at the field level. Moreover, they frequently overlook the decisive role of crop stress tolerance in disaster occurrence. This study proposes a multi-spatio-temporal fusion network (MSTF-Net) featuring a unique dual-tower architecture. One tower utilizes high-dimensional remote sensing features to capture crop growth status and micro-topography on the forecast date, while the other tower employs long short term memory (LSTM) to process “past 30 days + future 7 days” meteorological time-series data, simulating the dynamic evolution of environmental stress. Within a unified framework using Sentinel-2 imagery, this approach simultaneously achieves field-level disaster warning, cause attribution, and loss assessment to mitigate yield losses from disasters. Results demonstrate that MSTF-Net achieves 12% higher accuracy compared to LSTM models using only meteorological data and multilayer perceptron (MLP) models using only remote sensing data. The model maintains high-precision early warnings (AUC > 0.85) and loss assessments within a 7-day window, meeting crop growth scheduling needs. In summary, the proposed MSTF-Net model delivers effective field-level agricultural disaster warnings, offering a feasible pathway to mitigate agricultural disaster losses.

How to cite: Wu, Y., Zeng, W., Ao, C., Ma, T., and Huang, J.: Field-Level Agricultural Disaster Warning and Loss Assessment Based on Multi-Spatio-Temporal Fusion Network, EGU General Assembly 2026, Vienna, Austria, 3–8 May 2026, EGU26-8663, https://doi.org/10.5194/egusphere-egu26-8663, 2026.

EGU26-8703 | Orals | BG3.5

GEDI-constrained Estimates of Terrestrial Carbon Dynamics in Southeast Asian Tropical Forests over the Coming Century 

Shaoqing Liu, Wei Ouyang, Chunye Lin, Liling Chang, Xiangtao Xu, Marcos Longo, Elsa Ordway, John Armston, Hao Tang, Ralph Dubayah, and Paul Moorcroft

Global tropical rainforests represent an important carbon sink and have significant potential for mitigating the effects of human-induced climate change. However, current estimates of carbon stocks and fluxes in tropical forests are highly uncertain due to spatial variation in structure, composition, and dynamics of tropical forests. Canopy structure metrics, including vertical leaf area index (LAI) profiles, canopy height and biomass have been identified as essential variables for predicting tropical forest canopy biomass dynamics and climate feedbacks in heterogeneous landscapes. In this study, we assimilate lidar-derived measurements of forest canopy height and vertical LAI profile from NASA’s Global Ecosystem Dynamics Investigation (GEDI), space-borne lidar into ED2, a cohort-based terrestrial biosphere model. We then use the GEDI-constrained model to analyze carbon dynamics across Southeast Asia under different scenarios and climate forcings. In addition, we carried out model simulations without GEDI observations to evaluate how different initialization methods would impact predictions of carbon fluxes and states. Our results show that GEDI constrained model has similar predictions with ground-data initialized simulations. In addition, regional analysis of long-term regional simulations suggests that initialization with GEDI as opposed to with output from a historical simulation has larger effects on regional-scale aboveground biomass predictions than in the effects of future CO2 emissions, land use scenarios, and climate forcings. Our study demonstrates how information on forest structure from GEDI retrievals can improve the accuracy of TBM predictions of carbon dynamics in tropical forests and thereby inform decisions about how tropical forests can be managed to promote forest carbon storage and uptake in context of ongoing changes in earth’s climate.

How to cite: Liu, S., Ouyang, W., Lin, C., Chang, L., Xu, X., Longo, M., Ordway, E., Armston, J., Tang, H., Dubayah, R., and Moorcroft, P.: GEDI-constrained Estimates of Terrestrial Carbon Dynamics in Southeast Asian Tropical Forests over the Coming Century, EGU General Assembly 2026, Vienna, Austria, 3–8 May 2026, EGU26-8703, https://doi.org/10.5194/egusphere-egu26-8703, 2026.

Earth System Models (ESMs) play a central role in understanding and projecting the global carbon cycle by explicitly coupling the atmosphere, land, and ocean components. In particular, a large fraction of the interannual variability (IAV) in atmospheric CO₂ growth rate is attributed to variability in terrestrial carbon uptake. Therefore, an adequate representation of interannual variability in terrestrial ecosystem processes, such as gross primary production (GPP), is essential for robust global carbon cycle assessments.

However, in many coupled ESM simulations participating in CMIP, the phase of internal climate variability does not coincide with that of the real world, making direct time-series comparisons of interannual variability fundamentally difficult. This limitation has not yet been fully resolved even with the use of atmosphere–ocean data assimilation, and it has hindered robust evaluation of ecosystem processes governing IAV. As a result, most previous CMIP model evaluations of terrestrial carbon cycle processes have focused on mean states or climatological characteristics, while the representation of variability and ecosystem responses to extreme events has remained insufficiently assessed.

In this study, we propose a phase-insensitive model evaluation framework that is less sensitive to phase mismatches in internal variability. Within this framework, we focus on the general relationships between environmental variability—such as precipitation and temperature—and GPP responses, with particular emphasis on extreme and/or nonlinear variations that strongly contribute to interannual variability. Using multiple CMIP6 models, we evaluate the distributional properties (variability structure) of GPP and climate drivers, as well as their relationships, at monthly and seasonal timescales, through comparison with observational datasets. In addition, we examine whether biases in simulated GPP primarily arise from biases in environmental drivers or from differences in ecosystem response structures.

To capture ecosystem response diversity that is not evident in global-mean analyses, the evaluation is conducted at a regional scale across multiple climate zones. Regions exhibiting pronounced interannual variability in GPP are selected, and model behaviors are systematically compared in terms of seasonality and environmental responses. Because variability at annual timescales is strongly influenced by ecosystem functioning at seasonal scales, monthly and seasonal analyses provide an effective basis for diagnosing terrestrial ecosystem representations in ESMs.

This presentation highlights both common features and inter-model differences in the representation of GPP variability across CMIP models, and discusses implications for evaluating and improving terrestrial ecosystem processes in Earth system models.

How to cite: Satoh, Y. and Hajima, T.: Assessing Terrestrial GPP Responses to Climate Variability in CMIP6 Earth System Models: How Do Ecosystems Respond to Large Climate Fluctuations?, EGU General Assembly 2026, Vienna, Austria, 3–8 May 2026, EGU26-10218, https://doi.org/10.5194/egusphere-egu26-10218, 2026.

EGU26-10779 | Orals | BG3.5

Incorporating a modern understanding of soil carbon dynamics into Earth system model simulations 

Andrew H. MacDougall, Claude-Michel Nzotungicimpaye, Alexander J. MacIsaac, and Rose Z. Abramoff

Over the past 20 years the understanding of carbon cycling within soils has radically advanced. However, the representation of soil carbon within Earth System Models has remained based on outdated models which do not reflect our current understanding of soil carbon processes. The Millennial version 2 soil carbon module was developed to allow Earth System Models to represent soil carbon processes such as microbial decomposition, aggregation, and mineral sorption. Millennial consists of five interacting soil carbon pools: particulate organic carbon, mineral-associated organic carbon, aggregate carbon, microbial biomass, and low molecular weight carbon, all of which can be measured in natural soils.

Here we have incorporated Millennial into the University of Victoria Earth System Climate model, an Earth system model of intermediate complexity, with a simplified atmosphere and full complexity land surface and ocean modules. Preliminary results suggest that Millennial generates soil carbon pools consistent with observations across regional climates and ecosystems. A series of model experiments have been devised to explore how soil carbon as simulated by Millennial behaves relative to traditional methods for simulating soil carbon.  Our experiments will show how much this higher fidelity soil carbon model structure will change projections of future climate change and remaining carbon budgets.

How to cite: MacDougall, A. H., Nzotungicimpaye, C.-M., MacIsaac, A. J., and Abramoff, R. Z.: Incorporating a modern understanding of soil carbon dynamics into Earth system model simulations, EGU General Assembly 2026, Vienna, Austria, 3–8 May 2026, EGU26-10779, https://doi.org/10.5194/egusphere-egu26-10779, 2026.

EGU26-11088 | Orals | BG3.5

Accounting for photosynthetic traits acclimation improves the simulation of forest canopy temperature in Terrestrial Biosphere Models at the ecosystem level 

Marc Peaucelle, Félicien Meunier, Benjamin Stocker, Juliette Archambeau, Jéröme Ogée, Emilie Duflos, Laëtitia De Felix, Christophe Chipeaux, Mark Irvine, Jeffrey Anderson, Nicolas Viovy, and Hans Verbeeck

Leaf photosynthesis and respiration respond to leaf temperature, which differs from air temperature depending on radiation load, transpiration and heat exchange rates. However, most terrestrial biosphere models (TBMs) do not use leaf temperature to compute photosynthesis and respiration. Instead, they use directly air temperature, or an average surface temperature that incorporate soil and non-green biomass compartments. While these two approaches are computationally efficient, the absence of explicit leaf temperature simulation potentially hinders the representation of extreme events (e.g. heat stress) and their repercussion on carbon and water fluxes. To predict leaf temperature, it is necessary to explicitly account for leaf energy budget, photosynthesis and transpiration feedbacks (E-P-T).

Here, we explored the merits of coupling E-P-T processes in TBMs to simulate explicit leaf temperature and its feedback on carbon assimilation. Sensitivity analysis of the coupled E-P-T processes using the big-leaf configuration of the ORCHIDEE v2.2 TBM (used in CMIP6) resulted into leaf-to-air temperature differences varying between 1 and 10 °C in natural conditions. This translated into a change in carbon assimilation ranging from -35 % to +110 % at the leaf level. A comparison of simulated leaf temperature with measured canopy surface temperature at eddy-covariance fluxes sites in various E-P-T configurations showed that adding ecological constraints on photosynthesis and transpiration through the photosynthesis coordination and the least-cost hypothesis (P-model) improved the representation of top canopy temperature compared to a classical fixed parameterization. The improvement in canopy temperature estimates was best for deciduous broadleaved forests with an average reduction of the error by 1.2 ± 0.8 °C (9 sites). More importantly, the improvement in leaf temperature estimates mainly occurs at elevated temperature (> 30°C). 

Our results argue for the inclusion of an explicit representation of leaf temperature in TBMs to avoid biases in the carbon balance estimates. Fully coupling leaf processes through temperature will also be essential for accurately simulating and disentangling the effects of heat and drought stresses under future conditions. However, such implementation will only be possible if accompanied with space-time concomitant observations of leaf temperature and traits that are currently lacking. The ongoing deployment of digital cameras (e.g. thermal, multispectral, SIF etc.) on existing networks (e.g. ICOS) for tracking canopy temperature and trait variability, combined with punctual field observation campaigns, future remote sensing missions (e.g. TRISHNA), as well as new hybrid modelling methods are all timely and promising ways for improving our understanding and representation of leaf temperature in TBMs.

How to cite: Peaucelle, M., Meunier, F., Stocker, B., Archambeau, J., Ogée, J., Duflos, E., De Felix, L., Chipeaux, C., Irvine, M., Anderson, J., Viovy, N., and Verbeeck, H.: Accounting for photosynthetic traits acclimation improves the simulation of forest canopy temperature in Terrestrial Biosphere Models at the ecosystem level, EGU General Assembly 2026, Vienna, Austria, 3–8 May 2026, EGU26-11088, https://doi.org/10.5194/egusphere-egu26-11088, 2026.

EGU26-12153 | ECS | Orals | BG3.5

From field observations to improved land surface models: The case of dwarf-shrubs in Norway 

Jeanne Rezsöhazy, Sonya R. Geange, Hui Tang, Rosie A. Fisher, Kristine Birkeli, and Vigdis Vandvik

Dwarf-shrubs are a fundamental component of boreal, Arctic, and alpine ecosystems, where they contribute substantially to ecosystem carbon sequestration and long-term storage, potentially influencing feedback mechanisms between terrestrial ecosystems and the global climate system. To date, dwarf-shrubs remain inadequately represented in most land surface models, while their interactions with climate are highly uncertain. As part of the DURIN project, we aim to develop and implement a new dwarf-shrub plant functional type in the Community Land Model (CLM) coupled with the Ecosystem Demography model FATES (Functionally Assembled Terrestrial Ecosystem Simulator). Combining information from field observations and vegetation modelling, we will provide new insights on the roles and contributions of dwarf-shrubs in climate-biosphere feedbacks, and ultimately contribute to an enhanced Earth system model performance in predicting future changes in the boreal and Arctic region.

This objective involves calibrating CLM-FATES using the extensive field observation data collected across four sites in Norway as part of the DURIN project, ranging from physiology to ecosystem fluxes, carbon allocation, below-ground interactions, and soil properties. These measurements capture habitat change (open and forested) as well as latitudinal and inland-coastal gradients, providing crucial information on environmental controls of dwarf-shrubs and ensuring robust model parameterization and calibration. The DURIN data will be used to calibrate key physiological and ecosystem parameters in the model, including those related to photosynthesis, carbon allocation, and plant-soil hydraulics. They will also support further model developments of a dwarf-shrub plant functional type, such as revised allometric relationships, improved biomass allocation schemes, or enhanced parameterization of cold and drought stresses. Here, we present the first results from integrating these field observations into CLM-FATES, outlining the emerging representation of dwarf-shrubs in the model and the next steps in its development. 

How to cite: Rezsöhazy, J., Geange, S. R., Tang, H., Fisher, R. A., Birkeli, K., and Vandvik, V.: From field observations to improved land surface models: The case of dwarf-shrubs in Norway, EGU General Assembly 2026, Vienna, Austria, 3–8 May 2026, EGU26-12153, https://doi.org/10.5194/egusphere-egu26-12153, 2026.

EGU26-12157 | ECS | Posters on site | BG3.5

From grid-average to hillslopes: Adding subgrid topography and lateral water redistribution to the LPJ-GUESS terrestrial ecosystem model 

Hao Zhou, Paul A. Miller, Jing Tang, Mats Lindeskog, Petter Pilesjö, Anders Ahlström, Amos Tai, Jin Wu, and Stefan Olin

Large-scale ecosystem models often exhibit substantial uncertainty when simulating topographically complex landscapes because fine-scale microclimate and hydrologic connectivity are poorly represented within coarse grid cells. This uncertainty can propagate into limitations in capturing climate responses in water, carbon, and nitrogen cycling, especially during seasonal transitions and high- and low-flow periods. Here, we extended the widely used dynamic ecosystem model LPJ-GUESS by linking sub-grid topographic heterogeneity to ecosystem functioning through (i) topography-conditioned microclimate and (ii) lateral hillslope water redistribution, while maintaining consistency in coupled nitrogen losses.

Within a standard 0.5° grid cell, we discretize the landscape into representative topographic types based on elevation and aspect. Temperature and incoming shortwave radiation are adjusted per type using elevation, slope, and aspect, allowing vegetation and soil processes to respond to locally resolved climate conditions per topographical type. Hydrology is extended with slope-dependent partitioning between infiltration and runoff, and a daily lateral transfer scheme that redistributes surface and subsurface water downslope through simple storage/retention, thereby introducing the time-lagged hydrologic response absent from the default vertical-only bucket structure. We find that enhanced downslope drainage can unrealistically intensify nitrogen leaching at low landscape positions, so we further implement a nitrogen constraint that limits leaching under weak percolation and represents stronger retention at wetter, low-elevation areas.

We evaluate stepwise model versions in the Krycklan catchment (northern Sweden) using multi-variable observations, including catchment outlet discharge and eddy-covariance measured ecosystem evapotranspiration and carbon fluxes. Introducing sub-grid heterogeneity into LPJ-GUESS reduces runoff seasonality biases and improves performance against observed water and carbon fluxes relative to the default LPJ-GUESS. Our model development within LPJ-GUESS offers a transferable scheme to improve sub-grid topographical process representation in heterogeneous landscapes, and contributes to better simulations of ecosystem responses to climate variability and extremes.

How to cite: Zhou, H., A. Miller, P., Tang, J., Lindeskog, M., Pilesjö, P., Ahlström, A., Tai, A., Wu, J., and Olin, S.: From grid-average to hillslopes: Adding subgrid topography and lateral water redistribution to the LPJ-GUESS terrestrial ecosystem model, EGU General Assembly 2026, Vienna, Austria, 3–8 May 2026, EGU26-12157, https://doi.org/10.5194/egusphere-egu26-12157, 2026.

EGU26-12215 | ECS | Orals | BG3.5

EEO theory for photosynthesis and respiration in gridded standalone JULES for simulating better carbon fluxes 

Narender Reddy Kangari, Wenyao Gan, Pier Luigi Vidale, and Martin Best

Land surface models (LSMs) often exhibit substantial biases in simulating vegetation photosynthesis and respiration, largely due to their reliance on numerous plant functional type (PFT)–specific parameters. Recent advances based on Eco-Evolutionary Optimality (EEO) theory suggest that many of these parameters can be reduced, as vegetation carbon fluxes can be represented using universal optimal light and carboxylation conditions rather than prescribed PFT-dependent traits. Studies have demonstrated that EEO-based approaches perform remarkably well across a wide range of FLUXNET sites. In this study, we implement an EEO-based photosynthesis scheme within the gridded Joint UK Land Environment Simulator (JULES) to evaluate the scalability and performance of the theory at the global scale. This is a critical step beyond site-level evaluation of the theory, enabling assessment of EEO under diverse climatic and ecological conditions worldwide. We compare simulations from the EEO-enabled JULES configuration (JULES-EEO) against two model variants: JULES-NoAdap_NoAcclim, and JULES-Acclim; both of which rely on PFT-specific parameterizations. JULES-NoAdap_NoAcclim assumes no vegetation adaptation or acclimation, while JULES-Acclimation incorporates thermal acclimation following the Kumarathunge scheme. Through this intercomparison, we assess whether EEO can robustly reduce biases in global carbon flux simulations relative to conventional pft-parameter formulations. Superior performance of the EEO-based model offers the potential for improved computational efficiency by eliminating iterative, PFT-specific calculations, thereby enhancing overall model speed. The results provide new insights into the applicability of eco-evolutionary optimality theory at global scales and help identify potential pathways for further refinement of vegetation process representations in Earth system models.

How to cite: Kangari, N. R., Gan, W., Vidale, P. L., and Best, M.: EEO theory for photosynthesis and respiration in gridded standalone JULES for simulating better carbon fluxes, EGU General Assembly 2026, Vienna, Austria, 3–8 May 2026, EGU26-12215, https://doi.org/10.5194/egusphere-egu26-12215, 2026.

EGU26-13512 | ECS | Orals | BG3.5

Cohort-based water competition in a land surface model to assess grassland responses to drought 

Camille Abadie, Víctor Rolo, Josua Seitz, Luke Daly, Gayathri Girish Nair, Phillip Papastefanou, and Silvia Caldararu

Climate change increases the frequency and intensity of drought events, highlighting the need to accurately predict vegetation responses to water stress to reduce uncertainties in climate projections. Droughts can determine the competitive outcome between plant species, thereby affecting ecosystem carbon, water, and energy fluxes. Capturing species- or cohort-specific responses to drought (where cohorts group species with similar plant traits and water stress strategies) in land surface models requires representing structural and functional diversity, which determines how plants compete for water under stress.

Most land surface models, including QUINCY, represent vegetation using a few fixed plant functional types, defined by shared photosynthetic pathway, phenology, structure, and climatic range, with little or no interaction between co-occurring species. To address this limitation, we introduced vegetation demography into QUINCY, focusing on grasslands. At the site scale, the model now represents multiple cohorts, defined by distinct plant trait combinations that influence water stress responses, which share the same soil resources and allow for explicit water competition between cohorts. By accounting for how plants compete for water at different soil depths, the model links cohort interactions to changes in transpiration driven by soil water availability and root distribution, supporting more process-based simulations of grassland drought responses. To ensure consistent coupling between water and carbon fluxes, physiological water stress is diagnosed based on the reduction in transpiration caused by competition for soil water. This approach maintains coherence between transpiration and carbon uptake under drought conditions.

Site-scale simulations with this cohort-based water competition scheme allow detailed analyses of water use strategies, transpiration partitioning, and drought responses in grassland communities. By incorporating in situ observations of species composition and plant traits to define cohorts, the framework directly connects field data with model simulations, supporting more accurate predictions of grassland responses to drought.

This framework provides a basis for assessing water competition outcomes in grassland communities under future climate scenarios and will be extended to include nutrient competition. Overall, the introduction of cohort-based water competition in QUINCY represents a step toward more realistic simulations of ecosystem responses to environmental stress, offering insights into the role of plant diversity and structure in modulating drought impacts.

How to cite: Abadie, C., Rolo, V., Seitz, J., Daly, L., Girish Nair, G., Papastefanou, P., and Caldararu, S.: Cohort-based water competition in a land surface model to assess grassland responses to drought, EGU General Assembly 2026, Vienna, Austria, 3–8 May 2026, EGU26-13512, https://doi.org/10.5194/egusphere-egu26-13512, 2026.

EGU26-13561 | ECS | Orals | BG3.5

Mapping the global distribution of pollinator-dependence in wild and cultivated plants 

Jack Rawden, Tim Newbold, and Marco Springmann

Plant-pollinator interactions represent a mutualistic relationship of global importance, contributing to the reproduction of most of the world's vascular plants. However, a range of drivers such as climate change and increased land-use intensity are contributing to observed declines in global pollinator numbers. The risk of this decline to both ecosystems and human-wellbeing remains unclear, despite observed cases of pollen limitation in ecosystems and crop systems. Pollen-limited natural vegetation can lead to habitat degradation, impacting biodiversity and regulatory ecosystem services, whilst pollen-limited crops can result in crop shortages, threatening food security. Global, spatial models of pollinator-dependence in plants are required to identify where vegetation is most vulnerable to becoming pollen-limited if pollinators decline.

We take a dataset of measured pollinator-dependence values and use it to phylogenetically model the pollinator-dependence of 159,366 wild plant species, using and testing an assumption that pollinator-dependence can be inferred from species relatedness. We pair this with species distribution maps and pollinator-dependence data for 98 crops to generate a global, spatially explicit, dataset of pollinator-dependence in both wild and cultivated plants at a 20 km resolution.

We find that natural vegetation has a global average pollinator-dependence of 0.51 (0 = pollinator-independent, 1 = complete pollinator-dependence). This rises to approach 0.70 in the tropics, and tropical forests specifically. The Amazon Basin and the Indonesian Archipelago emerge as geographical hotspots of high pollinator-dependence in natural vegetation. We show that areas that have higher numbers of plant species, tend to have a higher average pollinator-dependence. Additionally, we see many pollinator-dependent crops, such as coffee and cocoa, being grown in areas where adjacent ecosystems are highly pollinator-dependent. We also find that approximately half of the global human population lives close to pollinator-dependent natural vegetation.

This study offers an insight into global trends of pollinator-dependence in wild and cultivated plants, and explores how the risk of a global pollinator decline to biodiversity and human well-being may be spatially uneven. Our dataset allows for pollinator-dependence to be incorporated into spatially explicit ecosystem models, allowing for further work aimed at understanding the relative importance of pollinators in limiting the growth of plant populations at a global scale.


How to cite: Rawden, J., Newbold, T., and Springmann, M.: Mapping the global distribution of pollinator-dependence in wild and cultivated plants, EGU General Assembly 2026, Vienna, Austria, 3–8 May 2026, EGU26-13561, https://doi.org/10.5194/egusphere-egu26-13561, 2026.

EGU26-14613 | ECS | Posters on site | BG3.5

Species-Specific Controls on Carbon–Water Coupling in European Temperate Forests: A Process-Based Sensitivity Analysis Using the CARAIB Dynamic Vegetation Model  

Tarunsinh Chaudhari, Arpita Verma, Alain Hambuckers, Nicolas Ghilain, Benjamin. Lecart, and Louis François

Temperate forests play a central role in Europe’s carbon and water cycles, yet process-based vegetation models remain weakly constrained at the species and daily timescale, particularly with respect to physiological and radiative controls on carbon–water coupling. In Wallonia (Belgium), forests cover 33% of the territory and represent about 80 % of the country’s forest area, with European beech (Fagus sylvatica), oaks (Quercus robur and Quercus petraea), Norway spruce (Picea abies) and Douglas fir (Pseudotsuga menziesii) among the dominant species.

Here, we present a species-specific, daily-scale sensitivity analysis of the CARAIB dynamic vegetation model at the FLUXNET/ICOS Vielsalm site (BE-Vie), a mixed forest site with European beech and Douglas fir as dominant species. Model performance is evaluated using eddy-covariance–derived gross primary production (GPP), total ecosystem respiration (TER), net ecosystem exchange (NEE) and actual evapotranspiration (AET) products for 1997–2021 processed with multiple friction-velocity (u*) filtering methods.

We systematically examine how forest management (year of plantation, thinning), nitrogen availability, plant functional traits, and radiative processes shape simulated GPP, TER, NEE and water-use efficiency (WUE, i.e., the ratio of GPP to transpiration). Physiological parameters constraining the model include slope of stomatal relationship (g₁), specific leaf area (SLA), carbon-to-nitrogen ratio (C:N) and fraction of sapwood (fsw), as well as the level of isohydricity of the tree species. Radiative sensitivity is assessed using diffuse radiation fraction at the top of canopy and leaf optical properties. Soil respiration sensitivity is also assessed through parameters controlling its dependence on temperature and soil water content. 

We put a particular emphasis on understanding the way the studied parameters impact the response of GPP, TER and NEE to droughts, by comparing drought years (e.g., 2018, 2019 and 2020) to normal years. The findings demonstrate that species-specific, process-based calibration is essential for improving dynamic vegetation model reliability in European temperate forests under management, climate and environmental changes.

How to cite: Chaudhari, T., Verma, A., Hambuckers, A., Ghilain, N., Lecart, B., and François, L.: Species-Specific Controls on Carbon–Water Coupling in European Temperate Forests: A Process-Based Sensitivity Analysis Using the CARAIB Dynamic Vegetation Model , EGU General Assembly 2026, Vienna, Austria, 3–8 May 2026, EGU26-14613, https://doi.org/10.5194/egusphere-egu26-14613, 2026.

EGU26-15195 | Orals | BG3.5

A multi-parameter definition of climate change velocity 

Jérôme Kasparian, Héloïse Allaman, Iaroslav Gaponenko, and Stéphane Goyette
In order to assess whether natural and human systems can adapt or migrate rapidly enough to keep pace with changing environmental conditions, it is essential to understand the spatial velocity of climate change. Current approaches of climate change velocity can, in principle, be applied to any climate variable, but they require a continuously varying scalar field. This constraint limits their practical application to single-variable analyses, because climate change impacts on ecological, agricultural, urban, economic, and human systems are inherently multi-parameter [1].
The recently introduced Monte-cArlo iTerative Convergence metHod (MATCH) [2] provides a continuous and ecologically relevant estimate of climate change velocity [3], although limited to a single climate parameter at once. In this study, we extend MATCH by introducing a multi-parameter definition of climate change velocity, enabling the computation of velocity for any chosen combination of climate variables. This generalisation enables the dynamics of climate change to be described in a manner that is specifically tailored to the processes or systems being investigated.
We assess the potential of this framework by focusing on species distribution shifts. Using data from the Audubon Christmas Bird Count, we identify the optimal set of climate parameters required to characterize the shift of the ecological niche of North American bird species and compute their corresponding multi-parameter climate velocity. This approach provides new insight into the pace and direction of habitat change and offers a quantitative basis for anticipating species range shifts and supporting adaptive conservation strategies.
H. Allaman, S. Goyette, P.-H. Dubuis, J. Kasparian, Future viability of European vineyards using bioclimatic climate analogues, Agricultural and Forest Meteorology 378, 110978 (2026) 
I. Gaponenko, G. Rohat, S. Goyette, P. Paruch, J. Kasparian, Smooth velocity fields for tracking climate change, Scientific Reports 12, 2997 (2022) 
L. Moinat, I. Gaponenko, S. Goyette, J. Kasparian, Comparing ecological relevance of climate velocity indices, Scientific Reports, in press (2026)

How to cite: Kasparian, J., Allaman, H., Gaponenko, I., and Goyette, S.: A multi-parameter definition of climate change velocity, EGU General Assembly 2026, Vienna, Austria, 3–8 May 2026, EGU26-15195, https://doi.org/10.5194/egusphere-egu26-15195, 2026.

EGU26-16516 | Posters on site | BG3.5

Advancing Ecohydrological Modelling with Coupled ParFlow-LPJ-GUESS: Role of Lateral Flow in Vegetation and Hydrology Simulations 

Zitong Jia, Yongshuo H. Fu, Shouzhi Chen, and Jing Tang

Climate change accelerates the global hydrological cycle, which has escalating impacts on human health and the socioeconomic development. However, many existing Earth system models neglect the more complex processes of topography-driven vegetation-surface-groundwater interactions, thereby failing to accurately capture climate-hydrological responses. To address this gap, we integrate the three-dimensional surface-subsurface hydrological model ParFlow with the dynamic global vegetation model LPJ-GUESS to investigate how lateral groundwater flow and vegetation dynamics jointly regulate hydrological fluxes. The fully coupled ParFlow-LPJ-GUESS (PF-LPJG) model (with and without lateral flow) and stand-alone LPJ-GUESS model were used to run hydrological simulations over a 38-year period at a resolution of 10 km across the Danube River Basin. The results demonstrate that the PF-LPJG model substantially improves streamflow and surface soil moisture simulations without requiring parameter calibration compared to stand-alone LPJ-GUESS, mitigates the underestimation of summer low flows during dry years, increases the accuracy of peak flow timing in wet years, and achieves a Kling-Gupta Efficiency (KGE) > 0.5 and Spearman’s ρ > 0.80 at over 80 % of gauging stations. Seasonal soil moisture anomalies are better captured (R = 0.51) compared to satellite-based products. Additionally, the modelled WTD agrees well with in-situ monitoring-well data, as indicated by a low RSR value (~1.31). Notably, the coupled model improves the representation of bare-soil evaporation and reduces transpiration-to-evaporation (T/E) ratio fluctuations, aligning more closely with the GLEAM v4.2 product. Sensitivity analysis reveals that shallow-rooted vegetation exhibits strong decreases in LAI and AET when lateral flow is removed, while slightly increasing LAI and AET in deep-rooted regions. The coupled model PF-LPJG entails a mechanistic framework for capturing bidirectional interactions among surface-subsurface water, vegetation dynamics and ecosystem biogeochemical processes, which can be applied to other catchments or climatic conditions to deeply analyze climate-induced modification on vegetation-water-carbon interactions. Future work will focus on how the lateral flow affects vegetation greening under different climatic conditions.

How to cite: Jia, Z., Fu, Y. H., Chen, S., and Tang, J.: Advancing Ecohydrological Modelling with Coupled ParFlow-LPJ-GUESS: Role of Lateral Flow in Vegetation and Hydrology Simulations, EGU General Assembly 2026, Vienna, Austria, 3–8 May 2026, EGU26-16516, https://doi.org/10.5194/egusphere-egu26-16516, 2026.

EGU26-17066 | ECS | Orals | BG3.5

A vegetation model based indicator measuring the risk for ecosystem destabilization (EcoRisk) 

Fabian Stenzel, Jannes Breier, Dieter Gerten, Sebastian Ostberg, Sibyll Schaphoff, and Wolfgang Lucht

A stable Earth system requires a healthy biosphere, but many ecosystems are being pushed beyond safe limits due to human activities such as land-use, resource extraction and climatic changes.

We map the “risk for ecosystem destabilization” (EcoRisk) due climate and land-use pressures based on simulations with the dynamic global vegetation model LPJmL. EcoRisk quantifies ecosystem dissimilarity relative to a preindustrial reference on a scale ranging from no change (0) to very strong change (1). It captures shifts in the vegetation structure (e.g., transition from forest to savanna), as well as relative (relevant for the local scale) and absolute shifts (relevant for the global scale) in soil and vegetation carbon stocks and fluxes, nitrogen stocks and fluxes, and changes in the water cycle [Stenzel et al. 2024].

Currently, almost 30% of the Earth’s global land area show severe changes (EcoRisk exceeds 0.55, a threshold derived from 10 independent indicators of biosphere integrity). These transgressions have steadily increased since 1600 and accelerated after 1925 [Stenzel et al. 2025]. A preliminary assessment of the future status according to simulations from ISIMIP3b scenarios indicates that EcoRisk continues to rise under SSP3-7.0, whereas under SSP1-2.6 it might plateau after mid-century, depending on the land-use scenario.

EcoRisk however is not only useful as a biosphere integrity indicator, but can also be used for model evaluation, because it can be computed separately for vegetation structure, water, carbon or nitrogen. It thus provides a diagnostic tool for model evaluation, benchmarking, and isolating the sources of change after major code revisions.

Data availability: https://biointegrity.pik-potsdam.de

Stenzel, F.; Braun, J.; Breier, J.; Erb, K.; Gerten, D.; Heinke, J.; Matej, S.; Ostberg, S.; Schaphoff, S. & Lucht, W.: biospheremetrics v1.0.2: an R package to calculate two complementary terrestrial biosphere integrity indicators -- human colonization of the biosphere (BioCol) and risk of ecosystem destabilization (EcoRisk), Geoscientific Model Development, 2024, 17, 3235-3258

Stenzel, F.; Ben Uri, L.; Braun, J.; Breier, J.; Erb, K.; Gerten, D.; Haberl, H.; Matej, S.; Milo, R.; Ostberg, S.; Rockström, J.; Roux, N.; Schaphoff, S. & Lucht, W.: Breaching planetary boundaries: Over half of global land area suffers critical losses in functional biosphere integrity, One Earth, 2025, 8, 101393

How to cite: Stenzel, F., Breier, J., Gerten, D., Ostberg, S., Schaphoff, S., and Lucht, W.: A vegetation model based indicator measuring the risk for ecosystem destabilization (EcoRisk), EGU General Assembly 2026, Vienna, Austria, 3–8 May 2026, EGU26-17066, https://doi.org/10.5194/egusphere-egu26-17066, 2026.

Tropical dry forests (TDFs) are ecosystems that are highly vulnerable to drought and face threats from human activities. However, long-term assessments of ecological drought dynamics across their geographic extent remain limited. In this study, we quantify spatial and temporal drought patterns in TDFs across the Americas using the Standardized Precipitation Evapotranspiration Index (SPEI). We examined SPEI at 3-, 6-, and 12-month timescales to capture short-term moisture deficits and longer-term water stress affecting ecosystem functioning. Drought trends from 1950 to 2024 were analyzed, focusing on drought occurrences, their severity, duration, and spatial extent.

Our results reveal heterogeneity in drought dynamics across the Neotropical dry forests. While some areas have experienced increases in drought severity and persistence in recent decades, longer SPEI timescales indicate an intensification of prolonged water deficits, particularly in regions with higher precipitation regimes. Overall, this study provides a continental-scale perspective on ecological drought in TDFs in the Neotropics. It highlights emerging hotspots of vulnerability and emphasizes the importance of incorporating evaporative demand into drought assessments. Our findings have direct implications for understanding ecosystem resilience, guiding conservation strategies, and predicting climate change impacts on tropical dry forest structure and function.

How to cite: Moreno-Pina, P. and Sanchez-Azofeifa, A.: Historical Drought Variability in Neotropical Dry Forests Using the Standardized Precipitation Evapotranspiration Index (SPEI) from 1950 to 2024, EGU General Assembly 2026, Vienna, Austria, 3–8 May 2026, EGU26-17134, https://doi.org/10.5194/egusphere-egu26-17134, 2026.

EGU26-17909 | Orals | BG3.5

Modelling central European oak growth 

Andrew Friend and Ulf Büntgen

Terrestrial ecosystem models are key tools for understanding and predicting climate and CO2 impacts on vegetation. Despite decades of research, there remains considerable uncertainty as to how to simulate canopy photosynthesis and transpiration, respiration, growth, and turnover. This uncertainty includes the approach to use, its complexity, and its parameterisation, and covers all processes from light interception to soil water dynamics to demography. While simulated carbon fluxes are often compared with eddy-covariance measurements, simulated growth is more difficult to evaluate. Tree rings can provide a useful measure of interannual growth rates, and are therefore an important potential constraint on model representations. Here, we use a new central European oak ring width chronology, 1901-2015 CE, to evaluate a range of model assumptions regarding key processes. Capturing more than a limited amount of the interannual variability in the chronology is difficult (i.e. achieving Pearson’s r > 0.5, including the long-term trend). It is clear that soil hydrological dynamics are a key driver and need to be represented well, as do leaf phenology, respiration, and responses to temperature and CO2. Spatial variability in climate and other factors such as soil type and depth also plays an important role. Less clear is how to explain some years with very strong or very weak growth. Explanations are sort in extreme temperatures (e.g. frost damage), extreme drought stress (e.g. causing xylem cavitation), recovery from storm damage, carry-over between years, and separation of controls on growth and photosynthesis. Recommendations are made regarding requirements for process representations and for future work to better understand drivers of tree-ring variability in temperate forest ecosystems.

How to cite: Friend, A. and Büntgen, U.: Modelling central European oak growth, EGU General Assembly 2026, Vienna, Austria, 3–8 May 2026, EGU26-17909, https://doi.org/10.5194/egusphere-egu26-17909, 2026.

The heterogenous structure and diversity of forest stands shape resource availabilities to individual trees and lead to diversity in stress responses. Heterogeneity in size and/or traits thus strongly determines tree and ecosystem carbon balances. While short-term net ecosystem carbon and water exchange might be well approximated by the average behavior of the top canopy trees, we expect both longer-term structural shifts as well as stress responses to extreme conditions to be more strongly dependent on the demography of below-canopy trees. Dynamic vegetation models (DVM) resolve and track this heterogeneity. They simulate growth, mortality, competition, and carbon allocation strategies. Thereby they propagate changes in environmental conditions into changes in structure of forest ecosystems.

Here, we use daily ecosystem flux measurements of gross primary production (GPP) and multi-annual forest inventories (distribution of diameter at breast height, DBH) as observational constraints to calibrate BiomeEP (Weng et al., 2015). BiomeEP is a process-based DVM grounded in optimality principles for computational efficiency and parameter sparsity. It includes acclimation of photosynthetic capacity via P-model (Stocker et al., 2020), a perfect plasticity assumption for canopy layering (Strigul et al., 2008) and makes use of empirical allometric relationships.

Our model implementation shows single-core runtimes (including 2000 years of spin-up) on the order of seconds for individual sites and thus enables site-specific inference of physiological traits. As next step the PROFOUND data set (Reyer et al. 2020) containing GPP and DBH data from seven European sites will be used for model data fusion. We aim to reproduce observed GPP and DBH distributions (targeting both absolute numbers and relative size distribution) and estimate parameter identifiability as well as across-sites generalizability. Preliminary results demonstrated the sensitivity of targets on the species-specific rate parameters for growth and mortality. Across-site generalizable parameters could pave the way to inform large scale predictions under future environmental changes.

How to cite: Bernhard, F., Weng, E., and Stocker, B.: Model-data fusion of daily ecosystem fluxes (GPP) and forest inventories (DBH) with the process-based dynamic vegetation model BiomeEP, EGU General Assembly 2026, Vienna, Austria, 3–8 May 2026, EGU26-21054, https://doi.org/10.5194/egusphere-egu26-21054, 2026.

EGU26-21178 | ECS | Posters on site | BG3.5

Research on the construction mechanism of warm temperate deciduous broad-leaved forest communities based on plant functional traits in northern China, 

Shiping Xing, Hairong Han, Zhan jun Quan, Yibo Sun, and Hui Wang

The mechanism of community assembly has always been a core aspect of community ecology. Exploring the interspecific interactions and the distribution characteristics of different organ traits, as well as their main influencing factors, during community development is of great significance for community assembly, succession, and adaptation to climate change. However, artificial forests cannot compare with natural forests in terms of biodiversity conservation and ecosystem multifunctionality. Therefore, an in-depth exploration of the assembly mechanisms of natural forest communities is beneficial for maximizing their ecological, economic, and social benefits. Current research mostly focuses on single-organ, single-functional groups and their responses to single environmental variables. There is little exploration of the diversity of species and the distribution patterns of functional traits in different functional groups and organs during the assembly process of natural communities, as well as their environmental explanations. This study takes the Quercus wutaishanica as community in the warm temperate deciduous forest of northern China as an example. Community surveys were conducted in Quercus wutaishanica communities spanning five provinces from west to east in northern China, including different functional groups such as trees, shrubs, and herbs. Samples of leaves, twigs, and fine roots were collected, and their morphological and chemical functional traits were measured. Environmental factors including soil and topography were also measured. This study aims to deeply explore the interactions between functional traits and species in natural forest communities and their environmental explanations, elucidate the ecological processes involved in the assembly process of warm temperate deciduous broad-leaved forest communities in northern China, and reveal their community assembly mechanisms. The goal is to provide a theoretical basis for biodiversity conservation, the restoration and reconstruction of natural secondary forests, and responding to climate change.

How to cite: Xing, S., Han, H., Quan, Z. J., Sun, Y., and Wang, H.: Research on the construction mechanism of warm temperate deciduous broad-leaved forest communities based on plant functional traits in northern China,, EGU General Assembly 2026, Vienna, Austria, 3–8 May 2026, EGU26-21178, https://doi.org/10.5194/egusphere-egu26-21178, 2026.

EGU26-3277 | ECS | Orals | BG3.7

Unpacking the potential: How proposed reforestation scenarios shape global and regional temperature 

Nora L. S. Fahrenbach, Steven De Hertog, Felix Jäger, Peter Lawrence, and Robert Jnglin Wills

Large-scale reforestation is a prominent proposed climate mitigation strategy, yet our understanding of its impact on global and regional temperature remains incomplete. Here, we present the first comparison of temperature responses to three distinct reforestation potentials – Bastin et al. (2019), Moustakis et al. (2024), and Hurtt et al. (2020) – integrated into a fully-coupled Earth System Model (CESM2) under an SSP2-4.5 warming trajectory. Our simulations reveal that while all scenarios achieve a net global cooling ranging from -0.13°C to -0.25°C by 2100, the cooling from carbon uptake is partially offset by biogeophysical warming. Consequently, a comparable net global cooling can be achieved with substantially less reforested area (up to 450 Mha) if planting locations are better suited for regional-scale cooling. Reforestation locally cools the tropics but triggers albedo-driven warming in higher latitudes, which is further amplified by non-local effects. Thus, tropical and subtropical regions emerge as high-potential climate mitigation areas where local cooling dominates, whereas reforestation in mid-to-high latitudes can be climatically counterproductive due to this amplified local warming. Regional temperature outcomes diverge most significantly due to non-local responses, illustrating how specific reforestation patterns reshape the climate through large-scale circulation and oceanic adjustments. Interestingly, despite these divergent temperature patterns, we find that precipitation changes remain surprisingly consistent across the different reforestation scenarios. Our findings underscore the importance of "climate-smart" policies that prioritize the geographical placement of reforestation over total area, accounting for both biogeochemical and biogeophysical effects to maximize global cooling benefits.

Reference to preprint: https://doi.org/10.21203/rs.3.rs-7714264/v1 

How to cite: Fahrenbach, N. L. S., De Hertog, S., Jäger, F., Lawrence, P., and Jnglin Wills, R.: Unpacking the potential: How proposed reforestation scenarios shape global and regional temperature, EGU General Assembly 2026, Vienna, Austria, 3–8 May 2026, EGU26-3277, https://doi.org/10.5194/egusphere-egu26-3277, 2026.

EGU26-3439 | Posters on site | BG3.7

Ski tourism as land use change: Assessing impacts on Alpine surface runoff generation 

Veronika Lechner, Christian Scheidl, Matthias Schlögl, Andreas Huber, Bernhard Kohl, Klaus Klebinder, Gertraud Meißl, and Gerhard Markart

Ski slope development represents one of the most intensive land use and land cover changes (LULCC) in Alpine environments, involving large-scale soil disturbance, vegetation removal, and terrain modification. While these transformations are evident, their consequences for hydrological regimes remain poorly quantified.

We analysed more than 20 years of artificial rainfall simulation data from 74 experiments conducted in 12 Alpine ski regions. Surface runoff generation on ski slopes was directly compared to adjacent reference areas with comparable environmental characteristics, allowing robust attribution of observed differences to ski slope development. We complement this experimental design with random forest regression to identify the key site characteristics that most strongly control runoff generation on each surface type.

Surface runoff coefficients on ski slopes (median 0.57) were approximately six times higher than on reference areas (0.09), indicating a substantial reduction in infiltration capacity following ski slope development. Model results indicate contrasting hydrological controls: soil properties and land use are most important for reference areas, while geological factors dominate on ski slopes.

These findings suggest that land use change shifts hydrological sensitivity from near-surface conditions to substrate and geomorphic context. By integrating long-term experimental data with machine learning, this study provides a framework to quantify land use impacts on Alpine hydrology and to support sustainable land management and planning in mountain environments.

How to cite: Lechner, V., Scheidl, C., Schlögl, M., Huber, A., Kohl, B., Klebinder, K., Meißl, G., and Markart, G.: Ski tourism as land use change: Assessing impacts on Alpine surface runoff generation, EGU General Assembly 2026, Vienna, Austria, 3–8 May 2026, EGU26-3439, https://doi.org/10.5194/egusphere-egu26-3439, 2026.

EGU26-3701 | ECS | Posters on site | BG3.7

Cascading influence of land use on riverine carbon and nutrients in a tropical coastal and inland headwaters streams. 

Samuel Ngari, Fredrick Tamooh, Alberto V. Borges, Fred Omengo, Grace Kibue, and Steven Bouillon

Anthropogenic pressures such as agricultural activities and urban development increasingly alter biogeochemical processes in headwaters catchments by modifying hydrological pathways, sediment and nutrient inputs, and carbon cycling. These impacts are intensified in tropical regions where high temperatures and intense episodic rainfall promote enhanced mobilisation of particulate matter and solutes from the landscape and rapid in-stream processing. Despite this, integrated studies linking land-use gradients to changes in carbon isotopes, nutrient dynamics and respiration pathways remain limited in tropical streams. Here we investigate how agricultural activities and human development (as reflected in land use cover) influence nutrients (PO₄3-, NO₃-, NO₂-,NH4+), dissolved inorganic and organic carbon concentrations and  isotopes (δ¹³C-DIC, δ¹³C-DOC), particulate organic carbon isotopes (δ¹³C-POC, δ¹⁵N-PN), sediment δ¹³C and δ¹⁵N, and carbon-processing pathways (pelagic and sediment respiration) across inland (Chania, Sagana, Thiba) and coastal (Ramisi, Mkurumudzi) catchments in Kenya. Seasonal sampling during both wet and dry periods captured contrasting biogeochemical conditions. We observed pronounced spatial contrasts in carbon sources and processing. Inland catchments exhibited progressively lower δ¹³C-DIC values (-3.1‰ to -12.6‰) with increasing agricultural cover, whereas coastal catchments showed an increase of δ¹³C–DIC (−16.9‰ to −2.1‰) along similar land use gradients. Across all catchments, δ¹³C-DOC, sediment δ¹³C, and sediment δ¹⁵N increased significantly with the fraction of agricultural land use . Nutrient responses were spatially and seasonally variable, with urbanised sections, particularly in the Thiba catchment showing strong relationships between built-up land use and NO₂⁻ concentrations, as well as between built-up land within 2 km–200 m buffers and N₂O. Both PO₄³⁻ and NO₃⁻ increased with agricultural land cover, though correlation strength varied among Catchments and season. By integrating hydrology, land use, isotopes, nutrients and respiration metrics, this study demonstrates that tropical catchments exhibit distinct inland to coastal controls on carbon sources and nutrient enrichment. These findings underscore the need for region-specific understanding of how land-use change is reshaping carbon and nutrient dynamics in the tropical  river systems, in order to guide adequate management strategies to improve water quality.

How to cite: Ngari, S., Tamooh, F., V. Borges, A., Omengo, F., Kibue, G., and Bouillon, S.: Cascading influence of land use on riverine carbon and nutrients in a tropical coastal and inland headwaters streams., EGU General Assembly 2026, Vienna, Austria, 3–8 May 2026, EGU26-3701, https://doi.org/10.5194/egusphere-egu26-3701, 2026.

EGU26-4048 | Posters on site | BG3.7

Emerging Land-Cover Changes from Boreal-Tundra Greening Reveal Reduced Surface-warming Feedback Relevant to Boreal Afforestation Feasibility in Northern Canada. 

Daniel Chukwuemeka Amaogu, Enoch Ofosu, Dsouza Kevin Bradley, Jérôme Pigeon, Lukas U Arenson, Richard Boudreault, Juan Moreno-Cruz, Yuri Leonenko, and Pooneh Maghoul

Across Northern Canada’s boreal–tundra (CBT) ecozones, climate warming has driven rapid northward greening induced land-cover vegetation type changes that modifies the land–atmosphere energy exchanges. While classical vegetation-type-dependent albedo constrained models predict that high-stature vegetation expansion amplifies warming through surface darkening, our observations suggest contrary diverse climate responses.

Using Landsat-based NDVI and MODIS albedo trends (1986–2023), integrated with land-cover transitions, meteorological records, and surface-energy fluxes, we find that, rather than declining, vegetation increases across ecozones largely correspond to snow-free albedo increases of 0.2–0.8 % dec⁻¹. These albedo increases are spatially collocated with surface-energy trends ranging from −0.003 to −0.009 W m⁻² yr⁻¹, consistent with stronger surface-warming reduction tendencies reaching up to −0.028 °C yr⁻¹ across the majority of central and northern CBT ecozones, particularly where landcover shifts toward mixedwood, broadleaf, and treed-wetlands compared with ecozones regions dominated by highly conifers and shrubified assemblages.

Under classical albedo-constrained expectations, CBT afforestation has often been viewed as a warming risk. Here, by viewing CBT greening–induced increases in high-stature vegetation as natural afforestation analogs, our results show that near-surface warming can be dampened upon afforestation with specific vegetation types, indicating that CBT afforestation feasibility is highly conditional on vegetation structure, hydrological context, and ecozone setting. These findings provide empirical evidence for the possibilities of surface cooling–dominated boreal afforestation pathways in boreal–tundra regions, with implications for permafrost stability, land-based climate mitigation, adaptation, and ecosystem restoration.

How to cite: Amaogu, D. C., Ofosu, E., Kevin Bradley, D., Pigeon, J., Arenson, L. U., Boudreault, R., Moreno-Cruz, J., Leonenko, Y., and Maghoul, P.: Emerging Land-Cover Changes from Boreal-Tundra Greening Reveal Reduced Surface-warming Feedback Relevant to Boreal Afforestation Feasibility in Northern Canada., EGU General Assembly 2026, Vienna, Austria, 3–8 May 2026, EGU26-4048, https://doi.org/10.5194/egusphere-egu26-4048, 2026.

EGU26-4147 | Orals | BG3.7

The climate mitigation of global forestation: Constrained by land availability and policy 

Zhangcai Qin, Yijie Wang, Yakun Zhu, Susan Cook-Patton, Wenjuan Sun, Wen Zhang, Philippe Ciais, Tingting Li, Pete Smith, Wenping Yuan, Xudong Zhu, Josep Canadell, Xiaopeng Deng, Yifan Xu, Hao Xu, and Chao Yue

Large-scale forestation, a profound form of land cover change, is widely proposed for climate mitigation. Its full Earth system impact, however, depends on complex trade-offs between carbon sequestration in biomass and soils and other biogeophysical feedbacks, alongside stringent land availability constraints. This study assesses the global potential and limits of forestation as a land use change strategy by integrating high-resolution simulations of soil organic carbon dynamics with spatially explicit constraints on land availability designed to prevent adverse impacts on surface albedo, water resources, and biodiversity. Our analysis reveals that when forestation is restricted to these ecologically viable lands, its scale and consequent carbon sequestration potential are substantially lower than previous estimates that did not fully account for these Earth system trade-offs. Furthermore, when land use is limited only to areas aligned with existing national policy commitments, the feasible scope for forestation and its associated carbon sink becomes drastically reduced. Realizing significant climate benefits from forestation requires navigating critical land use trade-offs and expanding ambitious, spatially optimized land-use policies, particularly in regions with high potential.

How to cite: Qin, Z., Wang, Y., Zhu, Y., Cook-Patton, S., Sun, W., Zhang, W., Ciais, P., Li, T., Smith, P., Yuan, W., Zhu, X., Canadell, J., Deng, X., Xu, Y., Xu, H., and Yue, C.: The climate mitigation of global forestation: Constrained by land availability and policy, EGU General Assembly 2026, Vienna, Austria, 3–8 May 2026, EGU26-4147, https://doi.org/10.5194/egusphere-egu26-4147, 2026.

EGU26-4739 | ECS | Posters on site | BG3.7

The impacts of oil palm expansion on the terrestrial carbon cycle in Southeast Asia 

Ruiying Zhao and Xiangzhong Luo

Rising demand for palm oil has driven rapid expansion of oil palm plantations in Southeast Asia over the past decades, yet their impacts on the regional carbon budget remain poorly constrained due to complex interactions between oil palm ecosystems and climate change, stand age, soils, and management. Here, we develop a diagnostic terrestrial biosphere model that incorporates key processes of oil palm carbon cycles, driven by high-resolution remote-sensing products and meteorological forcings. We validate our model using extensive observational data, including 31 site-years of carbon flux observations from eddy covariance sites and 360 sub-national yield records, and then simulate the carbon dynamics from 2001 to 2020 across Indonesia and Malaysia. Our model reproduces the observed carbon fluxes well, with R2 > 0.90 and RMSE < 502 gC/m2/year against eddy covariance measurements. We find oil palm plantations initially (yrs < 10 years) act as strong carbon sources, with annual net ecosystem exchange (excluding harvested fruits) exceeding 2,000 gC/m2/year. The plantations approach carbon neutrality and can become net sinks on mineral soils after maturity (yrs > 10 years), whereas those on peat soils remain net sources in their lifetime. Our study reveals the controlling factors of oil palm carbon fluxes and provides a spatially explicit estimate of carbon fluxes across oil palm plantations, offering insight into their contribution to the regional carbon budget.

How to cite: Zhao, R. and Luo, X.: The impacts of oil palm expansion on the terrestrial carbon cycle in Southeast Asia, EGU General Assembly 2026, Vienna, Austria, 3–8 May 2026, EGU26-4739, https://doi.org/10.5194/egusphere-egu26-4739, 2026.

EGU26-5078 | ECS | Posters on site | BG3.7

Large-scale afforestation impact on precipitation seasonality in global monsoonregions 

Nicolas Rapp, Nora L. S. Fahrenbach, Felix Jäger, Peter Lawrence, and Robert Jnglin Wills

Afforestation and reforestation (A/R) are widely promoted as cost-effective climate change mitigation strategies. In policy discussions, the focus often lies primarily on the local carbon sequestration potential, while potential side effects relevant for mitigation and adaptation are often overlooked. Forests, however, also exert strong biogeophysical impacts on the climate system, affecting the land-atmosphere coupling through changes in surface albedo, surface roughness, and evapotranspiration. Such processes may alter the local and remote hydrological cycle. This is particularly critical for monsoon regions, which are home to nearly one third of the global population and strongly depend on seasonal rainfall for agriculture.

Here, we assess whether and how large-scale afforestation affects precipitation seasonality and wet-season characteristics in global monsoon systems using fully coupled, emission-driven Earth system model (CESM2.1.5) simulations. We compare a large-scale A/R scenario initiated in 2025 with a reference scenario without land-use and land-cover change, both conducted under an SSP2-4.5 forcing pathway and evaluated for late-century conditions (2071 - 2100). Attribution of the simulated precipitation responses is explored using global warming level comparisons and optimal fingerprinting. These approaches indicate that precipitation responses cannot be fully explained by greenhouse-gas forcing alone, suggesting a contribution from biogeophysical-driven processes and associated feedback within the emission-driven framework.

To robustly quantify changes in monsoon timing, we apply an onset and cessation detection method developed by Dunning et al. (2016) that allows explicit identification of wet-season start, end, and duration, rather than relying on fixed seasonal averages over multiple months. This enables an assessment of agriculturally relevant precipitation metrics, including wet-season length, shifts in onset and cessation, and changes in rainfall distribution within the rainy season. An analysis of general precipitation regimes (wet-year-round, dry-year-round, annual, and biannual regimes) indicates no major spatial shifts in their global distribution. However, our results reveal regionally heterogeneous responses to afforestation within the annual regimes. The onset of the rainy season advances over South America and the Sahel but is delayed over Australia. Cessation shifts toward earlier dates over India and later dates over Australia, indicating both wet-season shortening and lengthening across monsoon domains. These findings suggest that afforestation can modify precipitation seasonality beyond greenhouse-gas–driven changes, with important implications for water availability and food security in monsoon-dependent regions.

How to cite: Rapp, N., Fahrenbach, N. L. S., Jäger, F., Lawrence, P., and Jnglin Wills, R.: Large-scale afforestation impact on precipitation seasonality in global monsoonregions, EGU General Assembly 2026, Vienna, Austria, 3–8 May 2026, EGU26-5078, https://doi.org/10.5194/egusphere-egu26-5078, 2026.

EGU26-5102 | ECS | Orals | BG3.7

Impacts of Future Oil Palm Expansion on Carbon and Hydrological Fluxes across the Tropics 

Ru Xu, Yuanchao Fan, Ashehad Ali, David Beerling, and Maria val Martin


Oil palm plantation is a major form of land use and land cover change in the tropics, frequently occurring at the expense of natural vegetation and thereby altering carbon, water and energy fluxes. To assess the biophysical and biogeochemical impacts of future oil palm expansion under climate change, we developed a pan-tropical expansion scenario spanning from 2023 to 2100. Using CLM-palm, a perennial crop module based on the Community Land Model 5 (CLM5), we conducted oil palm expansion simulations for Southeast Asia, Africa and the Amazon under two climate scenarios (SSP1-2.6 and SSP3-7.0).

Across all regions, oil palm expansion increases total vegetation carbon (+9.7%) and net ecosystem production (more than fivefold), but reduces soil carbon (-5.9%) under the SSP1-2.6, reflecting trade-offs between productivity and long-term carbon storage. Vegetation carbon responses depend strongly on previous land use, with forest-to-oil palm conversion causing the largest losses and cropland conversions yielding modest gains. Hydrologically, expansion enhances evapotranspiration (+2.5%), leading to decreases in surface water availability (-3.3%), runoff (-3.3%) and soil moisture (-3.7%). Land surface temperature responses reflect competing  biogeophysical cooling (-0.54°C) and biogeochemical warming (+0.18°C), with strong regional contrasts: cooling in Africa (-0.37°C), warming in the Amazon (+0.23°C), and near offsets in Southeast Asia. Results under SSP3-7.0 show similar spatial patterns but substantially larger magnitudes, indicating that warming amplifies these responses.

These results show that oil palm expansion produces region-specific,  climate-dependent trade-offs in carbon, water and land surface temperature, underscoring the importance of accounting for land-use in climate assessments.

How to cite: Xu, R., Fan, Y., Ali, A., Beerling, D., and val Martin, M.: Impacts of Future Oil Palm Expansion on Carbon and Hydrological Fluxes across the Tropics, EGU General Assembly 2026, Vienna, Austria, 3–8 May 2026, EGU26-5102, https://doi.org/10.5194/egusphere-egu26-5102, 2026.

EGU26-5287 | ECS | Orals | BG3.7

Projected Hotspots of Carbon Sink Loss under Urban Expansion in Southeast Asia by 2050 

Ronghua Xu, Perrine Hamel, Yiwen Zeng, and Poul Grashoff

Rapid urbanization across developing regions is driving extensive land-use and land-cover change, profoundly affecting ecosystem productivity and terrestrial carbon cycling. However, the spatially explicit identification of future urban expansion and associated hotspots of carbon sink loss remains limited, constraining the development of targeted land-based strategies for climate mitigation and ecosystem resilience. Here, we project urban expansion across Southeast Asia to 2050 under Shared Socio-economic Pathway (SSP1–SSP5) scenarios by integrating and validating multiple global urban growth models. We combine projected urban growth areas with spatial forest aboveground carbon stocks and fluxes to characterize carbon sinks. Focusing on sixty major cities selected based on socioeconomic characteristics and built-up extent in 2020, we identify spatial hotspots of carbon sink loss relevant for urban land management. We find that future urban expansion is most likely to occur in landscapes already exhibiting low carbon sequestration, often reflecting fragmented or degraded habitats. Across Southeast Asia, total potential carbon sequestration losses during 2020–2050 range from 241.81 to 242.93 Tg C yr⁻¹ under SSP1–SSP5. Aboveground carbon stock losses range from 21.91 to 21.94 Gt C, equivalent to approximately 80.46 Gt CO₂, representing about 16–20% of the remaining global carbon budget since 2020. Spatial hotspots of carbon sink loss are most pronounced in Indonesia, Malaysia, Viet Nam, and Thailand, with distinct patterns emerging at the city scale. Our transferable methodology enables application across diverse regions and delivers spatially explicit, actionable evidence to support place specific land-based interventions for reducing future urban heat risk and enhancing the resilience of human settlements.

How to cite: Xu, R., Hamel, P., Zeng, Y., and Grashoff, P.: Projected Hotspots of Carbon Sink Loss under Urban Expansion in Southeast Asia by 2050, EGU General Assembly 2026, Vienna, Austria, 3–8 May 2026, EGU26-5287, https://doi.org/10.5194/egusphere-egu26-5287, 2026.

The Earth has exceeded six critical environmental boundaries, posing threats to sustainable development and the realization of human well-being. Protected areas (PAs) are the core global governance tool to address this challenge and need to be ensured to achieve effective conservation outcomes. The existence of spillover effect may either enhance or diminish the value of PAs, but the consistency between local and spillover effectiveness remains unclear. Here, we focused on 10768 PAs in six typical global regions to explore the consistency between local effectiveness and spillover intensity in two dimensions of anthropogenic mitigation and vegetation conservation. During this process, we employed a nonlinear method to quantify the extent of spillover effect and used the counterfactual method to evaluate the conservation effectiveness. Our analysis indicates that in different regions, the change in the proportion of ecological land varies nonlinearly with the distance from the PA boundary, and the spillover extent varies among regions. A small part of PAs exhibited a significant isolated phenomenon. The spillover intensity and local effectiveness were positive for more than half of the PAs. PAs have achieved consistent local and spillover effectiveness in both dimensions, while the spillover intensity was weaker. Precipitation, NPP and elevation were the dominant influencing factors for local effectiveness in both dimensions. Our results showed that merely designating PAs is not sufficient for success. Effective management measures are also needed. The assessment of PA effectiveness should not be limited to the designated boundaries, but also consider the indirect impact of spillover effect. Indicators of multiple dimensions should be taken to quantify the effectiveness comprehensively.

How to cite: Jiang, H. and Peng, J.: Symmetrical local and spillover effectiveness of protected areas in anthropogenic mitigation and vegetation conservation, EGU General Assembly 2026, Vienna, Austria, 3–8 May 2026, EGU26-5392, https://doi.org/10.5194/egusphere-egu26-5392, 2026.

EGU26-5460 | ECS | Orals | BG3.7

Modelling carbon responses to land management in Mediterranean forests and agricultural systems: insights from Greece 

Carmen Sánchez-García, Arthur N. Fendrich, Panos Panagos, and Emanuele Lugato

Forest and agricultural systems represent major reservoirs of terrestrial carbon and play a key role in the carbon balance of Mediterranean landscapes. Their capacity to sequester carbon in both soils and biomass is highly sensitive to land management and disturbance regimes. However, the soil organic carbon (SOC) response to management practices in these systems remains highly uncertain. Accurate mechanistic modelling of SOC dynamics and validation under different forest and agricultural management scenarios are essential to support national and EU climate policies.

We used the state-of-the-art biogeochemical ecosystem model DayCent to simulate SOC stocks and total biomass in Mediterranean agricultural and forest soils at national scale in Grreece. The modelling framework builds on extensive validation of SOC dynamics in agricultural soils, whereas model evaluation in forests soils remains constrained by the lack of long-term field observations of management and disturbance histories. To address this limitation and evaluate model performance in forest soils, we used publicly available field observations from forest sites in Greece combined with spatial datasets of biomass and SOC stocks. Soil organic carbon dynamics were simulated at the 0-30 cm depth. We applied the model under a set of land management scenarios to assess their effects on SOC dynamics and total biomass. This work provides a promising framework to assess carbon sequestration potential of different land management practices in Mediterranean agricultural and forest soils and supports policy-relevant assessments of carbon dynamics.

How to cite: Sánchez-García, C., Fendrich, A. N., Panagos, P., and Lugato, E.: Modelling carbon responses to land management in Mediterranean forests and agricultural systems: insights from Greece, EGU General Assembly 2026, Vienna, Austria, 3–8 May 2026, EGU26-5460, https://doi.org/10.5194/egusphere-egu26-5460, 2026.

EGU26-5740 | ECS | Posters on site | BG3.7

Larger Forest Patches Exhibit Greater Per-Area Productivity in the U.S. and Worldwide 

Yibiao Zou, Gabriel Smith, Thomas Lauber, Joe Wan, Haozhi Ma, Noel Gorelick, Constantin Zohner, and Thomas Crowther

Forest fragmentation is accelerating worldwide as large, continuous forests are divided into increasingly smaller and more isolated patches. While the impacts of fragmentation on biomass storage are well documented, its consequences for forest productivity and carbon sequestration rates remain uncertain. Here, we analyse all ~17 million forest patches across the conterminous United States (CONUS) using a spatial mixed-effects framework to control for broad-scale socio-environmental heterogeneity and spatial autocorrelation. We find that larger forest patches consistently exhibit higher vegetation reflectance and significantly greater per-area net primary productivity (NPP) and gross primary productivity (GPP) than smaller patches under comparable conditions. This produces a robust superlinear scaling of total forest productivity with patch size. On average, a hectare embedded within a 100,000 km² forest is approximately 38% more productive than an isolated hectare in similar environments, and this size-related boost accounts for nearly one-quarter of total annual forest productivity across CONUS. Extending the workflow globally revealed consistent relationships across major forest biomes and continents, indicating that the phenomenon extends beyond CONUS. These findings highlight that fragmentation can substantially reduce carbon uptake even without net forest-area loss, underscoring the need for forest policies that consider spatial configuration alongside total area.

How to cite: Zou, Y., Smith, G., Lauber, T., Wan, J., Ma, H., Gorelick, N., Zohner, C., and Crowther, T.: Larger Forest Patches Exhibit Greater Per-Area Productivity in the U.S. and Worldwide, EGU General Assembly 2026, Vienna, Austria, 3–8 May 2026, EGU26-5740, https://doi.org/10.5194/egusphere-egu26-5740, 2026.

EGU26-6069 | ECS | Orals | BG3.7

Simulating boreal carbon and energy fluxes in the La Romaine watershed with the CLASSIC land surface model 

Muhammad Farhan Ul Moazzam, Manuel Helbig, Juile Talbot, Michelle Garneau, and Alexandre Roy

Boreal forests play an important role in the global carbon (C) cycle, but carbon and energy fluxes are still poorly constrained because of complex disturbance histories and a limited number of observation stations throughout remote northern landscapes. The La Romaine watershed in Quebec has undergone extensive hydroelectric development, including dam construction and related land-cover changes. We aim to use a land surface model to quantify the impact of land cover changes from natural and anthropogenic disturbances on net ecosystem productivity (NEP), gross primary productivity (GPP), ecosystem respiration (ER), and latent heat flux. In the initial phase of this study, plant functional types (PFTs) were derived from ESA-CCI land-cover data and used to drive site-level simulations with the Canadian Land Surface Scheme Including Biogeochemical Cycles (CLASSIC) together with ERA5 reanalysis data.

The simulations produced daily time series of NEP, GPP, ER, and net latent heat flux, depicting typical boreal seasonality with strong summer season peaks and snow-dominated dormant seasons. GPP presents a pronounced rise in late spring, while high in mid-summer, but falloff in autumn, whereas ER trailed temperature closely, led to periods of reduced but non-zero C losses during the winter season. Moreover, NEP is characterized by comparatively short windows of net C uptake when photosynthesis surpasses respiration, with longer, milder spring and autumn transition periods and winters with near-neutral or net C loss, while latent heat flux varies with growing-season productivity and moisture availability, signifying a tight coupling between carbon uptake and evapotranspiration.​​

We show that satellite-derived PFTs with ERA5 reanalysis forcing enable process-based exploration of boreal C and energy dynamics in a remote hydropower complex, even in the absence of dense local measurements. Ongoing work will replace the ESA-CCI PFTs with high-resolution (Landsat 30m resolution), Romaine-specific LULC-derived PFTs and refine the forcing, paving the way to link simulated flux responses with the observation’s ones in the La Romaine watershed.​

How to cite: Moazzam, M. F. U., Helbig, M., Talbot, J., Garneau, M., and Roy, A.: Simulating boreal carbon and energy fluxes in the La Romaine watershed with the CLASSIC land surface model, EGU General Assembly 2026, Vienna, Austria, 3–8 May 2026, EGU26-6069, https://doi.org/10.5194/egusphere-egu26-6069, 2026.

The climatic impacts of land cover changes (LCCs) due to altered biophysical properties include local effects in LCC areas and nonlocal effects in both LCC and non-LCC areas resulting from atmospheric feedback. The biophysical impacts of LCC simulated by climate models typically represent only the total effects, i.e., the sum of local and nonlocal effects. The respective local and nonlocal effects have been disentangled from climate model simulations using several methods. However, a systematic intercomparison of these methods under a comparable modeling framework is still lacking, hindering the complete understanding of LCC’s biophysical effect on the methodological nature. This study employs a series of unified global deforestation experiments to assess the performance of existing methods in quantifying the local and nonlocal effects of LCC on land surface temperature. Results show that local effects derived by different methods exhibit overall consistent latitudinal and seasonal patterns compared to those in observational datasets, including the transition zone between warming and cooling across the Northern Hemisphere. The separated nonlocal effects, which dominate the total effects, can be reproduced with broad similarity across methods. Nevertheless, regional discrepancies exist, reflecting the different assumptions of each method. We further discuss and summarize the strengths and limitations of each approach and offer practical suggestions on their usage. This study provides methodological guidance for the quantitative assessment of biophysical climate effects of LCC across multi-scales for climate change research.

How to cite: zhao, Z. and li, Y.: Intercomparison of Methods for Disentangling Local and Nonlocal Biophysical Impacts of Land Cover Changes, EGU General Assembly 2026, Vienna, Austria, 3–8 May 2026, EGU26-6581, https://doi.org/10.5194/egusphere-egu26-6581, 2026.

EGU26-7202 | ECS | Posters on site | BG3.7

Water availability reverses edge effects on crop yields across the United States 

Gayoung Yang, Gabriel Smith, Thomas Crowther, Thomas Lauber, and Constantin Zohner

Ensuring food security under climate change is a critical challenge for humanity. Maximizing food security requires an understanding of the drivers of within-field crop yield variation. Edge effects are expected to play an important role in determining total farm yields, as agricultural edges differ in their microenvironmental conditions and ecological processes, impacting crop productivity. However, the magnitude and variation of such effects remains largely unclear. Here, we used the normalized difference vegetation index (NDVI) as a proxy of crop yields to estimate the edge effects on two major US crops (corn and soybeans). We found that crop yields tend to be higher near field edges in the eastern US, an effect that was entirely reversed in the western US. This spatial variation may be driven by environmental conditions, as moist conditions in the Eastern US support natural vegetation and pollinators that promote crop growth near field edges, while dry conditions in the western US make field edges harsher than the interiors. Based on these edge effects, we simulate that optimizing edge effects to maximize their benefits on productivity leads to an annual economic gain of nearly 900 million dollars for corn and 500 million dollars for soybeans. These findings highlight the importance of strategic field-boundary management to enhance yields and economic returns.

How to cite: Yang, G., Smith, G., Crowther, T., Lauber, T., and Zohner, C.: Water availability reverses edge effects on crop yields across the United States, EGU General Assembly 2026, Vienna, Austria, 3–8 May 2026, EGU26-7202, https://doi.org/10.5194/egusphere-egu26-7202, 2026.

China has pledged to achieve carbon neutrality by 2060, with forestation as one of the key mitigation strategies due to its capacity to absorb and store carbon. However, forests can also emit biogenic volatile organic compounds (BVOCs), potentially affecting the climate. Here, we used the Model of Emissions of Gases and Aerosols from Nature (MEGAN) combined with future forestation dataset for China to investigate the changes in BVOC emissions and the potential climatic effects. The forestation dataset is developed based on the policies and tree species suitability, including a maximal carbon stock scenario and a maximal suitability scenario. To estimate BVOC emissions more accurately, we modified MEGAN to incorporate species-specific emission factors. The simulated results under forestation scenarios maximizing either carbon stock or ecological suitability show that BVOC emissions in China will increase by 0.21 and 0.19 Tg/year under Shared Socioeconomic Pathway 1-2.6 (SSP1-2.6), respectively. Forestation contributes more than 30% of the total BVOC emission increase, although the magnitude varies across scenarios. Broadleaf tree species are the dominate BVOC emitters, which are prioritized in southeastern and southwestern China under the maximal biomass scenario, while are selected in northeastern China under the maximal suitability scenario. These differences thus lead to distinct spatial patterns of BVOC emission increases and the associated climatic effects. Using emission-based radiative forcing responses derived from CMIP6, it is found that the increase in BVOC emissions induced by forestation will result in an additional cooling effect, thereby enhancing the biogeochemical cooling of forestation, particularly under the maximal biomass scenario. These findings highlight the necessity of accounting for BVOC emissions when assessing the climate mitigation potential of forestation.

How to cite: Zhang, Y.: Enhanced BVOC emissions and the corresponding biogeochemical cooling effects controlled by future forestation scenarios in China, EGU General Assembly 2026, Vienna, Austria, 3–8 May 2026, EGU26-7853, https://doi.org/10.5194/egusphere-egu26-7853, 2026.

EGU26-8739 | ECS | Orals | BG3.7

Greenhouse gas dynamics and soil conditions in restored wet moorlands in an upland managed spruce forest landscape 

Isaac Okiti, Ralf C.M. Verdonschot, Odette González Macé, Jos de Bijl, Mihkel Pindus, Philippe Collas, and Kuno Kasak Kasak

Ecosystem restoration often aims to re-establish environmental conditions required by specific habitat types and improve key ecosystem functions, including greenhouse gas (GHG) regulation and biodiversity support. This study compares two sites in a managed spruce forest landscape on drained wet moorlands in the Ardennes uplands in Belgium. A recently restored area, where spruce stands were cleared, and rewetting was encouraged by blocking drainage ditches to promote the development of moorland habitat, and a longer-established wet moorland site restored over a decade earlier, where vegetation and ecosystem functions have reached a more stable state. The objective was to assess how the restoration stage influences GHG fluxes, associated soil conditions, and biodiversity. From September 2023, methane (CH4), carbon dioxide (CO2), and nitrous oxide (N2O) fluxes were measured bi-weekly using closed dark chambers with LI-7810 and LI-7820 trace gas analyzers (LI-COR Biosciences). From March 2025, transparent chambers were used during the growing season to quantify net ecosystem exchange (NEE). Sampling focused on five zones: three within the recently restored site (adjacent to a closed ditch, far from the ditch, and near a functional drainage ditch), one plot in the managed spruce forest, and one in a longer-established moorland site (Control). At each plot, we also measured soil pore water electrical conductivity, temperature, moisture content, bulk density, and concentrations of soil carbon (C%) and nitrogen (N%). Additionally, ground-dwelling carabid beetles were surveyed using pitfall traps to characterize local biodiversity. GHG measurements revealed large spatial differences among the sites. The Control showed the lowest CH4 fluxes, ranging from −3.62 to 0.47 nmol CH4 m-2 s-1, and ecosystem respiration (Reco) from 0.05 to 3.93 µmol CO2 m-2 s-1. In contrast, the recently restored areas showed greater variability, with CH4 fluxes from −0.68 to above 84.88 nmol CH4 m-2 s-1 and Reco from 0.01 to above 28.49 µmol CO2 m-2 s-1. Growing-season NEE indicated that all plots acted as net CO2 sinks, with the control site reaching peak uptake around −29 µmol CO2 m-2 s-1 and the restored plots showing weaker sinks. The control site also had the highest soil nutrient values (C% = 12.7, N% = 0.73) and the lowest bulk density, whereas the other sites showed lower and more variable C and N (C% = 3.7–10.5; N% = 0.21–0.61) and higher bulk density. N2O and other measured parameters also varied substantially across the sampling sites. In total, over 772 individuals from 22 carabid beetle species were captured, with differences in richness, density, and biomass among sites. These findings indicate that the restoration stage has a large impact on GHG dynamics, soil properties, and biodiversity. The longer-established control site represents a relatively stable semi-natural moorland with low CH4 and N2O fluxes, strong net CO2 uptake, higher soil C and N, and lower bulk density, while the recently restored areas are characterized by higher and more variable fluxes and denser soils. By comparing restoration stages, this study provides insight into ecosystem recovery and can inform strategies to enhance ecosystem functioning, biodiversity, and climate mitigation.

How to cite: Okiti, I., Verdonschot, R. C. M., González Macé, O., de Bijl, J., Pindus, M., Collas, P., and Kasak, K. K.: Greenhouse gas dynamics and soil conditions in restored wet moorlands in an upland managed spruce forest landscape, EGU General Assembly 2026, Vienna, Austria, 3–8 May 2026, EGU26-8739, https://doi.org/10.5194/egusphere-egu26-8739, 2026.

EGU26-9895 | ECS | Posters on site | BG3.7

Biophysical climate responses to albedo management for wheat residue retention, cover crops, and pale wheat across European croplands 

Ke Yu, Yang Su, Ronny Lauerwald, Philippe Ciais, Jan Peter Lesschen, Ana Bastos, Dominic Schierbaum, Xianglin Zhang, Bo Yi, Liyang Liu, Lei Zhu, Tiphaine Vidal, and Daniel Goll

Agricultural management offers a pathway for climate change mitigation beyond greenhouse gas fluxes through biophysical processes that directly modify land-atmosphere energy exchange. Changes in cropland surface albedo influence the climate that operates independently of the biogeochemical impact. The need to account for both biogeochemical and biophysical processes in agriculture is increasingly recognized in assessments of climate-neutral agriculture, but the biophysical impacts remain largely unconstrained.

In this study, we quantified the albedo-mediated climate impacts of three promising agricultural practices, which include cover crop, residue management, and selection of highly reflective crop varieties (pale wheat) over European croplands under present and future climate conditions. To do so, we employed the ORCHIDEE-CROP land surface model, which incorporates a detailed representation of crop growth and management, together with improved albedo dynamics calibrated using observations from nine European cropland sites and satellite-derived leaf area index (LAI) from the Copernicus Land Monitoring Service.

In idealized simulations assuming EU-wide implementation of solutions, we show that scenarios of cover crop, residue retention and pale-wheat cultivation increase annual mean surface albedo by 0.001±0.001, 0.008±0.003 and 0.021±0.004, with pale wheat generating the largest enhancement. All three practices induce modest local surface cooling (-0.11±0.07°C, -0.25±0.13°C and -0.13±0.03°C), with stronger cooling in southern Europe than in northern regions. Residue retention produces the strongest cooling response due to pronounced albedo contrasts during high-radiation summer months, and this biophysical signal persists and strengthens under future climate conditions. Although the albedo-mediated mitigation benefits of cover crops and residue retention are relatively small compared to their biogeochemical impacts on greenhouse gas emissions, these practices are readily deployable and are increasingly adopted for agronomic purposes, particularly in comparison with pale wheat cultivation. Beyond mitigation, albedo management offers adaptation benefits by reducing absorbed shortwave radiation and surface temperatures, thereby alleviating heat stress during critical crop growth stages and enhancing yield stability. Overall, agricultural albedo management emerges as a scalable strategy for climate mitigation and local adaptation across European croplands.

How to cite: Yu, K., Su, Y., Lauerwald, R., Ciais, P., Lesschen, J. P., Bastos, A., Schierbaum, D., Zhang, X., Yi, B., Liu, L., Zhu, L., Vidal, T., and Goll, D.: Biophysical climate responses to albedo management for wheat residue retention, cover crops, and pale wheat across European croplands, EGU General Assembly 2026, Vienna, Austria, 3–8 May 2026, EGU26-9895, https://doi.org/10.5194/egusphere-egu26-9895, 2026.

EGU26-10050 | Orals | BG3.7

Differences and uncertainties in land-use CO2 flux estimates, and how to overcome them 

Clemens Schwingshackl, Wolfgang Obermeier, Thomas Gasser, Zhangcai Qin, Aparnna Ravi Panangattuparambil, Holger Metzler, and Julia Pongratz

Accurate estimates of land-use change CO2 fluxes (FLUC) are essential for understanding the terrestrial carbon cycle and for informing national and global climate reporting. FLUC can be quantified using a range of approaches, including bookkeeping models, dynamic global vegetation models (DGVMs), national greenhouse gas inventories, Earth observation-based products, and atmospheric inversions. However, systematic comparison of FLUC estimates across approaches remains challenging due to fundamental methodological differences. Additionally, individual approaches are often associated with substantial uncertainties.

Here, we provide an overview of the main sources of uncertainty and methodological discrepancies across approaches, while highlighting recent advances and identifying promising directions to further harmonize and improve FLUC estimates. Key sources of uncertainty and inconsistency include differing objectives and definitions across approaches, differences in the separation of natural and anthropogenic drivers (leading to FLUC differences of up to 2.8 PgC yr-1), incomplete process representation (contributing up to 30% uncertainty in FLUC), uncertainties in land-use data (up to 30% uncertainty), and constraints related to spatial resolution. At the same time, several important methodological improvements have been achieved recently, including the consideration of environmental changes in bookkeeping-based FLUC estimates and the correction for replaced sinks and sources (RSS) in DGVM-based FLUC estimates. Ongoing research projects are addressing several remaining challenges, including the improvement of regrowth estimates, the quantification of disturbance impacts, and the consolidation and harmonization of different land-use datasets. These developments build primarily on combining high-resolution Earth observation-based databases with the flexibility and traceability of semi-empirical modelling. Together, these advances provide an important contribution towards more consistent and robust estimates of land-use change CO2 fluxes within and across approaches.

How to cite: Schwingshackl, C., Obermeier, W., Gasser, T., Qin, Z., Ravi Panangattuparambil, A., Metzler, H., and Pongratz, J.: Differences and uncertainties in land-use CO2 flux estimates, and how to overcome them, EGU General Assembly 2026, Vienna, Austria, 3–8 May 2026, EGU26-10050, https://doi.org/10.5194/egusphere-egu26-10050, 2026.

EGU26-10231 | Posters on site | BG3.7

Quantifying tropical tree cover loss driven by cropland conversion 

Xiao-Peng Song

Cropland conversion is a significant driver of tropical tree cover loss. Recent research has mapped tree cover loss as well as cropland expansion in separate themes using satellite data, but the amount of tree cover loss driven by cropland expansion and the spatiotemporal dynamics are less well understood. The objective of this research is to conduct mapping and quantitative assessments of tree cover to cropland conversion using a combination of satellite-derived land cover change products and design-based inference. We combined the University of Maryland global tree cover loss and global cropland gain maps, both at 30 m resolution, to generate tree cover-to-cropland conversion over five epochs between 2004 and 2023. We employed this new set of maps to aid selection of a stratified random sample for area estimation. We used high-resolution images in Google Earth and time series of Landsat images to interpret the land cover and land use change for each sample unit. This sample allowed us to estimate the area of tree cover-to-cropland conversion over the five epochs and subsequently the temporal trends. Our results suggested that tropical tree cover-to-cropland conversion reached a total of 23.1 ± 2.1 Mha between 2004 and 2023. These results are important for understanding the socioeconomic drivers of deforestation in the tropics.  

How to cite: Song, X.-P.: Quantifying tropical tree cover loss driven by cropland conversion, EGU General Assembly 2026, Vienna, Austria, 3–8 May 2026, EGU26-10231, https://doi.org/10.5194/egusphere-egu26-10231, 2026.

Managed forest regions are increasingly exposed to disturbance regimes that generate cascading impacts beyond directly affected areas. In Austria, disturbance events trigger salvage logging that can disrupt regular harvesting and spill over across space through operational and institutional factors, yet such cross-district dynamics are rarely quantified as a systemic resilience problem. Here we assess systemic resilience in Austria’s district-level forestry system by measuring how regular harvesting responds to salvage “shocks” within affected districts and their spatial neighbors.

Using annual harvest reports for Austrian forest districts from 2000–2024, we use the amount of salvage timber as a measure of disturbance severity. We label years with unusually high salvage volumes as “hotspot” years, based on percentile thresholds. We then compare how regular harvesting deviates from its baseline in (i) hotspot districts and (ii) neighboring districts that share a border, capturing indirect and cascading effects beyond the directly affected area. To examine institutional heterogeneity, we analyze responses by forest ownership type (small private, large private, and public forests) and track trajectories in the years following hotspot events.

We find strong disruptions in regular harvesting in hotspot districts, together with clear spillover responses in neighboring districts. Recovery after hotspot events differs systematically across ownership types. We interpret changes in regular harvesting as an indicator of systemic resilience, capturing (i) resistance (how strongly harvesting is disrupted), (ii) recovery (how quickly harvesting returns toward baseline), and (iii) spillovers (how impacts extend to neighboring districts). These results show that disturbance impacts and recovery in forestry are spatially connected and institution-dependent, suggesting that post-disturbance planning should consider effects beyond the directly affected districts.

How to cite: Golestani, N. and Rauch, P.: Cascading impacts of forest disturbances: spatial spillovers in regular harvesting across Austrian forest districts (2000–2024), EGU General Assembly 2026, Vienna, Austria, 3–8 May 2026, EGU26-10521, https://doi.org/10.5194/egusphere-egu26-10521, 2026.

EGU26-10925 | ECS | Posters on site | BG3.7

Declining rice methane emissions in China due to decreased and displaced rice cropping 

Chang fan, Geli Zhang, Zizhang Zhao, Jinyang Wang, Ruoqi Liu, Minghao Zhuang, Shushi Peng, and Xiangming Xiao

The renewed surge in atmospheric methane (CH₄) growth since 2020 has necessitated a critical re-examination of anthropogenic sources. Rice cultivation plays a pivotal role in global food security but is also a substantial source of anthropogenic methane (~8–10%). However, quantifying its contribution to the recent surge in atmospheric methane remains uncertain due to the spatiotemporal heterogeneity of methanogenesis and inconsistencies in official agricultural statistics.

Here, by integrating a continuous remote sensing-based dataset of China’s rice agricultural systems with refined pixel-based emission factors that account for localized cropping intensity, we reveal that rice methane emissions declined from 9.41 Tg yr-1 in 2000 to 3.61 Tg yr-1 in 2022, a reduction of 61.6% in China. This steep downward trend (0.36 Tg CH₄ yr-1) stands in stark contrast to the flat or slightly increasing trends reported by previous statistical inventories. We demonstrate that this trend is dominated by a "north-south offset", where emission reductions from shrinking southern double rice systems outweigh the increases from expanding northern single rice systems.

These findings highlight that rice emission inventories relying on statistical data likely overestimate methane emission of rice agricultural systems by overlooking shifts in rice cropping pattern. Crucially, our refined 1-km resolution spatially explicit map of rice methane emissions offers a robust prior to constrain top-down satellite inversions. This framework also provides a transferable pathway for other main rice-growing countries to refine their estimation methods and better understanding of emission responses to structural changes in agricultural systems.

How to cite: fan, C., Zhang, G., Zhao, Z., Wang, J., Liu, R., Zhuang, M., Peng, S., and Xiao, X.: Declining rice methane emissions in China due to decreased and displaced rice cropping, EGU General Assembly 2026, Vienna, Austria, 3–8 May 2026, EGU26-10925, https://doi.org/10.5194/egusphere-egu26-10925, 2026.

EGU26-11526 | ECS | Orals | BG3.7

Exploring the minimum light availability to support plant biomass and soil life in solar parks 

Luuk Scholten, Ron G.M. de Goede, Anna Edlinger, Bas. B. Van Aken, Kay Cesar, and Gerlinde B. De Deyn

Solar parks are a rapidly expanding form of land use, primarily aimed at producing renewable energy. However, the aim is to make them multifunctional, and limit negative impacts on soils and biodiversity which requires light availability for plant growth. Previous research has shown a significant decline in plant biomass and soil biota beneath solar panels across different solar parks in the Netherlands that have a dense packing of relatively large, relatively flat solar panel arrays. The ground irradiance under these solar panel arrays is well below 10% of the open field irradiance, and the ecological decline was related to very low light availability beneath the panels. However, plant growth, soil biota and soil organic carbon may still be well-supported at intermediate levels of light availability and by favourable microclimatic conditions. In this research an experimental solar park was constructed with varying solar panel density to test the effect of a light gradient on the vegetation, CO2-fluxes, and on soil biota. The experiment consisted of 6 different light treatments (8%, 20%, 30%, 40%, 65% and 100% of annual open field irradiance) and 3 vegetation treatments (non-sowing, sowing of shade tolerant plant species and sowing of a “standard” species diverse grassland mixture). Plant biomass and species composition, nematode and earthworm abundance and net ecosystem exchange (NEE) were measured. Plant biomass, and the abundance of earthworms and nematodes all significantly increased with increasing levels of light, with the strongest increases between 8% and 20% light. At low light levels, shade tolerant plant species’ biomass was higher compared to the other vegetation treatments. These results show with a relatively small increase in light availability can lead to large benefits to soil health and biodiversity.

How to cite: Scholten, L., de Goede, R. G. M., Edlinger, A., Van Aken, Bas. B., Cesar, K., and De Deyn, G. B.: Exploring the minimum light availability to support plant biomass and soil life in solar parks, EGU General Assembly 2026, Vienna, Austria, 3–8 May 2026, EGU26-11526, https://doi.org/10.5194/egusphere-egu26-11526, 2026.

EGU26-11721 | ECS | Orals | BG3.7

Beyond carbon: Does afforestation/reforestation mitigate or trigger future climate extremes? 

Katharina Raberg, Julia Pongratz, and Yiannis Moustakis

The large-scale deployment of carbon dioxide removal (CDR) methods will be required to achieve the climate targets set in the Paris Agreement, with afforestation/reforestation (AR) currently being the most widely implemented one. While AR is recognized for its carbon sequestration potential, its biogeophysical effects remain insufficiently understood. This is particularly the case for climate extremes, since their quantification and robust statistical inference against internal variability require large simulation ensembles, which are typically lacking in modelling studies. Climate extremes such as heatwaves, floods and droughts have far-reaching consequences for ecosystems and human society, and understanding whether large-scale AR could unintentionally intensify climate extremes, or may support mitigation efforts by dampening them, is thus critical for assessing its viability as a mitigation measure. To investigate that, it is crucial to disentangle how the biogeophysically-induced effects on climate extremes are affected by the associated AR-induced global cooling and whether such effects differ across various emissions pathways.

Here, using an unprecedented multi-member ensemble of emission- and concentration-driven simulations with a fully coupled Earth System Model (MPI-ESM), we investigate the influence of large-scale AR on precipitation and heat extremes across different scenarios (SSP1-2.6, SSP5-3.4os, SSP3-7.0, SSP5-8.5). The AR scenario used includes an ambitious deployment in the range of country pledges, reaching 935 Mha by 2100 globally. Our setup featuring 120 simulations in total enables a robust quantification of changes in climatic extremes due to AR across spatial and temporal scales and their uncertainty boundaries. We assess the responses of eight climate extreme indicators for 2091-2100.

Our results reveal spatially heterogeneous but overall dampening effects of AR on end-of-century heat extreme indicators. On average, annual maximum temperature decreases by 0.24 °C [0.17 °C, 0.19 °C, 0.17 °C] under SSP5-3.4os [SSP1-2.6, SSP3-7.0, SSP5-8.5]. The number of extreme heat days decreases by 15.1 % [11.3 %, 7.4 %, 4.6 %], annual maximum wet-bulb temperature by 0.10 °C [0.07 °C, 0.08 °C, 0.07 °C] and warm spell duration by 20.3 % [13.0 %, 11.7 %, 7.6 %], respectively. Any biogeophysical warming visible in concentration-driven simulations seems to be largely offset by AR-induced cooling in emission-driven ones, although regional exceptions exist. While the emission scenarios influence the magnitude of differences, they do not alter the overall signal. The dampening of heat extremes is especially evident in major population exposure hotspots, such as Central Africa and Eastern Asia, suggesting that AR can provide co-benefits for mitigating heat-related risks.

AR effects on precipitation extremes are less consistent and exhibit strong regional and scenario-specific variability, with most changes being within the boundaries of internal variability. AR-induced intensification in some regions (e.g. in the tropics) balances out reduction elsewhere, showing a mixed global signal. Within re/afforested regions, precipitation extremes tend to be less intense in high-emission scenarios (SSP3-7.0 and SSP5-8.5). 

Overall, our study offers a robust, policy-relevant assessment of the impacts of large-scale AR on future climate extremes. Our results suggest that large-scale AR application not only contributes to climate change mitigation but also offers adaptation benefits, particularly by reducing heat extremes, offsetting any biogeophysically-induced warming.

How to cite: Raberg, K., Pongratz, J., and Moustakis, Y.: Beyond carbon: Does afforestation/reforestation mitigate or trigger future climate extremes?, EGU General Assembly 2026, Vienna, Austria, 3–8 May 2026, EGU26-11721, https://doi.org/10.5194/egusphere-egu26-11721, 2026.

EGU26-12652 | ECS | Orals | BG3.7

Mixed Land Cover Maximizes Surface Cooling in India: An ICON Model Energy-Balance Attribution Study 

Jyoti Sharma, Pankaj Kumar, and Alexander J. Winkler

India is experiencing rapid land-use transitions through cropland expansion and afforestation, which modify surface properties such as albedo and evapotranspiration and, in turn, influence land surface temperature. What remains unclear, however, is how much of the resulting temperature change is driven by individual surface energy balance components, and whether cropland expansion and afforestation produce symmetric or distinct biogeophysical responses, a question we address using idealised ICON model experiments. Therefore, we conduct three land-cover change experiments using the ICON Earth system model and follow the AMIP protocol: (i) a control simulation mirroring the historical land cover change until present-day (CTRL), (ii) a forest-to-cropland experiment (F2C) where all tropical deciduous forests are replaced by cropland, and (iii) a cropland-to-forest experiment (C2F) in which all croplands are replaced by tropical deciduous forest. All simulations are global and span the period 1850-2014 (165 years).

Preliminary results show that, relative to the CTRL simulation, the F2C experiment exhibits a long-term mean surface warming of 0.26°C, while the C2F simulation shows a weaker warming of 0.05 °C over India. Surface energy balance decomposition, which quantifies the contributions of individual radiative and turbulent flux components (shortwave radiation, longwave radiation, latent heat flux, sensible heat flux, ground heat flux, and albedo) to surface temperature change, indicates that the F2C simulation leads to surface warming relative to CTRL (+0.26 °C in the model, compared to +0.55 °C inferred from energy balance attribution). This difference between the attributed and model-simulated warming arises because the attribution estimate sums individual flux-driven contributions, whereas the model-diagnosed temperature additionally reflects nonlinear feedbacks and heat storage effects. Warming is primarily due to increased net longwave radiation (+0.46 °C), decreased latent heat flux (+0.23 °C) and enhanced sensible heat flux (+0.21 °C), partially offset by albedo-driven cooling (-0.36 °C). In contrast, C2F produces weaker warming relative to CTRL (+0.05 °C in the model; +0.07 °C from attribution), dominated by reduced surface albedo (+0.70 °C) and increased net shortwave absorption (+0.06 °C), despite enhanced latent heat flux. C2F exhibits the highest latent heat flux (55.87 W m-2) and lowest downward longwave radiation (61.92 W m-2), favouring cooling, but this is counteracted by low albedo (0.17), high net shortwave radiation (167.87 W m-2), and elevated sensible heat flux (47.30 W m-2). Trend analysis further indicates that C2F warms slightly faster (0.0062 °C yr-1) than CTRL (0.0059 °C yr-1) and F2C (0.0055 °C yr-1), mainly due to a persistently decreasing albedo. Overall, our results show that neither complete afforestation nor extensive cropification maximizes surface cooling over India. Instead, a mixed land-cover configuration optimizes competing biogeophysical processes that regulate surface temperature, highlighting the importance of explicitly accounting for surface energy balance mechanisms in land-use planning.

How to cite: Sharma, J., Kumar, P., and J. Winkler, A.: Mixed Land Cover Maximizes Surface Cooling in India: An ICON Model Energy-Balance Attribution Study, EGU General Assembly 2026, Vienna, Austria, 3–8 May 2026, EGU26-12652, https://doi.org/10.5194/egusphere-egu26-12652, 2026.

EGU26-14277 | Orals | BG3.7

Commodity-driven deforestation doubles local warming from tropical forest loss 

Callum Smith, Jessica C. A. Baker, Nike H. Doggart, Arthur P. K. Argles, Eddy Robertson, Robin Chadwick, Marcos Adami, Caio A. S. Coelho, and Dominick V. Spracklen

Tropical deforestation causes substantial changes to local climate, including strong daytime warming at the land surface. While deforestation is driven by a wide range of factors such as commodity production, shifting agriculture, and forestry, it remains unclear whether the local climate impacts of forest loss vary across these drivers. Using remotely sensed atmospheric and land-surface datasets, we examined whether the local warming due to tropical forest loss from 2001 to 2019 differed by deforestation driver. We find that forest loss consistently induced local daytime warming across the tropics that exceeds regional climate change over the same period, with 0.6 °C of warming in the Amazon, 0.47 °C in South-East Asia, and 0.18 °C in the Congo. In the Amazon, commodity-driven deforestation caused 0.66 °C of warming, more than double that from shifting agriculture (0.31 °C). Across the tropics, commodity-driven forest loss produced 0.02 °C warming per percentage point of forest loss, compared to 0.01 °C for shifting agriculture. This contrast reflects the biophysical differences between commodity-driven deforestation, typified by large scale, intensive conversion of forest to crops and pasture and shifting agriculture which often involves small-scale land clearance, land abandonment and vegetation regrowth. In the Congo where the predominant driver is shifting agriculture, smaller canopy reductions and vegetation recovery explain the weaker warming response. However, a projected shift toward commodity-driven deforestation, leading to larger reductions in leaf area index and greater increases in surface albedo, could substantially increase local warming. Expansion of commodity agriculture across the tropics will amplify local climate impacts, with serious consequences for communities in forest regions. Our findings highlight the need for climate, agriculture, and land-use policies that account for deforestation drivers. Preserving a mosaic of forest cover within agricultural landscapes can deliver significant local climate benefits and help safeguard livelihoods in tropical regions.

How to cite: Smith, C., Baker, J. C. A., Doggart, N. H., Argles, A. P. K., Robertson, E., Chadwick, R., Adami, M., Coelho, C. A. S., and Spracklen, D. V.: Commodity-driven deforestation doubles local warming from tropical forest loss, EGU General Assembly 2026, Vienna, Austria, 3–8 May 2026, EGU26-14277, https://doi.org/10.5194/egusphere-egu26-14277, 2026.

EGU26-14326 | ECS | Orals | BG3.7

A New Plant Functional Type Dataset for Earth System Modeling: Integrating ESA-CCI MRLC, LUH3, and C3/C4 Partitioning for CMIP7 

Luis Enrique Olivera Guerra, Vladislav Bastrikov, Céline Lamarche, Catherine Ottlé, and Philippe Peylin

Accurate representation of land use and land cover change (LULCC) is critical for simulating land–atmosphere interactions and biogeochemical feedbacks in Earth system models. Here we present a new, spatially and temporally consistent global Plant Functional Type (PFT) dataset designed for land surface and Earth system modeling, with direct applicability to CMIP7 model simulations. The dataset integrates high-resolution satellite-based land cover information with the latest Land-Use Harmonization dataset ( LUH3, updated from LUH2 – Hurtt et al., 2020), while improving the representation of grassland and cropland functional diversity through explicit C3/C4 partitioning. 

The historical PFT baseline is derived from the ESA Climate Change Initiative multi-resolution land cover (ESA-CCI MRLC) product for 1992–2022. Annual maps of fractional PFT composition are generated at 300 m resolution using a hierarchical framework that combines satellite observations, auxiliary datasets (tree cover, canopy height, surface water, urban extent), and bioclimatic constraints (Harper et al., 2023). Fourteen generic PFTs are represented, capturing sub-grid heterogeneity relevant for land surface and dynamic vegetation models. These maps are aggregated to coarser resolutions (≥0.1°) to support Land Surface Model (LSM) simulations.

To improve functional realism, natural grasslands are partitioned into C3 and C4 types using a synthesis of optimality-based estimates of potential C4 grass distribution (Luo et al., 2024), satellite-derived herbaceous cover, and complementary global datasets. Croplands are further refined using LUH3 to distinguish managed grasslands and crop types. LUH3 historical land-use states and transitions (850–2024) are merged with the satellite-based PFT baseline, allowing land-use changes such as deforestation, crop expansion, shifting cultivation, and wood harvest to be prescribed consistently through time.

The resulting harmonized PFT–land-use dataset provides a robust forcing for transient Earth system simulations from the pre-industrial period to the present. It improves the representation of LULCC processes, grassland physiology, and human land management, and is fully compatible with LSMs such as ORCHIDEE and CMIP7 requirements. This product enables more consistent assessments of land-based climate feedbacks and anthropogenic impacts on the Earth system.

How to cite: Olivera Guerra, L. E., Bastrikov, V., Lamarche, C., Ottlé, C., and Peylin, P.: A New Plant Functional Type Dataset for Earth System Modeling: Integrating ESA-CCI MRLC, LUH3, and C3/C4 Partitioning for CMIP7, EGU General Assembly 2026, Vienna, Austria, 3–8 May 2026, EGU26-14326, https://doi.org/10.5194/egusphere-egu26-14326, 2026.

EGU26-14648 | Orals | BG3.7

Linking LULCC (SSP1-SSP5) scenarios to forest regeneration via wolf-deer-browsing dynamics in boreal forest 

Sinchan Ghosh, Oskar Franklin, and Barbara Zimmermann
Forestry, agriculture, and urbanisation are adding further pressure to the ongoing climate-driven regime shift in boreal forest cover from dense to open state in Scandinavia. Such a change risks deer and their predator wolf populations in the boreal habitat. Changes in deer population and their natural predator wolves redistribute browsing pressure, thereby modulating forest regeneration trajectories that provides feed back to forest cover. We developed a hybrid empirical-process-based modelling framework that unites scenario-driven Land Use Land Cover (LULC) change with grey wolf (Canis lupus), moose, and roe deer density dynamics. The framework couples: (i) LUCAS LUC v1.2 land-cover fractions and scenario projections (SSP1-1.9 to SSP5-8.5), (ii)  snow depth (ERA5 for historical conditions; CMIP6-based projections for future periods), (iii) roe deer and moose calves harvest data and future projection based on vegetation cover using Random Forest models, and (iv) wolf pack-territory size density and distribution data on a 50 × 50 km grid across Scandinavia from SKANDULV for training (1999-2015), and model performance validation (2016-2024). We quantified “regimes” as statistically distinct 6-year states of the coupled system based on the temporal resolution of LULCC predictors. We designed our model outputs as an interactive map to be simultaneously management-relevant and scientifically informative for 3 variables: (a) number of wolf territories per grid cell, (b) mean territory size, and (c) wolf density. Regime shift in these variables implies decreased spatial coverage of predation risk and altered spatial concentration of moose and roe deer, therefore, redistributed browsing pressure in our interactive map. These browsing-pressure changes provide a mechanistic bridge to Earth-system relevance by shaping forest structure via regeneration. Across the study period, we identified seven unique regimes. Scenario evaluation indicated SSP5-8.5 (SSP585) best matched observed patterns during 2016-2024 for wolves and prey. Under SSP585-driven LULCC, moose-calf harvest projection shows 2-3% increment in the north, which supports a northward increase in suitable habitat area by mid-century, and a subsequent 7.6%  increase in wolf territory number in the north. Urban/crop expansion and linear features increment expands mean territory size 3-5% expansion in southern territories, while causing >3% decline in territory number in the south. The projected northward redistribution corresponds to an approximate additional 7.6% area of potential wolf-mediated deer regulation that could reduce browsing pressure on regenerating forests. Our result implies a spatial shift in zones where wolf-mediated deer regulation, and consequent browsing damage control, may reinforce or counteract land-based carbon and restoration strategies. Our scenario-based interactive maps are a decision-support tool and enable adaptive land management (zoning, hunting quotas, and conflict mitigation) and integrate biodiversity-mediated regulation into LULCC planning, explicitly addressing co-benefits and compromises between climate-focused land strategies and wildlife-human coexistence.
 

How to cite: Ghosh, S., Franklin, O., and Zimmermann, B.: Linking LULCC (SSP1-SSP5) scenarios to forest regeneration via wolf-deer-browsing dynamics in boreal forest, EGU General Assembly 2026, Vienna, Austria, 3–8 May 2026, EGU26-14648, https://doi.org/10.5194/egusphere-egu26-14648, 2026.

EGU26-14746 | ECS | Orals | BG3.7

Cloud Responses to Deforestation Vary Across the Diurnal Cycle 

Gabrielle Leung and Susan van den Heever

Among the most uncertain aspects of how land cover change impacts the Earth system is its effect on cloud formation. These cloud changes are important for both the hydrological cycle through shifts in precipitation, as well as the planetary energy balance through their radiative effects. However, quantifying land surface impacts on clouds remains a challenge, since the outcome depends on numerous convective and mesoscale processes that are not well-resolved in large-scale models. In this work, we focus on deforestation in Southeast Asia as a case study of extensive land cover changes in a complex convective environment. Using a combination of high-resolution atmospheric models and object-based analysis, we demonstrate that the cloud response to deforestation is not uniform and varies strongly across the diurnal cycle and with spatial scale.

We use the Regional Atmospheric Modeling System (RAMS) to conduct a pair of multi-day large eddy simulations (LES; Δx=150m) of shallow-to-deep convection over the island of Borneo. By using identical atmospheric boundary conditions but differing land surface properties, we explore the changes in convective initiation and development that occur due to realistic patterns of tropical deforestation. We use tobac (tracking and object-based analysis of clouds) to quantify shifts in the cloud population and find contrasting responses between various modes of tropical convection. Localized deforestation-driven changes to boundary layer processes result in widespread reductions in shallow cloud cover and suppression of the transition from shallow to deep convection. However, shallow cumuli which do form start raining earlier in the day, resulting in more widespread light rain throughout the afternoon. Furthermore, we also find localized increases in cloudiness along the boundary between forested and deforested areas due to surface heating-induced mesoscale circulations.

Our results demonstrate that land-atmosphere interactions and their implications for convection, hydrology, and radiation can vary greatly throughout the day, depending on prevailing cloud type and their interactions with mesoscale phenomena. We propose that this diurnal variability must be considered to more accurately capture the full impact of deforestation and other land cover changes on clouds, rainfall, and climate.

How to cite: Leung, G. and van den Heever, S.: Cloud Responses to Deforestation Vary Across the Diurnal Cycle, EGU General Assembly 2026, Vienna, Austria, 3–8 May 2026, EGU26-14746, https://doi.org/10.5194/egusphere-egu26-14746, 2026.

Reliable, transferable, and locally relevant land-cover information is critical for informed decision-making and ecosystem services assessment. However, this kind of information remains limited in data-scarce, topographically complex regions such as the Andes, constraining the analysis of ecosystem dynamics and climate impacts. Project GRADIENTES addresses this gap through the development of a regional Earth Observation (EO) Foundation Model trained on multi-sensor Sentinel-1 SAR and Sentinel-2 optical data across ecologically diverse watersheds of the Peruvian Andes.

The Foundation Model is trained using self-supervised contrastive learning on seasonally aggregated, multisensor image composites, enabling the learning of task-agnostic surface representations without reliance on dense manual labels. The frozen encoder is subsequently reused to support downstream applications through lightweight supervised models, including land-cover classification and change analysis. Land-cover classes are co-designed with local and regional stakeholders, through the establishment of Living Labs, to ensure operational and ecological relevance.

Downstream land-cover products derived from the Foundation Model achieved overall accuracies exceeding 0.9, comparable to region-specific handcrafted models while requiring substantially fewer training samples. The learned representations further enable the analysis of land-cover transitions and vegetation stress patterns relevant for ecosystem service assessment, especially when combined with gridded precipitation and temperature products developed within GRADIENTES.

This work demonstrates that regional EO Foundation Models can provide a scalable and reusable representation of surface processes in data-challenged mountainous environments. The approach supports integrated analyses of land dynamics, hydro-climatic variability, and ecosystem stress, and establishes a transferable framework for climate-impact and tipping-point research across the Andes and other topographically complex regions.

How to cite: Mantas, V. and Caro, C.: Towards scalable monitoring of mountain ecosystems: assessing land use and land cover transitions and ecosystem services from a new EO Foundation Model, EGU General Assembly 2026, Vienna, Austria, 3–8 May 2026, EGU26-14877, https://doi.org/10.5194/egusphere-egu26-14877, 2026.

EGU26-15682 | Orals | BG3.7

Next-Generation Harmonized Land-Use Forcing Datasets for Global Carbon and Climate Models 

Louise Chini, George Hurtt, Lei Ma, Janna Chapman, Kees Klein Goldewijk, Thais Rosan, Ida Bagus Mandhara Brasika, Stephen Sitch, Julia Pongratz, David Lawrence, Peter Lawrence, and Pierre Friedlingstein

Land-use change is an essential forcing dataset for climate and carbon cycle models, prescribing both the biogeophysical boundary conditions of the land surface as well as the land-based carbon sinks and sources. These datasets are built upon model requirements of a consistent set of variables and formats throughout the historical period as well as into future scenarios. Over the past two decades, both the ability of carbon and climate models to simulate land-use change, and the land-use datasets themselves, have advanced from relatively simple representations of 4 land-use types and their related transitions, to datasets that represent 13 land-use types, their transitions, as well as multiple data layers describing the detailed management of those land-use types. The Land-Use Harmonization (LUH) dataset has been used in both CMIP5 and CMIP6 experiments, as well as over 10 Global Carbon Budgets (GCBs), ISIMIP, IPBES, and will be used again in CMIP7 with several new features and new future scenarios, all provided at a resolution of 0.25 degrees for the years 850-2100 and beyond. In this presentation we will provide an overview of this data product, including recent updates to the historical dataset developed for GCB and comparisons with previous versions. We will present details of the 7 new harmonized future land-use scenarios developed for ScenarioMIP, including new variables used to model land-based Carbon Dioxide Removal (CDR) technologies such as BECCS and Re/Afforestation. Finally we will discuss our plans for new land-use datasets within the “Combining LAnd-use, modeling and Remote-sensing to Transform carbon budgets” (CLARiTy) project, which seeks to reduce the persistently high uncertainties in land carbon flux estimates and will include the development of new LUH products built upon high resolution remote sensing data to inform historical forest disturbances and areas of forest plantations.

How to cite: Chini, L., Hurtt, G., Ma, L., Chapman, J., Klein Goldewijk, K., Rosan, T., Brasika, I. B. M., Sitch, S., Pongratz, J., Lawrence, D., Lawrence, P., and Friedlingstein, P.: Next-Generation Harmonized Land-Use Forcing Datasets for Global Carbon and Climate Models, EGU General Assembly 2026, Vienna, Austria, 3–8 May 2026, EGU26-15682, https://doi.org/10.5194/egusphere-egu26-15682, 2026.

Forestation has gained prominence as a nature-based climate solution considering international commitments to limit global warming to well-below 2°C above pre-industrial levels. In addition to sequestering carbon dioxide from the atmosphere, forestation affects energy and water fluxes between the land surface and atmosphere, ultimately impacting the hydrologic cycle. Using a multi-model ensemble of Earth system model simulations for scenarios from the sixth phase of the Coupled Model Intercomparison Project wherein all forcings except land use change are identical, we examine forestation impacts on surface energy and water balance across five climatically diverse study regions. Surface and cloud albedo, turbulent heat fluxes, and longwave radiation fluxes are altered with implications for surface temperature where tree cover increase is ≥ 10% of grid cell area. Surface temperature decreases in the tropics and subtropics while slight warming occurs in the highest latitude study region, consistent with previous studies. Evapotranspiration (ET) and precipitation (P) increase in all study regions. P partitioned into ET increases and available water (P-ET) decreases in most study regions. Decreased runoff (R) often follows P-ET decrease and runoff ratio (R/P) decreases in all study regions, whereas subsurface soil moisture decreases in some, all with implications for water management. Shifting transpiration-to-evapotranspiration ratio plays a role in these anomalies. Our findings highlight the need to consider hydrologic cycle impacts when implementing forestation as a climate solution. 

How to cite: Leclerc, C. and Zickfeld, K.: Quantifying the Surface Energy and Water Balance Impacts of Forestation Using an Earth System Multi-Model Ensemble, EGU General Assembly 2026, Vienna, Austria, 3–8 May 2026, EGU26-16075, https://doi.org/10.5194/egusphere-egu26-16075, 2026.

EGU26-16111 | ECS | Posters on site | BG3.7

Impact of Land Use–Land Cover Changes on Urban Heat Island Dynamics in a Rapidly Growing Mid-Sized Indian City 

Gokul Gobind Bag and anv Satyanarayana

Rapid urbanization has induced substantial changes in land use and land cover (LULC), leading to pronounced modifications in the thermal characteristics of urban environments and, consequently, local climatic conditions. Although the impacts of urbanization on urban heat island (UHI) dynamics have been extensively investigated in large metropolitan regions,smaller and rapidly growing urban centers such as Kharagpur remain comparatively underexplored. This study assesses the influence of LULC transitions on the UHI phenomenon over Kharagpur, including the Indian Institute of Technology (IIT) Kharagpur campus, which has undergone accelerated urban expansion and surface transformation over the past two and a half decades.
Multi-temporal Landsat 5, 7, and 8 satellite imagery were used to analyze spatiotemporal variations in LULC, land surface temperature (LST), and UHI characteristics during the period 2000–2025. LULC classes were generated using supervised classification with the Maximum Likelihood Classifier (MLC) algorithm. The Normalized Difference Vegetation Index (NDVI) and Normalized Difference Built-up Index (NDBI) were employed to characterize surface properties and to estimate LST, enabling the identification and quantification of UHI intensity.
The results reveal a marked expansion of built-up areas, increasing from 26% to 55% across Kharagpur and from 6.7% to 42.3% within the IIT Kharagpur campus, primarily at the expense of barren and vegetated land. A significant and spatially coherent increase in LST is observed over the last 25 years, with pronounced UHI hotspots consistently associated with built-up and barren surfaces. The findings demonstrate that rapid urban growth and LULC transitions play a critical role in modulating the local thermal environment. This study provides valuable insights for sustainable urban planning and the development of heat mitigation strategies in emerging and mid-sized urban centers.
Keywords: LULC, Land Surface Temperature, Urban Heat Island, Landsat

How to cite: Bag, G. G. and Satyanarayana, A.: Impact of Land Use–Land Cover Changes on Urban Heat Island Dynamics in a Rapidly Growing Mid-Sized Indian City, EGU General Assembly 2026, Vienna, Austria, 3–8 May 2026, EGU26-16111, https://doi.org/10.5194/egusphere-egu26-16111, 2026.

EGU26-16122 | ECS | Orals | BG3.7

Future Agricultural Workforce Availability as a Constraint on the Northward Expansion of Cultivable Land 

Hongtak Lee, Nicklas Forsell, and Hyungjun Kim

Under ongoing climate change, high-latitude regions are becoming increasingly suitable for agricultural production, while climate-related risks to food systems are intensifying in many low-latitude regions. Accordingly, the northward expansion of cultivable land has been analyzed as a mitigation buffer for climate change and global food security. However, such expansion raises concerns regarding land-use competition with forestry and the encroachment on forests, soils, and peatlands that takes important roles in the terrestrial carbon cycle. Therefore, the proposition of a practical northern front that defines actually utilizable cropland potential is necessary to enable further analysis of these inherent issues. In this study, we assess the practical northern front under constraints imposed by agricultural workforce availability, used as a proxy for complex socio-economic interactions. The northern front of cultivable land is projected based on a data driven framework that integrates historical trajectories of agricultural employment with demographic assumptions from the SSP narratives. In contrast to the pronounced northward expansion of environmentally suitable land, the projected practical cultivable land area exhibits limited expansion. Under the SSP3 scenario, for instance, a southward retreat of the practical cultivable frontier is identified across Central Asia and the Far Eastern region. In Europe (50–90°N), most environmentally suitable areas remain practically cultivable, whereas in North America, agricultural workforce rarely extends beyond 50°N, except in a few localized regions. These results point to limitations in climate and food security mitigation strategies relying on high-latitude land expansion, while indicating that challenges in low-latitude agricultural systems persist.

Acknowledgment: This research was supported by the National Research Foundation of Korea (NRF) grant funded by the Ministry of Science and ICT (RS-2021-NR055516, RS-2025-02312954).

How to cite: Lee, H., Forsell, N., and Kim, H.: Future Agricultural Workforce Availability as a Constraint on the Northward Expansion of Cultivable Land, EGU General Assembly 2026, Vienna, Austria, 3–8 May 2026, EGU26-16122, https://doi.org/10.5194/egusphere-egu26-16122, 2026.

Land use and land cover (LULC) significantly influence terrestrial carbon cycling and soil functioning in Mediterranean mountain regions, yet the relative contribution of different vegetation types to soil organic carbon (SOC) storage remains poorly quantified. Understanding these relationships is essential for developing effective land-based climate mitigation and adaptation strategies that balance carbon sequestration with broader ecosystem services. This study quantifies SOC and nitrogen (N) stocks across five contrasting LULC types in La Rioja, northern Spain: Pinus sylvestris, Fagus sylvatica, Quercus pyrenaica, Quercus ilex, and a pastureland.

We assessed SOC and N stocks in both forest floor and mineral soil layers (0-40 cm), alongside key physicochemical properties. A soil quality index (SQI) was developed to evaluate overall soil functioning beyond carbon storage alone.

Results demonstrate substantial variation in carbon storage mechanisms among LULC types. Total SOC stocks ranged from 42.9 Mg ha⁻¹ (Quercus ilex) to 112.9 Mg ha⁻¹ (pasture), while N stocks varied from 4.0 to 10.3 Mg ha⁻¹. Pastureland stored the highest mineral soil stocks, associated with elevated organic matter content, finer texture, and lower bulk density. Coniferous forests accumulated substantial SOC and N in surface organic layers, reflecting slow litter decomposition and high C:N ratios, but lower mineral soil stocks. SQI values ranged from 0.32 (Fagus sylvatica) to 0.47 (pasture), indicating significant differences in overall soil functioning.

These findings reveal important considerations for land management decisions: while forest expansion provides carbon sequestration through distinct accumulation pathways, well-managed pastureland systems can achieve comparable or superior total carbon storage with additional co-benefits for soil quality. Our results highlight that vegetation-specific effects on SOC distribution, soil properties, and nutrient dynamics must inform land-based climate strategies. An integrated management approach considering species-specific traits, soil characteristics, and multiple ecosystem services is essential for optimizing carbon storage and maintaining soil functioning in Mediterranean mountain environments under environmental change.

This research project is supported by the FORWARD project (PID2024-161314OB-I00) funded by the MICINN-FEDER.

How to cite: Nadal Romero, E. and Wagner, C.: Soil Organic Carbon Storage and Soil Quality across Forest Types and Pastureland in Mediterranean Mountain Ecosystems, EGU General Assembly 2026, Vienna, Austria, 3–8 May 2026, EGU26-16804, https://doi.org/10.5194/egusphere-egu26-16804, 2026.

EGU26-17926 | Orals | BG3.7

Exploring the impact of time-varying land cover and data assimilation in ecLand 

David Fairbairn, Patricia de Rosnay, Hans Hersbach, Ewan Pinnington, Margarita Choulga, Souhail Boussetta, Jonathan Day, Etienne Tourigny, Amirpasha Mozaffari, Vinayak Huggannavar, Iria Ayan, and Stefano Materia

Vegetation and land cover information play an important role in land-atmosphere interactions for both Numerical Weather Prediction and reanalysis systems. In the ECMWF land surface model (ecLand), a fixed monthly climatology is currently employed for land cover,  leaf area index (LAI) and lake cover. Whilst this information accounts for the seasonal cycle, it lacks inter-annual variability. As part of the Copernicus Climate Change Evolution (CERISE) project, monthly varying maps of LAI, land cover and lake information have been developed from 1925 onwards. These maps are based on a combination of observation data sets, machine learning and back-filling methods. These maps are being tested in ecLand forced by ERA5, together with an offline land data assimilation system (LDAS), to produce the ERA-Land-CERISE reanalysis (1939-2019). The LDAS is based on the operational ECMWF land DA system, and consists of a soil moisture, snow depth, 2 m temperature/humidity and lake temperature analysis. Here we briefly describe the time-varying vegetation, land cover and LDAS methods. Case studies for ERA-Land-CERISE are presented, including the warm European summer of 2003. Furthermore, an evaluation of the soil moisture, snow, lake temperature and heat fluxes is performed. 

How to cite: Fairbairn, D., de Rosnay, P., Hersbach, H., Pinnington, E., Choulga, M., Boussetta, S., Day, J., Tourigny, E., Mozaffari, A., Huggannavar, V., Ayan, I., and Materia, S.: Exploring the impact of time-varying land cover and data assimilation in ecLand, EGU General Assembly 2026, Vienna, Austria, 3–8 May 2026, EGU26-17926, https://doi.org/10.5194/egusphere-egu26-17926, 2026.

EGU26-18137 | ECS | Orals | BG3.7

Consistent Pantropical Deforestation Monitoring in Dense Humid Forests from Landsat Time Series (2000–2025) 

Audric Bos, Céline Lamarche, Thomas De Maet, and Pierre Defourny

Land use and land cover change (LULCC) remains one of the largest and most persistent sources of uncertainty in the global carbon budget, limiting confidence in estimates of terrestrial carbon sources and sinks. Within LULCC, deforestation in tropical dense humid forests contributes a substantial share of emissions due to high biomass stocks and continued land conversion across major tropical regions. Despite the availability of several global forest change datasets, estimates of annual deforested area differ widely. Variations in forest definitions, disturbance detection methods, and temporal attribution lead to inconsistent estimates of both the magnitude and timing of forest loss, which propagate directly into uncertainty in LULCC emission estimates used in global carbon budget (GCB) assessments and Earth system models.

Consistent monitoring of tropical deforestation is particularly challenging because of persistent cloud cover, heterogeneous disturbance processes, and strong spatial and temporal variability in forest loss dynamics. These challenges are most pronounced in regions such as the Congo Basin, where observational limitations lead to uneven detection performance and reduced comparability across datasets. Improving the spatial and temporal consistency of deforestation estimates across tropical regions is therefore critical for reducing uncertainty in LULCC emissions and for supporting model evaluation within the GCB.

The objective of this study is to improve the spatial and temporal consistency of pantropical deforestation estimates derived from optical satellite data over the last 25 years. We present a consistent, high-resolution deforestation monitoring approach based on Landsat Analysis Ready Data, with application to Amazonia, Central Africa, and Southeast Asia.

Deforestation is detected within masks of intact tropical forests. To improve robustness in persistently cloudy environments, standard Landsat Quality Flags are complemented by a regionally adaptive, cloud-tolerant masking strategy, enabling the construction of continuous spectral time series suitable for long-term analysis. Deforestation signals are identified using Normalized Burn Ratio time series combined with forest-based local standardization. This yields a statistical change indicator designed to balance sensitivity to disturbance with robustness to noise and data gaps. Candidate deforestation events are further refined using complementary spatial and temporal metrics, including data availability constraints, disturbance amplitude, and spatial proximity to neighbouring events, enhancing coherence while limiting spurious detections. Parameter calibration and optimisation are conducted independently, with reference to existing operational monitoring systems, including Global Forest Change and Tropical Moist Forest products.

Evaluation using a targeted two-level validation framework combining spatial intersections and temporal stratification indicates reduced bias and root-mean-square error in annual deforestation estimates relative to widely used global datasets. Improved detection performance is particularly evident in observationally challenging regions such as the Congo Basin. Analyses in Amazonia and Southeast Asia are ongoing and already show coherent spatial patterns and realistic temporal dynamics.

Overall, this work demonstrates that harmonized, high-resolution optical time series can provide more consistent estimates of tropical deforestation, supporting improved quantification of LULCC emissions. By reducing discrepancies in annual forest loss estimates, the approach provides a more stable observational basis for GCB assessments and Earth system model evaluations like IPCC assessments.

How to cite: Bos, A., Lamarche, C., De Maet, T., and Defourny, P.: Consistent Pantropical Deforestation Monitoring in Dense Humid Forests from Landsat Time Series (2000–2025), EGU General Assembly 2026, Vienna, Austria, 3–8 May 2026, EGU26-18137, https://doi.org/10.5194/egusphere-egu26-18137, 2026.

EGU26-19859 * | Orals | BG3.7 | Highlight

Tropical forests make it rain: new understanding from observation and model-based approaches 

Dominick Spracklen, Arthur Argles, Steve Arnold, Jessica Baker, Edward Butt, Robin Chadwick, Caio Coelho, Paulo Kubota, John Marsham, Ben Maybee, Sarah McClory, Doug Parker, Carly Reddington, Eddy Robertson, Callum Smith, and Emily Wright

Tropical forests play an important role in regulating climate and the hydrological cycle.  Rapid deforestation across the tropics is radically changing the land surface, causing local and regional warming and altering the pattern of precipitation. The biogeophysical mechanisms behind these changes are complex and still not fully understood: climate models disagree on the sign of the precipitation change in response to tropical deforestation and the extent to which recent tropical deforestation has altered precipitation remains highly uncertain. Here, we apply observation and model-based approaches to provide new information on how tropical deforestation impacts precipitation. We combine satellite-based precipitation and forest loss data to explore how tropical deforestation is associated with rainfall trends across the tropics (30°S–30°N) from 2001 to 2024. We find the largest precipitation declines within and downwind of regions that have experienced the largest reductions in tropical forest canopy cover. To explore mechanisms behind these observed precipitation changes, we analyse simulations from climate models participating in the Land Use Model Intercomparison Project (LUMIP). Models predict a diverging response of precipitation to Amazon deforestation, largely due to opposite moisture convergence responses across models. We find that models with larger positive surface albedo response to deforestation typically have larger reductions in evapotranspiration, moisture convergence and precipitation. Finally, we use simulations from the UKESM and the Brazilian Atmospheric Model (BAM) to simulate the local and regional climate responses to different future land use scenarios and explore potential impacts on human health, agriculture and fire.    

How to cite: Spracklen, D., Argles, A., Arnold, S., Baker, J., Butt, E., Chadwick, R., Coelho, C., Kubota, P., Marsham, J., Maybee, B., McClory, S., Parker, D., Reddington, C., Robertson, E., Smith, C., and Wright, E.: Tropical forests make it rain: new understanding from observation and model-based approaches, EGU General Assembly 2026, Vienna, Austria, 3–8 May 2026, EGU26-19859, https://doi.org/10.5194/egusphere-egu26-19859, 2026.

EGU26-20605 | ECS | Posters on site | BG3.7

Mapping the "Green-on-Green" trade-off: tracking new solar photovoltaic plants in Italy through the CLC2024 change detection framework. 

Anna Palamidessi, Angela Cimini, Marco D'Antona, Paolo De Fioravante, Pasquale Dichicco, Tania Luti, Lorella Mariani, Ines Marinosci, and Michele Munafò

The CORINE Land Cover (CLC) project, part of the Copernicus program, provides harmonized European data for detecting and monitoring land cover and land use dynamics, with particular attention to environmental protection.

ISPRA (Italian Institute for Environmental Protection and Research), as the National Focal Point of the Europea Environment Agency (EEA) network Eionet, is responsible for producing national CLC datasets for Italy.

The first CLC database was created in 1990 and is updated every six years since 2000. CORINE Land Cover 2024 (CLC2024) introduces an important innovation: the voluntary mapping of newly established ground-mounted photovoltaic (PV) power stations (solar parks, solar power plants) built between 2018 and 2024 on previously non-built-up land.

The mapping is voluntary, however recommended as results will give information not only on the increase of renewable energy production, but also on the extent and type of land occupied by these structures. Given that PV power stations occupy at least one hectare per megawatt of installed capacity, their rapid growth raises increasing concerns about competition for land with agriculture and natural ecosystems.

In this context, Italy, with over 37 MW of PV capacity installed at the end of 2024, represents a critical case study, where 80% of the 1,702 ha of land consumed in 2024 by new ground-mounted plants was previously agricultural.In line with the updated technical guidelines, CLC2024 classification system has been improved by introducing a fourth hierarchical level within class 121. This innovation allows, for the first time, the systematic identification of new bigger ground-mounted PV installation from other industrial or commercial units.

This study presents a nationwide assessment of new PV plants constructed in Italy between 2018 and 2024. Using the CLC change detection framework (MMU 5 ha), we quantify the conversion of agricultural (class 2) and natural (class 3) land into energy infrastructure, comparing results with other national and more detailed data (MMU in order to derive the accuracy. The aim is to provide objective data on the so-called ‘Green-on-Green’ trade-off: balancing the urgent need for renewable energy expansion with the preservation of existing land cover.

The paper describes the national mapping methodology and the statistical analysis carried out on the complete dataset. The results will provide a comprehensive overview of the land cover classes most affected by PV expansion, contributing to the broader debate on agrivoltaics and soil protection. The final results will support land use planners and policymakers in harmonizing energy transition goals with the protection of the national ecological heritage.

How to cite: Palamidessi, A., Cimini, A., D'Antona, M., De Fioravante, P., Dichicco, P., Luti, T., Mariani, L., Marinosci, I., and Munafò, M.: Mapping the "Green-on-Green" trade-off: tracking new solar photovoltaic plants in Italy through the CLC2024 change detection framework., EGU General Assembly 2026, Vienna, Austria, 3–8 May 2026, EGU26-20605, https://doi.org/10.5194/egusphere-egu26-20605, 2026.

EGU26-20671 | ECS | Posters on site | BG3.7

Beyond carbon, from Arctic forest migration to climate mitigation: can biogeochemical effects challenge albedo-driven warming? 

Adele Zaini, Sara M. Blichner, Jing Tang, Rosie A. Fisher, Marianne T. Lund, Dirk J. Olivié, and Terje K. Berntsen

Rising global temperatures are expected to drive a northward expansion of boreal forests into Arctic regions, triggering multiple and interacting climate feedbacks. This land cover change is also relevant as a parallel to mitigation strategies such as afforestation, which are often evaluated solely for their carbon benefits, while other biogeophysical and biogeochemical effects may substantially offset the intended carbon uptake. Reduced surface albedo from forests replacing snow-covered, treeless areas is widely recognised as a strong warming mechanism. Chemical emissions, specifically biogenic volatile organic compounds (BVOCs), in these regions may also play a substantial role, potentially counteracting albedo-driven warming. In this study, we aim to provide new insights into the climate impacts of Arctic land cover change by assessing both biogeophysical and biogeochemical pathways beyond carbon uptake.

BVOCs influence climate through multiple, partly opposing pathways. Their oxidation products contribute directly to secondary organic aerosol formation and modify indirectly cloud optical properties, potentially leading to a cooling effect. At the same time, BVOCs affect atmospheric chemistry by altering the concentrations and lifetimes of key climate forcers such as ozone and methane, which can introduce a positive radiative forcing. The combined effect of these processes, and their relative importance compared to albedo changes, remains uncertain.

Here, we use the Norwegian Earth System Model version 2.3 (NorESM2.3), including a newly implemented comprehensive atmospheric chemistry scheme, to investigate the radiative impacts of projected boreal forest expansion. We perform targeted simulations under present-day and warmer climate scenarios, allowing us to isolate the contributions from surface albedo changes, BVOC-driven direct aerosol effects, cloud interactions, and chemistry-related impacts on ozone and methane.

By comparing these pathways within a single modelling framework, this work evaluates whether BVOC-related processes can significantly offset albedo-driven warming and how their relative importance evolves under climate warming. The results provide a comprehensive understanding of how land use and land cover changes influence the Arctic climate via interacting biogeophysical and biogeochemical mechanisms.

How to cite: Zaini, A., Blichner, S. M., Tang, J., Fisher, R. A., Lund, M. T., Olivié, D. J., and Berntsen, T. K.: Beyond carbon, from Arctic forest migration to climate mitigation: can biogeochemical effects challenge albedo-driven warming?, EGU General Assembly 2026, Vienna, Austria, 3–8 May 2026, EGU26-20671, https://doi.org/10.5194/egusphere-egu26-20671, 2026.

EGU26-20986 | Posters on site | BG3.7

A new online tool for assessing local climate heating and heat-related mortality associated with tropical deforestation 

Dominick Spracklen, Carly Reddington, Edward Butt, Nike Doggart, Richard Rigby, Jessica Baker, Callum Smith, Beatriz Oliveira, and Edmund Yamba

Tropical deforestation causes local warming resulting in elevated human heat stress and a potential human health risk. Analysis of satellite data shows tropical deforestation during 2001–2020 exposed 345 million people to a population-weighted daytime land surface warming of 0.27 °C that is associated with 28,000 (95% confidence interval: 23,610–33,560) heat-related deaths per year. Despite this important impact on public health, limited information is available at the local level on the scale and magnitude of deforestation-induced warming or the potential human healh impacts. Here we present a new interactive online tool that provides local-level information to stakeholders across the tropics on deforestation-induced warming and associated health impacts. In regions of forest loss, local warming from deforestation could account for over one third of total climate heat-related mortality, highlighting the important contribution of tropical deforestation to ongoing warming and heat-related health risks within the context of climate change. Our work provides locally-relevant information to inform stakeholders on the local climate and public health impacts of tropical deforestation.

How to cite: Spracklen, D., Reddington, C., Butt, E., Doggart, N., Rigby, R., Baker, J., Smith, C., Oliveira, B., and Yamba, E.: A new online tool for assessing local climate heating and heat-related mortality associated with tropical deforestation, EGU General Assembly 2026, Vienna, Austria, 3–8 May 2026, EGU26-20986, https://doi.org/10.5194/egusphere-egu26-20986, 2026.

This study develops and evaluates an enhanced Land Use and Land Cover Change (LULCC) scheme integrated within the Common Land Model (CoLM) of CAS-ESM2.0, which is coupled with the dynamic vegetation model IAP-DGVM. The updated model captures carbon fluxes and storage changes from key LULCC activities (e.g., deforestation, afforestation, wood harvest) and simulates the dynamic responses of both natural and human-managed vegetation to climate. Historical simulations conducted for CMIP6 LS3MIP/LUMIP demonstrate that the updated model reasonably reproduces the evolution of land-use emissions and trends in ecosystem carbon storage, showing significant improvements over the standard CoLM in simulating the surface climate and terrestrial carbon cycle.

We further quantify multi-source uncertainties in simulated historical LULCC carbon emissions (1850–2014) through ensemble experiments. Results indicate that model parameterization is the dominant source of uncertainty (contributing >50% and exceeding 80% in some comparisons), followed by climate forcing. Initial state uncertainty is significant only in the first few decades, while differences among CMIP6 land-use pathways contribute least to the total uncertainty, highlighting the priority of refining model parameterizations.

Finally, a comparison of simulations forced by CMIP6 (LUH2) and CMIP7 (LUH3) land-use datasets reveals that while global totals of carbon sink and LULCC emissions are similar, notable spatial discrepancies exist in key regions. Emissions in the LUH3-driven simulation show a marked increase (~40%) over the last three decades, attributable to accelerated forest-to-cropland conversion and intensified management in the updated dataset. This work underscores the critical roles of model process representation and input data in assessing the carbon impacts of land-use change.

How to cite: Zhang, Q. and Zeng, X.: Impacts of LULCC on Land Carbon Cycle in CAS-ESM2.0: Historical Benchmarking, Uncertainty, and CMIP6/7 Comparisons, EGU General Assembly 2026, Vienna, Austria, 3–8 May 2026, EGU26-21698, https://doi.org/10.5194/egusphere-egu26-21698, 2026.

EGU26-22427 | Orals | BG3.7

The LULUCF Data Hub: regional- and national-level discrepancies between independent global datasets and national GHG inventories. 

Joana Melo, Simone Rossi, Frédéric Achard, Ramdane Alkama, Josep G. Canadell, Sandro Federici, Pierre Friedlingstein, David Gibbs, Nancy Harris, Viola Heinrich, Michael O'Sullivan, Glen P. Peters, Julia Pongratz, Melissa Rose, Rosa Roman-Cuesta, María J. Sanz, Clemens Schwingshackl, Stephen Sitch, and Giacomo Grassi

Land use plays a critical role in achieving the Paris Agreement goals, yet inconsistencies between global carbon models, Earth Observation (EO), and national greenhouse gas inventories (NGHGIs) lead to significant mismatches in CO₂ emission estimates. NGHGIs, reported by countries using IPCC guidelines, guide national policies, while global models and satellite-based Earth Observation estimates support independent evaluations. Ensuring comparability among these datasets is essential.

Here we introduce the LULUCF Data Hub, an interactive platform hosted by the EU Forest Observatory to visualize CO₂ emissions and removals as reported by countries to the UNFCCC, alongside independent global land-use emission datasets. NGHGI data indicate a global net LULUCF sink of -2.3 Gt CO₂ yr⁻¹ (on average 2000-2023), with declining deforestation emissions and increasing forest sinks. For total LULUCF, a good agreement emerges between the translated results from the Global Carbon Budget (GCB 2024, representing the modelling scientific community) and NGHGIs at global level, both in magnitude – with the original gap of 7.2 Gt CO2 yr-1 (2000-2022 average) reduced to 0.8 Gt CO2 yr-1 – and trend. When combining estimates for forest and deforestation, the translated results from Global Forest Watch (GFW, representing the EO scientific community in this study) also show a similar magnitude than NGHGI, but a divergent trend.

While the translation methodology used here effectively addresses conceptual differences among the studied datasets at the global level and for most countries, we highlight regions and countries where disagreements in estimates persist. We provide insights into possible reasons for these discrepancies and indicate areas where further research is warranted. The ultimate objective of the LULUCF data hub is to stimulate dialogue and foster collaborative efforts across different communities to reach a greater consensus on the magnitude and trends of land use emissions and removals, in support of the implementation of the Paris Agreement and in anticipation of the next UNFCCC Global Stocktake.

How to cite: Melo, J., Rossi, S., Achard, F., Alkama, R., Canadell, J. G., Federici, S., Friedlingstein, P., Gibbs, D., Harris, N., Heinrich, V., O'Sullivan, M., Peters, G. P., Pongratz, J., Rose, M., Roman-Cuesta, R., Sanz, M. J., Schwingshackl, C., Sitch, S., and Grassi, G.: The LULUCF Data Hub: regional- and national-level discrepancies between independent global datasets and national GHG inventories., EGU General Assembly 2026, Vienna, Austria, 3–8 May 2026, EGU26-22427, https://doi.org/10.5194/egusphere-egu26-22427, 2026.

European environmental research infrastructures (RIs) are strategically positioned to address pressing environmental challenges. However, no single RI can generate the comprehensive knowledge required to support Europe’s transition toward a sustainable future when operating in silos (eLTER RI, 2023). To meet this challenge, co-location of RIs has emerged as a key strategy for fostering integration, collaboration, and joint scientific innovation. Collectively, RIs such as eLTER, AnaEE-ERIC, ICOS, LifeWatch, and ACTRIS provide complementary long-term, high-quality data on ecosystem processes, which are essential for understanding climate change impacts and biodiversity loss. This study examines the concept of co-location across four dimensions: data sharing, funding, physical location and instrumentation, and coordination and governance. Using two European case studies, including Hyytiälä SMEAR II (Finland) and the Castelporziano Presidential Estate (Italy), the study explores how co-location is interpreted and implemented in practice. Data were collected through RI documentation and semi-structured interviews involving principal investigators, scientific advisors, and technical personnel from the five RIs represented at the study sites. Findings show that co-location initially emerged from shared scientific interests, particularly the need to observe interactions between the atmosphere and ecosystems. However, conceptual ambiguities persist, especially regarding spatial proximity, scientific criteria, and terminology. The study identifies key benefits, challenges, and institutional dynamics shaping RI integration, including shared physical infrastructure, staff mobility, governance structures, data management, communication strategies, cost-sharing, collaborative funding, knowledge exchange, team integration, and collective responses to cross-disciplinary scientific questions. Overall, the results offer actionable insights into how collaborative infrastructure models can enhance efficiency, scientific impact, and policy relevance across European environmental monitoring systems. These findings contribute to the broader effort to strengthen coordination and alignment among RIs in addressing global environmental challenges.

How to cite: Eko, O., Carbone, F., and Papale, D.: Co-location and Scientific Collaboration Among Environmental Research Infrastructures: Insight from Hyytiälä SMEAR II and Castelporziano , EGU General Assembly 2026, Vienna, Austria, 3–8 May 2026, EGU26-205, https://doi.org/10.5194/egusphere-egu26-205, 2026.

EGU26-484 | ECS | Orals | BG3.8

Nature-Based Microbial Strategies for Enhancing Wheat Salt Tolerance in Coastal Agroecosystems 

Mahdi Shahabirokni, Hassan Etesami, Bahar S. Razavi, and Alireza Raheb

Global warming and sea-level rise are intensifying soil salinization in coastal regions, threatening food security and ecosystem stability. In coastal areas of Iran, where most of the rainfed farming and cultivation occur, seawater intrusion (EC > 4 dS/m) has severely degraded soils, reducing vegetation cover and carbon sequestration. This creates a dangerous feedback loop, which further amplify climate-change impacts. Developing sustainable, nature-based strategies to maintain crop productivity under these extreme conditions is therefore essential.

In this study, we explored halophyte-associated microbial communities from the Oman Sea coast as a nature-based solution to enhance wheat tolerance to seawater irrigation. A total of 510 bacterial isolates were obtained from halophyte rhizospheres and endospheres, and assembled into salt-tolerant, non-antagonistic consortia. These consortia were inoculated into six wheat cultivars (Pishgam, Narin, Arg, Ofoq, Bam, Barzgar) and irrigated with seawater (EC = 50 dS/m).

Results revealed strong genotype–microbiome interactions. Some consortia significantly increased biomass (up to 228% in Pishgam and 127% in Ofoq with Consortium 3), while others reduced growth (−33% in Arg with Consortium 7). Rhizospheric sequencing identified 122 shared OTUs across treatments, yet β-diversity analyses (UniFrac) showed distinct plant-driven microbial filtering. Ofoq maintained a microbiome closer to its control (0.285 distance), mitigating negative effects, while Bam exhibited a greater divergence (0.401), correlating with poor growth.

These findings highlight that the success of microbial inoculation depends on host genotype compatibility and root-exudate-mediated selection. Leveraging native halophyte-associated microbes offers a promising, ecosystem-based pathway to enhance crop resilience, restore coastal soils, and mitigate carbon loss under salinity stress. Under extreme conditions, a shift from grain to forage-oriented systems may further improve sustainability and align with climate adaptation goals.

How to cite: Shahabirokni, M., Etesami, H., Razavi, B. S., and Raheb, A.: Nature-Based Microbial Strategies for Enhancing Wheat Salt Tolerance in Coastal Agroecosystems, EGU General Assembly 2026, Vienna, Austria, 3–8 May 2026, EGU26-484, https://doi.org/10.5194/egusphere-egu26-484, 2026.

EGU26-2337 | Orals | BG3.8 | Highlight

The Global Ecosystem Research Infrastructure (GERI): Organizational Overview and ongoing development. 

Henry W. Loescher, Beryl Morris, Michael Mirtl, Steffen Zacharias, Jaana Back, Tommy Bornman, Gregor Feig, Xiubo Yu, Michael SanClements, and Paula Mabee

We recognize that contemporary environmental challenges transcend geopolitical boundaries.  The Global Ecosystem Research Infrastructure (GERI) was formed to address the nature and magnitude of these challenges through cross-border global perspectives and collaborations.  GERI brings together six large-scale (continental) ecosystem research infrastructures (RIs) from around the world.  The GERI member RIs are: SAEON in South Africa, TERN in Australia, CERN in China, NEON in the USA, and ICOS and eLTER in Europe) to federate the programmatic work needed for concerted operations, collaborations, and the provisioning of interoperable data and services.  Here, we present the historical activities that brought these RIs together, how we established a structured governance, engagement with other networks, and current overview of GERIs data harmonization and common services activities.  We will also present current programmatic challenges as GERI continues to develop internationally and seek community input and involvement.

How to cite: Loescher, H. W., Morris, B., Mirtl, M., Zacharias, S., Back, J., Bornman, T., Feig, G., Yu, X., SanClements, M., and Mabee, P.: The Global Ecosystem Research Infrastructure (GERI): Organizational Overview and ongoing development., EGU General Assembly 2026, Vienna, Austria, 3–8 May 2026, EGU26-2337, https://doi.org/10.5194/egusphere-egu26-2337, 2026.

EGU26-4793 | ECS | Orals | BG3.8

Atmospheric Deposition Outweighs Dryness in Regulating European Ecosystem Productivity 

Yu Zhou, Mana Gharun, Jingfeng Xiao, Rossella Guerrieri, Xing Li, and Nina Buchmann

Ecosystem productivity across Europe is often assumed to be constrained primarily by water limitation in recent decades. Yet the influence of atmospheric deposition remains poorly quantified, even as Europe experiences the world’s fastest decline in nitrogen (N) and sulfur (S) inputs. Here we combine satellite-derived gross primary productivity (GPP) from a SIF-based product with gridded N and S deposition from EMEP and hydroclimate constraints represented by atmospheric dryness (vapor pressure deficit, VPD) and soil dryness (soil water potential, ψsoil) for 2000–2023. We assess how these drivers shape two functional components of productivity: maximum carbon uptake capacity (GPPmax) and the carbon uptake period (CUP). To disentangle the relative influence of deposition versus dryness, we use XGBoost to model spatiotemporal variability in GPPmax and CUP and identify the dominant controlling factor at both ecosystem and pixel scales. Across large parts of Europe, deposition emerges as a more spatially extensive and stronger influence on GPPmax and CUP than recent changes in VPD or ψsoil. Declining N deposition is consistently associated with reductions in GPPmax and a shorter CUP, indicating a shift towards stronger nutrient limitation. In contrast, declining S deposition is generally linked to increases in both metrics, consistent with ecosystem recovery from historical acidification. Dryness effects are more geographically confined, although VPD remains a strong functional constraint for most ecosystem types. Overall, our results suggest that changes in atmospheric nutrient supply can outweigh the influence of hydroclimate in shaping recent patterns of European ecosystem carbon uptake, with implications for projecting productivity as deposition regimes continue to evolve. Our study provides an early insight into how declining nutrient inputs may impact future productivity, as similar transitions emerge elsewhere.

How to cite: Zhou, Y., Gharun, M., Xiao, J., Guerrieri, R., Li, X., and Buchmann, N.: Atmospheric Deposition Outweighs Dryness in Regulating European Ecosystem Productivity, EGU General Assembly 2026, Vienna, Austria, 3–8 May 2026, EGU26-4793, https://doi.org/10.5194/egusphere-egu26-4793, 2026.

EGU26-4966 | ECS | Orals | BG3.8

Towards a time-explicit climate–carbon feedback framework for Earth system stability analysis 

Felix Jäger, Jonathan Donges, and Johan Rockström

Climate sensitivity and stability analysis so far rely on two separate concepts: climate and carbon feedbacks. The climate feedback framework allows the separation of two components of Earth’s radiative budget: forcing and temperature feedbacks. The carbon feedback concept helps to diagnose the strength with which oceanic and terrestrial systems buffer anthropogenic carbon emissions to the atmosphere and respond to changes in temperature. Both, albeit limited in their interpretation by temperature pathway and time dependence, play major roles in our current understanding of the Earth’s capacity to withstand anthropogenic pressures, but have been used and treated separately in large parts of the literature.

However, two approaches that serve a more holistic grasp of Earth system stability have been pursued. One is simple climate modelling as a prognostic tool that—often by tuning idealized response functions—captures a net response to emissions that inherently includes both carbon and climate feedbacks. The other, a diagnostic framework by Gregory et al. (2009), combines climate and carbon feedbacks for a specific set of climate model simulations under the assumption of constant parameters. A combined climate–carbon feedback framework that represents Earth system stability and the role of warming-induced carbon emissions in a more comprehensive and flexible manner, however, is still lacking.

We present an attempt at Earth system stability analysis that mitigates pathway and time dependence by combining methods from traditional feedback analysis and simple climate modelling: time-explicit feedback functions constructed from linear response theory like initiated by Torres Mendonça et al., (2021) in a diagnostic framework, now for climate and carbon feedbacks. We apply our analysis to flat10MIP-style Earth system model simulations, which provide the necessary statistical foundation and allow us to test sensitivity and robustness with respect to applications to observational evidence. This approach could ultimately support assessments of present and past Earth system stability particularly under temperature overshoot scenarios as well as high-level model evaluation on the effects of warming-induced carbon emissions.


Gregory, J. M., C. D. Jones, P. Cadule, and P. Friedlingstein, 2009: Quantifying Carbon Cycle Feedbacks. J. Climate, 22, 5232–5250, https://doi.org/10.1175/2009JCLI2949.1.

Torres Mendonça, G. L., Pongratz, J., and Reick, C. H., 2021: Identification of linear response functions from arbitrary perturbation experiments in the presence of noise – Part 1: Method development and toy model demonstration, Nonlin. Processes Geophys., 28, 501–532, https://doi.org/10.5194/npg-28-501-2021.

How to cite: Jäger, F., Donges, J., and Rockström, J.: Towards a time-explicit climate–carbon feedback framework for Earth system stability analysis, EGU General Assembly 2026, Vienna, Austria, 3–8 May 2026, EGU26-4966, https://doi.org/10.5194/egusphere-egu26-4966, 2026.

EGU26-6060 | ECS | Orals | BG3.8

Mangrove Species Exhibit Contrasting Photosynthetic and Water-Use Strategies in Bali, Indonesia 

Sangeun Kwak, Eunha Park, and Citra Gilang

Coastal forest ecosystems, particularly mangroves are directly exposed to the impacts of climate change, including sea-level rise, extreme weather events, and altered precipitation patterns, while simultaneously being recognized as key nature-based solutions capable of delivering both climate adaptation and mitigation benefits. Mangroves play avital role in climate resilience, offering both carbon sequestration and coastal protection under increasing climate pressures.

In this study, we investigates species-specific physiological responses among dominant of mangrove and semi-mangrove species in Bali, Indonesia. Net photosynthetic rate (A) was measured using portable gas exchange systems (LI-6400 and LI-6800), and instantaneous WUE and intrinsic WUE (iWUE) were calculated. In addition, A–Ci response curves were analyzed and fitted using the Farquhar–von Caemmerer–Berry model to estimate the maximum carboxylation rate (Vcmax) and maximum electron transport rate (Jmax).

Significant interspecific differences were observed in both photosynthetic performance and water-use characteristics (p < 0.001). Sonneratia alba exhibited the highest net photosynthetic rate (15.29 ± 2.39 μmol CO₂ m⁻² s⁻¹), whereas Pongamia pinnata and Hibiscus tiliaceus showed high iWUE values (96.51 ± 44.37 and 87.62 ± 20.73 μmol CO₂ mol⁻¹ H₂O, respectively), indicating more water-conservative strategies.

Furthermore, A–Ci curve fitting revealed significant species-specific differences in Vcmax and Jmax (p = 0.003 and 0.016, respectively), highlighting functional differentiation along coastal environmental gradients. By integrating in situ gas exchange measurements and A–Ci curve analysis, this study demonstrates interspecific variation in carbon acquisition and water-use strategies among mangrove and semi-mangrove species in Bali. Provides foundational data for our findings provide and physiological evidence to support effective mangrove selection in Nature-based solution(Nbs).

How to cite: Kwak, S., Park, E., and Gilang, C.: Mangrove Species Exhibit Contrasting Photosynthetic and Water-Use Strategies in Bali, Indonesia, EGU General Assembly 2026, Vienna, Austria, 3–8 May 2026, EGU26-6060, https://doi.org/10.5194/egusphere-egu26-6060, 2026.

The canopy leaf area (CLA) of desert shrubs is a key trait influencing canopy transpiration, while also regulating both oxygen release and carbon capture. However, precise quantification of diurnal whole canopy carbon-water fluxes remains difficult due to limitations in non-destructive CLA measurement.  Herein, we first employed diverse methods to estimate the CLA) of Caragana korshinskii across different ages. Subsequently, based on precise assessments of canopy leaf area, we quantified the daily-scale photosynthetic carbon assimilation and transpiration of the whole-canopy under lysimeter with or without groundwater. We found that the leaf area index (LAI) method underestimates CLA in younger C. korshinskii shrubs, whereas the basal diameter derivation (BDD) method overestimates CLA in older individuals, highlighting the limitations of both methods in accurately estimating the CLA of shrub across different ages. Further analysis identified key morphological traits of CLA, including total branch cross-sectional area, shrub canopy area, leaf area, and plant height. The multi-trait allometric relationships developed by the above morphological traits can accurately estimate the CLA of C. korshinskii shrubs, which were more accurate and reliable than other methods. Quantitative analysis revealed that a 2.41-fold difference in photosynthetic capacity (PnDL) of C. korshinskii between with and without groundwater corresponded to a 5.2-fold difference in transpiration (TrDL) at the leaf scale. However, at the canopy scale, groundwater increased the whole crown daily amount of transpiration (TrD) 13.6-fold in C. korshinskii, but the whole crown daily amount of photosynthetic carbon assimilation (PnD) only 6.2-fold. Our results indicated scale-dependent divergence in carbon–water flux responses, and revealed an adaptive strategy that enhances water use efficiency in arid habitats by maintaining minimal transpiration while maximizing photosynthetic carbon assimilation under drought. Our results highlighted that the multi-trait allometric relationships could more accurately estimate canopy leaf area of C. korshinskii, providing new methodological perspectives for quantifying shrub canopy dynamics and carbon-water fluxes in arid desert ecosystems.

How to cite: Huo, J. and Zhang, Z.: Assessment of canopy leaf area and scale-dependent carbon-water flux responses in a desert shrub, EGU General Assembly 2026, Vienna, Austria, 3–8 May 2026, EGU26-6161, https://doi.org/10.5194/egusphere-egu26-6161, 2026.

EGU26-6717 | Posters on site | BG3.8

Ecotron experiments reveal non-linear responses of Fagus sylvatica to realistic future climate scenarios 

Bálint Jákli, Qiao-Lin Gu, Patrick Wolf, Roman Meier, Frank Johannes, Thorsten Grams, and Manuela Baumgarten

Plants in natural ecosystems are simultaneously exposed to multiple, interacting climate drivers, including rising temperature, vapor pressure deficit, atmospheric CO₂ and tropospheric ozone. However, most experimental studies rely on the static manipulation of a limited set of climate drivers (typically one or two), which restricts our ability to detect emergent or non-linear responses under future conditions.

Here, we synthesize results from an ecotron study conducted at the Model EcoSystem Analyser (TUMmesa). Young Fagus sylvatica trees were exposed for three growing seasons to three dynamically simulated, regionalized climate scenarios, including a control scenario (representing an average 1987-2016 climate), a mitigation scenario (RCP2.6), and a worst-case scenario (RCP8.5). The scenarios comprised realistic seasonal and diurnal co-variation of temperature, radiation, humidity, CO₂ and O₃ at hourly resolution.

Across physiological, carbon-dynamic and transcriptomic datasets, we consistently observed strong non-linear responses to increasing climate severity. While moderate future conditions (RCP2.6) induced measurable acclimation responses, plants exhibited qualitatively different responses in RCP8.5, suggesting a shift in regulatory strategies under more extreme future climates. These included threshold-like shifts in gene expression, enhanced assimilation with accelerated carbon turnover, increased belowground allocation, and altered stomatal regulation affecting transpiration and ozone uptake.

Our results demonstrate that experiments manipulating only a limited set of climate drivers, or relying on extrapolation from moderate scenarios, are insufficient to predict plant responses to future climates. Instead, realistic multivariate climate simulations in ecotrons are indispensable for capturing emergent stress responses, advancing eco-physiological understanding, and improving the reliability of process-based vegetation models under future climate change.

How to cite: Jákli, B., Gu, Q.-L., Wolf, P., Meier, R., Johannes, F., Grams, T., and Baumgarten, M.: Ecotron experiments reveal non-linear responses of Fagus sylvatica to realistic future climate scenarios, EGU General Assembly 2026, Vienna, Austria, 3–8 May 2026, EGU26-6717, https://doi.org/10.5194/egusphere-egu26-6717, 2026.

EGU26-6894 | Orals | BG3.8

Biological nitrogen fixation in polluted Central European peat bogs: 15N2 incubation experiments, 210Pb-derived nitrogen accumulation rates, and the role of phosphorus availability 

Martin Novak, Jiri Kopacek, Frantisek Buzek, Bohuslava Cejkova, Ivana Jackova, Marketa Stepanova, Frantisek Veselovsky, and Jan Curik

Microbial N2 fixation (BNF) helps to sustain C accumulation in pristine peatlands and to remove CO2 from the atmosphere. However, a combination of high anthropogenic inputs of reactive nitrogen (Nr) and sustained N2 fixation may accelerate the invasion of vascular plants into the peat bogs, leading to a reduction of C–N stocks. Recent work in peatlands of polluted regions has indeed documented measurable BNF rates. Such data indicate partial adaptation of diazotrophs to increasing Nr deposition, instead of rapid downregulation of this energy-intensive microbial process. In addition to overall Nr availability and the NH4+/NO3- ratio in atmospheric deposition, BNF controls include diazotrophic community structure, moss identity, temperature, moisture, phosphorus availability, bog water pH, and molybdenum availability. We present the results of a BNF study in Central European peat bogs that historically received as much as 20 kg Nr ha-1 yr-1 from the atmosphere. At five sites, we compared total N accumulation in peat and cumulative Nr deposition since 1950 and 1900. We took advantage of existing extrapolations of historical NH4+ and NO3- emissions, and quantified the role of horizontal Nr deposition via fog interception and dry deposition. Eleven peat cores were 210Pb-dated. At all sites, the amount of N accumulated in peat exceeded the cumulative atmospheric Nr input. At one site in the industrially polluted north of the Czech Republic, atmospheric Nr input appeared to explain only 41% of N accumulation in peat. One possible explanation would be that the found “excess” N in peat was, at least partly, a result of N2-fixation. However, at least two sets of empirical data suggest that such high BNF rates in the studied central European peat bogs are not ecologically plausible: (i) in direct measurements of N2-fixation rates using 15N2 labelling, d15N values of Sphagnum significantly increased, but could explain only a small part of the “excess” N in peat that had been estimated by 210Pb-dating; (ii) literature data on phosphorus deposition rates at various Central European sites suggest P limitation. Consequently, the 210Pb-derived N accretion rates violate reasonable ranges of peatland C:N:P stoichiometry. Our new measurements of N:P ratios in atmospheric deposition at three peat bogs situated near the borders between the Czech Republic, Poland, Germany and Austria confirm the P limitation: The total N:P molar ratios were ~200 at Kunštátská kaple Bog (Eagle Mts.), ~100 at Černý potok (Slakovský les Mts.), and ~80 at Žďárecká slatˇ (Šumava Mts.). The hypothetical breaking point between N and P limitation in plant biomass is close to the N:P molar ratio of 35 (P limitation at higher N:P). In the paper, we will discuss uncertainties in 210Pb dating and cumulative BNF rates in Central European peat bogs based on new 15N2 laboratory incubations of peat substrate collected from several peat depths in different seasons.

How to cite: Novak, M., Kopacek, J., Buzek, F., Cejkova, B., Jackova, I., Stepanova, M., Veselovsky, F., and Curik, J.: Biological nitrogen fixation in polluted Central European peat bogs: 15N2 incubation experiments, 210Pb-derived nitrogen accumulation rates, and the role of phosphorus availability, EGU General Assembly 2026, Vienna, Austria, 3–8 May 2026, EGU26-6894, https://doi.org/10.5194/egusphere-egu26-6894, 2026.

EGU26-8312 | Orals | BG3.8

Research infrastructures as catalysts for international collaboration and skill development 

Michael SanClements, Cedric Hagen, Jaana Bäck, Thomas Bornman, Gregor Feig, Axel Cerón-González, Phumlile Cotiyane-Pondo, Rosmery Cruz-O'Byrne, Krutika Deshpande, Katya Jay, Christine Laney, Henry Loescher, Paula Mabee, Michael Mirtl, and Beryl Morris and the GERI Team

Global environmental challenges do not abide geopolitical borders but require international cooperation to address. The Global Ecosystem Research Infrastructure (GERI) was founded to address this need, building relationships and establishing data sharing practices among six of the largest environmental research infrastructures (ERIs) in the world, located on five continents. Early career researchers (ECRs) are essential to these global efforts, yet often face barriers to participation, including gaps in training and support. To understand how these ECRs could be better prepared and supported in this work, GERI distributed a survey to assess training needs, skills, and obstacles to international collaboration. The survey received responses from 577 researchers across 61 countries. Our findings reveal key differences between the Global North and Global South, as well as notable mismatches between the training ECRs receive and the skills they deem critical for research success, particularly when it comes to team science skills. ERIs serve a pivotal role in bridging these gaps. ERIs provide ECRs with unique opportunities for networking, skills development, and career advancement that are otherwise difficult to access. Participation in ERIs fosters transferable skills—such as data management, project management, and interdisciplinary collaboration—crucial for international projects and long-term career retention and advancement. By developing partnerships with ERIs and supporting targeted training programs, higher education institutions could better prepare ECRs for leadership in international science collaborations. Strengthening ECR engagement with ERIs is vital for building a resilient, globally connected scientific workforce capable of addressing the grand challenges of the future.

How to cite: SanClements, M., Hagen, C., Bäck, J., Bornman, T., Feig, G., Cerón-González, A., Cotiyane-Pondo, P., Cruz-O'Byrne, R., Deshpande, K., Jay, K., Laney, C., Loescher, H., Mabee, P., Mirtl, M., and Morris, B. and the GERI Team: Research infrastructures as catalysts for international collaboration and skill development, EGU General Assembly 2026, Vienna, Austria, 3–8 May 2026, EGU26-8312, https://doi.org/10.5194/egusphere-egu26-8312, 2026.

EGU26-8340 | Posters on site | BG3.8

Future warming-induced emissions are substantial and poorly constrained 

Danielle Monteverde, Sam Abernethy, Christina Schädel, Brian Buma, and Ben Poulter

Earth-system feedback loops involving natural greenhouse gas emissions pose substantial but poorly constrained risks to future climate trajectories. While direct anthropogenic emissions dominate current climate policy, warming-induced emissions (WIE) from natural sources—including wetlands, permafrost, freshwaters, and wildfires—represent positive feedbacks that have a net effect of amplifying warming yet remain largely excluded from emissions accounting and climate projections. Here we synthesize literature-derived temperature-emission relationships for multiple natural sources and quantify their contributions to future emissions and temperature trajectories across three SSP scenarios (SSP1-2.6, SSP2-4.5, SSP4-6.0) through 2100.

We extracted relationships between global temperature and rising emissions of wetland CH₄, freshwater CH₄, and wildfire CO₂, while for permafrost CH₄ and CO₂ we used existing data from the literature for each SSP. We then used MAGICC7 to obtain baseline temperature trajectories, calculated the corresponding WIE using the derived relationships, and reran MAGICC with these additional emissions to quantify feedback-driven temperature increases. 

By 2100, preliminary estimates of total warming-induced methane emissions could range from 70 ± 40 Mt CH₄/yr under SSP1-2.6 to 200 ± 70 Mt CH₄/yr under SSP4-6.0, representing substantial fractions of current anthropogenic methane emissions. WIE of CH4 and CO2 contribute an additional 0.2 ± 0.1 °C of warming under a low-emission scenario (SSP1-2.6) and 0.5 ± 0.1 °C under a high-emission scenario (SSP4-6.0) by 2100. High uncertainty in each WIE highlights the need for improved process understanding and observational constraints.

Our results demonstrate that WIE represent a significant and growing component of the global carbon budget that cannot be ignored in climate accounting or policy frameworks. The magnitude of these feedbacks underscores the critical value of rapid emissions reductions in limiting not only direct warming but also the amplification of natural emissions. These findings provide policy-relevant quantification of WIE impacts and establish a baseline for future coupled earth-system modeling efforts such as WIE-MIP.

How to cite: Monteverde, D., Abernethy, S., Schädel, C., Buma, B., and Poulter, B.: Future warming-induced emissions are substantial and poorly constrained, EGU General Assembly 2026, Vienna, Austria, 3–8 May 2026, EGU26-8340, https://doi.org/10.5194/egusphere-egu26-8340, 2026.

Coastal forests are increasingly recognized as critical Nature-Based Solutions (NbS) for climate mitigation and adaptation, providing essential services such as carbon sequestration and protection from extreme weather. To effectively manage these ecosystems and assess their climate benefits, continuous and accurate monitoring using high-resolution satellites (e.g., Sentinel-2) is essential. However, the unique atmospheric conditions of coastal zones often hinder the reliability of satellite observations. This study investigates the accuracy of satellite-based forest monitoring in the complex coastal environments of the Korean Peninsula. Utilizing a dedicated ground-truth network, we analyzed surface reflectance data from key coastal sites, including Wando (Southern Coast), Samcheok (Eastern Coast), Anmyeon-do (Western Coast), and Jeju Island. Our analysis reveals a significant "Coastal Blindness" in standard satellite products. Specifically, current atmospheric correction algorithms tend to misinterpret bright maritime aerosols (e.g., sea salt and haze) as heavy pollution. This leads to an "over-correction" problem, where the satellite imagery artificially darkens the forest signal, resulting in severe negative biases (e.g., Wando: -0.048, Samcheok: -0.066 in the Blue band). Such errors can lead to the underestimation of forest health and vegetation density, potentially misguiding regional adaptation policies. We demonstrate that applying region-specific ground validation data can identify and correct these biases. By ensuring the radiometric integrity of satellite data over coastal areas, this study provides a foundational step for implementing reliable, data-driven coastal forest management strategies. Our findings emphasize that accurate "eyes in the sky" are a prerequisite for successful regional climate action.

Acknowledgement: This study was developed in National Institute of Forest Science (Project No. ‘ FE0100-2026-04-2026’).

How to cite: Lim, J., Seo, M., Jin, C., and Yoo, B.-O.: Optimizing Satellite Monitoring for Coastal Nature-Based Solutions: Overcoming Atmospheric Errors in East Asian Coastal Forests (Case Studies: Wando, Samcheok, Anmyeon, and Jeju), EGU General Assembly 2026, Vienna, Austria, 3–8 May 2026, EGU26-8404, https://doi.org/10.5194/egusphere-egu26-8404, 2026.

EGU26-8481 | Posters on site | BG3.8

Distribution of Halophytes around Jeju Island, Korea 

Hyung Jeek Kim and Taehee Lee

Jeju has declared a carbon-zero vision for 2035, and achieving this carbon-neutrality goal requires the expansion of effective carbon sinks. Given the limited potential for further increases in terrestrial carbon sequestration, enhancing coastal blue carbon ecosystems has emerged as a critical strategy. In particular, the restoration and management of coastal halophytes and seagrass ecosystems offer a promising pathway to increase carbon absorption and support climate mitigation policies at the regional scale. This study investigated the distribution and current status of key coastal halophyte species on Jeju Island in order to provide baseline information for blue carbon restoration planning. Target species included Hibiscus hamabo, Vitex rotundifolia, and glasswort. Their spatial distribution was assessed using drone surveys, field surveys, and diving surveys. Hibiscus hamabo was found mainly in areas isolated from the open sea, with an estimated distribution area of 3,300 m². Vitex rotundifolia was evenly distributed around Jeju, with an estimated distribution area exceeding 200,000 m². Glasswort was not observed along the Jeju coast and is presumed to have completely disappeared.

How to cite: Kim, H. J. and Lee, T.: Distribution of Halophytes around Jeju Island, Korea, EGU General Assembly 2026, Vienna, Austria, 3–8 May 2026, EGU26-8481, https://doi.org/10.5194/egusphere-egu26-8481, 2026.

EGU26-8847 | Orals | BG3.8

Spatiotemporal variations in solute chemistry of stemflow and throughfall within a xerophytic shrub ecosystem in Northern China 

Yafeng Zhang, Weiqi Yao, Chuan Yuan, Yanxia Pan, Zhishan Zhang, and Delphis Levia

Numerous studies have demonstrated the chemical alteration of throughfall and stemflow by vegetation in forested ecosystems. However, less is known about the temporal variations and spatial patterning of solute chemistry in stemflow and throughfall within arid ecosystems where water and nutrient availability are generally limited. This study systematically examined the variations of various cations (K⁺, Na⁺, Ca²⁺, Mg²⁺, and NH₄⁺), anions (NO₃⁻, SO₄²⁻, and Cl⁻), pH, total nitrogen (TN), total phosphorus (TP), and total organic carbon (TOC) in stemflow and throughfall by a xerophytic shrub species (Caragana korshinskii Kom.) within a desert ecosystem of northern China. We found that after accounting for the effects of sampling date and shrub variations, stemflow was significantly chemically enriched compared to throughfall (p < 0.001). TN, TP, TOC, cations and anions in stemflow exhibited significant decreasing trends during the course of individual rainfall events (p < 0.001), while pH of stemflow showed a significant increasing trend (p < 0.001). Throughfall ion concentrations demonstrated radial spatial differentiation below the canopy, with TOC, TN, K⁺, Na⁺, Ca²⁺, NO₃⁻, and Cl⁻ showing a significant decreasing trend from the shrub base to the canopy outer edge (p < 0.001), whereas TP, Mg²⁺, and SO₄²⁻ displayed no clear trend along this radial gradient. In general, ionic concentrations in stemflow and throughfall initially increased and then tended to stabilize with a prolonged antecedent dry period length, whereas pH showed the opposite trend. For all solutes examined, flux-based enrichment ratios of stemflow to gross rainfall (EP) and to throughfall (ET) averaged 24.1 and 10.2, respectively. This study provides insights into the dynamic processes of nutrient enrichment driven by canopy rainfall partitioning and the shrub “fertile island” effect in arid ecosystems.

How to cite: Zhang, Y., Yao, W., Yuan, C., Pan, Y., Zhang, Z., and Levia, D.: Spatiotemporal variations in solute chemistry of stemflow and throughfall within a xerophytic shrub ecosystem in Northern China, EGU General Assembly 2026, Vienna, Austria, 3–8 May 2026, EGU26-8847, https://doi.org/10.5194/egusphere-egu26-8847, 2026.

South Korea is geographically vulnerable to coastal disasters due to its extensive coastline and frequent exposure to natural hazards such as typhoons and storm surges. Recently, these risks have intensified as the local rate of sea-level rise exceeds the global average, leading to recurring coastal flooding and erosion.

To mitigate these threats, the South Korean government has implemented various policies rooted in the Coastal Management Act. Key initiatives include "Coastal Improvement Projects" for restoring damaged shorelines and the designation of "Coastal Erosion Management Zones" to prevent future risks. Additionally, long-term coastal monitoring and R&D programs have been established to support scientific decision-making.

Despite these efforts, coastal damage persists, revealing limitations in the current approach. The primary challenges include the inability to effectively restrict development in high-risk areas and an over-reliance on "grey infrastructure" (artificial structures). Furthermore, spatial management strategies, such as managed retreat, are difficult to implement due to a lack of social consensus and resistance from local communities.

This study argues that effective disaster response requires a paradigm shift beyond traditional engineering. We propose: (1) the active adoption of Green Infrastructure and Nature-based Solutions (NbS); (2) stronger integration of coastal management with urban planning to strictly limit development in vulnerable zones; and (3) enhanced governance mechanisms to encourage community participation and consensus building.

How to cite: jung, J.: Assessment of Coastal Disaster Policies in South Korea: Achievements, Limitations, and Future Challenges, EGU General Assembly 2026, Vienna, Austria, 3–8 May 2026, EGU26-8921, https://doi.org/10.5194/egusphere-egu26-8921, 2026.

EGU26-10557 | Orals | BG3.8

Process-Based Modelling of Climate Change Impacts on Soil–Water Services in Mediterranean Vineyard Soils 

Marialaura Bancheri, Angelo Basile, Binyam Alemu Yosef, Rossella Albrizio, Antonello Bonfante, Maurizio Buonanno, Antonio Coppola, Roberto De Mascellis, and Shawkat Basel Mostafa Hassan

Understanding how terrestrial ecosystems respond to climate change and human pressures requires an integrated analysis of soil–plant–atmosphere interactions and their consequences for ecosystem functioning and services. In agricultural systems, projected changes in precipitation regimes and hydrological pathways are expected to strongly affect soil water dynamics, plant functioning, and the capacity of soils to deliver key ecosystem services. Within the framework of the National Research Centre for Agricultural Technologies–National Recovery and Resilience Plan (AGRITECH-PNRR), this study investigates climate-driven responses of soil ecosystem services in a Mediterranean vineyard by combining field observations with process-based modelling.

The study was conducted at the Tenuta Donna Elvira vineyard (Montemiletto, southern Italy), a hilly agroecosystem characterized by two adjacent Cambisol profiles with similar pedogenesis but contrasting hydraulic properties. While both soils exhibit comparable hydraulic behaviour in deeper horizons, marked differences in water retention and hydraulic conductivity were observed in the upper soil layers, providing a natural setting to explore soil-specific controls on ecosystem processes. Continuous field observations, including soil water content and Leaf Area Index measurements, together with meteorological data, were used to calibrate and validate the process-based agro-hydrological model FLOWS.

The validated model was then applied to simulate soil–water–plant dynamics under bias-corrected climate projections from three General Circulation Models (MPI-ESM1-2-LR, MRI-ESM2-0, and GFDL-ESM4). Simulations covered four temporal horizons (current, near-, mid-, and far-future) under three CMIP6 emission scenarios (RCP2.6, RCP7.0, and RCP8.5), allowing an assessment of climate change impacts on multiple water-related soil ecosystem services, including runoff regulation, groundwater recharge, vine water stress, and phenological development.

Results reveal that ecosystem responses are strongly modulated by both emission scenarios and soil hydraulic characteristics. Under low-emission conditions (RCP2.6), grapevine phenology remains close to present-day conditions, whereas under higher-emission scenarios (RCP7.0 and RCP8.5) ripening advances by up to six weeks, indicating increasing pressure on crop–water management. Groundwater recharge exhibits only modest changes across scenarios, while runoff generation intensifies under higher emissions, increasing vulnerability to extreme rainfall events. Notably, one soil shows approximately 50% greater runoff mitigation capacity than the other, highlighting the critical role of soil-specific properties in regulating hydrological ecosystem services.

This study demonstrates how the integration of field observations and process-based modelling can improve our understanding of ecosystem responses to climate change and anthropogenic pressures. The results underline the importance of accounting for soil heterogeneity when assessing ecosystem services and designing site-specific adaptation strategies, while also highlighting key uncertainties related to climate model divergence and future rainfall intensity patterns. Overall, the work contributes to advancing predictive frameworks for sustainable ecosystem management under changing climatic conditions.

How to cite: Bancheri, M., Basile, A., Yosef, B. A., Albrizio, R., Bonfante, A., Buonanno, M., Coppola, A., De Mascellis, R., and Hassan, S. B. M.: Process-Based Modelling of Climate Change Impacts on Soil–Water Services in Mediterranean Vineyard Soils, EGU General Assembly 2026, Vienna, Austria, 3–8 May 2026, EGU26-10557, https://doi.org/10.5194/egusphere-egu26-10557, 2026.

EGU26-10662 | ECS | Orals | BG3.8

Acorn availability reduces agricultural damage by ungulates 

Maria Bogdańska, Valentin Journé, and Michał Bogdziewicz

Human-wildlife conflicts, particularly the damage to agricultural crops caused by ungulates, pose significant ecological and economic challenges. Understanding the role of natural food availability in driving these conflicts is important for developing effective management strategies. We investigated how the pulsed availability of forest tree seeds, i.e., mast seeding, influences the extent of agricultural crop damage in Poland. Using a 19-year national dataset (2001-2020), we analyzed the relationship between oak Quercus spp. and European beech Fagus sylvatica seed production, the abundance of wild boar Sus scrofa and red deer Cervus elaphus, and the area of damaged agricultural crops. We found a negative relationship between oak seed production and the level of crop damage, with estimated damage decreasing by 30% from years of seed failure to years of abundant seed production, supporting the hypothesis that a diet shift occurs in ungulates during years of seed abundance that averts ungulates from damaging the crop. In contrast, beech seed production showed no significant effect on crop damage. Our findings demonstrate that pulsed resource dynamics in forests are an important driver of human-wildlife conflict in adjacent agricultural landscapes.

How to cite: Bogdańska, M., Journé, V., and Bogdziewicz, M.: Acorn availability reduces agricultural damage by ungulates, EGU General Assembly 2026, Vienna, Austria, 3–8 May 2026, EGU26-10662, https://doi.org/10.5194/egusphere-egu26-10662, 2026.

EGU26-11812 | Posters on site | BG3.8

From Solid Earth Observations to Global Action: The Role of Federated Research Infrastructure  

Federica Tanlongo, Carmela Freda, Rebecca Bendick, Tim Rawling, Elisabetta D'Anastasio, Helen Glaves, Lesley Wyborn, Gaetano Festa, Daniela Mercurio, Massimo Cocco, Rossana Paciello, Daniele Bailo, Jan Michalek, Otto Lange, Rebecca Farringhton, Elizabeth Abbot, and Jonathan Hanson

Supranational Research Infrastructures (RIs) play a crucial role in addressing the interconnected global challenges of climate change, biodiversity loss, pollution, clean energy, and disaster risk reduction, which cannot be effectively tackled through fragmented national or regional approaches alone. Earth Observation (EO) data and technologies, from satellite imagery to long-term in-situ observations and experimental facilities, are essential for monitoring environmental change, informing adaptation strategies, and supporting National Adaptation Plans (NAPs) and Nationally Determined Contributions (NDCs) under the 2016 Paris Agreement. However, the scientific and societal value of these data remains sub-optimal without coordinated governance, interoperable standards, and synchronised investment cycles across infrastructures and continents. Their true potential can only be realized when access is free, open, and ubiquitous, and when data are interoperable across disciplines, domains, sectors and borders.As a community dedicated to advancing Open Science and providing democratic, interoperable access to geoscientific data, European Plate Observing System (EPOS), contributes to and benefits from the broader ENVironmental Research Infrastructure (ENVRI) ecosystem Together with its global partners AuScope (Australia), EarthScope (USA), and Earth Sciences NZ, EPOS is working towards broadening its regional scope to realise the collective grand vision of a federated Global Research Infrastructure (GRI) for solid Earth sciences. This collaboration, grounded in the FAIR and CARE principles, , Open Science, and global equity, illustrates how international RIs can link regional platforms into a cohesive, interoperable system that accelerates discovery and delivers actionable knowledge for societal resilience.

Building on experiences within ENVRI collaborations, we identified key priorities for advancing global cooperation:

  • strengthening interoperability across heterogeneous scientific domains, through shared standards, protocols, and vocabularies, while respecting disciplinary specificities;
  • supporting international coordination mechanisms, such as the Group on Earth Observations (GEO), as enablers of voluntary yet impactful collaboration;
  • leveraging integrated EO and geoscientific data to support adaptation, sustainable resource management, and disaster prevention;
  • ensuring long-term sustainability, encompassing not only funding, but also digital infrastructure, data preservation, high-performance computing, connectivity, and skills development;
  • promoting inclusivity and equity, including support for lower-resourced regions and the application of CARE principles in Indigenous data governance.
  • Advocating with one voice the support from institutions, not only in terms of funding and sustainability, but also in facilitating these processes by simplifying and harmonising the regulatory conditions for data sharing.

Early Career Researchers (ECRs) are central to the sustainability and future impact of global research infrastructures. As the primary drivers of tomorrow’s science, ECRs must be empowered to work across disciplines, infrastructures, and regions and encouraged to play an active role in modeling the future of the discipline. Dedicated training initiatives, such as the EPOS Summer School, play a vital role in equipping them with skills in inter- and cross-disciplinary research and foster a new generation of globally connected researchers.

Investing in these priorities means moving from a culture of reaction to one of prevention, enabling decision makers at all levels, from global leaders to local communities, to act on reliable, science-based evidence and to foster global resilience in the face of climate change.

How to cite: Tanlongo, F., Freda, C., Bendick, R., Rawling, T., D'Anastasio, E., Glaves, H., Wyborn, L., Festa, G., Mercurio, D., Cocco, M., Paciello, R., Bailo, D., Michalek, J., Lange, O., Farringhton, R., Abbot, E., and Hanson, J.: From Solid Earth Observations to Global Action: The Role of Federated Research Infrastructure , EGU General Assembly 2026, Vienna, Austria, 3–8 May 2026, EGU26-11812, https://doi.org/10.5194/egusphere-egu26-11812, 2026.

EGU26-12015 | ECS | Orals | BG3.8

Northern high latitudes could become a net carbon source below 2°C global warming 

Rebecca M. Varney, Daniel Hooke, Norman J. Steinert, T. Luke Smallman, Camilla Mathison, and Eleanor J. Burke

Terrestrial ecosystems in the northern high latitudes have historically acted as a net carbon sink, mitigating anthropogenic CO2 emissions. However, the long-term stability of this net sink is uncertain due to complex carbon cycle feedbacks in response to future climate change. In this presentation, we will show how the PRIME framework can be used to probabilistically quantify if and when this region will transition from a net carbon sink to a carbon source in a range of plausible future climate scenarios (SSP1-2.6, SSP2-4.5, SSP5-8.5), including overshoot (SSP5-3.4-OS). PRIME incorporates the JULES land surface model, which can explicitly represent permafrost physics, dynamic vegetation, and fire, enabling the simulation of key high-latitude processes that remain uncoupled in most Earth system models. In a low emission scenario, permafrost carbon emissions are shown to increase the risk of a net carbon source by more 50% at 2°C of warming, and at greater levels of warming in high emission scenarios. Conversely, in all emission scenarios dynamic vegetation is found to limit the sink-to-source transition at all warming levels by enhancing the carbon sink. Fire emissions can further weaken the sink by reducing its resilience to warming. In the high temperature overshoot scenario, post-peak cooling leads to less favourable conditions for vegetation growth, limiting recovery of the carbon sink. These results highlight the dominant role of vegetation dynamics in regulating the strength and resilience of the Arctic terrestrial carbon sink under warming. They also emphasise the importance of representing coupled permafrost, vegetation, and fire processes in Earth system models to improve projections of land carbon–climate feedbacks across future climate trajectories.

How to cite: Varney, R. M., Hooke, D., Steinert, N. J., Smallman, T. L., Mathison, C., and Burke, E. J.: Northern high latitudes could become a net carbon source below 2°C global warming, EGU General Assembly 2026, Vienna, Austria, 3–8 May 2026, EGU26-12015, https://doi.org/10.5194/egusphere-egu26-12015, 2026.

EGU26-12051 | Posters on site | BG3.8

MICROBES-4-CLIMATE: Advancing climate change research using microbial resources 

Joseph Timkovsky, Michel Boer, Dalila Fernandes, Youssef Haidala, and Ana Portugal Melo

MICROBES-4-CLIMATE (M4C) is a Horizon Europe INFRASERV project. It aims to deepen the comprehension of the complex relationships among microorganisms, plants, and soil within the framework of Climate Change. By offering access to advanced Research Infrastructures, training, and assistance, the project seeks to encourage research tackling the multifaceted challenges presented by Climate Change to terrestrial biodiversity and ecosystems.

By exploring these interactions, M4C strives to advance the understanding and facilitate the applied research directed at enhancing the resilience of plants and crops to the effects of Climate Change, thereby fostering sustainable and resilient agricultural methods.

In this presentation, we will outline the structure of the project and demonstrate how it enables researchers from a wide range of countries to carry out research projects at cutting-edge facilities in the microbiological domain with a focus on climate change-related questions. M4C offers transnational access (TNA) to four distinct research infrastructures and 144 services spanning 20 countries. We will also highlight some of the available services and share selected research outcomes as the project progresses.

How to cite: Timkovsky, J., Boer, M., Fernandes, D., Haidala, Y., and Portugal Melo, A.: MICROBES-4-CLIMATE: Advancing climate change research using microbial resources, EGU General Assembly 2026, Vienna, Austria, 3–8 May 2026, EGU26-12051, https://doi.org/10.5194/egusphere-egu26-12051, 2026.

In a rapidly changing world, ecosystems are increasingly affected by a simultaneous rise in atmospheric CO2 concentrations, temperature and drought events. While the individual effects of these global change factors on ecosystems are comparatively well understood, there is a major lack of experimental studies examining their interactive effects. In a multifactor experiment (ClimGrass) established in 2013 on a managed montane grassland in Central Austria we tested how elevated CO2, warming and drought individually and interactively affect ecosystem processes underlying carbon, nutrient and water cycling.

This talk will present an overview of key findings from the ClimGrass experiment. Future climate conditions (3 °C warming and + 300 ppm atmospheric CO2) synergistically amplified drought effects on ecosystem CO2 and water fluxes, on plant growth and phenology as well as belowground carbon allocation. Non-additive effects of interacting global change factors were also observed for microbial communities and processes related to soil carbon and nitrogen cycling. Furthermore, future conditions altered the recovery of ecosystem fluxes from drought, and changed the dynamics of soil water retention and grassland water use. Overall, the findings from ClimGrass suggest that multiple interacting global change factors lead to complex non-additive effects with major consequences for ecosystem functioning in a future world.


How to cite: Bahn, M. and the ClimGrass-Team: Individual versus combined effects of elevated CO2, warming and drought on grassland functioning – synthesis from a multiyear experiment, EGU General Assembly 2026, Vienna, Austria, 3–8 May 2026, EGU26-12151, https://doi.org/10.5194/egusphere-egu26-12151, 2026.

EGU26-13660 | ECS | Orals | BG3.8

Wetland Restoration as a Nature-Based Climate Solution: Quantifying Methane Emissions and Climate Feedbacks 

Rebecca Wagner, James Weber, Etienne Fluet-Chouinard, Peter Hopcroft, David Beerling, and Maria Val Martin

Limiting future global warming and achieving net zero emissions will require significant reductions in greenhouse gas (GHG) emissions alongside deployment of nature-based carbon dioxide (CO2) removal strategies. However, warming-induced emissions from natural ecosystems can introduce positive climate feedbacks that diminish mitigation potential and reduce the remaining carbon budget. Wetlands are a key example of this challenge. While wetland restoration is widely proposed as a nature-based climate solution as it can enhance CO2 sequestration, wetlands are also the largest natural source of methane (CH4), a potent GHG and key driver of atmospheric chemistry. Rising temperatures may amplify wetland CH4 emissions, offsetting CO2 uptake from restoration efforts and resulting in positive climate feedbacks, with potential implications for air quality and Earth system stability. Quantifying these feedbacks is critical for evaluating the net climate effectiveness of wetland-based mitigation. 

In this work, we investigate how large-scale global wetland restoration affects future CH4 emissions, atmospheric composition and climate under two warming pathways. Using historically reconstructed wetland areas, we develop two global wetland scenarios: protection of current wetlands, and restoration to 1900 coverage by 2050 with protection thereafter. Wetland CH4 emissions are estimated using an offline emission scheme driven by soil respiration and temperature outputs from eight CMIP6 Earth System Models under SSP1-2.6 (2°C warming and lower air pollution) and SSP3-7.0 (4°C warming and higher air pollution). These emissions are implemented in a CH4 emission-driven version of the UK Earth System Model (UKESM) to simulate responses in atmospheric CH4 mixing ratio, oxidising capacity and air quality. Associated climate impacts are evaluated by quantifying changes in the net GHG balance and radiative forcing, accounting for carbon sequestration and avoided drained emissions.

We find that wetland restoration amplifies warming-driven CH4 emissions, by 57% (91 Tg yr-1)  under SSP3-7.0 and by 30% (48 Tg yr-1) under SSP1-2.6 by 2100. In comparison, protecting wetlands at current levels leads to smaller increases (33% and 11%, respectively). As a result of enhanced CH4  emissions, wetland restoration increases atmospheric CH4 mixing ratios by approximately 100 ppb under SSP1-2.6 and 145 ppb under SSP3-7.0. While global impacts on air pollutants such as ozone and particulate matter are small, more substantial regional impacts may have implications for human health. Our results provide a comprehensive assessment of wetland restoration as a climate strategy under future warming, highlighting its potential to deliver net-zero goals while also identifying important trade-offs and implications for mitigation and policy.

How to cite: Wagner, R., Weber, J., Fluet-Chouinard, E., Hopcroft, P., Beerling, D., and Val Martin, M.: Wetland Restoration as a Nature-Based Climate Solution: Quantifying Methane Emissions and Climate Feedbacks, EGU General Assembly 2026, Vienna, Austria, 3–8 May 2026, EGU26-13660, https://doi.org/10.5194/egusphere-egu26-13660, 2026.

EGU26-13963 | ECS | Orals | BG3.8

Towards Globally Harmonized Environmental Data: a Proof of Concept Using Ecological Drought Data and the Global Ecosystem Research Infrastructure (GERI) Framework 

Krutika Deshpande, Benjamin L. Ruddell, Christine Laney, Henry W. Loescher, Michael SanClements, and Cedric J. Hagen and the GERI Team

Addressing global environmental challenges such as drought and climate change requires environmental analyses at a global scale, yet data from different sources remain fragmented and decentralized. While individual Research Infrastructures (RIs) effectively monitor ecosystems at national and continental scales, global environmental research requires more collaboration to bring these data together. The Global Ecosystem Research Infrastructure (GERI) addresses this gap by bringing together six major RIs: National Ecological Observatory Network (NEON)/USA, Terrestrial Ecosystem Research Network (TERN)/Australia, Integrated Carbon Observing System (ICOS)/Europe, European Long-Term Ecosystem, critical zone and socio-ecological systems Research Network (eLTER)/Europe, South African Environmental Observation Network (SAEON)/South Africa, Chinese Ecosystem Research Network (CERN)/China, that span five continents, and distributed among >1600 observational sites globally. 
Harmonizing data at a large scale presents multiple challenges, including data availability, differing measurement protocols, formats, scales, and data delivery mechanisms. In addition, an effort of this scale requires a strong foundation of collaboration, communication, and governance, particularly across international geo-political boundaries and networks-of-networks. Using ecological drought as a use case example, GERI has developed a harmonization framework and cyberinfrastructure workflow that advances the data harmonization at a global scale, supports FAIR and open science, and is adaptable to other similar efforts. Environmental variables central to ecological drought, such as precipitation, soil moisture, and soil temperature, are widely measured across regions but may vary substantially in semantics and processing. GERI’s framework uses cross-walk tables and templates to align these variables in a standardized manner. Current harmonized datasets integrate observations from more than 130 sites, providing a basis for global-scale synthesis and comparative drought analyses.
Here, we present the data harmonization methods, challenges, and lessons learned from this effort. Moving forward, we aim to adapt this framework for other key ecological variables. We also plan to use AI tools to resolve current bottlenecks in workflows, data quality and metadata management. These efforts are intended to further support collaborative, global-scale environmental research through GERI.

How to cite: Deshpande, K., L. Ruddell, B., Laney, C., W. Loescher, H., SanClements, M., and J. Hagen, C. and the GERI Team: Towards Globally Harmonized Environmental Data: a Proof of Concept Using Ecological Drought Data and the Global Ecosystem Research Infrastructure (GERI) Framework, EGU General Assembly 2026, Vienna, Austria, 3–8 May 2026, EGU26-13963, https://doi.org/10.5194/egusphere-egu26-13963, 2026.

The FLUXNET network is a bottom-up initiative built on collaboration among research infrastructures (RIs), regional networks of varying levels of organization, and individual stations and scientists. Its goal is to provide access to unique, direct measurements of carbon, water, and energy exchanges between ecosystems and the atmosphere.

Thanks to the efforts of globally distributed RIs and established regional networks, we are entering a new era of FLUXNET, marked by strengthened collaboration, improved data accessibility, high levels of standardization, and a common data license. Developing this shared data processing and distribution system—based on decentralized yet coordinated data management—has been complex, but it has resulted in a robust framework that meets user expectations and ensures the stability and continued development of the new FLUXNET system.

This presentation will introduce the largest-ever collection of continuous (24/7) flux measurements from around the world, all publicly accessible. It will focus on the key aspects developed through collaboration across different regional networks, as well as on the lessons learned that can be directly applied to inter-RI collaboration, including within the GERI framework. Remaining critical challenges will also be discussed to stimulate further dialogue.

The networks and RIs involved include AmeriFlux, ChinaFlux, the European Flux Database, ICOS, eLTER, JapanFlux, KoFlux, OzFlux, SAEON, and TERN, in addition to many smaller networks and individual contributors.

How to cite: Papale, D. and the The FLUXNET Community: A Revolutionary Step Forward in Ecosystem Research Infrastructure Collaboration: The FLUXNET System , EGU General Assembly 2026, Vienna, Austria, 3–8 May 2026, EGU26-14718, https://doi.org/10.5194/egusphere-egu26-14718, 2026.

Climate change–induced sea-level rise and the increasing frequency of extreme storm surges are placing increasing demands on coastal protection systems worldwide. Although conventional hard-engineering approaches have served as the primary means of coastal defence, their ecological constraints and long-term sustainability issues have become more apparent. In response, Coastal Green Infrastructure (CGI) has been explored as a nature-based approach that makes use of existing coastal features to reduce hazard exposure. In this study, we conduct a national-scale assessment of CGI potential along the coast of South Korea, where coastal form and environmental conditions differ markedly between regions.

The analytical framework applied here is organised around two dimensions: Protective Benefit and Environmental Vulnerability. Together, these dimensions reflect both the capacity of coastal ecosystems to attenuate physical processes and their exposure to long-term environmental change. Six indicators were selected to represent these characteristics, including coastal landforms (tidal flats, dunes, and beaches), the distribution of blue carbon vegetation such as seagrass and salt marshes, topographic relief, wave energy conditions, and projected sea-level rise. A GIS-based analysis using a 250 m grid resolution was employed to classify the national coastline into four management types, with the aim of supporting region-specific rather than uniform coastal policies.

The results indicate a clear regional contrast in CGI suitability. The West Coast (Yellow Sea), characterised by extensive tidal flats, exhibits relatively high protective capacity and low vulnerability, leading to the highest suitability classification (Type 1). By comparison, the East Coast and Jeju Island are dominated by steeper coastal profiles and higher wave energy, which limit the effectiveness of CGI when applied in isolation. In such high-energy environments, CGI is more appropriately implemented as part of a hybrid approach in combination with existing structural measures. Areas classified as Type 1 account for approximately 47.6% of South Korea’s total coastline, suggesting that a substantial proportion of the national coast may be suitable for CGI-focused management under current conditions.

How to cite: Kim, C. W. and Jung, J.: Strategic Spatial Prioritization of Coastal Nature-Based Solutions: A Multi-Criteria Assessment of Protective Capacity and Vulnerability along the South Korean Shoreline, EGU General Assembly 2026, Vienna, Austria, 3–8 May 2026, EGU26-15053, https://doi.org/10.5194/egusphere-egu26-15053, 2026.

Understanding and responding to global environmental change requires coordinated, long-term ecosystem observations and shared analytical capabilities that transcend national boundaries. This presentation explores how national research infrastructure initiatives can use systematic community engagement to identify emerging research priorities and align them with both national and global infrastructure planning, using Australia’s Terrestrial Ecosystem Research Network (TERN) Research Directions 2025–2035 Survey as a case study.

The survey engaged 181 researchers, practitioners and leaders across ecology, agriculture, climate science, data science and conservation, yielding over 300 distinct research questions spanning fundamental ecosystem processes, restoration strategies and landscape-scale management challenges.

Analysis revealed strong convergence around several critical themes: climate adaptation and resilience, biodiversity monitoring and conservation, ecosystem restoration trajectories, carbon cycling and climate mitigation, soil health and degradation, and the integration of traditional ecological knowledge and Western knowledge systems.

Importantly, respondents highlighted growing needs for cross-disciplinary collaboration, multi-scale observation systems linking plot-based monitoring with continental remote sensing, advanced analytical capabilities including machine learning and predictive modelling, and improved data integration across spatial and temporal scales. These findings reflect broader global trends in ecosystem science where research questions increasingly demand coordinated infrastructure investment beyond what individual nations can provide.

The TERN experience demonstrates how research infrastructure networks like the Global Ecosystem Research Infrastructure (GERI) can facilitate systematic horizon scanning to identify shared priorities, develop interoperable data systems and methodologies, coordinate observational capabilities across biogeographic gradients, and build collaborative analytical platforms that serve international research communities.

By aligning national infrastructure investments with community-identified priorities and fostering international collaboration, research infrastructure networks can more effectively address complex, multi-scale environmental challenges while maximising returns on public investment in ecosystem observation and analysis capabilities.

How to cite: Ceron, I. and Morris, B.: Community-Identified Priorities as Drivers of National and Global Ecosystem Research Infrastructure Planning, EGU General Assembly 2026, Vienna, Austria, 3–8 May 2026, EGU26-15155, https://doi.org/10.5194/egusphere-egu26-15155, 2026.

EGU26-15842 | Posters on site | BG3.8

Warming-induced CO₂, CH₄ and N₂O emissions from land ecosystems and wildfire feedbacks simulated by the Dynamic Land Ecosystem Model (DLEM) 

Shufen Pan, Naiqing Pan, Xinyi Yang, Xing Yu, Wensu Hao, Yuchun Zhang, Chris Jones, Ben Poulter, Pep Canadell, and Hanqin Tian

Climate warming can trigger additional greenhouse gas (GHG) emissions from terrestrial ecosystems, thereby amplifying climate change through positive biogeochemical feedbacks. Quantifying the magnitude, mechanisms, and spatial heterogeneity of these warming-induced emissions remains a major source of uncertainty in projections of the remaining carbon budget. In this study, we use the Dynamic Land Ecosystem Model (DLEM), a participating model in the Warming-Induced Emissions Model Intercomparison Project (WIE-MIP), to quantify warming-induced emissions of carbon dioxide (CO₂), methane (CH₄), and nitrous oxide (N₂O), and to assess the role of climate-driven changes in wildfire activity following the standardized WIE-MIP protocol.

We analyze ensemble simulations driven by two general circulation models under five climate scenarios, including one idealized pathway, three temperature-overshoot scenarios, and one unmitigated high-warming pathway. These simulations allow us to disentangle the responses of terrestrial carbon storage, ecosystem productivity, microbial processes, and wildfire dynamics to varying levels and trajectories of warming.

Our results indicate that climate warming leads to a substantial net loss of terrestrial carbon, dominated by enhanced soil organic matter decomposition and ecosystem respiration, which outweigh gains from increased plant productivity. Warming also strongly intensifies wildfire activity, increasing fire frequency, burned area, and fire intensity across multiple regions. These changes generate large additional pulses of CO₂, CH₄, and N₂O from biomass combustion and post-fire ecosystem recovery. In parallel, higher temperatures stimulate microbial processes that enhance CH₄ emissions from wetlands and N₂O emissions from agricultural and natural soils.

Together, emissions from terrestrial ecosystems, wetlands, soils, and wildfires form a strong positive climate feedback that amplifies with increasing warming. Spatial hotspots emerge in high-latitude regions, fire-prone landscapes, tropical wetlands, and intensively managed agricultural areas. These warming-induced feedbacks substantially tighten the remaining carbon budget and underscore the importance of explicitly representing coupled biogeochemical and disturbance processes in Earth system projections.

How to cite: Pan, S., Pan, N., Yang, X., Yu, X., Hao, W., Zhang, Y., Jones, C., Poulter, B., Canadell, P., and Tian, H.: Warming-induced CO₂, CH₄ and N₂O emissions from land ecosystems and wildfire feedbacks simulated by the Dynamic Land Ecosystem Model (DLEM), EGU General Assembly 2026, Vienna, Austria, 3–8 May 2026, EGU26-15842, https://doi.org/10.5194/egusphere-egu26-15842, 2026.

EGU26-16041 | ECS | Orals | BG3.8

Quantifying responses of CO2 and CH4 fluxes in a subarctic dry tundra ecosystem to summer warming and snow accumulation 

Bingqian Zhao, Wenxin Zhang, Shushi Peng, Peiyan Wang, and Bo Elberling

The Arctic is experiencing rapid warming and changing precipitation regimes. However, the overall impact of climate change on greenhouse gas fluxes remains uncertain in subarctic dry tundra ecosystems, which frequently experience drought. Since 2012, field experiments manipulating summer warming and snow accumulation have been conducted in a dry tundra in western Greenland. Here, we combined long-term experimental observations with process-based models (CoupModel and an analytical reaction-based model) to assess the impacts of summer warming and snow accumulation on CO2 and CH4 fluxes.

Model simulations successfully reproduced the observed seasonal and interannual variability of CO2 and CH4 fluxes. The ecosystem functioned as a net CO2 source and a net CH4 sink from 2014 to 2020. Over the studied period, summer warming enhanced CH4 uptake and reduced net CO2 emissions, leading to a decrease in the overall carbon balance. These responses were mainly driven by increased soil temperature and reduced soil moisture during the growing season. In contrast, increased snow accumulation has an adverse impact on the carbon balance, primarily due to the cooler and wetter soil during the early growing season. Importantly, drought suppressed the cooling effect induced by warming and amplified carbon losses associated with enhanced snow accumulation. This study suggests that future drought could undermine carbon sequestration and methane uptake under a warmer and wetter climate, thereby strengthening positive climate-carbon feedback.

How to cite: Zhao, B., Zhang, W., Peng, S., Wang, P., and Elberling, B.: Quantifying responses of CO2 and CH4 fluxes in a subarctic dry tundra ecosystem to summer warming and snow accumulation, EGU General Assembly 2026, Vienna, Austria, 3–8 May 2026, EGU26-16041, https://doi.org/10.5194/egusphere-egu26-16041, 2026.

EGU26-16113 | ECS | Posters on site | BG3.8

Global lake CH4 emissions (1980-2023) simulated using the process-based model-LAKE2.6 

Xinyu Li, Shushi Peng, Victor M. Stepanenko, Liu Liu, and Dan Zhu

While lakes play an important role in the global methane (CH4) budget, the present meta-analysis based global estimates produce large uncertainties (16.5 to 185 Tg CH4 yr-1), which were often due to lacking sufficient geographical and spatiotemporal representations. To address these uncertainties, we applied a one-dimensional process-based CH4 emission model (LAKE2.6) to simulate global lake CH4 emissions. We first calibrated the model in 10 temperate lakes and 5 tropical (24 °S–24 °N) lakes with continuous flux observations covering from 2 months to 8 years, and then proposed a new parameterization scheme for global lake CH4 simulation based on site-level calibrations. For global model validation, flux observations in 155 lakes from temperate and boreal regions and 21 lakes from tropical regions were collected, ranging in depth from 0.1 to 572 m and in size from 6 m2 to 67,075 km2. We found that 85% of temperate and boreal lakes and 38% of tropical lakes exhibited simulated similar CH4 fluxes to observations, with biases of < ±50%. Based on these model calibration and validation results, we developed a global parameterization framework and applied it to simulate global lake CH4 emissions. Our estimates indicate that lakes emitted 17.7–20.1 Tg CH4 yr-1 during the period 1979–2023, showing an increasing trend of 0.02 Tg CH4 yr-2. This approach enhances the reliability of model performance when extrapolating from site-level measurements to global-scale estimates, thereby improving our ability to assess historical and future changes in global lake CH4 emissions.

How to cite: Li, X., Peng, S., Stepanenko, V. M., Liu, L., and Zhu, D.: Global lake CH4 emissions (1980-2023) simulated using the process-based model-LAKE2.6, EGU General Assembly 2026, Vienna, Austria, 3–8 May 2026, EGU26-16113, https://doi.org/10.5194/egusphere-egu26-16113, 2026.

EGU26-17054 | ECS | Posters on site | BG3.8

Identifying Core Indicators to Monitor Deforestation and Restoration Trends in South Korea Island Ecosystems 

Wonhee Cho, Byungwoo Chang, Sinyoung Park, Sanae Kang, Chanwoo Ko, and Dongwook W. Ko

  Island regions serve as critical ecological functions, maintaining unique biodiversity and endemic species. Due to their geographical isolation, island ecosystems are exceptionally vulnerable to external anthropogenic and natural disturbances, including overgrazing by wildlife and feral livestock, land-use changes, and the impacts of climate change. By this susceptibility, establishing precise quantification and configuration of deforestation and restoration are essential for the sustainable management of island regions. This study aims to identify and validate core remote sensing indicators capable of detecting long-term deforestation and restoration efforts across diverse island landscapes in South Korea.

  A comprehensive island library of deforestation and recovery was constructed by synthesizing historical literature and field reports. This library contains a list of deforestation and restoration islands, disturbance types, and disturbed periods. To evaluate spatio-temporal dynamics in island landscape, we utilized multi-temporal satellite imagery and estimated three indicators to represent the vital and biophysical conditions of island ecosystems: Normalized Difference Vegetation Index (NDVI), Soil-Adjusted Vegetation Index (SAVI), Inverted Tasseled Cap Wetness-Greenness Difference (TCWGDinv).

  The analytical framework employed Sen’s slope to determine the magnitude of monotonic trends in each indicators, to provide a robust rate of degradation or recovery over time. To ensure the statistical significance, the Mann-Kendall trend test was conducted, allowing for a rigorous spatial assessment of areas undergoing significant ecological dynamics. The study focused on four representative island sites: Two island sites, Guleop-do island and Anma-do island, damaged from the intense browsing by the ungulate, one island site, Geoje-do island, damaged by pests, and one active restoration site, Wonsan-do island.

  All three indicators consistently detected significant decreasing trends in deforestation areas, effectively quantifying the reduction of vital of tree species. In the restoration site, NDVI and SAVI showed increased trends over time, efficiently detecting successful restoration. However, TCWGDinv demonstrated inverse trend, likely due to the high ambient soil moisture characteristics inherent to island regions.

  This study demonstrates that while the integration of these three indicators provides a useful tool for monitoring forest degradation and quantifying damage, the application of moisture-based indices like TCWGDinv for assessing restoration requires careful calibration according to site-specific environmental variables. These results provide a scientific foundation for developing optimized, data-driven strategies for the long-term conservation and ecological restoration of vulnerable island forest ecosystems. 

How to cite: Cho, W., Chang, B., Park, S., Kang, S., Ko, C., and Ko, D. W.: Identifying Core Indicators to Monitor Deforestation and Restoration Trends in South Korea Island Ecosystems, EGU General Assembly 2026, Vienna, Austria, 3–8 May 2026, EGU26-17054, https://doi.org/10.5194/egusphere-egu26-17054, 2026.

EGU26-17288 | ECS | Orals | BG3.8

Improving understanding on forest functions under climate change and management with modular process-based model pyAPES v1.0 

Olli-Pekka Tikkasalo, Kersti Leppä, Jari-Pekka Nousu, Antti-Jussi Kieloaho, and Samuli Launiainen

Forests are under high pressure due to anthropogenic activity and climate change. Understanding how these phenomena influence soil-plant-atmosphere continuum is important for ensuring sustainable management now and in the future. Process-based modelling combined with data assimilation enables developing a comprehensive understanding on how individual processes influence ecosystems and services they provide. Such approaches are essential for capturing the complexity of interactions that govern water, carbon and energy fluxes across spatial and temporal scales.

pyAPES is a multi-layer, multi-species process-based model designed to simulate the soil-plant-atmosphere continuum. It enables analysis of how changes in environmental conditions, plant traits, or stand structure influence microclimate, leaf gas exchange and ecosystem level fluxes. Over the past decade pyAPES has been widely applied in studies investigating how anthropogenic activity and climate variability affect forest processes at multiple scales. Recent developments have greatly improved model usability, making it a versatile and accessible tool for addressing emerging research questions on ecosystem functions.

In this work, we present recent advances in pyAPES that enhance usability and extend capabilities for simulating forest ecosystem processes. We demonstrate pyAPES applications at experimental sites, exploring how forest management and climate change influence stand microclimate, water transport and carbon fluxes. We also show how the modular architecture lets researchers tailor the model for their research needs without the need to learn or execute the full model and how accessible code, documentation and tutorials support practical implementation.

How to cite: Tikkasalo, O.-P., Leppä, K., Nousu, J.-P., Kieloaho, A.-J., and Launiainen, S.: Improving understanding on forest functions under climate change and management with modular process-based model pyAPES v1.0, EGU General Assembly 2026, Vienna, Austria, 3–8 May 2026, EGU26-17288, https://doi.org/10.5194/egusphere-egu26-17288, 2026.

EGU26-17503 | Orals | BG3.8

Process-Based Modeling of Lysimeter Boundary Conditions for Climate Change Experiments in Ecotron Facilities 

Harrie-Jan Hendricks Franssen, Murilo Viana, Bibi Naz, Holger Pagel, Michael Herbst, Andrea Schnepf, Daniel Leitner, Jannis Groh, Harry Vereecken, Jan Vanderborght, and Nicolas Brüggemann

Ecotron facilities are key tools to emulate and monitor environmental conditions for improving the understanding of terrestrial ecosystems. Although their conditions can be precisely modified by cutting-edge controlling systems, the external factors influencing the boundary conditions of such ecotron units remain uncertain under reconstructed scenarios (e.g., climate change). We assessed how an agroecosystem model can be used to simulate the bottom boundary conditions of the newly developed ecotron facility AgraSim. The facility comprises six identical ecotron units composed of a climate-controlled plant chamber on top of a cylindrical lysimeter (1 m2 by 150 cm depth). An automatic suction cup–pumping system installed below each lysimeter is used to control the bottom boundary condition of the system depending on the measured pressure head near its bottom. The first experimental trial of AgraSim is aimed to quantify the key climate responses of a typical agricultural field located in North-Rhine Westphalia (Germany) to transient climate change. A set of four climate scenarios were derived from storyline simulations with the regional atmospheric circulation model ICON, imposing a transient temperature gradient of +1oC to +4oC within the climate chambers. While the atmospheric forcings and the soil texture and hydraulic properties are well-characterized, the bottom boundary condition at 150 cm depth is unknown for the different climate change scenarios. We thus used an agroecosystem model (AgroC) to numerically solve water movement within the soil column (0-150 cm) and investigated the impact of choosing one of the following bottom boundary conditions: fixed pressure heads (FP); free-drainage (FD); and a modified seepage face at h=-100hPa (SP). A simulation that assumes a 500 cm deep soil column and free drainage was taken as a reference for assessing the performance of each of the different bottom boundary conditions. This setup was replicated for two rainfed cropping systems (winter wheat and maize), each parameterized with three types of rooting profile representing shallow, deeper and homogeneous root profiles, respectively. A 1-year spin-up run was performed to minimize the effect of the initial conditions. Our model simulations showed that the different boundary conditions only affected soil moisture below 30 cm, while topsoil moisture was mainly controlled by atmospheric forcings. The FP and FD scenarios tended to underestimate soil water availability in the 150 cm column, especially during critical summer drought periods. The modified SP showed the best agreement with the reference simulations, keeping the soil unsaturated during winter and maintaining moisture and fluxes closer to the reference levels in summer. This result was consistent across both crops and rooting profiles. At the crop level, the different boundary conditions had no significant effect on key crop variables (e.g., biomass and leaf area) and their respective response to the climate scenarios. Although our results are limited by observation availability and model parameterization uncertainty, they demonstrate the potential application of process-based models for decision-making in controlled-system facilities.

How to cite: Hendricks Franssen, H.-J., Viana, M., Naz, B., Pagel, H., Herbst, M., Schnepf, A., Leitner, D., Groh, J., Vereecken, H., Vanderborght, J., and Brüggemann, N.: Process-Based Modeling of Lysimeter Boundary Conditions for Climate Change Experiments in Ecotron Facilities, EGU General Assembly 2026, Vienna, Austria, 3–8 May 2026, EGU26-17503, https://doi.org/10.5194/egusphere-egu26-17503, 2026.

EGU26-17513 | Posters on site | BG3.8

The Castelporziano Super Site: a cross-research infrastructure integration of ICOS, LifeWatch and eLTER observatory for terrestrial ecosystems restauration 

Gabriele Guidolotti, Michele Mattioni, Paolo Sconocchia, Simone Sabbatini, Giacomo Nicolini, Adriana Mariotti, Dora Cimini, Giulia Bonella, Riccardo Salvati, Giorgio Matteucci, Francesco Mazzenga, Emiliano Mori, Leonardo Ancillotto, Olivia Dondina, Anjali Thapa, Giuseppe Scarascia Mugnozza, Alberto Basset, Carlo Calfapietra, and Dario Papale and the Technical Team

Global changes and biological invasions are probably the main causes of forest ecosystem degradation, negatively affecting all the ecosystem services they provide us. At the Castelporziano Presidential Estate, a 6000 km2 sout west of Rome (Italy), the combined attack of two invasive pests, Toumeyella parvicornis (Cockerell) and Tomicus destruens (Wollaston), has led in less than six years to the complete destruction of more than 600 ha of mostly monospecific stone pine (Pinus pinea L.) stands. The death and subsequent felling of the pine trees opened up vast areas that made it possible to test and compare different approaches to ecosystem recovery in an integrated manner, including active reforestation and passive natural evolution.

This opportunity has been fully exploited for the first time thanks to the coordinated and synergistic action of three European research infrastructures: ICOS, LifeWatch and LTER. Thanks to a joint effort made possible by the ITINERIS project, three new integrated monitoring plots have been implemented, two of which represent a post-pine forest restoration option, while the other two (one ICOS site already existed) represent two mature deciduous and evergreen oak forest ecosystems. Together, these plots create a true inter-infrastructural super-site for the study of terrestrial ecosystems. Each plot is equipped with an eddy covariance system for continuous measurements of CO₂, water and energy exchanges, ensuring high-resolution quantification of ecosystem–atmosphere fluxes. At the same time, the integration with LifeWatch and LTER frameworks enables long-term, multi-trophic ecological monitoring, including vegetation dynamics, soil properties, nutrient cycles and biodiversity which play a key role in ecosystem functioning and recovery processes. The Castelporziano supersite clearly demonstrates the added value of integrating research infrastructures operating on the biosphere, as no single infrastructure would have had the strength and expertise to offer this level of observational depth, temporal continuity and ecological breadth on its own. The resulting dataset provides and will continue to provide a solid basis for evaluating restoration strategies from multiple perspectives, including carbon sequestration, water balance, biodiversity and ecosystem resilience.

How to cite: Guidolotti, G., Mattioni, M., Sconocchia, P., Sabbatini, S., Nicolini, G., Mariotti, A., Cimini, D., Bonella, G., Salvati, R., Matteucci, G., Mazzenga, F., Mori, E., Ancillotto, L., Dondina, O., Thapa, A., Scarascia Mugnozza, G., Basset, A., Calfapietra, C., and Papale, D. and the Technical Team: The Castelporziano Super Site: a cross-research infrastructure integration of ICOS, LifeWatch and eLTER observatory for terrestrial ecosystems restauration, EGU General Assembly 2026, Vienna, Austria, 3–8 May 2026, EGU26-17513, https://doi.org/10.5194/egusphere-egu26-17513, 2026.

EGU26-18354 | Orals | BG3.8

The South African Environmental Observation Network (SAEON): A long-term research facility supporting environmental science in the terrestrial, coastal, marine and polar domains for a sustainable society.   

Thomas Bornman, Gregor Feig, Ryan Blanchard, Leo Chiloane, Juliet Hermes, Sue Janse van Rensburg, Zanele Ntshidi, Tony Swemmer, and Kogie Govender

The South African Environmental Observation Network is a South African national research facility dedicated to developing long-term environmental research infrastructure platforms to support environmental science for a sustainable society. Operating across terrestrial, coastal and marine domains, SAEON integrates in situ observations, models, long-term experiments and data systems to monitor biophysical and ecological processes at a diverse array of sites, representing the range of ecosystem and social contexts in South Africa at multiple spatial and temporal scales. This coordinated, multidimensional observation and data management capability supports critical insights into climate variability, biodiversity dynamics, land-use impacts, and land-atmosphere-ocean interactions. SAEON provides open-access, high-quality datasets that are interoperable with international partners, and that underpin scientific analysis and assessments that are relevant for policy. SAEON plays a strategic role within both national and international research communities. Its infrastructure contributes to continental and global observation systems by providing platforms in data-scarce regions, strengthening predictive modelling capacity through datasets for model parameterisation and verification, and supporting environmental risk assessment and sustainability planning. As a research infrastructure platform, SAEON supports collaboration among universities, government agencies, research councils, and international partners, enabling comparative studies and harmonised data. Its data stewardship and open-access platforms enhance transparency, reproducibility, and equitable knowledge sharing. In addition to the direct support for research, SAEON actively develops research capacity in South Africa by supporting students, training emerging scientists, supporting science education and data literacy. SAEON actively participates in numerous environmental research infrastructure networks through active collaboration and continuous alignment. This presentation will highlight how SAEON’s long-term observations, accessible data, collaborative networks, and capacity-building activities in a data and capacity-limited region are a critical contributor to global environmental research efforts supporting informed decision-making for a sustainable society.     

How to cite: Bornman, T., Feig, G., Blanchard, R., Chiloane, L., Hermes, J., Janse van Rensburg, S., Ntshidi, Z., Swemmer, T., and Govender, K.: The South African Environmental Observation Network (SAEON): A long-term research facility supporting environmental science in the terrestrial, coastal, marine and polar domains for a sustainable society.  , EGU General Assembly 2026, Vienna, Austria, 3–8 May 2026, EGU26-18354, https://doi.org/10.5194/egusphere-egu26-18354, 2026.

EGU26-18488 | Orals | BG3.8

AnaEE ERIC: Advancing Experimental Ecosystem Research through Aligned Research Infrastructures 

Dorra Gharbi, Adriano Palma, Biljana Đorđević, and Michel Boër

Addressing global environmental change requires coordinated, large-scale experimentation and analysis across diverse ecosystems. AnaEE ERIC (Analysis and Experimentation on Ecosystems European Research Infrastructure Consortium) provides a pan-European network of experimental and analytical facilities, including enclosed ecotrons and open-air platforms, covering agricultural, forest, freshwater, and peatland ecosystems across a wide range of climates. These facilities enable controlled manipulation of key ecosystem drivers, such as drought, flooding, elevated CO₂, temperature, nitrogen fluxes, and species migration, and support testing of nature-based solutions, including innovative farming and agroforestry practices.

Successful examples from AnaEE ERIC include multi-site experiments on ecosystem responses to drought and warming, as well as mechanistic studies of carbon and nutrient cycling in controlled ecotron facilities. Challenges encountered involve harmonising experimental protocols across facilities, integrating heterogeneous datasets, and scaling site-specific results to regional or European levels. To address these issues, AnaEE ERIC is progressively strengthening shared digital services, including standardised data catalogues and API-based access to data and models, enabling interoperable workflows and cross-platform use of experimental outputs.

Recommendations derived from the AnaEE ERIC experience emphasise the standardisation of protocols, the development of interoperable data platforms, and training programs to enhance cross-facility collaboration. This approach demonstrates how networked experimental infrastructures, supported by AnaEE ERIC, generate actionable knowledge, foster collaboration across disciplines, and inform both science and policy in the context of global environmental change.

How to cite: Gharbi, D., Palma, A., Đorđević, B., and Boër, M.: AnaEE ERIC: Advancing Experimental Ecosystem Research through Aligned Research Infrastructures, EGU General Assembly 2026, Vienna, Austria, 3–8 May 2026, EGU26-18488, https://doi.org/10.5194/egusphere-egu26-18488, 2026.

EGU26-18608 | Orals | BG3.8

Strengthening EU-US Cooperation towards a Sustainable Global Atmospheric Research Infrastructure: Key achievements from CARGO-ACT 

Sabine Philippin, Elisabeth Andrews, Giri Prakash, Tuukka Petäjä, James Mather, Markus Fiebig, Honey Alas, Alfred Wiedensohler, Doina Nicolae, Anca Nemuc, Martial Haeffelin, Lucia Mona, Rosa Maria Petracca Altieri, Martine De Mazière, Olga Mayol-Bracero, Jasper Lewis, Nga Lee (Sally) Ng, Mikhail Paramonov, and Ewan O'Connor

Harmonized observations of aerosols, clouds and trace gases with global coverage are essential for advancing weather prediction, climate science and air quality research. They support model development and simulation and enable the calibration and validation of current and future satellite missions. While major ground-based research infrastructures (RIs) and observational networks have been developed in Europe and the United States (US) with long-term perspectives [1], their global integration remains fragmented. This is primarily due to differences in governance and access mechanisms, and to a lesser extent to operational practices and data policies. The Horizon Europe project CARGO-ACT [2] addresses these challenges by developing a roadmap for sustainable global cooperation among key atmospheric RIs, with the long-term vision of building a sustainable and coherent international framework.

As proof of concept, CARGO-ACT evaluated the consistency and compatibility of data, operations, governance and access mechanisms for aerosol in-situ and remote sensing networks in the US (DOE/ARM, NASA/MPLNET, NOAA/GML, ASCENT) [3] and Europe (ACTRIS [4]). By bringing together network leaders and leading experts, the project promotes convergence towards interoperability and FAIR principles between ACTRIS and its US counterparts through a common data management framework and aligned data policies. Scientific robustness and comparability are addressed through the development of harmonised operating procedures, calibration strategies, and data quality methodologies, providing a solid basis for mutual trust, reproducibility and long-term sustainability of global observations.

As a concrete demonstration of data interoperability, the US Department of Energy’s Atmospheric Radiation Measurement (ARM) program enabled bi-directional metadata exchange by harvesting and indexing metadata from CARGO-ACT participants (such as ACTRIS) within the ARM data portal, and by providing ARM metadata APIs to support discovery and reuse of relevant ARM datasets by the ACTRIS data portal. Another outcome of the project is the ongoing revision of the WMO/GAW report on in-situ measurements [5], led by CARGO-ACT participants. In tandem with the technical aspects, CARGO-ACT proposes strategies for coordinating governance and aligning global objectives through structured stakeholder engagement and mechanisms to support cooperation across diverse scientific priorities. The project delivers strategic recommendations for sustainable international access to global atmospheric RIs, advocating policy alignment, legal and organisational flexibility, sustainable financial and operational models, and effective coordination platforms. The CARGO-ACT approach is applicable across multiple measurement variables and observational networks.

Overall, CARGO-ACT demonstrates that sustainable global cooperation in atmospheric research is not only technically feasible but strategically essential. In the context of global environmental challenges that extend beyond national and continental boundaries, strengthened international cooperation is a prerequisite for ensuring resilient, interoperable and globally coherent observing systems capable of supporting science, policy, and society in the long run.


[1] https://doi.org/10.1175/AMSMONOGRAPHS-D-15-0045.1

[2] CARGO-ACT: https://www.cargo-act.eu/

[3] DOE/ARM: https://www.arm.gov/), NASA/MPLNET: https://mplnet.gsfc.nasa.gov/), NOAA/GML:  ), ASCENT: https://ascent.research.gatech.edu/)

[4] ACTRIS: https://www.actris.eu/

[5] WMO/GAW (2016), Report 227, https://www.wmo-gaw-sag-aerosol.org/files/FINAL_GAW_227.pdf

How to cite: Philippin, S., Andrews, E., Prakash, G., Petäjä, T., Mather, J., Fiebig, M., Alas, H., Wiedensohler, A., Nicolae, D., Nemuc, A., Haeffelin, M., Mona, L., Petracca Altieri, R. M., De Mazière, M., Mayol-Bracero, O., Lewis, J., Ng, N. L. (., Paramonov, M., and O'Connor, E.: Strengthening EU-US Cooperation towards a Sustainable Global Atmospheric Research Infrastructure: Key achievements from CARGO-ACT, EGU General Assembly 2026, Vienna, Austria, 3–8 May 2026, EGU26-18608, https://doi.org/10.5194/egusphere-egu26-18608, 2026.

Evapotranspiration (ET) is a key component of the water balance, and its reliable estimation is critical for water resources planning and agricultural water management, for instance. Lysimeters have long been used to quantify ET from vegetated surfaces and to develop and calibrate ET models. Reference evapotranspiration (ET0) computed with the FAO-56 Penman–Monteith model (FAO-PM) has become a standard, supported by the broader availability of meteorological inputs. In Austria, users can access two main data categories via the GeoSphere Austria data hub: (i) point observations from stations – provided as daily and hourly time series – for meteorological variables; and (ii) spatially interpolated, gridded datasets. Beyond measured variables, derived products are also available, including modeled ET0 based on the Hargreaves–Samani method (HSM) and climate indices. To make an informed choice, it is necessary to understand the differences among these options. Therefore, we examine how alternative input datasets and adjusted algorithms affect ET0 estimates. For a site in northeastern Austria with lysimeter observations, we compute ET0 with FAO-PM using two station datasets (daily values vs. daily averages from hourly data) and compare these with HSM computations, including a gridded ET0 dataset with an adjusted algorithm. Meteorological and ET data are sourced from the GeoSphere Austria data hub (including the WINFORE dataset). ET data from a weighing lysimeter (3 m², grass, managed under reference conditions) serve as a benchmark. We compare the datasets covering a period of seven years using goodness-of-fit and error metrics as well as cumulated ET. The two FAO-PM results are most consistent with each other. However, they deviate slightly from the 1:1 line, which is likely due to the historically derived calculation method for daily wind data. The FAO-PM calculation based on hourly data (aggregated to daily) aligns best with lysimeter observations. During the growing season, FAO-PM cumulative ET0 exceeds lysimeter evaporation by about 3 % on average. ET0 based on HSM is larger by about 10 % relative to the lysimeter and by about 7 % relative to FAO-PM. This systematic overestimation should be considered in practical applications such as irrigation management. The FAO-PM vs. HSM comparison shows the largest bias and scatter, which requires further investigation.

How to cite: Nolz, R., Deißenberger, F., and Weninger, T.: Input selection and algorithm adjustment influence reference evapotranspiration: comparing FAO-56 Penman–Monteith and Hargreaves–Samani against lysimeter benchmarks, EGU General Assembly 2026, Vienna, Austria, 3–8 May 2026, EGU26-18963, https://doi.org/10.5194/egusphere-egu26-18963, 2026.

EGU26-19036 | ECS | Orals | BG3.8

Increase in physical and economic risks induced by permafrost thaw 

Xinrui Liu, Thomas Gasser, Christina Schädel, Susan Natali, Brendan Rogers, and Christopher Schwalm

Warming-induced greenhouse gas emissions from permafrost constitute a major uncertainty in assessments of Earth system stability, remaining carbon budgets, and the feasibility of long-term climate targets. While gradual permafrost thaw is represented in several complex Earth system models, abrupt thaw processes such as thermokarst development and active-layer detachment remain absent, despite their potential to generate rapid and substantial emissions. Here, we quantify the contribution of both gradual and abrupt permafrost thaw to CO2 and CH4 emissions and associated climate risks using the compact Earth system model OSCAR, extended with a newly implemented inventory-based module for abrupt permafrost thaw dynamics. Probabilistic projections of global temperature, sea-level rise, and direct economic damage costs are enabled across seven state-of-the-art scenarios from the Network for Greening the Financial System.

Our results show that permafrost carbon feedback introduces pronounced nonlinearities into climate outcomes. Risks associated with gradual thaw scale closely with global warming, whereas abrupt thaw exhibits complex, scenario-dependent effects that disproportionately influence upper-tail risks. These findings suggest that neglecting permafrost thaw may lead to systematic underestimation of tail risks. By explicitly linking permafrost thaw processes to climate risk metrics, this study contributes to reducing a key blind spot in climate‑impact assessments.

How to cite: Liu, X., Gasser, T., Schädel, C., Natali, S., Rogers, B., and Schwalm, C.: Increase in physical and economic risks induced by permafrost thaw, EGU General Assembly 2026, Vienna, Austria, 3–8 May 2026, EGU26-19036, https://doi.org/10.5194/egusphere-egu26-19036, 2026.

EGU26-21188 | Posters on site | BG3.8

Characterization and Management of Posidonia oceanica Banquettes as Nature-Based Solutions for Coastal Resilience 

Sara Dastoli, Edoardo Casoli, Alessandro Conforti, Matteo Conti, Jacopo Giampaoletti, Simone Simeone, Laura Sinapi, Alessandro Arani, and Luisa Nicoletti

The Interreg AMMIRARE Project aims to improve beach system resilience and enhance adaptive capacity to climate change through the adoption of nature-based solutions (NBS), recognizing living and death Posidonia oceanica (L.) Delile, 1813 as key natural assets for coastal protection. By combining ecological restoration, innovative monitoring strategies, and improved governance tools, the project promotes the use of banquettes as natural defenses against erosion and as functional components providing key ecosystem services. The integration of ecological and socio-economic data supports the development of a decision-making support system (DSS) for administrations and policy makers, fostering sustainable coastal management strategies that prioritize NBS over conventional hard-engineering approaches. From an NBS perspective, P. oceanica plays a crucial role both within underwater ecosystems and along sandy shorelines, where the accumulation of detached leaves and rhizomes forms distinctive structures known as “banquettes”. This stranded necromass, from a geomorphological perspective, significantly contribute to shoreline stabilization and mitigating erosion processes, by trapping and retaining sandy sediments. Ecologically, P. oceanica banquettes sustain a wide number of organisms, providing habitat, shelter, and feeding grounds for several invertebrates and microorganisms, enhancing the biodiversity at the land–sea interface. Despite their ecological and protective values, Italy currently lacks clear legislation for the protection and management of banquettes. They are frequently removed to preserve the aesthetic appeal of recreational beaches, often without considering the associated environmental and economic costs. Here, we present the evolution of a banquette located north of Civitavecchia (Italy) which is being monitored monthly by collecting manual penetrometer measurements at selected sites along transects longitudinal and perpendicular to the shoreline. These results, coupled by granulometric and surface/volumetric analyses, will provide the possibility to assess the degree of compactness of the P. oceanica banquette. When the results will be standardized and integrated with measurements from other banquettes with different compactness and formation characteristics, we aim to provide a simple and replicable method for classifying these deposits. These results will also be necessary to the DSS which, through the integration of scientific knowledge into coastal policies, will be able to foster the adoption of adaptive strategies capable of reconciling environmental protection with tourism and local economies.

How to cite: Dastoli, S., Casoli, E., Conforti, A., Conti, M., Giampaoletti, J., Simeone, S., Sinapi, L., Arani, A., and Nicoletti, L.: Characterization and Management of Posidonia oceanica Banquettes as Nature-Based Solutions for Coastal Resilience, EGU General Assembly 2026, Vienna, Austria, 3–8 May 2026, EGU26-21188, https://doi.org/10.5194/egusphere-egu26-21188, 2026.

EGU26-21502 | Posters on site | BG3.8

The NBFC Digital Platform: A National Infrastructure for Biodiversity and Ecosystem Services Governance in Italy 

Donatella Spano, Gabriella Scipione, Giuseppe Brundu, Antonio Costantini, Marco Puccini, Giuseppe Melfi, Dhori Xhulio, and Simone Mereu

The NBFC Digital Platform represents the core digital infrastructure of the National Biodiversity Future Center, designed to enable data-driven governance of biodiversity and ecosystem services in Italy. It integrates heterogeneous biodiversity monitoring data, ranging from in situ ecological networks and Earth observation products to genomic, functional, and experimental datasets.
Through advanced modelling frameworks, artificial intelligence, and high-performance computing (HPC) capabilities, the Platform provides a modular environment for simulating ecosystem dynamics, forecasting the impacts of climate and land-use change, and supporting restoration and conservation strategies.
Its architecture connects national observatories, research infrastructures, and Living Labs, offering interactive tools for data visualisation, model coupling, and decision support. By bridging science, technology and policy, the NBFC Platform aims to establish a new paradigm of digital governance for biodiversity and ecosystem services, fostering transparent access to knowledge, reproducible research and informed decision-making across multiple spatial and temporal scales.

How to cite: Spano, D., Scipione, G., Brundu, G., Costantini, A., Puccini, M., Melfi, G., Xhulio, D., and Mereu, S.: The NBFC Digital Platform: A National Infrastructure for Biodiversity and Ecosystem Services Governance in Italy, EGU General Assembly 2026, Vienna, Austria, 3–8 May 2026, EGU26-21502, https://doi.org/10.5194/egusphere-egu26-21502, 2026.

EGU26-21557 | Posters on site | BG3.8

Fostering harmonised access across environmental research infrastructures: Insights from IRISCC and other collaborative projects 

Rosa Maria Petracca Altieri, Carmela Cornacchia, Simone Gagliardi, Giuseppe Gargano, Simona Loperte, Quinzia Palazzo, Francesca Ricciardi, and Lucia Saganeiti

Global environmental challenges require coordinated access to research infrastructures (RIs) to enable integrated observations, collaborative science, and interdisciplinary research. However, access practices remain fragmented, limiting the potential for transnational research and innovation. This work presents efforts to harmonize access procedures within the environmental RI landscape, promoted by the ACTRIS Services and Access Management Unit in the IRISCC project, building on previous experiences from ATMO-ACCESS, ITINERIS, and other complementary initiatives.

IRISCC calls for Transnational Access (TA) are crucial for promoting cross-border collaboration and supporting researchers in accessing in situ facilities and long-term experimental platforms. Results from these calls demonstrate strong user interest in multi-RI access for integrated projects and highlight the potential for interdisciplinary research. Lessons learned from the calls highlight both technical and organizational challenges, such as aligning eligibility rules and integrating digital tools for access management.

Drawing on these projects, this contribution identifies good practices for harmonization, such as common guidelines, streamlined application workflows, and shared evaluation criteria, which together improve transparency and user experience. At the same time, it outlines lines of action for future developments to achieve more harmonized access models, virtual access solutions, coordinated user support, and the integration of strategies at the national and European levels. Continued collaboration among RIs is therefore essential to move from ad hoc solutions to a comprehensive access framework that supports the FAIR principles and maximizes societal impact.

By sharing insights from IRISCC and related initiatives, this presentation aims to inform future strategies for integrated access, promoting a more connected and efficient research infrastructure ecosystem.

How to cite: Petracca Altieri, R. M., Cornacchia, C., Gagliardi, S., Gargano, G., Loperte, S., Palazzo, Q., Ricciardi, F., and Saganeiti, L.: Fostering harmonised access across environmental research infrastructures: Insights from IRISCC and other collaborative projects, EGU General Assembly 2026, Vienna, Austria, 3–8 May 2026, EGU26-21557, https://doi.org/10.5194/egusphere-egu26-21557, 2026.

EGU26-333 | Orals | BG3.11 | Highlight

Monitoring Vegetation Structure, Function and Composition with Remote Sensing 

Fabian D. Schneider, Ting Zheng, Antonio Ferraz, Laura Berman, Camilla D. Jakobsen, Jaime C. Revenga, Zhaoyue Wu, Zhiwei Ye, Ryan P. Pavlick, Philip A. Townsend, and Signe Normand

Biodiversity monitoring is important to support decision-making for managing landscapes sustainably and supporting national and international policy targets for nature conservation and restoration, including the Global Biodiversity Framework. While assessing the status, change and drivers of biodiversity remains challenging, we have new opportunities to support biodiversity monitoring from space with a growing suite of Earth observation satellites. Remote sensing is especially well suited to monitor ecosystems in terms of their vegetation structure and forest structural diversity with lidar and radar, as well as vegetation functions, foliar functional diversity and community composition with imaging spectroscopy and multispectral imaging. In this talk, we will provide examples for monitoring forest structural diversity using the spaceborne lidar GEDI. We evaluated and compared structural diversity across contrasting biomes in the Western US and Central Africa, and we found that general biogeographic patterns of higher horizontal structural diversity in areas with higher disturbance, higher topographic variation and lower aridity hold across continents and scales. For monitoring ecosystem functions, we will provide examples for monitoring plant traits and functional diversity using imaging spectroscopy along elevation gradients in California. We will provide insights into the role of trait-trait relationships and trait selection for mapping trait diversity patterns at the landscape scale. We found that diversity patterns vary by the type and number of functional traits included in the analyses, and that the interpretation is context dependent. And for monitoring composition, we will provide examples indicating how well we can distinguish different vegetation types, communities and species with spectroscopy, and how well we predict animal composition and niche space using a remote sensing-based biodiversity data cube, BioCube. With these examples, we will demonstrate new capabilities and avenues for monitoring different aspects of biodiversity change using remote sensing at the landscape scale, and we will provide important context for the interpretation of these results. Remote sensing can provide information about biological communities and habitats, ecosystems and biomes at different spatial scales and time steps that should be integrated with other biodiversity data, models and decision support tools to fully leverage its potential for biodiversity monitoring.

How to cite: Schneider, F. D., Zheng, T., Ferraz, A., Berman, L., Jakobsen, C. D., Revenga, J. C., Wu, Z., Ye, Z., Pavlick, R. P., Townsend, P. A., and Normand, S.: Monitoring Vegetation Structure, Function and Composition with Remote Sensing, EGU General Assembly 2026, Vienna, Austria, 3–8 May 2026, EGU26-333, https://doi.org/10.5194/egusphere-egu26-333, 2026.

EGU26-405 | ECS | Posters on site | BG3.11

Satellite Earth Observation for supporting biodiversity monitoring: a case study of ecosystem extent mapping in the Great Western Woodlands, Australia. 

Adriana Parra Ruiz, Zheng-Shu Zhou, Matt Garthwaite, and Shaun Levick

The Kunming-Montreal Global Biodiversity Framework (GBF) provides a roadmap for action on biodiversity loss with the definition of an ambitious set of goals to achieve sustainable development by 2050. This international agreement includes a monitoring framework comprising 43 headline indicators to track the effects of policy implementation on biodiversity. Many of these indicators require information on ecosystem structure, composition or functioning, some of which can be provided by satellite-based Earth observation (EO) data. Different EO sensors (e.g., optical, radar, LiDAR) can produce unique information on various ecosystem characteristics, and the large coverage and systematic periodicity of EO data facilitate tracking changes in indicators across different spatial and temporal scales.

As part of an initiative by the Committee on Earth Observation Satellites (CEOS) Biodiversity study team, this project focuses on the use of EO data for producing the GBF Headline Indicator A.2: extent of natural ecosystems. Our study area is the Great Western Woodlands (GWW), located in south-western Australia, a biodiversity hotspot as the largest temperate woodland ecosystem in the world. This region faces threats related to climate change impacts, particularly, increases in aridity conditions and in fire frequency. For these reasons, monitoring ecosystem extent in the GWW is essential for land management, and conservation efforts.

In this study, we evaluated the effects of optical and Synthetic Aperture Radar (SAR) data integration on ecosystem discrimination and assessed the performance of different machine learning algorithms in relation to classification accuracy. To achieve this, we used multi-source Analysis Ready Data on a cloud computing platform to produce a series of tests incorporating different input data and classification methods.

Preliminary results indicate that classification products including optical and SAR data have higher overall accuracy (91%) and improved discrimination between similar ecosystem types in the GWW region, compared to optical-only products (87%). Additionally, different machine learning algorithms resulted in classifications products with similar accuracy statistics, but large differences in feature identification and boundary definition between ecosystem classes. These results showcase how satellite EO data, as a consistent, cost effective and repeatable measurement, can support the production of biodiversity indicators for management and conservation purposes.

How to cite: Parra Ruiz, A., Zhou, Z.-S., Garthwaite, M., and Levick, S.: Satellite Earth Observation for supporting biodiversity monitoring: a case study of ecosystem extent mapping in the Great Western Woodlands, Australia., EGU General Assembly 2026, Vienna, Austria, 3–8 May 2026, EGU26-405, https://doi.org/10.5194/egusphere-egu26-405, 2026.

EGU26-1307 | ECS | Posters on site | BG3.11

Introducing GeoLUCA: A Global Initiative to Map Land-Use Change and LandAbandonment in Mountain Ecosystems 

Nicolò Anselmetto and Matteo Garbarino

Mountain landscapes worldwide are experiencing rapid transformations, driven by land abandonment, climate change, shifting socio-economic paradigms, and evolving disturbance regimes. Despite their ecological importance and their role as climate-sensitive sentinels, no coordinated global framework exists to compile and harmonize long-term land-use change (LUC) data in mountain areas.

To address this urgent gap, we introduce GeoLUCA, the Geodatabase of Land-Use Change in Alpine and mountain environments, on behalf of all the colleagues participating to this effort. GeoLUCA envisions a global, open, and dynamic platform integrating historical aerial imagery, remote sensing products, and ecological and socio-environmental datasets to quantify landscape change across mountain systems.

GeoLUCA has already taken shape as a regional effort within the European Alps, bringing together ca. 20 interdisciplinary partner institutions spanning ecology, geography, environmental informatics, and land-system science. GeoLUCA is currently working on three complementary and parallel areas of research that embody the scope and some of the expected outcomes of the initiative: (i) reconstructing two centuries of forest dynamics in the European Alps, combining land-cover data from multiple sources over the last 200 years, (ii) developing a deep-learning workflow for classifying raw historical aerial images, enabling consistent land-cover mapping across decades and mountain ranges, (iii) analysing habitat change trajectories in the European Alps since the 1950s to evaluate ecological shifts and emerging hotspots.

GeoLUCA is now launching a global data-collection effort to gather original aerial photographs, historical maps, and satellite time-series from mountain regions worldwide. This includes developing standards for metadata and curating raw imageries and associated ecological data sources from contributors across the world.  By building the first coordinated database of long-term LUC and land abandonment in mountains, GeoLUCA aims to support global change research, ecosystem modelling, evidence-based conservation, and policy design. We invite researchers to join the initiative and contribute data, expertise, and regional knowledge.

How to cite: Anselmetto, N. and Garbarino, M.: Introducing GeoLUCA: A Global Initiative to Map Land-Use Change and LandAbandonment in Mountain Ecosystems, EGU General Assembly 2026, Vienna, Austria, 3–8 May 2026, EGU26-1307, https://doi.org/10.5194/egusphere-egu26-1307, 2026.

Riparian zones are essential for the vitality of river systems and their adjacent environment while offering an abundance of ecosystem services. However, these ecosystems are increasingly exposed to various stressors with human activities like habitat fragmentation instigated by land use intensification, hydroclimatic changes, and environmental impacts, being the primary contributors. The growing availability of satellite datasets has enhanced the capacity and efficiency of monitoring these ecosystems. Based on these viewpoints, the objective of this work is to present a systematic methodology to examine the structure of vegetation in riparian forests using the spectral heterogeneity in their reflectance for the Delhi stretch of river Yamuna. The spectral variation hypothesis suggests that a higher spectral variability is positively related to plant species richness. Taking that into account, the primary objectives of the present study are: (1) determination of differentiable spectral clusters for riparian vegetation and deriving endmember spectra for each cluster from the scene using Vertex Component Analysis (VCA), (2) unmixing the vegetation spectra and determination of Shannon’s Index (SHDI) as an indicator of structural diversity in the study area. Landsat 7 ETM and Landsat 8 and 9 OLI scaled surface reflectance products have been used for the analysis. Pixels corresponding to the forested region are identified using land use landcover maps. The principal component analysis was first carried out to reduce the high correlation among the image bands. The clusters for deriving the endmembers were determined from the output principal components using K- means clustering. The optimal number of clusters (k) were obtained using a tolerance-based plateau detection for iterative k - value against its average mean centroid distance (AMCD) at each step prior to retracing the cluster identities in the reflectance space. The endmember spectra are identified using VCA for each cluster and the method of Non-Negative Least Squares (NNLS) is employed to optimize the endmember reflectance function. Since the endmembers are identified for multiple years, we have used Spectral Angle Mapping (SAM) to identify the classes of similar endmember types within each year and across multiple years before determining the SHDI values based on the proportion of the total area covered by the endmembers The results show a decreasing trend in SHDI which implies that there is a decline in structural diversity at 30 meter scale within the riparian zones and thereby the area is becoming dominated by fewer vegetation types over time. The study reveals that spectral unmixing-based SHDI serves as a remote, repeatable metric for assessing riparian vegetation structure. Monitoring alterations in diversity facilitates the identification of homogenization and habitat complexity loss, thereby aiding in early warning, restoration targeting, and assessment of management or land-use policy effects.

Keywords: Riparian zones, spectral endmembers, spectral unmixing, VCA, Shannon diversity index.

How to cite: Vyas, H. and Keshari, A. K.: Spectral Unmixing based Approach to Quantify Structural Vegetation Diversity in the Riparian Zones of River Yamuna: A Study for the Delhi Stretch, EGU General Assembly 2026, Vienna, Austria, 3–8 May 2026, EGU26-2145, https://doi.org/10.5194/egusphere-egu26-2145, 2026.

EGU26-2150 | ECS | Posters on site | BG3.11

Deep learning and model transferability for standing dead tree mapping 

Jaan Rönkkö, Katalin Waga, Mikko Kukkonen, and Parvez Rana

Timely forest health monitoring depends on fast and accurate methods that identify tree mortality due to climate change driven phenomena such as bark beetle attacks. Aerial imagery coupled with deep learning is an efficient tool for detecting standing dead trees compared to field work but requires reliable and quickly accessible applications for forest owners and decision makers. Current challenges are related to laborious training data acquisition that models require in order to generalize for large areas. Few studies address how locally trained dead tree models can be transferred to new sites with minimal manual delineation of calibration data.

This presentation introduces three binary CNN segmentation models for detecting standing dead trees during the Finnish leaf-on season, with training and testing applied on aerial images of Koli 2017, Koli 2022 and Lapinjärvi 2022 study sites. These models were trained using 300–543 tiled aerial image samples and then transferred to images of Koli and Lapinjärvi taken in 2025 where only a small calibration set of n=12 samples are manually delineated for both images. To expand this calibration data, various geometric augmentations are applied to the samples. This dataset allows for transferability tests between eastern and southern Finland as well as across 8 years of aerial image data with varying imaging conditions.

Pixel-wise F1 scoring of all models ranged from 0.69 to 0.82 while the calibration improved transferred model F1 scores by 13–123% depending on site and year. This presentation will also provide a clear explanation of the used models, as well as the used aerial images with their inherent characteristics, for example spectral variations that affect calibration efficiency. Furthermore, standing dead tree mortality maps are shown to visualize the tree mortality extent in Koli and Lapinjärvi study areas.

Augmentation can efficiently generalize standing dead tree detection models as well as enable effortless calibration to new sites. Therefore, this approach can be extended to other tasks as well, such as forest fire mapping.

How to cite: Rönkkö, J., Waga, K., Kukkonen, M., and Rana, P.: Deep learning and model transferability for standing dead tree mapping, EGU General Assembly 2026, Vienna, Austria, 3–8 May 2026, EGU26-2150, https://doi.org/10.5194/egusphere-egu26-2150, 2026.

EGU26-2960 | ECS | Posters on site | BG3.11

From cultural landscapes to forest expansion: 70 years of habitat change in the European Alps 

Simona Cavallo, Nicolò Anselmetto, Luca Mauri, Simone Ferrero, Andrea Mainetti, and Matteo Garbarino

Mountain areas host several complex ecosystems that are not immune to biodiversity loss. In the European Alps, traditional agro-pastoral activities have shaped semi-natural cultural landscapes with unique ecological features, such as terraced landscapes and wood pastures. The peak in the abandonment of traditional practices in the last century led to intense natural forest expansion on montane slopes. This translated into changes in habitat structures resulting in the homogenisation of landscape features and the loss of open areas. These dynamics have rarely been investigated at appropriate ecological scales, as existing studies are constrained by trade-offs between spatial and temporal extent and resolution, and often rely on non-harmonised data.

The aim of this study is to analyse the trajectories and drivers of habitat changes across the Alps over the last 70 years, using three temporal steps, i.e., the 1950s, 1980s, and 2020s. We hypothesise that: i) natural forests expansion patterns are mostly associated with gap filling between the 1950s and the 1980s, but with treeline upshift in the last 40 years; ii) grasslands have decreased over the entire time period, but primary successions on unvegetated areas have recently occurred at higher elevations; iii) the relative importance and direction of effect of drivers differ between time periods and regional administrations, reflecting land-use legacies, history, and territorial policies.

A database of 393 historical aerial photographs from the 1950s and the 1980s, and satellite images from the 2020s was assembled for 138 alpine landscapes, each with an area of 9 km2, encompassing more than 1000 km2. Landscape areas were selected between 1000 and 3000 m a.s.l. to represent the topographic, climatic, and socio-economic diversity of the montane, subalpine, and alpine belts of the Alpine region. Images were obtained from multiple national and regional geoportals, orthorectified when needed, and harmonised at a spatial resolution of 1m. Deep-learning architectures were trained to classify the landscapes into 10 land-cover classes, including grasslands, croplands, forests, unvegetated or anthropic areas, and shadows. A semi-automatic post-processing procedure was implemented to ameliorate classification results. The spatiotemporal trajectories of habitat changes were assessed through landscape and class metrics, as well as morphological spatial pattern analysis. A machine-learning approach was adopted to quantify the importance and direction of effect of several topographic, socioeconomic, soil, climatic, and vegetation drivers.

Preliminary results confirmed the hypotheses regarding habitat transitions over time. Forests have increased everywhere, leading to a widespread landscape homogenisation dominated by closed-canopy habitats. By further investigating the evolution of spatial patterns of grasslands and open areas, we seek to better decipher landscape and habitat changes at different elevations. Moreover, the identification of the most relevant socio-ecological factors shaping semi-natural cultural landscapes can inform biodiversity conservation and rewilding agendas.

How to cite: Cavallo, S., Anselmetto, N., Mauri, L., Ferrero, S., Mainetti, A., and Garbarino, M.: From cultural landscapes to forest expansion: 70 years of habitat change in the European Alps, EGU General Assembly 2026, Vienna, Austria, 3–8 May 2026, EGU26-2960, https://doi.org/10.5194/egusphere-egu26-2960, 2026.

EGU26-3085 | ECS | Posters on site | BG3.11

Tree line dynamics and forest densification in the European Alps revealed by Landsat images and machine learning: a case study in the Senales/Schanls Valley 

Irene Menegaldo, Victoria Molbach Sforzini, Roberto Tognetti, and Michele Torresani

The alpine tree line represents one of the most climate-sensitive ecological boundaries, wher multiple interacting factors determine vegetation distribution as its upper limit. This study investigates the spatio-temporal dynamics of the tree line in Senales Valley (South Tyrol, Italy) between 1985 and 2023, combining multi-temporal Landsat imagery, Random Forest (RF) classification and visual orthophoto interpretation performed by manually delineating the forest boundary to assess both spatial and elevational shifts. Climatic variables (temperature, precipitation, snow cover and growing season length) were analysed using linear model (LM) and generalized additive models (GAM) to identify long-term trends and potential drivers of tree line migration. The results reveal a consistent increase in forest cover in all 16 study areas, averaging +44%, with the largest expansion occuring on slopes facing W. Elevational advances were recorded in 15 of 16 areas, averaging +32 m for Landsat-derived data and +45 m for orthophotos. Elevated minimum temperatures during spring and autumn, alongside warmer summers and a significant rise in precipitation during the same season, created condition which maintained soil moisture and reduced water stress - factors known to facilitate tree line advancement. Wind exposure from the N-NW sector and associated föhn effects appeared to limit tree line expansion on S-SE facing slopes. Comparison between manual and RF-derived tree lines revealed overall high agreement, with deviation below one Landsat pixel (30 m) in most cases. This confirms that Landsat imagery combined with RF algorithms provides a robust, cost-effective method for assessing long-term tree line dynamics in heterogeneous alpine enviroments.

How to cite: Menegaldo, I., Molbach Sforzini, V., Tognetti, R., and Torresani, M.: Tree line dynamics and forest densification in the European Alps revealed by Landsat images and machine learning: a case study in the Senales/Schanls Valley, EGU General Assembly 2026, Vienna, Austria, 3–8 May 2026, EGU26-3085, https://doi.org/10.5194/egusphere-egu26-3085, 2026.

Alpine zones in northeastern North America (NNA) are rare and support diverse ecological communities distinct from lower elevation forests. Global change drivers can alter the composition and functioning of these plant communities. The forest-alpine ecotone (treeline) is also influenced by a myriad of environmental drivers and is anticipated to encroach into alpine systems. We sought to determine the extent and drivers of treeline advance in NNA using multiple methodologies, including aerial and satellite-based imagery and long-term in-situ observation. For our approach, we (1) compared current and historical high-resolution aerial imagery of two ranges to quantify the advance of treeline over the last four decades. Vegetation delineation of aerial images were coupled with in-situ surveys to ground-truth treeline classifications. We used mixed effects models to examine the importance of both topographic and climatic variables on treeline advance. (2) Greening trends (NDVI) were modeled at 35 alpine and treeline ecotone sites in the Adirondacks (New York), New England, and Quebec’s Gaspé Peninsula using Landsat 5-8 imagery (1984-2024). (3) Permanent alpine vegetation point-intercept transects (with associated environmental data) in the Adirondacks and White Mountains (New Hampshire) were periodically sampled to quantify changes in alpine species composition and monitored for increased tree abundance. NNA treelines have shifted upslope on average by 3 m/decade since the 1970’s. Diffuse treelines (low tree density) displayed significantly greater upslope shifts (5 m/decade) compared to denser treelines, suggesting that both warming and demography are important correlates of treeline shifts. Topographical features (slope, aspect) as well as climate (accumulated growing degree days, AGDD) explained significant variation in the magnitude of treeline advance (R2 = 0.32). Most sites (88% total alpine area) have experienced significant greening via annual NDVImax. Greening occurs in the alpine zone interior in addition to some ecotone positions, potentially revealing both increased alpine vegetation productivity and tree establishment. Greening trends are moderated by landscape position and vary among plant community type (herbaceous vs. shrub-dominated). Non-metric multidimensional scaling (NMDS) illustrates an increase in shrub and tree species abundance over the past four decades, with a decrease in arctic specialist species abundance. These changes were highly positively correlated with site-level temperature and negatively correlated with anthropogenic atmospheric nitrogen (N) loading. Tree encroachment (and shrubbification) of NNA alpine challenges the future character and functioning of these rare systems. Development of remote sensing-based monitoring programs for NNA alpine will provide methodologically-consistent regional-scale information on how such ecosystems respond to environmental change, better informing stewardship and management activities.

How to cite: Tourville, J. and Chipman, J.: Tree encroachment in alpine environments of Northeastern North America: Evidence from multiple approaches, EGU General Assembly 2026, Vienna, Austria, 3–8 May 2026, EGU26-4545, https://doi.org/10.5194/egusphere-egu26-4545, 2026.

EGU26-4965 | ECS | Orals | BG3.11

Systematic Sensitivity Analysis of Spectral Variation Hypothesis Based Spectral Diversity Metrics from Sentinel-2 Using BiodivMapR  

Arathi Biju, Oleksandr Borysenko, Holger Virro, Jean-Baptiste Féret, Jan Pisek, and Evelyn Uuemaa

The Spectral Variation Hypothesis (SVH) proposes that spectral heterogeneity derived from remote sensing data can serve as a proxy for biodiversity. While spectral diversity metrics are increasingly applied in ecological studies, their reproducibility remains limited by methodological choices that are rarely evaluated systematically. In particular, the sensitivity of α-spectral diversity to clustering, spatial scale, masking strategies, and spectral input configuration within commonly used workflows such as BiodivMapR is poorly understood.

This study presents a systematic sensitivity analysis of α-spectral diversity derived from Sentinel-2 imagery using the BiodivMapR framework over a selected region in Estonia. The primary objective is to identify cluster size thresholds at which diversity values stabilize and to assess whether this stabilization depends on image extent. K-means clustering was evaluated across cluster sizes of 20, 40, 60, 100, 200, 500, and 1000, combined with image extents of 10, 15, 20, and 30 km. For all configurations, the same number of samples was used to derive clusters, while BiodivMapR’s default random initialization was retained to assess robustness. 

The analysis was extended to examine ecosystem masking effects. Forest-only masking represents landscape-level diversity restricted to forest ecosystems, while an inward buffer (~15 m) was applied to exclude edge pixels influenced by roads and non-vegetated surfaces, isolating within-forest spectral heterogeneity. Additional experiments assessed the sensitivity of α-diversity to window size and spectral input choice (bands versus indices). 

Results demonstrate that α-spectral diversity is highly sensitive to methodological configuration, with stabilization thresholds varying across spatial extents and masking strategies. Even within forest-only analyses, edge effects significantly influence diversity estimates. These findings highlight that spectral diversity metrics are strongly parameter-dependent and cannot be directly compared across studies without methodological harmonization. 

How to cite: Biju, A., Borysenko, O., Virro, H., Féret, J.-B., Pisek, J., and Uuemaa, E.: Systematic Sensitivity Analysis of Spectral Variation Hypothesis Based Spectral Diversity Metrics from Sentinel-2 Using BiodivMapR , EGU General Assembly 2026, Vienna, Austria, 3–8 May 2026, EGU26-4965, https://doi.org/10.5194/egusphere-egu26-4965, 2026.

EGU26-5097 | ECS | Posters on site | BG3.11

Land-use legacies drive contrasting dynamics between new and pre-existing forests 

Quim Canelles, Martina Sánchez-Pinillos, and Aitor Ameztegui

In many European countries, land-use changes driven by socio-economic contexts have induced widespread forest expansion during the 20th century, with still poorly explored implications for ecosystem dynamics. Previous research has shown that these “new forests” differ from “pre-existing forests” in terms of structure and productivity. However, beyond their current state, it remains unclear whether and how the long-term dynamics of new forests diverge from or converge towards those of pre-existing forests.

Here, we address this question using the framework of Ecological Dynamics Regimes (EDRs), which characterize ecosystem trajectories through time based on temporal changes in multiple state variables within a multidimensional state space. In this study, EDRs were defined using forest structural and compositional attributes. We assessed forest EDRs across two biogeographical regions of the Iberian Peninsula using data from 756 plots of the Spanish National Forest Inventory (1986–2023). Historical land-cover maps from 1956 were used to distinguish between pre-existing forests and new forests established after mid-20th-century land abandonment. Analyses focused on plots dominated by major Pinus and Quercus species in the region, from which we derived metrics describing the dispersion, length, and relative position of EDR trajectories.

Our results show that, for most species, new forests exhibit more dispersed (between 0 and 37% according to the species) and longer trajectories (11-75%), and are positioned further behind in state space (4-56%) compared to pre-existing forests. This indicates that new forests start from more heterogeneous initial conditions and experience faster or more pronounced structural and compositional changes, while nonetheless showing a tendency to converge towards the dynamics of pre-existing forests over time. These findings highlight the lasting influence of land-use legacies on forest dynamics and help to the understanding of forest responses under ongoing global change and increasing uncertainty.

How to cite: Canelles, Q., Sánchez-Pinillos, M., and Ameztegui, A.: Land-use legacies drive contrasting dynamics between new and pre-existing forests, EGU General Assembly 2026, Vienna, Austria, 3–8 May 2026, EGU26-5097, https://doi.org/10.5194/egusphere-egu26-5097, 2026.

EGU26-6668 | ECS | Posters on site | BG3.11

Uncertainties in Remote Sensing of Biodiversity 

Christian Rossi, Andreas Hueni, Tiziana L. Koch, Kaan Karaman, and Maria J. Santos

Recent advances in remote sensing of biodiversity and biodiversity-related products have significantly enhanced our capacity to monitor and understand biodiversity. Typical remote sensing products directly related to biodiversity are spectral features and plant traits, and their diversity in space, i.e., spectral diversity and functional diversity. Hence, remote sensing of biodiversity involves measuring biophysical quantities from signals recorded by a sensor in response to radiation reflected from the Earth’s surface. As for any other measurements, the biodiversity quantities estimated via remote sensing are inherently uncertain. Starting from the digital numbers recorded by the detector, the processing to obtain surface reflectance products, to the final biodiversity output, various sources of uncertainty can arise. Failing to account for such uncertainties may lead to over- or underestimates of diversity, with downstream repercussions on management strategies and policy making. Nevertheless, uncertainties are rarely quantified in remotely sensed biodiversity products, limiting our understanding of biodiversity processes and their detection. Sparse quantification of uncertainties is further exacerbated by the confusion arising from the inconsistent and improper use of uncertainty terms. Here, we clarify the concept of uncertainty by defining what it is and what it is not, outlining its typologies, highlighting sources of uncertainty and providing examples of uncertainty estimation and propagation. Our examples are based on spaceborne imaging spectroscopy data to propagate surface reflectance uncertainties into vegetation indices, principal components, plant traits, and spectral diversity metrics. By raising awareness of the magnitude and implications of uncertainty, establishing a shared terminology, and proposing a practical framework for uncertainty estimation, we contribute toward more transparent, interpretable, and ultimately more reliable remotely sensed biodiversity products.

How to cite: Rossi, C., Hueni, A., Koch, T. L., Karaman, K., and Santos, M. J.: Uncertainties in Remote Sensing of Biodiversity, EGU General Assembly 2026, Vienna, Austria, 3–8 May 2026, EGU26-6668, https://doi.org/10.5194/egusphere-egu26-6668, 2026.

EGU26-9249 | ECS | Posters on site | BG3.11

Future expansion of the treeline under land-use and climate change in the Eastern Alps 

Sebastian Marzini, Erich Tasser, Camilla Wellstein, Katharina Albrich, Werner Rammer, and Marco Mina

Across Alpine landscapes, a combination of land-use abandonment and climate change is driving forest expansion and promoting the upward migration of trees on grasslands. Yet, it remains unclear how rapidly the treeline will shift and how tree species composition of this ecotone will change, both in terms of species proportions and along elevational gradients.
Our aim is to investigate the future forest expansion in a landscape in the Eastern Alps under potential grassland abandonment, climate change, natural disturbances (wind and bark beetle), and forest management.
We used the iLand forest landscape model to simulate long-term dynamics (2020-2200) under different scenarios. We coupled model outputs with the concave hull algorithm to identify potential changes in the treeline, tracking tree species expansion and quantifying elevation and compositional shifts.
Under a potential abandonment of alpine grasslands, forest will likely expand rapidly within the 21st century regardless climate warming. This because the current treeline is mainly constrained by land use rather than climate. Our simulations also showed that ecotone shifts will be more pronounced on S-facing slopes, while climate change will affect more future tree species composition and forest stocking at higher elevations. 
Our outcomes provide useful insights on future dynamics of the upper forest ecotone by using a forest landscape model and by integrating not only species migration and climate but also other factors such as disturbances and management. Our results could provide useful information for designing landscape management strategies in rapidly changing Alpine mountain valleys.

How to cite: Marzini, S., Tasser, E., Wellstein, C., Albrich, K., Rammer, W., and Mina, M.: Future expansion of the treeline under land-use and climate change in the Eastern Alps, EGU General Assembly 2026, Vienna, Austria, 3–8 May 2026, EGU26-9249, https://doi.org/10.5194/egusphere-egu26-9249, 2026.

Even though forest biodiversity is currently at the center of international attention in the context of ecosystem restoration and global conservation strategies, quantifying forest biodiversity across large spatial extents remains a central challenge in ecological monitoring and forest management. The effective management of biodiversity in both protected areas and managed forests has long been constrained by a lack of methodologically consistent, and spatially continuous data. RNew high-resolution remote sensing data—including Vegetation Height Models, phenology time series, and detailed forest area maps—combined with standardized inventories, can bridge existing data gaps and substantially enhance forest ecosystem monitoring and biodiversity management. These base datasets have enabled the generation of new value products such as tree species mapping, standing deadwood, biomass mapping and phenology anomalies opening a new level of forest monitoring.  We present a multi-level showcase framework to demonstrate practical applications of these technologies in forest biodiversity and nature conservation: At the individual tree level, we explore the potential for delineating habitat tree priority areas by detecting indicators such as standing deadwood and crown dieback. These features serve as critical proxies for saproxylic insects, fungi, and cavity-nesting birds. While precise individual mapping remains a challenge, identifying these potential habitat backdrops enables a more targeted spatial approach to the conservation of rare or endangered tree species. At the stand level, structural heterogeneity and damages can be indicating biodiversity. A 26-class tree species map enables the assessment of compositional diversity and mixing degrees. Time-series of vegetation indices derived from sensors depict seasonal changes in forest phenology. This enables recognizing forest damages such as windthrow, bark beetle infestations, and even slow progressing tree pests. At the landscape and national levels, we utilize digital terrain models (DTM) and high-resolution vegetation height models to derive geodiversity and forest structure indices and identify micro-habitats. Landscape connectivity is addressed by mapping forest roads to measure fragmentation and planning ecological corridors between protected areas. Despite these opportunities, we address several critical limitations. While remote sensing offers scalability and objectivity, "ground truthing" - such as with the Austrian inventory data - remains an indispensable foundation for model validation. This necessitates a new profile of expertise: professionals who bridge deep ecological knowledge with data science. Only through interdisciplinary cooperation and a careful balance of technological gain versus energy consumption can digital models be meaningfully applied to protect our natural resources.

How to cite: Lapin, K., Schumacher, B., and Hoffmann, J. A.: Applying Remote Sensing for Improved Monitoring and Management of Forest Biodiversity: From Tree-Level Indicators to National  Level , EGU General Assembly 2026, Vienna, Austria, 3–8 May 2026, EGU26-10630, https://doi.org/10.5194/egusphere-egu26-10630, 2026.

EGU26-11310 | ECS | Posters on site | BG3.11

Patterns, drivers and potential biodiversity consequences of widespread tree-cover expansion in Europe 

Wanben Wu, Jens-Christian Svenning, Tobias Kuemmerle, Alexander V. Prishchepov, Matthias Baumann, and Robert Buitenwerf

Expanding tree cover is widely seen as a nature-based solution for climate mitigation and biodiversity conservation. However, widespread increases in tree cover can unintentionally reduce habitat heterogeneity or replace open ecosystems, thereby posing risks to biodiversity. Here, we developed a framework integrating measures of tree cover, connectivity, and heterogeneity, and quantified the dynamics in these measures in Europe from 2001 to 2021. We also explored potential drivers of tree dynamics, including land management, natural disturbance, climate, and human activities. We found that 23% of the European land area experienced widespread increases in tree cover and connectivity, accompanied by a decline in heterogeneity. Importantly, former cropland areas were linked to considerable tree-cover expansion and improved tree connectivity. Our findings indicate widespread densification and homogenization of vegetation, which will compromise the capacity of European ecosystems to support biodiversity. Restoring natural disturbance processes, including herbivory and fire, is essential to fully capitalize on the biodiversity potential of nature recovery in Europe.

How to cite: Wu, W., Svenning, J.-C., Kuemmerle, T., Prishchepov, A. V., Baumann, M., and Buitenwerf, R.: Patterns, drivers and potential biodiversity consequences of widespread tree-cover expansion in Europe, EGU General Assembly 2026, Vienna, Austria, 3–8 May 2026, EGU26-11310, https://doi.org/10.5194/egusphere-egu26-11310, 2026.

Farmland abandonment is among the most widespread land-use change processes in Europe and is often assumed to promote natural afforestation through vegetation succession, particularly in temperate regions. However, empirical evidence quantifying the extent and controls of afforestation on abandoned farmlands remains limited. Using Lithuania as a case study of post-Soviet land-use transition, satellite Landsat, Sentinel-2 time-series were combined with spatial analysis to quantify farmland abandonment between 1990 and 2000 and subsequent land-cover trajectories through 2025. Further, it assessed the extent to which abandoned farmland reverted to forest and identified key biophysical and socio-economic determinants shaping these dynamics. The results indicated that approximately 25% of farmland was abandoned during the early post-Soviet period, yet only a portion of this land remained abandoned by 2025. Among the remaining abandoned areas, only a small fraction exhibited spectral convergence with adjacent natural forest, suggesting limited progression toward mature forest states. Reversion to forest was strongly conditioned by accessibility, socio-economic factors, seed dispersal potential, and biophysical constraints. In contrast, recultivation of abandoned farmland was promoted by favorable cultivation conditions, agricultural subsidies, and land-use interventions such as the designation of hunting grounds. Overall, the findings challenge the assumption of widespread, spontaneous forest recovery on abandoned farmland and demonstrate the value of long-term Earth observation data for disentangling land-use trajectories and their controlling factors, as well as the formation of novel scapes, neither representing agriculture nor newly established forests. The proposed analysis framework is expandable and transferable to other regions experiencing land-use transitions, thus helping better quantify natural and socio-economic potentials.

How to cite: Prishchepov, A. V.: Revisiting the progress of natural afforestation on abandoned farmlands using long-term satellite time observations, EGU General Assembly 2026, Vienna, Austria, 3–8 May 2026, EGU26-12047, https://doi.org/10.5194/egusphere-egu26-12047, 2026.

EGU26-12186 | Orals | BG3.11

Krummholz at the Forefront of Treeline in the Himalaya: The Biotic Lock Decoupling Treeline Shift due to Climate Warming 

Rabindra Adhikari, Romina Granacher, Lisa-marie Kunz, Amrit Maharjan, Madhavi Parajuli, Chandra Kanta Subedi, Corinna Gall, Steffen Seitz, Ram Prasad Chaudhary, Yvonne Oelmann, Jüergen Boehner, Udo Schickhoff, and Thomas Scholten

Globally, alpine treelines are undergoing a spatially heterogeneous and frequently inconsistent and unpredicted altitudinal range expansion in response to accelerated climate warming. Previous findings in the Himalaya region reveal a significant decoupling between climatic control and treeline shift, suggesting that non-climatic factors are hindering the expected upward migration. We implemented a hierarchical sampling approach across krummholz and non-krummholz transects in Rolwalling and Langtang region extending from 3900 to 4300 m altitude. Soil was analysed for SOC, TN, microbial biomass to evaluate nutrient limitations and microbial stoichiometry. Allelochemical profiling was conducted for the analysis of secondary metabolites in leaf and root tissues of Rhododendron spp. Dendroecological climate sensitivity analysis was done through tree-rings study for drought response of the krummholz-forming R. campanulatum against the subalpine treeline species Abies spectabilis.

Our results reveal that Krummholz soils exhibit significantly higher acidity and elevated allelochemical concentrations profiling such as carboxylic acids, fatty acids, phenolics, and terpenoids as potential inhibitory metabolites in Rhododendron tissues. Krummholz site maintained a significantly higher soil C:N ratio (25:1) and an exceptionally low mean microbial quotient (qMIC = 0.17%), reflecting nitrogen immobilization and stagnant nutrient turnover. The lower dwarf shrub heath zone exhibited the highest mean MBC 1,170.8 µg g⁻¹ soil and MBN 111 µg g⁻¹ soil, while lower krummholz had the highest MBP mean 299.6 µg g⁻¹ soil. Furthermore, dendrochronological analysis showed that A. spectabilis is significantly more sensitive to drought severity than the resilient R. campanulatum. These findings suggest a 'Biotic Lock' mechanism: R. campanulatum not only modifies an edaphic niche through soil interference and nutrient dynamics but also exhibits greater physiological relaxation under climatic stress. This study identifies the krummholz forest as a critical biotic frontier that is inhibiting subalpine forest advance through complex edaphic interactions, allelopathic constraints, and higher resilience to moisture stress.

How to cite: Adhikari, R., Granacher, R., Kunz, L., Maharjan, A., Parajuli, M., Subedi, C. K., Gall, C., Seitz, S., Chaudhary, R. P., Oelmann, Y., Boehner, J., Schickhoff, U., and Scholten, T.: Krummholz at the Forefront of Treeline in the Himalaya: The Biotic Lock Decoupling Treeline Shift due to Climate Warming, EGU General Assembly 2026, Vienna, Austria, 3–8 May 2026, EGU26-12186, https://doi.org/10.5194/egusphere-egu26-12186, 2026.

EGU26-12203 | Orals | BG3.11

Assessing the impact of land-use history on soil fungal diversity and carbon sequestration across Mediterranean and temperate forests 

Teresa E. Gimeno, Henna Tyyskä, Albert Vilà-Cabrera, Miriam Selwyn, Josep Maria Espelta, Pablo Fernández-Cacelo, and Estefanía Muñoz

Forests in south-western Europe are expanding spontaneously as a result of the abandonment of traditional land-uses. Expanding forests can recover aboveground biodiversity, biomass and structure within a few decades. Yet, the impacts of land-use belowground might not recover at the same pace, compromising long-term nutrient cycling, carbon (C) sequestration, resistance and resilience to drought and other extreme climatic events. Such ecosystem functions rely on the activity of soil dwelling organisms and in mid-latitude forests, ectomycorrhizal (ECM) fungi are arguably the most crucial player for maintaining nutrient, carbon and water cycling. Still, the recovery of ECM communities during forest expansion and its link to long term C storage remain underexplored. Here, we assess how land-use history changes the diversity and structure of ECM communities and how these changes have altered the C sink capacity. We selected forests that established after the second half of the XXth century, following the first massive rural exodus in Spain, and pre-existing forests. Our study encompasses three forest types with contrasting climatic conditions and functional attributes dominated by: Pinus uncinata (pre-alpine, evergreen needleleaved), Fagus sylvatica (temperate, deciduous broadleaved) and Quercus ilex (Mediterranean, evergreen broadleaved). In autumn 2025, we collected soil samples  in these forests to analyse: (1) ECM fungal community composition and structure, using molecular techniques; (2) C storage and the ratio of labile vs. stable soil C; and (3) age of soil bulk C and of respired C, by measuring Δ14C. Analyses of preliminary data showed that the C:N ratio was higher in mature than in recently established forests, regardless of the dominant species, but the trends for total C and N content varied among forest types: total N content was higher in recently established F. sylvatica forests, and total C was higher in mature Q. ilex forest, whereas in P. uncinate forest, we did not find significant differences for total C or N. We suggest that a combination of differences in land-use history, and functional attributes could underlie these results . In turn, we expect that soil nutrient ratios will underlie functional soil attributes and in future analyses, we expect to find higher relative abundance of ECM types with long hyphae and longer C retention time a s the C:N ratio increases.

How to cite: Gimeno, T. E., Tyyskä, H., Vilà-Cabrera, A., Selwyn, M., Espelta, J. M., Fernández-Cacelo, P., and Muñoz, E.: Assessing the impact of land-use history on soil fungal diversity and carbon sequestration across Mediterranean and temperate forests, EGU General Assembly 2026, Vienna, Austria, 3–8 May 2026, EGU26-12203, https://doi.org/10.5194/egusphere-egu26-12203, 2026.

EGU26-12923 | Posters on site | BG3.11

Assessing the impact of measurement uncertainty on functional diversity metrics 

Javier Pacheco-Labrador and Christian Rossi

Remote sensing pursues the estimation of vegetation functional diversity. For that, both measurements of spectral variables and plant functional traits must be performed. However, these measurements encompass the intrinsic component of uncertainty (i.e., any measurement is composed of the measured value and the associated uncertainty). Uncertainty can take different forms: systematic biases with respect to the true value, or random variations that may or may not be correlated with it. Different measurands can be sampled independently (e.g., foliar and structural traits) or simultaneously (e.g., spectral radiance at different bands), and their uncertainties may exhibit different degrees of correlation. The different uncertainties propagate from the measurands to the derived variables of interest. Whereas remote sensing has mostly focused on the propagation of uncertainties to measurands representing the averaged value of an observation (e.g., the pixel reflectance factor), the effect on estimates of their diversity (i.e., functional diversity metrics), while different, remains unclear.

To fill this gap, we simulate synthetic measurements and introduce different types and magnitudes of uncertainty, evaluating their impact on various functional diversity metrics. While abstract, this exercise allows us to understand the role of each uncertainty type across different metric formulations via a Monte Carlo approach. For a clearer understanding of practical cases, we further use the Biodiversity System Simulation Experiment (BOSSE) to perform this assessment under synthetic landscapes.

Preliminary results suggest that the impact of uncertainty depends on the formulation of the functional diversity metric, but that standardization and principal component analysis applied to the spectral or plant functional traits attenuate some of the sources of uncertainty.

How to cite: Pacheco-Labrador, J. and Rossi, C.: Assessing the impact of measurement uncertainty on functional diversity metrics, EGU General Assembly 2026, Vienna, Austria, 3–8 May 2026, EGU26-12923, https://doi.org/10.5194/egusphere-egu26-12923, 2026.

EGU26-13167 | ECS | Posters on site | BG3.11

Predisposing factors to Landsat based greening trends in the Italian forestline ecotones  

Lorena Baglioni, Alessandro Vitali, Philippe Choler, Arthur Bayle, Matteo Garbarino, Donato Morresi, Fabio Gennaretti, and Carlo Urbinati

In Europe, alpine treelines are shifting upward under the combined influence of climate and land-use change. In the Mediterranean basin, historical human pressure has significantly lowered treeline elevations, and these legacy effects continue to shape their present-day trajectories. Such legacies are expected to contribute to the contrasting patterns observed between the Alps and the Apennines, the two main Italian mountain ranges. Because treeline ecotones are key for mountain biodiversity and ecosystem services, consistent monitoring is crucial. Satellite remote sensing—especially multi-decadal time series of vegetation indices (VIs)— offers a promising avenue to study forest dynamics and treeline shift. Here, we present a semi-automatic and reproducible method to delineate the uppermost forestlines and to identify significant hotspots of change. We then evaluate the main topographic, climatic, and anthropogenic factors predisposing to treeline dynamics according to the long-term increase of VIs. We integrated national and international open-source datasets within a semi-automatic workflow to detect uppermost forestlines based on vertical distances between forest pixels and their relative highest peaks. We assessed greening along a forestline buffer representing the treeline ecotone using a 40-year Landsat NDVI time series (1984–2023). Trend significance was tested with contextual Mann–Kendall statistics, while Theil–Sen slopes quantified the magnitude of change. Finally, we used Random Forest models to investigate the relative importance of predisposing factors. Highest forestline elevations occur in the Alps, where larger elevation ranges and the dominance of conifers appear to be associated with upward shifts. In contrast, Apennine treelines are mainly formed by European beech; its heavier seeds likely limit upslope encroachment, favouring gap infilling processes over treeline upward shift. Overall, this study contributes a standardized framework for mapping forestlines and analysing the predisposing factors of greening dynamics. The approach is transferable to other mountain regions, supporting comparisons across space and time.

How to cite: Baglioni, L., Vitali, A., Choler, P., Bayle, A., Garbarino, M., Morresi, D., Gennaretti, F., and Urbinati, C.: Predisposing factors to Landsat based greening trends in the Italian forestline ecotones , EGU General Assembly 2026, Vienna, Austria, 3–8 May 2026, EGU26-13167, https://doi.org/10.5194/egusphere-egu26-13167, 2026.

EGU26-13377 | Posters on site | BG3.11

Regular patterns and context-dependent deviations in successional trajectories of spontaneously developed semi-natural forests on abandoned farmland in Hungary 

László Demeter, Csaba Molnár, Ákos Bede-Fazekas, Ábel Péter Molnár, Gergely Zagyvai, and Zsolt Molnár

Spontaneously developed forests (SDFs) dominated by native tree species have expanded across vast areas of abandoned farmland in Central and Eastern Europe in the last decades. These forests hold considerable potential for contributing to the semi-natural forest restoration objectives of the European Union’s Nature Restoration Regulation. However, their effective management requires robust, comparative, and evidence-based research, while SDFs remain insufficiently studied in the Carpathian Basin. We aimed to assess how site locality, historical land use, and time since abandonment shape the species composition of spontaneously developed semi-natural forests across three forest landscape types in Hungary (riverine oak–ash–elm forests, mesic hornbeam–sessile oak forests, and thermophilous turkey oak–sessile oak forests). We surveyed the species composition of the canopy, shrub, and herb layers at 358 sampling points. Ordination analyses based on species cover data revealed that site locality, land-use history, and time since abandonment each contribute to deviations from general species-compositional patterns within forest layers and across landscape types. We found that the number of forest-generalist herbaceous species increased markedly following abandonment, reaching levels comparable to reference ancient forests already in 25–50-year-old stands across all habitat and land-use categories. In contrast, the number of forest-specialist species exhibited habitat-specific successional trajectories. These findings highlight the importance of management approaches that maintain the distinct species-compositional patterns of spontaneously developed forests on former farmland, thereby favouring close-to-nature and low-intensity forestry practices.

How to cite: Demeter, L., Molnár, C., Bede-Fazekas, Á., Péter Molnár, Á., Zagyvai, G., and Molnár, Z.: Regular patterns and context-dependent deviations in successional trajectories of spontaneously developed semi-natural forests on abandoned farmland in Hungary, EGU General Assembly 2026, Vienna, Austria, 3–8 May 2026, EGU26-13377, https://doi.org/10.5194/egusphere-egu26-13377, 2026.

Mountain ecosystems play a critical role in global biodiversity conservation, water regulation, and climate change adaptation. However, their pronounced topographic complexity poses major challenges for the large-scale estimation of plant functional traits using remote sensing, limiting our ability to characterize ecosystem functioning and vegetation responses to global warming. Variations in slope, aspect, and elevation strongly affect illumination conditions, viewing geometry, and canopy structure, introducing biases that are often overlooked in trait–reflectance relationships. Vegetation indices and empirical models are widely used to estimate plant traits from optical remote sensing data, yet their performance degrades in complex terrain due to topographic artifacts and limited field calibration data. Alternatively, radiative transfer models (RTMs) provide a physics-based framework for linking spectral reflectance to vegetation biophysical and biochemical properties. Despite their theoretical advantages, most commonly used RTMs assume flat or gently sloping terrain and are therefore poorly suited for mountainous landscapes, potentially compromising trait retrievals in these environments.

In this study, we quantify the influence of terrain complexity on the performance of both empirical and physically based models applied to hyperspectral data for estimating functional leaf traits in Andean forest ecosystems. Field data were collected in more than 120 plots distributed according to a fractal sampling design across strong gradients in elevation, slope, and aspect in the Mapocho River basin (central Chile). For each plot, we measured species abundance, leaf-level functional traits, and topographic variables, and linked these data with airborne hyperspectral reflectance. Our results show that model performance is highly sensitive to terrain conditions. Across traits and modelling approaches, explained variance ranged from near zero to approximately 50%, substantially lower than values typically reported in studies conducted in low-relief landscapes. Trait-specific responses were evident: some functional traits were better explained by spectral reflectance, while others were more strongly associated with topographic variables alone. Residual analyses further revealed systematic terrain-driven biases, indicating that both empirical models and RTMs struggle to disentangle spectral signals related to plant traits from those induced by complex topography.

These findings highlight a strong methodological and geographical bias in current remote sensing approaches for trait estimation, driven by the predominance of studies conducted in flat or gently undulating terrain. Because mountainous regions are essential for biodiversity, ecosystem services, and climate sensitivity, excluding or oversimplifying topographic effects limits the transferability and scalability of trait-based remote sensing models. Our study underscores the urgent need to develop terrain-aware modelling frameworks that explicitly integrate topography into hyperspectral trait estimation to improve ecological inference and support monitoring efforts in complex mountain systems.

How to cite: Lopatin, J.: Too much topography! Effects of topography on the estimation of plant functional traits using hyperspectral data, EGU General Assembly 2026, Vienna, Austria, 3–8 May 2026, EGU26-15464, https://doi.org/10.5194/egusphere-egu26-15464, 2026.

EGU26-15525 | ECS | Orals | BG3.11

Bridging the gaps between field-based ecology and remote sensing to estimate plant functional diversity: a systematic review 

José Cerda-Paredes, Dylan Craven, and Javier Lopatin

Understanding plant functional diversity across scales requires integrating field-based ecology and remote sensing, yet these disciplines differ in how traits are measured, and upscaled. We synthesized three decades of research to evaluate conceptual and methodological convergence between these disciplines. Our results reveal that field-based ecology has undergone longer conceptual development and covers a broader range of traits, while remote sensing has experienced rapid growth driven by technological advances. Despite these differences, both disciplines are increasingly converging on similar concepts. However, major gaps in empirical coverage persist across biomes in both disciplines. While vegetation-dominated ecosystems have been extensively studied, extreme ecosystems remain comparatively undersampled. Trait analyses demonstrate a broad conceptual flexibility in defining "functional traits", yet both disciplines converge on a core set (e.g., plant height, leaf area, and leaf nitrogen content), reflecting their central role in plant strategies and spectral detectability. Remote sensing approaches differ in whether functional diversity is inferred from spatially aggregated mixtures at the pixel or community level or from resolved individual plants. Our synthesis underscores the potential for methodological synergy. Harmonizing trait definitions, scaling assumptions, and computational steps is essential to building a unified, multiscale framework for monitoring functional diversity in the context of global change.

How to cite: Cerda-Paredes, J., Craven, D., and Lopatin, J.: Bridging the gaps between field-based ecology and remote sensing to estimate plant functional diversity: a systematic review, EGU General Assembly 2026, Vienna, Austria, 3–8 May 2026, EGU26-15525, https://doi.org/10.5194/egusphere-egu26-15525, 2026.

EGU26-16158 | Posters on site | BG3.11

AI-BioDynamics: Artificial Intelligence for Biodiversity Mapping and Conservation Decision-Making 

Seonyoung Park, Minji Koh, Haedam Baek, Minsu Cho, Byung-gil Kim, Zeyd Boukhers, Gyunam Park, Christian Beilschmidt, and Johannes Drönner

Globally, accelerated human activities and climate change have driven a continuous decline in natural ecosystems, resulting in habitat fragmentation and overall biodiversity loss. In response to this crisis, the international community adopted the Global Biodiversity Framework (GBF) at the 15th Conference of the Parties to the Convention on Biological Diversity (CBD COP15) in 2022, highlighting spatial planning–based biodiversity management as a central strategy. Consequently, there is a growing demand for spatial datasets with global consistency and high accuracy to enable quantitative assessment of ecosystem-related indicators. The Global Ecosystem Typology (GET) proposed by the International Union for Conservation of Nature (IUCN) provides a standardized framework and spatial information for consistent ecosystem classification at the global scale. However, the existing GET spatial datasets are produced at a global resolution, which limits their applicability at the national level due to spatial resolution mismatches and reduced classification accuracy for ecosystem types. In this study, we developed an IUCN GET ecosystem map for the Republic of Korea using time-series Landsat satellite imagery. Ecosystem classification was conducted for the period (2020–2024) using machine learning and deep learning approaches, resulting in ecosystem maps comprising 36 classes specific to Korea. The modeling results achieved an overall classification accuracy of approximately 85%, with several ecosystem classes exceeding 90% accuracy. The results of this study enable rapid and efficient detection of long-term and large-scale ecosystem changes. Furthermore, the enhanced precision and accuracy of ecosystem type classification support detailed ecosystem area analysis and provide a foundation for biodiversity conservation–oriented spatial planning.

How to cite: Park, S., Koh, M., Baek, H., Cho, M., Kim, B., Boukhers, Z., Park, G., Beilschmidt, C., and Drönner, J.: AI-BioDynamics: Artificial Intelligence for Biodiversity Mapping and Conservation Decision-Making, EGU General Assembly 2026, Vienna, Austria, 3–8 May 2026, EGU26-16158, https://doi.org/10.5194/egusphere-egu26-16158, 2026.

EGU26-16873 | ECS | Posters on site | BG3.11

Land Use Land Cover changes and their drivers since 1860 within the French northern Alps 

Clémentine Mutillod, Noémie Delpouve, Cyrille Rathgeber, Jean-Luc Dupouey, Nathalie Leroy, Sylvain Mollier, Baptiste Nicoud, Arthur Bayle, Matteo Garbarino, Nicolò Anselmetto, Nicolas Eckert, Philippe Janssen, and Laurent Bergès

Studying Land Use and Land Cover Changes (LULCC) and their drivers is essential for understanding the past origins of current landscapes and anticipating their future evolution. Moreover, such analyses can help prioritize and plan conservation and restoration strategies.

From the Middle Age to the 19th century in Western Europe, humans - driven by population growth – have altered the natural vegetation succession, notably through forest clearing to establish cultivated fields and pastoral farming systems. Thanks to the industrial revolution and the resulting technical advances which resulted in agriculture mechanization and intensification, important phases of rural exodus happened, inducing waves of land abandonment used for agriculture or pastoralism. Mountainous areas were particularly affected, especially due to their difficult access and their low productivity. The aims of this study were (a) to characterize land-use transitions, with a particular focus on forests, and (b) to analyse the biophysical and socioeconomic drivers of these changes.

We focused on the northern part of the French Alps, which is divided into three eco-regions covering an area of 726 953 ha: Northern Prealps, Inner Northern Alps, External Northern Alps. We used historical maps and aerial photography to analyse LULCC across four periods from 1860 to 2023. Based on the literature, we selected a set of drivers including biophysical drivers (precipitations, temperature, topography, substrate type, avalanches), landscape configuration drivers (distance and percent cover of pre-existing forest, distance to pastoral units, distance to river) and socio-economic drivers (population density and change, distance to settlement, road density, tourism density, number and rate of change of pastoral units). This dataset allows us to analyse land-use changes over a long-time span (approximately 160 years) and at a large spatial scale.

To analyses changes between different dates, we used a grid of systematic points, with a density of one point per hectare, to generate several transition matrices. To assess the effect of drivers on LULCC we performed logistic regression models. Specifically, we fitted models of LULCC or forest recovery as a smooth or linear function of the different drivers. We also took into account potential biases in the results of the different models related to spatial autocorrelation of observations by integrating distance based on the sample variogram of the residuals obtained from a model without spatial dependence. Overall, we expect a global forest expansion, with positive effects of lower precipitations, steeper slopes, substrate type (hard), lower population density and pastoral decline, and negative effect of high tourism density and avalanches. Preliminary results will be presented at the conference.

How to cite: Mutillod, C., Delpouve, N., Rathgeber, C., Dupouey, J.-L., Leroy, N., Mollier, S., Nicoud, B., Bayle, A., Garbarino, M., Anselmetto, N., Eckert, N., Janssen, P., and Bergès, L.: Land Use Land Cover changes and their drivers since 1860 within the French northern Alps, EGU General Assembly 2026, Vienna, Austria, 3–8 May 2026, EGU26-16873, https://doi.org/10.5194/egusphere-egu26-16873, 2026.

EGU26-19803 | Posters on site | BG3.11

Hardwoods on the rise: regeneration trends in Central European mountain forests over two decades 

Ugo Molteni, Meinrad Abegg, Andrea Doris Kupferschmid, Barbara Moser, Petia Simeonova Nikolova, Daniel Scherrer, and Thomas Wohlgemuth

Mountain forests provide essential ecosystem services, including protection against natural hazards, carbon storage, and biodiversity habitat. Climate change threatens the continuous provision of these services and is driving anticipated shifts in tree species ranges across elevation gradients. Understanding current regeneration dynamics is critical for predicting future forest composition and guiding adaptive management.
We analyzed two decades (2004-2023) of tree regeneration data from 2,377 plots across seven forest types spanning 1.3 million ha and an elevation gradient from 200 to 2,300 m asl in the Swiss Jura mountains and Alps. Using data from the Swiss National Forest Inventory and statistical models accounting for repeated measurements (generalized estimating equations), we assessed trends in presence for 20 tree species in two height classes: small saplings (40-129 cm height) and tall saplings (≥130 cm, DBH <12 cm).
Broadleaf species showed widespread expansion (35% of models), particularly among small saplings in low- to mid-montane forests (Beech, Fir-Beech, and Fir-Spruce types). Sycamore maple (Acer pseudoplatanus) and goat willow (Salix caprea) expanded most consistently across elevation gradients, establishing extensively in historically conifer-dominated forests. European beech (Fagus sylvatica) increased its presence in mixed-montane forests. Silver fir (Abies alba) exhibited a notable pattern in Fir-Beech forests: an increase in small saplings and a decrease in tall saplings, suggesting potential recruitment bottlenecks. European ash (Fraxinus excelsior) declined significantly across its range. At low elevations, oaks (Quercus spp.) failed to expand beyond their current forest types, while at high elevations, European larch (Larix decidua) saplings decreased in Stone Pine and Larch forests.
To identify potential drivers of these trends, we tested multiple environmental and stand variables. Basal area, temperature, and species richness emerged as the most important explanatory factors associated with observed shifts in regeneration patterns.
These results reveal substantial compositional shifts toward more broadleaf species in Central European mountain forests, with important implications for future ecosystem service provision, forest management strategies, and climate adaptation planning.

How to cite: Molteni, U., Abegg, M., Kupferschmid, A. D., Moser, B., Nikolova, P. S., Scherrer, D., and Wohlgemuth, T.: Hardwoods on the rise: regeneration trends in Central European mountain forests over two decades, EGU General Assembly 2026, Vienna, Austria, 3–8 May 2026, EGU26-19803, https://doi.org/10.5194/egusphere-egu26-19803, 2026.

EGU26-20456 | Orals | BG3.11

Dynamics of ecosystem services in response to land use and climate change: a case study in the eastern Italian Alps  

Marco Ciolli, Paolo Zatelli, Gianluca Grilli, and Clara Tattoni

Alpine forest cover has increased in recent decades due to socioeconomic factors and climate change. This study focuses on the evolution of the ecosystem services offered by the forest in the Paneveggio region (Trentino, Central Eastern Alps, Italy) since 1954. Although the expansion of the forests could be viewed as a renaturalization, this trend also affected habitats diversity and landscape after the 1990s. The Vaia windstorm that hit the area in 2018 caused significant damage, underscoring the necessity of accurate ecosystem service quantification. In accordance with the Common International Classification for Ecosystem Services (CICES), this work aims to quantify some of the ecosystem services that the forest provides over time using a spatio-temporal approach, recognizing the complexities of ecological, social, and economic drivers shaping contemporary landscapes. We performed GIS spatial analysis using GRASS GIS, QGIS and a set of maps of forest coverage that were obtained from historical maps and aerial photos. Information on provisioning services, including wildlife trends, timber, and cattle numbers, was gathered from a variety of literature sources. Carbon stock and erosion protection were computed, the latter using the Revised Universal Soil Loss Equation (RUSLE). The sales of postcards showing the same landscape over time were used to gauge aesthetic preferences. Between the 1950s and 2018, the area covered by forests increased steadily, bringing with it all the benefits directly associated with trees, such as protection from erosion and carbon stock. However, biodiversity showed a more complicated pattern, with losses in open areas benefiting species that live in forests while harming priority habitats. Additionally, there was a fluctuating pattern in aesthetic preferences, indicating a preference for a well-balanced landscape of trees and grass. After 2018, some services were reduced, including protection and aesthetics, because of fallen and standing dead trees and the building of avalanche defence systems to cope with deforestation. To raise awareness of climate change, some of the fallen areas were turned into outdoor laboratories and opportunities for the development of multi-species forests, even attracting disaster tourism. Forest landscapes are constantly changing, requiring adaptive management strategies that address climate change while sustaining biodiversity, ecosystem services, and human value. Gathering information from several data sources is advocated by many authors as most appropriate to develop an evidence-based management strategy tailored to local situation. Developing long-term solutions to deal with a changing climate and society can be aided by an understanding of historical ecosystem dynamics. Our study contributes to a multidisciplinary understanding of past changes in Alpine environments and highlights the importance of ecosystem connectivity and restoration across spatial and temporal scales. This integrated perspective supports innovative mountain landscape planning and promotes biodiversity conservation amid growing pressures from anthropization and climate change. Forest management should integrate climate challenges into a broader landscape vision that balances ecological sustainability, forest production, and human–wildlife coexistence. This approach promotes resilience through mountain landscape diversification, supports ecosystem services, and provides a clear narrative of landscape change for the public and policymakers, encouraging inclusive, historically informed planning.

How to cite: Ciolli, M., Zatelli, P., Grilli, G., and Tattoni, C.: Dynamics of ecosystem services in response to land use and climate change: a case study in the eastern Italian Alps , EGU General Assembly 2026, Vienna, Austria, 3–8 May 2026, EGU26-20456, https://doi.org/10.5194/egusphere-egu26-20456, 2026.

EGU26-21041 | Posters on site | BG3.11

Mapping recruitment patterns at alpine treeline ecotones using UAV-based LiDAR and multispectral data 

Alessandro Vitali, Francesco Atzeni, Mattia Balestra, Federico Fiorani, Matteo Garbarino, Carlo Urbinati, Fabio Gennaretti, and Emanuele Lingua

Monitoring vegetation dynamics is crucial for assessing the effects of global change on mountain ecosystems, particularly at treeline ecotones where tree recruitment success is highly variable and largely influenced by fine-scale site conditions. This study integrates ground-based surveys with UAV-based LiDAR and multispectral (MS) data to investigate recruitment patterns across two Alpine treelines in Italy (Mt. Genevris, Piedmont; Mt. Becco di Mezzodì, Veneto). During the 2024 and 2025 summer seasons, we conducted ground-based measurements along altitudinal transects spanning the treeline ecotone, from the upper ecotone limit down to the closed-canopy forest. We mapped trees and saplings using a GNSS rover, and we measured basal diameter and tree height. On the same slopes, we acquired and processed UAV LiDAR and MS imagery to derive high-resolution 3D point cloud. With the collected data, we derived canopy height model, microtopography, land-cover classification and MS metrics describing vegetation spectral variability. We used field-mapped individuals to train and validate machine-learning models for detecting individual trees and producing georeferenced point datasets across entire slopes. These individual-level spatial data enabled spatial point-pattern analyses to assess recruitment structure along the treeline, testing for facilitation versus competition among individuals in relation to key biotic elements (i.e. shrubs and patches). In addition, we examined establishment patterns in relation to microclimatic proxies derived from UAV-based topographic features, including indices of potential solar radiation, heat load and moisture availability. This integrated LiDAR–MS UAV framework, anchored to ground-truth data, enables individual mapping of treeline recruitment across entire slopes at spatial resolutions not achievable through ground surveys alone. By linking 3D structure, spectral information and spatial point-pattern analysis, this research approach improves the interpretation of micro-environmental controls on establishment niches and provides a transferable framework for scalable treeline monitoring under ongoing climate change.

How to cite: Vitali, A., Atzeni, F., Balestra, M., Fiorani, F., Garbarino, M., Urbinati, C., Gennaretti, F., and Lingua, E.: Mapping recruitment patterns at alpine treeline ecotones using UAV-based LiDAR and multispectral data, EGU General Assembly 2026, Vienna, Austria, 3–8 May 2026, EGU26-21041, https://doi.org/10.5194/egusphere-egu26-21041, 2026.

EGU26-3450 | PICO | BG3.12

Economic Insights and a Systematic Framework for Creating Resilient Forests: Transitioning from Reactive to Proactive Restoration in Slovenia 

Gregor Bozic, Andreja Ferreira, Gal Kusar, Anze Martin Pintar, Marijana Minic, and Bostjan Mali

Escalating natural disturbances in Central Europe necessitate restoration strategies that prioritize ecological integrity and adaptive capacity. Over the last decade, Slovenian forests—traditionally managed via close-to-nature silviculture—faced historic damage from a catastrophic 2014 ice storm, followed by extraordinary windthrows (2017, 2018, 2023) and subsequent bark beetle outbreaks. These events have rendered natural regeneration alone insufficient to preserve forest functions within acceptable timeframes.

Analyzing Slovenia Forest Service data (2007–2020), this study evaluates the economics of artificial forest restoration across 14 forest management regions. Based on an extensive data analysis conducted by the author (Bozic et al. 2025), we found that €33.6 million was invested to restore 5,353 ha via planting and 457 ha via sowing. Costs were dominated by planting (53%) and protection against game animals (42%). Crucially, natural disasters shifted management dynamics, with disaster-related restoration (planting) rising from 42% pre-2014 to 76% by 2020.

These findings advocate for a shift from reactive forest restoration toward proactive forest structures based on two pillars. First, we see the synergy between genetic adaptation of seed sources and nursery production as vital for seedling survival in extreme environments. To mitigate economic burdens, we propose: (1) differentiated co-financing for resilient mixtures; (2) increased use of sowing; (3) systematic investments in forest stability; and (4) fiscal incentives for quality containerized seedlings and protection against wildlife.

Second, forest restoration could be operationalized through a systematic five-step framework for future forests, co-developed by the authors (Kovac et al. 2024). By integrating site-specific actions into broader landscape goals, this holistic approach ensures consistent decision-making and equitable promotion of all sustainability components—ecological, social, and economic—by treating stands as building blocks of functional habitats. Adhering to the precautionary principle, the framework integrates: (1) environmental zoning via structured forest planning situation analysis; (2) climate-optimal species selection based on desired future portrayals and specific stand-level goals, such as species mingling; (3) the identification of climate-resilient seed sources and provenances to ensure that seedlings possess the genetic plasticity required for optimal growth and long-term adaptation to specific site conditions over several decades; (4) specialized silvicultural models executed via site-specific planting blueprints; and (5) adaptive monitoring. This path, supported by the author's extensive data analysis (Bozic et al. 2025) and personal field leadership, provides a foundation for a scientifically grounded transition from disaster-related restorations toward resilient, high-value forest ecosystems.

How to cite: Bozic, G., Ferreira, A., Kusar, G., Pintar, A. M., Minic, M., and Mali, B.: Economic Insights and a Systematic Framework for Creating Resilient Forests: Transitioning from Reactive to Proactive Restoration in Slovenia, EGU General Assembly 2026, Vienna, Austria, 3–8 May 2026, EGU26-3450, https://doi.org/10.5194/egusphere-egu26-3450, 2026.

EGU26-3998 | ECS | PICO | BG3.12

Enhancing Sustainability in Mediterranean Agroforestry Systems: A Living Lab ‘Follow-the-Thing’ Assessment of Products and Value Chains 

Ismail Ait lahssaine, Mohammed El Hafyani, Mohammed Hssaisoune, Paride D’Ottavio, Abdelwahed Chaaou, Hamza Ait-Ichou, Elhousna Faouzi, Sokaina Tadoumant, Brahim Meskour, Safae Ijlil, and Lhoussaine Bouchaou

Mediterranean agroforestry represents a diverse set of socio-ecological systems that provide a variety of agri-food products while preserving key ecosystem services, and linking local value chains to international consumers. However, increasing pressures from intensive production practices and environmental change threaten its long-term sustainability. In response, the PRIMA section 2 SHARE (Shared Innovations for Mediterranean Agroforestry Systems) project focuses on the resilience of tree-based agroforestry systems through Living Lab approaches, promoting the co-creation, stakeholder engagement, and collaborative innovation within public-private partnership. This study uses an interdisciplinary approach to assess the present status of agroforestry products and their interactions with consumers across the Mediterranean region. The analysis combines a review of academic literature, policy documents, and project reports with qualitative value-chain assessments conducted in selected living labs, using a “follow-the-thing” method to monitor products from production to consumption. The analysis is based on the first step in the argan-based agro-sylvo-pastoral system of Ait Souab-Ait Mansour, registered under the Globally Important Agricultural Heritage System (GIAHS) Programme and located within the Arganeraie Biosphere Reserve in Souss Massa region of Morocco. This case study is compared with other typical agroforestry systems, including olive groves in Central Italy, tree-trained vineyards in Occitanie (France), the Montado system in southern Portugal, olive groves with livestock grazing in Cyprus and in south-eastern Tunisia. The outcomes of the comparative study highlight challenges and system-specific synergies, as well as consumer preferences that can support the development of more sustainable agroforestry value chains.

Keywords: Agroforestry, Value chains, Ecosystem Services, Mediterranean region, argan system.

How to cite: Ait lahssaine, I., El Hafyani, M., Hssaisoune, M., D’Ottavio, P., Chaaou, A., Ait-Ichou, H., Faouzi, E., Tadoumant, S., Meskour, B., Ijlil, S., and Bouchaou, L.: Enhancing Sustainability in Mediterranean Agroforestry Systems: A Living Lab ‘Follow-the-Thing’ Assessment of Products and Value Chains, EGU General Assembly 2026, Vienna, Austria, 3–8 May 2026, EGU26-3998, https://doi.org/10.5194/egusphere-egu26-3998, 2026.

We evaluated the long-term development, ecological performance, and carbon dynamics of reclaimed and unreclaimed post-mining forest sites on coal spoil heaps in northwestern Czech Republic. Using historical aerial photographs, field inventories, and repeated surveys spanning 12–90 years, we characterized spontaneous forest succession and compared it with alder-reclaimed sites. Early successional stages on unreclaimed sites were dominated by pioneer species, primarily silver birch (Betula pendula), goat willow (Salix caprea), and aspen (Populus tremula), with Norway spruce (Picea abies) establishing naturally in intermediate stages. A 90-year-old site approached climax forest, hosting 21 woody species dominated by pedunculate oak (Quercus robur) and European beech (Fagus sylvatica).

Tree density and biomass were initially higher on reclaimed sites however in intermediate stages of sucession tree biomas in unreclaimed sites exceed reclaimed ones. Ecosystem measurements using eddy covariance showed that unreclaimed sites functioned as stronger carbon sinks (−256 g C m⁻² yr⁻¹) than alder-reclaimed sites (−166 g C m⁻² yr⁻¹).  Unreclaimed sites supported more favorable conditions for the establishment, growth, and mycorrhizal colonization of climax species namely Oak, beach and spruce, linked to lower soil pH, higher organic matter, and richer soil biota. Repeated surveys revealed sustained natural recruitment and relatively low mortality rates of climax species which ensure succesful establishment despite being several kilometers from seed sources.

Overall, spontaneous succession produced structurally and functionally diverse forests with comparable or superior long-term performance and carbon sequestration relative to conventional reclamation, highlighting the ecological value of unassisted forest recovery while suggesting cautious use of nitrogen-fixing plantations.

How to cite: Frouzova, J. and Frouz, J.: Long term comparison of post mining site restoration with unassisted forest recovery, EGU General Assembly 2026, Vienna, Austria, 3–8 May 2026, EGU26-6923, https://doi.org/10.5194/egusphere-egu26-6923, 2026.

EGU26-7741 | PICO | BG3.12

Testing NBS and assisted migration to restore a burnt forest in the Dolomites 

Flavio Taccaliti, Francesco Sforza, Tommaso Baggio, Francesco Atzeni, Davide Marangon, and Emanuele Lingua

Post-disturbance active forest restoration is common in Europe, but climate change, new socioeconomic conditions, and scientific knowledge acquired in the last years are highlighting the inefficiencies of some business-as-usual practices. Especially after forest fires, the frailty of the burnt ecosystem calls for the use of low-impact interventions focused on nature-based solutions (NBS), taking advantage of biological legacies on the site, instead of site preparation and regular-scheme planting. This study presents an ongoing experiment set in one of the largest burnt areas on record in the Dolomites (Taibon Agordino, Italy). Although the forest is already recovering, the presence of invasive species, major changes in forest species composition, and the presence of cascade disturbances in nearby stands triggered the interest in local managers to test novel restoration interventions. Propagules (seeds, seedlings) of Quercus pubescens Mill. have been deployed near biological legacies (shrubs, branches, logs) used as NBS, along with sensors for air temperature and light intensity. We hypothesise that the selected biological legacies enhance the local microclimate and protect propagules from limiting factors such as deer browsing. The tree species selected is not present in the area yet, but it thrives in similar conditions in the Western Alps, and it is expected to adapt to the drier and warmer conditions anticipated with climate change. This intervention represents one of the first examples of assisted migration in the region, paving the way for further trials in the Eastern Alps. Survival and growth of the plants will be monitored periodically over the first two growing seasons, together with microclimate variations near the biological legacies. Preliminary results already show some differences between the experimental treatments. Local stakeholders shared great interest in the outcomes of this study, which can provide new solutions for post-fire forest restoration under a changing climate, in a region where forests provide multiple and highly valued ecosystem services.

How to cite: Taccaliti, F., Sforza, F., Baggio, T., Atzeni, F., Marangon, D., and Lingua, E.: Testing NBS and assisted migration to restore a burnt forest in the Dolomites, EGU General Assembly 2026, Vienna, Austria, 3–8 May 2026, EGU26-7741, https://doi.org/10.5194/egusphere-egu26-7741, 2026.

EGU26-8314 | PICO | BG3.12

Guidelines for Climate Adaptive Forest Restoration and Reforestation Projects 

John Stanturf, Pedro Villar-Salvador, Barbara Mariotti, Vladan Ivetić, Palle Madsen, Antonio Montagnoli, Enrique Andivia, Ieva Bebre, Anastazija Dimitrova, and Marcin Klisz

The Guidelines for Climate Adaptive Forest Restoration and Reforestation Projects address key questions for climate adaptive forest restoration and reforestation success. Forestry professionals often encounter complex issues related to climate change and the need to adapt forest management practices while preserving biodiversity and maintaining sustainable ecosystems. This book is a compendium of practices based on robust and up-to-date knowledge. The 11 chapters of this guideline focus on the main research questions: how to set the goals of reforestation; how to select the best forest reproductive material; how to determine the appropriate attributes and methods to produce Forest Reproductive Material; and how to apply the best forest establishment techniques and develop post-planting protection and silviculture? Although this work mainly refers to the context of European forestry, practitioners, scientists, environmentalists and decision-makers worldwide will find guidance on how to address the challenges of climate-resilient forest management. Thanks to the joint efforts of 10 editors and 130 authors, scientists, and experts in climate-smart forestry, members of PEN-CAFoRR (Pan-European Network for Climate Adaptive Forest Restoration and Reforestation) COST Action (CA19128), a unique publication has been developed to meet the growing demand for practical knowledge. We are now entrusting this book to people who are deeply committed to the idea of maintaining and shaping future forests. The guideline is available in open access formula.

How to cite: Stanturf, J., Villar-Salvador, P., Mariotti, B., Ivetić, V., Madsen, P., Montagnoli, A., Andivia, E., Bebre, I., Dimitrova, A., and Klisz, M.: Guidelines for Climate Adaptive Forest Restoration and Reforestation Projects, EGU General Assembly 2026, Vienna, Austria, 3–8 May 2026, EGU26-8314, https://doi.org/10.5194/egusphere-egu26-8314, 2026.

EGU26-13793 | PICO | BG3.12

Can we leave it to nature? – post-fire tree regeneration in Białowieża Forest 

Ewa Zin, Marcin Churski, Martyna Bielak, Anders Granström, Kamil Pilch, Łukasz Kuberski, Elias Elfverson, Kamil Morawski, Brian Verhoeven, and Mats Niklasson

Fire is an important disturbance in European forests, particularly in the Mediterranean region. However, the effects of climate change on fuel availability and fire weather, combined with the widespread dominance of conifer monocultures, high population density, and the significance of human-caused ignition, support predictions of increasing fire risk in temperate Central Europe – a phenomenon likely to necessitate expanded post-fire forest restoration. The non-intervention approach based on ecological succession is often not favoured over active restoration due to economic considerations or legal requirements. Nevertheless, natural ecosystem recovery has been shown to enable successful tree establishment, support biodiversity, and provide microclimatic benefits. Here, we present data on early (2–5 years) natural tree regeneration following non-stand-replacing wildfires in lowland coniferous forests of Białowieża, northeastern Poland, in relation to burn depth and selected microsite characteristics, collected from sample plots along parallel transects within burnt and unburnt forest sections. Our results demonstrate that fire promoted the establishment of diverse tree taxa, including Pinus, Picea, Quercus, Betula, Populus, and Salix. A higher number of saplings was recorded in burnt plots across all sites, with Pinus and Betula benefiting most from both fire disturbance and burn depth. Furthermore, our findings confirm the importance of fire disturbance for the natural regeneration of Scots pine, which is currently nearly absent in the Białowieża Forest otherwise. Our study contributes to the discussion on fire regimes, post-fire ecosystem recovery, and forest restoration in Central Europe, highlighting the great potential for a non-intervention approach after fire. It also provides baseline information to inform conservation and management strategies in the region.

How to cite: Zin, E., Churski, M., Bielak, M., Granström, A., Pilch, K., Kuberski, Ł., Elfverson, E., Morawski, K., Verhoeven, B., and Niklasson, M.: Can we leave it to nature? – post-fire tree regeneration in Białowieża Forest, EGU General Assembly 2026, Vienna, Austria, 3–8 May 2026, EGU26-13793, https://doi.org/10.5194/egusphere-egu26-13793, 2026.

Drawing from the Millennium Ecosystem Services, planted forests have been increasingly important for provisioning services of wood fiber and commodity production, and have emerged as a unique regulating Nature-based solution (NBS) for climate change adaptation and mitigation. Forest plantations account now for at least 30% of global industrial roundwood production and their contribution can be further increased, while reducing pressures on natural forests. Planted forests have been proposed as one of the most efficient and cost-effective means to store more atmospheric carbon and reduce adverse impacts of climate change in the short- to medium-term, along with improved forest management and reduced emissions from forest area loss.

Increasing the amount and productivity of planted forests is a crucial method to meet increasing timber and climate demands by capturing carbon in forests and subsequent wood products and providing short-run terrestrial energy. They also can help adapt to forest species migration by purposeful introduction of forest species adapted to new climate in a warmer planet, and provide additional forest biodiversity, soil health, and water quality and quantity benefits.

Increases in planted forests to achieve their promise for economic provisioning and climate regulating services mandate that a host of technical, research, policy issues must be resolved quickly. These include technical questions such as (1) the trends and magnitude of planted forests extent needed to increase production and climate roles; (2) the relative benefits of plantations versus natural forest restoration or retention for carbon storage; (3) questions of where such plantings can occur and how to deploy well-performing species to new regions; (4) the technical capacity required to produce seedlings; (5) the rapid development of forest products research and development of engineered forest and mass timber products, and (6) the environmental benefits and impacts of planted forests.

Massive expansion of planted forests must also resolve issues such as (7) rural land tenure status and rights in developed and developing countries, (8) regulations promoting or limiting intensive public forest land management, (9) infrastructure requirements and development; (10) cooperation,  partnerships, and policy implementation, (11) investment opportunities, costs, returns, and incentives required to attract private landowners and outgrowers to plant forests, and (12) the effects on local and global timber markets.

These substantial questions must be resolved or planted forests will not achieve their potential to produce desirable wood fiber and products supplies, realize bioenergy opportunities, or store and offset vast amounts of global carbon emissions. This research tackles these questions while assessing historical trends and current status of planted forests worldwide and identifying the best practices for the development of planted forests for landscape restoration, climate change mitigation, and range of environmental, social, and economic co-benefits.

How to cite: Siry, J., Chudy, R., and Cubbage, F.: Planted Forests: A Key Nature Based Solution for Restoring Forest Landscapes and Mitigating Climate Change, EGU General Assembly 2026, Vienna, Austria, 3–8 May 2026, EGU26-14516, https://doi.org/10.5194/egusphere-egu26-14516, 2026.

EGU26-15186 | PICO | BG3.12

Forecasting Bark Beetle Disturbance Risk for Forest Regeneration Planning 

Jaroslav Čepl, Jiří Chuchlík, and Jiří Korecký

Large-scale bark beetle outbreaks can compromise multiple forest ecosystem services, including timber yield, carbon sequestration capacity, and the protective and cultural values of forests. In Central Europe, recent Ips typographus outbreaks have highlighted the increasing vulnerability of spruce-dominated forests under changing climatic conditions.

Historically, major bark beetle outbreaks were usually initiated by windthrow or snow damage, with fallen trees providing suitable host material and enabling rapid beetle population growth. Recently, drought is increasingly recognised as an additional amplifying or even triggering factor. Heat and water limitation impair spruce defence mechanisms, while warmer temperatures benefit beetles by extending their flight periods and accelerating development, potentially allowing additional generations per year. Together, these processes increase the likelihood that both beetle population growth and host susceptibility coincide over multiple consecutive years.

The aim of this work is to develop a predictive model of bark beetle disturbance vulnerability at the European scale. The modelling framework covers the period 1981–2021 and integrates a range of spatially explicit covariates, including climatic variables (temperature, precipitation, drought metrics), stand properties, and topographic characteristics. Model calibration relied on forest management records and remote sensing–based disturbance maps identifying historical bark beetle outbreaks. These disturbance layers provided spatially explicit binary response data and formed the core reference for model training and validation. The performance of a suite of statistical and machine-learning models was evaluated using both spatial and temporal cross-validation.

Such trained models were subsequently applied to projected future climate conditions under a high-emission scenario (SSP5-8.5), with inter-annual climatic variability explicitly incorporated. Ensemble predictions across different models and iterated climate simulations were aggregated to derive spatially explicit estimates of future bark beetle disturbance risk.

The results emphasize the importance of considering disturbance risk at spatial scales relevant for regeneration planning, highlighting species composition, spatial dispersion, and bet-hedging strategies under increasing ecological uncertainty. The outcomes will contribute to a decision-support system currently developed within the RE-ENFORCE project.

How to cite: Čepl, J., Chuchlík, J., and Korecký, J.: Forecasting Bark Beetle Disturbance Risk for Forest Regeneration Planning, EGU General Assembly 2026, Vienna, Austria, 3–8 May 2026, EGU26-15186, https://doi.org/10.5194/egusphere-egu26-15186, 2026.

EGU26-17190 | PICO | BG3.12

Recovering protective forests after a disturbance. Lessons from active and passive restoration approaches in mountain forests. 

Emanuele Lingua, Matteo Varotto, Flavio Taccaliti, Evan Barbarick, Davide Marangon, Paul Richter, Tommaso Baggio, Matteo Garbarino, Niccolò Anselmetto, Frédéric Berger, and Raffaella Marzano

When large and severe disturbances affect mountain forests, their ability to provide fundamental ecosystem services may be impaired for a long time. Indeed, in the Alps, forested slopes exert a crucial protective function and rapidly restoring the forest cover after a stand-replacing event is key to prevent the occurrence and mitigate the impact of subsequent natural hazards. Post-disturbance intervention can make or break forest recovery and should thus be tailored to meet management requirements and ecological needs. Widespread salvage logging removing all deadwood and other biological legacies in harsh environments where natural regeneration relies on facilitation mechanisms is a classical example of human intervention leading to undesired consequences. Quite often, when time is not a constraint, passive restoration can be the best option. Whenever active restoration is deemed necessary, particularly when large areas are affected, several challenges and limitations have to be addressed. Lack of saplings supply from tree nurseries, specialized workers and funding availability can hamper restoration activities.

Some lessons learnt from mountain forests of the Italian Alps will be presented, considering restoration interventions after forest fires, windthrows and bark beetle outbreaks. Taking advantage of biological legacies, assisted regeneration and applied nucleation provided encouraging results, with nature-based solutions proving to be effective in promptly restoring the ecosystem services provided by forests, especially in protective stands.

How to cite: Lingua, E., Varotto, M., Taccaliti, F., Barbarick, E., Marangon, D., Richter, P., Baggio, T., Garbarino, M., Anselmetto, N., Berger, F., and Marzano, R.: Recovering protective forests after a disturbance. Lessons from active and passive restoration approaches in mountain forests., EGU General Assembly 2026, Vienna, Austria, 3–8 May 2026, EGU26-17190, https://doi.org/10.5194/egusphere-egu26-17190, 2026.

EGU26-17414 | ECS | PICO | BG3.12

The potential of georeferenced planting and large dataset analysis for close-to-nature forest restoration 

Boris Rantaša, Katja Kavčič Sonnenschein, Natalija Dovč, Saša Ogorevc, Marjana Westergren, and Hojka Kraigher

The Interreg Central Europe project RE-ENFORCE policy brief advocates accelerating forest restoration in Central Europe through the harmonization of definitions, policies, action plans and monitoring. It further calls for the development of a common EU-wide framework for assessing forest restoration success, based on ecosystem-specific indicators that capture biodiversity, structural complexity, and regeneration outcomes. In this context, we propose an adapted approach that explicitly considers local biological diversity, including genetic diversity, in forest restoration and the establishment of close-to-nature forests. To increase future adaptability, naturally occurring local regeneration should be enhanced with enrichment planting using forest reproductive material (FRM) from tree species and provenances that are potentially adapted to future climates.

This approach should be supported by field testing, modern monitoring techniques and decision support methods and should include long-term monitoring of forest restoration projects, enrichment plantings and provenance or common garden trials. In Slovenia, we are developing systems for georeferenced planting and monitoring of local and regional FRM, combined with climate and soil data to evaluate tree species and provenance suitability and resilience when using different restoration techniques.

In our contribution, we present a system for georeferenced planting using highly accurate GNSS antennas and QGIS software, as well as a system design for nationwide forest restoration and FRM suitability monitoring and evaluation in Slovenia. The system also helps address the requirements of the new Regulation on the production and marketing of FRM in the EU regarding the preparation and regular updating of national contingency plans to ensure proactive and effective action against risks arising from climate change and the spread of pests and diseases.

How to cite: Rantaša, B., Kavčič Sonnenschein, K., Dovč, N., Ogorevc, S., Westergren, M., and Kraigher, H.: The potential of georeferenced planting and large dataset analysis for close-to-nature forest restoration, EGU General Assembly 2026, Vienna, Austria, 3–8 May 2026, EGU26-17414, https://doi.org/10.5194/egusphere-egu26-17414, 2026.

EGU26-17839 | ECS | PICO | BG3.12

Fine-scale environmental filtering and seed limitation shape early post-fire regeneration patterns in Mediterranean Pinus halepensis Mill. forests 

Francesco Atzeni, Flavio Taccaliti, Davide Marangon, and Emanuele Lingua

Post-fire regeneration in Mediterranean pine forests is increasingly constrained by recurrent high-severity fires and post-disturbance interventions. We assessed the drivers of early natural regeneration in a coastal Pinus halepensis Mill. forest in Spotorno (NW Italy) affected by two recent high-severity wildfires (September 2006 and July 2015) followed by salvage logging. Pine seedlings were mapped in spring 2025 with an RTK GNSS antenna, while high-resolution UAV images and LiDAR products were used to derive terrain- and forest structure-based predictors. Topographically mediated constraints on regeneration were quantified using the Topographic Wetness Index (TWI) and the Heat Load Index (HLI), which capture spatial variation in soil moisture accumulation and heat exposure. Seed availability was represented by the distance to remnant adult pines, identified from the canopy height model using a local-maximum filtering approach. Spatial point pattern analysis (inhomogeneous Ripley’s K and pair correlation) was used to test whether empirically evident regeneration clusters reflected plant–plant interactions, or environmentally-driven density variation. Drivers of regeneration were modelled using GLMs, GAMs and Random Forests (RF), and two pseudo-absence strategies in the RF were explicitly compared by training models with (i) ecologically informed, spatially homogeneous pseudo-absences and (ii) randomly sampled pseudo-absences. The informed pseudo-absence Random Forest achieved substantially higher discrimination (AUC = 0.895; ACC = 0.821; SEN = 0.785; SPE = 0.864) than the random-absence model (AUC = 0.653; ACC = 0.607; SEN = 0.648; SPE = 0.571). The best model was applied to generate a 5 x 5 m ecological suitability map identifying regeneration “hotspots”, i.e., near seed sources under warm, well-drained microsite conditions, and persistent “coldspots” in convergent terrain and seed-limited areas. This workflow provides an operational, transferable basis for precision-oriented post-fire restoration planning in Mediterranean landscapes where passive recovery is uncertain.

How to cite: Atzeni, F., Taccaliti, F., Marangon, D., and Lingua, E.: Fine-scale environmental filtering and seed limitation shape early post-fire regeneration patterns in Mediterranean Pinus halepensis Mill. forests, EGU General Assembly 2026, Vienna, Austria, 3–8 May 2026, EGU26-17839, https://doi.org/10.5194/egusphere-egu26-17839, 2026.

EGU26-19077 | ECS | PICO | BG3.12

Towards a better understanding of tree seedling establishment and its use for forest rejuvenation in Central European forests 

Timo Busse, Frederic Krieger, Fabian Weikl, Benjamin D. Hafner, Astor Toraño Caicoya, Richard L. Peters, and Thorsten E. E. Grams

Rejuvenation of forests is one of the most important ecological and economic challenges in central Europe. In an existing large-scale experiment in southern German forests, c. 500 thousand c. 2 years old tree seedlings of Beech, Douglas fir, Silver, Oak have been planted in rows. However, our knowledge of how potential small-scale factors like tree stumps and tree mixture mechanistically enhance tree establishment after planting is limited.

We focused on 6 plots (c. 2500 seedlings) of Douglas fir, planted on a comparably dry site without mature trees. We observed that those trees differed in height, 3 years after planting. Moreover, trees of comparably greater height cluster together on a small spatial scale of 3 m radius. However, conventional tree planting methods (in rows) neglect those beneficial small-scale sites for tree establishment.

Using an app we programmed (Shiny package in R) for quickly finding trees clustered by e.g. height, clusters of 3 m radius of well- and poorly-established trees were identified. A combination of multispectral drone-derived optical parameters, morphological analyses of twigs and 13C analyses of tree needles was then used to provide insight into the factors driving the trees’ height differences.

First results showing the positive effects on the establishment of young trees are presented, i.e. incorporating spatial proximity to tree stumps and using a tree mixture in the planting method. Further steps to gain a better understanding of the mechanisms driving tree seedling establishment are discussed.

How to cite: Busse, T., Krieger, F., Weikl, F., Hafner, B. D., Toraño Caicoya, A., Peters, R. L., and Grams, T. E. E.: Towards a better understanding of tree seedling establishment and its use for forest rejuvenation in Central European forests, EGU General Assembly 2026, Vienna, Austria, 3–8 May 2026, EGU26-19077, https://doi.org/10.5194/egusphere-egu26-19077, 2026.

EGU26-22570 * | ECS | PICO | BG3.12 | Highlight

Assisted Migration and Large-Scale Restoration in Europe Would Require Over 100 Billion Seedlings 

Albert Ciceu, Thibaud Chauvin, Heino Konrad, Debojyoti Chakraborty, and Silvio Schueler

Climate change is expected to profoundly alter the climatic suitability of tree species across Europe, necessitating large-scale reforestation and assisted migration to maintain forest ecosystem services. Here, we present a pan-European projection of potential seedling requirements under assisted migration across three reforestation strategies: conifer-preferred, broadleaf-preferred, and promotion of natural regeneration. Our simulations show that under the moderate-emission scenario (RCP4.5), total seedling requirements range from ~92 billion under the natural-regeneration-oriented strategy to ~144 billion when broadleaves are prioritized. Under the high-emission scenario (RCP8.5), demand rises substantially, reaching up to ~192 billion seedlings across the landscape.

Temporal patterns differ between scenarios. Under RCP4.5, seedling requirements are highest early in the century, with 2035 totals of ~69–72 billion for replacement-focused strategies and ~47 billion for the natural regeneration scenario, declining steadily toward 2095. In contrast, RCP8.5 projections peak at the end of the century, reaching ~76–82 billion seedlings for replacement-focused strategies and ~50 billion under natural regeneration.

Species composition of projected demand varies with reforestation strategy. In the conifer replacement strategy, silver fir, Scots pine, and black pine dominate, together requiring roughly 50–60 billion seedlings, with higher totals under strong warming. In the broadleaf-focused scenario, pedunculate oak, European beech, and sessile oak account for over 40 billion seedlings under moderate warming and exceed 55 billion under RCP8.5. Prioritizing natural regeneration reduces overall demand, though these broadleaf species remain dominant, requiring ~30–35 billion seedlings even under strong climate change.

Spatially, Central-East Europe represents the largest potential market, driven primarily by Poland, Belarus, Ukraine, Romania, and Czechia. Under RCP8.5 with broadleaf expansion, these countries collectively require over 72 billion seedlings, with Poland and Belarus alone accounting for ~23 and ~21 billion seedlings, respectively. Central-West Europe forms the second-largest market, led by Germany (~28 billion seedlings), while Northern, South-Eastern, and South-West Europe show moderate to low demand, rarely exceeding 15 billion seedlings per region.

Our results highlight the scale of effort required to implement assisted migration in Europe and emphasize the critical need for strategic planning in seedling production and distribution. Central and Central-Western Europe, in particular, will likely require substantial increases in nursery capacity and cross-border coordination to meet projected needs. These findings provide actionable insights for policymakers and the nursery sector, supporting the development of climate-adapted reforestation strategies capable of sustaining Europe’s forests under future climate conditions.

How to cite: Ciceu, A., Chauvin, T., Konrad, H., Chakraborty, D., and Schueler, S.: Assisted Migration and Large-Scale Restoration in Europe Would Require Over 100 Billion Seedlings, EGU General Assembly 2026, Vienna, Austria, 3–8 May 2026, EGU26-22570, https://doi.org/10.5194/egusphere-egu26-22570, 2026.

EGU26-3798 | ECS | Orals | BG3.13

Evaluating Forest Soil Health in Europe Using ICP Forests Data and the SHERPA Framework 

Surya Gupta and Christine Alewell

Soil health degradation is a major threat to European forests, with consequences for biodiversity and climate stability. Although spatially distributed soil data are available, a clear and quantifiable framework for soil health monitoring, management, and policy support is still lacking. In this study, we applied the recently proposed SHERPA framework (Soil Health Evaluation, Rating Protocol, and Assessment) to ICP Forests Level I data. SHERPA was published as a framework for discussion and provides the first quantitative soil health assessment at the European scale (Alewell et al., 2025).

Soil health scores were estimated by considering all major soil degradation processes, which were averaged to obtain Part 2 scores. This value was then subtracted from the intrinsic soil health score (Part 1), which is based on altitude, parent material, and humus horizon thickness (OL, OF, and OH), to calculate the final quantitative soil health score. Preliminary results indicate that soil health in forests across Europe is significantly reduced. This is mainly driven by nitrogen surplus, reflecting the widely documented forest decline caused by nutrient imbalances. Soil health is further affected by soil erosion and elevated concentrations of heavy metals, particularly nickel, which are predominantly observed in southern Europe. Overall, 45% of the samples show soil health scores below 1 on a scale from -8 to 10. These results are based on coarse-resolution spatial data due to the limited availability of measured soil data, especially of information on soil compaction and/or disturbance of a closed humus layer coverage of the soil. Therefore, the estimates can be further improved, but they already highlight major threats to forest soil health across Europe.

How to cite: Gupta, S. and Alewell, C.: Evaluating Forest Soil Health in Europe Using ICP Forests Data and the SHERPA Framework, EGU General Assembly 2026, Vienna, Austria, 3–8 May 2026, EGU26-3798, https://doi.org/10.5194/egusphere-egu26-3798, 2026.

Forests influence local climate via biogeophysical processes, but the diurnal asymmetry of their temperature effects—and its underlying drivers—remain poorly quantified, especially in climate-sensitive transition zones. This knowledge gap hinders the climate-adaptive planning of ecological restoration programs. Using multi-source remote sensing data (2002–2023) and a pixel-pairing approach, we systematically assessed the impacts of forests on land surface temperature (LST) in the semi-arid to semi-humid transition zone of northern China. Results reveal a consistent “daytime cooling–nighttime warming” pattern: forests reduced daytime LST by –0.57 °C but increased nighttime LST by +0.43 °C, yielding a slight net daily cooling. Mechanistic analyses identified a clear diurnal driver-switch: daytime cooling was dominated by biophysiological processes (primarily enhanced evapotranspiration), whereas nighttime warming was governed by physical structural forcing, notably aerodynamic roughness-induced turbulent mixing. This was robustly evidenced by persistent nighttime warming (~ +1.4 °C) during the dormant winter when evapotranspiration was negligible. Furthermore, forest cooling capacity exhibited a nonlinear response along the aridity gradient, with an optimal climatic window (aridity index ≈ 1.3–1.6) identified in the semi-arid to semi-humid transition zone where cooling per unit water use was maximized. These findings indicate that large-scale afforestation in drier regions may face a “high water cost–low cooling” trade-off, whereas focusing restoration efforts within this climatic transition zone can optimize both climate regulation and water sustainability. Our study provides a biophysical basis for spatially optimized ecological engineering, particularly for the “Three-North Shelterbelt Program” and similar initiatives worldwide.

How to cite: Yuan, Y., Wang, P., Guo, R., Zhang, Z., Liu, J., Cao, W., and Liu, Y.: Day–Night Asymmetric Effects of Forests on Land Surface Temperature and Their Optimized Regulation in Climatic Transition Zones: A Case Study of the Semi-Arid to Semi-Humid Region of Northern China, EGU General Assembly 2026, Vienna, Austria, 3–8 May 2026, EGU26-7521, https://doi.org/10.5194/egusphere-egu26-7521, 2026.

EGU26-10931 | ECS | Orals | BG3.13

Carbon stock in Central European forests: potential and reality  

Torben Hilmers, Jörg Müller, Richard L. Peters, Gerhard Schmied, and Hans Pretzsch

Forests are a cornerstone of nature-based climate mitigation, yet carbon stocks in managed Central European forests remain substantially below their full potential. Understanding this gap is essential for developing realistic mitigation strategies within the timeframe of national carbon neutrality targets.

We compare the current aboveground carbon stocks for Norway spruce (Picea abies), Scots pine (Pinus sylvestris), European beech (Fagus sylvatica), and oak (Quercus robur and Q. petraea) to their theoretical potential across Central European forests. Relying on a unique network of 593 long-term, unmanaged experimental plots throughout Europe that represent stand development under natural dynamics, we derive the carbon storage potential under maximum stocking density conditions. In contrast, realized carbon stocks are obtained from recent National Forest Inventory data (2024), which represent the current state of managed forests. Nonlinear growth models were fitted separately to experimental and inventory datasets, relating standing carbon stock to age and site productivity, while accounting for species-specific survival probabilities.

We reveal that Central European managed forests stay considerably below their full carbon storage potential compared to fully stocked and unmanaged forests of comparable age and site quality. Differences are highly species- and age-specific, with the largest gaps observed in middle-aged to maturing stands of European beech. Norway spruce stands also exhibited substantial potential, albeit with higher risks at older ages. Overall, we estimate that theoretically >500 *106 t CO2 equivalents could be stored by increasing C stock.

Using the most recent National Forest Inventory cycle, our estimates quantify the gap between potential and realized carbon storage across species and age classes. These findings provide a quantitative foundation for science-based decisions on forest mitigation capacity and for evaluating management scenarios that could help narrow this gap.

How to cite: Hilmers, T., Müller, J., Peters, R. L., Schmied, G., and Pretzsch, H.: Carbon stock in Central European forests: potential and reality , EGU General Assembly 2026, Vienna, Austria, 3–8 May 2026, EGU26-10931, https://doi.org/10.5194/egusphere-egu26-10931, 2026.

Facing an uncertain future, european forests are expected to fulfill a range of forest ecosystem services (FES), including timber supply, carbon storage or biodiversity. Using criteria and indicators forest managers can evaluate alternative management options and decision support systems (DSS) help them make decisions considering multiple objectives. Such tools need input on forest development under various scenarios, to obtain robust decisions, such as provided by forest models. We use the simulation results from the project “OptFor-EU” generated by the hybrid forest model PICUS v1.5 for four case study areas in Austria, Italy, Germany and Romania. We utilize six different climate input (3 RCPs, 2 regional climate models) and up to nine management alternatives in simulations until year 2100. The initial stand structure was derived using forest inventory data. We aggregated forest stands (represented by forest types) assuming even distribution of age classes in a hypothetical landscape or region of interest.

We found positive tradeoffs between key forest ecosystem services, FES (carbon sink, biodiversity, harvested wood volume) for selected forest management alternatives. Under a “no active management” scenario, most of the simulated forest stands in the case study areas reached their potential carbon storage in the second half of the century and thus their carbon sink becomes neutral during that period. A surprising result was that selected biodiversity indicators were higher under management scenarios than no management, at least for certain time periods and age classes. Less extensive forest management alternatives may offer tradeoffs between FESs. Next steps are expanding the simulations to additional case study areas and refining and optimizing the forest management, considering more realistic age class distributions and/or varying management by age class.


References

  • Irauschek, W. Rammer, M.J. Lexer, Evaluating multifunctionality and adaptive capacity of mountain forest management alternatives under climate change in the Eastern Alps, Eur. J. For. Res. 136 (2017) 1051–1069. https://doi.org/10.1007/s10342-017-1051-6.
  • Lexer, M. J. and K. Hönninger. 2001. A modified 3D-patch model for spatially explicit simulation of vegetation composition in heterogeneous landscapes. Forest Ecology and Management 144:43–65.

How to cite: Erich, N. and Neumann, M.: Tradeoffs in ecosystem services of European forests using a case study approach and a climate-sensitive modelling tool, EGU General Assembly 2026, Vienna, Austria, 3–8 May 2026, EGU26-11243, https://doi.org/10.5194/egusphere-egu26-11243, 2026.

EGU26-11651 | ECS | Posters on site | BG3.13

Continuous cover forest management in Black pine stands: regeneration dynamics, ecosystem services and implications for climate change mitigation 

Giuliano Secchi, Viviana Altomare, Ilaria Zorzi, Jessica Scriva, Irene Fattoretto, Ilaria Incollu, Yamuna Giambastiani, Davide Travaglini, and Francesca Giannetti

Continuous cover forest management (CCFM) plays a key role in sustaining forest multifunctionality by reconciling timber production with long-term carbon sequestration, biodiversity conservation, and landscape continuity. It represents a cornerstone of the closer-to-nature approach promoted by the European Forest Strategy for 2030 and related EU Guidelines, providing science-based solutions to enhance forest resilience to climate change while supporting bioeconomy and rural development. As forests are increasingly expected to contribute to climate change mitigation, they simultaneously face growing pressures from climatic extremes and environmental stressors, making the evaluation of management practices under changing climate conditions a critical research priority.

In this study, carried out in the context of the EU project SMURF, we analyze the long-term application of group selection cutting within irregular black pine (Pinus nigra J.F. Arnold) stands of the Sila Plateau (Calabria, Southern Italy), a traditional silvicultural system widely adopted by private forest owners. Using ecosystem service modelling approaches, we assess variations in gross primary productivity (GPP) and net primary productivity (NPP) in relation to gap size, regeneration patterns, and climate parameters, with the aim of evaluating the effectiveness of this CCFM practice in supporting climate change mitigation.

Results highlight how gap size variability allows the pursuit of multiple management objectives, ranging from the conservation of pure black pine stands—of high value for historical landscapes and habitat preservation—to the promotion of broadleaved species recruitment, which may enhance ecosystem resilience and wildfire resistance under future climate scenarios. Regeneration dynamics within gaps are analyzed to define operational silvicultural parameters that support successful natural regeneration while maintaining stable carbon sequestration rates. Overall, the study demonstrates that group selection cutting can effectively balance climate mitigation potential with economic income, contributing to science-based forest management strategies, forest resilience and adaptive capacity in Mediterranean mountain environments.

How to cite: Secchi, G., Altomare, V., Zorzi, I., Scriva, J., Fattoretto, I., Incollu, I., Giambastiani, Y., Travaglini, D., and Giannetti, F.: Continuous cover forest management in Black pine stands: regeneration dynamics, ecosystem services and implications for climate change mitigation, EGU General Assembly 2026, Vienna, Austria, 3–8 May 2026, EGU26-11651, https://doi.org/10.5194/egusphere-egu26-11651, 2026.

EGU26-11666 | ECS | Posters on site | BG3.13

Validation of a Low-Cost MEMS Inclinometer for Static Tree Stability Monitoring 

Ilaria Incollu, Yamuna Giambastiani, Andrea Giachetti, Tommaso Tognetti, Giuliano Secchi, Irene Fattoretto, Ilaria Zorzi, Jessica Scriva, and Francesca Giannetti

Urban trees and forests provide essential ecosystem services, including carbon sequestration and climate regulation, but their capacity to deliver these benefits can be compromised by increasing disturbances associated with climate change. Tree stability assessment is therefore a key component of adaptive forest and urban green infrastructure management. Visual Tree Assessment (VTA) is typically the first step in risk analysis and is sometimes complemented by instrumental methods such as dynamic and static tests. Static pulling tests provide quantitative information on anchorage and mechanical stability, but their cost and logistical complexity generally limit their application to site-specific investigations.

This study, carried out within the TREESURE project, evaluates the performance of a low-cost Micro-Electro-Mechanical Systems (MEMS) inclinometer for static tree tilt monitoring, with the aim of assessing its suitability for wider and longer-term deployments in support of resilience-oriented tree management. The approach combines a laboratory calibration against a geometric reference with field comparisons against a professional high-precision inclinometer commonly used in static pulling tests. In the laboratory, using a calibrated tilting beam and a 120 s averaging window, the MEMS sensor exhibited absolute errors on the order of a few hundredths of a degree, with maximum deviations of approximately 0.015°. In field conditions, comparisons were performed in the relative domain (baseline defined on the first stable plateau) along the longitudinal component, showing high concordance with the reference inclinometer.

The results demonstrate that low-cost MEMS inclinometers can provide reliable measurements for static tree tilt monitoring. Owing to their battery-powered wireless operation and simplified data processing, such sensors offer potential for scalable and continuous monitoring of tree stability. This capability may support proactive management strategies aimed at reducing storm-related tree failures, enhancing tree longevity, and indirectly contributing to the preservation of forest and urban tree carbon stocks under increasing climate-induced disturbance regimes.


How to cite: Incollu, I., Giambastiani, Y., Giachetti, A., Tognetti, T., Secchi, G., Fattoretto, I., Zorzi, I., Scriva, J., and Giannetti, F.: Validation of a Low-Cost MEMS Inclinometer for Static Tree Stability Monitoring, EGU General Assembly 2026, Vienna, Austria, 3–8 May 2026, EGU26-11666, https://doi.org/10.5194/egusphere-egu26-11666, 2026.

EGU26-11942 | ECS | Posters on site | BG3.13

European Forests Between Digitalization and Climate Change: A Pan-European Analysis of EIP-AGRI Operational Group Innovations 

Irene Fattoretto, Solaria Anzilotti, Mercedes Caron, Aida Rodríguez-García, Ana Maria Ventura, Giuliano Secchi, Benjamin Chapelet, Kathrin Böhling, and Francesca Giannetti

European forestry and agroforestry systems are foundational to the European Green Deal's climate and sustainability objectives. This study evaluates the effectiveness of the European Innovation Partnership for Agricultural Productivity and Sustainability (EIP-AGRI) Operational Groups (OGs) as a critical policy instrument for implementing these objectives on the ground. By systematically analyzing the innovations co-developed by these multi-actor partnerships, we assess their capacity to translate high-level strategy into tangible, practice-led solutions that address pressing sectoral challenges in climate change and digitalization.

This pan-European analysis, carried out within the FOREST4EU project, employed a mixed-methods framework, combining thematic, semantic, and network-based cluster analysis of 175 distinct innovations generated by 86 OGs across ten European countries to map the continent's forestry innovation ecosystem.

Our findings demonstrate that OGs are directly confronting climate change, with a major innovation cluster focused on "Climate adaptation and forest resilience" to address stressors like drought, forest fires, and pests. Critically, the primary response to these challenges is the deployment of advanced digital and geoscience-based tools, including sophisticated Decision Support Systems (DSS), remote sensing and LiDAR technologies, GIS-based forest data management, and mobile applications for forest inventory. This problem-solution dynamic explains the predominance of technological (33.1%) and process (26.9%) innovations, which show clear geographic specialization reflecting national priorities, from digital forest management in Italy to climate resilience in France and bioeconomy value chains in Spain and Portugal.

The analysis consolidates these findings into four interconnected innovation domains: (i) digital forestry and data-driven management, (ii) climate adaptation and forest resilience, (iii) sustainable forest management, and (iv) bioeconomy-oriented value chains. The interplay between these domains proves that digital tools are not being developed in isolation but are instrumental in creating integrated, climate-smart solutions. We therefore assert that the EIP-AGRI Operational Group is a validated and effective model for translating EU climate policy into practice. It provides a powerful bottom-up mechanism for co-creating the tailored, territorially-embedded, and science-based responses required to enhance Europe's forest resilience and climate mitigation capacity.

How to cite: Fattoretto, I., Anzilotti, S., Caron, M., Rodríguez-García, A., Ventura, A. M., Secchi, G., Chapelet, B., Böhling, K., and Giannetti, F.: European Forests Between Digitalization and Climate Change: A Pan-European Analysis of EIP-AGRI Operational Group Innovations, EGU General Assembly 2026, Vienna, Austria, 3–8 May 2026, EGU26-11942, https://doi.org/10.5194/egusphere-egu26-11942, 2026.

EGU26-13226 | Orals | BG3.13

Exploring climate and biodiversity smart forest management options for European forests 

Mikko Peltoniemi, Aapo Rautiainen, Anna Repo, Thomas Pugh, Annemarie Eckes-Shephard, Mats Lindeskog, Susanne Suvanto, Joanna Raymond, Almut Arneth, Sara Filipek, Mart-Jan Schelhaas, Gert-Jan Nabuurs, Alexander Moiseyev, Timokleia Orfanidou, Amelie Müller, Giuseppe Cardellini, Hanneke van't Veen, and Hans Verkerk

Forest-based climate mitigation measures are central to achieving the EU’s climate neutrality target by 2050 and meeting the LULUCF goal of 310 Mt CO₂ net removals by 2030. Forest management strategies should balance carbon sequestration and biodiversity conservation with wood production, and build resilient flows of ecosystem services under changing climatic conditions. In this study, we apply an integrated modelling framework combining dynamic vegetation models (LPJ-GUESS), forest resource models (EFISCEN-Space), a global forest sector model (EFI-GTM) and a wood flow model (aiphoria) with dynamic life-cycle assessment modelling to assess the long-term carbon and biodiversity impacts of alternative forest management approaches across Europe. We include the downstream effects of changed wood provision to harvested wood products impacting the forest sector carbon balance and provide insights into potential substitution effects. By linking biophysical and economic modelling, we identify management strategies that enhance resilience and multifunctionality while supporting EU policy objectives for climate mitigation and biodiversity in the forest sector.

Our results suggest that management portfolios emphasizing extended rotation periods, reduced thinning intensities, and shifting to continuous cover harvesting—particularly when coupled with long-lived wood product deployment that replaces fossil-intensive other materials —can boost carbon sequestration and biodiversity outcomes across Europe. However, they also suggest reduced near-time harvesting levels—which appears to be the more important regulator of forest C sinks than the method of harvesting. Changing harvesting regimes and other management practices can help closing the gap towards the 310 Mt CO₂ target and contribute to the EU’s 2050 climate neutrality goal, but they also affect near-time harvest yields.

How to cite: Peltoniemi, M., Rautiainen, A., Repo, A., Pugh, T., Eckes-Shephard, A., Lindeskog, M., Suvanto, S., Raymond, J., Arneth, A., Filipek, S., Schelhaas, M.-J., Nabuurs, G.-J., Moiseyev, A., Orfanidou, T., Müller, A., Cardellini, G., van't Veen, H., and Verkerk, H.: Exploring climate and biodiversity smart forest management options for European forests, EGU General Assembly 2026, Vienna, Austria, 3–8 May 2026, EGU26-13226, https://doi.org/10.5194/egusphere-egu26-13226, 2026.

EGU26-14020 | Posters on site | BG3.13

Assessing forest resilience using multiple indicators: integrating structural, hydrological, ecophysiological, and stakeholder perspectives 

Alexander Knohl, Christian Ammer, Matthias Beyer, Harald Biester, Svenja Dobelmann, Steffen Drohmen, Simon Drollinger, Christina Hackmann, Anne Klosterhalfen, Ann-Katrin Kößler, Paul Magdon, Christian Markwitz, Lina Oskamp, and Lennart Stangenberg

Forests play a key role in mitigating climate change, yet their capacity to do so critically depends on their resilience to increasing climatic stressors such as drought and heat extremes. Here we aim to enhance science-based knowledge on forest resilience by applying a multi-scale research framework that integrates structural, hydrological, ecophysiological, and stakeholder perspectives at European beech (Fagus sylvatica L.) stands in Central Germany.

In a first step, we combine terrestrial, drone-based, and airborne LiDAR technologies to comprehensively characterize three-dimensional forest structure across spatial scales. From these data, we derive indicators of forest resilience related to canopy complexity. A particular focus is placed on evaluating the robustness of LiDAR-derived metrics with respect to phenological variability and spatial resolution, ensuring their applicability for long-term monitoring and cross-site comparisons.

To link forest structure with ecosystem functioning, we investigate forest water, carbon and other biogeochemical fluxes along gradients of water availability and stand structure. In 2025 we carried out intensive measurement campaigns including detailed measurements of soil moisture at multiple depths, allowing us to assess how different stand structures influence soil water dynamics. We also measured mercury (Hg) concentration in the forest canopy for assessing Hg cycling of forests as indicator of biogeochemical resilience. We performed tree-level observations of growth and water consumption via dendrometer and sap flux sensors and combined them with ecosystem-scale measurements of CO₂, water, and energy exchange between forests and the atmosphere using the eddy covariance technique for ecophysiological indicators of forest resilience.

Complementing these biophysical assessments, we integrate a socio-ecological dimension through qualitative interviews with forest stakeholders. This allows us to evaluate stakeholder assessments of the status quo, their visions for resilient forests, and the specific requirements for a successful transformation toward those goals.

By integrating multiple indicators derived from measurements across spatial, temporal, and social scales, we provide a broad assessment of forest resilience. Our results contribute to a mechanistic understanding of how forest structure mediates water and carbon fluxes under climate stress, supporting the development of resilient forest management strategies and improved monitoring approaches for climate change mitigation that are both scientifically robust and stakeholder-informed.


How to cite: Knohl, A., Ammer, C., Beyer, M., Biester, H., Dobelmann, S., Drohmen, S., Drollinger, S., Hackmann, C., Klosterhalfen, A., Kößler, A.-K., Magdon, P., Markwitz, C., Oskamp, L., and Stangenberg, L.: Assessing forest resilience using multiple indicators: integrating structural, hydrological, ecophysiological, and stakeholder perspectives, EGU General Assembly 2026, Vienna, Austria, 3–8 May 2026, EGU26-14020, https://doi.org/10.5194/egusphere-egu26-14020, 2026.

EGU26-14710 | ECS | Orals | BG3.13

Enhanced growth rate and stand age leads to stronger biomass increase in primary versus managed secondary forests 

Emily Register, Henrik Smith, Johan Lindström, and Anders Ahlström

Boreal forests play a vital role in the global carbon cycle, yet the stability of this sink is uncertain during a period of rapid global environmental change. Swedish forest biomass has increased in recent decades, yet it remains unclear whether primary and managed secondary forests have changed similarly, and to what extent changes are driven by stand-age or shifts in growth curves. This is because intensive forest management practices in Sweden such as thinning, draining and fertilisation may obscure the effect of environmental changes, while rotational clear-cutting reduces the stand age. Here, we combine extensive National Forest Inventory data from 1983 to 2022 with random forest models to disentangle potential drivers of biomass change across forest types by isolating growth-curve and stand-age distribution effects. Our results indicate that management suppresses potential growth curve enhancement at a given stand-age as well as reducing the stand-age itself, leading to little net biomass change in managed secondary forests but large increases in primary forests. With the continued logging of unprotected primary forests, as well as the projected increase in warming, this has significant implications for the future boreal forest carbon stock.

How to cite: Register, E., Smith, H., Lindström, J., and Ahlström, A.: Enhanced growth rate and stand age leads to stronger biomass increase in primary versus managed secondary forests, EGU General Assembly 2026, Vienna, Austria, 3–8 May 2026, EGU26-14710, https://doi.org/10.5194/egusphere-egu26-14710, 2026.

EGU26-16467 | Posters on site | BG3.13

Expert Foresight for Enhancing European Forests' Climate Mitigation Potential up to 2100 

Alice Ludvig, Pipiet Larasatie, and Radityo Putro Handrito

Forest transformations extend beyond ecology to institutional shifts driven by evolving values, actor networks, and policy frameworks. This impacts carbon sequestration and mitigation capacities. Past research on shifts from deforestation to net gains or state to community management relies on ex-post case studies (Meyfroidt & Lambin, 2011; Rudel et al., 2010; Charmakar et al., 2024). However, forward-looking approaches are essential for guiding sustainable management amid uncertainties like climate change and bioeconomy demands. This study employs a three-round Delphi survey with high-level experts from policy, industry, and bioeconomy sectors to project wood production trajectories and management transformations across 2021-2030, 2031-2050, and 2051-2100, aligning with the role of forests and wood production for reaching climate targets.

Responses distinguish likelihood from desirability of developments, revealing on the one hand the points of consensus on institutional innovations such as reconfigured governance, property rights, and stakeholder participation. On the other, they reveal how experts value the role of forest carbon sinks while sustaining wood supply for bioeconomy mitigation (Weiss et al., 2021; Ludvig & Buzogány, under review). The advantage of a Delphi survey in this study is that it reveals the points of departure for consensus in complex and debated policy matters such as the purpose of wood use and harvesting. To this point, experts favor sustained wood mobilization over widespread set-asides for emissions reductions, viewing knowledge gaps as the primary barrier to sustainable production rather than market competition. Furthermore, wood markets are projected stable or growing to 2050 but declining post-2050. Diverse expert backgrounds reveal nuanced insights. Moreover, open responses highlight some innovative ideas for novel rules in tackling the trade-offs between ecological and economic challenges. The findings inform science-based strategies for forest mitigation. The approach advances foresight methods for complex socio-ecological systems (D’Amato et al., 2020).

References

Charmakar, S., Kimengsi, J. N., & Giessen, L. (2024). Linking institutional change mechanisms with forest management outcomes: Evidence from community forestry in Nepal. Ecology and Society, 29(3), https://doi.org/10.5751/ES-15085-290301

D'Amato, D., Veijonaho, S., & Toppinen, A. (2020). Towards sustainability? Forest-based circular bioeconomy business models in Finnish SMEs. Forest Policy and Economics, 110, 101848.https://doi.org/10.1016/j.forpol.2018.12.004

Rudel, T. K., Schneider, L., & Uriarte, M. (2010). Forest transitions: An introduction. Land use policy, 27(2), 95-97

Weiss, G., Hansen, E., Ludvig, A., Nybakk, E., & Toppinen, A. (2021). Innovation governance in the forest sector: Reviewing concepts, trends and gaps. Forest Policy and Economics, 130, Article 102506. https://doi.org/10.1016/j.forpol.2021.102506

How to cite: Ludvig, A., Larasatie, P., and Putro Handrito, R.: Expert Foresight for Enhancing European Forests' Climate Mitigation Potential up to 2100, EGU General Assembly 2026, Vienna, Austria, 3–8 May 2026, EGU26-16467, https://doi.org/10.5194/egusphere-egu26-16467, 2026.

EGU26-16841 | ECS | Posters on site | BG3.13

Integrating Modelling and Stakeholder Engagement to Assess Forest Management Pathways for Climate 

Ilaria Zorzi, Niccolò Fani, Eglè Baltranaitė, Sorin Cheval, Alessio Collalti, Elisabeth Gotschi, Elisa Grieco, Ionut Mihai Hapa, Marius Rohde Johannessen, Stefanie Linser, Alice Ludvig, Mirabela Marin, Hermine Mitter, Mauro Morichetti, Mathias Neumann, Mar Riera-Spiegelhalder, Nicu Constantin Tudose, and Francesca Giannetti

Forests play a crucial role in climate change mitigation by acting as long-term carbon sinks while simultaneously delivering a wide range of ecosystem services and socio-economic benefits. However, maximizing forest-based mitigation demands management strategies that explicitly integrate ecological resilience, carbon dynamics, and socio-economic performance across diverse pedoclimatic and governance contexts. This study contributes to the current debate by assessing the socio-economic implications of forest management scenarios aimed at enhancing carbon sequestration and climate resilience across a range of European forest landscapes. 

In this context we combine internationally recognised sustainability criteria (FOREST EUROPE), with OptFor-EU project outcomes such as: Essential Forest Mitigation Indicators, scenario-based modelling and semi-structured interviews with 56 forest managers. The latter are used to evaluate how alternative forest management pathways influence carbon stocks, ecosystem services, and socio-economic outcomes. The analysis integrates multi-disciplinary inputs, including forest growth and carbon modelling, socio-economic indicators, and Business Model Canvas approaches, within a co-designed Decision Support System developed by OptFor-EU research team in close collaboration with forest managers and local stakeholders. 

Results from 56 interviews carried out across the eight case studies (Norway, Lithuania, Austria, Germany, Romania, Spain, Italy) highlight that transitions from business-as-usual practices towards climate-smart and closer-to-nature silviculture can significantly improve carbon retention, diversify revenue streams (e.g. timber, payments for ecosystem services), and strengthen rural employment and social acceptance. At the same time, the findings underline key challenges regarding data availability for evidence-based decision-making, ownership fragmentation, and the monetisation of ecosystem services, particularly under increasing climate-related disturbances such as heat, droughts, storms, pests and wildfires increasingly frequent in Europe. 

Overall, the study demonstrates that forest-based mitigation actions are most effective when ecological and socio-economic dimensions are jointly addressed through integrated modelling, stakeholders’ co-creation, and tailored decision-support tools. These insights support evidence-based forest policies and management strategies that enhance climate mitigation while safeguarding biodiversity, ecosystem resilience, and socio-economic viability. 

Acknowledgements 

This research received funds from the project “OPTimising FORest management decisions for a low-carbon, climate resilient future in Europe (OptFor-EU)” funded by the European Union Horizon Europe programme, under Grant agreement no101060554. 

How to cite: Zorzi, I., Fani, N., Baltranaitė, E., Cheval, S., Collalti, A., Gotschi, E., Grieco, E., Hapa, I. M., Rohde Johannessen, M., Linser, S., Ludvig, A., Marin, M., Mitter, H., Morichetti, M., Neumann, M., Riera-Spiegelhalder, M., Tudose, N. C., and Giannetti, F.: Integrating Modelling and Stakeholder Engagement to Assess Forest Management Pathways for Climate, EGU General Assembly 2026, Vienna, Austria, 3–8 May 2026, EGU26-16841, https://doi.org/10.5194/egusphere-egu26-16841, 2026.

EGU26-17032 | Posters on site | BG3.13

An Adaptive Participatory Engagement Framework for the Forest–Climate Nexus: Co-Creation, Participatory Action Research, and Socio-Economic Indicator Validation Across Europe 

Mihai-Ionut Hapa, Nicu Constantin Tudose, Mirabela Marin, Alexandru Claudiu Dobre, Ilaria Zorzi, Sorin Cheval, Elisabeth Gotschi, Marius Johannessen, Stefanie Linser, Alice Ludvig, Hermine Mitter, Mar Riera-Spiegelhalder, Francesca Giannetti, and Bogdan Popa

Climate change is transforming European forests through increasingly frequent and intense droughts, storms, pest outbreaks, wildfires, and hydro-meteorological extremes. These biophysical pressures interact with socio-economic conditions and governance arrangements in complex and context-specific ways, shaping both vulnerability and adaptive capacity. Addressing such challenges requires climate-smart forestry supported by decision-support tools and climate services that are co-produced with forest managers, public authorities, and local communities.

This study introduces an Adaptive Participatory Engagement Framework (APEF) that integrates Participatory Action Research (PAR), a structured four-stage co-creation process (co-design, co-production, co-dissemination, and co-evaluation), and governance-aware validation of socio-economic indicators across Europe. The framework was implemented in eight Case Study Areas (CSAs), selected to encompass the fourteen European Forest Types (EFTs). Drawing on multi-stage stakeholder workshops, semi-structured interviews, and iterative qualitative analysis, the study explores stakeholders’ main themes of discussions regarding climate-related forest risks, identifies socio-economic and governance constraints on adaptation, and translates these insights into necessary prerequisites for supporting the development of a Decision Support System (DSS) as a climate service and tailored management practices.

Results show that economic uncertainty is a pervasive concern across all CSAs and is strongly linked to workforce shortages and institutional fragmentation, which together limit the feasibility of adaptive silvicultural practices under climate stress. By triangulating bottom-up stakeholders’ evidence with top-down policy frameworks and governance feasibility assessments, the study delivers a validated set of socio-economic indicators and a composite Socio-Economic Index (SE-Index) suitable for DSS integration. Overall, the findings demonstrate that meaningful and scalable participatory engagement is achievable across diverse governance contexts and provide an empirically grounded pathway for the co-production of climate services and management practices to support adaptive forest management across Europe.

Acknowledgements 

This research received funds from the project “OPTimising FORest management decisions for a low-carbon, climate resilient future in Europe (OptFor-EU)” funded by the European Union Horizon Europe programme, under Grant agreement no101060554. 

How to cite: Hapa, M.-I., Tudose, N. C., Marin, M., Dobre, A. C., Zorzi, I., Cheval, S., Gotschi, E., Johannessen, M., Linser, S., Ludvig, A., Mitter, H., Riera-Spiegelhalder, M., Giannetti, F., and Popa, B.: An Adaptive Participatory Engagement Framework for the Forest–Climate Nexus: Co-Creation, Participatory Action Research, and Socio-Economic Indicator Validation Across Europe, EGU General Assembly 2026, Vienna, Austria, 3–8 May 2026, EGU26-17032, https://doi.org/10.5194/egusphere-egu26-17032, 2026.

EGU26-17236 | Orals | BG3.13

The impact of future forest disturbances on the European forest carbon sink, stock and wood production 

Thomas Pugh, Annemarie H. Eckes-Shephard, Mats Lindeskog, Almut Arneth, Anna-Maria Jönsson, Fredrik Lagergren, Paul A. Miller, Lars Nieradzik, Stefan Olin, Mikko Peltoniemi, Aapo Rautiainen, Mart-Jan Schelhaas, Susanne Suvanto, Pieter Johannes Verkerk, Martin Wittenbrink, and Haoming Zhong

European forests have been subject to increasingly severe disturbances over recent years, particularly with respect to bark beetle outbreaks and fires. The occurrence of such disturbances will likely increase with intensifying climate change, impacting the services that forests provide including climate change mitigation and wood production. Disturbances events are, however, challenging to simulate, which means that possible changes in disturbances rates have been generally excluded from future projections of European forest dynamics. Here we draw on recent developments in the LPJ-GUESS dynamic vegetation model, allowing to simulate bark beetle outbreak, windthrow and fire at the European scale. We initialise LPJ-GUESS with observations of forest stand age and species composition from field and remotely-sensed data. Then we make projections of European forest dynamics over the period 2025–2100 under both strong and moderate climate change scenarios. Consideration of disturbances had locally substantial effects on the carbon sink, biomass stock and harvest extractions, but the effect averaged over the whole continent was relatively modest. Adaptation actions related to modifications of harvest rates, such as shortening or lengthening rotation periods, tended to impact forest dynamics more through their direct effects on harvest than through their interactions with disturbance impacts. Overall, it is harvest actions, not disturbances, which appear to primarily govern the future of the European forest.

How to cite: Pugh, T., Eckes-Shephard, A. H., Lindeskog, M., Arneth, A., Jönsson, A.-M., Lagergren, F., Miller, P. A., Nieradzik, L., Olin, S., Peltoniemi, M., Rautiainen, A., Schelhaas, M.-J., Suvanto, S., Verkerk, P. J., Wittenbrink, M., and Zhong, H.: The impact of future forest disturbances on the European forest carbon sink, stock and wood production, EGU General Assembly 2026, Vienna, Austria, 3–8 May 2026, EGU26-17236, https://doi.org/10.5194/egusphere-egu26-17236, 2026.

EGU26-17632 | Orals | BG3.13

Carbon sequestration potential of high-altitude afforestations in the Eastern Alps 

Andreas Schindlbacher, Erich Inselsbacher, Cecilie Foldal, Alexander König, Andrew Giunta, Gerhard Markart, Katharina Lapin, Herfried Steiner, Benjamin Schumacher, Kevin Kopecky, Silvio Schueler, Georg Kindermann, and Thomas Ledermann

Changes in alpine land management have led to the abandonment of high-altitude pastures in the European Alps. At the same time, climate warming facilitates upward forest expansion, creating opportunities for carbon (C) sequestration by afforestation. However, the magnitude of this potential remains uncertain, as soil C responses and forest growth at high elevations are still poorly understood.

We quantified biomass and soil C stocks in forest stands planted on subalpine pastures (1,600–2,100 m a.s.l.) in the Austrian Alps and compared them with adjacent pastures. In addition, we assessed vascular plant diversity and analysed timberline dynamics surrounding the afforestation sites.

Afforested plots stored 121 ± 49 Mg C ha⁻¹ more organic C than pastures, corresponding to a sequestration potential of 441 ± 179 Mg CO₂ ha⁻¹ within ~55 years after planting. Carbon sequestration occurred predominantly in tree biomass, which grew remarkably well despite the high-elevation conditions, while soil C stocks remained largely unchanged. Vascular plant diversity declined significantly under closed forest canopies, although higher diversity in nearby mature forests indicates partial recovery at later stand stages. Despite regional warming, the upper forest boundary remained largely stable over the past two decades.

Our results suggest that afforestation can accelerate forest establishment around the current upper forest edges and create local carbon sinks, while biodiversity impacts are mixed and strongly context-dependent.

How to cite: Schindlbacher, A., Inselsbacher, E., Foldal, C., König, A., Giunta, A., Markart, G., Lapin, K., Steiner, H., Schumacher, B., Kopecky, K., Schueler, S., Kindermann, G., and Ledermann, T.: Carbon sequestration potential of high-altitude afforestations in the Eastern Alps, EGU General Assembly 2026, Vienna, Austria, 3–8 May 2026, EGU26-17632, https://doi.org/10.5194/egusphere-egu26-17632, 2026.

EGU26-18726 | ECS | Orals | BG3.13

Modelling the impact of dead wood water retention in Central European Forests 

Bechon Matthias, Obermeier Wolfgang, Lehnert Lukas, Pongratz Julia, and Blaschke Markus

In recent years, German forests have faced numerous stress episodes, such as droughts, heatwaves and insect outbreaks, leading to a significant rise in tree mortality. Consequently, deadwood production increased, partly outpacing extraction capacities. This trend coincides with a shift towards more selective forest management methods that partially retain deadwood on logged sites. As a result, the average amount of deadwood per hectare in Germany has substantially increased, climbing from 19.9 m3 ha-1 yr-1 in 2012 to 29.4 m3 ha-1 yr-1 in 2022.

Besides providing valuable species habitats and sequestering carbon, deadwood plays a significant role in the water cycle, by reducing surface runoff and acting as a water reservoir.

Despite its growing abundance and ecological relevance, deadwood is largely neglected in current land surface models such as in JSBACH (ICON-LAND main component), particularly with respect to its impact on hydrology and microclimates.

This omission is rooted in the historical removal of deadwood under conventional management and in limited understanding of deadwood's hydrological properties, which vary with factors such as soil characteristics, canopy closure, deadwood position and species.

Here, we present an approach to quantify and model the influence of deadwood on hydrology and microclimates, by combining experimental field measurements from Bavarian Nature Reserves and the data from the LabForest project in the University forest of the LMU in southern Germany with JSBACH outputs. We compare different methodological pathways for deriving observation-based parameterizations suitable to model integration. Preliminary results indicate that deadwood exerts measurable effects on near-surface microclimate and soil moisture dynamics, highlighting the need to explicitly represent deadwood in land surface modeling frameworks.

How to cite: Matthias, B., Wolfgang, O., Lukas, L., Julia, P., and Markus, B.: Modelling the impact of dead wood water retention in Central European Forests, EGU General Assembly 2026, Vienna, Austria, 3–8 May 2026, EGU26-18726, https://doi.org/10.5194/egusphere-egu26-18726, 2026.

EGU26-20799 | Orals | BG3.13

Enhancing accessibility and understandability of forest mitigation pathways anddata through an integrated science-policy interface 

Kanwal Nayan Singh, Sylvia Schmidt, Sajid Ali, Rupesh Singh, Andrey Lessa Derci Augustynczik, Quentin Lejeune, and Fulvio Di Fulvio

Forests are central to climate change mitigation while simultaneously delivering co-benefits to biodiversity, bioeconomy, and climate adaptation. Yet scientific evidence on forest’s mitigation capacities is often fragmented across datasets, spatial scales, and scenario assumptions, consequently limiting accessibility, understandability, and transparency for decision-making. This contribution presents the ForestNavigator Portal, a science–policy interface designed to support the integrated exploration of forest carbon mitigation pathways and associated mitigation potentials in the European Union.

The platform combines spatially explicit forest monitoring data with emerging pathway outputs derived from alternative policy scenarios to enable a consistent assessment of both historical dynamics, present conditions, and future mitigation options under a range of policy assumptions. The first portal component, the Data Explorer, provides harmonised geospatial indicators, including forest cover, disturbance, and carbon stock change, visualised primarily through spatial maps to support examination of recent trends and disturbance regimes relevant for monitoring and assessment of changes in forest carbon stocks. The Pathways Explorer, the second component, enables comparative analysis of mitigation pathways at EU level, while also supporting exploration of pathways at country level, informed by national data and models, across alternative policy scenarios using aggregated indicators and comparative visual summaries reflecting alternative forest management, wood-use, biodiversity, and adaptation options. Policy scenarios will include an EU reference policy scenario as well as alternative policy pathways for EU forests, based on stakeholder’s input from scenario co-development exercises.

A core methodological contribution is the platform’s capacity to make forest mitigation pathways directly comparable across alternative policy scenarios, with a focus on improving the accessibility and understandability of pathway assessments while supporting the exploration of uncertainty through comparison across alternative policy scenarios and interactions across key dimensions. Interactive comparison functions, split-screen visualisations, and downloadable harmonised datasets reduce barriers between complex modelling outputs and policy-relevant interpretation. Particular attention is given to disturbance monitoring within the Data Explorer and to adaptation-oriented considerations in pathway exploration.

By integrating monitoring data and pathway results within a unified interface, the ForestNavigator Portal advances the practical use of forest science for climate mitigation planning. The approach supports evaluation of combined forest mitigation portfolios rather than isolated measures and contributes to improved science-based understanding of forests capacity to mitigate climate change under evolving environmental and socio-economic conditions.

How to cite: Singh, K. N., Schmidt, S., Ali, S., Singh, R., Derci Augustynczik, A. L., Lejeune, Q., and Di Fulvio, F.: Enhancing accessibility and understandability of forest mitigation pathways anddata through an integrated science-policy interface, EGU General Assembly 2026, Vienna, Austria, 3–8 May 2026, EGU26-20799, https://doi.org/10.5194/egusphere-egu26-20799, 2026.

EGU26-318 | ECS | Orals | BG3.14

Satellite, model and field observation CO2 and CH4 emissions in the Kati Thanda Lake Eyre basin dryland, Australia 

Anju Rana, Benjamin Poulter, Thomas Colligan, Stony Samberg, Judith Rosentreter, and Bradley Eyre

Dryland ecosystems, covering 40–50% of global land surface, experience long dry periods interrupted by episodic floods from extreme rainfall events. These highly variable hydrological conditions strongly influence carbon cycling, yet they remain challenging to monitor due to the remoteness and harsh environmental conditions. Satellite remote sensing, process-based models, such as Lund Potsdam Jena (LPJ) offers a basin wide perspective to track carbon dynamics, complementing the field observations.

In this study, we use monthly satellite observations from OCO-2/OCO-3 and TROPOMI between 2019 and 2024 to estimate CO₂ and CH₄ fluxes from the Kati Thanda Lake Eyre Basin (KTLEB), one of the world’s largest endorheic basins and a significant dryland in Australia. The satellite derived CO₂ and CH₄ fluxes were compared with LPJ model simulations, to evaluate spatial, seasonal, and interannual variability, and further compared against field measurements from flooded and non-flooded sites in 2019, 2022, and 2024. In addition, fluxes were compared against multi sensor water and vegetation indices from Landsat, Sentinel, and MODIS to investigate influence of flooding, and vegetation on carbon fluxes.

We find that satellite derived atmospheric CO₂ (XCO₂) concentrations over KTLEB ranged from 394 to 429 ppm (mean 414 ± 0.3 ppm), showing a significant increase from 2019 to 2024 (τ = 0.84). CH₄ (XCH₄) concentrations ranged from 1.776 to 1.812 ppm (mean 1.794 ± 3.6 ppm), also with a significant increase over time (τ = 0.61). Annual CO₂ fluxes exhibited substantial interannual variability, alternating between net uptake and net emission, whereas CH₄ fluxes were predominantly a net sink. Both satellite and LPJ model fluxes showed similar seasonal trends, with higher CO₂ uptake and CH₄ emissions during wet season, although satellite derived CO2 estimates showed a stronger seasonal swing and greater variability, and CH4 estimates were generally higher. Spatially, both datasets showed similar patterns, with CO₂ uptake concentrated in upper catchment and CH₄ emissions prominent along the basin’s major rivers.

Comparison with field measurements showed that CH₄ emissions were higher during wet season, consistent with satellite observations and LPJ model, and annual CH₄ estimates were broadly comparable across field, satellite, and model data during 2019, 2022, and 2024. CO₂ fluxes, however, varied more among the approaches. This is likely because model and satellite may have missed the initial rapid increase in CO2 fluxes after flooding, and field measurements may have missed some CO2 uptake by vegetation as the floodplain dried out. This underscores the need to improve models by including flood effects and incorporate vegetation carbon fluxes while upscaling field observations to better reconcile carbon estimates across datasets. Correlation analyses further supported this, as CO₂ emissions were significantly correlated with water and vegetation indices, with consistent NDWI, NDVI, and EVI alignment, while CH₄ was predominantly driven by NDWI.

Overall, combining satellite, model, and field measurements provides complementary insights into dryland carbon dynamics, showing that both CO₂ and CH₄ fluxes are driven by flooding, with CO₂ also influenced by post-flood vegetation activity. This highlights the value of integrated data for understanding carbon fluxes in drylands.

How to cite: Rana, A., Poulter, B., Colligan, T., Samberg, S., Rosentreter, J., and Eyre, B.: Satellite, model and field observation CO2 and CH4 emissions in the Kati Thanda Lake Eyre basin dryland, Australia, EGU General Assembly 2026, Vienna, Austria, 3–8 May 2026, EGU26-318, https://doi.org/10.5194/egusphere-egu26-318, 2026.

EGU26-962 | ECS | Posters on site | BG3.14

Extreme Temperatures, Soil Moisture, and Flooding Drive Methane Fluxes in the Kati Thanda-Lake Eyre Basin, Central Australia 

Stony Samberg, Jacob Yeo, Judith Rosentreter, and Bradley Eyre

Drylands and dry inland waterways are increasingly recognized as important contributors to global carbon cycling, but little is known about their response to flooding. Using soil chambers and the headspace equilibrium method, methane concentrations were measured in the Kati Thanda-Lake Eyre Basin (KTLEB) from 2024 through 2025 to establish a seasonal baseline for methane flux across upland, floodplain, and river channels (dry and inundated). A subsequent rainfall event in 2025 induced significant flooding in the KTLEB which allowed us to characterize key conditions before, during, and after an episodic flood pulse.

Under dry conditions methane uptake occurred across all terrestrial sites during the winter (avg: -0.107 ± 0.056 mg/m-2/d-1) but many switched to producing methane in the summer (avg: 0.278 ± 0.124 mg/ m-2/d-1). Methane flux from inundated river channels averaged 2.5 ± 0.4 mg/ m-2/d-1 and 6.4 ± 1.4 mg/ m-2/d-1 during the winter and summer, respectively. Water-air methane fluxes from the inundated river channels were significantly higher than sediment-air methane fluxes, regardless of landscape position (upland, floodplain or dry river channel).

Wetting from rain just prior to the flood had little effect on methane fluxes. However, methane fluxes during the flooding event initially reached 40 ± 3.9 mg/m m-2/d-1 before rapidly decreasing to 5.6 ± 0.5 mg/ m-2/d-1. As floodwater receded, re-exposed floodplain soil produced the highest methane fluxes (max: 172, avg: 42.3 ± 22.7 mg/ m-2/d-1). Three months later, methane fluxes from the soil and water returned to near their pre-flood rate. This work advances our understanding of seasonal dynamics, including episodic flooding, on methane fluxes in drylands.

How to cite: Samberg, S., Yeo, J., Rosentreter, J., and Eyre, B.: Extreme Temperatures, Soil Moisture, and Flooding Drive Methane Fluxes in the Kati Thanda-Lake Eyre Basin, Central Australia, EGU General Assembly 2026, Vienna, Austria, 3–8 May 2026, EGU26-962, https://doi.org/10.5194/egusphere-egu26-962, 2026.

Semi-arid ecosystems cover around one-third of the Earth's terrestrial surface and support over 1.2 billion people. These are water-limited landscapes that are vulnerable to climate variability and various anthropogenic pressures. An important feature of these ecosystems is the emergence of distinct spatial patterns. Such patterns result from processes of self-organisation that are driven by local plant-plant interactions and water redistribution.

Predictions from theoretical models and computer simulations show that these vegetation patterns exhibit specific statistical properties, notably in their cluster-size distributions. Healthy ecosystems are predicted to have underlying power-law distributions (having the form: 𝑝(𝑥) ~ 𝑥𝛽, where 𝛽 is the power-law exponent), characterised by the presence of vegetation clusters of all sizes, including large, connected patches. As ecosystems degrade, theory predicts a progressive truncation of the power-law distribution, with large clusters fragmenting into smaller ones. This has been proposed as a potential early warning signal of ecosystem collapse.

Although extensive theoretical work on self-organised vegetation patterns has been conducted, empirical validation remains critically limited. Most studies examine spatial gradients at a single moment using a space-for-time approach, but only a few have repeatedly monitored the same ecosystem over many years to determine whether the way clusters change over time aligns with what theory predicts. There are no studies at high spatial resolution (~1 m) that also cover landscape-level scales (>1 km²) that have been conducted so far. Our study addresses this gap by analysing multi-year, high-resolution satellite data (~ 1 m) from the study sites in the African semi-arid region. We have examined six sites in the African drylands, utilising high-resolution data from the WorldView-2 satellite, to derive NDVI, binarize vegetation via Otsu thresholding, and extract underlying vegetation cluster-size distributions. Using the spatialwarnings and poweRlaw packages, we fit power-law, truncated power-law, and exponential models to quantify spatial structure and evaluate the power-law exponent β as an indicator of fragmentation and resilience. Temporal analysis examines how vegetation clusters have changed at each location over a few years.

Looking at the underlying vegetation cluster-size distributions, we found that some sites have 2 < β < 3 (where β is the exponent of the power-law fit to the cluster-size distribution), indicating little fragmentation and a balanced mix of small & large clusters, while one site showed a highly fragmented system. Additional insights can be gained by examining how the clusters have evolved over time at a landscape level. Together, these analyses provide a novel approach to studying semi-arid ecosystems from anywhere in the world, utilising satellite imagery, and to make a quantitative assessment of their health in terms of fragmentation and resilience. This approach provides a scalable framework that can be applied globally to identify vulnerable dryland sites and prioritise those that require conservation and management interventions.

How to cite: Biswas, U. and Guttal, V.: Vegetation cluster-size distribution, dynamics and resilience indicators in African semi-arid ecosystems from high-resolution satellite data, EGU General Assembly 2026, Vienna, Austria, 3–8 May 2026, EGU26-1016, https://doi.org/10.5194/egusphere-egu26-1016, 2026.

EGU26-2214 | ECS | Orals | BG3.14 | Highlight

Four decades of declining stability in global dryland ecosystems despite widespread greening 

Wen Zhang, David Moore, Yang Li, Natasha Macbean, Andrew Feldman, Yanghui Kang, Julia Green, Christopher Schwalm, Ben Poulter, Sasha Reed, and Russell Scott

Dryland ecosystems play a key role in regulating both the trend and interannual variability (IAV) of the terrestrial carbon sink and provide key ecosystem services to over 2 billion people. Recent work has highlighted the sensitivity of dryland ecosystems to changing climate, yet uncertainties from satellite data, reliance on land-surface models, and analytical techniques have led to mixed conclusions. Here, we use a unique set of long-term satellite-derived leaf area index (LAI) datasets that include novel machine learning algorithms to remove artifacts that have hindered greening trend analyses in the past. From 1982 to 2020, we find a persistent increase in LAI over 54.7% of drylands, but surprisingly this trend is accompanied by an increase in its interannual variability ( ). Increasing LAIcv is found over 81.8% of drylands, indicating a decline in stability despite long term greening trends. This increasing variability is driven by a divergence between increasing annual growing-season maximum LAI and simultaneously a declining minimum. The observed rise in  also correlates well with an increasing vegetation sensitivity over time to rainfall and to shifts in intra- and interannual rainfall variability. While current dynamic global vegetation models (DGVMs) can reproduce long-term greening, they fail to capture increases in , instead simulating declining variability and convergent LAI trends. Given their disproportionate role in driving the interannual growth rate of atmospheric CO₂, declining stability of global dryland systems is indicative of a potential transition to alternative states that will further impact the carbon cycle and critical ecosystem services that drylands provide.

How to cite: Zhang, W., Moore, D., Li, Y., Macbean, N., Feldman, A., Kang, Y., Green, J., Schwalm, C., Poulter, B., Reed, S., and Scott, R.: Four decades of declining stability in global dryland ecosystems despite widespread greening, EGU General Assembly 2026, Vienna, Austria, 3–8 May 2026, EGU26-2214, https://doi.org/10.5194/egusphere-egu26-2214, 2026.

Capturing long-term dynamics and the potential under climate change of woody aboveground biomass (AGB) is imperative for calculating and raising carbon sequestration of afforestation in dryland. It has always been a great challenge to accurately capture AGB dynamics of sparse woody vegetation mixed with grassland using only Landsat time-series, resulting in changing trajectories of woody AGB estimates that cannot accurately reflect woody vegetation growth regularity in dryland. In this study, surface reflectance (SR) sensitive to woody AGB was first selected, and interannual time-series of composited SR were smoothed using an S–G filter for each pixel; then, the optimal machine learning algorithm was selected to estimate woody AGB time-series. Pixels that have reached AGB potential were detected based on the AGB changing trajectory, and the potential was spatially and temporally extended using a random forest model combining environmental variables under current climate conditions and CMIP6 climate models. Results show that: (1) minimum value composites based on NIRv during July–September are more capable of explaining woody AGB variation in dryland (R = 0.87, p < 0.01), and the random forest (RF) model has the best performance in estimating woody AGB (R² = 0.75, RMSE = 4.74 t·ha⁻¹) among commonly used machine learning models; (2) annual woody AGB estimates can be perfectly fitted with a logistic growth curve (R² = 0.97, p < 0.001), indicating explicit growth regularity of woody vegetation, which provides a physiological foundation for determining woody AGB potential; and (3) woody AGB potential can be accurately simulated by RF combining environmental variables (R² = 0.95, RMSE = 2.89 t·ha⁻¹), and current woody AGB still has a small potential for increase, whereas overall losses of woody AGB potential are projected for 2030, 2040, and 2050 under CMIP6 SSP-RCP scenarios.


How to cite: Wang, Z.: Capturing woody aboveground biomass historical change and potentialunder climate change using Landsat time-series for afforestation in dryland of China , EGU General Assembly 2026, Vienna, Austria, 3–8 May 2026, EGU26-2388, https://doi.org/10.5194/egusphere-egu26-2388, 2026.

EGU26-3281 | Posters on site | BG3.14

Tree cover gains dominate vegetation greening and incremental differences between productivity and biomass in China’s drylands 

Gaopeng Sun, Guangyao Gao, Xianfeng Liu, Zheng Fu, Changjia Li, Xiaoming Feng, and Bojie Fu

Trees play a vital role in structuring processes of dryland ecosystems, and China’s drylands have experienced significant vegetation greening in recent decades because of large-scale forestation. However, the contributions of tree cover (TC) expansion to increases in vegetation greenness (leaf area index, LAI), productivity (gross primary production, GPP), and biomass (vegetation optical depth, VOD), along with their incremental differences, remain unclear. This study indicated that the China’s drylands revealed a significant TC increase (2.3% ± 0.3% decade⁻¹, p < 0.05) from 2001 to 2018, whereas non-tree vegetation cover (NTC, i.e., shrubs, grasses, and crops) exhibited a nonlinear shift—rising before 2010 but declining afterward. Forestation-driven TC expansion accounted for more than 75% of LAI increase throughout the study period, as well as over 70% of GPP and VOD increases pre-2010; however, TC expansion contributed to 42.6% of increase in GPP but little to VOD post-2010. Furthermore, rising GPP/LAI ratios coupled with declining VOD/LAI ratios indicated vegetation carbon sequestration enhanced but moisture content reduced per unit leaf area, and TC gains explained over half of the observed divergence between productivity enhancement and biomass accumulation. The results highlight the leading role of tree restoration in the greening of China’s drylands and the subsequent increased incremental differences between productivity and biomass, characterized by “trading water for carbon” at the leaf and canopy scales. The findings underscore the critical need to monitor both biomass distribution and moisture dynamics within the vertical structure of dryland ecosystems, particularly given the carbon–water imbalance driven by large-scale forestation efforts.

How to cite: Sun, G., Gao, G., Liu, X., Fu, Z., Li, C., Feng, X., and Fu, B.: Tree cover gains dominate vegetation greening and incremental differences between productivity and biomass in China’s drylands, EGU General Assembly 2026, Vienna, Austria, 3–8 May 2026, EGU26-3281, https://doi.org/10.5194/egusphere-egu26-3281, 2026.

EGU26-3785 | ECS | Posters on site | BG3.14

Grazing amplifies grassland productivity sensitivity to climate variability through altered water regulation in drylands 

Ge Gao, Jia Liu, Yicheng Wang, and Josep Peñuelas

Dryland grasslands are increasingly exposed to the combined pressures of climate warming, drying and intensified grazing, yet how grazing alters ecosystem sensitivity to climate variability remains poorly understood. In particular, the ecohydrological mechanisms through which grazing influences vegetation productivity under climate change are still unclear. Here, we investigate how grazing modifies the climate sensitivity of net primary productivity (NPP) in a temperate dryland grassland ecosystem.

We focused on a grassland watershed in Inner Mongolia, China, and combined process-based modelling with interpretable machine learning to analyze long-term NPP responses to climate variability under contrasting grazing intensities. Using an HRU-based DNDC model, we reconstructed multi-decadal NPP dynamics under grazing and no-grazing scenarios. Random forest models and SHAP analysis were then applied to quantify changes in the relative importance of precipitation characteristics, soil moisture and temperature.

Our results show that total precipitation, precipitation frequency and early to mid-growing season soil moisture (June–July) are the dominant hydrometeorological controls on NPP in this dryland system. However, grazing substantially amplifies NPP sensitivity to climate variability by weakening ecosystem water regulation capacity. This amplification effect differs among vegetation types. Low-coverage grasslands exhibit strong sensitivity to water availability, while medium-coverage grasslands maintain higher regulatory capacity. In contrast, high-coverage grasslands are most vulnerable to the combined impacts of grazing and climate stress.

Threshold analysis reveals vegetation-dependent grazing intensities beyond which ecosystem stability declines. High-coverage grasslands show reduced stability at relatively low grazing intensity (~0.25 beef ha⁻¹), whereas medium- and low-coverage grasslands tolerate higher intensities (~0.3 beef ha⁻¹). Historical NPP trajectories further indicate nonlinear responses, including lag effects and metastable states, suggesting that shifts in grazing pressure can trigger abrupt changes in ecosystem functioning.

Our findings demonstrate that grazing acts as a key amplifier of climate sensitivity in dryland grasslands by altering ecohydrological controls on productivity. These results highlight the importance of incorporating vegetation type and water availability into adaptive grazing management strategies under increasing climate variability.

How to cite: Gao, G., Liu, J., Wang, Y., and Peñuelas, J.: Grazing amplifies grassland productivity sensitivity to climate variability through altered water regulation in drylands, EGU General Assembly 2026, Vienna, Austria, 3–8 May 2026, EGU26-3785, https://doi.org/10.5194/egusphere-egu26-3785, 2026.

EGU26-4565 | Orals | BG3.14

Greenhouse gas emissions from flooded drylands (Kati Thanda Lake Eyre basin, Australia) 

Bradley Eyre, Judith Rosentreter, and Dirk Erler

Covering 40–50% of the Earth’s surface drylands make an important contribution to the terrestrial carbon sink and the global carbon cycle. However, in addition to extended dry periods, drylands also experience extreme flood events. We will present carbon dioxide (CO2), methane (CH4) and nitrous oxide (N2O) emissions from Kati-Thanda-Lake-Eyre basin in central Australia during flooding in 2019. The low basin slope resulted in a large wet of inundation (up to 33,547 km2), that remained wet for an extended period (89 to 325 days). Up-scaling the daily measured fluxes for the changing wet surface area, for the period it was wet, has the potential to result in around 115 Tg of CO2 and 21 Gg of CH4  emitted, and 2 Gg of N2O consumed (Total= 117 Tg CO2e). The low gradient and associated low volume of water transported and large wet area also resulted in the vertical flux of carbon being up to about 800 times the river transported carbon. This first-order estimate of GHG emissions from the Kati-Thanda-Lake-Eyre basin suggests that when flooded, dryland systems globally have the potential to make a significant but currently unaccounted for, contribution to global GHG emissions.

How to cite: Eyre, B., Rosentreter, J., and Erler, D.: Greenhouse gas emissions from flooded drylands (Kati Thanda Lake Eyre basin, Australia), EGU General Assembly 2026, Vienna, Austria, 3–8 May 2026, EGU26-4565, https://doi.org/10.5194/egusphere-egu26-4565, 2026.

The northern and central coast of Chile exhibits a pronounced aridity gradient extending over 1,000 km, from the hyperarid Atacama Desert (~18°S) to the Mediterranean shrublands of central Chile (~34°S). This gradient is controlled by the interaction between the South Pacific Anticyclone, the Andean rain shadow, and the Humboldt Current. Despite these extreme arid conditions, the coastal zone is characterized by the recurrent presence of fog associated with marine stratocumulus clouds, which, upon interacting with the coastal range, generate persistent fog banks over land. Marine fog constitutes the main water source for highly specialized ecosystems such as fog oases and fog-dependent forests distributed along this gradient. In addition to fog and rainfall, dew has also been recognized as an important water source for biological communities. While the meteorology of these water inputs is well documented, their combined influence on surface soil moisture and temperature dynamics remains poorly understood.

This study evaluated the ecohydrological response of surface soil (2 cm depth) to atmospheric water regimes at four fog-dependent ecosystems (20°S-32°S): Alto Patache Research Station (hyperarid), Pan de Azúcar National Park (arid), Bosque Fray Jorge National Park (semiarid), and El Boldo Private Park (Mediterranean), during winter and spring 2025.

During the winter-spring study period, results reveal a marked north-south increase in rainfall, from 0.2 mm at Alto Patache to 155 mm at El Boldo, whereas fog exhibited an inverse pattern, peaking at the hyperarid site (>1,100 L m⁻²) and reaching minimum values in the Mediterranean zone (41 L m⁻²). Dew emerged as a relevant water source in arid and hyperarid sites (≈31 L m⁻²), exceeding values in semiarid and Mediterranean environments (10 and 26 L m⁻², respectively). Soil moisture dynamics indicate that Mediterranean and semiarid sites exhibit high temporal variability driven by rainfall pulses (mean ≈0.14 m³ m⁻³, SD = 0.055, and 0.06 m³ m⁻³, SD = 0.018, respectively), whereas hyperarid and arid sites maintain relatively stable moisture regimes (SD ≈ 0.0075) closely associated with fog and dew at weekly timescales. At daily scales, soil temperature showed significant negative correlations with non-rainfall water inputs across all sites, highlighting fog and dew as dominant thermal regulators that buffer soil heating.

We conclude that soil moisture and temperature regimes along this aridity gradient are governed by distinct hydrological drivers. A hydrological compensation mechanism emerges, whereby fog and dew sustain soil moisture and regulate soil temperature during rainless periods, particularly under hyperarid conditions. These findings underscore the critical role of non-rainfall water inputs in maintaining the ecohydrological resilience of drylands soils under future climate change.

How to cite: Ríos-Silva, F., Alfaro, F. D., Fuentealba, M., and del Río, C.: Ecohydrological controls on soil moisture and temperature along an aridity gradient in the Atacama Desert: the role of fog, dew, and rainfall in the maintenance of fog-dependent ecosystems, EGU General Assembly 2026, Vienna, Austria, 3–8 May 2026, EGU26-8357, https://doi.org/10.5194/egusphere-egu26-8357, 2026.

EGU26-8552 | ECS | Orals | BG3.14

Climate Variability Drives Phenological Decoupling of Dryland Photosynthesis from Canopy Greenness and Water Content 

Yuqi Dong, Yu Zhou, Li Zhang, Jingfeng Xiao, José M. Grünzweig, and Xing Li

Drylands strongly modulate interannual variability of the global land carbon sink, yet photosynthetic seasonality is often inferred from vegetation greenness and canopy water content under the assumption that canopy dynamics and carbon uptake remain tightly coupled. Here we show that this assumption is widely violated. Across global drylands during 2001–2020, satellite-derived photosynthesis becomes increasingly decoupled from both greenness and canopy water content in the timing of growing-season onset and senescence. Approximately 35% of drylands exhibit significant decoupling at both the start and end of the growing season, with pronounced hotspots in the Sahel, Central Asia and Australia, where the correlation between photosynthetic phenology (SIF-derived) and canopy dynamic phenology (EVI2/VOD) declined by 0.42–0.48 from 2001–2010 to 2011–2020. Spatial attribution indicates that higher precipitation seasonality drives start-of-season decoupling, whereas higher temperature seasonality drives end-of-season decoupling, with both strengthened under elevated CO₂. However, state-of-the-art process-based models fail to reproduce either the emergent decoupling patterns or their inferred controls, suggesting that key nonlinear responses of dryland vegetation to hydroclimatic variability and CO₂ are misrepresented. This widespread decoupling suggests that changes in canopy condition no longer provide a consistent proxy for when carbon uptake begins or ends, potentially biasing estimates of terrestrial carbon sequestration under ongoing climate change. By pinpointing where and why dryland productivity decouples from canopy dynamics, our analysis reveals key model limitations and provides new constraints for predicting dryland carbon uptake and carbon–climate feedbacks under ongoing climate change.

How to cite: Dong, Y., Zhou, Y., Zhang, L., Xiao, J., Grünzweig, J. M., and Li, X.: Climate Variability Drives Phenological Decoupling of Dryland Photosynthesis from Canopy Greenness and Water Content, EGU General Assembly 2026, Vienna, Austria, 3–8 May 2026, EGU26-8552, https://doi.org/10.5194/egusphere-egu26-8552, 2026.

EGU26-8834 | Posters on site | BG3.14

Aridity-induced nonlinear shifts in soil organic carbon across Chinese grasslands 

Yunxiang Cheng and Tianyang Fu

Soil organic carbon (SOC) is an important carbon pool in terrestrial ecosystems that plays a key role in global carbon cycling and climate regulation. However, the patterns of SOC variation along aridity gradients remain poorly characterized, particularly under varying aridity conditions. To address this gap, we surveyed 192 sites across nine provinces in China, spanning environmental gradients from humid to extremely arid regions. Our findings revealed a distinct threshold at an aridity level of 0.77, beyond which SOC accumulation and stability became more closely associated with microbial diversity and soil enzyme activity, while the influence of vegetation and nutrient inputs declined significantly. Notably, β-glucosidase activity showed strong correlations with SOC dynamics under severe aridity. These results indicate that intensified aridity conditions shift the biotic and abiotic correlates of SOC, emphasizing the increasing relevance of microbial and enzymatic characteristics under arid environments. This study highlights the nonlinear response of SOC to aridity and identifies a critical threshold at an aridity level of 0.77, underscoring the potential value of microbial and enzymatic indicators in monitoring soil carbon changes. These findings provide important insights into the vulnerability of grassland soil carbon stocks and offer a scientific basis for developing adaptive management strategies to conserve carbon sinks under future climate scenarios.

How to cite: Cheng, Y. and Fu, T.: Aridity-induced nonlinear shifts in soil organic carbon across Chinese grasslands, EGU General Assembly 2026, Vienna, Austria, 3–8 May 2026, EGU26-8834, https://doi.org/10.5194/egusphere-egu26-8834, 2026.

EGU26-9228 | ECS | Posters on site | BG3.14

Diversity-multifunctionality relationships shift with increasing aridity in grasslands 

Weiling Niu, Jingyi Ding, Wenwu Zhao, Yanxu Liu, Shuai Wang, Changjia Li, Yan Li, Xutong Wu, David Eldridge, and Bojie Fu

Grasslands are a dominant global ecosystem, yet they face an uncertain future due to the accelerating threat of aridification, particularly in drylands. Species diversity and functional diversity can enhance the resilience of grasslands to aridity and help to maintain multiple ecosystem functions (multifunctionality) to face these challenges. Yet, the relative roles of species diversity and functional diversity in promoting this resilience are not well understood. We examined how diversity-multifunctionality relationships varied with increasing aridity, and explored the underlying mechanisms at 104 grassland sites spanning an extensive aridity gradient in China. Our results indicate that positive diversity-ecosystem multifunctionality relationships strengthened with increasing aridity but waned at aridity levels exceeding 0.83, a region that corresponds to the transition between semiarid and arid climates. This threshold also coincided with a shift in the relative importance of functional diversity and species diversity. Specifically, functional diversity was more strongly associated with multifunctionality under wetter conditions, but under drier conditions, species diversity, particularly plant diversity, played a more dominant role. Predicted drier conditions would promote a more diverse grassland community, but not necessarily species with more diverse traits. Our results suggest that enhancing species diversity can mitigate the impacts of intensified aridification in grasslands under a drier climate. These finding demonstrate the importance of protecting species-rich grasslands as the planet becomes hotter and drier. By prioritizing climate-specific biodiversity management and matching actions to particular dimensions of diversity, grassland managers can ensure that diversity benefits translate into tangible gains in ecosystem services and climate resilience.

How to cite: Niu, W., Ding, J., Zhao, W., Liu, Y., Wang, S., Li, C., Li, Y., Wu, X., Eldridge, D., and Fu, B.: Diversity-multifunctionality relationships shift with increasing aridity in grasslands, EGU General Assembly 2026, Vienna, Austria, 3–8 May 2026, EGU26-9228, https://doi.org/10.5194/egusphere-egu26-9228, 2026.

EGU26-10255 | ECS | Posters on site | BG3.14

Improved mapping of dynamic soil properties by comparing date-specific vs. temporal mosaicking strategies on bare agricultural soils using Sentinel-2 

Mukhtar Abubakar, Youssef Fouad, Didier Michot, Hamouda Aïchi, Lucie Martin, Hayfa Zayani, and Emmanuelle Vaudour

Mapping dynamic soil properties (DSPs), such as pH and nutrient levels, that fluctuate under management practices (fertiliser application, liming, irrigation, etc.), seasonal cycles, and environmental factors, is essential for precision agriculture, yet reliably quantifying them from satellite imagery remains a challenge. In this study, conducted in a semi-arid agricultural region of Tunisia covering 480 km², we challenge the standard composite-first paradigm by systematically evaluating the relationship between specific satellite acquisition dates and the predictability of DSPs. Using a dense time series of Sentinel-2 imagery (2019-2023) and 215 soil sampling points, we modelled key DSPs (pH, K, P₂O₅, EC, and Na) and soil moisture suctions (pF2.8 and pF4.2) using both temporal mosaic and date-specific approaches, with the latter being applied only on dates with at least 50 valid samples after cloud and vegetation filtering. Our results reveal a crucial limitation of the temporal mosaic approach, which yielded poor predictive performance, validated by low RPIQ values, for all properties. In contrast, date-specific analysis showed that certain DSPs, notably pH, K, and P₂O₅, could be predicted with high accuracy on specific optimal dates. At the same time, EC and Na remained poorly predicted, likely due to a low proportion of saline points in the dataset. We conclude that in such semi-arid agricultural environment, the temporal context of image acquisition is a decisive factor for successfully mapping specific DSPs, mandating a strategic shift from universal composites toward date-specific modelling for operational soil mapping.

How to cite: Abubakar, M., Fouad, Y., Michot, D., Aïchi, H., Martin, L., Zayani, H., and Vaudour, E.: Improved mapping of dynamic soil properties by comparing date-specific vs. temporal mosaicking strategies on bare agricultural soils using Sentinel-2, EGU General Assembly 2026, Vienna, Austria, 3–8 May 2026, EGU26-10255, https://doi.org/10.5194/egusphere-egu26-10255, 2026.

EGU26-12338 | ECS | Posters on site | BG3.14

Impact of changing precipitation variability on carbon budgets of global semi-arid savannas 

Laura Nadolski, Marieke Wesselkamp, Markus Lange, Tarek El Madany, Jacob Nelson, Arnaud Carrara, Aleksander Wieckowski, Anke Hildebrandt, Markus Reichstein, and Sung-Ching Lee

Global warming leads to increased precipitation variability, impacting vegetation and the terrestrial carbon sink. While the impact of mean annual precipitation on vegetation and the carbon cycle is well-studied, recent research emphasizes the importance of intra-annual precipitation variability in precipitation-productivity relationships. In drylands the effects of changed precipitation variability on ecosystem functioning are still not fully understood, and therefore also not captured well in Earth system models. Available studies cover either multiple sites, but focus on the effects of changing inter-annual precipitation variability on productivity, or focus on single dryland sites to assess the effect of changing seasonal precipitation variability on carbon fluxes. A multi-site analysis of the effect of intra-annual precipitation variability on carbon fluxes across global semi-arid savannas is still missing.

Here, we contribute to closing this gap by incorporating data from multiple eddy covariance measurement stations located in semi-arid savanna ecosystems around the globe. We examined the impacts of precipitation variability on ecosystem carbon fluxes by: i) assessing the sensitivity of ecosystem CO2 fluxes to precipitation amount, frequency and intensity on the annual scale, ii) evaluating the importance of each metric in explaining seasonal CO2 fluxes, and iii) understanding direct and indirect effects of precipitation metrics on ecosystem CO2 fluxes in different seasons.

On the annual scale precipitation variability has a positive effect on both gross primary productivity and ecosystem respiration. However, these effects partly cancel out, with different ecosystem processes dominating in different seasons. On the seasonal scale, both precipitation frequency and intensity explain more variance in net CO2 fluxes than precipitation amount. Linear mixed effect models show that models containing all three metrics together have the most explanatory power. Structural equation models show that across seasons soil water content is the main mediator of precipitation impacts on CO2 fluxes. In the next steps we will investigate how other site properties, such as canopy cover and height, mean annual precipitation or soil composition, modulate the effects of precipitation variability on the ecosystem CO2 fluxes.

How to cite: Nadolski, L., Wesselkamp, M., Lange, M., El Madany, T., Nelson, J., Carrara, A., Wieckowski, A., Hildebrandt, A., Reichstein, M., and Lee, S.-C.: Impact of changing precipitation variability on carbon budgets of global semi-arid savannas, EGU General Assembly 2026, Vienna, Austria, 3–8 May 2026, EGU26-12338, https://doi.org/10.5194/egusphere-egu26-12338, 2026.

EGU26-12786 | ECS | Posters on site | BG3.14

Dryland vegetation patterns: the impact of diffusion network topology 

Sara Filippini, Luca Ridolfi, and Jost von Hardenberg

In numerous dryland regions, the vegetation is not distributed uniformly in space. Rather, it is organized into patterns with varying degrees of regularity. These patterns may be explained as the result of a self-organization process driven by water scarcity. In this framework, the ability to form patterns represents an important resource for dryland resilience, as it allows the ecosystem to circumvent a “tipping point” transition from uniform vegetation to desert. Reaction-diffusion vegetation models are often employed to reproduce highly regular patterns. The factors determining the emergence of patterns with lower regularities remain unclear.

Recent studies in the field of network theory have shown that similar reaction-diffusion mathematical models generate patterns on idealized networks. Taking inspiration from these theorethical works, we studied the formation of vegetation patterns in relation to the topologies of the networks through which water and biomass diffuse. To do so, we employed a physical reaction-diffusion vegetation model, and gradually modified the topology of the diffusion networks by adding random shortcuts over a 2-dimensional grid (representing either soil heterogeneities or seed dispersal mechanisms), thus interpolating between a regular lattice and a random network. 

We found that network topology strongly shapes both the resulting vegetation patterns and the precipitation range that supports them. Three behavioral regimes emerge. On a regular lattice, highly regular patterns develop reflecting local diffusion processes. On a random network, the system is dominated by global pressure towards homogenization yielding either a uniform state or a single patch. In the intermediate shortcut density range, as the network topology resembles a small world network, the interaction between the two scales of diffusion generates two kinds of disordered patterns: low-regularity patterns with a well-defined characteristic wavelength, and irregular patterns characterized by a broad patch size distribution. These disordered patterns resemble real-world observations and, in our model, they show different responses to changing precipitation. Although we focused on dryland vegetation, we suggest that network-mediated diffusion could lead to similar mechanisms in a wide variety of pattern-forming systems.

How to cite: Filippini, S., Ridolfi, L., and von Hardenberg, J.: Dryland vegetation patterns: the impact of diffusion network topology, EGU General Assembly 2026, Vienna, Austria, 3–8 May 2026, EGU26-12786, https://doi.org/10.5194/egusphere-egu26-12786, 2026.

EGU26-15033 | Orals | BG3.14

Same climate, different recovery: Carbon and water dynamics of semi-arid woodlands through drought and deluge 

Anne Griebel, Tingting Wang, Nicola Lieff, Benjamin Russell, Meng Luo, Cacilia Ewenz, and Matthew Northwood

Australia’s semi-arid ecosystems can exert a disproportionate influence on interannual carbon cycling, yet their resilience to increasingly hot and prolonged drought remains poorly constrained. Here, we combine long-term eddy covariance measurements with stand inventory data from paired flux tower sites in Australia’s semi-arid zone to examine ecosystem responses to the Tinderbox drought that preceded the 2019/2020 Black Summer bushfires.
The complete omission of two consecutive wet seasons led to substantial reductions in ecosystem productivity, accompanied by marked declines in understorey grass cover and increased overstorey tree mortality. Despite this widespread drought impact, productivity was reduced rather than halted, highlighting the capacity of woody semi-arid systems to persist under extreme water limitation.
Following the drought, an unusual triple La Niña delivered multiple years of above-average rainfall. Despite experiencing the same climatic forcing, adjacent Acacia woodlands exhibited contrasting recovery trajectories: a stand characterised by lower tree density and higher drought-induced mortality recovered slowly, whereas a denser stand with lower mortality showed a rapid rebound in carbon uptake.
Together, these results demonstrate that local differences in vegetation structure, mortality, and access to soil water strongly shape ecosystem recovery following extreme climate events, complicating efforts to predict the future resilience of semi-arid woody ecosystems under a warming climate.

How to cite: Griebel, A., Wang, T., Lieff, N., Russell, B., Luo, M., Ewenz, C., and Northwood, M.: Same climate, different recovery: Carbon and water dynamics of semi-arid woodlands through drought and deluge, EGU General Assembly 2026, Vienna, Austria, 3–8 May 2026, EGU26-15033, https://doi.org/10.5194/egusphere-egu26-15033, 2026.

EGU26-16557 | ECS | Orals | BG3.14

Patchiness configuration fidelity in dryland vegetation: the EO scale-issue and challenge for spatial pattern surveys 

Eva Arnau-Rosalén, Ángel Marqués-Mateu, Juan F. Martínez-Sánchez, Adolfo Molada-Tébar, Borja Rodríguez-Lozano, Emilio Rodríguez-Caballero, Ramón Pons-Crespo, Roberto Lázaro-Suau, Víctor Castillo-Sánchez, Yolanda Cantón-Castilla, Adolfo Calvo-Cases, and Elias Symeonakis

The way vegetation is spatially arranged is a major concern for understanding ecosystem structure and functioning, and it is particularly relevant in drylands due to its control on surface water redistribution. As a result, vegetation spatial configurations derived from Earth Observation (EO) data are widely used as the basis for ecological indicators. However, the transition from pixel-based vegetation mapping to pattern-based interpretation is often implicitly assumed to be straightforward.

In patchy dryland landscapes, where vegetation and bare soil coexist at fine spatial scales, this assumption may be particularly problematic. Spatial structures extracted from EO products are not direct observations of ecological organization, but outcomes of classification and mapping choices operating across multiple spatial scales. Sensor characteristics, spatial resolution and spatial support, together with algorithmic choices, jointly shape how vegetation configurations are inferred and subsequently interpreted.

In this contribution, we examine how different EO-derived estimates of vegetation influence the spatial patterns retrieved in dryland ecosystems. Using aerial and drone imagery across varying spatial and spectral resolutions, we assess the sensitivity of commonly used spatial pattern descriptors to mapping and classification choices, without restricting the analysis to a single methodological approach. Particular attention is given to how pixel-level decisions propagate to landscape-scale pattern characterizations, affecting the apparent configuration of vegetation.

Our results show that spatial pattern metrics vary substantially across EO-derived vegetation products, and that apparent differences in configuration may arise from classification artefacts as much as from genuine ecological structure. This has important implications for the use of spatial patterns as empirical proxies for ecosystem functioning, highlighting the need for more scale-aware mapping workflows and more cautious use of EO-derived spatial patterns in dryland environments.

How to cite: Arnau-Rosalén, E., Marqués-Mateu, Á., Martínez-Sánchez, J. F., Molada-Tébar, A., Rodríguez-Lozano, B., Rodríguez-Caballero, E., Pons-Crespo, R., Lázaro-Suau, R., Castillo-Sánchez, V., Cantón-Castilla, Y., Calvo-Cases, A., and Symeonakis, E.: Patchiness configuration fidelity in dryland vegetation: the EO scale-issue and challenge for spatial pattern surveys, EGU General Assembly 2026, Vienna, Austria, 3–8 May 2026, EGU26-16557, https://doi.org/10.5194/egusphere-egu26-16557, 2026.

EGU26-16823 | ECS | Posters on site | BG3.14

Quantifying woody cover dynamics in heterogeneous dryland ecosystems: a 36-year Landsat assessment (1989-2025) 

Felana Nantenaina Ramalason, Olivia Lovanirina Rakotondrasoa, Arthur Vander Linden, Guillaume Renard, and Jean-François Bastin

Open woody formations provide critical dryland ecosystem services—fuelwood, charcoal, construction materials, and livestock fodder—yet remain systematically underestimated by global monitoring systems prioritizing dense forests. Conventional binary forest/non-forest classifications fail to effectively detect these formations, creating a disconnect between forest cover assessments and ground reality. This limitation highlights fundamental challenges in detecting sparse woody vegetation where deciduous phenology, spectral confusion with herbaceous vegetation, and shadows compromise traditional remote sensing.

We mapped continuous woody cover (0-100%) across 36 years (1989-2025) using Landsat imagery and Random Forest regression calibrated on 505 photo-interpreted plots and validated on 41 field plots. Images acquired during rainy season/early dry season maximized detection when deciduous species retain foliage. We analyzed fire regimes (2000-2024) and human pressure via distance gradients from habitations (1-10 km) to identify degradation drivers.

Intact woody thickets declined dramatically from 60% (1989) to 35% (2025), with accelerating loss after 2010. Fire is the primary degradation driver: burned areas lose four times more woody cover than unburned zones. Crucially, fire frequency—not single events—determines degradation severity. Natural recovery is very limited even after 10 years, insufficient to offset immediate post-fire losses. Human proximity also shows significant impacts: woody cover is approximately 20% lower near habitations than in remote areas.

Continuous woody cover mapping successfully quantifies sparse woody vegetation dynamics in heterogeneous dryland environments. This approach is transferable to similar dryland ecosystems globally facing comparable detection challenges. Results reveal that fire frequency exceeds natural recovery capacity, providing scientific evidence to inform conservation and restoration strategies in drylands under increasing anthropogenic pressure.

How to cite: Ramalason, F. N., Rakotondrasoa, O. L., Vander Linden, A., Renard, G., and Bastin, J.-F.: Quantifying woody cover dynamics in heterogeneous dryland ecosystems: a 36-year Landsat assessment (1989-2025), EGU General Assembly 2026, Vienna, Austria, 3–8 May 2026, EGU26-16823, https://doi.org/10.5194/egusphere-egu26-16823, 2026.

EGU26-16936 | ECS | Orals | BG3.14

Groundwater access does not ensure resilience: climate change effects in a groundwater-dependent ecosystem in the Mediterranean region 

María Trinidad Torres-García, Maria Jacoba Salinas-Bonillo, Montserrat Escudero-Clares, and Javier Cabello

Climate change effects (i.e., rising temperatures and reduced rainfall) and land use changes are expected to affect dryland ecosystems worldwide, particularly those that rely on groundwater. These effects are already detected in southeastern Spain where we find one of the few groundwater-dependent ecosystems (GDEs) in European drylands. This GDE is dominated by the phreatophyte Ziziphus lotus (L.) Lam., a winter-deciduous arborescens shrub native to the Mediterranean region. We monitored spatio-temporal variation in groundwater depth and salinity, as well as climate (daily temperature, precipitation, and vapor pressure deficit) for 8 years (2018-2025) to assess the ecophysiological responses of Z. lotus to climate change effects. Hourly groundwater monitoring in 8 boreholes along a natural depth-to-groundwater gradient (2-25 m) was coupled with mid-summer (peak of plant physiological activity) measurements of water potential, photosynthetic capacity, transpiration rate, and water-use efficiency (WUE) of Z. lotus. Overall, annual trends indicated increased water stress and decreased photosynthetic activity of Z. lotus. Lower photosynthetic activity and stable transpiration rates reduced its WUE. Despite the absence of a clear long-term decline in groundwater levels, a sustained increase in air temperature without compensatory precipitation has led to increased atmospheric water demand, driving physiological stress and earlier defoliation in Z. lotus. Elevated groundwater salinity likely imposed additional osmotic stress. This decoupling between carbon assimilation and water loss suggests a progressive weakening of the ecosystem buffering capacity under combined atmospheric and osmotic stress. This long-term study shows that increasing climatic aridity reduces the productivity and weakens the resilience of GDEs, highlighting the vulnerability of these key dryland ecosystems.

How to cite: Torres-García, M. T., Salinas-Bonillo, M. J., Escudero-Clares, M., and Cabello, J.: Groundwater access does not ensure resilience: climate change effects in a groundwater-dependent ecosystem in the Mediterranean region, EGU General Assembly 2026, Vienna, Austria, 3–8 May 2026, EGU26-16936, https://doi.org/10.5194/egusphere-egu26-16936, 2026.

EGU26-18299 | ECS | Posters on site | BG3.14

From Mapping to Risk: Two Decades of Land-Use and Land-Cover Change in Tropical Dryland–Forest Mosaics 

Khalil Ali Ganem, Yongkang Xue, Andeise Cerqueira Dutra, Thomas Gillespie, Frans Germain Corneel Pareyn, and Yosio Edemir Shimabukuro

Tropical dryland–forest mosaics host hundreds of millions of people and are among the world’s most climate-sensitive landscapes. Yet these heterogeneous regions remain difficult to monitor consistently with Earth observation due to persistent cloud cover, sparse and variable vegetation with asynchronous phenological responses to irregular rainfall pulses, and limited ground reference data. These constraints have historically capped land-use and land-cover (LULC) mapping accuracy and hindered the detection of subtle but consequential transitions in dryland ecosystems. We developed a 21-year (2000–2020) time-series remote-sensing framework that overcomes these barriers by integrating climate-driven compositing optimized for rainfall gradients, region-specific classification, and machine learning. Our approach generates multiclass, annual, cloud-free mosaics with <0.5% pixel gaps from moderate-resolution satellite imagery and maps LULC using a Random Forest model with dozens of spectral, temporal, and fraction-based predictors. External validation demonstrates a step-change in performance for heterogeneous dryland–forest environments, achieving unprecedented >90% overall accuracy and enabling reliable tracking of both forest and non-forest formations at regional scale. Applying this dataset to Northeast Brazil reveals dramatic transformations over two decades: forest cover declined by 22%, grasslands by 68%, and agriculture expanded by 140%, equivalent to roughly 10 million soccer fields, while encroachment around protected Amazon areas intensified. Building on these maps, we apply interval-level intensity analysis and spatial driver diagnostics to examine how land transformation propagates through coupled human–environment systems. Results reveal sustained periods of rapid change in the early 2000s, followed by a partial slowdown after 2013, with distinct spatial pathways of expansion for farming and non-vegetated land. Vegetation losses are strongly correlated with demographic growth, economic activity, and energy use. Critically, severe multi-year droughts affecting ~60% of the study area amplify degradation in seasonally dry tropical forests. Over 70% of forest conversion occurs within 30 km of roads, with sharp decay beyond 50 km, highlighting infrastructure as a dominant organizing force of landscape change. By linking high-accuracy mapping with change intensity, climate stress, and accessibility gradients, this work moves beyond describing where change happens to explaining how and why it propagates. Our approach demonstrates significant improvements over existing datasets, showing 29–70% spatial concordance with alternative products while achieving superior class discrimination. This open-access product (http://www.dsr.inpe.br/DSR/laboratorios/LAF) provides a transferable blueprint for monitoring land transformation and assessing socio-environmental risk across dryland–forest mosaics worldwide.

How to cite: Ali Ganem, K., Xue, Y., Cerqueira Dutra, A., Gillespie, T., Germain Corneel Pareyn, F., and Edemir Shimabukuro, Y.: From Mapping to Risk: Two Decades of Land-Use and Land-Cover Change in Tropical Dryland–Forest Mosaics, EGU General Assembly 2026, Vienna, Austria, 3–8 May 2026, EGU26-18299, https://doi.org/10.5194/egusphere-egu26-18299, 2026.

EGU26-19005 | Posters on site | BG3.14

Unexpected relations between temporal resilience indicators and trend breakpoints in a dryland catchment 

Mariano Moreno de las Heras, Willem Grootoonk, Arie Staal, Alexandre Génin, Angelique Vermeer, and Ángeles G. Mayor

In this study, we compare two common frameworks to assess ecosystem resilience by looking at temporal changes. One framework is based on the slowing down in the rate of ecosystem recovery from small disturbances, which implies a loss in resilience signalled by higher temporal correlation and variance. The other method applies time-series segmentation to detect breaks in the trend component of the time series, which are interpreted as (positive or negative) shifts in ecosystem functioning. Using remote-sensing vegetation greenness time series for a dryland catchment and a period including a severe drought, we hypothesised that an increased temporal correlation and variance, representing resilience loss, preceded negative drought breakpoints and vice versa. We however found more support for the opposite. Catchment areas responding with the most frequent positive breakpoint to drought (positive reversal) showed higher temporal correlation and variance than areas with the most frequent negative drought breakpoint (interrupted decrease). Further, the lowest temporal correlation and variance were observed in areas with a positive breakpoint in response to drought or without a significant trend in greenness. These results question the robustness of the indicatory potential of temporal early warnings and highlight the need for studies cross-validating resilience indicators.

How to cite: Moreno de las Heras, M., Grootoonk, W., Staal, A., Génin, A., Vermeer, A., and G. Mayor, Á.: Unexpected relations between temporal resilience indicators and trend breakpoints in a dryland catchment, EGU General Assembly 2026, Vienna, Austria, 3–8 May 2026, EGU26-19005, https://doi.org/10.5194/egusphere-egu26-19005, 2026.

EGU26-19744 | Orals | BG3.14

Global Destocking Trends and Their Consequences for Ecosystem Primary Productivity 

Jose Anadon, Osvaldo Sala, and Lydia Cruz-Amo

Grazing by livestock is the most extensive land use on Earth, covering nearly 40% of the terrestrial surface, and is commonly portrayed as a major driver of global land degradation in drylands through overgrazing. Yet, the role of grazing livestock as a driver of global environmental change remains poorly addressed in Earth-system research.

In the first part of the presentation, we synthesize emerging global evidence to document the widespread and largely overlooked process of extensive livestock destocking and discuss its implications for ecosystem functioning. We show that regions containing 42% of grazing livestock species are experiencing reductions in stocking rates, while stocking rates continue to increase in other regions. This duality of increasing and decreasing stocking rates challenges the prevailing focus on overgrazing in research and calls for a more nuanced understanding of extensive livestock systems and their role in global environmental change.

Because grazing livestock is the dominant consumer of terrestrial primary productivity, global destocking can affect biodiversity, fire regimes, carbon sequestration, and land–atmosphere fluxes at large scales. In the second part, we present a regional case study from peninsular Spain showing that recent changes in extensive stocking rates have modulated both greening and browning patterns at large scales. In the most common situation, declines in extensive livestock have produced measurable increases in ecosystem productivity. In medium-to-highly destocked rangelands, destocking accounts for approximately 6% of the observed increase in net primary productivity over the last two decades.

Together, these findings demonstrate that extensive destocking is a relevant and underappreciated land-use driver of global change in drylands and highlight the need to rethink research and policy priorities around global grazing systems.

How to cite: Anadon, J., Sala, O., and Cruz-Amo, L.: Global Destocking Trends and Their Consequences for Ecosystem Primary Productivity, EGU General Assembly 2026, Vienna, Austria, 3–8 May 2026, EGU26-19744, https://doi.org/10.5194/egusphere-egu26-19744, 2026.

EGU26-20848 | Orals | BG3.14

Carbon and water dynamics in contrasting East African drylands: implications for ecosystem function and resilience 

Sonja Leitner, Vincent Odongo, Thomas Dowling, Ilona Gluecks, Marcin Jackowicz-Korczynski, Janne Rinne, Martin Wooster, and Lutz Merbold

Dryland ecosystems play a pivotal role in terrestrial biogeochemical cycles and are highly sensitive to climate variability and land-use change. In this study, we investigate coupled carbon (C) and water flux dynamics in two distinct East African dryland systems—a savanna rangeland supporting mixed livestock and wildlife grazing, and a rainfed cropland under minimal tillage—over 185 days encompassing variable moisture conditions.

Although cumulative C emissions were of similar magnitude in both systems, they exhibited markedly different temporal dynamics. The rangeland displayed highly pulsed C exchange patterns, with rapid shifts from net ecosystem C loss to uptake following rainfall events, underscoring the strong influence of precipitation pulses on dryland carbon cycling. In contrast, the cropland functioned as a net C sink during the peak growing season; however, inclusion of lateral C exports via chickpea harvest revealed an overall C source at the ecosystem scale over the observation period. These findings emphasize the need to account for non-vertical C fluxes when assessing land-use impacts in drylands.

We observed higher carbon use efficiency (CUE) in the cropland, linked to effective allocation of assimilated C to biomass facilitated by agronomic inputs and conservation tillage. Peak-season water use efficiency (WUE) was also elevated in the cropland, reflecting optimized management under sufficient soil moisture; yet when averaged across the full period, rangeland WUE exceeded that of the cropland, likely due to persistent vegetation cover and drought-adapted plant traits that promote conservative water use. Notably, the cropland exhibited a complex interplay between WUE and CUE, wherein gains in productivity were accompanied by increased respiration, illustrating nonlinear responses of dryland systems to management and environmental drivers.

Both ecosystems were co-limited by water and nitrogen, and plant physiological adaptations to dry spells—such as maintenance of photosynthesis under moisture stress—were key to sustaining CUE. Our results contribute to improved process-level understanding of carbon–water interactions, pulse-driven variability, and resilience in dryland biogeochemical cycles. They highlight the importance of integrating temporal variability, lateral fluxes, and land-use intensity into dryland carbon and water budget assessments under global change.

How to cite: Leitner, S., Odongo, V., Dowling, T., Gluecks, I., Jackowicz-Korczynski, M., Rinne, J., Wooster, M., and Merbold, L.: Carbon and water dynamics in contrasting East African drylands: implications for ecosystem function and resilience, EGU General Assembly 2026, Vienna, Austria, 3–8 May 2026, EGU26-20848, https://doi.org/10.5194/egusphere-egu26-20848, 2026.

Change detection in vegetation index time series can identify abrupt responses to disturbances and assess ecosystem stability. Breakpoints in vegetation greening trends are being used for this purpose, with more breakpoints indicating lower resistance. However, breakpoints can be positive or negative, reflecting improving or degrading trends. Therefore, areas with similar breakpoint counts may differ in stability depending on the balance of positive and negative changes. This study investigates how incorporating breakpoint sign improves the assessment of vegetation dynamics and develops an improved typology based on the sign and significance of trend slopes before and after breakpoints. We applied the new breakpoint typology to 35 years of Landsat NDVI data from a pastoral catchment in Morocco’s High Atlas. We derived the total, positive and negative number of breakpoints in NDVI trends accumulated during the study period and the type of breakpoint in response to the most severe drought within that period. Regions with smaller NDVI changes over time exhibited a higher number of breakpoints with a similar share of positive and negative, compared to areas with stronger greening/ browning, which a higher share of positive/negative breakpoint. During the drought, positive breakpoints (positive reversals) were most common, followed by negative breakpoints (interrupted decreases). Areas with positive reversals experienced fewer total breakpoints over the study period and had a greater share of positive breakpoints than areas with interrupted decreases.  These findings highlight the importance of analysing the balance of positive and negative breakpoints alongside their total count for understanding ecological change.

How to cite: G. Mayor, Á., Vermeer, A., and Foerster, S.: New ecological change indicators using breakpoints in vegetation trends applied to a dryland catchment in Morocco’s High Atlas, EGU General Assembly 2026, Vienna, Austria, 3–8 May 2026, EGU26-20942, https://doi.org/10.5194/egusphere-egu26-20942, 2026.

EGU26-21424 | Posters on site | BG3.14

Vegetation and Soil Drivers of Depth-Resolved Soil Carbon Stocks in U.S. Drylands  

Johny Arteaga, William K. Smith, Sasha Reed, Travis W. Nauman, Michael C. Duniway, and Brooke B. Osborne

Drylands cover more than 41% of the Earth’s terrestrial surface and provide ecosystem services to approximately 2 to 2.5 billion people. Drylands store roughly 30% of the world’s soil organic carbon (C) and exhibit high spatiotemporal variability in biogeochemical cycling, making them a critical component for accurately quantifying terrestrial carbon and nitrogen budgets. This, in turn, requires an improved understanding of the underlying biogeochemical processes. One key challenge in advancing our understanding of dryland carbon cycling is capturing processes occurring in both surface and subsurface soils. Empirical studies have provided valuable insights into how climate, vegetation, and land management shape the distribution of surface SOC, but few have explored the importance of these drivers in explaining deep SOC across diverse dryland systems. 

Here, we leverage the Rapid Carbon Assessment (RaCA), a USDA-NRCS initiative launched in 2010 to quantify SOC stocks by genetic horizon to 100 cm depth across the conterminous United States, including more than 2,400 dryland sites spanning multiple land use/land cover (LULC) types, including Rangelands (shrublands and grasslands) and Forest (deciduous, evergreen, and mixed forests). Using a multi-objective Random Forest model to predict SOC stocks at 0–5 cm, 5–15 cm, 15–30 cm, 30–60 cm, and 60–100 cm depths, we examine the role of vegetation in explaining SOC distribution with depth, including metrics such as NDVI, net primary productivity (NPP), and plant functional cover derived from the Rangeland Analysis Platform. We additionally assess the influence of climate (e.g., aridity index) and soil properties, including texture, pH, rock fragment content, calcium carbonate concentration, and sodium adsorption ratio, obtained from the Soil Survey Geographic Database and complementary data-driven products. 

Model performance decreases with depth, with Rangelands sites performing better in the topsoil layers (R2 = 0.45, RMSE = 8.8) than Forest sites (R2 = 0.28, RMSE = 11.56). In forest systems, the highest performance was observed in the 0–5 cm layer (R² = 0.38). In contrast, rangeland systems showed their highest model performance at the 5–15 cm (R² = 0.53) and 15–30 cm (R² = 0.46) intervals, evidence of the strong link between aboveground and belowground plant production on Rangeland systems. Accumulated Local Effects (ALE) and Shapley Additive Explanations (SHAP) were used to characterize the functional form and relative contribution of individual predictors learned by the model across land-cover types and soil depths. In Rangelands, SOC predictions increase monotonically with increasing aridity and net primary productivity (NPP), whereas Forest systems exhibit saturation at high values of these predictors. This contrast highlights that the non-saturating vegetation response to water availability in dryland rangelands, and the saturation of forest productivity under high precipitation regimes, are also reflected in modeled SOC stocks. 

Addressing these questions will advance understanding of dryland biogeochemical processes and support more accurate representation of these systems in terrestrial biosphere models. 

How to cite: Arteaga, J., K. Smith, W., Reed, S., W. Nauman, T., C. Duniway, M., and B. Osborne, B.: Vegetation and Soil Drivers of Depth-Resolved Soil Carbon Stocks in U.S. Drylands , EGU General Assembly 2026, Vienna, Austria, 3–8 May 2026, EGU26-21424, https://doi.org/10.5194/egusphere-egu26-21424, 2026.

EGU26-22009 | Posters on site | BG3.14

A spectral library of native Caatinga vegetation to improve species discrimination and ecosystem monitoring in tropical dry forest 

Magna Moura, Cloves Vilas Boas dos Santos, Diana Signor, Herica Fernanda de Sousa Carvalho, Josicleda Domiciano Galvíncio, Mário Marcos do Espírito Santo, and Patricia Morellato

The Caatinga biome is part of the seasonally tropical dry forest system and represents a unique Brazilian biome due to its distinctive functional adaptations to extreme climatic conditions. In this semi-arid environment, rainfall is a primary driven to control plant functioning, influencing phenology and biomass production. Reflectance spectroscopy provides continuous measurements across a broad range of the electromagnetic spectrum and captures integrated signals related to leaf structural, biochemical, and physiological properties, as well as environmental conditions, making it a powerful tool for vegetation characterization and ecosystem monitoring. Within a hyperspectral framework, this study aims to develop a spectral library of native Caatinga species to support applications in ecology, remote sensing, conservation, restoration, and climate change research. The study was conducted in a 600 ha area of well-preserved native Caatinga in Petrolina, northeastern Brazil (09°52′32″ S, 40°05′10″ W), characterized by a BSWh’ semi-arid climate with a mean annual temperature of approximately 26 °C and an average annual precipitation of 498.5 mm. Leaf-level spectral reflectance (350–2500 nm) was measured for 13 dominant native shrub and tree species using a portable ASD FieldSpec®3 spectroradiometer. Measurements were performed on healthy, fully developed leaves using a leaf clip with an internal halogen light source. Field campaigns conducted over three years captured both rainy and dry-season conditions under maintained foliation. Distinct spectral responses were observed in specific wavelength regions, although overall patterns were broadly similar across most species, reflecting measurements on the healthiest leaves. Notable interspecific differences were detected in the visible region (450–650 nm), particularly for Croton conduplicatus, Handroanthus spongiosus, Sapium glandulosum, Schinopsis brasiliensis, Senegalia piauhiensis, and Spondias tuberosa, with reflectance peaks shifting from green toward red, indicative of leaf senescence. Seasonal contrasts were also evident, with changes in reflectance peaks across the visible spectrum between rainy and dry conditions. This study establishes a comprehensive spectral dataset of dominant native Caatinga species across seasonal and hydrological gradients, providing a robust foundation for linking leaf-level spectral variability to environmental conditions. The resulting spectral library represents a critical contribution for improving species discrimination, ecological monitoring, and hyperspectral remote sensing applications in tropical dry forests, particularly within one of the most climatically vulnerable and understudied biomes in the world.

Keywords: Caatinga, Hyperspectral reflectance, Leaf traits, Species discrimination

Acknowlegments: The authors thanks to the financial support from the São Paulo Research Foundation (FAPESP) Grant #2022/07735-5, the Pernambuco State Research Support Foundation (FACEPE) (Grant # BFP-0103-5.01/23), the National Council for Scientific and Technological Development (CNPq) (Grant #403692/2024-5), and the Brazilian Agricultural Research Corporation (EMBRAPA) (Grants #10.23.00.111.00.00 and 10.25.00.144.00.00).

How to cite: Moura, M., Santos, C. V. B. D., Signor, D., Carvalho, H. F. D. S., Galvíncio, J. D., Santo, M. M. D. E., and Morellato, P.: A spectral library of native Caatinga vegetation to improve species discrimination and ecosystem monitoring in tropical dry forest, EGU General Assembly 2026, Vienna, Austria, 3–8 May 2026, EGU26-22009, https://doi.org/10.5194/egusphere-egu26-22009, 2026.

EGU26-22064 | Posters on site | BG3.14

Risk Assessment of Transboundary Locust Habitat Distribution and Migration Pathways in Kazakhstan and Xinjiang, China 

Xiaoyu Guo, Jianghua Zheng, Feifei Zhang, Xuan Li, and Liang Liu

Cross-border migration of Calliptamus italicus (C. italicus) and Locusta migratoria migratoria (L. migratoria migratoria) threatens agricultural security along the China-Kazakhstan border, yet their migration pathways remain poorly understood. This study integrates geospatial techniques (optimized Maximum Entropy (MaxEnt) and weighted overlay analysis) with multi-source habitat variables (climate, soil, vegetation) to map current and future habitat suitability and migration pathways. Future climate projections were generated using Globle climate models. Key findings: (1) The MaxEnt model achieved robust performance marked with goodlooking values of AUC and TSS, with precipitation seasonality, isothermality, and elevation as dominant drivers. (2) Projections indicate climate change will expand overall suitable habitats for both Italian and L. migratoria migratoria, moderate-high suitability areas in Asian locusts and low-moderate zones in C. italicus will progressively shrink under future climates. (3) Priority migration pathways were identified for L. migratoria migratoria and C. italicus respectively, concentrated along the Irtysh/Ili Rivers, Balkhash/Alakol Lakes, and Tianshan northern slopes. (4) Future scenarios predict corridor shortening and southward shifts, with SSP585 intensifying L. migratoria migratoria habitat fragmentation. Spatial overlap occurs in Irtysh River and Alakol Lake regions, highlighting cross-border monitoring priorities. These results provide geospatial evidence for optimizing early-warning systems and transboundary pest management strategies under climate change scenarios.

How to cite: Guo, X., Zheng, J., Zhang, F., Li, X., and Liu, L.: Risk Assessment of Transboundary Locust Habitat Distribution and Migration Pathways in Kazakhstan and Xinjiang, China, EGU General Assembly 2026, Vienna, Austria, 3–8 May 2026, EGU26-22064, https://doi.org/10.5194/egusphere-egu26-22064, 2026.

EGU26-22946 | ECS | Posters on site | BG3.14

Remote Sensing Indicators of Green Water in Mediterranean Croplands, Forests, and Agroforestry Systems: A Multi-Year Study from Tunisia 

Nikolaus Fröhlich, Mengistie Kindu, Issam Touhami, Ali Khorchani, and Annette Menzel

The plant-water-atmosphere interaction is partly acknowledged as “Green Water” (GW) in the planetary boundaries concept (Wang-Erlandsson et al. 2022). There, the soil moisture in the root-zone is estimated with global models and assumptions about the root depth, plant cover, drought indices and other low-resolution proxies. This study aims to evaluate Green Water with remote sensing data from Sentinel-2 by combining the Normalized Difference Moisture Index (NDMI), vegetation indices, drought indices and detailed information about the LULC down to the species level.

The study’s focus is on seasonal characteristics like moisture retention in the dry season, recovery/water uptake after rainfall and stand vulnerability to drought events. The moisture index (NDMI) and Soil adjusted Vegetation Index (SAVI) will show these seasonal differences of GW and plant health on the aridity gradient in Tunisia.

We expect that

  • there are differences in water retention capacities between the land cover types (agriculture – agroforestry – forest plantations)
  • species (olive and carob in agroforestry, eucalyptus and pine in forests) show different water retention capabilities and vigor in the dry season.
  • these differences will lead to unequal microclimatic effects like surface temperature and latent heat flux.

The results can be used to estimate other ecosystem services related to GW and living plant matter as well as the improvement of model inputs to go beyond mere plant functional types.

How to cite: Fröhlich, N., Kindu, M., Touhami, I., Khorchani, A., and Menzel, A.: Remote Sensing Indicators of Green Water in Mediterranean Croplands, Forests, and Agroforestry Systems: A Multi-Year Study from Tunisia, EGU General Assembly 2026, Vienna, Austria, 3–8 May 2026, EGU26-22946, https://doi.org/10.5194/egusphere-egu26-22946, 2026.

EGU26-2469 | ECS | Orals | BG3.15

Radiocarbon and Stable Isotopic Signatures Reveal Accelerated Carbon Cycling in a Boreal Peatland Subjected to Warming and Elevated CO2 

Alexandra Hedgpeth, Karis Mcfarlane, Gavin McNicol, and Paul Hanson

Natural wetlands account for approximately one-third of global methane (CH₄) emissions, while northern peatlands store more than 20% of terrestrial carbon. Environmental change has the potential to enhance microbial decomposition of peat, mobilizing long-stored carbon as CO₂ or CH₄. However, predicting future peatland trace gas fluxes remains challenging due to limited mechanistic understanding and a lack of long-term, ecosystem-scale experimental data for model evaluation. The Spruce and Peatland Responses Under Changing Environments (SPRUCE) experiment addresses this gap by providing a rare, whole-ecosystem manipulation of warming and elevated CO₂ in an ombrotrophic forested bog in northern Minnesota.
Here, we measured radiocarbon (¹⁴C) and stable carbon (¹³C) isotopic signatures of surface-emitted CH₄ and CO₂ at the onset of experimental treatments and after five and seven years of combined warming and elevated CO₂. Across treatments, CH₄ emissions were on average approximately a decade older than co-emitted CO₂, indicating differences in carbon source age and processing between the two gases. Despite this age offset, surface carbon fluxes were dominated by recently fixed photosynthates rather than older peat-derived carbon. This finding is consistent with previous work at SPRUCE demonstrating rapid incorporation of newly fixed carbon into dissolved organic carbon pools throughout the peat profile.
In plots exposed to elevated CO₂, isotopic signatures of both ¹⁴C and ¹³C in chamber air were depleted relative to ambient conditions. Correspondingly, surface-emitted CH₄ and CO₂ from elevated CO₂ plots exhibited depleted isotopic values compared to non-elevated plots, reflecting rapid transfer of newly assimilated carbon from vegetation to atmospheric fluxes. Peat sampled four years after the initiation of elevated CO₂ treatments also showed depletion in carbon isotopic values within shallow peat layers relative to ambient CO₂ plots, further supporting enhanced incorporation of recent photosynthates into near-surface peat carbon pools.
Unexpectedly, we found little evidence for increased decomposition or mobilization of older peat carbon, even under conditions that would typically favor peat degradation. Warming treatments, combined with episodically dry conditions, resulted in significant lowering of the water table and measurable loss of surface elevation over the course of the experiment. Despite these physical changes, isotopic evidence did not support substantial contributions of deep or old peat carbon to surface CO₂ or CH₄ emissions.
Together, our results indicate that elevated surface CH₄ and CO₂ fluxes observed under warming at SPRUCE are primarily fueled by rapidly cycling carbon recently fixed by bog vegetation, rather than by accelerated decomposition of long-stored peat carbon. These findings underscore the importance of hydrologic and biogeochemical interactions in regulating peatland carbon dynamics and have critical implications for interpreting experimental manipulations, improving process-based wetland models, and extrapolating peatland responses to climate change across boreal ecosystems.

How to cite: Hedgpeth, A., Mcfarlane, K., McNicol, G., and Hanson, P.: Radiocarbon and Stable Isotopic Signatures Reveal Accelerated Carbon Cycling in a Boreal Peatland Subjected to Warming and Elevated CO2, EGU General Assembly 2026, Vienna, Austria, 3–8 May 2026, EGU26-2469, https://doi.org/10.5194/egusphere-egu26-2469, 2026.

EGU26-2623 | Orals | BG3.15

Methane Flux Dynamics in a California Oak Savanna 

Kuno Kasak, Reti Ranniku, Martin Beland, Joseph Verfaillie, and Dennis Baldocchi

Methane (CH4) is a potent greenhouse gas, yet the role of trees in the global CH4 budget remains uncertain. While some studies report CH4 emissions from wetland and certain upland trees via soil-derived transport or in-tree production, others suggest that upland forests may function as net atmospheric CH4 sinks. In this study, we investigated CH4 exchange in an oak savanna in California (AmeriFlux site US-Ton) using a multi-scale measurement approach. From August 2024 till October 2025, we have conducted biweekly measurements of stem CH4 and CO2 fluxes on six mature oak trees at three heights (0.4, 1.3, and 2.6 m), alongside soil CH4 flux measurements near each tree using LI-COR 7810 analyzers and a Smart Chamber. Ecosystem-scale CO2 and CH4 fluxes were quantified using eddy covariance with open-path LI-COR 7500 and 7700 analyzers. To assess sub-canopy flux variability, an additional eddy covariance system was deployed below the canopy. Tree surface area for flux upscaling was quantified using terrestrial laser scanning. Tree stems generally acted as small CH4 sources throughout the year, whereas soils consistently functioned as minor CH4 sinks, especially in sun-exposed areas. Stem vertical stem flux profiles did not indicate a direct coupling with soil CH4 dynamics. However, during early spring flooding events, the stem bases of some trees emitted episodically large CH4 fluxes, suggesting that transport of soil-derived CH4, in addition to internal production, can contribute to stem emissions. Ecosystem-scale eddy covariance measurements showed no persistent seasonal pattern in CH4 emissions, although modest increases were observed from spring. At the annual scale, sub-canopy eddy covariance CH4 fluxes were comparable to soil chamber-based estimates, indicating that the under-canopy the soil likely functions as a small CH4 sink. In contrast, above-canopy eddy covariance measurements indicated that the ecosystem as a whole is a small net CH4 source. This discrepancy may be explained by non-microbial CH4 production from oak leaves, supported by incubation experiments and the pronounced increase in ecosystem CH4 fluxes following leaf emergence. 

How to cite: Kasak, K., Ranniku, R., Beland, M., Verfaillie, J., and Baldocchi, D.: Methane Flux Dynamics in a California Oak Savanna, EGU General Assembly 2026, Vienna, Austria, 3–8 May 2026, EGU26-2623, https://doi.org/10.5194/egusphere-egu26-2623, 2026.

EGU26-2737 | Posters on site | BG3.15

Effect of elevated atmospheric CO2 concentration on greenhouse gas exchange of common hazel trees and soils 

Katerina Machacova, Karel Klem, Tomáš Medňanský, Hannes Warlo, and Sami Ullah

Trees are known to emit and consume methane (CH4) and nitrous oxide (N2O), important greenhouse gases (GHGs). Most studies have focused on stems, whereas the role of tree leaves in forest CH4 and N2O exchange remains unknown. In recent decades, forests have been responding to changing environmental conditions, including increasing/elevated atmospheric carbon dioxide (eCO2). However, the long-term effect of eCO2 on tree CH4 and N2O exchange is almost unknown.  

We suggested that the conserved stomatal behavior under eCO2 may directly affect N2O and CH4 fluxes from leaves or stems by altering transpiration, carbon assimilation and allocation, and indirectly soil N2O and CH4 fluxes by altering soil moisture and root exudation patterns.

At the Birmingham Institute of Forest Research’s Free Air CO2 Enrichment (BIFoR-FACE) facility, we studied i) CH4, N2O and CO2 exchange from soils, and stems and shoots of mature Common Hazel (Corylus avellana), and ii) the long-term effect of eCO2 on this GHG exchange. The facility dominated by English Oak with sub-canopy hazel includes three arrays with +150 ppm CO2 enrichment above the ambient (eCO2) and three arrays under ambient CO2 (aCO2).

We measured GHG exchange from three hazel trees and three soil positions in each array and in one sunny aCO2 plot in June 2025. Hazel trees at all arrays grow under low photosynthetically active radiation (PAR). Photosynthesis and transpiration were measured in parallel to GHG fluxes at all studied trees. The gas exchange was studied using static chamber systems and portable LiCOR analysers. 

The soil was a sink for CH4 and a source for N2O and CO2. The nine years of eCO2 enrichment tended to reduce the soil CH4 uptake by 55%, and significantly increased soil N2O and CO2 emissions by 93 and 62%, respectively. The stem emissions of CH4, N2O and CO2 were not affected by eCO2. However, trees growing under sunny conditions showed significantly higher stem CO2 efflux than shaded trees. The shoots were CH4 sources irrespective of eCO2 treatment. The shoots turned from being an N2O source under aCO2 to a weak N2O sink under eCO2 (non-significant change). The leaves exposed to eCO2 showed higher CO2 assimilation and transpiration rates compared to aCO2. However, the leaves growing under sunny ambient conditions demonstrated much higher physiological activity than leaves under shaded ambient conditions. The eCO2 seems to partly compensate the low PAR intensities at arrays, and approximates the light curve to the sunny leaves.

Concluded, eCO2 seems to affect the GHG fluxes from soils rather than from hazel stems and shoots. The tree CO2 exchange tends to be more related to PAR conditions than to the atmospheric CO2 levels, mainly due to shaded conditions at arrays.  


Acknowledgement

This research was supported by the Ministry of Education, Youth and Sports of CR within programs LU-INTER-EXCELLENCE II [LUC23162] and CzeCOS [LM2023048], and project AdAgriF-Advanced methods of greenhouse gases emission reduction and sequestration in agriculture and forest landscape for climate change mitigation [CZ.02.01.01/00/22_008/0004635]. We thank Robert Grzesik and Kris Hart from BIFoR-FACE for all their field support.

How to cite: Machacova, K., Klem, K., Medňanský, T., Warlo, H., and Ullah, S.: Effect of elevated atmospheric CO2 concentration on greenhouse gas exchange of common hazel trees and soils, EGU General Assembly 2026, Vienna, Austria, 3–8 May 2026, EGU26-2737, https://doi.org/10.5194/egusphere-egu26-2737, 2026.

EGU26-4387 | ECS | Posters on site | BG3.15

Methane Exchange and Microbial Functional Potential in Forest Tree Tissues 

Krishnapriya Thiyagarasaiyar, Dhiraj Paul, Johanna kerttula, Milja Keski-Karhu, Kaido Soosaar, Ülo Mander, Katerina Machacova, Jukka Pumpanen, and Henri Siljanen

Methane (CH4) is a potent greenhouse gas, and microorganisms play a crucial role in its cycling. While soil microbial processes are well studied, the microbial basis of CH4 production and oxidation within tree tissues remains poorly understood. Trees play an active role in forest CH4 exchange, yet studies on tree-associated microbial contributions are only beginning to emerge.  In this study, we aimed to assess the abundance of CH4-cycling genes in shoots (leaves and terminal branches) and wood cores of four tree categories: European beech (Fagus sylvatica), European hornbeam (Carpinus betulus), birch (Betula pendula and Betula pubescens), and Norway spruce (Picea abies) along a transect spanning temperate to subarctic regions. We assessed CH4 exchange through shoot incubation experiments and measured internal CH4 concentrations in stem wood. Targeted metagenomic approach was used to analyze the relative abundance of CH4-cycling genes. Our study revealed that among shoots, birch, spruce and beech showed potential CH4 emissions, while hornbeam indicated potential CH4 consumption in the incubation study. Beech had the highest internal stem wood CH4 concentration, and hornbeam the lowest when compared to the ambient concentration. Metagenomic analysis confirmed the presence of key methanogen and methanotroph genes in both tissues. Soluble CH4 monooxygenase gene (mmoX) were most abundant in birch shoots and spruce shoots. In addition, CH4 exchanges showed strong positive correlation with shoot ammonia, whereas CH4 concentration on stem wood showed strong positive association with particulate CH4 monooxygenase (pmoA) and methanogen-to-methanotroph gene ratio. These findings provide new insights into tree microbiome and its contribution to CH4 exchange in forest ecosystem.

How to cite: Thiyagarasaiyar, K., Paul, D., kerttula, J., Keski-Karhu, M., Soosaar, K., Mander, Ü., Machacova, K., Pumpanen, J., and Siljanen, H.: Methane Exchange and Microbial Functional Potential in Forest Tree Tissues, EGU General Assembly 2026, Vienna, Austria, 3–8 May 2026, EGU26-4387, https://doi.org/10.5194/egusphere-egu26-4387, 2026.

EGU26-4992 | ECS | Orals | BG3.15

Impact of afforestation on GHG fluxes and related microbiome in abandoned peat extraction areas 

Fahad Ali Kazmi, Mohit Masta, Mikk Espenberg, Jaan Pärn, Sandeep Thayamkottu, and Ülo Mander

Abandoned peat extraction areas are significant hotspots of major greenhouse gas (GHG) emissions, including CO2, CH4, and N2O, compared to drained or undisturbed peatlands. These areas are subject to restoration through either rewetting or afforestation. However, the long-term successional dynamics of GHG fluxes and the underlying microbial mechanisms remain poorly understood. We present GHG flux monthly dynamics and related microbial functional gene abundances across four different-aged afforested sites in Estonia sampled from 2023 to 2025: a young plantation (YP; 1-3 yrs) of Silver birch (SB), Scots pine (SP), Norway spruce (NS), Black alder (BA), and a reference area without trees, a mid-age plantation (MP; 17 yrs) of SB, SP, NS and a reference area, an older plantation (OP-SB, 30 yrs), and a natural riparian forest (NF-BA,  ~80 yrs) on a river bank.

In YP, all tree species showed excellent growth in the first three years, particularly silver birch, which demonstrated that this species is highly suitable for the afforestation of abandoned peat extraction areas. In YP and MP plantations, soil CO2 emissions were higher in areas with trees than in the reference area without trees, which was possibly caused by additional autotrophic respiration and the addition of fresh, easily decomposable carbon from tree roots. On the temporal scale, CO2 fluxes increased significantly across YP, OP-SB, and NF-BA during the latter part of the study period, yet remained stable in MP. Methane dynamics were strongly influenced by stand age and species; the oldest forest (NF-BA) consistently acted as a CH4 sink (mean, -31.6 ± 2.7  µg C m 2 h 1), supported by the higher oxygen content in river water and the highest abundance of pmoA-containing methanotrophs. Due to intensive precipitation and increasing soil water content (SWC), the older birch plantation (OP-SB) transitioned from a minor to a major CH4 source (23.8 ± 9.61  µg C m 2 h 1), while all young plantations remained persistent sources (75.6 ± 17.1 - 85 ± 8.25 µg C m 2 h 1). This was due to the elevated water table in YP throughout the entire study period. Across all sites, CH4 fluxes negatively correlated with pmoA abundance, highlighting the critical role of aerobic methanotrophic potential in peat soils.

Nitrous oxide emissions were highest in the old alder forest (NF-BA, 13.7 ± 2  µg N m 2 h 1), followed by mid-age plantation (MP, 8.92 ± 1.14  µg N m 2 h 1), which were particularly high during freeze-thaw cycles and post-precipitation periods. Overall, N2O fluxes showed a positive correlation with SWC. In the riparian Black alder forest, N2O fluxes were negatively correlated with the C: NO3- ratio and positively linked to a high abundance of all Nitrogen-cycling functional genes and soil NO3- levels.  Random forest modeling identified total Carbon, SWC, and nirK gene proportions as the primary predictors of N2O emissions.

These findings demonstrate that while afforestation of abandoned peat extraction areas can eventually establish CH4 sinks in peatlands, the tree species and stand age significantly modulate the net radiative forcing of the restored ecosystem through altered N-cycling and microbial community structures.

How to cite: Kazmi, F. A., Masta, M., Espenberg, M., Pärn, J., Thayamkottu, S., and Mander, Ü.: Impact of afforestation on GHG fluxes and related microbiome in abandoned peat extraction areas, EGU General Assembly 2026, Vienna, Austria, 3–8 May 2026, EGU26-4992, https://doi.org/10.5194/egusphere-egu26-4992, 2026.

EGU26-5594 | Posters on site | BG3.15

Integrating leaf-level CH₄ and N₂O measurements with a field-portable photosynthesis system 

Ian Smillie, Seton Bachle, Doug Lynch, Richard Vath, and Jason Hupp

The fluxes of different greenhouse gas (GHG) species have long been studied using a variety of techniques, with the choice of method largely determined by the measurement scale. Small-scale fluxes such as soil chamber measurements may be made using closed transient approaches, whereas direct micrometeorological measurement of ecosystem-scale fluxes predominantly employs eddy covariance or related methodologies. However, methods to directly quantify plant-mediated fluxes at the leaf scale remain limited.


Increasingly, plant-mediated transport (PMT) and plant-mediated exchange (PME) are recognised as important, and in some ecosystems even dominant pathways by which some soil-produced GHGs reach the atmosphere. These processes are influenced by both biotic and abiotic factors, and physiological characteristics of the plant, such as stomatal conductance, are thought to play a significant role. However, a limited body of literature constrains our understanding of this component of GHG flux, largely due to the lack of appropriate instrumentation and methodologies to quantify these fluxes. Clipping studies have been used to remove vegetation from plots and monitor net changes in flux, but this precludes investigation of interactions between plant physiology and the GHG flux.


Plant physiological responses are typically measured in an open flow through system to minimise perturbation of physiology. Portable photosynthesis systems measure CO2 and H2O concentrations before and after interacting with the leaf. The differences between these concentrations (ΔCO2, ΔH2O) permit calculation of physiological parameters including net CO2 assimilation (A), intercellular CO2 concentration (Ci), and stomatal conductance to water vapour (gsw) while the chamber is continuously refreshed with stable air, allowing the maintenance of the leaf in a steady physiological state.

     However, the open flow-through nature of the photosynthesis system has traditionally made quantification of plant-mediated trace gas fluxes, such as CH4 and N2O, challenging. The surface area of plant material enclosed is typically small, and the relatively small changes in trace gas concentrations require a high degree of precision to resolve. Additional complexity arises from the large differences in H2O concentration before and after interaction with the leaf due to transpiration. Most systems also show a sensitivity to changing CO2 concentration, which is commonly utilised in plant physiology measurements.


Here we describe and characterise a system that integrates trace gas measurements with a commercial photosynthesis system (LI-COR LI-6800), managing water transients and integrating data from the various gas analysers, including real-time on-board flux calculations. Presented are two commercial OF-CEAS trace gas analysers, measuring CH4 and N2O (LI-COR LI-7810 and LI-7820 respectively). We examine the impact of averaging interval on measurement precision for a range of CO2 mole fractions and assess the dependence of trace gas mole fraction to changing CO2 mole fractions. We also present a sensitivity analysis for zero trace gas flux.

How to cite: Smillie, I., Bachle, S., Lynch, D., Vath, R., and Hupp, J.: Integrating leaf-level CH₄ and N₂O measurements with a field-portable photosynthesis system, EGU General Assembly 2026, Vienna, Austria, 3–8 May 2026, EGU26-5594, https://doi.org/10.5194/egusphere-egu26-5594, 2026.

EGU26-5842 | ECS | Posters on site | BG3.15

Hidden Figures: how tree species shape methane uptake in temperate forests. 

Andrea Rabbai, Alejandra Ordoñez, Josep Barba, Alec Robinson, Aidan Dryburgh, and Vincent Gauci

Methane (CH4) is a potent greenhouse gas and the second most important contributor to the Earth’s warming after carbon dioxide (CO2). Atmospheric methane concentrations have nearly tripled since pre-industrial times, exceeding 1,930 ppb in 2025, and its radiative forcing is approximately 28-30 times greater than that of CO2 over a 100-year time scale. As a result, methane is at the centre of the climate agenda, led by the Global Methane Pledge (GMP) launched at COP26. Owing to its relatively short atmospheric lifespan ranging from 7 to 12 years, methane concentration is highly sensitive to changes in the balance between its sources and sinks.

Soils have long been recognised as the primary terrestrial methane sink alongside atmospheric oxidation. However, recent observations suggest that trees growing in free-draining soils may constitute an overlooked and potentially significant methane sink. Despite its possible importance, the magnitude, drivers, and global relevance of this tree-mediated methane uptake remain poorly constrained, introducing substantial uncertainty into current methane budget estimates. This knowledge gap is particularly pronounced in temperate forests, where evidence of tree methane uptake is limited to only two tree species (Fraxinus excelsior and Acer pseudoplatanus), leaving the broader sink potential of these ecosystems largely unexplored.

Here, we present preliminary results on spatial and temporal variability of stem methane fluxes measured across multiple UK native and non-native tree species in newly planted forests under contrasting forest management approaches, including monoculture and mixed-species woodlands.  This experiment is conducted at the Norbury Park Estate, Shropshire (central England), close to the Birmingham Institute of Forest Research (BIFoR) FACE facility. These data will provide new insights into potential drivers of tree-mediated methane uptake in temperate forests and help assess the additional climate benefits of forest expansion under different planting strategies.


How to cite: Rabbai, A., Ordoñez, A., Barba, J., Robinson, A., Dryburgh, A., and Gauci, V.: Hidden Figures: how tree species shape methane uptake in temperate forests., EGU General Assembly 2026, Vienna, Austria, 3–8 May 2026, EGU26-5842, https://doi.org/10.5194/egusphere-egu26-5842, 2026.

EGU26-6055 | ECS | Orals | BG3.15

Testing vertical influences on greenhouse gases fluxes (CO2, CH4 and N2O) along tropical tree stems 

Kabi Raj Khatiwada, Ivan A. Janssens, Andreas Richter, Benjamin Runkle, Clément Stahl, and Laëtitia M. Bréchet

Our knowledge of how greenhouse gas (GHG) fluxes vary from the soil to the tree canopy is limited, particularly in upland tropical rainforests. In this case study, we show changes in the fluxes of the primary GHGs (carbon dioxide (CO₂), methane (CH₄), and nitrous oxide (N₂O)) along the soil - stem continuum, and their relationships with corresponding stem traits at different heights. To do this, we used static chambers to measure the GHG fluxes from three stems, both on the surrounding forest floor and at eight heights ranging from 0.5 m to 30 m, while also assessing tree traits at these heights. We selected representative emergent trees from a tropical forest in French Guiana, South America. We found no clear pattern in the GHG fluxes along the stems, with highly variable CO₂ emissions and alternating CH4 and N2O emissions and uptake. Regression analysis showed that stem traits related to the tree’s surface area, bark, and sapwood partly explain the measured fluxes along the stem height. For CO₂ fluxes, the best explanatory variables are identified as bark surface temperature, bark water content, and sapwood density; for CH₄ fluxes, the key drivers are tree diameter, bark water content, and bark surface temperature; and for N₂O fluxes, the more influential variables are sapwood density, and sapwood water content. We concluded that the variability in GHG fluxes along the stems was not only specific to tree traits, but also to individual trees. These findings pose a challenge for scaling efforts - it will not be trivial to create bottom-up estimates of tree-impacted fluxes, and a convergence of approaches will be needed to generate a complete GHG balance for these ecosystems.

How to cite: Khatiwada, K. R., Janssens, I. A., Richter, A., Runkle, B., Stahl, C., and Bréchet, L. M.: Testing vertical influences on greenhouse gases fluxes (CO2, CH4 and N2O) along tropical tree stems, EGU General Assembly 2026, Vienna, Austria, 3–8 May 2026, EGU26-6055, https://doi.org/10.5194/egusphere-egu26-6055, 2026.

EGU26-8335 | ECS | Posters on site | BG3.15

Long-Term Nitrogen Addition Reshapes Methane and Nitrous Oxide Fluxes and Microbial Functional Potential in European Beech Forest Soil 

Thomas Schindler, Carme Lopez-Sanchez, Stefania Mattana, Hannes Warlo, Rosella Guerrieri, Angela Ribas, and Katerina Machacova

European beech (Fagus sylvatica L.) is a both native and extensively cultivated species found in Central and Southeast Europe's upland forests. These beech forests soils are known to emit nitrous oxide (N₂O), sequester methane (CH₄), and release carbon dioxide (CO₂), individually influenced by specific site conditions. The interplay of nitrogen (N) and carbon cycling, along with greenhouse gas (GHG) turnover in these forests, is affected by N deposition, but the long-term effects of N-deposition on GHG exchange involving soil and mature trees are not well understood.

We examined how simulated increased N-deposition affects GHG emissions and soil N-composition in a pre-alpine eutrophic beech forest in Northeastern Italy, subjected to high N-addition. Since 2015, the site has undergone N-manipulation involving four treatments with three replicates: control (N0, ambient N-deposition), above canopy N-addition (N30A, 30 kg/ha*yr N), and soil N-addition at 30 and 60 kg/ha*yr, respectively (N30 and N60). For this study, one plot for each treatment was considered. In September 2023, we measured N₂O, CH₄, and CO₂ fluxes from stems and accompanying soil, and analyzed soil samples for biological and physico-chemical properties.

Beech stems acted as net CH₄ sinks and CO₂ sources, with limited N₂O exchange, unaffected by nine years of artificial N-treatment. Similarly, soil CO₂ emissions remained unchanged, but soil CH₄ uptake increased by 40% in N30 and N60 plots. Conversely, N-treated plots showed significantly lower soil N₂O emissions than controls (nearly 50-fold difference). High flux variability suggests that the observed effects cannot be solely ascribed to N-treatment, likely due to the influence of complex micro-topography.

Soil analyses revealed that N-addition strongly affected soil chemistry, and microbial functional diversity. Control plots maintained higher concentrations of nitrate, nitrite, and total dissolved inorganic nitrogen, indicating enhanced N-consumption or transformation rates under elevated inputs. The N-addition reorganized the microbial community, marked by increased richness and evenness and a shift towards reductive processes, confirmed by the enrichment of genes associated with assimilatory and dissimilatory nitrate reduction and denitrification. Furthermore, carbon cycle responses included increased methanotrophic capacity in N60, evidenced by pmoA gene enrichment, while this effect was absent in canopy-applied treatments.

Overall, while long-term N-addition did not significantly alter GHG stem fluxes, it facilitated greater soil CH₄ uptake through increased microbial methane oxidation capacities and caused substantial restructuring of microbial communities with increased N-reduction potential.

This research was supported by the Ministry of Education, Youth and Sports of CR within the programs LU-INTER-EXCELLENCE II [LUC23162] and CzeCOS [LM2023048], project AdAgriF-Advanced methods of greenhouse gases emission reduction and sequestration in agriculture and forest landscape for climate change mitigation [CZ.02.01.01/00/22_008/0004635], and by the Spanish Government grants PID2024-162617NB-I00 funded by MCIN, AEI/10.13039/ 501100011033 EU Next Generation EU/PRTR

How to cite: Schindler, T., Lopez-Sanchez, C., Mattana, S., Warlo, H., Guerrieri, R., Ribas, A., and Machacova, K.: Long-Term Nitrogen Addition Reshapes Methane and Nitrous Oxide Fluxes and Microbial Functional Potential in European Beech Forest Soil, EGU General Assembly 2026, Vienna, Austria, 3–8 May 2026, EGU26-8335, https://doi.org/10.5194/egusphere-egu26-8335, 2026.

EGU26-8685 | ECS | Posters on site | BG3.15

Multi-pathway methane and nitrous oxide emissions from Acacia plantations on tropical peatlands 

Steven Gunawan, Nurholis Nurholis, Nardi Nardi, Ari Putra Susanto, Suci Ramadhanti, Safira Dyah Kusumawardhani, Rico Wenadi, Aquilla Garry Andrean Samosir, Kevin Yap Jurgen, Pitri Rohayani, Abdul Jabbar, Nurul Pertiwi, Sofyan Kurnianto, Vincent Gauci, Josep Barba, Fahmuddin Agus, and Chandra Shekhar Deshmukh

Tropical ecosystems are major contributors to global methane (CH₄) emissions, yet substantial uncertainties remain in both top-down and bottom-up estimates. Such uncertainties partly can be attributed to limited understanding of various emissions and uptake pathways in tropical ecosystem. Most field measurement of CH4 focused solely on soil-atmosphere exchange, overlooking other exchange pathways. Furthermore, several studies from natural forest ecosystem confirmed significant CH4 emission from tree stems. However, such quantification remains scarce in tropical forest plantations, which constitute significant proportion of current land use. A better quantitative and process-based understanding of CH4 emissions, removals, and transport pathways is therefore essential for improving regional and global CH4 budgets and mitigation strategies, especially under changing climate and land use.

In this study, we measured soil and stem CH4 fluxes from two managed plantation forests (Acacia and Eucalyptus plantations) and two natural forests ecosystem (peat swamp forests and riparian forests) in Sumatra, Indonesia. We used LI-8200-01S (LICOR, USA) for soil and semi-rigid chambers made with polyethylene terephthalate (PET) plastic sheets for stem measurements. We used LI-7810 (LICOR, USA), connected to the chambers during the measurement period to measure the CH4 concentration. The fluxes were calculated using a linear function of changes in CH4 concentration during incubation time.

The preliminary result shows that plantation emits significantly smaller CH4 from both soil and stem compared to respective natural forested ecosystems, indicating that land-use change substantially alter the methane production, consumption, and transport processes. We observed a clear decreasing stem CH4 fluxes with increasing stem height in both ecosystems on peat, strongly suggest a soil-originated CH4 transport mechanism. Interestingly, no significant difference between stem height was detected in Eucalyptus plantations and adjacent riparian forests. Tree stems acted as net CH4 sources across all ecosystems. Soil surfaces functioned as CH4 sources in peatland ecosystems but as net CH4 sinks in Eucalyptus plantations and adjacent riparian forests. These results demonstrate strong contrasts in soil–stem CH4 dynamics between peatland and non-peatland ecosystems in tropics. Comprehensive, pathway-specific assessments are therefore required to reduce uncertainties in tropical CH4 budgets.

How to cite: Gunawan, S., Nurholis, N., Nardi, N., Susanto, A. P., Ramadhanti, S., Kusumawardhani, S. D., Wenadi, R., Samosir, A. G. A., Jurgen, K. Y., Rohayani, P., Jabbar, A., Pertiwi, N., Kurnianto, S., Gauci, V., Barba, J., Agus, F., and Deshmukh, C. S.: Multi-pathway methane and nitrous oxide emissions from Acacia plantations on tropical peatlands, EGU General Assembly 2026, Vienna, Austria, 3–8 May 2026, EGU26-8685, https://doi.org/10.5194/egusphere-egu26-8685, 2026.

EGU26-10870 | ECS | Posters on site | BG3.15

Fire-driven shifts in nitrous oxide emissions in boreal peatland soils  

Saana Hakkola, Jonna Teikari, Mika Korkiakoski, Mari Pihlatie, Tatu Polvinen, and Heidi Aaltonen

In parts of the northern boreal zone, a significant number of peatlands have previously been drained for forestry. Climate change is increasing the frequency of forest fires, making these peatland forests particularly vulnerable to wildfires due to thick organic layers and low water table levels. Peatlands store approximately 10% of global soil nitrogen (N) and peatland forests in particular may act as a source of nitrous oxide (N2O), which is a potent greenhouse gas contributing to ozone depletion. Although forest fires affect several factors influencing soil N dynamics, very little is known about the impact of wildfires on the N cycle and N2O emissions on burned peatland sites. We investigated these impacts with a peat column experiment by simulating forest fire conditions with controlled burning. 

We collected peat profiles up to 50 cm depth from three different undrained and drained peatland sites in Southern Finland in May 2025 (n=50). Peat columns were incubated outdoors for three months, and half of the columns were scorched in mid-summer with a gas torch to simulate a surface fire. During the experiment period, N2O, carbon dioxide (CO2), and methane (CH4) were measured weekly. After three months, incubated columns were dissected, and peat samples were collected to analyze soil physicochemical parameters, microbial community structure, and the quality of soil organic matter.  

Preliminary results suggest that nutrient-rich peatland forests act as N2O sources under favorable conditions for N2O production, while nutrient-poor sites are negligible as N2O sources. The fire appeared to shift these patterns and temporarily increase N2O emissions across peatland types. Further analyses will evaluate how post-fire changes in different peat N pools relate to observed N₂O flux dynamics. 

How to cite: Hakkola, S., Teikari, J., Korkiakoski, M., Pihlatie, M., Polvinen, T., and Aaltonen, H.: Fire-driven shifts in nitrous oxide emissions in boreal peatland soils , EGU General Assembly 2026, Vienna, Austria, 3–8 May 2026, EGU26-10870, https://doi.org/10.5194/egusphere-egu26-10870, 2026.

EGU26-13079 | ECS | Posters on site | BG3.15

Constraining temporal and spatial variations of methane flux in a temperate wet woodland  

Stephanie Batten, Gary Egan, Mark Lee, Rebecca Fisher, Alice Milner, Phil Wilkes, Scott Davidson, and David Lowry

Atmospheric methane (CH4) concentrations are rising globally, and evidence suggests natural sources may be responsible. Forests represent the largest terrestrial sink in the global CH4 budget, however CH4 emissions from certain forest ecosystems – wet woodlands (i.e. forested wetlands) – remain poorly constrained. Due to their hydrology, the anoxic soils in wet woodlands provide suitable conditions for methanogenesis. Little is known about the spatial or temporal patterns of CH4 flux in these ecosystems, and the environmental variables that drive these, due to insufficient understanding of biogeochemical mechanisms and limited observations.

To address this, we used hourly-resolved automatic chambers, complimented by a greater expanse of monthly manual chambers to compare CH4 and carbon dioxide (CO2) flux to soil parameters in a temperate wet woodland (Wakehurst, Sussex, UK). From observations over two years, we show that soil temperature is the dominant control of CH4 flux from the wet woodland soil once within high soil moisture (>40%) or water table depth (WTD) (< 0.2m); at lower moisture, changes in WTD and moisture determine CH4 flux. Large seasonal variations were present, where CH4 emissions peaked in summer months (44.05 ±1.15 nmolm-2s-1 (mean)), and reduced in winter (7.54 ± 0.078 nmolm-2s-1 (mean)), with measurements in drier soil moving from source to sink. A diurnal cycle in CH4 flux positively correlated with soil temperature was revealed, with diurnal and seasonal variation comparable in magnitude, highlighting the importance of high temporal resolution flux measurements. Diurnal cycles changed significantly on the hottest days (>90th percentile soil temperature), with diurnal amplitudes of CH4 higher (~100 ppb) than the general trend (~20 ppb).

The large spatial, seasonal and diurnal variability in methane flux we report are significant for quantifying and understanding CH4 emissions from these small fragmented forest ecosystems, which are currently highly uncertain or missing in model estimates. The relationship to soil temperature suggests rising summer temperatures may lead to an increase in summer CH4 emissions in future climate scenarios, and highlights the importance of constraining and understanding this ecosystem within the global CH4 budget.

How to cite: Batten, S., Egan, G., Lee, M., Fisher, R., Milner, A., Wilkes, P., Davidson, S., and Lowry, D.: Constraining temporal and spatial variations of methane flux in a temperate wet woodland , EGU General Assembly 2026, Vienna, Austria, 3–8 May 2026, EGU26-13079, https://doi.org/10.5194/egusphere-egu26-13079, 2026.

EGU26-16812 | ECS | Orals | BG3.15

Interactive effects of soil moisture and temperature on methane uptake and microbial community dynamics in an upland forest soil 

Jana Täumer, Olivia Schaffer, Axel Kitte, and Susanne Liebner

Aerated soils, especially forest soils, are a sink for atmospheric methane, oxidizing an average of 30 to 40 Tg (bottom-up and top-down estimates) of this powerful greenhouse gas each year. Methane-oxidizing microorganisms, i.e., methanotrophs, mediate this methane sink. Soil methane uptake (SMU) depends primarily on environmental factors, such as soil water content and temperature. Climate change is expected to alter these soil properties, affecting SMU, but more research is needed to understand how SMU will respond to combined changes in temperature and precipitation.

To investigate how soil water content and temperature interact to regulate SMU and methanotroph abundance, we established a rain exclusion experiment in an upland forest soil on the Telegrafenberg campus, Potsdam (Germany), and began monitoring SMU and microbial community composition and abundance at the 0-10 cm soil depth. Soil methane uptake is measured biweekly using a chamber-based method, while microbial abundances are assessed monthly by qPCR (pmoA, mcrA, and 16S rRNA gene) and 16S rRNA gene sequencing. Additionally, we measured methane uptake and microbial gene abundances of soil samples from the same location in controlled laboratory incubations at varying water contents and temperatures.

The incubation experiment revealed that SMU was highest at 35% and 65% of the maximum water-holding capacity. The incubations with 100 and 130% WHC even switched to methane production. The community composition shifted along the moisture gradient and differed significantly across water levels. Regarding the methane-cycling community, there was an increase in Methylocystis, Methanobacteria and Methanocella, and in the high-water content treatments. The community composition of methanotrophs was dominated by Methylocapsa and Methylocella. The differences in methane uptake were accompanied by differences in the abundances of microbial genes (mcrA and pmoA). So far, all forest plots show high methane uptake, and the methanotroph community is dominated by type II methanotrophs. Our research will provide valuable insights into how climate change may impact SMU and the associated microbial community in upland forest soils.

How to cite: Täumer, J., Schaffer, O., Kitte, A., and Liebner, S.: Interactive effects of soil moisture and temperature on methane uptake and microbial community dynamics in an upland forest soil, EGU General Assembly 2026, Vienna, Austria, 3–8 May 2026, EGU26-16812, https://doi.org/10.5194/egusphere-egu26-16812, 2026.

EGU26-16952 | Orals | BG3.15

Persistent and increasing forest floor methane consumption in a boreal mineral-soil pine forest over seasons and years 

Markku Koskinen, Tatu Polvinen, Anuliina Putkinen, Elisa Vainio, Kira Ryhti-Laine, Sirpa Rantanen, Matti Loponen, Pauliina Schiestl-Aalto, Pasi Kolari, Henri Siljanen, and Mari Pihlatie

Mineral soil forest floors often act as net methane (CH4) sinks. The contribution of the different components of the forest floor, such as soil, shrubs, mosses and their roots and the roots of trees, to the sink and the factors affecting their contribution are not well known. Predicting the CH4 flux dynamics of forests requires understanding the component fluxes and drivers, such as microbial population, soil moisture and temperature, and composition and coverage of the forest floor vegetation.

The CH4 exchange of the forest floor at the SMEAR II experimental forest in central Finland (Hari & Kulmala, 2005) was monitored using manual and automated chambers for a total of more than 10 years (2006-2016 manually, 2021-mid 2023 and mid 2025 onwards automatically). In addition, a manipulation experiment was conducted using manual chambers where either tree, shrub or mycorrhizal roots were excluded by trenching. Also, the effect of above ground vegetation (shrubs, mosses) on CH4 flux dynamics was studied. The humus and soil layers next to the automated chambers were inspected for presence of methanotrophs.

We found that the forest floor is a persistent sink for CH4 through the year, CH4 being consumed even during winter on all measurement plots. The general trend in the long-term measurements was towards a larger sink during growing season. Increasing soil temperature increased the sink during the growing season, while soil moisture decreased it. During growing season, a diurnal pattern was observed where higher CH4 consumption occurred during night time.

In the trenching experiment the exclusion of tree, shrub or mycorrhizal roots did not affect soil CH4 uptake, however, the cutting all above ground vegetation increase CH4 uptake compared to presence of normal vegetation (shrubs and mosses). Based on the probe-targeted metagenomic sequencing, methanotrophic bacteria within the organic and mineral soil layers consisted mainly of alphaproteobacterial high-affinity oxidizers, including taxa potentially adapted to oxygen-limited conditions.

Hari, P., & Kulmala, M. (2005). Station for Measuring Ecosystem-Atmosphere Relations (SMEAR II). Boreal Environment Research, 10(5), 315-322.

How to cite: Koskinen, M., Polvinen, T., Putkinen, A., Vainio, E., Ryhti-Laine, K., Rantanen, S., Loponen, M., Schiestl-Aalto, P., Kolari, P., Siljanen, H., and Pihlatie, M.: Persistent and increasing forest floor methane consumption in a boreal mineral-soil pine forest over seasons and years, EGU General Assembly 2026, Vienna, Austria, 3–8 May 2026, EGU26-16952, https://doi.org/10.5194/egusphere-egu26-16952, 2026.

EGU26-17309 * | Orals | BG3.15 | Highlight

The Global Methane Budget: the knowns and unknowns 

Marielle Saunois

After carbon dioxide, atmospheric methane is the second most impactful anthropogenic greenhouse gas for global warming. Observations of atmospheric methane in ambient air began in 1978, and now include a wide range of in-situ and remote-sensed observations from the surface, aircraft or from space. Those observations have shown that methane mixing ratio have been multiplied by 2.6 since pr-industrial time and the recent period has experienced record methane growth rate in the atmosphere. This is a well-known and established fact. Questions arise when it comes to methane sources and sinks and the causes of such an increase, sustained by at different rate over time. Different approaches are used to estimates methane sources and sinks: atmospheric inversions use atmospheric mixing ratios measurements to infer methane emissions and sinks (top-down approaches), land-surface models simulate the processes that emit methane at the surface (e.g. wetland and freshwater emissions) or remove methane from the atmosphere (e.g. OH radicals), and inventories estimates anthropogenic emissions based on socio-economic statistics (bottom-up approaches).

Despite significant efforts over the last decades, there are still significant uncertainties in the spatial and temporal quantification of methane sources and sinks. The Global Methane Budget (GMB), under the umbrella of the Global Carbon Project, aims to releases regular synthesis of the methane budget at global and region scales.

This presentation will present the well-known facts, the quite-knowns sources and sinks and their uncertainties, the remaining large uncertainties on the methane budget and its changes over the past decades based on the latest Global Methane Budget activities, and will discussion the not-well knowns and unknows in the methane biogeochemical cycles, including the question of the contribution of the forest ecosystem.

How to cite: Saunois, M.: The Global Methane Budget: the knowns and unknowns, EGU General Assembly 2026, Vienna, Austria, 3–8 May 2026, EGU26-17309, https://doi.org/10.5194/egusphere-egu26-17309, 2026.

EGU26-18971 | Posters on site | BG3.15

Active microbial nitrous oxide consumption captures nitrogen for plant tissues  

Henri Siljanen, Johanna Kerttula, Krishnapriya Thiyagarasaiyar, Dhiraj Paul, Milja Keski-Karhu, Kaido Soosaar, Ülo Mander, Katerina Machacova, and Lukas Kohl

Nitrous oxide (N2O) is a strong greenhouse gas with the capacity of depleting ozone layer. Nitrous oxide is naturally produced in nitrogen cycle by microbial processes, but anthropogenic activities have increased the emissions to the atmosphere. Agricultural soil management and excessive use of nitrogen fertilizers are the main reason for increased emissions. Nitrous oxide reductase (nosZ) is a key gene required for the reduction of N2O and the consumption of it through microbial processes.

The aim of this work was to observe the effects of increased concentration of N2O to the activation on nosZ genes in microbes from leaf samples. The samples from labelling experiment enabled detecting, whether 15N-N2O labelling affected the nitrogen isotope ratio of the plant tissues. The quantitative analysis of nosZ and 16S rRNA genes was used to evaluate the transcription and activity of the genes. The composition of the microbial population of nosZ genes was determined from data obtained from amplicon sequencing with Illumina Miseq using bioinformatic analysing.

The results showed that amplification of clade I was successful in most of the samples, and there was moderate positive correlation between transcription of clade I and nitrogen fixation to the biomass. Clade II amplified only in one sample. Sequencing analyses revealed a wide range of microbial species with nosZ clade I gene, including species associated with nitrogen fixation.


How to cite: Siljanen, H., Kerttula, J., Thiyagarasaiyar, K., Paul, D., Keski-Karhu, M., Soosaar, K., Mander, Ü., Machacova, K., and Kohl, L.: Active microbial nitrous oxide consumption captures nitrogen for plant tissues , EGU General Assembly 2026, Vienna, Austria, 3–8 May 2026, EGU26-18971, https://doi.org/10.5194/egusphere-egu26-18971, 2026.

EGU26-20187 | Orals | BG3.15

Methane and nitrogen cycling within the tropical tree canopies in the Peruvian Amazon wetlands 

Anuliina Putkinen, Salla Tenhovirta, Eyrún Gyða Gunnlaugsdóttir, Lukas Kohl, Mikk Espenberg, Ülo Mander, and Mari Pihlatie

Tropical forests occupy a substantial share of the Earth’s forested land area. In addition to serving as major carbon reservoirs, these ecosystems influence the global greenhouse gas (GHG) balance by acting both as sinks and sources of methane (CH₄) and nitrous oxide (N₂O). Despite their importance, and sensitivity to climate change, the biogeochemical functioning of tropical forests remains insufficiently understood, particularly with respect to processes occurring in above-ground vegetation.

In this study, we investigated GHG cycling in tree canopies at two peat-swamp forest sites in the Peruvian Amazon: a protected palm swamp reserve Quistococha (3.83417° S, 73.31889° W) and a nearby secondary peatland forest Zungarococha, which served as a reference system.

Field campaigns conducted in November 2023 and May 2024 quantified potential CH₄ and N₂O production and uptake in leaves and twigs of three to four representative tree species (Symphonia globulifera, Mauritia flexuosa, Hevea sp., Tabebuia sp.). Aerobic incubations were performed on-site over 48 hours, with daily gas sampling for analysis via gas chromatography. Biological nitrogen fixation was assessed using 15N isotope labeling over a 72-hour incubation. In parallel, branch material was collected for metagenomic characterization of epiphytic and endophytic microbial communities.

Across all tree species, leaves exhibited small but statistically significant fluxes of both CH₄ and N₂O. In contrast, twig samples displayed species-specific behavior: Hevea sp. acted as a weak sink for both gases, whereas Symphonia globulifera was a consisted source. Considerable variability was observed not only among species but also between the two forest sites within the same species. Nitrogen fixation activity was detected in three of the four studied taxa. Metagenomic analyses revealed the genetic capacity for complete denitrification pathways and for N₂ fixation, while genes associated with nitrification (amoA) were rare. All analyzed tree species contained a high diversity of methanotrophic bacteria. Reads related to methanogenic archaea suggested presence of variable CH4 production pathways.

Our findings highlight tropical tree canopies as active components in the GHG cycling. By linking gas fluxes with the microbial functional potential, this work provides new insights into how above-ground plant–microbe interactions can shape ecosystem-level GHG balance in tropical peatland forests.

How to cite: Putkinen, A., Tenhovirta, S., Gyða Gunnlaugsdóttir, E., Kohl, L., Espenberg, M., Mander, Ü., and Pihlatie, M.: Methane and nitrogen cycling within the tropical tree canopies in the Peruvian Amazon wetlands, EGU General Assembly 2026, Vienna, Austria, 3–8 May 2026, EGU26-20187, https://doi.org/10.5194/egusphere-egu26-20187, 2026.

EGU26-22270 | Posters on site | BG3.15

Strong resilience of stem CO2 fluxes from a mature temperate forest under elevated atmospheric CO2 

Josep Barba, Andrea Rabbai, Robero Salomon, Giulio Curioni, and Vincent Gauci

There is substantial uncertainty regarding how different components of mature forests respond to rising atmospheric CO₂ concentrations under ongoing climate change. Tree stems, in particular, may act as increased carbon sinks due to enhanced growth under CO₂ fertilization, but they may also release more CO₂ as a consequence of higher metabolic rates and accelerated carbon cycling. Here, we investigated stem CO₂ fluxes in a mature oak (Quercus robur) stand exposed to elevated CO₂ since 2016 as part of a Free-Air CO₂ Enrichment experiment (BIFoR FACE, UK; +150 ppm above ambient concentrations). Stem CO₂ fluxes were measured over one year through monthly campaigns at 1.3 m height, and seasonally along the stem profile up to 4 m height. Stem CO₂ fluxes exhibited a pronounced seasonal pattern, with higher rates during the growing season, a decline in autumn, and consistently low fluxes during winter. However, neither the magnitude nor the seasonal dynamics of stem CO₂ fluxes were affected by elevated CO₂. Furthermore, partitioning total stem fluxes into maintenance respiration (associated with the metabolism of living stem tissues) and growth respiration (associated with the biosynthesis of new stem cells) revealed no significant response of either component to elevated CO₂. Stem CO₂ fluxes also showed no consistent vertical gradient along the stem, and this pattern was similarly unaffected by CO₂ enrichment. Overall, these findings indicate a strong functional resilience of stem CO₂ fluxes in mature trees to elevated atmospheric CO₂. This resilience may have important implications for predicting forest carbon balance responses to future climate conditions, particularly in mature temperate forests.

How to cite: Barba, J., Rabbai, A., Salomon, R., Curioni, G., and Gauci, V.: Strong resilience of stem CO2 fluxes from a mature temperate forest under elevated atmospheric CO2, EGU General Assembly 2026, Vienna, Austria, 3–8 May 2026, EGU26-22270, https://doi.org/10.5194/egusphere-egu26-22270, 2026.

EGU26-22794 | Posters on site | BG3.15

Tree species and forest habitat shape stem methane and nitrous oxide fluxes and sapwood microbial communities 

Laëtitia Bréchet, Clément Stahl, Coline Le Noir de Carlan, Andreas Richter, Damien Bonal, Ivan Janssens, and Erik Verbruggen

Living trees in forests emit or consume methane (CH4) and nitrous oxide (N2O) through their stems. These stem fluxes can originate directly from the internal tissues, or co-occur from soils and stems. However, the magnitudes, origins, and biogeochemical pathways of these fluxes remain poorly understood.

In our study, we aimed to investigate whether tropical forest habitats (upland versus seasonally flooded areas), tree species and composition of the microbial communities living in the sapwood influence the stem fluxes of CH4 and N2O.

To address this, we measured the in situ CH4 and N2O fluxes in the stems of thirteen tropical tree species using static chambers. We investigated the microbial communities in the sapwood by sequencing the 16S rDNA of bacteria and archaea on an Illumina MiSeq platform. Measurements were taken in two contrasting habitats: well-drained, nutrient-poor soil in an upland area, and waterlogged, nutrient-rich soil in a seasonally flooded area of a tropical forest in French Guiana. Fluxes, woody tissue microbial communities, and related tree traits were measured during the wet season.

Overall, we observed a significant effect of forest habitat on sapwood microbial communities, which remained relatively consistent within specific tree species. Stem fluxes per unit of stem surface area were approximately 2.5 times higher for CH4 and lower for N2O in the seasonally flooded forest, compared to the upland forest. Variability in these fluxes was observed not only between the two forest habitats, but also among and within tree species. Surprisingly, methanotrophs and methanotrophs were barely detectable, and denitrifiers and nitrifiers were also scarce in the stem tissues, despite the high CH4 and, to a lesser extent, N2O emissions measured on the stem surfaces. This suggests that, in our site, CH4 and N2O fluxes mainly result from processes occurring in the heartwood, bark, soil, or a combination of these. Further research is needed to shed light on the microbial mechanisms underlying the exchange of CH4 and N2O between the trees and the atmosphere in tropical forest ecosystems.

How to cite: Bréchet, L., Stahl, C., Le Noir de Carlan, C., Richter, A., Bonal, D., Janssens, I., and Verbruggen, E.: Tree species and forest habitat shape stem methane and nitrous oxide fluxes and sapwood microbial communities, EGU General Assembly 2026, Vienna, Austria, 3–8 May 2026, EGU26-22794, https://doi.org/10.5194/egusphere-egu26-22794, 2026.

EGU26-23183 | Orals | BG3.15

Tree stems dominate methane but not nitrous oxide emissions in a riparian nature-based wastewater treatment system 

Sílvia Poblador, Laura Escarmena, Aitana Izquierdo, Stefania Mattana, Angela Ribas, Núria Roca, and Francesc Sabater

Riparian zone soils are being applied as nature-based solutions for treating wastewater treatment plant effluents via intermittent horizontal subsurface flow systems. While their treatment efficiency is well documented, their role in greenhouse gas (GHG) dynamics, particularly emissions mediated through tree stems, remains largely unexplored. This study quantified tree stem and soil emissions of CO2, CH4, and N2O within an innovative riparian-zone wastewater treatment system and evaluated the influence of hydrological conditions, soil properties, and tree species. From April to October 2023, treated wastewater was applied in alternating wet and dry cycles of one week each, with five sampling campaigns per condition. GHG fluxes were measured from soils (N = 15) and from tree stems at approximately 0.5 m height (N = 18). Concurrently, soil temperature, moisture, pH, and carbon and nitrogen content were assessed. The dominant tree species included Alnus glutinosa, Ulmus minor, Fraxinus excelsior, and the non-native Platanus × hispanica. Soil GHG emissions were primarily driven by environmental conditions. Soil CO2 emissions were mainly controlled by temperature, whereas soil CH4 and N2O were ruled by groundwater table fluctuations. Soil N2O emissions increased under shallower water tables and higher soil temperature and moisture. Soil CH4 fluxes were spatially heterogeneous, with higher emissions in areas where groundwater table was shallower. Overall, the intermittent wet/dry management supported both soil GHG production and consumption without causing a substantial net increase in emissions.Tree stem emissions were strongly species-dependent and often exceeded soil CO2 and CH4 emissions, while N2O emissions were almost negligible. Platanus × hispanica consistently showed the highest stem emissions across all gases, emitting approximately threefold more CO2 and over two orders of magnitude more CH4 than soils. Ulmus minor and Alnus glutinosa also exhibited elevated stem CH4 emissions compared to soils (20 and 9 times higher, respectively), whereas stem N2O emissions were generally about half of soil emissions for all species. Notably, Fraxinus excelsior frequently acted as a sink for N2O. Stem CO2 emissions increased with soil temperature and nitrogen content and peaked during the warmest months but were not influenced by hydrological conditions. In contrast, CH4 emissions displayed a significant interaction between species and wet conditions, suggesting transport of CH4 produced in deeper soil layers through stems or in situ microbial production. N2O fluxes from stems were highly variable, with both emissions and uptake observed, indicating control by microscale and potentially internal stem processes.This study provides the first simultaneous assessment of soil and tree stem GHG emissions in a nature-based wastewater treatment system. The results demonstrate that tree species identity is a critical determinant of stem-mediated GHG fluxes and highlight the need to incorporate vegetation structure, particularly tree stems, into GHG budgets and the design of riparian wastewater treatment systems.

How to cite: Poblador, S., Escarmena, L., Izquierdo, A., Mattana, S., Ribas, A., Roca, N., and Sabater, F.: Tree stems dominate methane but not nitrous oxide emissions in a riparian nature-based wastewater treatment system, EGU General Assembly 2026, Vienna, Austria, 3–8 May 2026, EGU26-23183, https://doi.org/10.5194/egusphere-egu26-23183, 2026.

EGU26-239 | ECS | Posters on site | BG3.17

Beyond greening and browning in northern peatlands: the roles of warming, precipitation, lake drainage, and tree cover 

Iuliia Burdun, Jiabin Pu, Ranga B. Myneni, and Miina Rautiainen

We conducted, to our knowledge, the first multi-decadal, peatland-specific assessment of canopy greening and browning trends across northern peatlands using a gap-filled, sensor-independent climate data record of leaf area index (LAI) for 2001–2023.  We hypothesise that northern peatlands exhibit spatially coherent greening or browning trends in LAI and that these trends can be explained by (i) climate-related changes, including warming, precipitation and recent lake drainage in the northern permafrost zone; (ii) differences in protection status; and (iii) variation in tree cover type and density. We found that although greening was widespread (77% of peatlands; greening-to-browning ratio 3.5:1), there was no statistical evidence for an area-weighted LAI trend at the map scale. Overall, peatland canopy change was not a uniform increase in greenness; rather, LAI responses were moisture-sensitive and dependent on tree-cover context and were further modulated by decadal climate variability.

How to cite: Burdun, I., Pu, J., Myneni, R. B., and Rautiainen, M.: Beyond greening and browning in northern peatlands: the roles of warming, precipitation, lake drainage, and tree cover, EGU General Assembly 2026, Vienna, Austria, 3–8 May 2026, EGU26-239, https://doi.org/10.5194/egusphere-egu26-239, 2026.

EGU26-285 | ECS | Orals | BG3.17 | Highlight

Changes in Snow Cover and Underground Ecosystems in the Northern Hemisphere 

Xiangjiao Tan and Yan Yang

The snow cover changes driven by climate change are profoundly altering the structure and function of alpine ecosystems. Based on a review of the effects of snowpack variation on soil processes in terrestrial ecosystems of the Northern Hemisphere (with the most significant soil insulation effect observed at snow depths of 40-70 cm; increased snow cover accelerates carbon and nitrogen cycling, leading to their loss, with more pronounced effects in moist habitats), this study, combined with snow cover manipulation experiments in the alpine meadows of the Tibetan Plateau, focuses on examining the response of plant above-ground and below-ground functional traits to increased snow depth. The study found that increased snow depth significantly improved the water-thermal conditions of the shallow soil during the growing season, which in turn drove an "inconsistent response" in plant above-ground and below-ground parts: while there was no significant change in above-ground biomass, leaf chemical traits (carbon, nitrogen, and phosphorus concentrations) were significantly enhanced, and morphological traits (such as specific leaf area) decreased. In contrast, root biomass in the below-ground part increased significantly, and root morphology was significantly optimized (specific root length and specific root area increased, root diameter decreased). Further analysis indicated that variation in leaf traits was primarily driven by nutrient chemical properties, whereas variation in root traits was predominantly influenced by morphological adjustments. The sensitivity of below-ground processes in the alpine meadows to snowpack variation was higher than that of the above-ground processes. This differential response strategy reflects the trade-offs between above-ground and below-ground resource allocation, highlighting the adaptive strategy of alpine plants to prioritize root investment for enhanced resource acquisition under changing snow conditions. This study deepens the understanding of the cascading mechanisms of snow-soil-plant interactions and provides a theoretical basis for predicting the feedback of alpine meadow ecosystems to climate change.

How to cite: Tan, X. and Yang, Y.: Changes in Snow Cover and Underground Ecosystems in the Northern Hemisphere, EGU General Assembly 2026, Vienna, Austria, 3–8 May 2026, EGU26-285, https://doi.org/10.5194/egusphere-egu26-285, 2026.

EGU26-378 | ECS | Orals | BG3.17

Evidence of long- range transport of toxic metals in High Arctic wetlands 

Ellie Purdy, Graeme Swindles, Richard Fewster, Thomas Roland, Jennifer Galloway, Maarten Blaauw, Thomas Bishop, Jon Yarwood, Emma Shuttleworth, Gareth Clay, and Becca Cole

High Arctic peatlands are among the most remote and climate- sensitive ecosystems on Earth. While they are globally recognised as important carbon sinks, their capacity to accumulate and archive atmospheric pollutants remains underexplored. This study investigates the deposition and accumulation of trace metals in peat cores from four sites across the Canadian High Arctic (Axel Heiberg Island, Banks Island, Ellesmere Island, and Kugaaruk) to assess the influence of long- range atmospheric transport on contaminant inputs.

Peat cores were collected from wetlands and analysed using inductively coupled plasma mass spectrometry (ICP-MS) for lead (Pb), cadmium (Cd), copper (Cu), zinc (Zn), chromium (Cr), and nickel (Ni). Concentration profiles were evaluated alongside enrichment factors (EFs), calculated relative to crustal reference elements, to distinguish anthropogenic contributions from natural lithogenic sources.

Across all sites, distinct enrichment of Pb, Cd, and Zn was observed in the upper peat layers, with enrichment factors exceeding 5 at several depths, particularly on Axel Heiberg and Ellesmere Island. In contrast, Cr and Ni displayed near-crustal EF values (close to 1), suggesting primarily natural origins. The enrichment patterns for Pb and Cd indicate deposition peaks likely corresponding to periods of heightened industrial emissions in the mid- to late 20th century, consistent with known global trends in atmospheric metal fallout. The widespread detection of anthropogenic metals across geographically isolated High Arctic wetlands underscores the efficacy of long- range atmospheric transport processes in dispersing contaminants from lower- latitude industrial regions.

These findings demonstrate that Arctic peatlands serve as dual-function environmental archives: they sequester both carbon and anthropogenic pollutants over millennial timescales. However, as climate warming intensifies permafrost thaw and alters hydrological and biogeochemical conditions, these historically sequestered metals risk remobilisation into Arctic freshwater systems. Such release could have cascading effects on sensitive ecosystems and local food webs, further illustrating the interconnectedness of global human activity and polar environmental change.

By coupling concentration and enrichment factor analyses across multiple Arctic sites, this study provides the first regional- scale evidence of widespread metal enrichment in High Arctic peatlands attributable to atmospheric transport. It highlights the necessity of incorporating contaminant storage and release processes into broader models of Arctic biogeochemical cycling. Understanding how these systems mediate both carbon and pollutant fluxes under a warming climate is critical for predicting future Arctic ecosystem responses and for developing effective environmental protection strategies.

How to cite: Purdy, E., Swindles, G., Fewster, R., Roland, T., Galloway, J., Blaauw, M., Bishop, T., Yarwood, J., Shuttleworth, E., Clay, G., and Cole, B.: Evidence of long- range transport of toxic metals in High Arctic wetlands, EGU General Assembly 2026, Vienna, Austria, 3–8 May 2026, EGU26-378, https://doi.org/10.5194/egusphere-egu26-378, 2026.

EGU26-2070 | Posters on site | BG3.17

Seasonal freeze-thaw effects on submarine groundwater discharge in coastal unconfined aquifers 

Xiayang Yu, Yue Li, and Pei Xin

Submarine groundwater discharge (SGD) can deliver land-sourced chemicals to coastal waters, influencing coastal biogeochemistry and ecosystems. In cold regions, submarine groundwater discharge commonly occurs under seasonal freeze-thaw conditions, but how freeze-thaw processes affect SGD in coastal unconfined aquifers remains unclear. This study examines the fluctuation of water efflux in coastal aquifers under seasonal freeze-thaw conditions, based on a two-dimensional conceptual model. Simulations were conducted using a modified SUTRA-MS model that incorporates freeze-thaw processes into variably saturated, density-dependent groundwater flow coupled with salt and heat transport. The response of frozen layer thickness and SGD to seasonal freeze-thaw will be discussed here in detail.

How to cite: Yu, X., Li, Y., and Xin, P.: Seasonal freeze-thaw effects on submarine groundwater discharge in coastal unconfined aquifers, EGU General Assembly 2026, Vienna, Austria, 3–8 May 2026, EGU26-2070, https://doi.org/10.5194/egusphere-egu26-2070, 2026.

Plant-microbe symbiotic relationships are critical for ecosystem stability and functional maintenance, particularly in extreme alpine ecosystems. Takakia lepidozioides, one of the most primitive moss species in the world, has unclear mechanisms of interaction with microbes. This study focused on T. lepidozioides distributed along an altitudinal gradient (3800-4200 m) on Galongla Snow Mountain in southeastern Tibet. Through in situ field sampling, 16S rRNA and ITS amplicon sequencing were used to analyze microbial community structures in the rhizoidsphere and endophyte compartments, combined with metagenomic sequencing to examine functional characteristics. The study systematically investigated the T. lepidozioides-microbe symbiotic system and its cooperative adaptation mechanisms to alpine environments. Key findings are as follows:

(1) Significant differences existed between rhizoidsphere soil bacteria and endophytic bacteria in community composition, diversity, network structure, and assembly processes, with relatively smaller differences in fungi; altitude had no significant effect on symbiotic microbes (rhizoidsphere and endophyte), but they were influenced to some extent by physicochemical properties;

(2) Symbiotic microbes potentially assisted the host in basic element cycling, immunity, and antioxidant production, while supplementing indole-3-acetic acid synthesis pathways; symbiotic microbes relied on ABC transporters for N/S/P/Fe(III) transport but lacked transporters for sugars, organic acids/aromatics, metals/partial vitamins, amino acids, and defense-related proteins; endophytes contributed to host growth and stress resistance through enhanced amino acid metabolism, energy flow, terpenoid precursors, and carotenoid precursor synthesis compared to rhizoidsphere microbes;

(3) The symbiotic compartment contained many novel microbes (unclassifiable to species level by GTDB-Tk); endophytic metabolic modules were more diverse than those in the rhizoidsphere; endophytes exhibited pronounced community-function decoupling, with more frequent horizontal gene transfer events, consistent with weaker selection processes in endophytes.

In summary, this study revealed the roles of rhizoidsphere and endophytic microbes in supporting T. lepidozioidessurvival at the community and functional levels, providing the first comprehensive analysis of potential T. lepidozioides-microbe symbiotic relationships. These findings have significant implications for understanding early patterns of plant-microbe cooperative adaptation to extreme environments and for conserving endangered species.

How to cite: Liu, W. and Wei, Y.:  Symbiotic strategy of endophytic-rhizoidsphere microbiome with Takakia lepidozioides in alpine mountain of Tibetan Plateau, EGU General Assembly 2026, Vienna, Austria, 3–8 May 2026, EGU26-4937, https://doi.org/10.5194/egusphere-egu26-4937, 2026.

EGU26-8163 | Posters on site | BG3.17

Evaluating spatial upscaling strategies for Arctic carbon fluxes: high-density mobile chamber measurements at Stordalen Mire 

Kseniia Ivanova, Abdullah Bolek, Nicholas James Eves, Martin Heimann, Sanjid Backer Kanakassery, Lara Oxley, Elliot Pratt, Mark Schlutow, Nathalie Triches, Judith Vogt, Elias Wahl, Theresia Yazbeck, Barbara Widhalm, Annett Bartsch, and Mathias Göckede

Estimating the carbon balance of Arctic ecosystems is challenging because of their high spatial heterogeneity, which is difficult to account for using traditional methods: static chambers linked to fixed points allow for tracking the seasonal dynamics of processes but are limited in spatial coverage, whereas the Eddy Covariance method provides only an integral assessment of fluxes from large areas, averaging the contribution of various microlandscapes. 

In this work, we present the results of a STORDALENX25 field campaign conducted during the 2025 growing season at Stordalen Mire (Abisko, Sweden), during which over 650 measurements of CH4 and CO2 (NEE) fluxes were obtained using the mobile chamber technique, quasi-randomly distributed within and beyond the Eddy Covariance footprint, covering a total area of approximately 0.1 km2. The unique density of this spatial dataset allows it to be used not only for calculating the regional budget but also as a testbed for evaluating various spatial upscaling strategies. 

As a first key methodological task, we compare the effectiveness of different base maps describing the study domain: we contrast classical upscaling based on land cover types (Palsa, Fen, Bog) with the use of data-driven functional zonation. Another research objective is to determine the factors contributing most to model accuracy: we conduct a comparative analysis of predictors, assessing the "value added" by remote sensing data (Sentinel-2, UAV) compared to direct field measurements such as soil temperature and moisture. Furthermore, we analyze the "performance plateau" to identify the minimum necessary number of measurement points and compare the efficiency of classical vegetation-based scaling against clustering based on environmental response functions. The results, validated by data from static chambers and the Eddy Covariance tower, allow for the optimization of future field campaign designs by determining the balance between labor effort and the accuracy of spatial estimates.

How to cite: Ivanova, K., Bolek, A., Eves, N. J., Heimann, M., Kanakassery, S. B., Oxley, L., Pratt, E., Schlutow, M., Triches, N., Vogt, J., Wahl, E., Yazbeck, T., Widhalm, B., Bartsch, A., and Göckede, M.: Evaluating spatial upscaling strategies for Arctic carbon fluxes: high-density mobile chamber measurements at Stordalen Mire, EGU General Assembly 2026, Vienna, Austria, 3–8 May 2026, EGU26-8163, https://doi.org/10.5194/egusphere-egu26-8163, 2026.

EGU26-10758 | Posters on site | BG3.17

Negative effects of false spring on P. cembra in the alpine treeline ecotone of the High Tatras, Slovakia 

Veronika Lukasová, Svetlana Varšová, and Jaroslav Škvarenina

Trees growing in mountain regions have evolved adaptations to withstand extreme winter conditions, primarily through dormancy and frost-avoidance mechanisms. However, frost events occurring after the growing season begins pose a substantial risk, as ice formation can damage newly developing tissues. A warm episode in late winter or early spring that triggers premature growth, followed by a subsequent hard freeze, is termed a false spring.

In the alpine treeline ecotone in the High Tatras, Pinus cembra, a native, long-lived mountain conifer, experienced such a false spring in 2024. Weather conditions in late winter led to an unusually early bursting of vegetative buds, which was interrupted by an 11-day cold spell. During this period, minimum air temperatures dropped to −8.3 °C, with a mean daily temperature of −2.0 °C, as recorded at the Skalnaté Pleso Observatory (1778 m a.s.l.). This freezing event occurred shortly after vegetative buds had lost their protective resin layer and begun to burst. The aim of this study was to assess the impact of this event on the life cycle of P. cembra.

In the weeks following the false spring, affected individuals exhibited pronounced needle yellowing and defoliation. While senescence and shedding of older needles typically occur between August and September, frost-induced stress led to the premature loss of approximately one-third of needles as early as May, at the beginning of the growing season. Although new shoots and needles developed normally, reproductive organs were severely affected. Cone bud formation was observed approximately two months after vegetative budburst; however, male (pollen) cones were degenerated and showed minimal pollination potential. Following the false spring, P. cembra individuals developed several seed cones, which subsequently abscised between July and August 2025. These cones were immature, small, and deformed.

Our results demonstrate that false spring events associated with ongoing climate change can disrupt the life cycles of P. cemba, substantially limiting its reproductive potential in the alpine treeline ecotone of the High Tatras.

Acknowledgement: This study was funded by the project VEGA 2/0048/25.

How to cite: Lukasová, V., Varšová, S., and Škvarenina, J.: Negative effects of false spring on P. cembra in the alpine treeline ecotone of the High Tatras, Slovakia, EGU General Assembly 2026, Vienna, Austria, 3–8 May 2026, EGU26-10758, https://doi.org/10.5194/egusphere-egu26-10758, 2026.

EGU26-11121 | ECS | Orals | BG3.17

Between light and dark, source and sink: N2O dynamics in a subarctic, nutrient-poor permafrost peatland 

Nathalie Ylenia Triches, Abdullah Bolek, Mirkka Rovamo, Richard E. Lamprecht, Kseniia Ivanova, Wasi Hashmi, Theresia Yazbeck, Nicholas James Eves, Dhiraj Paul, Anna-Maria Virkkala, Timo Vesala, Christina Biasi, Maija E. Marushchak, and Mathias Göckede

Global warming and associated permafrost thaw in the Arctic raise concerns about increased greenhouse gas emissions. Nitrous oxide (N2O) is a potent greenhouse gas produced in soils, but the magnitude of N2O fluxes from permafrost regions remains highly uncertain. While high N2O emissions for nutrient-rich, bare Arctic soils have been reported, for nutrient-poor soils that dominate the region the magnitude and drivers of N2O fluxes have rarely been investigated. We present an unprecedented dataset of 1487 chamber flux observations covering three snow-free seasons in a nutrient-poor thawing permafrost peatland in northern Sweden. Our results show that this ecosystem can act as a continuous and non-negligible, albeit small, sink of N2O during the snow-free season, which has not been reported from in-situ studies before. We also discovered a continuous N2O hotspot that indicates potential for substantial N2O production and net emissions in specific areas of the peatland. Our study identifies complex controls of N2O fluxes, highlighting interactions between photosynthetically active radiation (PAR), carbon dioxide (CO2) fluxes, and other environmental factors. We show that PAR is an important but not exclusive driver, with differences in the set of drivers and shape of dependencies between light and dark conditions.

Our results underscore the non-negligible N2O fluxes in nutrient-poor Arctic soils and the presence of hot spots which may be important for the total landscape scale N2O budget. The crucial role of soil-plant-atmosphere interactions in N2O dynamics and the role of light as a driver of N2O flux may have implications for global greenhouse gas budgets and climate mitigation and should be further investigated in future studies.

How to cite: Triches, N. Y., Bolek, A., Rovamo, M., Lamprecht, R. E., Ivanova, K., Hashmi, W., Yazbeck, T., Eves, N. J., Paul, D., Virkkala, A.-M., Vesala, T., Biasi, C., Marushchak, M. E., and Göckede, M.: Between light and dark, source and sink: N2O dynamics in a subarctic, nutrient-poor permafrost peatland, EGU General Assembly 2026, Vienna, Austria, 3–8 May 2026, EGU26-11121, https://doi.org/10.5194/egusphere-egu26-11121, 2026.

EGU26-12212 | ECS | Orals | BG3.17

Permafrost degradation inputs shape mitigation potential of methane emissions from aquatic ecosystems in a polygonal peatland context 

Rémi Trémouille, Maialen Barret, Aliénor Allain, Julien Arsenault, Frédéric Bouchard, Garance Coquereau, Lucie Germain, Marion Vivant, and Laure Gandois

In polygonal peatlands, typical of continuous permafrost, numerous small aquatic ecosystems are found in ice-wedge troughs but also in larger depressions. These ponds reflect permafrost evolution and degradation, which influences their functioning. Permafrost ice is enriched in carbon and nutrients, and its degradation leads to the transfer of Dissolved Organic Carbon (DOC), nutrients (N, P) and microorganisms to ponds. These aquatic ecosystems act as CH4 emission hotspots. An important proportion of the CH4 produced by ponds is mitigated in the water column by methanotrophic activity. We refer to the hydrological and biological exchange between permafrost pore ice and aquatic ecosystems, which is driven by ongoing permafrost degradation, as permafrost-pond connectivity. The effects of permafrost-ponds connectivity on microbial communities and CH4 oxidation activity remain to be assessed, to understand how permafrost degradation could influence future Greenhouse Gas (GHG) fluxes of polygonal peatland.

In this study, we combined in situ monitoring and incubation approach of small ponds of polygonal peatlands. Study sites were located near Churchill (Manitoba, Canada) and across Wapusk National Park, in the Hudson Bay lowlands, the second largest complex of permafrost peatland in the world. To investigate the diversity and functioning of aquatic ecosystems, we characterised GHG concentration and fluxes, organic carbon, nutrient concentrations and microbial communities, in and around forty waterbodies covering a large range of permafrost degradation context, from small trough ponds to larger depressions. Additionally, we tested the effect of permafrost-pond connectivity on CH4 oxidation activity in an experimental setting by adding inorganic nutrients (N, P) or permafrost pore ice into methanotrophic incubations of pond water. Ponds selected for these experiments covered a range of different permafrost connectivity context.

We found that the degree of connectivity between permafrost ice and ponds strongly structures their microbial community composition, nutrient content and CH4 mitigation potential. Higher connectivity to permafrost leads to higher DOC and Total Phosphorous (TP) content, whereas lower [CH4] were measured. Nutrient transfer affected CH4 oxidation activity in different ways in methanotrophic experiments. Synthetic NP inputs increased CH4 oxidation activity. On the other hand, permafrost pore ice transfer led to strong decrease of CH4 oxidation activity. Labile DOC and nutrients contained in permafrost pore ice increased heterotrophic activity and competition for O2. Ponds with low connectivity to permafrost (influenced by the active layer) were more sensitive to nutrient inputs than the ponds highly connected with permafrost. These results suggest that methanotrophic activity could be less nutrient-limited as a result of higher nutrient input from permafrost to ponds. These results show that nutrient transfer from permafrost alters CH4 mitigation activity and influences CH4 emissions from aquatic ecosystems in a polygonal peatland context. This study provides new insights into understanding biogeochemical processes and estimating permafrost thaw positive feedback to climate change.

How to cite: Trémouille, R., Barret, M., Allain, A., Arsenault, J., Bouchard, F., Coquereau, G., Germain, L., Vivant, M., and Gandois, L.: Permafrost degradation inputs shape mitigation potential of methane emissions from aquatic ecosystems in a polygonal peatland context, EGU General Assembly 2026, Vienna, Austria, 3–8 May 2026, EGU26-12212, https://doi.org/10.5194/egusphere-egu26-12212, 2026.

EGU26-12456 | ECS | Orals | BG3.17

Understanding how snow cover controls methane emissions in high-latitude peatlands through ecosystem modeling 

Suvi Orttenvuori, Antti Leppänen, Tiina Markkanen, Mika Aurela, Anna Kontu, Juha Lemmetyinen, Milja Männikkö, Maarit Raivonen, and Tuula Aalto

Seasonal snow cover plays a critical role in regulating soil freeze-thaw dynamics by forming an insulating layer on top of the soil and modifying the soil thermal regime in high latitude regions. In natural wetlands, which have a significant contribution to global methane (CH4) emissions and are sensitive to rising surface temperatures, snow cover influences the seasonality and magnitude of these emissions. Despite its importance, snow-soil-atmosphere interactions remain a major source of uncertainty in current land surface models, particularly with respect to methane dynamics during the cold season. The net methane flux is regulated by the processes of CH4 production, oxidation, and transport, with methane transported from the soil to the atmosphere via diffusion, ebullition and plant-mediated transport. Snowpack slows down the diffusion of methane and high emissions can occur during spring snow melt and soil thaw.

In this study, we utilize the JSBACH ecosystem model and run it coupled with the HIMMELI peatland process model with a novel snow resistance implementation to assess how snowpack modifies the methane microbe and transport processes in high-latitude peatlands. The model framework is forced, calibrated and evaluated using observational data from an established pristine mire eddy covariance (EC) measurement site located in northern Finland within the Arctic-boreal region. Simulated methane fluxes and snow dynamics are compared against EC, chamber, and snowpack CH4 diffusion gradient observations in addition to manual and automated observations of snow properties. Our preliminary results indicate that the snowpack impacts the soil freeze/thaw, anoxic conditions, methane concentrations and plant-mediated transport, therefore demonstrating the complex and non-linear relationship between seasonal snow cover and methane production, transport and oxidation processes.

How to cite: Orttenvuori, S., Leppänen, A., Markkanen, T., Aurela, M., Kontu, A., Lemmetyinen, J., Männikkö, M., Raivonen, M., and Aalto, T.: Understanding how snow cover controls methane emissions in high-latitude peatlands through ecosystem modeling, EGU General Assembly 2026, Vienna, Austria, 3–8 May 2026, EGU26-12456, https://doi.org/10.5194/egusphere-egu26-12456, 2026.

EGU26-12726 | Orals | BG3.17

Winter Metabolism in the High Arctic: A Multi-Habitat Metatranscriptomic Perspective 

Catherine Larose, Harpreet Singh, James A Bradley, and Timothy M Vogel

The cryosphere hosts diverse microbial communities adapted to steep temperature gradients, low water availability, and prolonged darkness. Despite evidence for sub-zero metabolic activity and long-term survival in ice cores, winter microbial ecology, particularly during the polar night, remains poorly constrained, with most studies focused on sunlit seasons. This has led to an incomplete, photosynthesis-centric view of polar ecosystem function, leaving open whether winter represents a period of dormancy or sustained metabolic activity. Here, we present the first multi-habitat metagenomic and metatranscriptomic study of High Arctic (79°N) microbial communities from glacier ice, snow, lake ice, and soils, sampled during mid-polar night. We examine transcriptional and translational activity to test for winter metabolic function, identify active taxa and pathways, and assess habitat-specific strategies. We evaluate how nutrient availability constrains winter metabolism and whether low-abundance taxa contribute disproportionately to activity. Our results indicate that cryospheric microbial communities maintain diverse metabolic functions throughout the polar night, redefining winter as a dynamic biogeochemical period with implications for Arctic ecosystem processes under changing climate.


How to cite: Larose, C., Singh, H., Bradley, J. A., and Vogel, T. M.: Winter Metabolism in the High Arctic: A Multi-Habitat Metatranscriptomic Perspective, EGU General Assembly 2026, Vienna, Austria, 3–8 May 2026, EGU26-12726, https://doi.org/10.5194/egusphere-egu26-12726, 2026.

EGU26-14046 | ECS | Orals | BG3.17

Thermal and hydrological controls on subsurface gas transport and soil respiration in Arctic tundra ecosystems 

Navid Ahmadi, Birgitte Kortegaard Danielsen, Guy Schurgers, Chamindu Deepagoda, Riikka Rinnan, Karoline Nordberg Nilsson, and Bo Elberling

In recent decades, the temperature and precipitation patterns in Arctic ecosystems have been highly affected by climate change. Previous studies suggest that changing air circulation and more evaporation from ice-free Arctic seas could increase snowfall and winter snow accumulation in parts of the Arctic, which in turn can change the onset of the growing season. In combination with ongoing and projected temperature rise, such shifts will alter the physical and biogeochemical processes that are associated with soil respiration and production/release of greenhouse gases like CO2 from Arctic tundra soils.

Arctic tundra soils experience strong seasonal hydrological dynamics, ranging from frozen conditions in winter to near water saturated and partially water saturated conditions following snowmelt infiltration in early spring. These conditions exert controls (i) on the transport behavior and delivery of O2 into the soil, (ii) on the kinetics of soil respiration and (iii) on the release of CO2 to the atmosphere. Despite the importance of these complex interactions for Earth’s climate, there is still a considerable limitation on the accurate quantification of the interplay between thermo-hydrological, transport and microbial respiration in controlling CO2 emissions from tundra ecosystems under transient field conditions.

We investigated how physical and biogeochemical processes, including oxygen transport, soil respiration and CO2 emissions respond to seasonal thermo-hydrological dynamics in a typical well-drained Arctic tundra ecosystems by combining lab experiments and field observations with process-based modelling. Our results show that respiration and CO₂ emissions are strongly constrained by low temperatures during most of the year as oxygen concentration remains close to atmospheric levels and therefore oxygen availability is not a limiting factor. The onset of spring is accompanied by a gradual increase in temperature and melting of snowpack, which reduces the thermal limitation on soil respiration. However, the resulting snowmelt infiltration exerts a series of biochemical and physical controls on soil respiration dynamics and CO2 emission by (i) inducing water saturated conditions in soil; (ii) limiting oxygen transport into the soil and CO2 migration toward the atmosphere due to slow gas diffusivity in water and (iii) reducing oxygen concentration to values close to half saturation constant of oxygen, thereby exerting metabolic constrains. These results highlight the importance of considering the impact of climate forcing (e.g., thermal and hydrological dynamics) on physical and biogeochemical processes that regulate carbon dynamics in Arctic tundra ecosystems.


How to cite: Ahmadi, N., Kortegaard Danielsen, B., Schurgers, G., Deepagoda, C., Rinnan, R., Nordberg Nilsson, K., and Elberling, B.: Thermal and hydrological controls on subsurface gas transport and soil respiration in Arctic tundra ecosystems, EGU General Assembly 2026, Vienna, Austria, 3–8 May 2026, EGU26-14046, https://doi.org/10.5194/egusphere-egu26-14046, 2026.

EGU26-16383 | Posters on site | BG3.17

Effects of Long-Term Experimental Warming on Nitrogen Uptake and Partitioning During Arctic Tundra Shoulder Seasons 

Ji Young Jung, Emil Alexander Sherman Andersen, Sujeong Jeong, Sungjin Nam, Jinhyun Kim, Jihyeon Jeon, and Anders Michelsen

Spring and autumn, often termed shoulder seasons, represent key transitional phases in Arctic tundra ecosystems, during which nutrient dynamics become highly variable. Biogeochemical cycling during these periods is particularly responsive to warming. Here, we quantify nitrogen uptake and allocation across soil, plant, and microbial fractions in tundra ecosystem at Abisko, northern Sweden, where experimental warming has been maintained for 7 and 17 years, alongside ambient controls. A dual-labeled ¹³C¹⁵N-glycine tracer was used to trace nitrogen incorporation over short-term (24 h) and longer-term (one month) timescales. Isotope recovery across ecosystem pools will be used to determine how warming duration alters the partitioning of nitrogen during seasonal transitions. Based on fieldwork completed last year, this work reports preliminary results from ongoing analyses, with only a limited number of initial findings presented. Once analyses are complete, the results will contribute to improve our understanding of nitrogen dynamics during transition periods under warming in Arctic tundra ecosystems.

How to cite: Jung, J. Y., Andersen, E. A. S., Jeong, S., Nam, S., Kim, J., Jeon, J., and Michelsen, A.: Effects of Long-Term Experimental Warming on Nitrogen Uptake and Partitioning During Arctic Tundra Shoulder Seasons, EGU General Assembly 2026, Vienna, Austria, 3–8 May 2026, EGU26-16383, https://doi.org/10.5194/egusphere-egu26-16383, 2026.

EGU26-16767 | ECS | Posters on site | BG3.17

Divergent ecosystem responses: Biological activity and soil organic matter vulnerability under increased snow depth in Arctic tundra 

Jinhyun Kim, You Jin Kim, Ji Young Jung, Sungjin Nam, and Sujeong Jeong

Snow cover strongly affects Arctic tundra soils, regulating temperature, moisture, and nutrient availability across seasons. Although warming increases winter snowfall and prolongs snow cover, the biogeochemical impacts remain uncertain in contrasting tundra types. We installed snow fences in moist tundra (Council, Alaska) and dry tundra (Cambridge Bay, Nunavut) for five to six years to assess how deeper snow cover modifies soil conditions, biological activity, and soil organic matter (SOM) fractions, focusing on mineral-associated organic matter (MAOM). Deeper snow cover raised winter soil temperatures at both sites. However, only the moist tundra showed higher summer soil temperature and moisture, leading to higher plant greenness and a slight rise in SOM vulnerability. At this site, free particulate organic matter fraction rose while MAOM declined, indicating that MAOM, less chemically processed (high C/N, low δ¹⁵N), was more susceptible to decomposition. In contrast, the dry tundra’s colder conditions showed no major shifts in soil chemistry, vegetation, microbes, or SOM fractions, likely because temperatures stayed below thresholds for winter biological activity. These site-specific results indicate that soil temperature and moisture drive Arctic tundra responses to deeper snow cover, highlighting the importance of understanding such differences when predicting biogeochemical feedback under rapid climate change.

How to cite: Kim, J., Kim, Y. J., Jung, J. Y., Nam, S., and Jeong, S.: Divergent ecosystem responses: Biological activity and soil organic matter vulnerability under increased snow depth in Arctic tundra, EGU General Assembly 2026, Vienna, Austria, 3–8 May 2026, EGU26-16767, https://doi.org/10.5194/egusphere-egu26-16767, 2026.

EGU26-16981 | ECS | Posters on site | BG3.17

Spatial patterns of Arctic ecosystem changes under recent climate warming and permafrost degradation 

Marina Vîrghileanu, Teona Daia-Creinicean, Alexandru Berbecariu, Carmen-Gabriela Bizdadea, Florin Miron, and Ionuț Șandric

Recent climate warming in the Arctic is driving accelerated permafrost degradation (Biskaborn et al., 2019), representing one of the most severe consequences of contemporary climate change (Rantanen et al., 2022; Schuur et al., 2022), with profound impacts on terrestrial ecosystems and the global climate system (Calvin et al., 2023). Although Arctic greening has been widely documented, ecosystem responses remain spatially heterogeneous and include both vegetation expansion and degradation (Kropp et al., 2025; Frost et al., 2025).

The aim of our study is to investigate the spatial patterns of Arctic ecosystem dynamics over the past four decades in relation to recent climate warming and permafrost degradation, using multi-temporal satellite observations and spatial analysis techniques. Time series of satellite-derived vegetation (NDVI, GNDVI, SAVI, MSAVI, EVI) and water indices (NDWI, AWEIsh) from Landsat (1984–2025) and MODIS (2000-2025) were analyzed to identify trends and anomalies in vegetation productivity and surface water dynamics. The analysis was conducted using a reproducible workflow based on the Microsoft Planetary Computer STAC and automated Python scrips, enabling efficient data extraction and consistent processing across temporal and spatial scales.

Results reveal widespread greening across large areas of the Arctic tundra, with a general increase up to 0.03 – 0.04 in vegetation indices. However, localized browning and declining vegetation are observed in areas affected by permafrost thaw, surface subsidence, and altered hydrological regimes. Contrasting patterns are also revealed by water indices, with increasing values indicating the formation of new lakes, and decreasing values associated with drainage or vegetation encroachment. These patterns highlight strong spatial linkages between climate warming, permafrost dynamics, and ecosystem response.

Overall, this study emphasizes that Arctic ecosystem change is characterized by complex and heterogenous trend and underscores the importance of spatially explicit monitoring frameworks for assessing Arctic ecosystem vulnerability and resilience under ongoing climate change.


Acknowledgement

This project has received funding from the European Union’s Horizon 2020 research and innovation programme under grant agreement No. 101086386, EO-PERSIST - A Cloud-Based Remote Sensing Data System for Promoting Research and Socioeconomic Studies In Arctic Environments (https://www.eo-persist.eu).


References

  • Biskaborn et al. (2019). Permafrost is warming at a global scale. Nature Communications, 10(1), 264. https://doi.org/10.1038/s41467-018-08240-4
  • Calvin et al. (2023). IPCC, 2023: Climate Change 2023: Synthesis Report. Contribution of Working Groups I, II and III to the Sixth Assessment Report of the Intergovernmental Panel on Climate Change [Core Writing Team, H. Lee and J. Romero (eds.)]. IPCC, Geneva, Switzerland. (First). Intergovernmental Panel on Climate Change (IPCC). https://doi.org/10.59327/IPCC/AR6-9789291691647
  • Frost, G. V. et al. (2025). The changing face of the Arctic: Four decades of greening and implications for tundra ecosystems. Frontiers in Environmental Science, 13. https://doi.org/10.3389/fenvs.2025.1525574
  • Kropp, H. et al. (2025). Heterogeneous long-term changes in larch forest and shrubland cover in the Kolyma lowland are not captured by coarser-scale greening trends. Environmental Research: Ecology, 4(1), 015002. https://doi.org/10.1088/2752-664X/ada8b1
  • Rantanen et al. (2022). The Arctic has warmed nearly four times faster than the globe since 1979. Communications Earth & Environment, 3(1), 168. https://doi.org/10.1038/s43247-022-00498-3

How to cite: Vîrghileanu, M., Daia-Creinicean, T., Berbecariu, A., Bizdadea, C.-G., Miron, F., and Șandric, I.: Spatial patterns of Arctic ecosystem changes under recent climate warming and permafrost degradation, EGU General Assembly 2026, Vienna, Austria, 3–8 May 2026, EGU26-16981, https://doi.org/10.5194/egusphere-egu26-16981, 2026.

EGU26-17197 | ECS | Orals | BG3.17

Plant belowground traits reflect increased plant-mediated methane transport along a peatland permafrost thaw gradient 

Tiia Määttä, Jalisha Theanutti Kallingal, Samantha Bosman, Jeffrey Chanton, Suzanne Hodgkins, Rachel Wilson, Ruth Varner, and Avni Malhotra

Permafrost thaw in subarctic peatlands alters ecosystem methane (CH4) fluxes. Collapsing permafrost peat plateaus (palsas) change soil hydrology, oxygen availability, and vegetation composition, and each of these factors contribute to net CH4 flux by influencing CH4 production, consumption and transport. However, changes in plant-mediated CH4 fluxes have mostly been estimated with aboveground characteristics, such as biomass and leaf area, leaving belowground parts (roots and rhizomes) understudied despite their direct contact to depth-dependent CH4 flux processes. Here, we explored the potential of using root and rhizome traits as proxies for plant-mediated CH4 cycling along a peatland permafrost thaw gradient in subarctic Sweden. We investigated changes in plant belowground traits along the thaw gradient and the relationships between root and rhizome biomass, surface area (SA), diameter, tissue density (TD), and specific root length (SRL), and early, middle, peak and season median CH4 fluxes by utilizing chamber CH4 flux and pore water CH4 concentration and isotopic measurements during the productive season. Shrub SRL, diameter and isotopic data suggested increased plant-mediated carbon substrates for acetoclastic methanogenesis along the thaw gradient. Root TD (root porosity proxy) decreased with thaw and had negative correlations with CH4 fluxes throughout the season, and together with positive herbaceous rhizome SA-CH4 flux associations and lower pore water CH4 concentrations in the fully thawed stage. These results indicated increasing herbaceous plant-mediated transport of acetoclastically-produced CH4 with thaw. Altogether, while confirming previous findings of increased plant-mediated acetoclastic methanogenesis with thaw, this study also demonstrated the benefit of belowground traits in revealing new aspects of plant-mediated CH4 cycling in permafrost peatlands.

How to cite: Määttä, T., Kallingal, J. T., Bosman, S., Chanton, J., Hodgkins, S., Wilson, R., Varner, R., and Malhotra, A.: Plant belowground traits reflect increased plant-mediated methane transport along a peatland permafrost thaw gradient, EGU General Assembly 2026, Vienna, Austria, 3–8 May 2026, EGU26-17197, https://doi.org/10.5194/egusphere-egu26-17197, 2026.

Microbial carbon use efficiency (CUE) is a cornerstone metric for predicting soil organic carbon (SOC) storage globally. However, its predictive power in vulnerable frozen boreal forests, where physical preservation can override biological processing, remains a critical unknown. Here, we investigated the CUE-SOC relationship across the climatically sensitive permafrost transitional zone in the Greater Khingan Mountains. Our results revealed a stark dichotomy that challenges the universal applicability of this microbial efficiency–SOC paradigm. In the warmer, non-permafrost soils, microbial CUE was the primary positive driver of SOC accumulation, consistent with global patterns. Conversely, this relationship completely vanished in adjacent permafrost soils, in which SOC accumulation was decoupled from microbial efficiency and was instead overwhelmingly controlled by high retention of plant carbon residues (e.g., NDVI, particulate organic matter) and their physical cryo-preservation. This fundamental decoupling of microbial processing from soil carbon storage demonstrated that the biogeochemical rules governing SOC in much of the world do not apply in these frozen landscapes. Our findings provide critical mechanistic evidence that ecosystem carbon model must shift priority toward controls on plant inputs and physical cryo-preservation over microbial CUE to accurately forecast the fate of the vast and vulnerable northern carbon stocks in a future climate.

How to cite: Zhou, X. and Kong, T.: Decoupling of microbial carbon use efficiency from soil carbon storage in boreal forests, EGU General Assembly 2026, Vienna, Austria, 3–8 May 2026, EGU26-17692, https://doi.org/10.5194/egusphere-egu26-17692, 2026.

EGU26-20267 | ECS | Orals | BG3.17

Global warming driving increased winter CO2 emissions in the Northern Hemisphere permafrost region 

Yuguo Wei, Cuicui Mu, Deliang Chen, Xiaoxiao Mo, Bo Elberling, Wenxin Zhang, Guofei Zhang, Chunling Zhang, Kun Li, Xiaodong Li, Mingming Shi, Mei Mu, Xufeng Wang, Da Wei, Tianbao Dou, Xinlong Du, Xiaoqing Peng, Yanxiang Jin, Jingfeng Xiao, and Philippe Ciais

Global warming accelerates the breakdown of carbon stored in permafrost regions, releasing it into the atmosphere and amplifying climate change, particularly during winter when photosynthesis ceases. The Northern Hemisphere's permafrost is primarily concentrated in two key regions — the Arctic and the Tibetan Plateau — each with distinct environmental characteristics. However, previous studies often treat these regions separately, missing the opportunity to compare their winter CO2 emissions within a unified framework. Here, we synthesized 2,487 monthly CO2 flux measurements from 166 in-situ sites to quantify the spatial and temporal variations and key drivers of winter CO2 emissions in these two regions. Our analysis reveals that combined winter emissions from the Arctic and Tibetan Plateau are estimated to be 1,289 ± 25 Tg C yr-1. From 1982 to 2022, winter CO2 emissions increased by 2.10 ± 0.23 Tg C yr-1. Notably, since 2001, winter CO2 emissions have surged in the Arctic while declining in the Tibetan Plateau. The driving factors also differ: soil temperature dominates in the Arctic (51%), whereas soil moisture plays the most significant role on the Tibetan Plateau (33%). These findings highlight the contrasting mechanisms governing winter carbon emissions in these regions and underscore the importance of incorporating region-specific factors when predicting permafrost-carbon feedbacks in a warming world.

How to cite: Wei, Y., Mu, C., Chen, D., Mo, X., Elberling, B., Zhang, W., Zhang, G., Zhang, C., Li, K., Li, X., Shi, M., Mu, M., Wang, X., Wei, D., Dou, T., Du, X., Peng, X., Jin, Y., Xiao, J., and Ciais, P.: Global warming driving increased winter CO2 emissions in the Northern Hemisphere permafrost region, EGU General Assembly 2026, Vienna, Austria, 3–8 May 2026, EGU26-20267, https://doi.org/10.5194/egusphere-egu26-20267, 2026.

EGU26-21349 | Posters on site | BG3.17

Modeling year-round CO₂ fluxes and winter subsurface CO₂ dynamics in an Arctic heath ecosystem, West Greenland 

Wenxin Zhang, Birgitte Danielsen, and Bo Elberling

Carbon exchange in Arctic ecosystems shows strong seasonality, yet winter processes remain poorly constrained despite their potential importance for annual carbon budgets. In permafrost regions, CO₂ produced in the active layer during late summer and autumn may accumulate beneath frozen soil and snow cover, when gas diffusion to the atmosphere is restricted. Observed wintertime increases in subsurface CO₂ concentrations therefore raise the question of whether they primarily reflect reduced diffusivity or enhanced CO₂ production under relatively warm subnival conditions.

We combined year-round eddy covariance measurements of ecosystem CO₂ exchange, growing-season chamber flux observations, and winter subsurface CO₂ concentration profiles from an Arctic heath ecosystem on Disko Island, West Greenland, to constrain the process-based CoupModel. The model represents soil CO₂ production and transport as functions of soil temperature, moisture, air-filled porosity, and CO₂ concentration, allowing winter physical controls on gas diffusion to be explicitly evaluated.

The calibrated model reproduces observed vertical soil CO₂ concentration patterns between 10 and 80 cm depth as well as the seasonal dynamics of ecosystem CO₂ fluxes. Simulations indicate that elevated winter subsurface CO₂ concentrations are largely explained by reduced gas diffusivity in frozen and snow-covered soils, while the direct influence of high CO₂ concentrations on production rates is limited. Laboratory measurements of CO₂ diffusion under frozen and unfrozen conditions support the strong sensitivity of gas transport to changes in air-filled porosity.

Interannual variability in snow conditions exerts a strong control on non-growing-season CO₂ emissions. Winters with unusually deep snowpacks show substantially higher CO₂ efflux, reducing the annual net CO₂ sink. In contrast, warmer and wetter growing seasons enhance both gross primary production and ecosystem respiration, partially compensating for increased winter losses. These results underline the importance of winter soil physical processes for Arctic carbon dynamics and illustrate how combining observations with process-based modelling can improve estimates of year-round CO₂ exchange.

How to cite: Zhang, W., Danielsen, B., and Elberling, B.: Modeling year-round CO₂ fluxes and winter subsurface CO₂ dynamics in an Arctic heath ecosystem, West Greenland, EGU General Assembly 2026, Vienna, Austria, 3–8 May 2026, EGU26-21349, https://doi.org/10.5194/egusphere-egu26-21349, 2026.

EGU26-21405 | ECS | Posters on site | BG3.17

Permafrost peatland dynamics during the Holocene: evidence of palsa transformation at Šuoššjávri, northern Norway 

Harry Roberts, Michał Słowiński, Katarzyna Marcisz, Piotr Kołaczek, Daniel Coathup, Anders Lyngstad, Jan Kucharzyk, Mateusz Grygoruk, and Mariusz Lamentowicz

As scientists continue to better understand climate change, it is becoming increasingly apparent that ecosystems around the polar regions are warming at an accelerating rate. This poses a particular problem for climate-sensitive ecosystems, particularly permafrost peatlands. Permafrost peatlands are an exceptionally important ecosystem for carbon storage. representing ~45% of soil organic carbon in northern peatlands; however, as cooler conditions are imperative for preserving carbon-rich permafrost sediment, these peatlands are extremely vulnerable to warming. Degradation of permafrost peatlands could be damaging, as thawing permafrost turns the ecosystem into a source of carbon dioxide (CO2), and subsequent waterlogging of the surface can increase methane. The long-term effects of permafrost degradation remain uncertain; as warming trends continue, permafrost thaw is expected to create a positive feedback loop which would further accelerate climate change. However, thawed permafrost peatlands also have the potential to create a negative feedback loop; productivity and peat/carbon accumulation rates can benefit from the increased nutrient availability and the proliferation of wetland habitats resulting from thawed permafrost.

The focus of this study is Šuoššjávri, a palsa mire located in northern Norway, within the discontinuous permafrost zone. Our project aims to assess the formation/collapse of palsas, their relationships with fire regimes and climate change, and their impacts on in-situ vegetation and carbon storage. We collected three peat cores in a ~10m transect from the top of a palsa to a thermokarst pond, around 3m apart. These cores were analysed using multiple palaeoecological proxies at high resolution (1 cm contiguous samples), to reconstruct past fire frequency, vegetation, hydrological change, and carbon storage over the past ~5000 years.

We hypothesise that (1) regional climatic warming has accelerated palsa degradation at Šuoššjávri, expressed through coupled shifts in ground subsidence, hydrological regime, vegetation composition, and a long-term decline in carbon accumulation; (2) hydrological reorganisation, reconstructed from plant macrofossils and peat physicochemical properties, is the dominant mechanism controlling vegetation succession during palsa destabilisation and collapse; and (3) early warning signals of an approaching critical transition—manifested as local wetting, directional vegetation change, and transient increases in carbon accumulation—systematically precede major palsa collapse events in the palaeoecological record.

This study is funded by NCN project no. 2021/41/B/ST10/00060

How to cite: Roberts, H., Słowiński, M., Marcisz, K., Kołaczek, P., Coathup, D., Lyngstad, A., Kucharzyk, J., Grygoruk, M., and Lamentowicz, M.: Permafrost peatland dynamics during the Holocene: evidence of palsa transformation at Šuoššjávri, northern Norway, EGU General Assembly 2026, Vienna, Austria, 3–8 May 2026, EGU26-21405, https://doi.org/10.5194/egusphere-egu26-21405, 2026.

EGU26-1807 | ECS | Posters on site | BG3.19

Plant Trait-Mediated Water-table Thresholds in Peatland Carbon Flux Dynamics 

Heyu Chen, Dominik Bittner, Liam Thompson, Yongxing Ren, Astley Hastings, and Mohamed Abdalla

Peatlands are central to climate mitigation strategies; however, existing management approaches and process-based modelling methods often rely on oversimplified assumptions about how water table depth (WTD) regulates carbon fluxes. This study used long-term flux observation data spanning distinct peatland ecosystems and vegetation functional traits to quantify the nonlinear response of methane and carbon dioxide emissions to the water-table gradient. We employed a hierarchical, segmented linear mixed-effects model accounting for site heterogeneity and identified consistent, transition-state-like variations in the flux-water table relationship that across peatlands.

Methane exhibited stronger threshold behaviour (~-15.2 cm) than carbon dioxide, with trait-related variations suggesting plant-mediated gas transport prolongs methane sensitivity at deeper water levels. In contrast, ecosystem respiration (Rs) exhibited a more gradual response until reaching the surface, with less separation between trait groups, highlighting differences in the control mechanisms of CH₄ and CO₂ emission processes.

Our findings provide an observation-based foundation for defining hydrological “windows” capable of balancing greenhouse gas emissions. This trait-based WTD-flux approach offers actionable targets for ecological restoration and water level management, while establishing a generalisable method for diagnosing ecohydrological controls on greenhouse gas exchange. Moreover, the results help explain why similar hydrological interventions may yield markedly different climate outcomes across varying vegetation compositions and wetland environments.

How to cite: Chen, H., Bittner, D., Thompson, L., Ren, Y., Hastings, A., and Abdalla, M.: Plant Trait-Mediated Water-table Thresholds in Peatland Carbon Flux Dynamics, EGU General Assembly 2026, Vienna, Austria, 3–8 May 2026, EGU26-1807, https://doi.org/10.5194/egusphere-egu26-1807, 2026.

EGU26-2525 | ECS | Orals | BG3.19

From subsidence to carbon emission: a conceptual and remote sensing-based framework for quantifying peatland carbon loss 

Pouya Ghezelayagh, Andrzej Kamocki, Piotr Banaszuk, and Mateusz Grygoruk

Peatland degradation fundamentally shifts these ecosystems from carbon (C) sinks to major C sources; yet large-scale emission estimates remain highly uncertain due to the challenges of conducting field measurements. Carbon loss reduces the volume of peat, causing peat subsidence; therefore, a direct relationship exists between C emissions and surface displacement. The primary aim of this study is to establish a fully remote-sensing-based framework that links peat subsidence (detectable via satellite observations) to carbon emissions without requiring ground-based sampling. To operationalize this, three critical parameters are required: bulk density (BD), soil organic carbon (SOC), and the oxidation component of subsidence (the fraction of total subsidence attributable to oxidative peat loss). We developed a methodology to derive these parameters by integrating Sentinel-1 InSAR subsidence data with spatially distributed peatland typologies from global archives and empirical relationships between groundwater levels, subsidence, and oxidation. Applying this framework across the Biebrza Valley peatlands in northeastern Poland, we observed a mean annual subsidence rate of 1.4 cm.yr-1. The derived parameters averaged ~35% for the oxidation component, 120 kg.m-3 for BD, and 389 g-C.kg-1 for SOC. Validation against field surveys confirmed high accuracy, with normalized differences for peat properties remaining below 0.14. The framework yielded a mean emission estimate of 7.49 ± 3.6 tons.CO2-eq.ha-1.yr-1. Notably, this framework aligns more closely with field-validated parameters than the “common approach” (using constant BD and SOC values), which was found to overestimate emissions at 14.49 tons.CO2-eq.ha-1.yr-1. This framework offers a scalable and cost-effective solution for assessing carbon emissions from peatlands, particularly in areas where field access is limited. Its application across diverse peatland types could support continental-scale emission estimations and peat carbon inventories for climate mitigation, as well as evaluating restoration planning.

How to cite: Ghezelayagh, P., Kamocki, A., Banaszuk, P., and Grygoruk, M.: From subsidence to carbon emission: a conceptual and remote sensing-based framework for quantifying peatland carbon loss, EGU General Assembly 2026, Vienna, Austria, 3–8 May 2026, EGU26-2525, https://doi.org/10.5194/egusphere-egu26-2525, 2026.

EGU26-4186 | ECS | Posters on site | BG3.19

Effect of subsurface irrigation on greenhouse gas emissions and yield on a boreal agricultural drained peatland 

Milla Niiranen, Miika Läpikivi, Hermanni Aaltonen, Stephanie Gerin, Henriikka Vekuri, Liisa Kulmala, Juho Kinnunen, and Maarit Liimatainen

Drained agricultural peatlands are a major source of greenhouse gas (GHG) emissions in Finland and globally, and increasing pressure is being placed on their management in the context of climate change mitigation targets. Drainage, fertilization, and other management practices accelerate the decomposition of soil organic matter, leading to the release of carbon dioxide (CO₂) and nitrous oxide (N₂O) into the atmosphere. Raising the groundwater table through subsurface irrigation or ditch blocking has been proposed as a mitigation measure for intensively managed peatlands. However, field-based evidence remains limited, particularly from northern regions, and results vary across studies. Key concerns include whether the water table depth can be maintained sufficiently shallow during the growing season considering the needs of crop and management, and whether reductions in CO₂ emissions may be offset by enhanced methane (CH₄) and N₂O emissions under wetter soil conditions.

To address these uncertainties, a field-scale subsurface irrigation system was established at the NorPeat research facility in Ruukki, Finland (64.68°N, 25.11°E), operated by the Natural Resources Institute Finland (Luke). The field is a 26-ha cultivated peatland under a grass intensive crop rotation for beef cattle feed production and is divided into eight drainage blocks (2.5-3.9 ha each). Peat depth at the site ranges from 20 to 80 cm, with sulfidic material occurring below one meter depth. Since 2022, a water storage reservoir (9000 m3) has been connected to the subsurface drainage system, allowing block-specific subsurface irrigation. During grass cultivation years, the target for groundwater table has been at approximately 30 cm depth.

Greenhouse gas fluxes have been measured year-round since 2019 using chamber, snow-gradient, and eddy covariance methods, complemented by floating chamber measurements in open ditches. In addition, other environmental variables have been monitored intensively, with continuous measurements of soil moisture and water table depth.

In the presentation, we will show whether GHG emissions can be reduced by subsurface irrigation under field-scale management conditions, whether the mitigation effect depends on peat depth, and how the irrigation affects crop yields.

How to cite: Niiranen, M., Läpikivi, M., Aaltonen, H., Gerin, S., Vekuri, H., Kulmala, L., Kinnunen, J., and Liimatainen, M.: Effect of subsurface irrigation on greenhouse gas emissions and yield on a boreal agricultural drained peatland, EGU General Assembly 2026, Vienna, Austria, 3–8 May 2026, EGU26-4186, https://doi.org/10.5194/egusphere-egu26-4186, 2026.

EGU26-4287 | ECS | Posters on site | BG3.19

CHASY LOCO: low-cost measurement of GHG fluxes in tropical peatlands 

Hauke Schmülling, Gerald Jurasinski, Samer Elshehawi, Asadhu Ssebyoto, Therese Ave Maria, and Mathias Hoffmann

GHG flux measurement techniques have been around for decades, but field measurements still rely on expensive analyzers. This may be one of the reasons for the relatively low number of GHG exchange studies from tropical peatlands compared to temperate peatlands. CHASY LOCO (chamber system low-cost) is a new device with the mission to change that. Based on Arduino and low-cost sensors for CO2 (Senseair K30 FR) and CH4 (Figaro TGS2611-C00), a whole chamber system should become available for less than €1,000. The first edition (built in 2025 at ZALF) contains a well-transportable transparent chamber with the dimensions of 30x30x50 cm3, so natural and drained peatlands with small vegetation can be surveyed.

In 2026, CHASY LOCO’s use cases are being tested in tropical non-forested peatlands of three countries: Starting with Rwanda and Uganda, the high percentage of drained peatlands causes potentially more than 50% of the national emissions, but so far, they are calculated based on international emission factors. Hence, as part of the project "Peat4People", GHG flux data acquired by CHASY LOCO could specify these numbers. Furthermore, there are no GHG emission data from pristine Andean peatlands in Bolivia yet, which is why CHASY LOCO will be applied there in the second half of 2026.

Here, we would like to discuss the initial results, challenges, and chances of CHASY LOCO for measuring GHG fluxes in tropical peatlands.

How to cite: Schmülling, H., Jurasinski, G., Elshehawi, S., Ssebyoto, A., Ave Maria, T., and Hoffmann, M.: CHASY LOCO: low-cost measurement of GHG fluxes in tropical peatlands, EGU General Assembly 2026, Vienna, Austria, 3–8 May 2026, EGU26-4287, https://doi.org/10.5194/egusphere-egu26-4287, 2026.

EGU26-4799 | Orals | BG3.19

Paludiculture maintains peat formation potential in rewetted temperate fens 

Jürgen Kreyling, Katharina Zeterberg, Camiel Aggenbach, Johannes Kollmann, Wiktor Kotowski, Lukasz Kozub, Katharina Laage, Patrick Scheel, Rune Schmidt, Elke Seeber, Rudy van Diggelen, Anna Zaborowska, and Franziska Tanneberger

Drainage for agriculture has transformed temperate fen peatlands from carbon sinks into major carbon sources. Rewetting can halt this degradation, and the productive use of rewetted peatlands through paludiculture offers a promising sustainable land use strategy. However, historical drainage increases nutrient availability, which often remains elevated after rewetting. It is unknown how such nutrient conditions affect the potential of rewetted peatlands to form new peat, particularly under paludiculture use.

We studied rewetted fens across temperate Europe with varying land uses (no use, low- and high-intensity paludiculture) and nutrient availability (low in Carex-dominated sites, high in Typha-dominated sites and quantified by Ellenberg Indicator Values). Over two years, we measured belowground biomass production using root ingrowth cores and decomposition using litterbags, and calculated the peat formation potential as the standardized balance between these two processes.

We hypothesized that paludiculture does not reduce peat formation potential compared to no agricultural land use after rewetting, that nutrient enrichment affects both production and decomposition equally, and that water availability and nutrient levels are key drivers of these processes.

Paludiculture did not negatively affect peat formation potential in rewetted fens compared to non-used sites. Unexpectedly, belowground biomass production was higher in low-nutrient Carex-dominated sites than in high-nutrient Typha-dominated sites, while decomposition rates showed little difference across vegetation types and were lowest below moderate nutrient availability. Peat formation potential increased with a longer growing season, high water levels, and low nutrient availability. This is the first field-based study to quantify the balance of production and decomposition under different management and nutrient regimes in rewetted fens. The findings support the use of paludiculture on degraded, nutrient-rich fens to reduce nutrient loads and steering them to high peat formation potential, offering a sustainable solution for peatland restoration and agricultural land use.

How to cite: Kreyling, J., Zeterberg, K., Aggenbach, C., Kollmann, J., Kotowski, W., Kozub, L., Laage, K., Scheel, P., Schmidt, R., Seeber, E., van Diggelen, R., Zaborowska, A., and Tanneberger, F.: Paludiculture maintains peat formation potential in rewetted temperate fens, EGU General Assembly 2026, Vienna, Austria, 3–8 May 2026, EGU26-4799, https://doi.org/10.5194/egusphere-egu26-4799, 2026.

EGU26-5603 | ECS | Orals | BG3.19

Klimafarm - economically and ecologically viable grassland management that conserves peatland soil 

Sebastian F. A. Jordan, Christof Kluß, Tobias W. Donath, Elena Zydek, Tim Diekötter, and Friedhelm Taube

Germany’s goal to reach net zero by 2045 remains ambitious, and in order to achieve this, it is necessary to balance or drastically reduce a pool of residual emissions. The agricultural sector and the Land Use, Land Use Change and Forestry (LULUCF) sector are significant contributors to this pool, together ranking as the fourth largest anthropogenic source of greenhouse gases. Drained and converted peatlands are one of the largest emitters in this sector, despite their relatively small area. However, these areas are also part of another major challenge, the biodiversity crisis. Intensive farming and dairy farming are both based on monoculture and the massive application of fertilizer in both cases has a deleterious effect on biodiversity.

We introduce the Klimafarm, focusing particularly on its greenhouse gas monitoring; the project is one of the four funded German pilot initiatives (“Moorpiloten”) whose aim is to rewet agricultural peatlands and explore economically viable paludiculture methods for farmers. The Klimafarm project presents an innovative approach to simultaneously addressing two major challenges—reducing CO₂ emissions and mitigating biodiversity loss—through the implementation of extensive paludiculture on rewetted grasslands in Schleswig-Holstein, northern Germany. This aims to stop the degradation of organic rich soils and conserves the large carbon stocks during the rewetting of drained peatlands and seeks to mitigate biodiversity loss by implementing a system with a single cut per year within a diversified grassland ecosystem. In such a scenario paludiculture is enabling further usage of the land while reducing greenhouse gas emissions and restoring wetland-type ecosystems.

The project is comprised of three distinct components, with each group focusing on a different topic: the management of the farm and value chain development, biodiversity research and greenhouse gas monitoring. Here, we focus on the greenhouse gas monitoring, which is implemented on three project sites and two intensive used reference sites. We will detail our eddy covariance and chamber-based CH4, CO2, and N2O flux measurements, present our methodological framework, and discuss preliminary 2023-2025 data.

How to cite: Jordan, S. F. A., Kluß, C., Donath, T. W., Zydek, E., Diekötter, T., and Taube, F.: Klimafarm - economically and ecologically viable grassland management that conserves peatland soil, EGU General Assembly 2026, Vienna, Austria, 3–8 May 2026, EGU26-5603, https://doi.org/10.5194/egusphere-egu26-5603, 2026.

EGU26-6808 | Posters on site | BG3.19

The impacts of hydrological disturbance, tree encroachment, and mowing management on arbuscular mycorrhizal fungal communities in fen peatlands. 

Łukasz Kozub, Nina Trochanowska, Olsza Borys, Alicja Okrasińska, Julia Pawłowska, and Mateusz Wilk

Arbuscular mycorrhiza (AM) is one of the most widespread types of symbiosis on Earth and plays a key role in the functioning of many ecosystems, including potentially fen peatlands. Due to the scarcity of research on AM in peatlands, we do not know how the current anthropogenic hydrological disturbances of these ecosystems, as well as the associated overgrowth of shrubs and trees and the prevention of this process through mowing, may affect the communities of fungi participating in AM (AMF). In order to detect the potential impact of these factors on AMF, peat samples were collected from open and wooded areas within 24 peatlands with varying degree of hydrological disturbance in northern Poland. DNA was isolated from the peat and the SSU rDNA fragment was amplified and sequenced. In addition, the correlation between the composition of AMF communities and habitat variables such as climatic and chemical factors and plant community composition was examined. The composition of AMF communities differed significantly between hydrologically disturbed and undisturbed peatlands, with a higher number of OTUs and AMF reads detected in hydrologically disturbed peatlands, while no significant effect of overgrowth or conservation-related mowing on AMF communities was detected. The studied AMF communities were characterised by high beta diversity, and the potential impact of all studied habitat factors, including disturbances, accounted for a relatively small percentage of variance in the composition of these communities. The results suggest that although AMF communities are relatively resistant to habitat changes in fen peatlands, hydrological disturbance may affect them to some extent. Future studies could help determine whether further drainage will result in significant changes in the composition of AMF communities.

How to cite: Kozub, Ł., Trochanowska, N., Borys, O., Okrasińska, A., Pawłowska, J., and Wilk, M.: The impacts of hydrological disturbance, tree encroachment, and mowing management on arbuscular mycorrhizal fungal communities in fen peatlands., EGU General Assembly 2026, Vienna, Austria, 3–8 May 2026, EGU26-6808, https://doi.org/10.5194/egusphere-egu26-6808, 2026.

EGU26-6874 | ECS | Posters on site | BG3.19

Money4Moor: a comparative analysis of the costs of peatland restoration in Austria 

Raphael Müller, Greta Danko, and Ralf Nordbeck

Peatland restoration is increasingly recognized as a cost-effective way to reduce greenhouse gas emissions, and it is expected to play a key role in meeting national emission targets. In Austria, drained and cultivated organic soils are a significant potential source of emissions. However, there is currently a lack of comprehensive information on the cost-effectiveness of peatland restoration measures. Specifically, there is insufficient data on cost ranges, differences between restoration methods, and spatial factors that influence costs and effectiveness.

To address this gap, the Money4Moor project aims to systematically collect and analyze detailed cost data on peatland restoration and rewetting measures in Austria. The project will (i) compile a comprehensive database of restoration measures implemented since 2005 and (ii) analyze and categorize the costs, technical approaches, and spatial characteristics of restoration projects.

The ongoing data collection includes 44 peatland restoration projects implemented between 2007 and 2025 across eight Austrian provinces, excluding Vienna. Of these projects, 19 are in ombrotrophic bogs, 11 are in fens, and the remainder are in other peatlands. These projects vary substantially in scale, duration, and cost, ranging from small maintenance measures to large-scale restoration projects. Most projects were short-term, with 11 completed within one year and only three extending beyond six years.

First evaluations of 19 projects (14 ombrotrophic bogs, 5 fens) resulted in the following cost distribution. Annual restoration costs ranged from €2,600 to €246,000 for ombrotrophic bogs (mean: €60,300; median: €23,500) and from €7,600 to €400,000 for fens (mean: €92,000; median: €12,500). Next steps will allocate restoration costs to restored areas to improve comparability, include further spatial analyses to assess regional cost differences and the categorization of costs. By enhancing data availability and transparency, the project aims to support robust cost-effectiveness assessments and evidence-based decision-making for peatland restoration and climate policy.

This project is funded by the Climate and Energy Fund and is carried out under the program Austrian Climate Research Programme Implementation 2024 (ACRPI, Nr.: KC511213).

How to cite: Müller, R., Danko, G., and Nordbeck, R.: Money4Moor: a comparative analysis of the costs of peatland restoration in Austria, EGU General Assembly 2026, Vienna, Austria, 3–8 May 2026, EGU26-6874, https://doi.org/10.5194/egusphere-egu26-6874, 2026.

EGU26-8133 | ECS | Posters on site | BG3.19

Impacts of bund construction and Sphagnum reintroduction on peatland CO₂ and CH₄ fluxes: insights from field monitoring and mesocosm experiments 

Wenlue Miao, Jonathan Ritson, Emma Shuttleworth, and Martin Evans

Peatlands are a major component of the global carbon cycle, storing large quantities of soil carbon. However, widespread drainage and land-use change have degraded many peatland systems, converting them from net carbon sinks into important sources of greenhouse gases. Water-table lowering is a key mechanism underlying this shift, as enhanced oxygen availability accelerates peat decomposition and alters CO₂ and CH₄ fluxes. Although restoration is widely promoted, the effectiveness of specific interventions—particularly bund construction and Sphagnum reintroduction—in regulating greenhouse gas emissions remains insufficiently understood.


To address this knowledge gap, we combined long-term field monitoring with controlled mesocosm experiments to assess the effects of bund construction and Sphagnum reintroduction on peatland CO₂ and CH₄ fluxes. Field measurements were conducted at Holcombe Moor, a blanket bog in Greater Manchester, northern England, UK. Continuous water-table depth was recorded to capture hydrological responses to restoration, alongside biweekly chamber-based measurements of CO₂ and CH₄ fluxes across restored and control plots. Flux measurements were conducted under contrasting light conditions to partition net ecosystem exchange into photosynthetic and respiratory components, with accompanying measurements of temperature and pH to characterise key environmental controls.


To enable controlled manipulation of key variables, a mesocosm experiment using intact peat cores was established to disentangle hydrological and vegetation controls under controlled conditions. Mesocosms were planted with either native graminoids or reintroduced Sphagnum and subjected to contrasting water-table treatments. Greenhouse gas fluxes were measured biweekly. Additional biogeochemical indicators, including dissolved organic and inorganic carbon, iron speciation (Fe²⁺/Fe³⁺), and phenolic compounds, were quantified through laboratory analyses, with DOC and DIC measured using a total organic carbon (TOC) analyser, phenol content determined by FT-IR spectroscopy, and iron speciation assessed using the ferrozine assay.


The field monitoring design incorporated both spatial and temporal contrasts, with greenhouse gas fluxes measured concurrently at restored (treatment) and unrestored (control) plots, as well as repeatedly at the same plots before and after bund construction. This design provides the basis for quantifying treatment effects relative to background temporal variability. Owing to the availability of pre- and post-treatment observations, treatment effects will be quantified using a combination of Before–After Control–Impact (BACI) and progressive-change BACIPS approaches.

How to cite: Miao, W., Ritson, J., Shuttleworth, E., and Evans, M.: Impacts of bund construction and Sphagnum reintroduction on peatland CO₂ and CH₄ fluxes: insights from field monitoring and mesocosm experiments, EGU General Assembly 2026, Vienna, Austria, 3–8 May 2026, EGU26-8133, https://doi.org/10.5194/egusphere-egu26-8133, 2026.

Wetlands are recognized as critical carbon sinks and effective nature-based solutions for climate change mitigation. However, in many regions, wetland areas and their functions have significantly diminished due to agricultural expansion and land-use changes. This study aimed to identify potential wetlands based on a topo-climatic index and quantitatively assess the carbon sequestration capacity of restoring these areas­–currently used croplands–back to wetland ecosystems. We employed LPJ-GUESS, a process-based dynamic global vegetation model (DGVM) with ERA5-Land reanalysis climate data at a 0.1o resolution for the period 1950–2024 (75 years) and land use maps constructed based on Landsat images. To quantify the carbon benefits, we performed a comparative analysis between two scenarios: a baseline scenario maintaining current land use, and a restoration scenario where potential wetlands within agricultural lands are reverted to natural wetlands. Results indicate that at the national and regional scales, the difference of net ecosystem-atmosphere exchange (NEE) between two scenarios (ΔNEE) appeared minimal. This is likely because the restoration effects were limited by spatial averaging, as the proportion of restored wetlands remained below 5% at these national or regional scales. In contrast, at the single-pixel scale (0.1o) where the wetland restoration ratio reached approximately 35%, the carbon sequestration effect was significant, showing an increase of up to 0.37 kgC m-2. This suggests that wetland restoration can serve as an effective nature-based solution in croplands adjacent to rivers. However, given that the full carbon sequestration potential of wetlands often manifests over timescales exceeding a century, our 75-year simulation provides a conservative estimate. Therefore, we emphasize the necessity of long-term simulations incorporating future climate change scenarios to comprehensively evaluate the sustained efficacy of wetland restoration.

Acknowledgements: This work was jointly supported by the National Research Foundation of Korea (NRF) grant funded by the Korea government (MSIT) (RS-2024-00416443), and by the Korea Environmental Industry & Technology Development Project, funded by Korea Ministry of Climate, Energy and Environment (MCEE) (RS-2022-KE002066).

How to cite: Lee, S. C., Kim, D., and Jang, S. H.: Quantifying carbon sequestration capacity of potential wetland restoration in South Korea using a high-resolution dynamic vegetation model, EGU General Assembly 2026, Vienna, Austria, 3–8 May 2026, EGU26-8843, https://doi.org/10.5194/egusphere-egu26-8843, 2026.

Pan-tropical peatlands are long-term soil carbon reservoirs and hotspots of carbon exchange, but widespread degradation has transformed many into carbon sources. Restoration is increasingly pursued to reverse these emissions and restore carbon sink function. However, the spatiotemporal heterogeneity of carbon budgets in post-restoration peatlands remains poorly quantified, limiting our ability to accurately assess mitigation potential and optimize management strategies.

Here we analyzed 23 years (2001-2023) of 0.1° gridded CO₂ and CH₄ flux data from CAMS across pan-tropical restored peatlands to characterize the complexity of post-restoration carbon dynamics. We examined spatial variability, temporal trajectories, and stage-dependent environmental drivers.

Carbon budgets in post-restoration peatlands exhibited substantial spatiotemporal heterogeneity. Overall, pan-tropical restored peatlands acted as a net carbon sink (mean = −29.7 t C ha⁻¹, 95% CI: −32.5 to −26.9), though regional patterns varied markedly. Restored Congo Basin (−29.6 t C ha⁻¹, 95% CI: −33.4 to −25.7) and Amazonian peatlands (−41.1 t C ha⁻¹, 95% CI: −45.4 to −36.7) consistently functioned as net sinks, whereas restored Southeast Asian peatlands remained net carbon sources (30.0 t C ha⁻¹, 95% CI: 20.8 to 39.2). The overall sink status reflects the larger spatial extent of Congo and Amazon sites. Temporally, carbon budgets followed non-linear trajectories, with peak sequestration occurring 10–15 years post-restoration before declining due to frequent fire events. Driver analysis revealed stage-specific management priorities: water management is critical in early stages (0-5 years) to support vegetation establishment and minimize carbon losses, while fire prevention becomes paramount in later stages (>15 years) as biomass accumulation increases flammability.

Using 23 years (2001–2023) of high-resolution (0.1°) pan-tropical data, we present a long-term assessment of post-restoration peatland carbon dynamics. Our findings reveal three critical insights for improving peatland restoration outcomes: (1) water table management is essential in early stages (0-5 years) to maximize carbon uptake; (2) peak sequestration occurs at 10-15 years, providing an optimal window for carbon crediting; and (3) fire prevention must be prioritized after 15 years to sustain gains. Incorporating this spatiotemporal complexity into carbon accounting frameworks can help refine mitigation strategies and enable stage-specific, regionally-adapted management that enhances long-term carbon sequestration.

How to cite: Mo, Y., Pan, B., Chen, D., and Lam, S. K.: Spatiotemporal heterogeneity and nonlinear recovery trajectories of carbon budgets in restored pan-tropical peatlands, EGU General Assembly 2026, Vienna, Austria, 3–8 May 2026, EGU26-8858, https://doi.org/10.5194/egusphere-egu26-8858, 2026.

EGU26-10980 | Posters on site | BG3.19

PeatTransform: Supporting the Transition of the Peat Sector towards Climate Neutrality in Latvia 

Inga Retike, Normunds Stivrins, Andis Lazdins, Anda Zakenfelde, Raimonds Kasparinskis, Maris Turks, Edgars Rubauskis, Sanita Zute, and Dainis Jakovels

Peatlands play a key role in climate regulation, biodiversity, and regional development, yet drained and degraded peatlands are also major sources of greenhouse gas (GHG) emissions and a priority within current European Union climate and restoration policies. In Latvia, drained organic soils account for more than half of net LULUCF emissions, while the country remains one of Europe’s leading peat producers. National GHG inventories still rely largely on default emission factors and limited field data, resulting in a limited understanding of how hydrology, restoration, and land-use history influence emissions.

PeatTransform is a newly launched interdisciplinary research project supporting the transition of Latvia’s peat sector towards climate neutrality. The project integrates closely linked research themes, including improved GHG emission calculation methods for managed peatlands based on nationally specific emission factors and enhanced data acquisition, and the testing of restoration approaches at experimental and demonstration sites to quantify GHG mitigation potential and biodiversity responses. In parallel, the project develops climate-neutral technologies and products like peat substitutes and carbon-storing materials. Socio-economic impacts of peat extraction and processing are assessed to inform long-term transition scenarios up to 2050.

A central component of PeatTransform is the co-development of science-based recommendations for Latvia’s national policy framework. The project works closely with stakeholders, including public authorities and the peat industry, to translate research results into practical guidance for peatland restoration, land-use planning, emission reduction and just transition strategies.

Project PeatTransform – “Research and Innovation Based Solutions to Support the Peat Sector’s Transition to a Climate Neutral Economy, Promoting the Sustainable Use of Latvia’s Natural Resources” is implemented under the European Union Cohesion Policy Programme for 2021–2027, Specific Objective 6.1.1 “Mitigation of the economic, social and environmental impacts of the transition to climate neutrality in the most affected regions”, Measure 6.1.1.2 “Research development for the sustainable use of natural resources related to environmental and climate goals” with co-funding from the European Union and the State Budget of Latvia (6.1.1.2/1/25/A/001).

How to cite: Retike, I., Stivrins, N., Lazdins, A., Zakenfelde, A., Kasparinskis, R., Turks, M., Rubauskis, E., Zute, S., and Jakovels, D.: PeatTransform: Supporting the Transition of the Peat Sector towards Climate Neutrality in Latvia, EGU General Assembly 2026, Vienna, Austria, 3–8 May 2026, EGU26-10980, https://doi.org/10.5194/egusphere-egu26-10980, 2026.

EGU26-11142 | ECS | Orals | BG3.19

Ecosystem dynamics in boreal cutover peatlands restored and reused for photovoltaic production 

Che Liu, Maarit Raivonen, Erkka Rinne, Ville Tuominen, Tuula Aalto, Tiina Markkanen, Suvi Orttenvuori, and Annalea Lohila

In Finland there are tens of thousands of hectares of drained peat extraction sites (‘cutover peatlands’) in which the extraction has recently ceased, leaving an amount of peat still on site. Restoration and productive reuse of such cutover peatlands and related research on their impact have been ongoing for studying and mitigating greenhouse gas (GHG) emissions, sustaining wetland ecosystem services, and developing local economy. Such comprehensive restoration and paludicultural reuse often include rewetting, vegetation restoration (with fertilisation if necessary), solar or wind power production, and/or agricultural (including husbandry) use provided that the vegetation regenerates sufficiently. In the current EU-funded project ‘AurinkoSuo’, we use modelling tools to investigate the dynamics of carbon dioxide and methane emissions, vegetation regeneration, peat carbon pools, and net ecosystem production (NEP) during peat extraction, vegetation restoration, and reuse for photovoltaic production in cutover peatlands in southwestern Finland. We modified land surface model JSBACH for cutover peatlands, coupled it with peatland GHG model HIMMELI, and used the coupled model to simulate the aforementioned dynamics over 1996—2055. The model was parameterized using specific literature on cutover peatlands and information on our study sites, and the climate forcing inputs were obtained from the Coupled Model Intercomparison Project Phase 6 (CMIP6) in the scenario of Shared Socioeconomic Pathway (SSP) 1-2.6. The panels’ shading effects on the ground vegetation were modelled and implemented into our simulation. The simulation included different combinations of water table depths, shading effects, and biomass removal (mimicking crop harvesting or husbandry use). Our work is among the first attempts to model the GHG- and vegetation-related processes in WPG paludiculture spanning over the historical peat extraction to the future with changing climate.

How to cite: Liu, C., Raivonen, M., Rinne, E., Tuominen, V., Aalto, T., Markkanen, T., Orttenvuori, S., and Lohila, A.: Ecosystem dynamics in boreal cutover peatlands restored and reused for photovoltaic production, EGU General Assembly 2026, Vienna, Austria, 3–8 May 2026, EGU26-11142, https://doi.org/10.5194/egusphere-egu26-11142, 2026.

EGU26-13560 | ECS | Posters on site | BG3.19

Soil-atmosphere CH4 and CO2 fluxes of multiple peatland forests simulated with JSBACH-HIMMELI model  

Ellinoora Ekman, Xuefei Li, Antti Leppänen, Tuula Aalto, Jani Anttila, Jyrki Jauhiainen, Raija Laiho, Annalea Lohila, Tiina Markkanen, Kari Minkkinen, Raisa Mäkipää, Paavo Ojanen, Meeri Pearson, Mikko Peltoniemi, Anuliina Putkinen, and Maarit Raivonen

Around half of the European peatlands are drained, and in Finland, most of them are drained for forestry. Drainage degrades the soil organic matter (SOM) and lowers the soil water-table level (WTL), increasing oxygen levels in the soil. This suppresses the production and increases in-soil oxidation of methane (CH4) but enhances the decomposition of SOM, accelerating aerobic soil respiration. Consequently, emissions of CH4 from soil to the atmosphere may decrease while those of CO2 may increase. Process-based models are useful in estimating greenhouse gas emissions and sinks from large areas.  In previous modelling studies, the focus has mainly been on pristine peatlands with high CH4 emissions. However, simulations of soil CH₄ and CO₂ fluxes of multiple forestry-drained peatland sites over several years that are compared with measurement data remain still scarce.

We simulated the soil-atmosphere CH4 and CO2 fluxes from six Finnish forestry-drained peatlands with a process-based model, JSBACH (Jena Scheme for Biosphere–Atmosphere Coupling in Hamburg) coupled with a peatland CH4 model, HIMMELI (HelsinkI Model of MEthane buiLd-up and emission). Our aim was to better understand and evaluate the accuracy of the predicted soil CO2 and CH4 fluxes from multiple peatland forest sites, and to identify the sources of uncertainty in the modelled fluxes. To do this, we used WTL and chamber flux data measured over 2-5 years from each site.

The average modelled soil CO2 fluxes varied between 0.7 and 1.42 µmol m-2 s-1 among the sites. The model overestimated emissions in two sites and underestimated them in three sites. The mean differences between model and measurement varied from 0.05 to 2.02 µmol m-2 s-1 among all sites. There was a clear interannual variation on this. The average modelled CH4 fluxes varied between -1.09 and 3.77 nmol m-2 s-1 among the sites. The model underestimated sink or predicted occasional CH4 emission peaks in four sites. In turn, the CH4 sink was overestimated by the model in two sites. The measurements indicated all the sites being, on average, small sinks of CH4. The mean differences between modelled and measured CH4 fluxes were between 0.44 and 5.44 nmol m-2 s-1 among the sites. Generally high WTL of a site was associated with larger discrepancies between modelled and measured CH4 fluxes. The WTL was considered high for three sites (modelled WTL on average -30  – (-32) cm), and low for three sites (modelled WTL on average -42 – (-64) cm). We found that by tuning the CH4 production and oxidation parameters in the model, we can improve the prediction accuracy of the modelled CH4 fluxes.

The results of this work will be useful for further model development and when aiming to estimate soil CH4 and CO2 sinks and emissions of forestry-drained peatlands.

How to cite: Ekman, E., Li, X., Leppänen, A., Aalto, T., Anttila, J., Jauhiainen, J., Laiho, R., Lohila, A., Markkanen, T., Minkkinen, K., Mäkipää, R., Ojanen, P., Pearson, M., Peltoniemi, M., Putkinen, A., and Raivonen, M.: Soil-atmosphere CH4 and CO2 fluxes of multiple peatland forests simulated with JSBACH-HIMMELI model , EGU General Assembly 2026, Vienna, Austria, 3–8 May 2026, EGU26-13560, https://doi.org/10.5194/egusphere-egu26-13560, 2026.

EGU26-14902 | Orals | BG3.19

Assessing the mitigation of peat oxidation in Frisian managed pastures using mobile eddy covariance systems 

Bart Kruijt, Reinder Nouta, Wilma Jans, Laurent Bataille, Wietse Franssen, Margit Gosen, Ruchita Ingle, and Niek Bosma

Most low-level peatlands in The Netherlands have been converted to pastures for dairy-production as early as 500 years ago, leading to drainage, peat oxidation, soil subsidence and CO2 emissions. Climate policies prescribe drastic mitigation of these emissions, while cultural and economic interests of dairy production cannot be ignored either. This leads to proposals for often highly technical measures elevating the groundwater table or otherwise limiting oxidation while maintaining the productivity of the land. In the northern Fryslân Province drainage has traditionally been deeper than in the Western Netherlands. The province and its peat meadow programme is actively assessing the effectiveness of a range of measures, including sub-surface (drain) and surface (furrow) irrigation, dynamic ditch levels and flooding as well as soil manipulation techniques.

Wetterskip Fryslân and Wageningen University since 2021 have been jointly monitoring greenhouse gas emissions (CO2 and CH4) from a selection of up to 16 pastures implementing these measures (treatment and control), using a set of four roving (mobile) eddy covariance (EC)systems but maintaining fixed environment monitoring in each site. This yields discontinuous data sets spread of the years, which we completed to annual series and annual Net Ecosystem Carbon Budgets (NECB, or NBP) using advanced machine learning techniques completed with harvest and manure data. 

The analysis yields consistent time series with quantifiable uncertainty. However, in most cases the effectiveness of the mitigation methods could not be demonstrated. Apart from methodological considerations, this indicates important secondary factors affecting the emissions, including cattle management, soil clay content, etc.

The relationship with ground water table is also not significant among these sites. If alternative ground water metrics are considered, however, explanatory power improves. Air filled pore space was calculated from soil moisture profiles and is a better predictor than groundwater table, while the depth of ground water below a top clay layer also has explanatory power. Finally, we explored an interesting delayed effect of ground water on emissions.  

One measure that does seem consistently effective is surface (trench) irrigation. Dynamic ditch level management seems to lead to higher, not lower emissions, while in some cases we find consistent carbon uptake in a pasture. Cropping on peat soils is clearly unfavourable, no matter the mitigation measure. Comparison with national-scale emission reporting models shows that our measurements are showing similar uncertainties. All in all, the mobile EC approach proves to be a powerful tool to assess real-world effectiveness of mitigation measures while it also confronts policy makers with the often tough reality of scientifically underpinning mitigation measures.

How to cite: Kruijt, B., Nouta, R., Jans, W., Bataille, L., Franssen, W., Gosen, M., Ingle, R., and Bosma, N.: Assessing the mitigation of peat oxidation in Frisian managed pastures using mobile eddy covariance systems, EGU General Assembly 2026, Vienna, Austria, 3–8 May 2026, EGU26-14902, https://doi.org/10.5194/egusphere-egu26-14902, 2026.

EGU26-16357 | Orals | BG3.19

Stopping the Leak and Rebuilding the Sink? Positioning Peatland Rewetting as a Climate Change Mitigation Measure 

Franziska Koebsch, Vytas Huth, John Couwenberg, Gerald Jurasinski, and Franziska Tanneberger

Peatland rewetting can reduce greenhouse gas (GHG) emissions (stopping the leak) and establish Carbon Dioxide Removals (CDR, rebuild the CO2 sink). Emission reductions and CDR are two distinct climate change mitigation strategies that require tailored accounting methodologies and regulatory designs to ensure environmental integrity.

Here, we evaluate the potential, constraints and uncertainties of rewetting agriculturally drained peatlands as a strategy for emission reduction and CDR. Our analysis utilizes radiative forcing modeling and the sustained global warming potential (GWP*) metric, applied to emission factors from Germany’s national inventory reporting. Further, to account for the large variety of rewetting outcomes, we incorporate two emission trajectories in our evaluation: first, a worst-case scenario characterized by high initial CH4 pulses and delayed CO2 sequestration due to year-round flooding and, second, a best-case scenario, featuring low CH4 emissions and high initial CO2 sequestration associated with precise water table management and the rapid establishement of wetland vegetation. Furthermore, we quantify additional CDR gains derived from long-term carbon storage in products from paludiculture biomass and, finally, contrast peatland rewetting with alternative CDR techniques, highlighting its synergies in ecosystem services and biodiversity conservation.

Our findings contribute to the scientific basis for better integrating peatland rewetting into climate policies and accounting schemes, ensuring that regulatory frameworks most accurately reflect the climate change mitigation potential of rewetting agriculturally drained peatlands. 

How to cite: Koebsch, F., Huth, V., Couwenberg, J., Jurasinski, G., and Tanneberger, F.: Stopping the Leak and Rebuilding the Sink? Positioning Peatland Rewetting as a Climate Change Mitigation Measure, EGU General Assembly 2026, Vienna, Austria, 3–8 May 2026, EGU26-16357, https://doi.org/10.5194/egusphere-egu26-16357, 2026.

EGU26-17658 | Posters on site | BG3.19 | Highlight

Agricultural peatland restoration for Green Transition: A Danish case-study 

Franziska Eller, Asbjørn Emil Hertz, Emil Skole Læsøe, Frank Bondgaard, Mads Lægdsgaard Madsen, Rikke Rørby Graversen, and Tobias Sandfeld Jensen

In 2024, the Danish government, together with key stakeholders in agriculture and nature conservation, reached a historic Agreement on a Green Denmark. The agreement aims to secure more nature, a better ecological water status, and a sustainable agricultural transition through restructuring and converting land use and production. A central pillar of this initiative is the introduction of a CO₂e tax on greenhouse gas emissions from agricultural lowland soils rich in organic carbon (hereafter “peatlands”), combined with financial support for their decommissioning. It has been decided that a total of 140,000 drained peatlands, including their marginal areas, will be restored into nature areas or forests by 2030.

The presented project seeks to identify the optimal process for peatland restoration in Denmark—from planning to post-rewetting. Through case studies and literature reviews, a detailed model for land use and management is developed to maximize synergies between biodiversity conservation, nutrient removal, and greenhouse gas reduction. The preliminary vegetation analyses indicate that topsoil removal before rewetting is a promising restoration measure to enhance plant biodiversity and remove nutrients, while biomass harvesting seems to be less efficient. Year-round grazing after rewetting seems to be the most effective management measure for ensuring biodiversity.

Stakeholder workshops have gathered knowledge and experience from Denmark and abroad to design efficient management models for restored areas, where multiple landowners must collaborate. The ultimate goal is rational planning and organization that optimize both ecological and economic benefits. The current results of this project, as well as the identified barriers for successful post-restoration management, will be presented as part of this work.

How to cite: Eller, F., Hertz, A. E., Læsøe, E. S., Bondgaard, F., Madsen, M. L., Graversen, R. R., and Jensen, T. S.: Agricultural peatland restoration for Green Transition: A Danish case-study, EGU General Assembly 2026, Vienna, Austria, 3–8 May 2026, EGU26-17658, https://doi.org/10.5194/egusphere-egu26-17658, 2026.

EGU26-17886 | Orals | BG3.19

Terrae incognitae - water and forest management of transformed drained peatlands 

Annamari Laurén and Marjo Palviainen

Drainage in peatland forests has onset a succession, where a mor humus has formed on the top of the peat. Our latest study revealed that trees on transformed drained peatlands grow better when the water table (WT) is rather close to the soil surface. This is due to the hydrological and biogeochemical function of the mor layer. Mor layer is a substantial nutrient storage and source, it contains most of the roots and includes macropores that enable oxygen supply for roots even when WT is elevated. This suggests that in future peatland forestry the improved growth under higher WT would be synergetic to several other ecosystem services (ES): Growing forests with higher WT improves climate change mitigation via reduced peat carbon (C) emissions and enhanced stand and ecosystem C sequestration, improved resiliency due to reduced drought risks and smaller nutrient export to water courses. The importance of mor layer has been unrecognized, and its characteristics, function and consequences for ES provision remain virtually unexplored. We outline how mor layer affects the function of transformed drained peatlands, and apply the understanding to define sustainable water and forest management strategies taking into account ES across site fertility range under current and changing climate. This is achieved through application of process-based Peatland simulator SUSI. Understanding the mor layer function supports renewal of forest regeneration, planning of water and forest management and adaptation to climate change. Wood production with higher WT is an intermediate form between rewetting and current water management. The new peatland management has potential to cause immediate climate cooling effects through enhanced forest growth and decreased soil C emissions whilst decreasing nutrient loading to water courses. 

How to cite: Laurén, A. and Palviainen, M.: Terrae incognitae - water and forest management of transformed drained peatlands, EGU General Assembly 2026, Vienna, Austria, 3–8 May 2026, EGU26-17886, https://doi.org/10.5194/egusphere-egu26-17886, 2026.

EGU26-17906 | Orals | BG3.19

Ash fertilization in peatland forest requires water management 

Marjo Palviainen, Mikko T. Niemi, and Annamari Laurén

Ash fertilization substantially increases stand growth in drained boreal forested peatlands. Growth response lasts  for several decades. Ash fertilization is economically viable management practice and it also can increase ecosystem carbon sink. The long-lasting growth response is a combined result of increased supply of growth limiting phosphorus and potassium, higher soil pH, enhanced microbial activity and nutrient release in soil. An indirect growth response emerges as a feedback from higher foliage mass, increased evapotranspiration and subsequent lower water table and increased organic matter decomposition and nutrient release.  

Previous studies indicate that growth response with respect to unfertilized control is greatest when water table is high. Growth response decreases when water table lowers. In this study, we use Peatland simulator SUSI to search for water management where synergetic benefits from stand growth, ecosystem and soil carbon balance, and nitrogen export to watercourses is achieved. We simulated the combined effects of ash fertilization and water management in Scots pine (Pinus sylvestris L.) stands in different site fertility classes in Southern-Finland, Central-Finland and Northern-Finland. Results indicate that the growth response and effects on carbon balance and nitrogen export are best when water table is maintained high. In intensively drained areas the growth response is small and ash fertilization increases carbon emissions and nitrogen export to water courses.

How to cite: Palviainen, M., Niemi, M. T., and Laurén, A.: Ash fertilization in peatland forest requires water management, EGU General Assembly 2026, Vienna, Austria, 3–8 May 2026, EGU26-17906, https://doi.org/10.5194/egusphere-egu26-17906, 2026.

EGU26-18377 | ECS | Posters on site | BG3.19

Climate Mitigation Potential of Peatland Restoration in Switzerland  

Qing Sun and Édouard Davin

Peatlands are among the most carbon-dense terrestrial ecosystems, accumulating organic carbon over millennia. Alongside essential ecosystem services such as biodiversity support, water purification, and erosion control, peatlands play a crucial role in climate regulation through long-term carbon sequestration and methane emissions. Over the past three centuries, widespread drainage of northern peatlands for agriculture, forestry, and urban expansion has led to severe ecosystem degradation.

In Switzerland, despite the constitutional peatland protection introduced by the “Rothenthurm initiative” in 1987, most peatlands remain drained and continue to act as significant net carbon sources with substantially compromised ecosystem services. Restoration through rewetting is considered a high-impact nature-based solution, halting soil carbon losses and reinstating peatland functions as net carbon sinks. While carbon credits offer a pathway to mobilise private finance, current frameworks typically rely on generalised estimates with large uncertainties, and the restoration potential of avoided emissions at national scales remains poorly constrained. Field surveys and observations are essential for designing site-specific restoration measures and evaluating outcomes, whereas process-based modelling provides a complementary approach to assess peatland greenhouse gas exchanges under the changing climate across spatiotemporal scales.

In this study, we employ the terrestrial biosphere model LPX-Bern to simulate greenhouse gas dynamics of Swiss peatlands from the preindustrial period to the present day. Carbon uptake and methane emissions from natural peatland processes are modelled under historical climate forcings. Peatland degradation resulting from land use conversion is represented by altered vegetation composition and water table level. By combining model simulations with empirical emission factors derived from field measurements under different land managements, the greenhouse gas balance of Swiss peatlands and their potential climate feedback under restoration can be evaluated. We highlight the urgent need for integrated assessment frameworks that link modelling and field investigations to robustly quantify the climate mitigation potential of peatland restoration. This work provides a process-based estimate of peatland restoration potential in Switzerland, informing climate mitigation strategies and supporting investment in large-scale peatland and wetland climate action.

How to cite: Sun, Q. and Davin, É.: Climate Mitigation Potential of Peatland Restoration in Switzerland , EGU General Assembly 2026, Vienna, Austria, 3–8 May 2026, EGU26-18377, https://doi.org/10.5194/egusphere-egu26-18377, 2026.

EGU26-18837 | ECS | Posters on site | BG3.19

PaludiCentral: Building a network of large-scale paludiculture demonstration and research sites 

Jannes Säurich, Merten Minke, Bärbel Tiemeyer, and Franziska Tanneberger

Although drained peatland and other carbon-rich soils represent only 5% of the land surface in Germany, they contribute to 6.9% of total national greenhouse gas (GHG) emissions. Transitioning from drainage-based to wet peatland management offers substantial benefits, including reduced GHG emissions, prevention of further peat degradation, improved water retention, and enhanced biodiversity. Moreover, paludiculture can be used to produce peat-preserving biomass on wet soils, including horticultural substrates, building materials and bioplastics. However, widespread adoption faces many obstacles, including complex approval procedures, high costs, limited expertise and a lack of established value chains for the biomass produced.

To address these challenges, the German government funds a collaborative network, the “PaludiNet”, consisting of nine long-term projects implementing large-scale paludiculture and the “PaludiCentral” project coordinating monitoring, research and knowledge transfer centrally. In total, around 5500 ha project sites are distributed across different peatland regions and vary in peatland type, site conditions, ownership, former land use and paludiculture approach. The projects collectively demonstrate the full process from site selection and rewetting to cultivation, management, processing, and marketing of paludiculture products.

Across all PaludiNet projects, a comprehensive monitoring network is being established to quantify, among a wide range of biotic and abiotic parameters, GHG fluxes at drained and rewetted sites. We will present this monitoring network both in terms of design and collaboration approaches. In addition, we will highlight preliminary cross-project results include the compilation of a catalogue of paludiculture biomass products which can be used as building materials, animal feed, packaging and energy carriers. Furthermore, we set up an online platform designed to facilitate the exchange of specialized machinery and technologies for the management of wet and rewetted peatlands. The platform enables practitioners to identify suitable equipment, suppliers, and contractors, compare products, and access relevant technical information.

By linking scientific evidence with practical implementation, this work bridges the gap between research and practice, supporting GHG mitigation, the upscaling of paludiculture, and the establishment of sustainable paludiculture value chains.

How to cite: Säurich, J., Minke, M., Tiemeyer, B., and Tanneberger, F.: PaludiCentral: Building a network of large-scale paludiculture demonstration and research sites, EGU General Assembly 2026, Vienna, Austria, 3–8 May 2026, EGU26-18837, https://doi.org/10.5194/egusphere-egu26-18837, 2026.

EGU26-18911 | ECS | Orals | BG3.19

Potential positive effects of solar panels on peatland restoration 

Robin Pelchen, Bärbel Tiemeyer, Arndt Piayda, Philipp Porada, and Kai Jensen

Peatlands have accumulated around 600 Gt of carbon throughout the Holocene, but centuries of drainage for agriculture and peat extraction have transformed these ecosystems into major carbon sources in many regions of the world. Rewetting drained peatlands can essentially reduce these emissions and is therefore a key strategy for achieving net zero targets by 2050. However, it is unclear if common rewetting measures are sufficient to restore peatlands to a near pristine state. Degraded peat soils and more frequent severe droughts under climate change often produce deeper water tables with larger seasonal fluctuations, which reduce the recovery potential of characteristic peatland vegetation such as Sphagnum mosses. Both a stable water table and, particularly in raised bogs, the re-establishment of Sphagnum are necessary to restore the carbon sink function of rewetted sites and to meet nature conservation goals. Rewetting also raises socioeconomic challenges, because rewetting land formerly used for agriculture can lead to loss of income for landowners.


One recently proposed land-use approach is to combine rewetting with renewable energy production by installing solar parks on rewetted peatlands to replace the loss of income. A potential ecological benefit is reduced evapotranspiration from shading by solar panels, which could help stabilize seasonal water-table fluctuations. However, the effect of such shading on peatland vegetation, especially Sphagnum, remains unknown.


In this study, we combine process-based modeling with a field experiment to assess short- and long-term effects of solar panel shading on water table dynamics and Sphagnum growth. Preliminary results indicate that shading stabilizes water levels and, despite light limitation beneath solar panels, can enhance Sphagnum performance. These findings suggest that solar parks could simultaneously support renewable energy production and peatlands restoration.


How to cite: Pelchen, R., Tiemeyer, B., Piayda, A., Porada, P., and Jensen, K.: Potential positive effects of solar panels on peatland restoration, EGU General Assembly 2026, Vienna, Austria, 3–8 May 2026, EGU26-18911, https://doi.org/10.5194/egusphere-egu26-18911, 2026.

Tropical peatlands contain substantial carbon stores, but their degradation is increasing. In East African countries, e.g. Burundi, Rwanda and Uganda, more than 50% of the peatland area is drained, predominantly for agriculture. Subsequent peat subsidence rates are estimated to range from 2.66 to 5.12 cm a⁻¹, indicating a significant carbon loss and reduced water regulation capacity. While these systems are rapidly lost their ecohydrological regimes remain understudied.

This study investigated the temporal and spatial patterns of peat formation in the Kagera River Basin of East Africa, a sub-basin of the Nile system. The basin predominantly contains valley-bottom fen peatlands connected by the waterway system, which are fed by rain-, surface- and ground-water flows. Regardless of their interconnectivity, they vary in their hydro-morphological setting – e.g. relief and proximity to water bodies, size and peat depth.

We synthesized  radiocarbon-dated peat records from literature as well as own work. Peat formation processes in these tropical systems appear to not be driven by climatic factors alone but are strongly influenced by regional and local hydromorphological factors. While increased water availability was critical for enabling widespread peat initiation, the timing and pace of peat growth was conditioned by regional and localized ecohydrological feedbacks of their landscapes, e.g. proximity to lake versus river floodplains. Our findings indicate that management, conservation and restoration activities should first aim to understand the peatlands landscape interactions including site-specific understanding of their ecohydrological conditioning factors.

How to cite: Schaefer, L., Couwenberg, J., and Elshehawi, S.: Climatic and ecohydrological feedbacks as conditioning factors to peat initiation and accumulation in tropical valley-bottom fens: lessons from East Africa , EGU General Assembly 2026, Vienna, Austria, 3–8 May 2026, EGU26-19101, https://doi.org/10.5194/egusphere-egu26-19101, 2026.

EGU26-19287 | ECS | Orals | BG3.19

Nutrient and organic matter dynamics in drained peatland forest and the impact of drainage ditch reconstruction on water quality. 

Jürgen Sarjas, Margit Kõiv-Vainik, Kadir Yildiz, Isaac Okiti, Ilona Tamm, Joosep Tuupõld, Mihkel Pindus, and Kuno Kasask

Draining land to remove excess water in areas where precipitation exceeds evaporation is a common practice. At peatlands used for forestry, this facilitates accelerated tree growth but has significant environmental implications. Drainage exposes peat soils to oxygen, triggering peat decomposition and mineralization, which leads to the leaching of solids, organic matter, and nutrients to run-off water. This study monitored nutrient and organic matter dynamics, as well as changes in water quality, in a 507.6 ha actively managed peatland forest in western Estonia since July 2022, while the drainage system underwent reconstruction in 2025. To mitigate the negative impacts of reconstruction, ecological water protection measures - sedimentation ponds and hybrid systems combining sedimentation ponds with treatment wetlands were implemented in the studied peatland forest area during the reconstruction. Outflow from four of the implemented measures was monitored with a V-weir overflow combined with an automated water level logger (Solinst Canada Ltd.) to estimate the flow rates. Monthly water samples were collected, and during the collection, on-site measurements of water temperature, dissolved oxygen concentration, electrical conductivity, pH, redox potential, and turbidity were taken using a portable device (YSI ProDSS). Concentrations of total suspended solids (TSS), total inorganic carbon (TIC), total organic carbon (TOC), dissolved organic carbon (DOC), total phosphorus (TP), phosphate-phosphorus (PO4-P), total nitrogen (TN), nitrite-nitrogen (NO2-N), nitrate-nitrogen (NO3-N), ammonium (NH4-N), sulfate (SO4-2), magnesium (Mg+2), calcium (Ca+2), chloride (Cl-) and total iron (FeTOT) analyzed in the laboratory. For continuous monitoring, starting in May 2025, one of the hybrid systems' inflows was equipped with an automated monitoring device (YSI EXO1), which recorded water temperature, dissolved oxygen concentration (DO), electrical conductivity (EC), pH, and fluorescent dissolved organic matter (fDOM) levels every 5 minutes. The reconstruction works elevated TP, TSS, and TIC release, with mean concentrations rising from 0.04 mg/L to 0.17 mg/L, 14.80 mg/L to 161.71 mg/L, and 13.82 mg/L to 17.47 mg/L, respectively. For TOC and TN, the effect was opposite, with mean concentrations decreasing from 54.63 mg/L to 51.26 mg/L and from 4.05 mg/L to 2.56 mg/L, respectively. Continuous monitoring revealed a severe short-term decrease in pH, fDOM, and DO levels and a slight short-term rise in EC in the inflow of the hybrid system as the released sediments passed through it. This indicates that the main release originates from the mineral soils underneath the peat that were disturbed during the works. To assess the volume of sediments retained by the ecological water protection measures, two bottom topography surveys were conducted in July 2025 (before) and October 2025 (after) using a Trimble® R12 (Trimble Inc. USA) GNSS receiver with RTK mode. Measured GPS points were interpolated in QGIS, yielding results of low sediment accumulation in two of the systems and sediment release from two of the systems. The fine particle sediments released during the reconstruction require very low flow rates and long hydrological retention times in the system to settle. Additionally, long-term monitoring is necessary to determine whether these systems have a lasting positive impact during active peatland forest management.

How to cite: Sarjas, J., Kõiv-Vainik, M., Yildiz, K., Okiti, I., Tamm, I., Tuupõld, J., Pindus, M., and Kasask, K.: Nutrient and organic matter dynamics in drained peatland forest and the impact of drainage ditch reconstruction on water quality., EGU General Assembly 2026, Vienna, Austria, 3–8 May 2026, EGU26-19287, https://doi.org/10.5194/egusphere-egu26-19287, 2026.

EGU26-19342 | Posters on site | BG3.19

Effects of subsurface irrigation on greenhouse gas emissions from intensively managed grassland on bog peat soil 

Bärbel Tiemeyer, Ullrich Dettmann, Thi Tra My Lang, Liv Offermanns, Dominik Düvel, Jeremy Rüffer, and Christian Brümmer

Artificial drainage is prerequisite for conventional agricultural use of peatlands, but causes high emissions of greenhouse gases (GHG), mainly carbon dioxide (CO2). Furthermore, grassland renewal is regularly practiced to maintain the high fodder quality required for dairy farming. Raising water levels is necessary to reduce CO2 emissions, but whether a partial raise of water levels by subsurface irrigation (SI) is a sustainable mitigation measure is a matter of intense debate.

In this study, we evaluated the effects of subsurface irrigation on GHG exchange by comparing an experimental intervention site (INT) with SI and a deeply drained reference site (REF) for six years. Both sites are intensively used grasslands on deep bog peat with the same management history. In the first year of the experiment, grassland renewal was conducted at INT, followed by the raise of the water levels. At both sites, CO2 (eddy covariance) as well as nitrous (N2O) and methane (CH4) (manually employed chambers) were measured.

SI effectively raised and stabilized mean annual water levels (-0.25 ± 0.05 m) in comparison to the REF site (-0.68 ± 0.14 m). However, a high spatial variability was observed at INT, causing parts of the site being too wet for management with regular machinery.

The initial grassland renewal resulted in very slow re-growth of grass and, in combination with the raised water levels, to extremely high N2O emissions. N2O emissions declined during the course of the study, but remained higher than at the REF site. CO2 emissions at the INT site were lower than at the REF site, particularly during the second year with a strong development of a new sward. Towards the end of the study period, CO2 emissions from both sites became more similar. Overall, CO2 emissions of the INT site were 41% of those of the REF site, but total GHG emissions were 126%. Furthermore, Juncus effusus (soft rush) became more frequent at the INT site, which deteriorates fodder quality and would necessitate, again, grassland renewal. We conclude that at this bog site, SI is not an adequate solution to mitigate GHG emissions while maintaining production.

How to cite: Tiemeyer, B., Dettmann, U., Lang, T. T. M., Offermanns, L., Düvel, D., Rüffer, J., and Brümmer, C.: Effects of subsurface irrigation on greenhouse gas emissions from intensively managed grassland on bog peat soil, EGU General Assembly 2026, Vienna, Austria, 3–8 May 2026, EGU26-19342, https://doi.org/10.5194/egusphere-egu26-19342, 2026.

EGU26-19627 | Posters on site | BG3.19

Persistent Net CO₂ Emissions After Peatland Rewetting Reflect Lagged Functional Recovery  

Owen Naughton, Md Shamsuzzaman, Ultan McCarthy, Imelda Casey, and Shane Regan
Peatland restoration is widely used as a climate mitigation strategy, yet the immediate transition from a carbon source to a sink is rarely linear. While rewetting is intended to mitigate carbon loss, the precise biophysical mechanisms that govern carbon exchange during the early recovery phase remain poorly understood. This study employs an integrated multi-scale approach by combining eddy covariance, chamber-based fluxes, and Sentinel-2 remote sensing to track CO₂ dynamics through three distinct stages of restoration at a degraded peatland in Ireland. 
 
Our results show that restoration initially intensified CO₂ losses. During the active restoration phase, mean net ecosystem exchange (NEE) peaked at 0.62 µmol m⁻² s⁻¹ due to mechanical disturbance and peat oxidation. Following restoration, emissions declined and stabilized relative to the restoration phase at 0.56 µmol m⁻² s⁻¹, coinciding with a significant shift in energy partitioning. We observed a move from sensible heat dominance toward latent heat exchange, with the Bowen ratio dropping by 0.3, indicating a shift toward wetter surface conditions and evaporative cooling. 
 
Spatial analysis further highlights that while bunded areas remain emission hotspots, recolonized vegetation in the northern sections has already reached near-neutral CO₂ exchange.  The negative correlation between NEE and NDVI (r = −0.48) indicates that biological recovery, rather than hydrological repair alone, plays a key role in carbon stabilization. These findings suggest that the system achieved "early functional stabilization" within just three years. This research provides a useful benchmark for peatland management, demonstrating that the transition to a carbon sink is a staggered process where microclimatic recovery precedes full biological sequestration. 

How to cite: Naughton, O., Shamsuzzaman, M., McCarthy, U., Casey, I., and Regan, S.: Persistent Net CO₂ Emissions After Peatland Rewetting Reflect Lagged Functional Recovery , EGU General Assembly 2026, Vienna, Austria, 3–8 May 2026, EGU26-19627, https://doi.org/10.5194/egusphere-egu26-19627, 2026.

EGU26-19767 | ECS | Orals | BG3.19

A first multi-proxy palaeoecological record from a tropical peatland in Guyana, NE South America 

Audra Swan, Yarin Tatiana Puerta Quintana, Amanda Mateo Beneito, Petr Kuneš, Kaslyn Holder-Collins, Seon Hamer, Ian Lawson, Katherine Roucoux, and Adam Hastie

Tropical peatlands are among the most carbon-dense ecosystems on Earth, yet their long-term development and responses to environmental change remain poorly understood. Palaeoecological records from the Guianas region in particular are extremely limited, resulting in a major gap in our understanding of tropical peatland dynamics. This study presents the first multi-proxy palaeoecological investigation of tropical peatlands in Guyana, providing new insights into peatland development, carbon dynamics, and environmental variability in this under-researched region.

This study analyses two peat cores from lowland tropical peatlands in Guyana, which represent different hydrological and vegetation settings. The cores have been analysed using various complementary proxies, including macroscopic charcoal analysis to reconstruct past fire activity, thermogravimetric analysis (TGA) to characterise changes in organic matter composition, stable carbon and nitrogen isotope analyses (δ¹³C and δ¹⁵N) to investigate vegetation inputs and biogeochemical processes, and pollen analysis to assess vegetation dynamics. Radiocarbon dating provides a chronological framework for interpreting proxy evidence for past conditions and peat accumulation history.

Results reveal variability in charcoal abundance, organic matter composition, and isotopic signatures, suggesting changes in peat accumulation processes and environmental conditions through time. Charcoal-rich layers indicate episodic fire activity, while pollen assemblages reveal shifts in local and/or regional vegetation composition. Differences observed between the two cores indicate spatial variability in fire history and peatland development, potentially driven by local hydrological conditions, vegetation type, or human influence.

Integrated multi-proxy records from both peat cores link fire history, vegetation change, and organic matter characteristics within chronological frameworks. This study provides a critical first baseline for understanding the long-term dynamics of Guyanese peatlands and contributes to broader efforts to assess the vulnerability and resilience of tropical peat carbon stores under future climate and land-use change.The results are also timely, as in the field we observed substantial fire-induced peat loss following the 2023–2024 El Niño event which likely resulted in significant greenhouse gas emissions. Overall, the findings highlight the value of multi-proxy palaeoecological approaches for reconstructing peatland development in understudied tropical regions.

How to cite: Swan, A., Puerta Quintana, Y. T., Mateo Beneito, A., Kuneš, P., Holder-Collins, K., Hamer, S., Lawson, I., Roucoux, K., and Hastie, A.: A first multi-proxy palaeoecological record from a tropical peatland in Guyana, NE South America, EGU General Assembly 2026, Vienna, Austria, 3–8 May 2026, EGU26-19767, https://doi.org/10.5194/egusphere-egu26-19767, 2026.

EGU26-20294 | ECS | Orals | BG3.19

Restoring organic soils under agriculture: cost-effective portfolios in the context of European climate and biodiversity policies 

Fanqi (Vicky) Jia, Andre Deppermann, Juraj Balkovic, Zuelclady Araujo Gutierrez, Mykola Gusti, Michael Wögerer, Alexandra Barthelmes, Amanda Palazzo, Stefan Frank, Tamás Krisztin, Sabine Fuss, and Petr Havlík

Organic soils contain nearly one-third of the world’s soil carbon, despite covering only 3-4% of the global land surface. Their degradation releases large quantities of greenhouse gases (GHGs) and reduces ecosystem functions, including biodiversity support. The European Union (EU) is the second-largest global emitter of GHGs from drained organic soils after Indonesia. Although organic soils under agricultural use represent only about 2% of the EU’s total agricultural area, they are responsible for approximately 80% of Cropland and Grassland emissions released to the atmosphere. Restoring drained organic soils therefore represents a significant opportunity for achieving climate change mitigation targets in the EU. However, the economic mitigation potential of organic soil restoration remains insufficiently explored, as existing studies do not consider restoration beyond full rewetting and rarely assess potential synergies with economic incentives and restoration targets. In this study, we apply GLOBIOM-EU, an economic land-use model, to comprehensively assess the economic climate mitigation potential from restoring drained organic soils used for agriculture considering multiple restoration measures: full rewetting, rehabilitation, and paludiculture. Our results indicate that under a GHG price of 100 EUR per tCO2 equivalent (EUR tCO2e-1), 38.2-44.4 MtCO2 equivalent per year (MtCO2e yr-1) could be mitigated in 2050. Paludiculture emerges as a promising option, substantially increasing the attractiveness of rewetting organic soils; under conditions of high demand for paludiculture products, 2 million hectares of drained organic soils could be restored without additional climate mitigation incentives, delivering mitigation of approximately 17 MtCO2e yr-1 by 2050. Moreover, meeting the 2050 targets of the EU Nature Restoration Regulation (NRR) alone could mitigate 23-29% of current emissions from drained agricultural organic soils in the EU. Overall, our findings suggest that the greatest climate benefits would be achieved through the combination of restoration measures that balance mitigation potential, economic viability, and land-use competition under different policy and market conditions, while also enabling opportunities for biodiversity co-benefits. This highlights the importance of integrated policy frameworks that align climate mitigation, ecosystem restoration, and market incentives.

How to cite: Jia, F. (., Deppermann, A., Balkovic, J., Araujo Gutierrez, Z., Gusti, M., Wögerer, M., Barthelmes, A., Palazzo, A., Frank, S., Krisztin, T., Fuss, S., and Havlík, P.: Restoring organic soils under agriculture: cost-effective portfolios in the context of European climate and biodiversity policies, EGU General Assembly 2026, Vienna, Austria, 3–8 May 2026, EGU26-20294, https://doi.org/10.5194/egusphere-egu26-20294, 2026.

EGU26-20692 | Orals | BG3.19

Biomarker approaches for determining past changes in peatland vegetation, pH and biogeochemistry: how they inform the future of tropical peatlands 

Richard Pancost, Mike Vreeken, Pantelis Prokopiou, Yiming Zhang, and Imani and the CERES and TroPeaCC Collaborative Team

Lipid biomarkers are now routinely used in palaeoclimate and palaeoenvironmental investigations of peatlands.  However, these applications are mainly focused on vegetation reconstruction, i.e. using n-alkane distributions as a tracer for Sphagnum mosses, and based on biomarker tools largely developed in (Northen hemisphere) boreal and temperate peatlands, especially acidic ombrotrophic bogs. Here, we examine and confirm the applicability of these proxies in a wide variety of subtropical and tropical peatlands. We also identify and highlight the potential of underutilised proxies for environmental reconstruction, i.e. those sensitive to pH, and introduce new proxies for tracing biogeochemical cycling, including methane cycling.

In some cases, the expansion to tropical peatlands complicates the use of well-established biomarker proxies. In particular, the diverse distributions of n-alkanes in peat-forming graminoids complicates vegetation reconstruction in many tropical peatlands. Further complication arises from the contributions of above ground- vs below ground-derived organic material.  These issues can be partly resolved via macromolecular characterisation, including lignin monomer distributions. In other cases, biomarker proxies clearly have under-exploited potential. We have previously shown that the stereochemistry of bacterial-derived hopanes and the distribution of bacterial branched glycerol dialkyl glycerol tetraethers exhibit strong relationships with pH, but these proxies are not yet commonly employed in peatland palaeoecological interpretation. We confirm their applicability to tropical settings, as well as their coherent behaviour, which allows cross-validation of their palaeoecological interpretation and encourages wider application. 

We illustrate the coupled application of vegetation and microbial biomarkers using peatland archives from the Democratic Republic of Congo (DRC), Uganda and Panama, many of which reveal sensitive ecological tipping points. For example, in DRC peatlands, Holocene dry intervals are associated with biomarker-inferred shifts from forest- to graminoid-dominated peatland and a concomitant increase in pH. Other sites exhibit pronounced past pH changes despite relatively stable vegetation – or vice versa – suggesting that focussing exclusively on one parameter obscures more nuanced palaeoenvironmental change. We suggest that new insights into tropical peatland development and history can be obtained through holistic biomarker analyses, especially when coupled to other approaches, and that these will better inform our understanding of future responses of these crucial carbon stocks to changing climate.

How to cite: Pancost, R., Vreeken, M., Prokopiou, P., Zhang, Y., and Imani, and the CERES and TroPeaCC Collaborative Team: Biomarker approaches for determining past changes in peatland vegetation, pH and biogeochemistry: how they inform the future of tropical peatlands, EGU General Assembly 2026, Vienna, Austria, 3–8 May 2026, EGU26-20692, https://doi.org/10.5194/egusphere-egu26-20692, 2026.

EGU26-20815 | ECS | Posters on site | BG3.19

Methodological influences on bulk density estimation in tropical peat soils 

Yarin Tatiana Puerta Quintana, Audra Swan, Ans Marie Ngu Chin Tjon, Raisa Abendanon, Marco Ouboter, Verginia Wortel, and Adam Hastie

Tropical peatlands are ecosystems recognised as important reservoirs of soil carbon (C), with an estimated 152 to 288 Gt of C (S. E. Page et al., 2011; Ribeiro et al., 2020). Bulk density (BD) is a key soil property for estimating carbon density and, subsequently, soil carbon stocks. Furthermore, it is also an important parameter for indicating soil compaction and porosity, including water fill pore space (WFPS), hydraulic conductivity (K), biological activity, and cation exchange capacity related to nutrient availability (USDA and NRCS, 2019).

However, there is no standardised method for collecting peat soil in the field. In studies reporting bulk density values, it is uncommon to find detailed descriptions of field sampling procedures. Instead, most studies state that bulk density is determined by measuring the mass of an oven-dried soil sample per unit volume (g cm³ or kg m³) (see SM-Qi et al 2025)

Several approaches are used to determine BD in peat soils, and these methods may produce different outcomes, with implications for carbon density estimates. This work aims to compare two common methods for taking bulk density samples in peat soil. The first is the core method, which is the most commonly reported approach for peat soils in the literature, and the second is the ring method, a general soil bulk density method adapted for use in peat soils. By assessing the differences in BD estimates between these two methods, we want to test and describe a more standardised and reliable protocol for determining BD in peat soils. This assessment considers all stages of the process, including sampling, transportation, and laboratory procedures.

We collected tropical peat soil samples in the field using a ring sampler of known ring volume and a Russian peat core. Our results reveal that BD estimated using the core method was significantly higher than that obtained using the ring method (paired t-test, p < 0.001). These differences may have substantial implications for tropical soil-carbon stock estimations and highlight the importance of standardising bulk density procedures across all stages, from field sampling to final laboratory analysis.

How to cite: Puerta Quintana, Y. T., Swan, A., Ngu Chin Tjon, A. M., Abendanon, R., Ouboter, M., Wortel, V., and Hastie, A.: Methodological influences on bulk density estimation in tropical peat soils, EGU General Assembly 2026, Vienna, Austria, 3–8 May 2026, EGU26-20815, https://doi.org/10.5194/egusphere-egu26-20815, 2026.

EGU26-20858 | Orals | BG3.19

Tree harvest decisions modulate the climate impact of rewetting in a low-productive peatland forest in boreal Sweden 

Järvi Järveoja, Alexander Pinkwart, Cheuk Hei Marcus Tong, Eduardo Martínez-García, Hjalmar Laudon, Matthias Peichl, and Mats B. Nilsson

Over the past century, extensive areas of northern peatlands have been drained for forestry. Today, concerns about their role as significant sources of greenhouse gases (GHG) have sparked growing interest in peatland rewetting as a climate mitigating strategy. However, empirical evidence for rewetting effects on ecosystem carbon (C) and GHG balances is still limited, particularly for minerogenic boreal peatland forests. Rewetting of peatland forests also involves decisions about tree harvest, which can have important but understudied consequences for the C cycle. In this study, we quantified tree growth and estimated carbon dioxide (CO2) and methane (CH4) fluxes in both peatland areas and ditches over two years before (2019-2020) and after (2021-2022) rewetting a low-productive, minerogenic peatland forest in boreal Sweden. We also assessed effects of tree removal during rewetting by comparing harvest and non-harvest areas. Our results suggest that the peatland forest was, on average, C-neutral at the ecosystem-scale during the drained years. After rewetting, the harvested area became a C source (79 g C m-2 yr-1), while the treed area acted as a small C sink (-21 g C m-2 yr-1), with the difference due to diverging responses in net CO2 exchange. Furthermore, CH4 emissions doubled after rewetting, resulting in a two- to threefold increase in total GHG emissions (expressed in CO2 equivalents) over both 20- and 100-year timeframes. While ditches functioned as significant CO2 sinks and moderate CH4 sources during the drained years, they became CO2-neutral and CH4 emission hotspots after being in-filled. Altogether, our findings suggest that rewetting low-productive boreal peatland forests may have a negative short-term climate impact. However, rewetting without tree harvest considerably meliorates ecosystem C and GHG balances. Overall, our study highlights the importance of tree harvesting decisions and the need for a deeper understanding of rewetting as a climate mitigation strategy.

How to cite: Järveoja, J., Pinkwart, A., Tong, C. H. M., Martínez-García, E., Laudon, H., Peichl, M., and Nilsson, M. B.: Tree harvest decisions modulate the climate impact of rewetting in a low-productive peatland forest in boreal Sweden, EGU General Assembly 2026, Vienna, Austria, 3–8 May 2026, EGU26-20858, https://doi.org/10.5194/egusphere-egu26-20858, 2026.

EGU26-21230 | Posters on site | BG3.19

MoorPower – Sustainable and innovative photovoltaic solutions for rewetted peatlands 

Andrea Krüger, Jürgen Kreyling, Franziska Tanneberger, Agnes Katharina Wilke, Arndt Piayda, and Andreas Schweiger and the MoorPower team

The combination of photovoltaic (PV) systems and peatland rewetting could be an economically attractive form of utilisation for currently drained peatland areas while simultaneously reducing greenhouse gas emissions and providing other ecosystem services. MoorPower is an innovative project combining peatland PV, rewetting and paludiculture (Paludi PV) bringing together the expertise of University of Greifswald/Greifswald Mire Centre with the Fraunhofer Institute for Solar Energy Systems ISE, the Thünen Institute of Climate-Smart Agriculture and the University of Hohenheim. The project is funded by the German Federal Ministry of Education and Research (BMFTR) and runs from 2024 to 2028.

At the core experimental site in Northeast-Germany, MoorPower implements the rewetting of a drained peatlands and their utilisation by ground-mounted PV systems together from the outset. The experimental setup allows the comparison of different PV installation methods and the estimation of their effects on water quality, soil physics and the microbiome. Social acceptance, legal issues and economic aspects are analysed together with climate protection and biodiversity assessments at different scales of investigation. In addition, a larger implementation site in Northwest-Germany provides insights on a larger spatial scale and with supplementary methods. In South-Germany, mesocosm experiments and material tests are conducted. Initial results from all sites are already available. We also invite all interested scientists to join us with their research on our experimental platform. The results of this research are urgently needed to evaluate PV systems on peatland soils, to identify possible negative effects of the systems and to avoid these, e.g., through technical guidelines and authorisation requirements, or to adapt existing systems accordingly.

How to cite: Krüger, A., Kreyling, J., Tanneberger, F., Wilke, A. K., Piayda, A., and Schweiger, A. and the MoorPower team: MoorPower – Sustainable and innovative photovoltaic solutions for rewetted peatlands, EGU General Assembly 2026, Vienna, Austria, 3–8 May 2026, EGU26-21230, https://doi.org/10.5194/egusphere-egu26-21230, 2026.

EGU26-21282 | ECS | Posters on site | BG3.19

Large spatial variability of GHG emissions from an alpine peatland detected by chamber based measurements.    

Laura Rubriante, Damiano Gianelle, Dario Papale, Davide Andreatta, Mirco Rodeghiero, and Luca Belelli Marchesini

The study focuses on GHG fluxes analysis (CH4 and CO2) under climate change pressure at “Le Viote” alpine peatland (46.01 N, 11.04 E, 1560 m asl), located in the middle of a plateau in the Mt. Bondone area (eastern Alps, Italy).       
Soil GHG fluxes were monitored from 12th May to 18th November 2025 using a LiCor Smart Chamber and a LiCor 7810 CH4/CO2/H2O Trace Gas Analyzer. Being the Smart Chamber opaque, measured CO2 fluxes regarded only the total respiration fluxes of heterotrophic and autotrophic origin. GHG flux measurements were performed over 24 plots, with a sampling design consisting of transects along microtopographic and soil moisture gradients intersecting different areas featuring homogeneous vegetation classes. A total of six dominant vegetation classes were considered  following a botanical survey to update the vegetation map of the peatland area, and eight transects of three plots each were set.  Ancillary environmental variables such as soil moisture and soil temperature were measured at 6 cm and 15 cm depth respectively on each plot using portable probes.  
For both GHG fluxes, vegetation classes were characterised by high spatial variability, even within the same vegetation type. For example, CH4 fluxes ranged from -3.91 to -0.04 nmolm-2s-1 in grassland, while in the wettest area dominated by sedge communities it ranged from 13.19 to 1271.88 nmolm-2s-1. This highlights the close relationship between CH4 emissions and the soil moisture content. CO2 fluxes instead ranged from 0.21  to 8.22 µmolm-2s-1 in sedges area, and from 0.22 to 34.67 µmolm-2s-1 in grassland.      
Fluxes were cumulated over the whole monitoring period averaging plots data for each vegetation class and performing a linear interpolation between consecutive measurement dates. CH4 fluxes ranged from -2.96 g C-CO2eq m-2 over grassland to a maximum value of 194.91 g C-CO2eq m-2 in the wettest area, characterized mainly by sedges and sphagnum mosses. CO2 fluxes, on the contrary, showed maximum emissions in grassland, with 1613.90 g C m-2, and minimum emissions in the wettest area, with 542.34 g C m-2.     
CH4 and CO2 fluxes were then aggregated and cumulated over the entire measurement period, for the different vegetation classes: grassland reached the highest GHG emissions, with a maximum value of 1610.94 g C-CO2eq m-2. Sedge areas characterised by higher soil water content, on the other hand, showed lower fluxes, with values ranging from 1221.60 g C-CO2eq m-2 for the intermediate sedge zone to 736.76 g C-CO2eq m-2 for the wettest area. The transition zone reached the third highest emissions, with 1113.32 g C-CO2eq m-2.
Mean GHG effluxes assessed for the whole peatland area of 0.99 km2 resulted in  942.27 g C-CO2eq m-2 .    
The sensitivity of both CO2 and CH4 and fluxes to soil temperature was analyzed: the first showed a significative exponential response for all vegetation types, while CH4 fluxes did not show a consistent, nor significant response pattern being on the contrary clearly modulated by soil moisture.

How to cite: Rubriante, L., Gianelle, D., Papale, D., Andreatta, D., Rodeghiero, M., and Belelli Marchesini, L.: Large spatial variability of GHG emissions from an alpine peatland detected by chamber based measurements.   , EGU General Assembly 2026, Vienna, Austria, 3–8 May 2026, EGU26-21282, https://doi.org/10.5194/egusphere-egu26-21282, 2026.

Lowland peatlands are a globally significant carbon store; yet they are intensively used in agriculture and grazing. Long-term peat drainage has led to an imbalance in their ability to sequester carbon, making them a potential C source, as opposed to a long-term C sink, and leading to irreversible loss of ancient carbon stored in the deeper parts of the peat profile. This study investigates the sources and dominant pathways of carbon loss from previously drained, post-agricultural lowland peatlands, with the aim of developing practical, low-cost approaches to assess the quality of carbon exported from these systems. Temporal dynamics of dissolved organic matter (DOM) and its aromaticity are used as proxies to detect changes in carbon cycling in response to a range of rewetting histories and peat restoration strategies.

The quality and composition of DOM and gaseous carbon exchange were monitored across five lowland peatland sites spanning intact, drained, and restored systems. Monthly water sampling (Oct 2024–Oct 2025) was combined with continuous water-table measurements and in-situ CO₂–CH₄ flux monitoring. Pore-water DOC concentration, SUVA254, and related optical indices were used to assess DOM quantity and aromaticity.

At sites exhibiting minimal peat degradation and longer rewetting durations, pore-water dissolved organic carbon (DOC) concentrations were not associated with elevated SUVA254 values, indicating that DOC exported from these systems is predominantly labile rather than recalcitrant. In contrast, site outlets (ditches) showed disproportionately high SUVA254 relative to DOC concentrations, suggesting enhanced leaching of aromatic carbon compounds, particularly from more intensively degraded sites. Ongoing radiocarbon analyses will further constrain carbon turnover times and allow the observed fluxes to be interpreted in the context of carbon age and stability.


How to cite: Elgendy, H.: A Low-Cost Multiproxy Framework for Assessing the Quality of Carbon Loss from Degraded and Restored Post-Agricultural Lowland Peatlands, EGU General Assembly 2026, Vienna, Austria, 3–8 May 2026, EGU26-21451, https://doi.org/10.5194/egusphere-egu26-21451, 2026.

EGU26-21506 | ECS | Orals | BG3.19

Soil and tree stem greenhouse gas fluxes from nutrient-rich and nutrient-poor tropical peatland forests 

Sebestian Kalang William, Kaido Soosaar, Lulie Melling, Erik Lilleskov, Faustina Sangok, Lizardo Fachin-Malaverri, Jhon Rengifo-Marin, Lijan Ahmui, Elizabeth Wangari, Daniel Tyler Roman, Angela Lafuente, Mikk Espenberg, Jaan Pärn, Maarja Öpik, Randall Kolka, Timothy Griffis, Craig Wayson, and Ülo Mander

Tropical peatland forests are significant sources and sinks of greenhouse gases (GHG), yet the relative contributions of soil and tree stem fluxes have remained poorly quantified, particularly CH4 and N2O fluxes across gradients of nutrient availability. We conducted simultaneous measurements of CO2, CH4 and N2O fluxes from both soil and tree stems using soil and stem chamber in two contrasting tropical peat swamp forests: a nutrient-rich in Quistococha, Peru and a nutrient-poor in Maludam, Sarawak, Malaysia. Our results showed higher soil CO2, CH4 and N2O fluxes from Quistococha nutrient-rich forest. Tree stem respiration was consistently higher in the nutrient-poor forest across all dominant species in both forests. Tree stem CH4 fluxes exhibited distinct patterns, with significantly higher emissions from the nutrient-rich forest, while displaying species-specific behaviour among dominant tree species. Mauritia flexuosa palm stems in Quistococha showed high emission of CH4 from stems with potential CH4 sinks from specific species from both forests. N2O emissions were also species-specific and higher from the nutrient-rich forest, with negligible fluxes observed from the species in the nutrient-poor forest. From stem fluxes to tree fluxes upscaling, we found that the majority of total ecosystem GHG flux originated from soil with minimal contribution from the dominant tree species. In conclusion, these findings highlighted tree stems from tropical peatland can act as sources and sinks and that nutrient availability influence on the magnitude of greenhouse gas emissions.

How to cite: William, S. K., Soosaar, K., Melling, L., Lilleskov, E., Sangok, F., Fachin-Malaverri, L., Rengifo-Marin, J., Ahmui, L., Wangari, E., Roman, D. T., Lafuente, A., Espenberg, M., Pärn, J., Öpik, M., Kolka, R., Griffis, T., Wayson, C., and Mander, Ü.: Soil and tree stem greenhouse gas fluxes from nutrient-rich and nutrient-poor tropical peatland forests, EGU General Assembly 2026, Vienna, Austria, 3–8 May 2026, EGU26-21506, https://doi.org/10.5194/egusphere-egu26-21506, 2026.

Restoration-specific trajectories of greenhouse-gas fluxes are needed to estimate potential climate mitigation by restoration, as reflected against scenarios of alternative land-use. I explored the case of restoration of forestry-drained peatlands (FDP) in Finland. Dynamic trajectories of GHG-fluxes were calculated informed by published studies for restoration scenarios and the trajectory models were applied for 12 restored FDPs with data of new moss layer growth and water-table depth (WTD). The impact of restoration on global climate forcing was modelled against different alternative scenarios of continued drainage. Restoration resulted in initial warming in all scenarios, but a hummock-level scenario (deep WTD) shifted to a climate cooling effect already after 15 years. In the 12-sites sample, climate cooling was predicted in half of cases after 10 years, and in most cases within 100 years. Restoration resulted in an average reduction of cumulative absolute global forcing between -2.02and -6.29 t CO2-equivalent ha-1 yr-1 over 100 years, depending on choice of alternative continued drainage scenarios. The results indicate that climate mitigation by restoration can be improved by optimizing establishment of new Sphagnum moss layer, resulting in temporarily high CO2 sequestration and likely dampening of CH4 emissions. An initial period with warming impact can be expected after restoration, but development of the Sphagnum moss layer is suggested already to indicate the onset of climate cooling impact. Realistic dynamic scenarios specific to restoration and drainage are crucial, but more studies are needed to unravel detailed process-specific input and monitoring to verify the realized impacts.

How to cite: Tahvanainen, T.: Climate mitigation potential of forestry-drained peatland restoration in Finland, EGU General Assembly 2026, Vienna, Austria, 3–8 May 2026, EGU26-21673, https://doi.org/10.5194/egusphere-egu26-21673, 2026.

EGU26-21868 | Orals | BG3.19

Holocene palaeoenvironmental change in Amazonia’s largest known peatland complex 

Katherine H. Roucoux, Ian T. Lawson, Euridice N. Honorio-Coronado, Christine Akesson, Dael Sassoon, Fredderick Draper, Thomas Kelly, and William Fletcher

Tropical peatlands are important for carbon storage and sequestration, biodiversity, and a wide range of other ecosystem services, but they are under pressure from resource exploitation, climate change, commercial agriculture, and infrastructure expansion. Through their rich palaeoecological records, these water-logged landscapes offer a unique opportunity to understand long-term vegetation dynamics of tropical peatlands and, importantly, their interactions with the physical environment, the global carbon cycle, and the local communities who rely on their resources. Improving our understanding of long-term peatland development contributes critical underpinning evidence to support their conservation and management and provide information about their sensitivity to changes in climate and hydrology. In this presentation we synthesize more than a decade’s work by our research group in pioneering the palaeoecological study of the largest known peat-forming wetland complex in Amazonia, the Pastaza-Marañón Foreland Basin (PMFB). This body of work, including around twenty palaeoecological sequences, allows a reappraisal of earlier ideas about the spatial and temporal structure of the wetland complex. Our analysis shows that, with caveats, palynology and associated proxy methods can be used successfully to reconstruct past vegetation changes. For example, the palaeoecological data challenge earlier attempts to classify the vegetation of the PMFB into ‘types’, suggesting instead that plant communities vary gradually in time (as they do, often, in space) between a wide variety of end-members. At many individual sites, likely those occupying abandoned river channels, endogenous processes (infilling, plant succession) dominate the pattern of peatland development and local environmental change over time. These patterns are largely predictable and comparable to hydroseres known elsewhere, though many details remain unexplored. At some herbaceous or lightly wooded sites, palaeoecological data confirm that similar vegetation has persisted for many thousands of years without succeeding to closed-canopy woodland, apparently maintaining an equilibrium with hydrological conditions. Overall, our palaeoecological data are informing our conceptualisation of the processes of change in these landscapes, which in turn are finding applications in policy development and sustainable management at global, national and local scales.

How to cite: Roucoux, K. H., Lawson, I. T., Honorio-Coronado, E. N., Akesson, C., Sassoon, D., Draper, F., Kelly, T., and Fletcher, W.: Holocene palaeoenvironmental change in Amazonia’s largest known peatland complex, EGU General Assembly 2026, Vienna, Austria, 3–8 May 2026, EGU26-21868, https://doi.org/10.5194/egusphere-egu26-21868, 2026.

EGU26-21872 | Posters on site | BG3.19

Phosphorus leaching from anaerobic peat columns under steady-state flow 

Goswin Heckrath, Bo Vangsø Iversen, Hans Christian Bruun Hansen, Dominik Zak, and Nimisha Krishnankutty

Rewetting of organic lowland soils may result in a large and prolonged phosphorus (P) load to the aquatic environment as legacy iron (Fe) is reductively dissolved and the associated P released. We hypothesize that the remaining P sorption capacity in anaerobic soils determines P mobilization. To study P mobilization and transport under steady-state flow, a convective discharge experiment was conducted in the laboratory at 10 °C. Sixty undisturbed soil columns were taken from two different soil depths (5-25 cm, 25-50 cm) in six Danish lowlands characterized by wide variability in P, as well as Fe and aluminum oxide contents. The column experiment used oxygen-free deionized water flowing at a rate of 1 mm per hour over a period of 28 days. The cumulated effluent was analyzed for different P and Fe forms, dissolved organic carbon (OC), ammonium, nitrate, and other solutes on day 5, 14 and 28 during the experiment. Active flow volume and non-equilibrium flow conditions were determined with the help of a tritium tracer. Upon completing the leaching experiments, the soil columns were dismantled for determination of relevant soil properties.

Across the six sampling sites, OC content varied strongly with subsoil OC% (1 – 49%) consistently exceeding topsoil OC% (1 – 44%). Molybdate reactive P (MRP) leaching generally followed site-specific OC patterns, indicating a strong link between C availability and P mobilization. Sites with higher OC showed elevated MRP leaching rates, and higher MRP release, especially in topsoils. In subsoils, MRP leaching was lower and less variable across sites. Columns remained strongly anaerobic during the experiment. Iron-poor sites showed higher MRP leaching. Release rates of MRP declined sharply with increasing molar ratios of bicarbonate-dithionite or oxalate-extractable Fe and P (Fe:P) indicating strong sorption control by Fe oxides. This effect was much more pronounced in topsoils. Saturated hydraulic conductivity also varied substantially among and within sites, ranging from 0.04 to 156 cm d⁻¹. Hydrological conditions further influenced P mobilization: higher flow rates and short residence times caused limited reductive Fe(III) dissolution and MRP release, whereas prolonged residence under low-flow conditions enhanced Fe(II) and MRP release. Additionally, P release to the aqueous phase remained low when the soil’s residual sorption capacity (RSC) exceeded 100 mmol kg⁻¹. In general, we observed lower P release rates compared to those typically reported for batch experiments with similar soils. We expect that our findings will support improved modeling of P export from rewetted organic lowland soils.

How to cite: Heckrath, G., Iversen, B. V., Hansen, H. C. B., Zak, D., and Krishnankutty, N.: Phosphorus leaching from anaerobic peat columns under steady-state flow, EGU General Assembly 2026, Vienna, Austria, 3–8 May 2026, EGU26-21872, https://doi.org/10.5194/egusphere-egu26-21872, 2026.

EGU26-21889 | Orals | BG3.19

Using biodiversity to support climate resilient livelihoods in intact tropical peatlands 

Euridice Honorio Coronado and GCBC project partners*

Tropical peatlands support unique biodiversity, store large carbon stocks, and sustain local livelihoods, yet they are increasingly threatened by climate change and human activities. In Southeast Asia, large-scale drainage and conversion to oil palm and forestry plantations have caused widespread peatland degradation. By contrast, peatlands in the Amazon and Congo basins remain largely intact but face growing pressures from commercial agriculture and infrastructure development. A key challenge is how to prevent these peatlands from following the same degradation trajectory observed in Southeast Asia.

Here, we present a project funded by the Global Centre for Biodiversity on Climate (GCBC) that integrates scientific and local knowledge to inform sustainable, climate-resilient peatland management. Our research spans 24 sites with permanent forest plots across Peru, the Republic of Congo, and the Democratic Republic of Congo. We combine multiple datasets to advance understanding of (1) peatland plant biodiversity through new botanical collections, (2) hydrological variation using newly installed water-table monitoring dataloggers, and (3) human uses of peatland species derived from semi-structured interviews.

We present preliminary results from work package (1), focusing on floristic diversity and the conservation status of vascular peatland plants assessed using the IUCN Red List. Peatlands in Peru and the Republic of Congo exhibited relatively low species richness compared to other tropical ecosystem types. Palm swamps were strongly dominated by Calamoideae palms, notably Mauritia flexuosa in Peru and Raphia laurentii in the Republic of Congo. Early successional swamp stages were dominated by other Calamoideae species, whereas pole and hardwood forests showed greater tree dominance, including Pachira nitida (Malvaceae), Hevea guianensis (Euphorbiaceae), and Platycarpum loretensis (Rubiaceae) in Peru, and Coelocaryon preussii (Myristicaceae), Cryptosepalum congolanum, Cynometra sessiliflora (Leguminosae), and Symphonia globulifera (Clusiaceae) in the Republic of Congo.

Of the 395 species assessed, 96.7% were classified as Least Concern and only 3.3% as threatened. Contrary to expectations, peatlands did not hold a high overall proportion of threatened species. However, some threatened taxa—such as Platycarpum loretensis (Endangered)—were locally abundant, accounting for 9–21% of stems in pole forest plots. These findings suggest that tropical peatlands have low species diversity, but they can function as important refugia for threatened tropical plant species, highlighting their conservation value beyond carbon storage.


* Camille Choquet1, Xander van der Burgt1, Dennis del Castillo2, Gabriel Hidalgo2, Siria  Portalanza2, Manuel Martin2, Ifo Suspense3, Brice Milongo3, Corneille Ewango4, Joseph Kanyama4, Tim Baker5, Simon Lewis5, Ian Lawson6, Christopher Schulz6 / 1 Royal Botanic Gardens, Kew, 2Intituto de Investigaciones de la Amazonia Peruana,3 Université Marien N’Gouabi, 4 Université de Kisangani, 5 University of Leeds, 6 University of St Andrews

How to cite: Honorio Coronado and GCBC project partners*, E.: Using biodiversity to support climate resilient livelihoods in intact tropical peatlands, EGU General Assembly 2026, Vienna, Austria, 3–8 May 2026, EGU26-21889, https://doi.org/10.5194/egusphere-egu26-21889, 2026.

EGU26-2034 | ECS | Orals | BG3.20

Deciphering eddy-covariance CO₂ flux patterns in Dutch peatlands, from machine-learning to physics-based deep-learning 

Laurent Bataille, Bart Kruijt, Laura van der Poel, Wieste Franssen, Wilma Jans, Corine van Huissteden, Hong Zhao, Hanne Berghuis, Jan Biermann, Ignacio Andueza Kovacevic, Freek Engel, Jeferson Zerrudo, Ruchita Ingle, Tan JR Lippman, Isabel Cabezas-Dueñas, Reinder Nouta, Veronique Boon, Alex Buzacott, Ype van der Velde, and Ronald Hutjes

Peat soil degradation in the Netherlands contributes an estimated 4.6–7 Mt CO₂ annually, accounting for approximately 3% of national greenhouse gas emissions. In response, the Dutch Climate Agreement (2019) established a target to reduce net CO₂ emissions from fen meadows by 1 Mt CO₂ per year by 2030. To achieve this objective, the Dutch National Research Programme on Greenhouse Gases in Peatlands (NOBV) implemented an intensive monitoring network that integrates chamber-based measurements with both on-site and airborne eddy covariance (EC) observations. A primary challenge in this context is attributing and upscaling CO₂ emissions across diverse peat types, soil conditions, groundwater regimes, and grassland management practices.

Direct measurement of peat oxidation at the ecosystem scale is not feasible; instead, it must be inferred from EC fluxes that encompass autotrophic respiration, heterotrophic decomposition, and management-induced vegetation turnover resulting from mowing and regrowth. Attribution remains challenging because conventional emission–response functions emphasise groundwater levels while neglecting soil physical properties and vegetation dynamics, which is a significant limitation in highly degraded, nutrient-rich peatlands.

Our modelling strategy consists of two components. First, we employ machine learning to analyse the data without imposing prior assumptions. Shapley-based attribution quantifies the contributions of groundwater depth, meteorological forcing, vegetation state, and mowing timing to fluxes, along with their interactions. These models identify nonlinear thresholds and regime-dependent behaviours that are challenging to specify a priori. We compare response structures across sites to assess sensitivities, rather than prescribing specific management scenarios.

Second, we develop a physics-based deep learning framework that integrates biophysically meaningful equations with adaptable learning components. Groundwater dynamics regulate oxygen availability and determine the proportion of organic matter exposed to air. Soil moisture profiles are used to characterise oxic and anoxic zones. Bulk density and porosity, which define degraded peat, constrain oxygen diffusion and moisture retention. By explicitly representing vegetation growth and mowing disturbances, we distinguish autotrophic respiration from peat oxidation.

Integrating soil physics and groundwater dynamics within a deep learning framework enhances both temporal robustness and cross-site transferability while maintaining model flexibility. This approach enables inference of peat oxidation from EC observations in a mechanistically consistent manner, thereby providing a robust foundation for evaluating mitigation strategies in intensively managed peatlands.

How to cite: Bataille, L., Kruijt, B., van der Poel, L., Franssen, W., Jans, W., van Huissteden, C., Zhao, H., Berghuis, H., Biermann, J., Andueza Kovacevic, I., Engel, F., Zerrudo, J., Ingle, R., Lippman, T. J., Cabezas-Dueñas, I., Nouta, R., Boon, V., Buzacott, A., van der Velde, Y., and Hutjes, R.: Deciphering eddy-covariance CO₂ flux patterns in Dutch peatlands, from machine-learning to physics-based deep-learning, EGU General Assembly 2026, Vienna, Austria, 3–8 May 2026, EGU26-2034, https://doi.org/10.5194/egusphere-egu26-2034, 2026.

EGU26-5304 | ECS | Orals | BG3.20

Role of redox-active dissolved organic matter for methane cycling in thawing permafrost peatlands 

Eva Voggenreiter, Zoe Hahn, Edgardo I. Valenzuela, Jeffrey Hudson, Andreas Kappler, and Sigrid van Grinsven

Permafrost peatlands represent a large organic carbon stock and are currently a net carbon sink. However, some permafrost regions will develop anoxic conditions due to soil subsidence and waterlogging in the future. Under these conditions, it is estimated that methane (CH4) emissions will increase due to the higher availability of newly mobilized dissolved organic matter (DOM) for microorganisms. However, little attention has been given to redox-active functional groups within DOM, which could also play a role in lowering CH4 emissions. On the one hand, oxidized redox-active DOM could suppress methanogenesis thermodynamically, while on the other hand it could act as an electron acceptor for anaerobic CH4 oxidation (AOM). Both processes would decrease net CH4 release. However, the change in redox-active moieties in DOM across thaw in permafrost peatlands and their role in AOM have not been determined yet. In this project, we therefore aim (i) to quantify the changes in abundance and oxidation state of redox-active DOM along a thaw gradient and (ii) to determine the effect of oxidized redox-active DOM on AOM. To achieve this, we collected porewater samples over four depths (10-40 cm) across multiple thaw stages during July and September 2025 in a thawing permafrost peatland in Sweden (Stordalen Mire, Abisko). We analyzed the electron accepting and donating capacity of the anoxic porewater via mediated electrochemical reduction and oxidation, respectively. We found that the electron accepting capacity attributable to DOM significantly decreases from recently thawed to fully thawed sites (from 1.68±0.65 to 0.77±0.58 mmol e- g-1 C-1, p<0.01). Further, mean electron donating capacity attributable to DOM was positively correlated to the average CH4 flux per site (R=0.53, p<0.05), suggesting that more reduced redox-active DOM co-occurs with a higher CH4 release. Additionally, microcosm experiments with water-extracted DOM from the peat and 13C-labeled CH4 were performed in order to quantify the rates of methane oxidation in the presence and absence of redox-active DOM. We used a combination of electrochemical, isotope-tracing and molecular biology techniques to track the reduction of amended DOM, production of 13C-CO2 and the change in abundance of methane-oxidizing microorganisms. Overall, this work will help to assess the importance of redox-active DOM for CH4 cycling in thawing permafrost peatlands.

How to cite: Voggenreiter, E., Hahn, Z., Valenzuela, E. I., Hudson, J., Kappler, A., and van Grinsven, S.: Role of redox-active dissolved organic matter for methane cycling in thawing permafrost peatlands, EGU General Assembly 2026, Vienna, Austria, 3–8 May 2026, EGU26-5304, https://doi.org/10.5194/egusphere-egu26-5304, 2026.

EGU26-5981 | ECS | Orals | BG3.20

Water table regulation and biochar amendments govern peat oxidation and greenhouse gas emissions in agricultural peatlands 

Jeewani Hemamali Peduruhewa, Jennifer M Rhymes, Chris Evans, Dave Chadwick, and Davey Jones

Peat soils store a disproportionate share of terrestrial carbon, yet agricultural drainage accelerates peat oxidation, converting long-term carbon sinks into substantial sources of greenhouse gases (GHGs). We conducted a two-year mesocosm experiment to quantify how water table level (WTL) and organic amendment type interactively regulate peat oxidation and emissions of CO2, CH4, and N2O under agricultural management. Three hydrological regimes were applied over 730 days: permanently saturated conditions (WTL 0 cm) during the first year, moderate drainage (WTL 20 cm) during the second year, and a continuously deeply drained business-as-usual control (WTL 40 cm). Each regime was combined with five amendments such as Miscanthus biochar, Miscanthus chips, paper waste, biosolids, and cereal straw and an unamended control.

Moderate drainage (WTL 20 cm) emerged as a critical threshold that constrained peat oxidation while strongly suppressing methanogenesis. Although CO2 emissions increased relative to saturated conditions, CH₄ fluxes declined by more than 90% compared with WTL 0 cm, where CH4 dominated total GHG output. This shift resulted in a 27-35% reduction in net CO2 -equivalent emissions, demonstrating a clear climate benefit of maintaining a moderately lowered water table. Labile, low C:N amendments (biosolids and straw) intensified CO2 and N2O emissions under WTL 20 cm, reflecting rapid microbial activation following oxygen exposure and enhanced peat decomposition. In contrast, Miscanthus biochar consistently reduced GHG emissions across hydrological conditions, lowering cumulative CO2-equivalent emissions by up to 52% relative to the deeply drained control after 730 days. chemical recalcitrance of biochar, high microporosity, and redox-buffering capacity promoted CH4 oxidation, limited N2O production, and stabilized native peat carbon against oxidative loss.

Our findings demonstrate that peat oxidation and associated GHG emissions can be substantially mitigated through the combined application of moderate water table regulation and stable, recalcitrant organic amendments. Integrating WTL management at -20 cm with biochar addition represents a robust, climate smart strategy for reducing emissions from agricultural peatlands while preserving long-term soil carbon stocks.

How to cite: Peduruhewa, J. H., Rhymes, J. M., Evans, C., Chadwick, D., and Jones, D.: Water table regulation and biochar amendments govern peat oxidation and greenhouse gas emissions in agricultural peatlands, EGU General Assembly 2026, Vienna, Austria, 3–8 May 2026, EGU26-5981, https://doi.org/10.5194/egusphere-egu26-5981, 2026.

EGU26-9234 | Posters on site | BG3.20

Re-visiting the relationship between net ecosystem carbon balance (NECB) and the depth to the water table – a case of Simpson paradox? 

Fred Worrall, Gerardo Lopez Saldana, Michel Bechtold, Sue Page, Stefano Salvi, Kevin Tansey, Yara Al-Sarrouh, and Ian Jory

A relationship between the net ecosystem carbon balance (NECB) and the depth to water table (WTD) has been commonly quoted and used to justify restoration (Evans et al. (2021). However, there are some curious aspects to this relationship. Firstly, the relationship is linear over all depths which implies that the link between the carbon losses and water table is constant, i.e. if the water table in a peat declines then the impact is the same at 10 cm depth as it is at 75 cm depth. A constant susceptibility to degradation with depth in the peat profile would not fit with our understanding of peat accumulation. Secondly, the relationship has no significant fit for peatlands which are reported as net sinks – it only works for net sources. Tiemeyer et al. (2021) provided an alternative relationship based upon a Gompertz function where a linear relationship becomes a constant value at the extremes of water table depth. So in this study we expanded the available dataset and used Bayesian hierarchical modelling with the available factorial and covariate information to re-assess the link between NECB and depth to the water table. Within the hierarchical modelling both linearizable and non-linearizable relationships were considered. The data were considered by global peatland type (boreal, temperate and tropical) and the temperate peatlands  were also considered separately by sub-type (cropland, drained, grassland, natural and rewetted). There were 752 studies that we could consider – 447 studies of temperate peatlands.

Our study shows that:

  • NECB of boreal and temperate peatlands were not significantly different from each other, or from zero, but tropical peatlands were significant sources.
  • NECB of natural, rewetted and drained sub-types were not significantly different from each other, but cropland and grassland sub-types were significantly different from all other sub-types.
  • By global type there were significant relationships with depth to water table for temperate and tropical peatlands but not for boreal peatlands, and the slopes were not significantly different between tropical and temperate.
  • There is little evidence that a linear relationship between NECB with WTD exists: previous published versions of the relationship were dominated by results from grasslands which are generally drier and larger sources than other settings, but within grasslands there is no relationship.
  • Where a relationship does exist, then a Gompertz function solves some of the interpretation problems of a linear relationship. Although the Gompertz function itself has a linear portion.
  • All relationships fitted poorly for sinks.

The study shows that Simpsons paradox may govern the apparent relationship between NECB and water table and that once a suitable grouping factor is applied any relationship breaks down: the use of non-linear relationships does not resolve the problem.

This finding has important implications for the management of peatlands and shows that a relationship between NECB and WTD is not common – what does that mean for our understanding of peatland accumulation and degradation? Further, if not WTD as a control then what are the common drivers on NECB?

Evans et al. (2021).  Nature, 593(7860), 548–552.

Tiemeyer et al. (2021). . Global Change Biology, 22(12), 4134–4149. 

How to cite: Worrall, F., Lopez Saldana, G., Bechtold, M., Page, S., Salvi, S., Tansey, K., Al-Sarrouh, Y., and Jory, I.: Re-visiting the relationship between net ecosystem carbon balance (NECB) and the depth to the water table – a case of Simpson paradox?, EGU General Assembly 2026, Vienna, Austria, 3–8 May 2026, EGU26-9234, https://doi.org/10.5194/egusphere-egu26-9234, 2026.

EGU26-9417 | ECS | Posters on site | BG3.20

Is the application of lignocellulosic material an effective carbon storage improvement technique to peatlands? 

Poppy Reilly, Emily Fearns_Nicol, Fred Worrall, Julia Knapp, and Julian Small

Peatlands form due to the slow rate of organic matter decomposition  characteristic of waterlogged and anaerobic conditions. The resulting organic matter accumulation acts as a long-term store of organic carbon. However, historical use of peatlands, such as peat extraction and drainage, has been detrimental to the carbon storing capabilities of these environments. With the UK’s set aims to achieve a net zero greenhouse gas emissions by 2050 there is an increased interest in the restoration and management of peatlands to help achieve these goals. Biochar has previously been applied to the surface of a peatland, encapsulating carbon for long periods of time due to its refractory nature. This method proved an effective carbon store whilst having no recorded significant or detrimental impact on the peatland itself. However, biochar production is expensive, and therefore, there is a desire to find a cheaper alternative.

This study has assessed the application of lignocellulosic material, specifically Calluna Vulgaris (heather) brash, to a peatland as an alternative to biochar addition. This study was performed on Hatfield Moors in South Yorkshire, UK. Employing a triplicate random block design with doses of 1 cm and 2 cm depth heather brash application alongside controls with no heather brash application. The plots were visited on a monthly basis for two years and monitored for:

  • Peatland surface water quality monitoring – water table height, pH, ionic conductivity, UV absorbance at 400 nm, and organic carbon concentration;
  • Peatland surface water nutrient concentration (nitrate and phosphate concentration);
  • Peatland surface water terminal electron acceptor concentration (iron and sulphate concentration);
  • Gas exchange of peatland (net ecosystem respiration, gross primary productivity, net ecosystem exchange) ; and
  • Degradation of Calluna Vulgaris over the course of the study.

The study shows that heather brash could be a viable alternative to biochar as a means of augmenting carbon storage within peatlands.

How to cite: Reilly, P., Fearns_Nicol, E., Worrall, F., Knapp, J., and Small, J.: Is the application of lignocellulosic material an effective carbon storage improvement technique to peatlands?, EGU General Assembly 2026, Vienna, Austria, 3–8 May 2026, EGU26-9417, https://doi.org/10.5194/egusphere-egu26-9417, 2026.

EGU26-9827 | Orals | BG3.20

 Impact of peatland restoration on CO2 and CH4 emissions and microbial communities  

Carla Cruz Paredes, Katrin Olvasstovu Midjord, Clara Aguilar Vilar, and Simon Herzog

Peatlands, known to be important carbon sinks, have been transformed into sources of carbon due to human activities, contributing around 1 GtCO2 equivalents annually to global emissions. Denmark's Green Deal aims to restore 100,000 hectares of peatlands by 2030 to mitigate these emissions, with studies indicating that rewetting drained peatlands could significantly reduce greenhouse gas emissions. Microbial communities play a central role in peatland carbon cycling, driving the production of CO2 and CH4 through decomposition. Moreover, microbial communities are sensitive to changes in moisture conditions, particularly during dry and rewetting cycles. Previous studies show that CO2 rose during drought but returned to control levels during rewetting, while CH4 fluxes fell and remained suppressed throughout the rewetting period. Moreover, it has been found that microbial communities differed to a lesser extent between drained and rewetted peatland, than in drained and undrained peatlands, highlighting the importance of restoration.

Our aim in this study was to evaluate peatland restoration effectiveness in carbon sequestration and to improve the understanding of microbial controls on carbon dynamics in these ecosystems. To achieve this, we monitored CO2 and CH4 fluxes in restored and unrestored peatlands during spring and summer 2025, alongside assessments of microbial activity and community composition.

Preliminary results indicate that raising the water table in degraded peatlands reduces both CO2 and CH4 emissions, suggesting improved carbon storage following restoration. Despite decades of drainage, both sites retained high organic carbon stocks. Bacterial community composition differed more strongly between restored and unrestored sites than between seasons, and topsoil communities showed greater divergence from mid- and subsoil layers. Microbial activity analyses revealed that anoxic conditions limited bacterial growth, whereas fresh litter inputs and elevated temperatures stimulated it.

These findings deepen our understanding of how restoration influences peatland carbon processes and microbial ecology. By identifying conditions that promote carbon storage, this research supports the development of management strategies that enhance peatlands’ capacity to function as effective carbon sinks, contributing to climate change mitigation.

How to cite: Cruz Paredes, C., Olvasstovu Midjord, K., Aguilar Vilar, C., and Herzog, S.:  Impact of peatland restoration on CO2 and CH4 emissions and microbial communities , EGU General Assembly 2026, Vienna, Austria, 3–8 May 2026, EGU26-9827, https://doi.org/10.5194/egusphere-egu26-9827, 2026.

EGU26-11059 | Orals | BG3.20

Simulation of CO2 and CH4 emissions from peatlands and organic soils: an improvement of SOC pool initialization in LDNDC model 

Sergey Blagodatsky, David Kraus, Florian Braumann, Janina Klatt, Matthias Drösler, Ralf Kiese, and Clemens Sheer

Advanced process-oriented models can reliably predict emissions of carbon containing greenhouse gases (CO₂ and CH₄) from both peatlands and arable soils. However, changes in land use, such as the conversion of peatlands into arable land or grassland following drainage, or the rewetting of drained peatlands, make it challenging for a single model to simulate soil processes and greenhouse gas emissions accurately across such different conditions.

We evaluated the LandscapeDNDC (LDNDC) model (Kraus et al., 2015) by comparing its simulations with field measurements of soil properties and CO2 and CH4 exchange rates (Eickenscheidt et al., 2015; Hommeltenberg et al., 2015). The default distribution of soil organic carbon (SOC) into pools with different decomposability, which is typically initialized in models based on the C:N ratio of soil organic matter (SOM), was ineffective for soils with a high organic matter content (>10% organic C). To address this, we distributed SOC into particulate and mineral-associated fractions (POM and MAOM) based on the concept of Lavallee et al (2020). Furthermore, we divided the MAOM into fast- and slow-decomposable pools, according to the C:N ratio of total organic matter (OM). The initial fraction of POM in total OM was derived from the total C content using the function proposed by Rühlmann (2020). Incorporating these changes into LDNDC’s soil biochemistry module improved agreement with observations and resolved the problem of underestimating ecosystem respiration in drained peatlands used for grassland or crop production. The improved initialization of SOC pools in the LDNDC model should enable more precise simulation of soil C stocks and GHG emissions at regional level, where soils with a wide range of SOC content need to be considered simultaneously.

References

Eickenscheidt, T., Heinichen, J., Drösler, M., 2015. The greenhouse gas balance of a drained fen peatland is mainly controlled by land-use rather than soil organic carbon content. Biogeosciences 12, 5161–5184. https://doi.org/10.5194/bg-12-5161-2015

Hommeltenberg, J., Mauder, M., Drösler, M., Heidbach, K., Werle, P., Schmid, H.P., 2014. Ecosystem scale methane fluxes in a natural temperate bog-pine forest in southern Germany. Agricultural and Forest Meteorology 198–199, 273–284. https://doi.org/10.1016/j.agrformet.2014.08.017

Kraus, D., Weller, S., Klatt, S., Haas, E., Wassmann, R., Kiese, R., Butterbach-Bahl, K., 2015. A new LandscapeDNDC biogeochemical module to predict CH4 and N2O emissions from lowland rice and upland cropping systems. Plant Soil 386, 125–149. https://doi.org/10.1007/s11104-014-2255-x

Lavallee, J.M., Soong, J.L., Cotrufo, M.F., 2020. Conceptualizing soil organic matter into particulate and mineral-associated forms to address global change in the 21st century. Global Change Biology 26, 261–273. https://doi.org/10.1111/gcb.14859

Ruehlmann, J., 2020. Soil particle density as affected by soil texture and soil organic matter: 1. Partitioning of SOM in conceptional fractions and derivation of a variable SOC to SOM conversion factor. Geoderma 375, 114542. https://doi.org/10.1016/j.geoderma.2020.114542

How to cite: Blagodatsky, S., Kraus, D., Braumann, F., Klatt, J., Drösler, M., Kiese, R., and Sheer, C.: Simulation of CO2 and CH4 emissions from peatlands and organic soils: an improvement of SOC pool initialization in LDNDC model, EGU General Assembly 2026, Vienna, Austria, 3–8 May 2026, EGU26-11059, https://doi.org/10.5194/egusphere-egu26-11059, 2026.

EGU26-14097 | ECS | Posters on site | BG3.20

Methane emission dynamics of a shallow dutch peat lake: Insights from long-term eddy covariance monitoring 

Olga M. Zygadlowska, Veronique E.N. Boon, Julia Marinissen, Sarian Kosten, and Ype van der Velde

Freshwater lakes, despite covering only ~ 3% of Earth’s surface, are among the largest natural sources of methane to the atmosphere. Current global estimates of lake methane emissions, however, remain uncertain and likely underestimated due to the scarcity of long-term and high resolution datasets and the spatial and temporal complexity of freshwater lakes. Methane fluxes from lakes are influenced by many factors such as lake depth, organic matter input, seasonal biogeochemical dynamics and vegetation composition, making upscaling from individual systems challenging. In this study, we investigate the temporal dynamics of methane emissions from a shallow peat lake in the Netherlands. The lake is characterized by rich submerged vegetation dominated by two species: Potamogeton perfoliatus and Nitellopsis obtusa. Continuous eddy covariance (EC) measurements of methane fluxes, collected since December 2021, were combined with various water quality data to assess seasonal and interannual variabilities. Our results show a clear seasonal pattern, with substantially higher methane emissions during summer months (average of 165 mg m-2 d-1), compared to autumn, winter and spring (average of 50, 15 and 68 mg m-2 d-1, respectively). Through strong positive correlations, both water and air temperature were identified as the main drives of methane emissions, with the redox potential at the lake water-sediments interface also showing strong negative correlation. Interestingly, two distinct emission peaks were observed each early summer and again in late summer to early autumn. These peaks are likely linked to the macrophyte life cycle, with an early-season peak preceding full plant development, a mid-summer decrease possibly associated with oxygen input from the vegetation, and a late-season increase due to plant decomposition. These findings highlight the role of aquatic vegetation in methane release from shallow peat lakes. Better quantifying these temporal drivers is important to improve regional and global methane budgets.

How to cite: Zygadlowska, O. M., Boon, V. E. N., Marinissen, J., Kosten, S., and van der Velde, Y.: Methane emission dynamics of a shallow dutch peat lake: Insights from long-term eddy covariance monitoring, EGU General Assembly 2026, Vienna, Austria, 3–8 May 2026, EGU26-14097, https://doi.org/10.5194/egusphere-egu26-14097, 2026.

EGU26-14965 | Orals | BG3.20

Anaerobic decomposition contributions to greenhouse gas emissions of agriculturally used peatlands.  

Ype van der Velde, Jim Boonman, Duygu Tolunay, Joost Keuskamp, Liam Heffernan, Alexander Buzacott, Sarah Faye Harpenslager, Gijs van Dijk, and Mariet Hefting

Globally, peatlands store one third of global soil carbon. Peatlands accumulate carbon under waterlogged anoxic conditions, but drainage increases oxygen availability causing peatland degradation. Therefore, drainage is responsible for ~2% of anthropogenic greenhouse gas (GHG) emissions. GHG emission estimates from drained peatlands are often based on hydrological proxies. In this research, we propose to improve these estimates by adding the redox potential that controls peat degradation more directly compared to hydrological proxies. We quantified in-situ soil production rates of CO2 and CHby combining in-situ redox potential measurements with corresponding laboratory basal respiration rates scaled to in-situ soil temperature. Using this approach, we estimated soil CO2 and CHproduction rates for 12 field sites over multiple years and validated these estimates by comparing them to aboveground Net Ecosystem Carbon Balance (NECB) measurements. We show that (1) laboratory incubation measurements can serve as a strong basis to estimate field-scale CO2 and CH4 emissions, (2) compared to water table depth, the redox potential is a more reliable parameter for estimating soil CO2 production, and (3) anaerobic respiration processes contribute substantially to peat decomposition and soil CO2 production.  Our results provide valuable new insights for assessing GHG emissions from drained peatlands and enhances our understanding of aerobic and anaerobic peat decomposition processes. 

How to cite: van der Velde, Y., Boonman, J., Tolunay, D., Keuskamp, J., Heffernan, L., Buzacott, A., Harpenslager, S. F., van Dijk, G., and Hefting, M.: Anaerobic decomposition contributions to greenhouse gas emissions of agriculturally used peatlands. , EGU General Assembly 2026, Vienna, Austria, 3–8 May 2026, EGU26-14965, https://doi.org/10.5194/egusphere-egu26-14965, 2026.

EGU26-17613 | Orals | BG3.20 | Highlight

The complexity of carbon cycling in peatlands: a biogeochemical perspective 

Dominik Zak, Gerald Jurasinski, Jesper Christiansen, Susanne Liebner, Rasmus Petersen, Joachim Audet, Renske Vroom, and Nichlas Hermansen

Peatlands store a substantial fraction of the global soil carbon pool. Widespread drainage and land-use change have accelerated peat decomposition, while current restoration efforts aim to slow or reverse peat carbon oxidation and associated greenhouse gas emissions through rewetting. Understanding when and to what extent rewetting restores carbon sequestration and long-term peat accumulation remains a key scientific and management challenge.

Over recent decades, substantial progress has been made in identifying the biogeochemical controls on peat carbon turnover in rewetted systems. Water table dynamics, hydrological connectivity, redox conditions, substrate availability, nutrient status, and vegetation composition jointly regulate microbial processes driving organic matter decomposition and carbon fluxes. Yet, key questions remain: what really drives carbon turnover in peatlands? Is it “the overriding role of the water table”, the “iron gate” of mineral interactions, or the “iron wheel”? Could there even be a single enzyme controlling global carbon storage (Wen et al., 2019)? These questions highlight how peat carbon cycling defies simple explanations and directly challenges long-standing paradigms. Classical concepts emphasizing intrinsic substrate recalcitrance, single inhibitory controls (e.g., phenolics or water table position), or strictly separated aerobic–anaerobic microbial pathways fail to capture the complexity of carbon stabilization and turnover observed in rewetted peatlands (Zak et al., 2019). Instead, emerging evidence points to a network of interacting, context-dependent processes, including microbial community turnover, mineral–organic interactions, and dynamic redox condition changes, underpinning peat carbon persistence.

Yet, these mechanisms are typically studied at micro- to plot scales, while restoration success and climate feedbacks are evaluated at ecosystem to landscape scales, posing persistent challenges for upscaling. In this contribution, we synthesize current insights into carbon cycling in rewetted riparian peatlands by explicitly linking microbial and biogeochemical controls on carbon decomposition with restoration approaches aimed at managing carbon fluxes. Emphasis is placed on spatial and temporal heterogeneity in peat properties, hydrology, and microbial functioning, and on how this variability propagates uncertainty in carbon balance assessments and model predictions.

By integrating process-based understanding with measurements and modeling perspectives, both recent advances and remaining knowledge gaps in predicting peat carbon cycling under restoration will be highlighted. Re-assessing prevailing paradigms and strengthening cross-scale linkages are essential for designing effective rewetting strategies.


References

Wen, Y., Zang, H., Ma, Q., Evans, C. D., Chadwick, D. R., & Jones, D. L. (2019). Is the ‘enzyme latch’or ‘iron gate’the key to protecting soil organic carbon in peatlands?. Geoderma, 349, 107-113.

Zak, D., Roth, C., Unger, V., Goldhammer, T., Fenner, N., Freeman, C., & Jurasinski, G. (2019). Unraveling the importance of polyphenols for microbial carbon mineralization in rewetted riparian peatlands. Frontiers in Environmental Science, 7, 147.

How to cite: Zak, D., Jurasinski, G., Christiansen, J., Liebner, S., Petersen, R., Audet, J., Vroom, R., and Hermansen, N.: The complexity of carbon cycling in peatlands: a biogeochemical perspective, EGU General Assembly 2026, Vienna, Austria, 3–8 May 2026, EGU26-17613, https://doi.org/10.5194/egusphere-egu26-17613, 2026.

EGU26-17664 | ECS | Posters on site | BG3.20

Constraints on Deep Peat Decomposition: Roles of Redox Conditions, Microbial Communities, and Organic Matter Reactivity 

Nea Sneddon-Jenkins, Mike Vreeken, Amelia Oakeshott, Simon Cheung, Fin Ring-Hrubesh, Angela Gallego-Sala, Richard Pancost, and Casey Bryce

Deep peat is typically more decomposed than shallow peat, and tends to be less available for microbial respiration, producing less methane and carbon dioxide per gram of stored carbon. Understanding why deep peat exhibits slower rates of decomposition – and especially the interplay of redox conditions and organic matter composition – is important for understanding the effects of peat drying and exposure of deep peat at the surface.

To investigate whether the metabolic capabilities of the deep peat microbiome or the reactivity of the peat itself limited breakdown of deep peat organic matter, we conducted a controlled incubation experiment. Incubations were set up to compare deep (>1m deep) and shallow peat (<30cm) from two temperate peatlands (an ombrotrophic, Sphagnum-dominated bog and a minerotrophic, graminoid-dominated fen). Peat samples were incubated under oxic and anoxic conditions, and a subset of vials were inoculated with a shallow microbial community extract, a shallow dissolved organic carbon (DOC) extract or a deep DOC extract from the corresponding site. Headspace gas concentrations (CO2 and CH4) were determined over the incubation period, while water samples were taken over the same period to observe changes in DOC concentrations and composition. Microbial community samples were collected at the beginning and end of the incubation period, and 16S rRNA gene sequencing was used to determine shifts in community composition.

We observed that exposure to oxygen and addition of the shallow microbial community increased microbial respiration in comparison to the anoxic deep peat controls. This suggests that the deep peat microbiome is metabolically capable of breaking down deep organic matter, but less efficient, and that without oxygen, the deep peat is less thermodynamically available. However, the amended deep peats do not exhibit CO2 production rates as high as those in the shallow peat control, indicating that organic matter recalcitrance still governs degradation rates even under aerobic conditions, with implications for the fate of deep peat carbon stocks exposed to oxygen.

How to cite: Sneddon-Jenkins, N., Vreeken, M., Oakeshott, A., Cheung, S., Ring-Hrubesh, F., Gallego-Sala, A., Pancost, R., and Bryce, C.: Constraints on Deep Peat Decomposition: Roles of Redox Conditions, Microbial Communities, and Organic Matter Reactivity, EGU General Assembly 2026, Vienna, Austria, 3–8 May 2026, EGU26-17664, https://doi.org/10.5194/egusphere-egu26-17664, 2026.

EGU26-18049 | ECS | Orals | BG3.20

Land-use effects on microbial methane dynamics across European peatlands 

Tatjana Zivkovic, Sanja Deinert, Krista Peltoniemi, Jenni Hultman, Aino Korrensalo, Tomáš Hájek, Zuzana Urbanová, Jaak Truu, Marika Truu, Ain Kull, and Susanne Liebner

Peatlands are globally important sources and sinks of methane (CH4), yet the extent to which land-use change alters the balance between methanogenesis and methane oxidation across peatland types remains poorly constrained. Here, we quantify potential methane production and aerobic methane oxidation across 27 peatland sites within the EU Biodiversa+ project network, spanning Estonia, Finland, Germany, and Czechia and encompassing pristine, drained, and rewetted bogs and fens.

We combined laboratory incubation assays with molecular approaches to assess methane cycling potential in both the aerobic peat layer and below the water table. Potential CH4 production and oxidation rates were measured under controlled conditions, alongside quantitative PCR targeting methanogenic (mcrA), methanotrophic (pmoA), and total bacterial (16S rRNA) genes. Shotgun metagenomics and 16S rRNA gene sequencing were used to explore the genomic potential for methane oxidation and to identify microbial taxa involved.

Preliminary results indicate that pristine peatlands exhibit the highest potential rates of both methane production and oxidation. Drained sites show strongly reduced methanogenic potential, while rewetted sites display partial recovery, with rates generally remaining lower than in pristine systems. Higher methane oxidation rates in long-term rewetted sites (>15 years) suggest that functional recovery may increase with time since rewetting. When separated by peatland type, bogs show higher methane cycling potentials than fens across all land-use categories.

Pristine peatlands consistently showed highest methanogen gene abundances compared to rewetted and drained, particularly in the anaerobic peat layer. Methanotrophic gene abundances were highest in pristine peatlands in the aerobic layer; however, anaerobic layers of rewetted and drained peatlands harbored higher methanotrophic communities than in their aerobic layers. This suggests that methanotrophic communities in managed peatlands may establish deeper in the peat profile, potentially in response to oxygenic microsites or dynamic redox conditions. In rewetted and drained sites, pmoA gene abundance explained ~20% of the variation in methane oxidation rates, and mcrA explained ~10% in rewetted sites.

Overall, these findings suggest that drainage substantially suppresses methanogenic potential, while rewetting promotes partial functional recovery, particularly in bog systems and on timescales of at least decades. Integrating process-based and molecular data provides new insight into how land-use change shapes peatland methane cycling.

How to cite: Zivkovic, T., Deinert, S., Peltoniemi, K., Hultman, J., Korrensalo, A., Hájek, T., Urbanová, Z., Truu, J., Truu, M., Kull, A., and Liebner, S.: Land-use effects on microbial methane dynamics across European peatlands, EGU General Assembly 2026, Vienna, Austria, 3–8 May 2026, EGU26-18049, https://doi.org/10.5194/egusphere-egu26-18049, 2026.

EGU26-18795 | ECS | Posters on site | BG3.20

Environmental Controls on Carbon Stability in Peatlands: Integrating Microbial, Geochemical, and Organic Matter Variation 

Amelia Oakeshott, Mike Vreeken, Megan Jenkins, Yiming Zhang, Simon Cheung, Juan Carlos Benavides Duque, Paola Alarcon Prado, Frank Kansiime, Ellen Kayendeke, Carol Kagaba, Angela Gallego-Sala, Richard Pancost, and Casey Bryce

Peatlands are significant terrestrial ecosystems that play a large role in regulating many global processes, resulting in a high social, environmental, and cultural importance. Despite this global distribution, these systems are far from uniform with differences in their hydrology, geochemistry, vegetation, and microbial communities, all shaping carbon processing pathways. This study investigates how contrasting peatland types across tropical and temperate zones differ in their biogeochemical characteristics, and to identify the dominant environmental and microbial drivers underpinning this variation. We examined microbial community composition, nutrient profiles, dissolved porewater gases, and detailed organic matter (OM) characterisation of eight peatlands from Colombia (n=4), Uganda (n=1), and the United Kingdom (n=3) to determine the influence on carbon cycling. First, we find that peat, which serves as microbial substrate, becomes enriched in aromatic and alkyl macromolecules with depth, which correlates with an increase abundance of Bathyarchaea and Spirochaeta, whilst a decrease in Methanobacterium and Burkholderia. This is consistent with a shift towards more processed OM and decreased substrate availability. Results also indicate a pH control, in relation to peatland type, on the abundance of Acidobacteriota. Sites with lower pHs (~ 4) are observed to have more Acidobacteriota in comparison to higher sites (~ 6) where Chloroflexi dominate more. Together, these results suggest that local geochemistry exerts a stronger influence on microbial community structure than latitude, further influencing OM decomposition pathways and carbon preservation. Overall, our data indicates that peat carbon stability is governed primarily by site-specific geochemistry rather than regional climate alone, highlighting the need for process-based constraints in predicting peatland carbon emissions under future environmental changes.

How to cite: Oakeshott, A., Vreeken, M., Jenkins, M., Zhang, Y., Cheung, S., Benavides Duque, J. C., Alarcon Prado, P., Kansiime, F., Kayendeke, E., Kagaba, C., Gallego-Sala, A., Pancost, R., and Bryce, C.: Environmental Controls on Carbon Stability in Peatlands: Integrating Microbial, Geochemical, and Organic Matter Variation, EGU General Assembly 2026, Vienna, Austria, 3–8 May 2026, EGU26-18795, https://doi.org/10.5194/egusphere-egu26-18795, 2026.

EGU26-19491 | ECS | Posters on site | BG3.20

Tracking microbial responses to rewetting and nutrient mobilisation during agricultural peatland restoration 

Fin Ring-Hrubesh, Paola Alarcon-Prado, Bradley Powell, Lauren Randle, Erin May, Yiming Zhang, Mike Vreeken, Rich Pancost, and Casey Bryce

Degradation of the UK’s peatlands has turned these landscapes from long-term carbon sinks to net sources, with lowland peatlands contributing a majority of these emissions. Rewetting is the primary means of restoring these peatlands, with the aim of limiting microbial aerobic decomposition of organic matter by raising the water table and reestablishing anoxic conditions. However, rewetting of former agricultural peat may also disrupt the cycling of redox-sensitive compounds, mobilise organic and mineral-bound nutrients, and modify the source of water supplying the peatland. How microbial communities respond to these hydrological and geochemical alterations remains unclear, even though they represent the primary control on peatland carbon balance and ecosystem function.  

We have established a multi-year study at a former dairy farm on lowland peat soils in the Somerset Levels. We are conducting paired comparisons of drained and rewetted peat profiles within the same context that have resulted from blocking drainage ditches with sheet pile dams. Ditch blocking has been conducted at the site to facilitate rewetting but is also expected to alter the availability of nutrients within the peatland. We are investigating the primary geochemical controls on the microbiome, combining seasonal geochemical characterisation (water-extractable NO3-, NO2-, NH4+, PO43-, Fe2+, Fe3+), 16S rRNA gene sequencing; and bulk peat organic matter characterisation. Our findings highlight some of the challenges in restoring agricultural peatlands with both legacy and catchment-derived nutrient inputs. We find that macronutrient availability (in particular, water-extractable NH4+ and PO43-) remains elevated under the rewetting scenario, suggesting a potential legacy influence of prior land use on nutrient cycling. Moreover, across much of the peat profile, the major microbial constituents are shared between the drained and rewetted sites despite intervention. We identify taxa which may serve as markers of the redox interface, such as microaerophilic iron-oxidising bacteria, and explore the utility of such microbial indicators as a potential approach for predicting peatland function. The project demonstrates how microbial community sequencing can shed light on in-situ elemental cycling to inform ongoing management practices.

How to cite: Ring-Hrubesh, F., Alarcon-Prado, P., Powell, B., Randle, L., May, E., Zhang, Y., Vreeken, M., Pancost, R., and Bryce, C.: Tracking microbial responses to rewetting and nutrient mobilisation during agricultural peatland restoration, EGU General Assembly 2026, Vienna, Austria, 3–8 May 2026, EGU26-19491, https://doi.org/10.5194/egusphere-egu26-19491, 2026.

EGU26-20061 | Orals | BG3.20

N2O emissions from fertilised peat soils under different water infiltration systems and groundwater levels 

Rima Porre, Mart Ros, Erne Blondeau, and Gerard Velthof

Agricultural use of peat soils results in large amounts of GHG emissions. Drainage of peat soils leads to mineralisation and thus CO2 emissions. Wet conditions and copious amounts of carbon in fertilised peat soils generally also lead to high N2O emissions. Water infiltration systems (WIS) could regulate the groundwater table (GWT), allowing agricultural use of these soils while at the same time reducing peat oxidation, CO2-emissions and land subsidence. These changes to the groundwater will also affect N cycling processes yet it remains unclear how N2O emissions will be affected. We hypothesised that 1) active drainage reduces N2O emissions due to increased GWT stability, 2) a high GWT reduced N2O emissions due to limited mineralisation and 3) active drainage prevents large peaks in N2O emissions otherwise expected from fertilisers with a high mineral N content.  

In this study, we conducted two one-year field studies. In the first study (2024), we tested how N2O emissions from peat soils were affected by grazing (urine and dung patches) and groundwater management (GWT and WIS). Treatments consisted of urine, dung patches and compaction or combinations thereof. These were laid out in a full factorial block design on 4 field parcels. In the second study (2025) we tested how different fertilisers affect N2O emissions from peat soils under two GWTs. Treatments consisted of an unfertilised control, standard synthetic fertilisers (CAN and Urea), Urea + urease- or nitrification inhibitor, cattle slurry and manure derived bio-based fertilisers (liquid and solid fraction of cattle slurry and ammonium sulphate). In both studies N2O emissions were measured using a closed chamber technique and gas monitor. In addition, grass yield and nitrogen uptake were recorded.

In 2024, N2O emissions were highest from all treatments containing urine patches. N2O emissions were highest from the field with a GWT. This could be explained by higher nitrogen mineralisation of peat, resulting in a high carbon availability for denitrification and thus increased N2O fluxes. Surprisingly we did not see an effect of WIS on N2O emissions. In 2025 GWT did not affect N2O emissions, yet crop N uptake was higher from the field with a low GWT. Emissions from ammonium sulphate (1% of applied N) were highest compared to the other fertilisers. Surprisingly all other treatments resulted in similarly low N2O emissions (<0.5%) with no effect of nitrification or urease inhibitor. Perhaps conditions such as temperature and precipitation inhibited emissions in 2025.

How to cite: Porre, R., Ros, M., Blondeau, E., and Velthof, G.: N2O emissions from fertilised peat soils under different water infiltration systems and groundwater levels, EGU General Assembly 2026, Vienna, Austria, 3–8 May 2026, EGU26-20061, https://doi.org/10.5194/egusphere-egu26-20061, 2026.

EGU26-20511 | Orals | BG3.20

Dissolved organic matter composition predicts the carbon sink in a northern peatland warming experiment 

Martin Berggren, Shokoufeh Salimi, Mahya Tafazoli, and Miklas Scholz

Northern peatlands are major carbon sinks, but their response to warming is difficult to predict because carbon uptake depends on complex interactions between climate, vegetation and drainage. We tested whether the composition of dissolved organic matter (DOM) in peat pore water reflects the biogeochemical functioning of the system and, therefore, can predict the carbon sink response to increased temperature. Using 16 peatland mesocosms subjected to contrasting climatic and hydrological conditions, we measured noon-time CO2 exchange and analyzed DOM optical properties. Interaction forest models were used to predict carbon balance from peatland characteristics combined with DOM composition data. The CO2 sink strengthened with warming in mesocosms with low DOM aromaticity, marked by high protein-like and microbially derived fluorescence, but remained weak when DOM was more aromatic. These results show that DOM composition is a sensitive indicator of peatland carbon balance under warming and can improve predictions of future carbon sink behavior.

How to cite: Berggren, M., Salimi, S., Tafazoli, M., and Scholz, M.: Dissolved organic matter composition predicts the carbon sink in a northern peatland warming experiment, EGU General Assembly 2026, Vienna, Austria, 3–8 May 2026, EGU26-20511, https://doi.org/10.5194/egusphere-egu26-20511, 2026.

EGU26-20652 | Posters on site | BG3.20

When peat burns: Wildfire and the fate of terminal electron acceptors.  

Emily Fearns-Nicol, Catherine Hirst, Fred Worrall, and Julia Knapp

The existence of peatlands relies on the balance of primary productivity and oxidation of organic matter. Oxidation requires a terminal electron acceptor (TEA). The most energetically favourable TEA is O2 followed, in order of reducing energy return, by NO3, Mn, Fe, and SO4. Organic matter itself can become a TEA with the production of methane (CH4). Organic matter will degrade faster the better access to the more energetically favourable TEAs. Therefore, the fate of the organic matter turnover in peatlands is related to the supply of TEAs. Typically, water tables are raised to limit the access of TEAs into the peat porewater, however, it is not only high water tables that are required but also stagnant water tables otherwise fresh TEAs are brought into the porewater.

This study looked at the hydrological and biogeochemical controls on organic matter turnover along a peat-covered hillslope using bunds. Bunds are used in peatlands to manipulate the water table to create environments for peat-forming species such as sphagnum mosses. To our knowledge, this is the only study with continuous pre-fire baseline data prior to a wildfire in a peatland system. Nine bunded plots and nine control plots were monitored monthly over a two year period, with sampling conducted upslope, within, and downslope of each bund. Measurements included water table depth, soil water chemistry (pH, conductivity, DOC, absorbance, cations and anions), and ecosystem CO₂ fluxes.

Pre-fire results showed significant differences absorbance down the hillslope, but no significant differences attributable to bund presence. Concentrations of DOC, iron and sulphate, conductivity, and water table depth did not differ significantly between bunded and control plots. Ecosystem respiration showed no significant variation related to bunds or hillslope position.

Following a wildfire, water table depths did not differ significantly from pre-fire conditions across the hillslope or between bunded and control plots. Similarly, concentrations of TEAs, including iron and sulphate, showed no statistically significant post-fire change. DOC concentrations, absorbance, conductivity, and CO₂ fluxes also remained within the range of pre-fire data.

Neither bund installation nor wildfire caused detectable changes in water table behaviour or TEA availability at this site over the two year study.

How to cite: Fearns-Nicol, E., Hirst, C., Worrall, F., and Knapp, J.: When peat burns: Wildfire and the fate of terminal electron acceptors. , EGU General Assembly 2026, Vienna, Austria, 3–8 May 2026, EGU26-20652, https://doi.org/10.5194/egusphere-egu26-20652, 2026.

EGU26-21201 | ECS | Posters on site | BG3.20

Pore structure controls on microbial decomposition of peat organic matter and GHG production 

Lore Rits, Gilles Erkens, Mariet M. Hefting, Joost A. Keuskamp, and George A. Kowalchuk

Organic soils can contribute significantly to greenhouse gas (GHG) emissions, particularly when drained. In the Netherlands, large areas of peat soils have been drained for agricultural use, resulting in peat oxidation, increased CO₂ emissions, and land subsidence. Microorganisms are the driving force behind peat degradation at a landscape scale, yet their activity is determined by the conditions at the pore scale. Understanding peat decomposition dynamics across landscapes therefore requires mechanistic understanding of microscale controls that link microbial processes to larger-scale subsidence and GHG emission patterns.

One factor shaping microscale conditions is the peat pore space and its architectural properties, including pore size distribution and connectivity. In the field, these properties are dynamic and respond to drainage and rewetting, as well as to microbial decomposition. Microorganisms are therefore both constrained by pore space properties and actively modify them. In contrast to natural peatlands, drained Dutch peatlands commonly exhibit a compacted, well-decomposed top layer with low pore volume that transitions into more porous and less decomposed peat with depth.

In this study, we aim to investigate how the volume and architecture of the peat pore space affect microbial metabolism and the resulting peat organic matter decomposition and GHG production. Using intact peat samples, we will establish field-relevant pore space volumes and architectures, as well as the microbial communities that inhabit them. In addition, we test a controlled laboratory setup in which homogenised peat is repacked to generate contrasting levels of pore space volume, while pore architecture is manipulated to create different pore size distributions. This design allows us to disentangle the effects of pore space volume from those of pore architecture. Pore structures will be resolved using X-ray microtomography, complemented by microbial community analysis and measurements of basal respiration.

We expect that variation in total pore volume, pore size distribution, and pore connectivity will alter microscale chemical and biological conditions, thereby impacting microbial metabolism, peat organic matter decomposition, and GHG emissions. By linking peat physical structure to microbial processes, this work seeks to provide mechanistic insights into peat decomposition, CO₂ emissions, and land subsidence.

How to cite: Rits, L., Erkens, G., Hefting, M. M., Keuskamp, J. A., and Kowalchuk, G. A.: Pore structure controls on microbial decomposition of peat organic matter and GHG production, EGU General Assembly 2026, Vienna, Austria, 3–8 May 2026, EGU26-21201, https://doi.org/10.5194/egusphere-egu26-21201, 2026.

EGU26-1306 | ECS | Orals | BG3.21

Assessing Ammonia Deposition Patterns and Emission Reduction Scenarios in a Livestock-Dense Region of the Netherlands Using a High Resolution Dispersion Model. 

Amitabha Govande, Daniel Martins Figueiredo, Demi van Wijk, Dick Heederik, Ceder Raben, Serigne Lô, Hans Erbrink, Wietske Dohmen, and Parisa Falakdin

In the Netherlands, ammonia (NH₃) emissions from livestock housing have become a major environmental concern, largely due to high density of livestock farms in certain areas of the country. After emission, NH3 settles on the ground, lowering the soil pH, leading to increased acidity and creating harmful conditions for plants. To protect biodiversity, it is essential to reduce nitrogen emissions. This study investigates the spatial variation in NH3 deposition from livestock farming in 2020 within one of the hotspot regions in the Netherlands (Foodvalley region), using a high resolution dispersion model (STACKS-D). The spatial mean NH3 deposition from livestock emissions in Foodvalley was found to be 11.14 kg/hectare/year. Levels above critical deposition load (17 kg/ha/year) were mainly observed in central areas and some nature reserves. To eliminate these exceedances, we tested various livestock emission reduction scenarios. All scenarios explored were able to reduce deposition in nitrogen-sensitive nature environments significantly. Scenarios targeting stable removal in buffer zones around nature areas, as well as those focused on veal calves, dairy cattle, and laying hens sectors, were highly effective in reducing deposition with potentially smaller influence on existing livestock sectors. The annual average deposition map generated by STACKS-D, demonstrated consistent spatial characteristic with 2020 large-scale deposition map, which serves as a reference for assessing pollution distribution and policy making in the Netherlands. Furthermore, a strong (~0.8) and statistically significant correlation between modelled and measured annual mean NH₃ air concentrations as observed for the period 2022-2023 indicates the model captures key spatial features.

How to cite: Govande, A., Martins Figueiredo, D., van Wijk, D., Heederik, D., Raben, C., Lô, S., Erbrink, H., Dohmen, W., and Falakdin, P.: Assessing Ammonia Deposition Patterns and Emission Reduction Scenarios in a Livestock-Dense Region of the Netherlands Using a High Resolution Dispersion Model., EGU General Assembly 2026, Vienna, Austria, 3–8 May 2026, EGU26-1306, https://doi.org/10.5194/egusphere-egu26-1306, 2026.

EGU26-1786 | ECS | Orals | BG3.21

Rapid Nitrogen Supply Increases N2O Losses in Organic Potato Systems 

Morten Möller, Dominik Schlotter, Christian Bruns, and Miriam Athmann

Nitrous oxide (N2O) emissions are a major contributor to the greenhouse gas footprint of agricultural systems and are strongly influenced by nitrogen management. With the ongoing expansion and specialization of organic farming in Germany, an increasing number of farms operate without livestock, raising new challenges for nutrient supply. In stockless organic systems, clover grass is used in alternative ways instead of animal feed, resulting in different organic fertilizer forms with contrasting nitrogen availability, which may strongly affect N2O emissions. However, field-based empirical data on these effects are still scarce.

This study assessed N2O emissions from potato cultivation within a long-term organic field experiment established in 2017 at the experimental farm of the University of Kassel, Germany. The experiment compares different organic farm types and fertilization strategies, with a focus on stockless systems. During the 2024 growing season (May–September), N2O fluxes were measured in three farm types using dynamic, non-transparent PVC chambers installed on permanently embedded soil frames. Chambers were equipped with internal fans, temperature sensors, vent, and pressure opening to ensure stable measurement conditions. In addition to ridge measurements, small PVC sampling tubes installed between ridges allowed spatially differentiated flux measurements across ridge and inter-ridge positions. Chamber air was continuously analyzed in real time using laser-based direct absorption spectroscopy (MIRA Ultra N2O/CO2, AERIS Technologies, USA).

The investigated systems included (i) a bio-vegan Cut & Carry system fertilized with tofu whey and fresh clover grass mulch, (ii) a soil fertility–oriented system fertilized with clover grass compost, and (iii) a mixed-farm system fertilized with cattle manure compost, with nitrogen application rates ranging from 55 to 67 kg N ha-1. Across all systems, N2O emissions exhibited pronounced temporal dynamics, with the highest fluxes occurring after spring fertilization, incorporation of organic fertilizers, and mechanical disturbance such as ridge harrowing. Additional emission peaks were observed after ridging operations and after harvest.

Cumulative N2O emissions over the growing season were consistently higher on ridges than between ridges (42.7 %). The bio-vegan Cut & Carry treatment showed the highest cumulative N2O emissions (average across on- and between ridge positions: 85 mg m-2), attributed to rapidly available nitrogen from tofu whey combined with fresh clover grass mulch. In contrast, compost-based fertilization strategies resulted in lower emissions (average across on- and between ridge positions:  53–60 mg m-2), likely due to higher C/N ratios and slower nitrogen release. Despite these differences, potato yields did not differ significantly among systems.

The results demonstrate that rapid nitrogen availability in stockless organic systems can substantially increase N2O losses without providing yield benefits. Compost-based fertilization strategies appear more effective in mitigating N2O emissions while maintaining productivity, highlighting the importance of carefully designed clover grass utilization and nutrient transfer strategies for climate mitigation in stockless organic farming systems.

How to cite: Möller, M., Schlotter, D., Bruns, C., and Athmann, M.: Rapid Nitrogen Supply Increases N2O Losses in Organic Potato Systems, EGU General Assembly 2026, Vienna, Austria, 3–8 May 2026, EGU26-1786, https://doi.org/10.5194/egusphere-egu26-1786, 2026.

EGU26-2766 | Orals | BG3.21

Carbon Flux Dynamics in a Flood-Prone Grassland: Linking CO₂ Uptake and CH₄ Emission Pulses 

Anna Lindenberger, Hans Peter Rauch, Kuno Kasak, Mihkel Pindus, and Magdalena von der Thannen

Grasslands play a crucial role in the global carbon cycle, yet their greenhouse gas (GHG) dynamics are highly sensitive to environmental fluctuations, especially in flood-prone systems. This study provides a full year of continuous CO₂ and high-resolution CH₄ Eddy Covariance flux measurements from a seasonally flooded and grazed floodplain grassland in Marchegg, Austria – offering a rare insight into how repeated inundation events shape the net carbon balance.

In 2024, the grassland functioned as a modest net carbon sink (–17.6 g C-CO₂ eq m⁻² yr⁻¹). Annual CO₂ uptake (–27.3 g C m⁻² yr⁻¹) was dampened by reduced photosynthesis during floods, while CH₄ emissions (1.6 g C m⁻² yr⁻¹) increased sharply and predictably with each inundation. These flood-related CH₄ pulses, captured at high temporal resolution, accounted for the majority of annual CH₄ release and strongly influenced the overall carbon budget. Whereas CO₂ exchange was primarily driven by light availability and vegetation greenness, CH₄ fluxes were almost entirely controlled by soil moisture and standing water presence, showing minimal response to grazing. The timing of flood events within the growing season proved to be critical. Both early- and mid-season inundation substantially reduced CO₂ uptake, whereas late-season flooding had only a minimal impact. Inundation also triggered pronounced methane emission hot moments, underscoring the dominant role of hydrology in controlling annual greenhouse gas fluxes.

Overall, these findings demonstrate that flood events are the primary determinant of the annual GHG balance in this grassland ecosystem. They further highlight the necessity of year-round, multi-gas monitoring to accurately capture carbon dynamics in hydrologically variable systems. In addition, the results emphasize that adaptive management practices—such as water level regulation, grazing timing, and land-use planning—are crucial for mitigating GHG emissions and enhancing ecosystem resilience under increasingly variable hydrological conditions.

How to cite: Lindenberger, A., Rauch, H. P., Kasak, K., Pindus, M., and von der Thannen, M.: Carbon Flux Dynamics in a Flood-Prone Grassland: Linking CO₂ Uptake and CH₄ Emission Pulses, EGU General Assembly 2026, Vienna, Austria, 3–8 May 2026, EGU26-2766, https://doi.org/10.5194/egusphere-egu26-2766, 2026.

EGU26-2919 | ECS | Orals | BG3.21

Managing saline soil to boost crop yield and halve nitrogen losses 

Wen Wen and Baojing Gu

Soil salinity is an escalating global challenge that reduces crop productivity and exacerbates reactive nitrogen (Nr) losses, threatening food security and environmental health. However, the dual impacts of salinity on crop yields and nitrogen cycling remain under-quantified at the global scale. This study aims to quantify how salinity alters nitrogen dynamics and yield outcomes in croplands and to assess the effectiveness of integrated mitigation strategies designed to reverse these adverse trends. We focus on identifying practical solutions that deliver co-benefits for agricultural output and environmental sustainability in saline croplands. For this, we integrate the IMAGE and CHANS models to construct the nitrogen budget for saline croplands worldwide. A pairwise comparison framework was employed to quantify changes in nitrogen flows across saline and non-saline conditions. Additionally, a global database of field-based mitigation strategies and simulated combined interventions to evaluate their effectiveness. Afterwards, cost-benefit analysis was conducted to evaluate the societal benefits of implementing mitigation measures at scale. Our results show that soil salinity increases nitrogen inputs by 13%, exceeding 1 million tonnes per year, while reducing nitrogen harvest by 7% and amplifying Nr losses by 61%. To assess mitigation potential, we compile and evaluate ten categories of salinity management measures, which collectively reduce Nr losses by 58%, equivalent to 1.9 million tonnes annually, while enhancing yield and generating net global benefits of approximately US$12.6 billion. Regional analyses highlight Asia (e.g., China, Pakistan, Indonesia) and the Middle East (e.g., Iran, Egypt, Saudi Arabia) as hotspots for saline croplands mitigation. The study provides an evidence-based framework for integrating nitrogen budgeting with mitigation policy and highlights the importance of prioritizing salinity mitigation policies and enhancing sustainable agriculture management under increasing environmental stressors.

How to cite: Wen, W. and Gu, B.: Managing saline soil to boost crop yield and halve nitrogen losses, EGU General Assembly 2026, Vienna, Austria, 3–8 May 2026, EGU26-2919, https://doi.org/10.5194/egusphere-egu26-2919, 2026.

EGU26-3380 | ECS | Posters on site | BG3.21

QUAntifying ricE gReenhouse gas Emissions (QUAERE): Mitigation Potential of Sustainable Irrigation Practice in India 

Ishan Ajmera, Mahesh Sirimalle, Preethi Konkathi, Arti Bhatia, Tao Li, and Nathan Torbick

The case for mitigating greenhouse gas emissions from rice production systems is well recognised. Among different strategies, alternate wetting and drying (AWD) has emerged as a low-tech, water-saving approach with strong emission mitigation potential. Intermittent drying of rice fields creates an aerobic environment that suppress methane production. We present a multi-season, landscape-scale assessment of AWD in intensive rice cultivation systems of Telangana state in Southern India. Using a robust experimental design, we quantified irrigation water use, crop productivity, and methane emissions, measuring methane fluxes with static closed chambers. Across seasons, AWD consistently lowered methane emissions relative to conventional continuously flooded systems while maintaining grain and biomass yield. Irrigation demand was reduced under AWD, with water savings ranging from ~14% to ~37%. When conservatively scaled, emission reductions correspond to mitigation potentials of 2.5-3.5 Mt CO2-eq ha-1 season-1. These observations enabled the calibration and validation of process-based biogeochemical crop models, which were subsequently extrapolated to the project region using a remote-sensing-based framework. Overall, this work highlights AWD as a scalable lever for reducing emissions, conserving water and improving regional inventories, while strengthening voluntary carbon market accounting and sustainability assessments in rice production systems.

How to cite: Ajmera, I., Sirimalle, M., Konkathi, P., Bhatia, A., Li, T., and Torbick, N.: QUAntifying ricE gReenhouse gas Emissions (QUAERE): Mitigation Potential of Sustainable Irrigation Practice in India, EGU General Assembly 2026, Vienna, Austria, 3–8 May 2026, EGU26-3380, https://doi.org/10.5194/egusphere-egu26-3380, 2026.

Anthropogenic greenhouse gas emissions continue to drive global climate change, highlighting the importance of terrestrial ecosystems in regulating atmospheric carbon. While vegetation acts as a major carbon sink through photosynthetic uptake and biomass accumulation, carbon sequestration research has predominantly focused on forest ecosystems. In contrast, agricultural systems—especially perennial crops—remain comparatively underrepresented despite their extensive land coverage and long-term management.

Tea plantations (Camellia sinensis) are perennial agroecosystems composed of long-lived woody shrubs with repeated harvest cycles and sustained biomass, suggesting a potentially significant but poorly constrained role in terrestrial carbon cycling. In Taiwan, tea is a major commercial crop occupying extensive agricultural land, yet quantitative assessments of plant–soil carbon exchange processes in tea systems remain limited. To better understand carbon exchange processes in tea plantations, this study applies a dual-approach integrating plant- and soil-level greenhouse gas measurements in a managed tea garden in Taiwan.

Field measurements were conducted from January to April 2026. Branch-level photosynthesis and respiration were monitored using branch cuvettes, and gas exchange rates were extrapolated to the plant level using allometric relationships. Concurrently, soil carbon dioxide (CO2) fluxes were measured using static chamber techniques to characterize soil–atmosphere carbon exchange, with fluxes further extrapolated to the garden scale. Measurements were repeated monthly under fair-weather conditions and supported by laboratory gas chromatography analysis. Ancillary environmental variables and management activities were recorded to support flux interpretation.

Overall, this study provides an integrated, field-based assessment of carbon exchange dynamics in a managed tea plantation by explicitly linking plant- and soil-level gas fluxes with seasonal progression and agricultural practices. By aligning greenhouse gas measurements with farming activities, the results offer insight into how management and phenological stages jointly regulate carbon exchange in perennial agroecosystems. The findings contribute to reducing current uncertainties surrounding the role of tea plantations in terrestrial carbon cycling and provide a scientific basis for future evaluations of carbon management and climate mitigation potential in perennial agricultural systems.

How to cite: Huang, Y.-N. and Liao, K.-W.: Integrating Branch- and Soil-Level Flux Measurements to Investigate Carbon Exchange Dynamics in Tea Plantations, EGU General Assembly 2026, Vienna, Austria, 3–8 May 2026, EGU26-4908, https://doi.org/10.5194/egusphere-egu26-4908, 2026.

Thailand is a major national source of methane (CH₄) from irrigated rice, yet its national greenhouse gas inventory applies fixed IPCC Tier-2 seasonal emission factors. Tier-2 follows the IPCC scaling-factor framework but replaces default parameters with country- or region-specific values derived from local data. For irrigated rice in Thailand’s Central/Southern region, the inventory applies fixed seasonal factors of 143 and 71.8 kg CH₄ ha⁻¹ season⁻¹ for the main and second crops, respectively, which may not reflect heterogeneity in farm management and soils. Using survey and soil data from irrigated farms in Central Thailand, we evaluated the sensitivity of estimated seasonal CH₄ emissions to water regime, residue management, and soil organic carbon (SOC) by comparing Thailand’s Tier-2 reference with four estimation approaches:  IPCC, (2019) and the empirical/statistical models of Yan et al. (2005), Wang et al. (2018), and Nikolaisen et al. (2023). For the analysed farms, multiple drainage water management was common (54.0% in the main crop; 52.8% in the second crop), while straw incorporation occurred in 38.7% of farms before the main crop and 27.8% before the second crop. Sensitivity was quantified using a structured scenario framework. Scenario 0 was a counterfactual baseline (continuous flooding, no residue inputs). Water effects were isolated as Scenario A−0, residue effects as Scenario B−0, and combined effects under current practices as Scenario C−0. In the main season, drainage effects were negative for 149 of the 150 farms. Residue effects produced large upper-quartile increases (Q3 = 295–390 kg CH₄ ha⁻¹ season⁻¹ across models). Under current practices, the median net effect remained negative, but high-emitting cases persisted. Across seasons, empirical/statistical models produced higher medians and wider farm-to-farm distributions than the Thai Tier-2 reference factors. SOC further structured variability under current practices, with farms >2% SOC disproportionately represented among the highest estimated emitters. These results indicate that fixed seasonal emission factors can mask management and soil heterogeneity, and that more detailed activity data on drainage techniques, residue incorporation, and soil carbon status are necessary to improve Thai rice methane inventories.

Reference

IPCC. (2019). 2019 Refinement to the 2006 IPCC Guidelines for National Greenhouse Gas Inventories: Volume 4: Agriculture, Forestry and Other Land Use (E. Calvo Buendia, K. Tanabe, A. Kranjc, J. Baasansuren, M. Fukuda, S. Ngarize, A. Osako, Y. Pyrozhenko, P. Shermanau, & S. Federici, Eds.). IPCC. https://www.ipcc-nggip.iges.or.jp/public/2019rf/vol4.html

Nikolaisen, M., Cornulier, T., Hillier, J., Smith, P., Albanito, F., & Nayak, D. (2023). Methane emissions from rice paddies globally: A quantitative statistical review of controlling variables and modelling of emission factors. Journal of Cleaner Production, 409, 137245. https://doi.org/10.1016/j.jclepro.2023.137245

Wang, J., Akiyama, H., Yagi, K., & Yan, X. (2018). Controlling variables and emission factors of methane from global rice fields. Atmospheric Chemistry and Physics, 18(14), 10419–10431. https://doi.org/10.5194/acp-18-10419-2018

Yan, X., Yagi, K., Akiyama, H., & Akimoto, H. (2005). Statistical analysis of the major variables controlling methane emission from rice fields. Global Change Biology, 11(7), 1131–1141. https://doi.org/10.1111/j.1365-2486.2005.00976.x

How to cite: Sudto, T., Mcbey, D., Smith, P., and Vetter, S.: Sensitivity of methane estimates for irrigated rice in Thailand: A comparison of Tier-2 factors and empirical models regarding water and residue management, EGU General Assembly 2026, Vienna, Austria, 3–8 May 2026, EGU26-5801, https://doi.org/10.5194/egusphere-egu26-5801, 2026.

EGU26-7237 | ECS | Posters on site | BG3.21

CO2, water and energy fluxes over a cropland in central Germany 

Christian Markwitz, Anas Emad, Paulina Englert, Ana Meijide, Christiane Münter, Edgar Tunsch, and Alexander Knohl

The management of cropping systems can substantially impact the amount of CO2 emitted, such as during fertilisation, tillage and bare soil conditions. Smart and optimised management practices can promote sustainable farming allowing for maximum yields and fertile soils at the same time. This study aims to investigate the impact of management interventions on CO2 and energy fluxes at a cropland site in central Germany.

In our study, continuous CO2, water, and energy fluxes have been measured at the Reinshof (DE-Rns; 51°29'24.0"N, 9°55'55.2"E) agricultural FLUXNET site near Göttingen, Germany, since 2021. The field is conventionally managed, with a typical crop rotation (winter barley, sugar beet, winter wheat), deep tillage and received both organic and mineral fertilisation. Measurements are performed at a 6.5 m tall flux tower equipped with an eddy covariance setup (uSONIC3-omni Cage MP, METEK; LI7200, LI-COR) for CO2, water, and energy fluxes, as well as ancillary meteorological instruments.

The results indicate that gross primary productivity and ecosystem respiration were the highest during the cultivation of sugar beet compared to all cereals grown in the other years (wheat and barley), with values that were 20% and 6% higher, respectively. This resulted in a 50% higher net ecosystem productivity. Evapotranspiration was 21% higher than for the other crops. The high productivity of sugar beet in terms of carbon and ET fluxes can be explained by (i) its high natural efficiency in sequestering carbon, (ii) the extended growing season and (iii) the higher leaf area index compared to cereals (wheat or barley). Despite the higher fluxes, the annual water use efficiency of sugar beet was similar to that of wheat and barley. Furthermore, we demonstrate that bare soil conditions lead to carbon losses, which could be mitigated through the extended cultivation of cover crops.

In conclusion, both management and crop rotation had the greatest impact on the variability of annual carbon and evapotranspiration budgets, suggesting that management plays a relevant role in carbon and water fluxes in croplands and can be used to increase the carbon uptake.

How to cite: Markwitz, C., Emad, A., Englert, P., Meijide, A., Münter, C., Tunsch, E., and Knohl, A.: CO2, water and energy fluxes over a cropland in central Germany, EGU General Assembly 2026, Vienna, Austria, 3–8 May 2026, EGU26-7237, https://doi.org/10.5194/egusphere-egu26-7237, 2026.

EGU26-7295 | Posters on site | BG3.21

Field evaluation of winter rye as a biological nitrification inhibitor to reduce nitrous oxide emissions 

Nanna Baggesen, Franziska Eller, Louise Mortensen, Esben Lykke, and Cecilie Nielsen

Agriculture is under increasing pressure to reduce greenhouse gas emissions as part of global efforts to mitigate climate change and ensure sustainable food production. Among these emissions, nitrous oxide (N₂O) is a particularly potent greenhouse gas, largely originating from agricultural soils, which makes effective mitigation strategies crucial. Winter rye has been identified as a potential biological nitrification inhibitor due to its release of the compound 6-methoxy-2-benzoxazolinone (MBOA) by the roots. This compound suppresses nitrifying bacteria, thereby reducing the conversion of ammonia to nitrate in soil systems and ultimately lowering N₂O emissions. Unlike chemical nitrification inhibitors, whose environmental side effects remain insufficiently understood, biological nitrification inhibitors occur naturally and offer a promising, sustainable alternative for reducing emissions in agricultural systems. We tested the nitrification inhibiting effect of MBOA in Danish fields under common Danish farming practices. The aim was to determine the degree of N₂O reduction by winter rye, compared to cereals without a biological nitrification function. If successful, winter rye could be a low-emission substitute for similar crops, providing farmers with a practical tool to reduce greenhouse gas emissions without compromising crop management, aligning with EU climate targets and sustainable agriculture goals. Three field trials were conducted in West Jutland, Denmark. Winter wheat was selected as a control species with no genes producing MBOA. To account for different N-demands in rye and wheat, both species received three different N-treatments: 0, 130 and 190 kg N ha-1, respectively. We measured N₂O emissions 20 times during the growing season using the static chamber method along with soil N contents and -moisture. As expected, N₂O emissions increased with increasing N amounts applied in both species. Although variability was observed among trials, results indicated an overall trend toward lower N₂O emissions from winter rye compared to winter wheat under the high N application (p < 0.07). These findings suggest that winter rye can act as a biological nitrification inhibitor under field conditions, contributing to reduced N₂O emissions and supporting agricultural practices with lower carbon footprints. Further trials will assess the consistency of these effects across varying weather conditions, aiming to strengthen recommendations for large-scale implementation. If confirmed, this strategy could offer a scalable, low-cost approach to reducing agricultural greenhouse gas emissions without major changes to current farming systems.

How to cite: Baggesen, N., Eller, F., Mortensen, L., Lykke, E., and Nielsen, C.: Field evaluation of winter rye as a biological nitrification inhibitor to reduce nitrous oxide emissions, EGU General Assembly 2026, Vienna, Austria, 3–8 May 2026, EGU26-7295, https://doi.org/10.5194/egusphere-egu26-7295, 2026.

EGU26-7426 | Orals | BG3.21

An Eddy Covariance System to Quantify Fluxes of Pesticides in an Agricultural Environment 

Ujjawal Arora, Hugh Coe, Thomas Bannan, James Allan, Laura Cardenas, Michael Flynn, Rongrong Wu, Emily Matthews, and Sam Johnston

Synthetic pesticides applied in agricultural fields to control pests can volatilize into the atmosphere in either gas or particle phase (Rajmohan et al., 2020). Understanding the biosphere–atmosphere exchange of these compounds is crucial, as this exchange influences various atmospheric chemical processes that ultimately determine the environmental fate of pesticides. However, data quantifying these processes remain limited (Hörtnagl et al., 2010).

This work aims to test the eddy covariance flux system developed by combining a High-Resolution Time of Flight Iodide Chemical Ionization Mass Spectrometer (HR-TOF-I-CIMS) which measures a wide range of compounds including pesticides in the atmosphere at 10 Hz, with a Sonic Anemometer which gives high frequency vertical wind speed. These two observations can be combined to obtain the biosphere to atmosphere exchange of pesticides.

Here we are going to present the results from the campaign which was conducted from 20th march to 14th April 2025, at an arable farm located in Rothamsted Research, Okehampton, Devon (50°46'26.4"N 3°54'11.2"W). The site had minimal local obstructions, essential to capture well developed turbulent eddies.

The measurements were done at a height of 3.6 m above ground and the I-CIMS was kept in a temperature-controlled trailer with a heated inlet mounted at the top of the trailer connecting the two instruments.

Initial results indicate successful capture of atmospheric turbulence, with a footprint extent of approximately 350 m in both directions at the given measurement height. Flux footprint analysis (Figure), performed using a simple two-dimensional parameterization model (Kljun et al., 2015), revealed major contributions from the SE and NW directions.

Additionally, preliminary results with targeted analysis via CIMS for fluxes of specific compounds will be presented, validating system performance, followed by spectra and cospectra analysis that reveals the contributions across different frequency scales.


How to cite: Arora, U., Coe, H., Bannan, T., Allan, J., Cardenas, L., Flynn, M., Wu, R., Matthews, E., and Johnston, S.: An Eddy Covariance System to Quantify Fluxes of Pesticides in an Agricultural Environment, EGU General Assembly 2026, Vienna, Austria, 3–8 May 2026, EGU26-7426, https://doi.org/10.5194/egusphere-egu26-7426, 2026.

EGU26-9109 | Orals | BG3.21

Simulating CO2 and N2O emissions from sub-Saharan African croplands under conservation agriculture  

Yélognissè Frédi Agbohessou, Armwell Shumba, Souleymane Diop, Jean-Alain Civil, Gatien N. Falconnier, Antoine Couëdel, Regis Chikowo, Marc Corbeels, Johan Six, Christian Thierfelder, and Rémi Cardinael

Agricultural ecosystems are significant contributors to greenhouse gas (GHG) emissions, yet they also offer mitigation potential through soil carbon sequestration and improved nutrient management. However, field-based assessments of major GHG emissions (e.g., CO2 and N2O) remain scarce in croplands in sub-Saharan African (SSA), limiting the development of region-specific mitigation strategies. Process-based crop-soil models can complement experimental studies by explicitly representing the biogeochemical processes controlling gas fluxes and by assessing the impacts of management practices.

In this study, we applied the STICS (Simulateur mulTIdisciplinaire pour les Cultures Standard, (Brisson et al., 2003)) soil-crop model to simulate soil CO2 and N2O emissions at two experimental sites in Zimbabwe: the Domboshava Training Centre (DTC; abruptic lixisols), and the University of Zimbabwe Farm (UZF; xanthic ferralsols). The model represents key processes governing CO2 and N2O production from soil, including decomposition, nitrification, and denitrification, as well as their main environmental drivers (soil temperature, water-filled pore space, ammonium and nitrate availability). Model outputs were evaluated against field GHG measurements done between 2019 and 2021 at both sites across six treatments, each replicated four times: conventional tillage, conventional tillage with rotation, no-tillage, no-tillage with mulch, no-tillage with rotation, no-tillage with mulch and rotation. Soil CO2 emissions were simulated by combining STICS-simulated heterotrophic respiration with an independent autotrophic respiration module accounting for root respiration. After calibration, the model reproduced the main environmental drivers of soil CO2 and N2O emissions reasonably well. The simulated and measured soil CO2 emissions showed moderate agreement at the daily scale (R2 = 0.40, RMSE = 18.1 kg C ha-1 d-1, EF = 0.28) and strong agreement for cumulative emissions (R2 = 0.87, RMSE = 800.74 kg C ha-1, EF = 0.84). Simulated N2O emissions were of the same order of magnitude as the observations across all treatments (observed range: 0-0.0126 kg N ha-1 d-1; simulated range: 0-0.0132 kg N ha-1 d-1). However, both daily and cumulative emissions were overestimated across treatments, particularly during the 2020-2021 season at UZF, potentially reflecting missed short-lived emission pulses due to non-continuous measurements. Across all treatments, simulated and observed mean seasonal N2O emissions ranged from 0.155 to 0.580 kg N ha-1 and 0.154 to 0.285 kg N ha-1, respectively (R2 = 0.15, RMSE = 0.18 kg N ha-1, EF = -3.26). Overall, this modelling framework provides a useful tool to further explore the effects of crop management practices on GHG emissions in cropping systems in SSA.

How to cite: Agbohessou, Y. F., Shumba, A., Diop, S., Civil, J.-A., Falconnier, G. N., Couëdel, A., Chikowo, R., Corbeels, M., Six, J., Thierfelder, C., and Cardinael, R.: Simulating CO2 and N2O emissions from sub-Saharan African croplands under conservation agriculture , EGU General Assembly 2026, Vienna, Austria, 3–8 May 2026, EGU26-9109, https://doi.org/10.5194/egusphere-egu26-9109, 2026.

EGU26-10013 | ECS | Orals | BG3.21

Effects of regenerative agricultural measures on soil nitrous oxide emissions in organic farming 

Wolfgang Aumer, Carolyn-Monika Görres, Carolina Bilibio, Wiebke Niether, Simeon Leisch, Stephan Martin Junge, Tobias Karl David Weber, Andreas Gattinger, Stephan Peth, Maria Renate Finckh, and Claudia Kammann

Agricultural soils represent a significant source of greenhouse gas (GHG) emissions at the global scale, with nitrous oxide (N2O) playing a major role. Promoting more sustainable agricultural practices is not only essential for climate change adaptation, but also for mitigating emissions from agriculturally used soils. Several management measures may contribute to both mitigation and adaptation, including long-term low-intensity tillage systems. When combined with other management measures associated with regenerative agriculture, such as intensive intercropping and undersowing, compost and mulch applications, and the use of biostimulants, their effects on N2O emissions are poorly understood. The objective of this study was to assess the impact of these management practices on soil N2O emissions.

Since 2010, the factors tillage, compost, and mulching, and since 2020 the factor vitalization (compost tea and ferments), have been implemented in a split-plot design with fourfold repetition in an organically managed long-term field experiment on a Luvisol in central Germany. Five treatments ranging from conventional ploughing to progressively intensified regenerative management (reduced tillage, reduced tillage with compost, reduced tillage with compost and mulch, and reduced tillage with compost, mulch, and vitalization) were selected for weekly N2O flux measurements (closed static chamber method). Emissions were monitored from October 2021 to October 2023, covering winter intercrop vetch-triticale, potato cultivation, and a winter wheat-pea mixture. During potato cropping, reduced tillage plots were tilled to a depth of 0.12 m prior to planting, and mulching was applied as dead mulch (green rye, C:N ratio of 39:1). Living mulch was established in the winter wheat-pea mixture as an undersown crop (clover and ryegrass).

Cumulative emissions (728 days) were 9.28 (standard error: ±0.78) kg N2O-N ha-1 in the ploughed control treatment, whereas reduced tillage without additional factor combination resulted in slightly lower emissions of 8.06 (±0.53) kg N2O-N ha-1. Compost application with reduced tillage promoted slightly higher emissions compared to the ploughed control with 10.20 (±0.75) kg N2O-N ha-1. However, the combination of reduced tillage, compost, and mulching significantly reduced emissions compared to reduced tillage with compost alone, resulting in 6.90 (±0.35) kg N2O-N ha-1.  The factor vitalization on top of the reduced tillage, compost, and mulching treatment showed no further effect, with 7.17 (±0.79) kg N2O-N ha-1. Mulching contributed to the emission reduction through the combined effects of dead and living mulch: dead mulch effectively damped soil temperatures, reducing heat stress during the warm, dry summer of 2022, which likely enhanced nitrogen (N) uptake by the potatoes, in combination with nitrogen immobilization due to its high C:N ratio, thereby reducing a high post-harvest N2O emission peak observed across all treatments. In the winter wheat-pea mixture, two consecutive emission peaks occurred post-harvest; these were mitigated by the enhanced growth of the undersown living mulch, likely resulting in N uptake during this critical period. Our findings indicate that mulching can overcompensate the tendency of long-term compost applications to increase N2O emissions when both management measures are combined.

How to cite: Aumer, W., Görres, C.-M., Bilibio, C., Niether, W., Leisch, S., Junge, S. M., Weber, T. K. D., Gattinger, A., Peth, S., Finckh, M. R., and Kammann, C.: Effects of regenerative agricultural measures on soil nitrous oxide emissions in organic farming, EGU General Assembly 2026, Vienna, Austria, 3–8 May 2026, EGU26-10013, https://doi.org/10.5194/egusphere-egu26-10013, 2026.

EGU26-11923 | ECS | Orals | BG3.21

Seasonal and Temporal Variability and drivers of Nitrous Oxide Emissions from Northern Agriculture Soil 

Karuna Rao, Markku koskinen, Annalea Lohila, Alexander Buzacott, Mika Korkiakoski, Henriikka Vekuri, Tatu Polvinen, and Mari Pihlatie

Agricultural soils are the largest anthropogenic source of nitrous oxide (N₂O), a potent greenhouse gas and an ozone-depleting substance. We investigated the seasonal and diurnal variability of N₂O fluxes and their controlling factors in an agricultural ecosystem at the SMEAR-Agri Viikki site (Helsinki, Finland) over three years. The field was cultivated with timothy (Phleum pratense) in 2022 and was renewed in spring 2023 with barley (Hordeum vulgare) undersown with red clover (Trifolium pratense) and grasses; in 2024 the site was managed for silage production. N₂O emissions in 2022 showed no consistent seasonal pattern but a high early-summer emission peak, whereas 2023 and 2024 were characterised by multiple emission events with smaller magnitudes. Minimum fluxes occurred in autumn 2022 (0.003 µg m⁻² s⁻¹), winter 2023 (0.008 µg m⁻² s⁻¹) and summer 2024 (0.006 µg m⁻² s⁻¹). The highest fluxes were observed in 2022 summer (0.089 µg m⁻² s⁻¹) and spring (0.088 µg m⁻² s⁻¹), while peak emissions in 2023 (0.028 µg m⁻² s⁻¹) and 2024 (0.032 µg m⁻² s⁻¹) occurred during autumn. Our results highlight strong interannual variability in both the timing and magnitude of N₂O emissions, likely linked to changes in crop N utilization and management, soil conditions and meteorological drivers. Seasonal variations in N₂O emissions during spring, summer and autumn were primarily driven by soil and meteorological factors, including air and soil temperature, soil moisture, water-filled pore space, electrical conductivity and redox potential. During winter, however, N₂O fluxes showed little association with these variables, suggesting a shift in controlling processes under cold conditions. Overall, the findings reveal substantial seasonal and interannual complexity in N₂O dynamics and underscore the importance of integrating soil conditions, management practices and seasonal context when assessing and mitigating N₂O emissions from managed agricultural systems.

Keywords: Nitrous oxide flux, greenhouse gas, seasonal variability, agricultural ecosystems, soil moisture, temperature.

How to cite: Rao, K., koskinen, M., Lohila, A., Buzacott, A., Korkiakoski, M., Vekuri, H., Polvinen, T., and Pihlatie, M.: Seasonal and Temporal Variability and drivers of Nitrous Oxide Emissions from Northern Agriculture Soil, EGU General Assembly 2026, Vienna, Austria, 3–8 May 2026, EGU26-11923, https://doi.org/10.5194/egusphere-egu26-11923, 2026.

EGU26-12032 | ECS | Posters on site | BG3.21

Effectiveness and key drivers of nitrification inhibitors in mitigating N2O Emissions in a cool temperate climate: A Meta-analysis 

Louise Hindborg Mortensen, Azeem Tariq, Nanna S. Baggesen, Cecilie Skov Nielsen, Esben Høegholm Lykke, Sander Bruun, Søren O. Petersen, and Franziska Eller

Agricultural systems are a major source of nitrous oxide (N2O) emissions. Nitrous oxide is a potent greenhouse gas (GHG) emitted from managed grasslands and croplands, primarily as a result of nitrogen fertilization. Reducing nitrogen inputs alone can mitigate N2O emissions, but this may compromise crop productivity. Alternative mitigation strategies are therefore required to sustain food production while reducing GHG emissions. Currently one of the most promising strategies to do that is the use of nitrification inhibitors (NIs).

Nitrification inhibitors act by suppressing the activity of nitrifying microorganisms for a period, thereby slowing the conversion of ammonium to nitrate. This reduces N2O emissions from ammonia oxidation and the availability of nitrate for subsequent denitrification and associated N2O emission. Fertilizers amended with NIs may improve plant nitrogen uptake and reduce nitrogen losses. In a second-order meta-analysis, Grados et al (2022) found an average reduction of 44 % in N2O emissions when NIs are used as fertilizer amendment. However, effects may vary among studies, potentially due to variable soil and climate conditions, as well as different management (time, rate and method of application).

To obtain a more robust estimate of the effectiveness and key drivers of nitrification inhibitors under temperate conditions, we conducted a meta-analysis of studies reporting cumulative N2O emissions from NI-amended fertilization in northern European climate. Literature was identified using Web of Science (all databases) by combining search terms related to nitrous oxide and nitrification inhibitors. The initial search yielded 9,387 references, which were filtered using exclusion terms implemented in R, followed by manual screening of approximately 100 abstracts. In total, 43 studies met the inclusion criteria and were included in the analysis.

Preliminary results based on studies from Denmark only (n= 10) show a statistically significant average decrease of 40% in N2O emissions, when NIs are used as fertilizer amendment. However, factors such as sand content and concentration of nitrogen applied significantly affect the inhibitors mitigation efficiency.

Reference: Grados et al 2022 Environ. Res. Lett. 17 114024, DOI 10.1088/1748-9326/ac9b50

How to cite: Hindborg Mortensen, L., Tariq, A., S. Baggesen, N., Skov Nielsen, C., Høegholm Lykke, E., Bruun, S., O. Petersen, S., and Eller, F.: Effectiveness and key drivers of nitrification inhibitors in mitigating N2O Emissions in a cool temperate climate: A Meta-analysis, EGU General Assembly 2026, Vienna, Austria, 3–8 May 2026, EGU26-12032, https://doi.org/10.5194/egusphere-egu26-12032, 2026.

Nitrogen losses following fertilizer application not only cause nutrient loss to the crops, but also have negative environmental impacts, including ammonia (NH3) and greenhouse gas emissions (GHG) (e.g., nitrous oxide, N2O). Numerous studies have been carried out to investigate the efficiency of fertilizer use, aiming to increase crop yield and reduce environmental impacts including GHG and other gaseous emissions. There are different measurement approaches of quantifying gaseous nitrogen (N) losses, and static chamber methods are the most commonly used approach for directly measuring emissions from soils. However, chambers interfere with the soil environment, the small measurement footprint of chambers is unable to represent the large source area and are poorly suited for long-term measurements. Here, we demonstrated the use of slant-path Fourier transform infrared spectroscopic (FTIR) technique to continually measure NH3 and N2O emission rates from wheat crops for 4 weeks following fertilizer application. The study was conducted in a wheat farm in Victoria, Australia in winter season in August 2025. Urea with (treatment) and without (control) a urease inhibitor was applied to the wheat crop at a rate of 98 kg N/ha. Line-averaged concentrations of NH3 and N2O from each plot were continually measured with vertically separated measurement paths using an OP-FTIR and wind information was recorded by a 3-D sonic anemometer. Fifteen-min average NH3 and N2O emission rates were calculated based on the measured concentrations and wind information. The results showed that NH3 emission rates increased immediately after urea was applied, with greater increase than the untreated urea. Ammonia emission rates from the urease inhibitor treatment increased in the third week following fertilization, while ammonia emission rates from the control site started decreasing. Preliminary results show that the accumulative NH3 and N2O emissions from the urea plot were ~3 and 1.6 times higher than that from the urease inhibitor treated plot, respectively. The higher NH3 and N2O emissions following non-treatment urea application highlighted the benefits of a urease inhibitor for reducing N loss under high ambient temperature and lack of rainfall for 2 weeks following fertilization. Further benefits could be achieved in N use efficiency by reducing the N application rate when using the urease inhibitor.

How to cite: Bai, M., Pandy, A., Chen, D., and Suter, H.: The use of slant-path FTIR techniques to measure gaseous N loss in Australian dryland wheat following urea/urease inhibitors fertilizers application, EGU General Assembly 2026, Vienna, Austria, 3–8 May 2026, EGU26-15845, https://doi.org/10.5194/egusphere-egu26-15845, 2026.

EGU26-16420 | Posters on site | BG3.21

An open-path nitrous oxide laser analyzer for eddy covariance flux and mobile monitoring applications 

Ruisheng Jiang, Kai Wang, Chenxia Su, Ting-Jung Lin, Weihao Shen, Daniel Wilson, and Yin Wang

Nitrous oxide (N₂O) is a major agricultural greenhouse gas and a reactive nitrogen species that drives climate forcing and environmental degradation. Its low ambient concentration and episodic bursts following fertilization or rainfall make detection difficult, requiring instruments capable of high sensitivity and temporal resolution to capture rapid flux dynamics.

This work introduces an open-path N2O laser analyzer (Model: HT8500, HealthyPhoton Co., Ltd.) designed for future applications in N₂O monitoring and EC flux measurements. The HT8500 utilizes an quantum cascade laser (QCL) to probe the mid-infrared transition of N2O at 4.54 μm. Laboratory experiments revealed that the HT8500 has a noise level of 0.3 ppbv at a 10-Hz sampling rate with a typical power consumption < 25 Watts.

A long-term field experiment based on the HT8500 over a bare agricultural field in Shandong, China was conducted to test “zero-flux” measurements and computations under different meteorological conditions. The resulting minimum detectable flux (~26.549 μg N m⁻² h⁻¹) indicates performance comparable to commercially available chamber-based N2O flux measurement scenarios.

In the experiments conducted in Northeast China, the fertilization period was concluded. As temperatures decrease, the diurnal variation in N2O fluxes dropped significantly, indicating the influence of temperature on eddies when emission sources remain stable. Continued evaluation will clarify how climate conditions and agricultural practices shape flux variability.

Such analyzer was also deployed on a EV based plume sensing platform (Farizon SV), along with open-path NH3, CH4, H2O laser analyzers (model HT8700, HT8600P, respectively). We conducted mobile monitoring campaigns at wastewater treatment plants in Jinan, Beijing and Shanghai, all employed the Anaerobic–Anoxic–Oxic (AAO) process. Synchronized plume signals of GHGs above background were detected, with CH₄:N₂O concentration ratios ranging from 4.06:1 to 5.93:1, indicative of anaerobic contributions and process-dependent emission signatures.

How to cite: Jiang, R., Wang, K., Su, C., Lin, T.-J., Shen, W., Wilson, D., and Wang, Y.: An open-path nitrous oxide laser analyzer for eddy covariance flux and mobile monitoring applications, EGU General Assembly 2026, Vienna, Austria, 3–8 May 2026, EGU26-16420, https://doi.org/10.5194/egusphere-egu26-16420, 2026.

EGU26-16779 | ECS | Posters on site | BG3.21

Water Management Alters Emission Behaviour: Comparative Analysis of Methane Flux Drivers in Three Rice Systems Using Generalised Additive Models  

Jef Zerrudo, Laurent Bataille, Ronald Hutjes, Bart Kruijt, Björn Ole Sander, Caesar Arloo Centeno, and Reiner Wassmann

Alternate Wetting and Drying (AWD) is widely advocated as a strategy to reduce methane (CH4) emissions from rice paddies by decreasing the duration of flooding. However, AWD implementation can differ substantially across climatic regions and agricultural systems. It is not yet established whether water management affects only the magnitude of CH4 emissions or also modifies the dominant environmental controls governing sub-daily flux variability, particularly the interaction between water status, temperature, and other micrometeorological variables. 

The current research evaluates whether different water-management regimes yield distinct emission-control outcomes by comparing the nonlinear hierarchies of ecological drivers influencing half-hourly CH4 fluxes across three rice systems: continuously flooded (CF) and two distinct AWD practices. 

Half-hourly CH4 fluxes and associated drivers were analysed from three rice systems: the Philippines, Japan, and South Korea. Fluxes were standardised and paired with engineered hydrologic and micrometeorological predictors, including water depth, depth-change rates, hydroperiod integral (hydrologic memory), psychrometric variables, diurnal harmonics, and interaction terms. Multivariate generalised additive models (GAMs) were constructed using normalised predictors and assessed with 80/20 train–validation splits. The importance of each driver was determined using permutation ΔRMSE and drop-one diagnostics. 

Three distinct emission-control regimes were identified. In Japan (characterised by continuous flooding), moderate mean emissions (5.70 mg CH4 m−2 h−1) were regulated mainly by water–temperature interactions, suggesting thermal buffering by standing water. South Korea (AWD with regular wet–dry cycling) exhibited the highest emissions (16.71 mg CH4 m−2 h−1) and a transition toward direct atmospheric forcing, with air temperature as the dominant predictor and minimal influence from water–temperature interactions. The Philippines (aerobic-dominated AWD) demonstrated the lowest emissions (1.92 mg CH4 m−2 h−1), with hydrologic memory and dryness as the primary modulators. 

Water management influences both the magnitude of CH4 emissions and the dominant controlling mechanisms: thermal buffering prevails under continuous flooding, atmospheric forcing under frequent wet–dry cycling, and hydrologic memory under aerobic-dominated AWD. Our analysis shows that AWD encompasses fundamentally different emission regimes. The climate benefits of AWD depend on drainage depth, cycle frequency, and the persistence of aerobic conditions. An AWD typology that distinguishes practices by their dominant control mechanisms is suggested to strengthen emission inventories, MRV frameworks, and management guidance.

How to cite: Zerrudo, J., Bataille, L., Hutjes, R., Kruijt, B., Sander, B. O., Centeno, C. A., and Wassmann, R.: Water Management Alters Emission Behaviour: Comparative Analysis of Methane Flux Drivers in Three Rice Systems Using Generalised Additive Models , EGU General Assembly 2026, Vienna, Austria, 3–8 May 2026, EGU26-16779, https://doi.org/10.5194/egusphere-egu26-16779, 2026.

EGU26-17123 | Posters on site | BG3.21

Simultaneous flux monitoring of 10 trace and greenhouse gases with a single instrument ideal for complex agricultural ecosystems 

Jonas Bruckhuisen, Etienne Smith, and Christophe Espic

Monitoring as many trace and greenhouse gas fluxes as possible is essential for understanding the interactions between the atmosphere, vegetation, and soil, the key components of agricultural ecosystems. In these complex environments, capturing a complete flux budget requires the simultaneous measurement of a wide range of inert and reactive trace gases, as well as greenhouse gases.

Until recently, gas flux monitoring was typically limited to just a few gases per instrument, making the process both complex and costly while offering only a partial view of emitted gas composition. MIRO Analytical has addressed this limitation by developing a novel multi-compound gas analyzer capable of simultaneously measuring up to 10 air pollutants (CO, NO, NO2, O3, SO2 and NH3), greenhouse gases (CO2, N2O, H2O, CH4 and C2H6) and other atmospheric trace gases such as OCS, HONO and CH2O at ppb or even ppt levels.

One single analyzer can be used to conduct eddy covariance (EC) measurements, which require a high temporal resolution. With a cell turnover time below 0.1 seconds, our compact instrument combining multiple mid-infrared quantum cascade lasers delivers true 10 Hz sampling with exceptional precision. The very same analyzer can also be used to measure fluxes captured by (soil-)incubation chambers. It can be installed on mobile platforms and is field deployable.

In this contribution, we showcase the capabilities of our all-in-one flux monitor through application examples that demonstrate unique combinations of up to 10 trace and greenhouse gases measured with the EC or flux gradient technique, as well as on-field and lab chamber measurements.

How to cite: Bruckhuisen, J., Smith, E., and Espic, C.: Simultaneous flux monitoring of 10 trace and greenhouse gases with a single instrument ideal for complex agricultural ecosystems, EGU General Assembly 2026, Vienna, Austria, 3–8 May 2026, EGU26-17123, https://doi.org/10.5194/egusphere-egu26-17123, 2026.

EGU26-18177 | Posters on site | BG3.21

Effects of nitrification inhibitors on growing‑season N₂O emissions in Danish grain systems: evidence from multi‑site field trials 

Cecilie Skov Nielsen, Nanna Schrøder Baggesen, Esben Høgholm Lykke, Louise Hindborg Mortensen, Martin Nørregaard Hansen, Mette Kramer Langgaard, and Franziska Petra Eller

Nitrous oxide (N2O) is an important greenhouse gas from agricultural systems. Nitrification inhibitors can potentially reduce N2O emissions from field fertilization, but evidence from cool, wet climates under real farm conditions are limited.

Here we present results from a Danish multi-site program carried out in commercial farms across five different regions and soil classes (coarse sandy to loamy) in 2021-2025 focusing on winter wheat and spring barley. Fertilization practices included ammonium nitrate and organic fertilizers (cattle slurry, pig slurry and digestate). The organic fertilizer treatments included a synthetic “starter fertilizer” to reflect Danish practice, and organic fertilizers were only applied in regions where they predominate. The fertilizer treatments were included with and without nitrification inhibitors, primarily 3,4-dimethylpyrazole phosphate (DMPP) and in selected trials nitrapyrin.

N₂O fluxes were measured in situ using static chambers once weekly during the growing season and twice weekly for three weeks after fertilizer applications to capture short‑lived emission pulses. Air and soil temperature, precipitation and volumetric soil water content were logged at high frequency. Cumulative growing‑season emissions were derived by linear interpolation and trapezoidal integration.

Preliminary results show an average reduction in N2O emissions of about 20-50 % across field trials with differences in efficiency of nitrification inhibitors being related to parameters such as crop type. Further data on growing‑season N₂O emission responses to nitrification inhibitors across crops, fertilizer types, and soils will be presented, and the potential and limitations of this mitigation option will be discussed.

How to cite: Skov Nielsen, C., Schrøder Baggesen, N., Høgholm Lykke, E., Hindborg Mortensen, L., Nørregaard Hansen, M., Kramer Langgaard, M., and Eller, F. P.: Effects of nitrification inhibitors on growing‑season N₂O emissions in Danish grain systems: evidence from multi‑site field trials, EGU General Assembly 2026, Vienna, Austria, 3–8 May 2026, EGU26-18177, https://doi.org/10.5194/egusphere-egu26-18177, 2026.

EGU26-18869 | ECS | Orals | BG3.21

Seasonal dynamics of CO2, CH4 and N2O fluxes and evapotranspiration in an organically managed cropping system 

Farshid Jahanbakhshi, Najeeb Al-Amin Iddris, Mattia Bonazza, Sheila Kraus, Vilna Tyystjärvi, and Ana Meijide

Fluxes of carbon dioxide (CO2), methane (CH4) and nitrous oxide (N2O) from croplands, as well as evapotranspiration (ET) are regulated by complex interactions among abiotic and biotic factors, which are strongly modified by environmental conditions, crop growth and management practices. This study investigated how CO2, CH4 and N2O fluxes and ET developed during the cultivation of spring wheat and the subsequent cover crop (oil radish) in an organic farming field at the Wiesengut experimental farm of the University of Bonn, located in Rhein-Sieg district of Germany. Since March 2025, we continuously monitor net ecosystem CO₂ exchange and evapotranspiration using the eddy covariance technique. In parallel, we conducted weekly measurements of CO2, CH4 (starting in July 2025) and N2O (since May 2025) fluxes using static chambers and laser-based CO2/CH4/H2O and N2O/H2O analyzers and monitored soil mineral nitrogen.

Eddy covariance data showed sustained CO2 uptake during the spring wheat growing season with mean NEE of -8.49 ± 0.62 µmol m-2 s-1during the mid-season (32-102 days after sowing). The harvest, incorporation of crop residues and manure application resulted in slightly positive NEE fluxes, which then fluctuated close to zero during the oil radish period in autumn and winter. ET fluxes were also associated with crop development, with largest fluxes measured in mid-June 2025.  Carbon dioxide fluxes measured with the chambers in the ripening stage of spring wheat, July 2025, indicated moderate soil and plant respiration, while after harvest and soil management operations CO2 efflux increased and became more variable, reaching peak values of up to 12.34 ± 2.3 µmol m-2 s-1. Methane fluxes were predominantly negative throughout the study, indicating that the soil acted mainly as a methane sink. The strongest uptake occurred in the limited pre-harvest measurements, reaching -61.76 ± 7.7 µg CH4 m-2 h-1. After harvest and soil disturbance, CH4 uptake weakened, with fluxes approaching zero during late autumn. Nitrous oxide fluxes exhibited clear seasonal dynamics showed generally low emissions during most of the spring wheat growing season, fluctuating around zero. In contrast, strong and short-lived emission peaks occurred after harvest and subsequent management operations, with maximum fluxes reaching 66.47± 14.14 µg N2O-N m-2 h-1. During the oil radish period, fluxes rapidly declined and remained mostly low, with only occasional episodic increases.

Our results demonstrate that greenhouse-gas and water dynamics in organic cropping systems vary strongly across crop and cover-crop phases and are tightly coupled to post-harvest management. These findings improve process-based understanding of GHG fluxes in organic rotations, including cover crops, and support the development of mitigation strategies for climate-smart agriculture.

How to cite: Jahanbakhshi, F., Iddris, N. A.-A., Bonazza, M., Kraus, S., Tyystjärvi, V., and Meijide, A.: Seasonal dynamics of CO2, CH4 and N2O fluxes and evapotranspiration in an organically managed cropping system, EGU General Assembly 2026, Vienna, Austria, 3–8 May 2026, EGU26-18869, https://doi.org/10.5194/egusphere-egu26-18869, 2026.

EGU26-19694 | Posters on site | BG3.21

Climate Forcing of Bioenergy Feedstocks: Insights FromCarbon and Energy Flux Measurements 

Carl Bernacchi, Bethany Blakely, Caitlin Moore, Taylor Pederson, Christy Gibson, Michael Benson, and Evan Dracup

Bioenergy derived from biofuels can help slow the rise of atmospheric CO2 by displacing fossil fuel consumption. Yet, cultivating bioenergy feedstocks requires substantial land area. In the United States, the recent growth of maize-based ethanol has entailed environmental trade-offs, motivating interest in alternative feedstocks. Many of these candidates have been chosen partly for characteristics linked to ecosystem services and may therefore deliver environmental gains beyond simple fossil-fuel substitution. We proposed that bioenergy cropping systems could also generate direct climatic cooling by altering carbon exchange and radiative energy fluxes (e.g., via surface albedo). To evaluate this proposition, we quantified the potential cooling influence of five current or prospective bioenergy feedstocks using multi-year eddy-covariance tower datasets. Perennial systems functioned as carbon sinks, with annual mean net ecosystem carbon balance (NECB) of −2.7 ± 2.1 Mg C ha−1 for miscanthus, −0.8 ± 1.1 Mg C ha−1 for switchgrass, and −1.4 ± 0.7 Mg C ha−1 for prairie. By contrast, annual rotations were generally carbon sources, with annual mean NECB of 2.6 ± 2.4 Mg C ha−1 for maize–soy and 3.2 ± 2.1 Mg C ha−1 for sorghum–soy. Using maize–soy as the reference system, conversion to the alternative feedstocks increased albedo and produced additional cooling. This radiative effect was largest for miscanthus (−3.5 ± 2.0 W m−2) and smallest for sorghum (−1.4 ± 1.4 W m−2). When carbon- and albedo-driven impacts were compared using carbon-equivalent metrics, carbon exchange emerged as the dominant ecosystem effect, reinforcing the importance of perennial species as effective carbon sinks. Overall, these results demonstrate that feedstock selection strongly shapes ecosystem processes and should be considered an integral component of bioenergy land-conversion strategies.

How to cite: Bernacchi, C., Blakely, B., Moore, C., Pederson, T., Gibson, C., Benson, M., and Dracup, E.: Climate Forcing of Bioenergy Feedstocks: Insights FromCarbon and Energy Flux Measurements, EGU General Assembly 2026, Vienna, Austria, 3–8 May 2026, EGU26-19694, https://doi.org/10.5194/egusphere-egu26-19694, 2026.

Soil organic carbon (SOC) persistence is central to climate mitigation yet often framed by the debated concept of mineral-associated organic carbon (MAOC) saturation. At the microscale (MAOC, <50 µm), organic carbon associates with minerals to form primary organo–mineral complexes. The enrichment factor (EFc), the ratio of C concentration in the silt and clay (silt+clay) fraction to SOC content, emerged early as a useful measure of MAOC enrichment or saturation. For example, a higher EFc is interpreted as indicating that coarse-textured soils are more saturated than fine-textured ones. This concept parallels Hassink’s saturation theory, which posits that C sequestration is constrained by mineral sorption capacity currently observable in the silt+clay fraction. Here, I show that both assumptions are not supported by global empirical evidence, and an alternative steady-state framework is proposed. This study assessed whether SOC accumulation is driven by site-specific inputs and decomposition rather than by a fixed saturation capacity. This study draws on updated global data to reconcile the MAOC:silt+clay and MAOC:SOC approaches across a wide range of pedoclimatic conditions. The analysis further highlights future directions for refining sequestration estimates through the development of a pedotransfer function framework. The slope of the MAOC versus SOC regression from global datasets, previously reported, remains linear up to ~13% SOC, then the observed accumulation of MAOC likely reflects a dynamic steady-state rather than a saturation threshold. By contrast, MAOC versus silt+clay content captures variation in C loading, not strictly a universal fixed saturation. Although rarely observed, MAOC may continue to accumulate under varying C flux scenarios, stabilizing beyond the measurable range. This framework improves SOC sequestration predictions and challenges the paradigm that C saturation is determined solely by silt+clay.

How to cite: Matus, F.: Mineral-associated carbon persistence arises from steady-state dynamics, not saturation, EGU General Assembly 2026, Vienna, Austria, 3–8 May 2026, EGU26-46, https://doi.org/10.5194/egusphere-egu26-46, 2026.

EGU26-1820 | ECS | PICO | BG3.22

Mapping future crop water footprints under alternative climate futures in Upper Syr Darya Basin, Central Asia 

Gautamee Baviskar, Rick J. Hogeboom, and Maarten S. Krol

Climate change will reshape agricultural water consumption in Central Asia, yet the impacts on crop water footprints remain largely unquantified. The Upper Syr Darya Basin, a critical agricultural region where irrigated cotton and other water-intensive crops depend on a shared river system, faces accelerating water stress as climate variables shift dramatically by 2100. To assess future agricultural sustainability and inform transboundary water allocation decisions, this study projects spatiotemporal changes in crop water footprints under alternative climate scenarios. The ACEA crop water productivity model is implemented and forced with downscaled climate projections to quantify how variations in climate variables will alter green (rainfed) and blue (irrigated) water footprints across cropping systems. Expected outcomes include spatial-temporal maps identifying agricultural regions where future water scarcity will intensify, shifts in crop water consumption patterns, and areas of heightened vulnerability to climate-driven water stress. These projections provide critical evidence for climate-adaptive agricultural planning and transboundary water governance, enabling policymakers to anticipate sectoral water competition and design sustainable irrigation management strategies under alternative climate futures.

How to cite: Baviskar, G., Hogeboom, R. J., and Krol, M. S.: Mapping future crop water footprints under alternative climate futures in Upper Syr Darya Basin, Central Asia, EGU General Assembly 2026, Vienna, Austria, 3–8 May 2026, EGU26-1820, https://doi.org/10.5194/egusphere-egu26-1820, 2026.

EGU26-3839 | ECS | PICO | BG3.22

Characterisation of global cropland bright spots 

Jasmine Gamblin, Marcellin Guilbert, David Makowski, and Carole Dalin

Agriculture has major impacts on the environment: it is the first cause of biodiversity loss, freshwater withdrawals and nutrient flows disruption, as well as an important source of GHG emissions. At the same time, it is an essential human activity to sustain the life of current and future generations. Thus, a drastic increase in food systems sustainability is crucial in the coming years. To address this huge challenge, a mix of local- and global-scale studies assessing impacts and exploring possible solutions are needed. At the global scale, studies that are spatially-explicit and account for multiple impacts are particularly precious. Such studies often focus on hotspots of environmental degradation and tend to overlook the analysis of existing best practices.

In this work, we instead look at bright spots, that we define as regions where agricultural production is relatively important but does not cause the exceedance of local environmental sustainability thresholds. Making use of a circa 2020, 5 arcmin resolution dataset on global crops distribution and four associated environmental sustainability indicators (biodiversity loss, freshwater stress, excess nitrogen application and GHG emissions), we derive bright spot maps for 46 crop categories including individual cereals (wheat, maize, rice, barley, …) and other major crops (soybean, rapeseed, …).

We then train a random forest classification model to identify bright spots based on a number of land-use, biophysical and socio-economical variables. Using feature importance metrics such as SHAP values, we identify key characteristics of these regions.

Further, we simulate several prospective scenarios assuming the widespread adoption of the best practices identified, such as allocating more land to natural habitat, reducing irrigation and fertiliser use, or establishing crop rotations. We quantify the consequences of these scenarios in terms of agricultural production loss and sustainability increase, and estimate their ability to feed the human population by combining them with different human diet scenarios.

How to cite: Gamblin, J., Guilbert, M., Makowski, D., and Dalin, C.: Characterisation of global cropland bright spots, EGU General Assembly 2026, Vienna, Austria, 3–8 May 2026, EGU26-3839, https://doi.org/10.5194/egusphere-egu26-3839, 2026.

EGU26-3843 | PICO | BG3.22

Economic and Environmental Tradeoffs of Forage Systems in Climate-Adaptive Dairy Production 

Susanne Wiesner, Shabda Gajbhiye, Zac Freedman, and Paul Stoy

Agricultural decision-making depends on tools that quantify whole-system tradeoffs under climate and market volatility, but significant gaps remain in understanding how these tools perform at the farm scale under real-world constraints. For dairy production systems, transitioning from corn silage monoculture to diversified forage systems offers a pathway toward greater sustainability under global change. However, market and policy constraints, including crop insurance structures, continue to challenge farmers’ willingness to adopt adaptive strategies. To address these barriers, we evaluated six cropping systems: Corn silage as a baseline, corn followed by a cover crop (CCC), corn interseeded with alfalfa (CAL), alfalfa (ALF), intermediate wheatgrass (IWG), and multi-species pasture (PAS) in a two-year field experiment in Wisconsin, USA. Environmental sustainability was quantified through depth-resolved soil C, N, P, K stocks using equivalent soil mass, bulk density, hydrological metrics, and microbial diversity, integrated into a composite soil health index (SHI). Economic outcomes included net returns on a forage basis, potential milk production, risk-adjusted metrics under historical price variability and stress scenarios, and an incremental cost-effectiveness ratio analysis.

Corn-based systems maximized energy-corrected milk per hectare and minimized land use per cow but exhibited the lowest SHI and greatest downside risk under price shocks. CCC and PAS improved SHI and reduced costs relative to Corn, while ALF delivered high per-cow profitability with limited soil health gains. CAL provided intermediate returns with greater variability, and IWG offered strong soil benefits at higher cost. These results reveal a fundamental tradeoff: Corn-centric systems prioritize short-term yield and land efficiency, whereas perennial systems enhance long-term soil resilience and economic stability. This is because pasture-based diets require no concentrate supplementation, reducing feed costs and input dependency, while all corn-based systems rely heavily on concentrates to sustain high milk yields, which increases their vulnerability to market shocks. Greater input requirements for corn further compound this risk. In our study, pasture systems offered profitable alternatives to corn silage diets and improved risk management, which can reduce reliance on crop insurance. By integrating biophysical indicators with risk-aware economics, our framework identifies diversified forage strategies as adaptive pathways that enhance resilience to climate variability and economic shocks. While these findings reflect a single soil type, the approach provides a scalable method for evaluating tradeoffs in agricultural systems under global change.

How to cite: Wiesner, S., Gajbhiye, S., Freedman, Z., and Stoy, P.: Economic and Environmental Tradeoffs of Forage Systems in Climate-Adaptive Dairy Production, EGU General Assembly 2026, Vienna, Austria, 3–8 May 2026, EGU26-3843, https://doi.org/10.5194/egusphere-egu26-3843, 2026.

EGU26-5362 | PICO | BG3.22

Modelling N2O Emissions and Yield Responses under Drip Fertigation and Future Climate Scenarios with DNDCv.CAN 

Huan Liu, Guillermo Guardia, Brian Grant, Ward Smith, Budong Qian, Jørgen Olesen, and Diego Abalos

Drip fertigation can conserve water in arid and semi-arid regions across the world. Recent field studies have shown that drip fertigation can also mitigate emissions of the powerful greenhouse gas nitrous oxide (N2O). However, existing process-based models have not been evaluated for simulating N2O emissions under drip fertigation systems, limiting our capacity to predict the environmental performance of these irrigation technologies under future climatic conditions. Here we assessed the performance of the Canadian version of the DeNitrification-DeComposition model (DNDCv.CAN) in simulating N2O emissions from drip-fertigated maize systems. The model was calibrated and validated using a comprehensive two-year dataset from a field experiment in Spain that included subsurface and surface drip irrigation with four nitrogen (N) fertigation treatments: ammonium sulfate (AS), AS with nitrification inhibitor DMPP (AS_DMPP), calcium nitrate (CN), and a control without N (N0). The calibrated model accurately simulated crop yield (RMSE < 1,300 kg ha⁻¹), grain N content (RMSE < 12 kg N ha⁻¹), and cumulative N2O emissions (RMSE < 0.03 kg N ha⁻¹), with R² values of 0.6-0.8 and d-index above 0.8. Under future climate scenarios, both surface and subsurface drip irrigation will likely experience yield reductions and increased N2O emissions. Subsurface drip showed slightly lower yield losses but higher N2O emissions compared to surface drip irrigation. CN-based fertilizer integrated with subsurface drip performed best, achieving both higher yields and lower N2O emissions. Increasing heat stress is likely the primary factor driving the yield losses. Adaptation strategies focused on mitigating heat stress should be explored to support the use of drip fertigation systems in arid and semiarid regions.

How to cite: Liu, H., Guardia, G., Grant, B., Smith, W., Qian, B., Olesen, J., and Abalos, D.: Modelling N2O Emissions and Yield Responses under Drip Fertigation and Future Climate Scenarios with DNDCv.CAN, EGU General Assembly 2026, Vienna, Austria, 3–8 May 2026, EGU26-5362, https://doi.org/10.5194/egusphere-egu26-5362, 2026.

EGU26-5656 | PICO | BG3.22

Assessing future irrigation needs in vineyard living labs through microclimate modelling and climate projections 

André Fonseca, José Cruz, Helder Fraga, Cristina Andrade, Joana Valente, Fernando Alves, Ana Neto, Rui Flores, and João Santos

Understanding vineyard scale microclimate variability is essential for adapting viticulture to climate change and increasing water scarcity. This study applies a high-resolution microclimate modelling framework to assess future irrigation requirements in two Mediterranean vineyard living labs, in the Douro Region and Alentejo. The approach integrates the NicheMapR microclimate model, hourly local meteorological observations, ERA5-Land reanalysis, and a high-resolution Digital Elevation Model to generate climate variables at 10m spatial resolution. Local station data are used to bias-correct ERA5-Land through quantile mapping, while topographic effects (elevation, slope, aspect, shading and horizon angles) are explicitly represented via the Digital Elevation Model. The resulting 10 m microclimate outputs are then used to bias-correct EURO-CORDEX regional climate model ensembles, producing vineyard-specific future climate projections. These climate datasets are subsequently used in the STICS crop model to simulate vineyard water balance and irrigation requirements. Irrigation needs are assessed for four climate scenarios (RCP4.5 and RCP8.5, mid- and end-century) under four water stress levels (20%, 40%, 60% and 80%). Results show increasing irrigation demand and variability under higher radiative forcing, with distinct responses between the two vineyards reflecting differences in local microclimate and atmospheric demand. In addition, viticulture climate extreme and bioclimatic indices are derived at the 10m scale, providing insights for vineyard-scale irrigation planning and climate adaptation. Differences between the Douro and Alentejo vineyards emphasise the role of local microclimate in modelling irrigation needs, reinforcing the importance of site-specific adaptation strategies. This work highlights the value of combining microclimate modelling, crop modelling, and bias-corrected climate projections to support sustainable vineyard management under future climate change.

Acknowledgements: Research funded by Vine & Wine Portugal–Driving Sustainable Growth Through Smart Innovation, PRR & NextGeneration EU, Agendas Mobilizadoras para a Reindustrialização, Contract Nb. C644866286-011. The authors acknowledge National Funds by FCT – Portuguese Foundation for Science and Technology, under the projects UID/04033/2025: Centre for the Research and Technology of Agro-Environmental and Biological Sciences (https://doi.org/10.54499/UID/04033/2025) and LA/P/0126/2020 (https://doi.org/10.54499/LA/P/0126/2020).

How to cite: Fonseca, A., Cruz, J., Fraga, H., Andrade, C., Valente, J., Alves, F., Neto, A., Flores, R., and Santos, J.: Assessing future irrigation needs in vineyard living labs through microclimate modelling and climate projections, EGU General Assembly 2026, Vienna, Austria, 3–8 May 2026, EGU26-5656, https://doi.org/10.5194/egusphere-egu26-5656, 2026.

EGU26-6627 | ECS | PICO | BG3.22

Optimizing cropping patterns under emission reduction constraints: Balancing food production, carbon sequestration, and profit 

Lingli Zuo, Guohua Liu, Xukun Su, Martin Volk, Felix Witing, Lingfan Wan, Shuyuan Zheng, and Kui Luo

In view of increasing climate pressure and population growth, ensuring food security while progressing towards carbon neutrality has become a key challenge for agricultural development. Although cropping pattern optimization has been widely explored, most existing studies focus on single objectives or static configurations and rarely incorporate long-term cropping dynamics and stakeholder preferences into a unified decision framework, limiting their applicability in agricultural management. This study proposes a hybrid framework that integrates remote sensing data, agricultural systems modeling, life cycle assessment, and multi-objective optimization to identify optimal cropping patterns based on stakeholder preferences. The approach aims to maximize the yield, profitability, and carbon sequestration potential of corn and soybeans while minimizing associated carbon emissions in the typical black soil region of Northeast China. The results show that between 2008 and 2022, both continuous corn cultivation and corn–soybean rotation systems expanded, with continuous corn cultivation accounting for 60–75% of the total cultivated area, whereas continuous soybean cultivation declined steadily. Spatially, most cultivation patterns exhibited a clear northward shift. Overall, the results suggest that continuous corn cultivation can offer the most effective compromise between food production, carbon sequestration, and economic returns, provided that strict measures to reduce emissions are implemented. Among all rotation strategies, the two-year corn and one-year soybean rotation is the most effective in mitigating the adverse effects of continuous cropping while maintaining a balanced food–carbon–profit performance. In contrast, soybean cultivation offers notable environmental benefits but is constrained by relatively low yields and limited economic returns, underscoring the need for targeted optimization measures. This study provides actionable insights for designing sustainable crop patterns that balance agricultural productivity with climate mitigation goals.

How to cite: Zuo, L., Liu, G., Su, X., Volk, M., Witing, F., Wan, L., Zheng, S., and Luo, K.: Optimizing cropping patterns under emission reduction constraints: Balancing food production, carbon sequestration, and profit, EGU General Assembly 2026, Vienna, Austria, 3–8 May 2026, EGU26-6627, https://doi.org/10.5194/egusphere-egu26-6627, 2026.

EGU26-6714 | ECS | PICO | BG3.22

Wheat in Crisis: Variability of Wheat Area in Lebanon 2017-2025 

Mariam Ibrahim, Ghaleb Faour, Michel Le Page, Marielle Montginoul, Ahmad Al Bitar, Eric Ceschia, Bilal Komati, and Lionel Jarlan

Wheat stands as one of the most important staple crops worldwide. However, the vital role of this crop has been increasingly challenged in Lebanon, in recent years by multi-factorial crises from socio-economic, political, security and climate factors, threatening agricultural stability and food supply. Consequently, monitoring wheat production is crucial for managing import and export activities, developing effective policies, achieving resilient agricultural development, and ensuring food security. This study provides the first national, multi-year monitoring of wheat area and production in Lebanon (2017-2025), linking satellite observations with crisis impacts. We conducted a multi-temporal supervised classification from 2017-2018 to 2024-2025 seasons, usinging Sentinel-2 optical images and Random Forest classifier. We estimated wheat area based on a random stratified sample achieving an overall accuracy of 87%. Interannual changes were then related to major crises and input-price dynamics. Wheat area increased during 2019-2021 but dropped sharply in 2021-2022 as subsidies weakened and input costs surged. Indeed, during the transition toward economy dollarization, the computed indicator of production cost expressed in USD peak in 2021-2022 and then ease consistently with the 2022-2023 area rebound reaching the highest level observed during the study period. In 2023-2025, the crop area decreased again dramatically (-34% in 2023-2024 and -38% in 2024-2025) in relation to the conflict with Israel and associated widespread displacement of population that likely constrained field access and reduced sowing, particularly in southern Lebanon. The derived wheat cover maps were then used as input of the agronomic model AgriCarbon-EO to assess biomass and grain yields variability.

How to cite: Ibrahim, M., Faour, G., Le Page, M., Montginoul, M., Al Bitar, A., Ceschia, E., Komati, B., and Jarlan, L.: Wheat in Crisis: Variability of Wheat Area in Lebanon 2017-2025, EGU General Assembly 2026, Vienna, Austria, 3–8 May 2026, EGU26-6714, https://doi.org/10.5194/egusphere-egu26-6714, 2026.

EGU26-6718 | ECS | PICO | BG3.22

Optimizing maize irrigation and fertilization management with APSIM Next Generation for current and future climate scenarios under semi-arid conditions in Morocco 

Mohamed Amine Benaly, Gang Zhao, Mohamed Hakim Kharrou, Youssef Brouziyne, Bin Chen, Achraf Mamassi, Omar EL Janyani, Qi Tian, Abdelghani Chehbouni, and Lhoussaine Bouchaou

Rising food demand and intensifying climate stresses are putting growing pressure on African cereal systems. In Morocco, maize is a staple crop for smallholder farmers, yet it remains highly vulnerable to rainfall variability and water scarcity. To address these challenges, model-guided adaptation practices offer a promising pathway to enhance the resilience and sustainability of maize production under future climate conditions. The APSIM Next Generation model was calibrated and validated for irrigated maize in the Souss-Massa region in Morocco using data from three growing seasons (2022–2024), under varying levels of deficit irrigation and nitrogen supply. Adaptation strategies were then evaluated under different planting dates using multi-model climate projections. The model showed good accuracy in both calibration and validation for simulating maize phenology (R2 up to 0.91; RMSE = 0.5–1.1 days), leaf area index (R2 = 0.96/0.89; RMSE = 0.32/0.49), soil water content (R2 = 0.95/0.89; RMSE = 4.70/8.33 mm), and above-ground biomass (R2 = 0.97/0.95; RMSE = 1.25/1.01 t ha-1). Nitrogen dynamics were reasonably reproduced, showing moderate accuracy for soil nitrogen and high precision for nitrogen uptake. Under full irrigation and nitrogen supply, biomass declines by 2–6% by mid-century and 9–15% by late century, reaching 30% losses under severe resource limitation. Seasonal irrigation inputs increase by about 3–8% by mid-century and 9–25% by late century across scenarios, with peaks shifting later into hotter months. Early planting shifts irrigation demand into cooler periods and increases final biomass by 6%, with maximum gains observed under 75% ETc and nitrogen application. Variance decomposition reveals a shift from management-driven variance (sowing date and N-fertilizer 30% at baseline) to rainfall dominance by mid-century (SSP2-4.5) and temperature dominance by late century (SSP5-8.5 > 50%), with increasing higher‑order interactions. Biomass production‑risk analysis shows that full N with ≥75% ETc maintains high final above-ground biomass (75% probability at baseline; 50% under SSP2‑4.5 late‑century; 39% under SSP5‑8.5 late‑century), while early sowing provides a modest, diminishing buffer by late century as heat and drought intensify. (+2–20 percentage points). Adequate nitrogen supply, moderate irrigation, and earlier sowing are recommended to sustain final biomass in the near term, while heat-tolerant varieties are required for long-term silage maize production in the Souss-Massa region.

How to cite: Benaly, M. A., Zhao, G., Kharrou, M. H., Brouziyne, Y., Chen, B., Mamassi, A., EL Janyani, O., Tian, Q., Chehbouni, A., and Bouchaou, L.: Optimizing maize irrigation and fertilization management with APSIM Next Generation for current and future climate scenarios under semi-arid conditions in Morocco, EGU General Assembly 2026, Vienna, Austria, 3–8 May 2026, EGU26-6718, https://doi.org/10.5194/egusphere-egu26-6718, 2026.

EGU26-7208 | ECS | PICO | BG3.22

Future projections of European maize yields using AquaCrop with an adaptive growing season 

Vincent Deketelaere, Louise Busschaert, Wim Thiery, Dirk Raes, and Gabriëlle J.M. De Lannoy

Securing maize crop production is essential in our changing world. However, it remains unclear to what extent climate conditions and farmers’ practices, such as fertility management and irrigation, can impact future maize crop production in Europe. Here we use the AquaCrop model v7.2 in a spatially distributed setup to estimate yields, yield gaps, growing cycles, and water productivity over a 30-year baseline period (1985–2014), and a near-future period (2030–2059) under a range of climate scenarios, forced with meteorological data from the Inter-Sectoral Impact Model Intercomparison Project (simulation round 3). We define a generic maize crop with a temperature-dependent sowing date and growing stages, allowing for acclimatization of the growing cycle, in contrast to some earlier climate impact assessments. The results show that a warmer climate will lead to earlier sowing dates and shorter growing seasons, keeping future yield and yield gaps for rainfed maize relatively unchanged from the baseline. Furthermore, the area of profitable rainfed maize production may shift north and expand. In contrast to the marginal impact of climate change on near-future maize yield, removing fertility stress has the potential to increase average yields by 1.5 ton/ha (mainly in the north). An additional gain of 2 ton/ha can be obtained by optimizing irrigation in the southern regions that are not completely unsuitable for rainfed maize production. For irrigated maize in the south, the stable future yield projections are accompanied with increased water productivity, again due to an earlier and shorter growing season.

How to cite: Deketelaere, V., Busschaert, L., Thiery, W., Raes, D., and De Lannoy, G. J. M.: Future projections of European maize yields using AquaCrop with an adaptive growing season, EGU General Assembly 2026, Vienna, Austria, 3–8 May 2026, EGU26-7208, https://doi.org/10.5194/egusphere-egu26-7208, 2026.

EGU26-7806 | PICO | BG3.22

Crop-model informed economic analysis of nitrogen tax effects on food production 

Christoph Müller, Jannes Breier, Iman Haqiqi, Thomas Hertel, and Dieter Gerten

Agricultural nitrogen (N) pollution poses major challenges for sustainable food systems, yet policy assessments often neglect feedbacks between biophysical crop responses and economic market dynamics. We couple the process-based global crop model LPJmL with the spatially explicit agricultural trade model SIMPLE-G using crop- and location-specific nitrogen response functions for yields and N leaching derived from extensive LPJmL simulations. This framework is used to assess the effects of a regional N tax targeting highly polluting production systems while accounting for market-mediated spillover effects.

The tax substantially reduces N pollution in targeted regions with comparatively small yield losses, reflecting the non-linear response of leaching to fertilizer inputs. Lower fertilizer demand in taxed regions reduces global fertilizer prices, inducing yield-enhancing input increases elsewhere that raise production with limited additional pollution. At the global scale, total fertilizer use declines and food prices may decrease under inelastic fertilizer supply assumptions, consistent with empirical evidence, while production remains largely stable. Although targeted farmers experience income and production losses, non-targeted regions can benefit from higher output and incomes. A comparison with a uniform, economy‑wide N tax shows that a location-specific targeted tax achieves similar pollution reductions at substantially lower economic cost. The targeted tax is based on a universal, generalizable, and easily applicable formula. Our results demonstrate the importance of integrating crop-model-informed response functions into economic analyses and challenge the notion that environmental taxation necessarily increases food prices.

How to cite: Müller, C., Breier, J., Haqiqi, I., Hertel, T., and Gerten, D.: Crop-model informed economic analysis of nitrogen tax effects on food production, EGU General Assembly 2026, Vienna, Austria, 3–8 May 2026, EGU26-7806, https://doi.org/10.5194/egusphere-egu26-7806, 2026.

EGU26-7907 | ECS | PICO | BG3.22

Evapotranspiration shed of agriculture: combining agro-hydrological estimates with atmospheric moisture dynamics 

Giulia Cigna, Elena De Petrillo, Lan Wang-Erlandsson, and Marta Tuninetti

The increasing global demand for food, feed and flexible crops is exerting unprecedented pressure on the global hydrological cycle through landscape conversion and increasing irrigation demand, which altogether contribute to the alteration of land moisture recycling. This alteration influence evapotranspiration and precipitation patters through atmospheric flows. Atmospheric moisture flows connect sources of evapotranspiration to sinks of precipitation, from local to regional and continental scale, up to thousands of kilometres away. Terrestrial sources of evapotranspiration are crucial for global food production, regulating precipitation and climate patterns by redistributing water and latent heat. At the same time, the alteration of evapotranspiration dynamics from these sources is mainly driven by land-use conversion for pasture (cattle meat production), and feed crops (such as soy, and maize) and agricultural practises, such as irrigation.

Current crop water use assessments disregard these atmospheric moisture fluxes in redistributing evapotranspiration from agricultural parcels to precipitation in downwind areas. This understanding is particularly key to better assess the water-related implication of agricultural production. Addressing this research gap, this study aims to advance the understanding of how evapotranspiration from agricultural areas shape precipitation in other agricultural areas.

The agro-hydrological estimates for crop production were performed over the period 2008–2017 by means of the model waterCROP, which solves the daily soil water balance on a global 5 arc-minute grid, with global coverage for both irrigated and rainfed conditions.

These evapotranspiration estimates are then combined with atmospheric moisture connections by means of the RECON dataset (based on the UTrack Lagrangian moisture tracking model), a 4D matrix of annual moisture flow connections between any cell in the world at a spatial resolution of 0.5° including a globally closed water balance at annual scale. Each cultivated cell is linked to its blue and green evapotranspiration shed (i.e. the downwind area receiving precipitation from irrigated or rainfed crop production). Evapotranspiration sheds are finally classified according to their land use category to analyse potential synergies and trade-off between land and water use between the sites at the origin of evapotranspiration and others at the fate of precipitation. By characterizing these connections, this research sheds light on the hidden global links between cultivated land and downwind areas.

How to cite: Cigna, G., De Petrillo, E., Wang-Erlandsson, L., and Tuninetti, M.: Evapotranspiration shed of agriculture: combining agro-hydrological estimates with atmospheric moisture dynamics, EGU General Assembly 2026, Vienna, Austria, 3–8 May 2026, EGU26-7907, https://doi.org/10.5194/egusphere-egu26-7907, 2026.

EGU26-8148 | ECS | PICO | BG3.22

The Financial Toll of Climate-Induced Crop Losses 

Corey Lesk, Yi-Ling Hwong, and Kai Kornhuber

The detrimental impacts of climate change to global agriculture are well documented, but the financial consequences of these climate-driven crop losses remain underexplored. Here, we quantify the economic damages from heat and drought-induced crop losses in maize, wheat, and soybean using a statistical modeling approach and attribute them to individual emitters. Between 2000 and 2019, climate-induced yield impacts resulted in global economic losses totalling roughly $400 billion, corresponding to an average annual loss of about 0.06% of global GDP. Least-developed countries experienced GDP-normalized losses 2.5 times higher than those of rich nations (0.10% versus 0.04% of GDP). Aggregated over 2000–2019, CO2 emissions from the world’s richest 10% contributed to approximately $113 billion in financial losses from associated crop yield declines. This represents about 55% of the total economic damages across all income groups and is over eight times greater than the contribution from the poorest 50%. Attributing damages to the economic activities of Carbon Major companies, we estimate that their CO2 emissions caused about $170 billion in financial losses from associated agricultural yield declines. We also show that global annual losses could quadruple between 2019 and 2070 under a high-emissions scenario (SSP3-7.0), while a sustainable development pathway (SSP1-2.6) could avoid an estimated $40 billion of these damages. By linking climate-induced yield losses to financial outcomes, we provide a more tangible understanding of climate risks from food system impacts and strengthen the basis for loss and damage claims.

How to cite: Lesk, C., Hwong, Y.-L., and Kornhuber, K.: The Financial Toll of Climate-Induced Crop Losses, EGU General Assembly 2026, Vienna, Austria, 3–8 May 2026, EGU26-8148, https://doi.org/10.5194/egusphere-egu26-8148, 2026.

EGU26-8438 | ECS | PICO | BG3.22

High-temporal-resolution ammonia concentration measurements in a naturally ventilated dairy barn to inform RuFaS housing ammonia prediction refinement 

Haowen Hu, Martin Perez, Jason Oliver, Andres Jacome, Francisco Scattolini, Julio Giordano, and Kristan Reed

Agriculture contributes approximately 80% of ammonia (NH3) emissions globally and in the United States, with major loss pathways including animal housing, manure storage, and land application of manure and synthetic fertilizers. Although NH3 is not itself a greenhouse gas, it is a key precursor of nitrous oxide (N2O), a potent greenhouse gas. Current housing NH3 emission models, including those implemented in the open-source Ruminant Farm Systems (RuFaS) model, rely on generalized parameters that may not adequately represent region- and management-specific variability, particularly in naturally ventilated barns. The objective of this study was to generate high-temporal resolution housing NH3 concentration data using IoT-based sensors to inform refinement of housing NH3 modeling in RuFaS toward more context-specific simulations. Measurements were conducted in a naturally ventilated free-stall dairy barn housing approximately 600 lactating cows with solid flooring and sand bedding in Harford, New York, USA. Manure was mechanically scraped 3 times per day. A total of 7 electrochemical NH3 sensors (Cynomys, Arenzano, Italy) were deployed evenly throughout the barn at a height of 2 m. Ammonia concentrations were continuously monitored from April 2025 to January 2026 at 10-min intervals. Hourly averages were used to assess diurnal patterns, and monthly averages were calculated to evaluate seasonal trends. Indoor temperature was monitored concurrently. Indoor temperature increased from 12.04±1.52 °C in April to 24.67±0.46 °C in July, before declining to 4.32±0.89 °C in January. Hourly NH3 concentrations ranged from 0.447±0.497 ppm to 0.714±0.369 ppm, with an overall mean of 0.554±0.088 ppm. Minimum concentrations occurred around 12:00, while maximum concentrations were observed at 23:00. Monthly mean NH3 concentrations ranged from 0.413±0.090 ppm to 0.752±0.618 ppm, with an overall mean of 0.594±0.133 ppm; the lowest and highest monthly averages occurred in April and August, respectively. These concentration levels are generally consistent with ranges reported in the literature for dairy housing. These measurements provide a high-throughput dataset capturing diurnal and seasonal variability of housing NH3 concentrations in a naturally ventilated dairy barn. While concentration data alone are insufficient to directly calibrate housing NH3 emission models, the observed temporal patterns establish essential boundary conditions for subsequent emission estimation when combined with ventilation rates. In this context, the dataset supports future derivation of NH3 emission fluxes needed to evaluate and calibrate housing NH3 submodules in whole-farm simulation frameworks such as RuFaS. Ongoing work will integrate ventilation estimates to quantify emission fluxes.

How to cite: Hu, H., Perez, M., Oliver, J., Jacome, A., Scattolini, F., Giordano, J., and Reed, K.: High-temporal-resolution ammonia concentration measurements in a naturally ventilated dairy barn to inform RuFaS housing ammonia prediction refinement, EGU General Assembly 2026, Vienna, Austria, 3–8 May 2026, EGU26-8438, https://doi.org/10.5194/egusphere-egu26-8438, 2026.

EGU26-10729 | ECS | PICO | BG3.22

AquaCrop model performance evaluation and centennial simulations in a rainfed dryland agroecosystem 

Morice Oluoch Odhiambo, Juuso Tuure, Janne Heiskanen, Sheila Wachiye, Kevin Z. Mganga, Pirjo S. A. Mäkelä, Laura Alakukku, Petri Pellikka, and Matti Räsänen

Rainfed smallholder farming systems in semi-arid sub-Saharan Africa (SSA) are vulnerable to intra-seasonal rainfall variability, prolonged dry spells, and high evaporative demand that constrain crop productivity. AquaCrop—a water driven crop growth model, has been widely applied to assess crop performance and water use in water-limited environments. However, long-term, multivariable evaluations spanning multiple growing seasons remain scarce in SSA dryland.

Thus, this study was conducted to evaluate the capacity of AquaCrop to reproduce maize yield components, crop evapotranspiration (ETc), soil water storage (SWS) and plant growth dynamics. We assessed these variables across multiple growing seasons spanning contrasting hydroclimatic years and quantified how rainfall characteristics relate to yield in a typical semi-arid agrosystem in Africa.

Field experiments in Maktau, Kenya, spanned six growing seasons (2019–2024), covering both long (LR) and short (SR) rains. AquaCrop was calibrated for SR2023 and validated for LR2024, with additional growing seasons adopted for testing. LARS-WG—a stochastic weather generator was utilized to generate a 100–year weather data for Maktau by utilising in-situ meteorological data (2013–2024). This weather data was then employed to quantify how plant–available soil water relate to yield.

Simulated maize final biomass and yields generally tracked observed data, with percent errors for final aboveground biomass and grain yield ranging from −23% to 33% and −19% to 7%, respectively, under total seasonal rainfall of 176–489mm. The model showed satisfactory performance for ETc (R² = 0.41–0.81), mixed performance for SWS across growing seasons (R² = 0.15–0.69) and accurately captured canopy cover (CC) dynamics (R² ≥ 0.91). In the centennial analysis, maize grain yield variability was strongly associated with total seasonal rainfall (R² = 0.44), with grain yield ranging from crop failure to 3.8 t/ha under total seasonal rainfall of 37–592mm.

Crop failure and low yields were associated with lower rainfall in May, which coincided with the tasselling–flowering stage of the dryland maize variety DH02 planted in early March as is typical in Maktau. Soil water deficit in the tasselling–flowering stage disproportionally impacted maize yield.

Beyond reaffirming the established rainfall and yield relationship, the findings provide clear, actionable insights for smallholder dryland systems in Kenya and similar dryland agrosystems: (i) timing of rainfall, particularly during tasselling–silking, is a critical determinant of yield loss or realization of yield, suggesting the value of matching cultivar maturity and sowing windows to the temporal distribution of rainfall; (ii) supplemental irrigation targeted to critical maize growth stages; and (iii) selection of maize varieties with accelerated growth cycles to minimises the exposure to extended periods of no rainfall that leads to soil water deficits as the crops are able to complete critical growth stages (tasselling–flowering) faster averting the risk of crop failure.

How to cite: Odhiambo, M. O., Tuure, J., Heiskanen, J., Wachiye, S., Mganga, K. Z., Mäkelä, P. S. A., Alakukku, L., Pellikka, P., and Räsänen, M.: AquaCrop model performance evaluation and centennial simulations in a rainfed dryland agroecosystem, EGU General Assembly 2026, Vienna, Austria, 3–8 May 2026, EGU26-10729, https://doi.org/10.5194/egusphere-egu26-10729, 2026.

EGU26-10733 | ECS | PICO | BG3.22

Exploring the usefulness of global warming levels for aligning agricultural productivity impact trajectories across GCMs 

Vidur Mithal, Jonas Jägermeyr, Christoph Müller, Jana Sillmann, and Leonard Borchert

A key source of uncertainty in climate impact projections is the divergence of climatic variables across global climate models (GCMs) which are used to drive impact models. Here, we demonstrate the extent of this issue for agricultural impact modelling using the latest generation of GCM-driven global gridded crop models, and explore the usefulness of global warming levels (GWL) for aligning crop yield impact estimates across GCMs. To do this, we compare the spread in distributions of spatially aggregated yield change projections across GCMs using the GWL- and the commonly used fixed time window approaches. We find that at the global scale, the GWL approach is particularly effective in reducing GCM uncertainty in projections of interannual yield variability changes, and that this effect is robust across crops. In contrast, for changes in mean yields, the effectiveness of GWLs is strongly crop-dependent. These differences can be explained by different responses to increasing CO2 concentrations across crops and yield metrics: a strong CO2 fertilization effect on mean yields of the C3 crop wheat renders the GWL approach less effective, while the relative independence of both maize and wheat variability from CO2 concentrations makes GWLs particularly effective in these cases. We find that in the agricultural modelling community, the GWL approach offers a means not only to align responses across GCMs but also to better understand impact drivers and components of uncertainty. The relevance of these findings also extends to the broader impact modelling community, particularly in settings where output from multiple climate models is used to drive impact models, such as studies based on the Inter-Sectoral Impact Model Intercomparison Project (ISIMIP) framework.

How to cite: Mithal, V., Jägermeyr, J., Müller, C., Sillmann, J., and Borchert, L.: Exploring the usefulness of global warming levels for aligning agricultural productivity impact trajectories across GCMs, EGU General Assembly 2026, Vienna, Austria, 3–8 May 2026, EGU26-10733, https://doi.org/10.5194/egusphere-egu26-10733, 2026.

EGU26-11357 | ECS | PICO | BG3.22

Canopy temperature emulation in process-based models 

Marie Hemmen, Heidi Webber, and Christoph Müller

Agricultural production relies heavily on the weather, making it especially sensitive to climate change. In the past, high temperatures have had substantial negative effects on crop yields. In a warming climate, these impacts could become even more severe.

Process-based modelling offers a systematic way to examine whether and how future environmental changes may impact crop yields. Many crop models take the 2 m air temperature as an input, allowing the simulated growth and development of the crops to respond directly to that temperature signal. However, depending on the climatic conditions, water status, and the developmental stage of a crop, 2 m air temperatures can be several degrees higher or lower than the actual temperatures at the canopy level. Some crop models therefore compute canopy temperatures based on complex energy balance approaches (EBSC), that have been shown to perform best compared to other approaches. However, these EBSC approaches are computationally expensive and their application in global models can therefore result in considerably higher runtimes. In our work, we developed resource efficient emulators that are based on an EBSC model and can be incorporated in global process-based models without significantly increasing the simulation time.

We applied the emulators in the agricultural modules of the dynamic global vegetation model LPJmL. The validation of daily maximum simulated canopy temperatures shows that LPJmL can reproduce cooling and heating effects of the canopy depending on the water and nitrogen availability of a crop compared to detailed site based observations in different locations throughout the US and Canada. For a global evaluation, we compared our results with skin temperatures from ERA5, which we used as an approximation for canopy temperatures. We show that, on a global scale and for daily maximum values, skin temperatures are significantly better represented by simulated canopy temperatures than by ERA5 2 m air temperatures.

Our results indicate that substituting simulated canopy temperatures for the 2 m air temperatures in processes driven by daily maximum temperatures improves the requirements of modelling heat stress impacts. Particularly, as high temperature processes often follow nonlinear dynamics and are even more affected by small temperature deviations. In a next step, we will use the further developed LPJmL model to analyze such heat stress impacts on crops. For this, we will include high-temperature responses, that will react to the newly implemented canopy temperatures.

The developed emulators can easily be included in other crop models, aiming to improve simulated temperature-dependent process dynamics. With this, we hope to provide a step towards reducing uncertainties in future agricultural yield estimates. 

How to cite: Hemmen, M., Webber, H., and Müller, C.: Canopy temperature emulation in process-based models, EGU General Assembly 2026, Vienna, Austria, 3–8 May 2026, EGU26-11357, https://doi.org/10.5194/egusphere-egu26-11357, 2026.

EGU26-11692 | PICO | BG3.22

Introduction of heat stress on global crop production in the Community Land Model (CLM5) 

Shannon de Roos, Sam Rabin, and Wim Thiery

CLM5, the land model for the Community Earth System Model (CESM), simulates complex terrestrial processes and provides us with a global understanding of the interplay between energy, water and biochemistry fluxes. The crop representation in CLM5 currently lacks the inclusion of specific heat stress that can harm crop yield during crop sensitive stages. As heatwaves are becoming more frequent, we assess the potential of including specific heat-stress functions to target crop development in the working version of CLM5, the Community Terrestrial Systems Model version 5.2 (CTSM5.2). Several model implementations and parameterizations are assessed to target the leaf area index (LAI) or crop grain production directly and are compared to the default model version in terms of impact and to global annual yield data from the FAO in terms of model accuracy. Uncertainties and challenges in crop modelling and model development are also highlighted.

How to cite: de Roos, S., Rabin, S., and Thiery, W.: Introduction of heat stress on global crop production in the Community Land Model (CLM5), EGU General Assembly 2026, Vienna, Austria, 3–8 May 2026, EGU26-11692, https://doi.org/10.5194/egusphere-egu26-11692, 2026.

EGU26-11859 | ECS | PICO | BG3.22

Unveiling Characteristics of the Global Crop Production System 

Best Bhattarabhop Viriyaroj

Ensuring global food security while limiting environmental impacts and supporting the economy requires a multidisciplinary perspective in analysis. Crops, which are the foundation for providing humans with food and livestock with feed, significantly impact both biophysical and human systems over time. Thus, we have conceptualised the crop production system into biophysical, human, and integrated systems and assembled relevant datasets for these systems. The dataset choices were gathered through surveys from expert opinions and compiled at a 5-arcminute resolution from 1992 to 2020. Furthermore, we analysed the global gridded dataset characteristics by utilising the Two-step Self-Organising Map method. These characteristics will be grouped into clusters showing differences and similarities in crop production across the globe using hierarchical cluster analysis. The clusters will be further analysed based on the diversity within each country and the changes in clusters over time. The results of this research are expected to contribute to the understanding and communication of global crop production from a socio-ecological perspective from 1992 to 2020. More research is encouraged to validate the conceptualisation and build upon these characteristics to further analyse the system, potentially leading to the creation of more relevant and sustainable policies.

How to cite: Viriyaroj, B. B.: Unveiling Characteristics of the Global Crop Production System, EGU General Assembly 2026, Vienna, Austria, 3–8 May 2026, EGU26-11859, https://doi.org/10.5194/egusphere-egu26-11859, 2026.

EGU26-12491 | ECS | PICO | BG3.22

Modelling planetary transition pathways to conservation agriculture under climate change 

Jannes Breier, Hannah Prawitz, Marlene Rimmert, Luana Schwarz, Lorenz Sieben, Stephen B. Wirth, Christoph Müller, Dieter Gerten, and Donges Jonathan

Agricultural production systems are increasingly constrained by interacting social-ecological pressures. While a growing world population and dietary shifts are increasing the demand for agricultural crop products, seven out of nine planetary boundaries are breached, with climate change at the forefront. On the production side, farmers face the challenge of implementing climate-resilient farming systems that can operate within planetary boundaries. Conservation agriculture, as part of sustainable and regenerative agriculture, is believed to potentially play a significant role in this development. However, this has not been sufficiently assessed at larger scales. Existing global modelling approaches have predominantly focused either on stylized biophysical potential assessments or macroeconomic optimization approaches. Both approaches often neglect the endogenous decision-making of individual land-use actors. Here, we introduce an integrated World–Earth modelling approach that couples farmers' socio-economic decision-making related to the adoption of farming practices with process-based terrestrial biosphere and, in particular, crop modelling. Using the recently bulit InSEEDS model embedded within the copan:LPJmL modelling framework, we investigate social-ecological co-evolutionary feedback mechanisms of land-use systems at the global scale. For this first large-scale application of InSEEDS, it is extended to include socio-economic and supra-regional communication feedbacks, alongside standardized procedures for providing empirical data for model validation. Modelled farmer agents can dynamically choose between tillage systems and decide on crop residue management and cover crop cultivation. We apply the model under a constant-climate scenario as well as SSP1-2.6 and SSP3-7.0 forcing scenarios. Our results indicate a strong influence of climate change on regional and temporal patterns in farmers' decision-making between conventional agriculture and conservation agriculture, taking into account socio-economic as well as socio-cultural factors. This highlights the importance of integrated modelling approaches for understanding co-evolutionary challenges and opportunities under climate change.

How to cite: Breier, J., Prawitz, H., Rimmert, M., Schwarz, L., Sieben, L., Wirth, S. B., Müller, C., Gerten, D., and Jonathan, D.: Modelling planetary transition pathways to conservation agriculture under climate change, EGU General Assembly 2026, Vienna, Austria, 3–8 May 2026, EGU26-12491, https://doi.org/10.5194/egusphere-egu26-12491, 2026.

EGU26-12688 | ECS | PICO | BG3.22

Eating food from my backyard: The role of urban and peri-urban agriculture in greenhouse gas reduction 

Aisha Javed, Marney Isaac, Adam Martin, and George Arhonditsis

The global rise in human population has substantially increased reliance on agricultural landscapes to meet food security demands. At the same time, conventional rural agriculture is a major contributor to global anthropogenic greenhouse gas (GHG) emissions. Climate change, coupled with the increasing frequency and intensity of extreme weather events, has intensified pressure to develop more sustainable, resilient, and environmentally friendly agrifood systems. Over recent decades, urban and peri-urban agriculture (UPA) has gained increasing attention as a potential strategy to supply food to growing urban populations while delivering a range of environmental, social, and economic co-benefits. Despite growing scientific and policy interest, multiple meta-analyses indicate that the environmental impacts of UPA systems remain poorly quantified, particularly with respect to their contributions to GHG emissions and their potential role in achieving net-zero climate targets. Evidence regarding the GHG mitigation potential of UPA systems remains mixed. Some studies highlight reductions in emissions due to shorter rural-to-urban supply chains (“food miles”) and enhanced carbon sequestration associated with increased urban green space. In contrast, other studies report substantially higher carbon dioxide (CO₂) emissions per unit of food produced in urban agricultural systems compared to conventional rural agriculture. Here, we synthesize insights from an extensive global literature review of UPA systems with the objectives of: (1) clarifying key definitions and characteristics of UPA systems across spatial and temporal scales; (2) quantifying their reported global environmental impacts, such as effects on GHG emissions; (3) identifying the major vegetation types cultivated and assessed within UPA systems; and (4) evaluating existing research and knowledge gaps in process-based crop simulation models and life cycle assessment (LCA) approaches used to estimate food production and GHG emissions in UPA contexts. This synthesis aims to advance understanding of the carbon footprint reduction potential of UPA systems and their interactions with climatic, social, political, and economic drivers, while informing strategies to strengthen their role as effective nature-based solutions within sustainable urban food systems.

How to cite: Javed, A., Isaac, M., Martin, A., and Arhonditsis, G.: Eating food from my backyard: The role of urban and peri-urban agriculture in greenhouse gas reduction, EGU General Assembly 2026, Vienna, Austria, 3–8 May 2026, EGU26-12688, https://doi.org/10.5194/egusphere-egu26-12688, 2026.

Crop production exerts substantial pressure on the Earth system and frequently exceeds environmental boundaries, including those related to greenhouse gas emissions, nitrogen use, biomass appropriation, and freshwater use.  International trade redistributes these production related impacts, with high-income countries often externalizing a significant share of the environmental pressures associated with their food consumption.

Using 2020 detailed international food trade data (FAOSTAT) combined with our crop-specific assessment of production sustainability in 2020 (https://doi.org/10.5194/egusphere-egu25-2526), we quantify the environmental unsustainability embedded in international trade flows of crop commodities. We then explore the potential effects of demand-side changes, namely dietary shifts, on global environmental sustainability. This analysis highlights the importance of addressing sustainability from the demand side and provides policy-relevant insights based on the most recent, crop-specific assessment of environmental sustainability 

How to cite: Guilbert, M. and Dalin, C.: How far are global croplands from environmental sustainability: from production to consumption perspectives, EGU General Assembly 2026, Vienna, Austria, 3–8 May 2026, EGU26-12851, https://doi.org/10.5194/egusphere-egu26-12851, 2026.

EGU26-13304 | PICO | BG3.22

Modeling Coupled Impacts of Soil Salinity and Hydroclimatic Stress on Irrigation Demand 

Isabella Ghirardo, Carole Dalin, Saverio Perri, Carla Sciarra, and Marta Tuninetti

A transformation towards sustainable agriculture requires accurate tools to assess how environmental constraints limit food production. However, agricultural productivity faces increasing pressure from the interconnected issues of soil salinization and water stress. As climate conditions become more extreme, rising temperatures intensify evapotranspiration (ET) and crop water stress, while soil salinization further reduces soil moisture availability, particularly in arid and semi-arid regions. Despite these challenges, global agricultural models have historically lacked the capacity to quantify the specific impact of salinity on irrigation requirements at an operational scale.

To bridge this gap, this work advances the waterCROP agrohydrological model by integrating a new modeling layer that accounts for salt build-up in the root zone and its feedback on crop water availability. This represents one of the first operational attempts to simulate irrigation demand under distinct soil salinity conditions at the global scale. The enhanced framework improves the representation of soil-water-plant interactions by (i) simulating more realistic actual crop ET, (ii) estimating irrigation water demand under varying salinity levels, and (iii) incorporating up-to-date agricultural datasets across staple crops (wheat, rice, maize, soybean) and salt-sensitive crops (broadbean, cabbage, potatoes, tomatoes).

Simulations were conducted at a 5 arc-minute resolution (approximately 9×9 km at the Equator) for years centered on 2000 and 2015. Globally, maize and soybean show blue water demand (BWD) increases of 6 - 10 %, but locally BWD can increase up to 50% over this period, highlighting areas of particularly high water demand growth. This operational approach provides a refined, quantitative assessment of BWD, offering essential data to support sustainable land management strategies in the face of increasing climate and salinity pressures.

How to cite: Ghirardo, I., Dalin, C., Perri, S., Sciarra, C., and Tuninetti, M.: Modeling Coupled Impacts of Soil Salinity and Hydroclimatic Stress on Irrigation Demand, EGU General Assembly 2026, Vienna, Austria, 3–8 May 2026, EGU26-13304, https://doi.org/10.5194/egusphere-egu26-13304, 2026.

EGU26-13806 | ECS | PICO | BG3.22

Crop Yield Prediction Using Multi-Temporal Hyperspectral Data and GeoAI Deep Learning Algorithm 

Harsha Vardhan Kaparthi, Alfonso Vitti, David Mwenda Muriithi, and Faith Kagwiria Mutwiri

Accurate and timely crop yield prediction is essential for effective agricultural management and global food security. This study assesses the effectiveness of hyperspectral imagery combined with deep learning model for crop yield prediction in agricultural fields of interest. Distinct vegetation indices are derived to reflect key physiological and structural crop traits by using hyperspectral imageries from early crop growth insight for detecting stress and predicting potential yield trends to peak growth information for reliable estimates of final crop yield, along with ground truth yield data. In addition, independent ancillary datasets, such as Digital Elevation Models (DEMs), critical soil parameters, and cropping treatments, are incorporated to capture topographic and edaphic influences on crop growth. The Deep learning algorithms such as Multilayer Perceptron (MLP) are employed, and model performance evaluated using Mean Absolute Error (MAE) and coefficient of determination (R²) values. The critical role of ShortWave InfraRed (SWIR) and Visible and Near-InfraRed (VNIR) based indices are investigated with respect to the yield estimations. The proposed methodology is applied at the field-plot scale as shown in the figure, using long-term experimental data from a temperate agricultural research site in the Midwestern United States. The analysis focuses on agricultural plots within the Main Cropping System Experiment (MCSE), comprising different cropping treatments (T1-T4) such as:

  • conventional (T1),
  • no-till (T2),
  • reduced-input (T3), and
  • biologically based practices (T4).

How to cite: Kaparthi, H. V., Vitti, A., Muriithi, D. M., and Mutwiri, F. K.: Crop Yield Prediction Using Multi-Temporal Hyperspectral Data and GeoAI Deep Learning Algorithm, EGU General Assembly 2026, Vienna, Austria, 3–8 May 2026, EGU26-13806, https://doi.org/10.5194/egusphere-egu26-13806, 2026.

EGU26-14447 | PICO | BG3.22

Assessing the carbon footprint of leaf protein concentrate and biomethane from organic multispecies grasslands 

Fatemeh Hashemi, Lisbeth Mogensen, Jørgen Eriksen, Moren Ambye-jensen, Thalles Allan Andrade, Henrik Bjarne Møller, Uffe Jørgensen, Radziah Wahid, Yoko Luise Dupont, Wenfeng Cong, Huayang Zhen, Teodora Dorca-Preda, and Marie Trydeman Knudsen

Advancing the circular bioeconomy requires climate-friendly valorization of locally available biomass. Organic multispecies grasslands provide multiple outputs, including leaf protein concentrate (LPC) for feed and biogas for energy, while supporting biodiversity, weed suppression, and carbon sequestration.

This study assessed the climate impacts of Protein, Pollinator, and Energy grassland mixtures under different cutting regimes using life cycle assessment (LCA) with the ReCiPe 2016 method, applying both economic allocation and system expansion approaches. The cradle-to-gate system boundary included grassland cultivation, transport, and processing in the biorefinery. Grassland carbon footprints were low, roughly 50–100 kg CO₂ eq per ton of dry matter. LPC from four-cut grass mixtures had a baseline carbon footprint around 1600 kg CO₂ eq per ton DM with no allocation, and reductions possible depending on co-product use. Biogas from energy grass mixtures had a climate impact of roughly 100–400 kg CO₂ eq per 1000 m³.

Climate performance of biorefinery products was strongly influenced by grass yields, protein content, allocation methods, and downstream valorization strategies. These findings highlight the potential of organic multispecies grasslands to provide LPC as a sustainable alternative to soy-based feed and biomethane as a renewable energy source while mitigating climate impacts.


How to cite: Hashemi, F., Mogensen, L., Eriksen, J., Ambye-jensen, M., Andrade, T. A., Møller, H. B., Jørgensen, U., Wahid, R., Dupont, Y. L., Cong, W., Zhen, H., Dorca-Preda, T., and Knudsen, M. T.: Assessing the carbon footprint of leaf protein concentrate and biomethane from organic multispecies grasslands, EGU General Assembly 2026, Vienna, Austria, 3–8 May 2026, EGU26-14447, https://doi.org/10.5194/egusphere-egu26-14447, 2026.

EGU26-14656 | ECS | PICO | BG3.22

Consumption-based GHG footprint of global food systems (2000–2020) 

Belen Benitez, Carole Dalin, and Bertrand Guenet

Food consumption drives environmental pressures by shaping global agricultural production systems and international trade patterns. A growing body of literature has quantified consumption-based food footprints by reallocating production-based pressures, such as greenhouse gas (GHG) emissions, land use, and nitrogen application, to final consumers, highlighting the role of global demand in shaping agricultural impacts beyond national borders (Hertwich & Peters, 2009; Weinzettel et al., 2013; Henders et al., 2015; Oita et al., 2016).  However, existing approaches differ in their treatment of GHG emission sources, spatial characterization of production systems, and temporal consistency, often addressing individual pressures in isolation. Developing harmonized frameworks that consistently integrate multiple agricultural GHG emission sources and link them to food consumption through trade is therefore essential for fully assessing the sustainability of the agri-food system. Here we quantify the carbon footprint of food consumption by combining spatially-explicit (5-arc-minute resolution) agricultural GHG emission sources -including land-use change building on prior work by the authors, farm-level production processes (synthetic fertilizer and manure application, peatland drainage, and rice paddy methane), and transport- for 24 crop types with international trade data (FAOSTAT). We also quantify livestock-related emissions derived from feed production (crops and grass) and reallocate these to consumption via trade. Both results are reported at the global scale across four reference years between 2000 and 2020. By reallocating production-based emissions to final consumers through a consumption-based framework, we link global food demand to the geographic origin of agricultural GHG emissions, thereby enabling an analysis of spatial patterns and temporal trends of the carbon footprint of food demand worldwide.

How to cite: Benitez, B., Dalin, C., and Guenet, B.: Consumption-based GHG footprint of global food systems (2000–2020), EGU General Assembly 2026, Vienna, Austria, 3–8 May 2026, EGU26-14656, https://doi.org/10.5194/egusphere-egu26-14656, 2026.

EGU26-15014 | ECS | PICO | BG3.22

A high-resolution crop fertilisation database for Germany under SSP/RCP scenarios, 1960-2100 

Hector Camargo Alvarez and Almut Arneth

Agriculture faces the challenge of securing a food supply for the growing global population while producing it in a sustainable manner, reducing the impacts of crop management on natural resources, air quality, climate change, and biodiversity. Robust representations of crop processes in agroecosystem modelling allow a better understanding of the interactions and feedbacks between agriculture, climate, environment and society, increasing the likelihood of meeting these challenges. In addition, improved agricultural modelling enhances the simulation of carbon cycling and natural vegetation in Dynamic Global Vegetation Models (DGVM). One main limitation for mechanistic agricultural representation in models is the low availability of high-resolution and long-term management datasets at regional or national scales, such as the application rates of nitrogen (N), the most important nutrient for plant growth. Here, we estimated a crop-specific N fertilisation dataset at 3-arc-min resolution for 1961–2015 and also projected future N applications at the same resolution under SSP1-RCP2.6, SSP3-RCP7.0 and SSP5-RCP8.5 for 2016-2100 in Germany. We included the crop groups C3 and C4 cereals, oil crops, starch crops, and fruit and vegetables under high and low-intensity management. Historical estimates were based on HILDA+ land cover data, harmonised by hindcasting the CRAFTY-GERMANY 2020 baseline and using an existing global N fertilisation database. The estimations were bias-corrected to match yearly FAO country-level statistics of fertiliser consumption.

For future projections, a baseline map for Germany of average fertilisation by state for 2005-2015 was generated, as well as a spatial deviation map, filling missing grid cells by ordinary kriging interpolation. In grid cells where a given crop was projected in the future according to the CRAFTY-GERMANY land-cover data obtained for each scenario, the fertilisation was calculated by weighting the average fertilisation baseline according to the future trends, adding the corresponding spatial deviation for that grid cell, plus a random value from the kriging interpolation error, assuming a normal distribution. The resulting historical spatiotemporal N fertilisation dataset was consistent with statistics of the International Fertilizer Association and can be used as an input for crop models and DGVMs. The same approach can be applied at the regional and global scale to improve modelling inputs.

How to cite: Camargo Alvarez, H. and Arneth, A.: A high-resolution crop fertilisation database for Germany under SSP/RCP scenarios, 1960-2100, EGU General Assembly 2026, Vienna, Austria, 3–8 May 2026, EGU26-15014, https://doi.org/10.5194/egusphere-egu26-15014, 2026.

Sorghum (Sorghum bicolor L. Moench), a vital crop in semi-arid region Maharashtra, is increasingly threatened by climate change, characterized by erratic monsoons, prolonged droughts, and rising temperatures. As a staple cultivated during kharif and rabi seasons, sorghum supports food security and livelihoods for millions of farmers. However, these environmental shifts are jeopardizing yield and water use efficiency (WUE), particularly in rainfed systems. This study employs the DSSAT-CERES-Sorghum model to assess these impacts, utilizing historical India Meteorological Department (IMD) data (1980–2009) and CMIP6 Global Climate Model (GCM) projections under SSP2-4.5 (moderate emissions) and SSP5-8.5 (high emissions) scenarios. Focused on Maharashtra, the research aims to quantify yield-WUE changes and classify climate stress regimes (hot/dry, cool/wet) using percentile thresholds to understand regional vulnerabilities. The methodology integrates comprehensive datasets, including soil properties, crop management practices, and genotype parameters for kharif and rabi cultivars. The CERES-Sorghum model simulates baseline and future performance, accounting for temperature, rainfall, and irrigation effects. Climate data from GCMs provides projections for mid-century (2040–2069) and end-century (2070–2099), enabling a comparative analysis of climate impacts across Maharashtra’s diverse agro-climatic zones. Simulations are expected to indicate significant yield declines and reduced WUE by 2040–2069, with further deterioration by 2070–2099 in rainfed systems. Elevated temperatures (Tmax > 35°C) and irregular rainfall are anticipated to drive heat and water stress, leading to poor yield-WUE performance in vulnerable regions. This will pose risks to food security and farmer livelihoods, highlighting areas where agricultural output is most at risk. The study will integrate baseline and future data to identify these critical zones, providing a foundation for targeted adaptation strategies. These insights aim to enhance Maharashtra agricultural resilience by informing sustainable practices to mitigate climate variability effects. The research addresses knowledge gaps in integrating yield, WUE, and climate stress indicators for Maharashtra, where localized assessments are limited despite the crop’s importance. By leveraging advanced modelling, the study offers a robust framework to predict future trends and support policy interventions. The expected outcomes will underscore the urgency of adapting to changing climate conditions, ensuring the sustainability of sorghum production. This effort is crucial for safeguarding Maharashtra’s agricultural heritage and supporting its rural economy against the backdrop of escalating environmental challenges.

How to cite: Srivastava, M. and Mall, R. K.: Climate Change and Sorghum Yield-WUE Dynamics in Maharashtra: Unveiling the Impacts of Temperature and Rainfall Variability on Crop Performance, EGU General Assembly 2026, Vienna, Austria, 3–8 May 2026, EGU26-16233, https://doi.org/10.5194/egusphere-egu26-16233, 2026.

EGU26-16914 | PICO | BG3.22

Modelling Resilience of the UK Poultry Sector to Socio-Ecological Shocks: A Data-Driven System Dynamics Approach 

Justin Sheffield, Ali Parsa, Pippa Simmonds, Theo Stanley, Damian Maye, Sarah Lambton, and Emma Roe

The UK poultry industry supplies 50% of the nation’s meat demand, serving as a cornerstone of national food security. Industrialisation and the rise of ‘megafarms’ have rendered poultry a cheap, nutritious, and widely available protein source; production nearly doubled from 1.0 million tonnes in 1994 to 1.9 million tonnes in 2024, while per capita consumption rose from 23 kg in 2007 to 31 kg by 2022. However, intensive farming has triggered significant public concern regarding animal welfare and the environmental impact of farm waste on UK watercourses. Furthermore, recent shocks—including Brexit, COVID-19, the war in Ukraine, and increasing extreme weather—underscore the urgent need for systemic resilience against natural, socio-economic, and geopolitical disruptions.

Addressing these challenges requires a comprehensive systems approach. Despite increasing calls for systems thinking, robust modelling methods remain underutilised in the field. This study employs a data-driven System Dynamics approach to explore the complex interdependencies of poultry production and consumption, evaluating the trade-offs between system benefits and harms across human, animal, microbial, and environmental communities.

The model was developed through a participatory framework in collaboration with academics and industry stakeholders. A group model building approach—incorporating workshops, interviews, and collective scenario specification—enabled qualitative and quantitative modelling, optimisation, and the development of a decision-support tool. The simulation captures the dynamic interrelations between medicated feed, waste management, and welfare, tracing the sector’s evolution since the 1950s. By analyzing how the industrialisation of biochemical processes has shifted the dynamics between poultry, people, and the planet, this study identifies key vulnerabilities and pathways for enhancing the resilience and sustainability of the UK poultry sector.

How to cite: Sheffield, J., Parsa, A., Simmonds, P., Stanley, T., Maye, D., Lambton, S., and Roe, E.: Modelling Resilience of the UK Poultry Sector to Socio-Ecological Shocks: A Data-Driven System Dynamics Approach, EGU General Assembly 2026, Vienna, Austria, 3–8 May 2026, EGU26-16914, https://doi.org/10.5194/egusphere-egu26-16914, 2026.

EGU26-17734 | ECS | PICO | BG3.22

Bayesian optimization of a sustainability index to reduce nitrogen losses in European cropland 

Alejandro Romero-Ruiz and Landon Halloran

Nitrogen leaching in agricultural systems is a major environmental risk resulting from irrigation-fertilization practices. Global losses of fertilized agricultural systems are estimated to be about 30% of the applied nitrogen fertilizer. As food and water security are being threatened by the effects of climate change, it is imperative to develop strategies that optimize fertilization application (and irrigation) to mitigate adverse environmental effects of nitrogen losses while maximizing production. Developing and testing such strategies remains challenging, partly because soil functions strongly depend on pedoclimatic conditions, soil degradation, and crop type; and all these parameters may be highly variable, even over relatively small distances and short periods of time. In this work, we present an approach for optimizing agricultural management based on the introduction of a sustainability index (SI). The SI is defined as a function of the net monetary system gain resulting from subtracting the estimated societal cost of soil losses of nitrogen (NO3 leaching and N2O emissions) and soil carbon to the brut economic gain of crop yield at current market prices. We considered a management optimization example simulating winter wheat in the United Kingdom using Historical climate simulations (1960-1980) with yearly homogeneous fertilization of 200 kg N/ha/yr applied on 11th of March. These management variables were integrated into a probabilistic Markov Chain Monte Carlo (MCMC) approach aiming at optimizing the SI. This led to reductions of approximately 34% in annual nitrate leaching (from 44 kg/ha to 29 kg/ha) and 23% in annual nitrous oxide emissions (from 5.2 kg/ha to 4 kg/ha) by only compromising 3% of the annual crop yield (from 7.4 Mg/ha to 7.2 Mg/ha). These results are further discussed in the context of climate change and soil degradation in cropland. For this, we computed the SI for healthy and compacted soils in European cropland using winter wheat simulations under climate projections from the high-emissions climate scenario (SSP585) in the Coupled Model Intercomparison Project (CMIP6). Introducing a SI that weights economic and environmental factors of agroecosystems and utilizing it within a MCMC optimization scheme provides a powerful framework to harness agroecosystem models in order to test and optimize management strategies. Such an approach offers both estimations and uncertainty of management variables, crop yield, nitrogen losses, and the resulting net economic gain, which are crucial for informing and guiding policy-making in agriculture.

How to cite: Romero-Ruiz, A. and Halloran, L.: Bayesian optimization of a sustainability index to reduce nitrogen losses in European cropland, EGU General Assembly 2026, Vienna, Austria, 3–8 May 2026, EGU26-17734, https://doi.org/10.5194/egusphere-egu26-17734, 2026.

Surface ozone air pollution impairs carbon assimilation in terrestrial ecosystems. For crop species, ozone pollution reduces biomass and crop yield and therefore poses challenges on food security in regions with large populations such as India and China. The ozone impacts on crop yield can be examined with a mechanistic crop model, which explicitly simulates plant physiological responses (e.g., gas exchange rate, leaf area index) to changes in environmental conditions. In mechanistic crop models, ozone-induced yield loss is primarily determined by the sensitivity parameter (asen) of photosynthetic rate loss to cumulative stomatal ozone uptake. Derivation of asen follows different approaches: one based on statistical relationships between relative yield or biomass loss and cumulative ozone uptake, as described in Sitch et al. (2007); another based on relationships between gas exchange rate losses (photosynthesis and stomatal conductance) and cumulative ozone uptake, as described in Lombardozzi et al. (2015).

In this study, gas-exchange measurement data from multiple elevated ozone exposure experiments for maize and soybean are used to calibrate asen following Lombardozzi et al. (2015). Validation simulations are conducted using the Terrestrial Ecosystem Model in R (TEMIR) version 2.0, a mechanistic crop model akin to those in land surface models such as JULES and CLM4.5, implemented with two plant-ozone damage schemes following Sitch et al. (2007) and Lombardozzi et al. (2015).

With the newly calibrated asen, modeled ozone-induced relative yield loss shows good agreement with observed values for soybean, with a mean error of less than 5 percentage points across different ozone levels. Simulations using the calibrated asen following Lombardozzi et al. (2015) exhibit superior performance compared to those using the default asen from Lombardozzi et al. (2015) or the calibrated asen following Sitch et al. (2007), both of which have mean errors exceeding 25 percentage points in the modeled ozone-induced relative yield loss. The low mean error from the simulations using the calibrated asen following Lombardozzi et al. (2015) suggests the sensitivity of relative photosynthetic rate loss to ozone is similar to that for relative yield loss in soybean. In contrast, for maize, with the calibrated asen following Lombardozzi et al. (2015), the model overestimates relative ozone-induced yield loss by about 30 percentage points at the highest ozone concentration (~100 ppbv). Sensitivity simulations with varying values of asen indicate that the parameter calibrated to photosynthetic rate loss must be reduced to about one-third of its original value to align modeled and observed relative yield and biomass losses for maize. Modelers should account for these differential responses of photosynthetic rates versus yield and biomass losses among crops species, when assessing future ozone impacts on crop productivity.

How to cite: Pang, J. Y. S., Singh, A. A., Agrawal, S. B., Chintala, S., Feng, Z., Ainsworth, E. A., and Tai, A. P. K.: Investigation of the impacts of elevated ozone on maize and soybean using the Terrestrial Ecosystem Model in R (TEMIR) version 2.0: differential responses of biomass and photosynthetic rates to cumulative stomatal ozone uptake in different crops, EGU General Assembly 2026, Vienna, Austria, 3–8 May 2026, EGU26-17799, https://doi.org/10.5194/egusphere-egu26-17799, 2026.

EGU26-17854 | PICO | BG3.22

An Integrated Modeling Assessment of Food and Land-Use Systems in Taiwan 

Pei-Yuan Chen and Hsueh-Kuo Chen

Taiwan’s agricultural systems face multiple and interconnected challenges under global change, including a high dependence on food imports, stringent land-use constraints imposed by national spatial planning, and increasing pressure to reduce agricultural greenhouse gas (GHG) emissions in line with net-zero targets. This study addresses this gap by applying and validating the Food, Agriculture, Biodiversity, Land-Use, and Energy (FABLE) Calculator as an integrated interdisciplinary modeling framework for Taiwan’s agricultural systems. We evaluate the model’s applicability under Taiwan’s specific agricultural, land-use, and policy contexts, and develop a set of baseline and alternative sustainability-oriented scenarios to explore potential development pathways of food and land-use systems under environmental and climate change. The scenario analysis focuses on key system indicators, including crop production and food self-sufficiency, cropland area dynamics, and agriculture- and land-based GHG emissions. Particular emphasis is placed on cropland availability, which is highly constrained due to limited land resources, and on agricultural GHG emissions, which represent a critical sector for national climate mitigation strategies. The results highlight trade-offs and synergies among food security, land-use allocation, and emission reduction across alternative scenarios. This study provides a transparent and scalable modeling framework that supports integrated assessments of agricultural adaptation and mitigation strategies. Additionally, the proposed approach offers policy-relevant insights for transforming sustainable agricultural systems, thereby contributing to integrated land–food–environment management under conditions of global change.

How to cite: Chen, P.-Y. and Chen, H.-K.: An Integrated Modeling Assessment of Food and Land-Use Systems in Taiwan, EGU General Assembly 2026, Vienna, Austria, 3–8 May 2026, EGU26-17854, https://doi.org/10.5194/egusphere-egu26-17854, 2026.

EGU26-17868 | ECS | PICO | BG3.22

From scarcity to risk - Propagation of green water stress through the food system due to agricultural trade 

Heindriken Dahlmann, Elena De Petrillo, Dieter Gerten, Friedrich Busch, Simon Fahrländer, Stefania Tamea, and Marta Tuninetti

Water resources are increasingly shaped by global teleconnections. Through international trade, particularly in agricultural commodities, water is imported and exported as virtual water, linking distant regions via shared dependencies on freshwater resources. While virtual water trade can alleviate local water scarcity and enhance food security, it also amplifies systemic vulnerabilities within global supply chains. Even though the majority of global agricultural production depends on green water resources (soil moisture derived from precipitation), existing research has predominantly focused on blue water resources (surface and groundwater) and the redistribution of blue water stress due to trade. This study addresses this gap by explicitly linking export-side green water stress to import-side water-related risks within the global food system. We integrate a national-scale green water stress assessment, simulated using the LPJmL dynamic global vegetation, crop, and hydrological model, with international trade data from the CWASI database for selected primary crops. This combined framework enables a systematic analysis of the propagation of green water stress through the global food system via trade relationships. For this, we develop and analyze distinct categories of green water scarcity risk at country level: First, risk associated with domestic agricultural production; second, risk arising from the reliance on imports sourced from water-stressed regions; and third, risk that emerges in a country due to its export-oriented production. Using this categorization, we follow and map water-related risks from producers to consumers. Our results demonstrate that dependence on distant green water resources creates a complex and often opaque network of vulnerabilities, whereby local water stress can translate into risks far beyond the region of origin. By revealing how green water stress is embedded in global trade flows, this study underscores the need to move beyond local perspectives on water management. A more holistic, teleconnection-aware approach is required to sustainably govern global water resources and to reduce systemic risks in an increasingly interconnected world.

How to cite: Dahlmann, H., De Petrillo, E., Gerten, D., Busch, F., Fahrländer, S., Tamea, S., and Tuninetti, M.: From scarcity to risk - Propagation of green water stress through the food system due to agricultural trade, EGU General Assembly 2026, Vienna, Austria, 3–8 May 2026, EGU26-17868, https://doi.org/10.5194/egusphere-egu26-17868, 2026.

EGU26-18148 | ECS | PICO | BG3.22

Attribution and Resilience Assessment in Crop Rotation Patterns under Extreme Climate Events 

Wanjing Gao, Neda Abbasi, and Stefan Siebert

Extreme climate events — such as heavy precipitation, heatwaves, and droughts — are increasing in frequency under global climate change and increasingly threaten sustainable agricultural systems. Crop rotation is a key management practice for sustaining soil health and enhancing ecosystem resilience. However, the extent to which extreme climate events drive observable changes in rotation patterns remains insufficiently quantified. This study presents a modeling framework to analyze crop rotation patterns, attribute changes to climatic factors, and identify resilient rotation strategies under future climate conditions.

We examine three core questions: (1) Do extreme climate events significantly alter crop rotation dynamics? (2) Do regions with higher event frequency show systematically different rotation structures? (3) Do rotation sequences that change after extreme events perform differently under climate stress?

Using 1 km resolution meteorological data across Germany, we identify extreme rainfall, heatwave, and drought events. We analyze crop sequences from over 900,000 fields (2012–2024) using Markov chain models to characterize rotation patterns, transition probabilities, and stability indicators. Statistical comparisons are conducted of rotation patterns before and after extreme events, as well as between regions with different event frequencies. To evaluate resilience, a process-based crop model is used to simulate selected crop rotation patterns under various climate conditions, assessing indicators of resistance, recovery, and yield stability.

By integrating climate data, stochastic crop sequence modeling, and process-based crop model simulation, this study establishes a framework for attributing rotation pattern changes to climate factors and evaluating agricultural system resilience. Our findings contribute to understanding climate adaptation in cropping systems and support the development of targeted strategies for sustainable agriculture under global change.

How to cite: Gao, W., Abbasi, N., and Siebert, S.: Attribution and Resilience Assessment in Crop Rotation Patterns under Extreme Climate Events, EGU General Assembly 2026, Vienna, Austria, 3–8 May 2026, EGU26-18148, https://doi.org/10.5194/egusphere-egu26-18148, 2026.

EGU26-19303 | ECS | PICO | BG3.22

Severe yield loss every other year through 2039 in the Austrian agriculture based on SSP3-7.0 

Jan Haacker, Sabina Thaler, Edurne Estévez, Josef Eitzinger, and Herbert Formayer
Austria is experiencing increasingly frequent and prolonged drought periods as well as a rising number of heat days, both of which adversely affect agricultural productivity. The magnitude of these impacts depends on crop-specific growing periods and stress tolerances. Here, we assess how projected climate conditions during 1990-2039, assuming the shared socio-economic pathway SSP3-7.0 for the future period, influence yield expectations for winter wheat, spring barley, soybean, maize, potatoes, and grassland in Austria.
Meteorological forcing is derived from the high-resolution General Circulation Model "Climate Change Adaptation Digital Twin", developed by the European Centre for Medium-Range Weather Forecasts. The data are statistically downscaled to a spatial resolution of 250 m and daily temporal resolution using Quantile Delta Mapping, with an observation-based in-house reference dataset for the historical period 1990-2019. Crop phenology, soil water balance, and combined heat and drought stress are simulated using the Agricultural Risk Information System. Phenological stage entry dates are computed from accumulated excess temperatures calibrated against near-surface air temperature observations and satellite-based remote sensing data for the years 2020, 2021, and 2023.
The projections indicate increasing levels of crop stress accompanied by enhanced interannual variability. Winter wheat is least affected by combined heat and drought stress due to its relatively early maturity. However, drought and heat extremes lead to substantial yield reductions across all modeled crops in approximately half of the projected years. Overall, potential benefits of warmer temperatures during early growing stages are outweighed by increasing heat and drought stress later in the season.

How to cite: Haacker, J., Thaler, S., Estévez, E., Eitzinger, J., and Formayer, H.: Severe yield loss every other year through 2039 in the Austrian agriculture based on SSP3-7.0, EGU General Assembly 2026, Vienna, Austria, 3–8 May 2026, EGU26-19303, https://doi.org/10.5194/egusphere-egu26-19303, 2026.

The impact of climate change on agricultural yields and risk management is fundamentally tied to shifts in crop phenology. As warming climates accelerate plant development, adjusting sowing dates has emerged as a critical adaptation strategy for maintaining productivity. However, the drivers of future sowing decisions remain a subject of debate. Current modeling strategies, ranging from prescribed planting dates and temperature thresholds to sophisticated decision trees, often imply different assumptions regarding farmers' goals. Some approaches assume farmers seek to maximize the growing period to optimize yields, while others suggest they prioritize reducing inter-annual variability to ensure business stability.

This study investigates the determinants of maize sowing dates in Germany. While historical observations and rule-based models highlight temperature as the primary driver in Central Europe, recent findings suggest that integrating soil moisture may offer higher predictive power. To bridge the gap between theoretical modeling and practical management, we surveyed German farmers to identify the primary motivations behind their planting decisions.

Based on these insights, we developed a planting model that incorporates rolling temperature averages, defined "earliest possible" sowing dates, and soil moisture constraints. This decision-making framework was linked to a Bayesian phenological model to simulate the future development of maize in Germany, assuming the use of modern-day cultivars in a shifting climate.

Our results shed light on the factors that determine farmers' motivations for choosing specific planting dates, as well as the effects these decisions have on crop phenology. By refining how we model the "human factor," we provide a more robust assessment of climate change impacts on German maize production.


How to cite: Busch, F.: Integrating Farmer Motivations into Phenological Models: Impacts of Sowing Decisions on German Maize, EGU General Assembly 2026, Vienna, Austria, 3–8 May 2026, EGU26-19368, https://doi.org/10.5194/egusphere-egu26-19368, 2026.

EGU26-20094 | ECS | PICO | BG3.22

Expenditure–Driven Patterns in India’s Dietary GHG Emissions 

Saumya Yadav and Srinidhi Balasubramanian

Dietary patterns in India are increasingly shifting toward higher consumption of animal-based foods, with implications for climate change. However, dietary choices in a country with widespread economic disparities are influenced by socioeconomic factors. While previous studies have examined the role of income (or expenditure) on food consumption, their contributions in driving dietary GHG are not well explored. Here, we link literature-derived GHG emission factors for food items with food consumption data obtained from three rounds of the Household Consumer Expenditure Survey (1999-00, 2011-12, 2022-23), further differentiated by deciles based on monthly per-capita expenditure.

The total dietary GHG emissions increased by 25% from 449 Mt CO2eq in 1999-2000 to 601 Mt CO2eq in 2022-2023 for India. Dietary GHG emissions are unevenly concentrated among deciles, with the top three expenditure deciles contributing comparably to emissions (30%; 2022) as the lower three deciles (29%; 2022), despite accounting a much smaller section of the population. A clear pattern emerges of higher deciles exhibiting a significantly greater share of animal food emissions. In 2022, animal food emissions accounted for 46% of total dietary emissions for the tenth decile compared to 37% in the lowest decile.

A similar influence of expenditure is also observed in dietary footprints. In 2022, the per-capita GHG emissions ranged from 0.9 to 1.9 kg CO2eq/day across deciles. Dietary footprints shifted from whole grains (35% to 17%) toward animal-based foods (23% to 33%) from the lowest to highest deciles. Additionally, decile contributions differed spatially, with some states dominated by lower-decile emissions and others by upper-decile emissions. Overall, the dietary GHG intensity increases with rising per-capita expenditure, highlighting the need for climate and nutrition policies that explicitly account for socioeconomic heterogeneity.

How to cite: Yadav, S. and Balasubramanian, S.: Expenditure–Driven Patterns in India’s Dietary GHG Emissions, EGU General Assembly 2026, Vienna, Austria, 3–8 May 2026, EGU26-20094, https://doi.org/10.5194/egusphere-egu26-20094, 2026.

EGU26-20431 | ECS | PICO | BG3.22

Tracing agricultural nitrogen policy impacts on groundwater quality through an integrated modeling approach  

Kaja Jurak, Andreas Musolff, Rohini Kumar, and Birgit Müller

Assessing the effectiveness of agricultural nitrogen policies requires capturing the interactions between socio-economic decision-making, crop production, and catchment hydrology. Our study looks at the impact of uniform per hectare payments to farmers for reducing nitrogen (N) input to soil in German agriculture on groundwater quality in Rhine and Elbe catchments. To evaluate nitrogen surplus reductions and resultant nitrate leaching at the catchment scale under different subsidy schemes and climatic scenarios, we use an integrated modeling framework linking an agro-economic model (SNAg) – based on simulated yield data from the dynamic global vegetation, hydrology and crop model „Lund-Potsdam-Jena managed Land (LPJmL)“ - with a process-based water quality model (mQM). Our approach captures farmer responses to policy instruments and spatial heterogeneity in productivity, nitrogen use efficiency and hydrological processes.

Specifically, we compare a moderate subsidy scheme characterized by high participation and moderate nitrogen surplus reductions with a tighter scheme featuring lower uptake but stronger reductions. This allows us to examine how different spatial distributions of nitrogen reductions affect nitrate leaching and exceedances of groundwater quality thresholds. In the modeled scenarios, the share of catchments exceeding a nitrate leaching limit of 12 mg L⁻¹ in 2030 is reduced by 48% under the moderate subsidy scheme and by 59% under the tight scheme, relative to the no-policy baseline.

Our results further show that spatial heterogeneity in catchment structure plays a stronger role than interannual climatic variability in shaping nitrate export. Consequently, policy instruments calibrated solely on agricultural N input risk producing outcomes that are misaligned with hydrological processes. For instance, not taking spatial differences in nitrogen retention into account can lead to misleading assessments of policy effectiveness.

This work highlights the importance of integrating agro-economic, biogeophysical and hydrological properties in models to inform policy design capable of accommodating both spatial variability in agricultural systems and the biogeochemical complexity of catchments. By explicitly modeling outcomes across a range of scenarios and including farmers decision-making, we provide insight into how agricultural policy effectiveness can be evaluated and enhanced under global change conditions.

How to cite: Jurak, K., Musolff, A., Kumar, R., and Müller, B.: Tracing agricultural nitrogen policy impacts on groundwater quality through an integrated modeling approach , EGU General Assembly 2026, Vienna, Austria, 3–8 May 2026, EGU26-20431, https://doi.org/10.5194/egusphere-egu26-20431, 2026.

EGU26-20518 | ECS | PICO | BG3.22

Modelling developmental stage-specific climate effects and extremes on wheat yield under global change 

Joel Joshua Milek, Lukas Koppensteiner, Luca Giuliano Bernardini, Gernot Bodner, Elisabeth Zechner, and Eva Maria Molin

Wheat is a key staple crop in temperate regions where projected increases in temperature variability, drought frequency and extreme weather events pose a significant threat to yield stability. Understanding how weather variability, climate extremes and, importantly, their timing in relation to crop development affect yield is essential for modelling agricultural systems in the context of climate change. Increasing climate variability and compound stress events challenge static or season-averaged approaches that fail to resolve developmentally sensitive stress periods.

However, it is often difficult to disentangle these effects across phenological stages due to incomplete or inconsistent phenological observations, particularly in long-term, multi-site datasets. This study presents a proxy-based modelling framework that quantifies yield–environment relationships while explicitly accounting for sensitivities specific to developmental phases.

We analyzed a multi-year historical dataset spanning multiple locations, combining wheat yield records with weather and environmental data extracted from the Spartacus dataset by GeoSphere Austria. Our primary objectives were to: (i) quantify the influence of weather and environmental variables on wheat yield; (ii) identify the most relevant stress factors within these environments; and (iii) assess how stress impacts vary across developmental phases. As phenological scoring data were incomplete across years and locations, we used Growing Degree Days (GDD) as a biologically motivated proxy to reconstruct crop developmental timing.

Based on the reconstructed developmental phases, raw weather and soil data were transformed into explanatory envirotyping variables at multiple temporal scales, including annual aggregates, phase-specific windows and daily to weekly resolutions. Explicit stress indicators were derived for thermal, hydrological and precipitation extremes, including compound and duration-based events, described using both frequency and intensity metrics. These were described using both frequency and intensity metrics. Such temporally explicit stress characterization is essential in the context of global change, given the projected increases in heatwaves, drought duration and compound extremes, which are expected to amplify phase-specific yield sensitivities.

Yield responses were modelled using a combination of linear models and machine learning approaches to capture non-linear effects and interactions. This framework enables the identification of critical developmental windows, the quantification of stress sensitivities and the assessment of environmental similarity and transferability across sites and years. Overall, this scalable envirotyping framework enables the identification of critical developmental windows and time-specific environmental drivers of yield variation, supporting more robust crop modelling and breeding decisions under increasing climate variability.

How to cite: Milek, J. J., Koppensteiner, L., Bernardini, L. G., Bodner, G., Zechner, E., and Molin, E. M.: Modelling developmental stage-specific climate effects and extremes on wheat yield under global change, EGU General Assembly 2026, Vienna, Austria, 3–8 May 2026, EGU26-20518, https://doi.org/10.5194/egusphere-egu26-20518, 2026.

EGU26-20645 | ECS | PICO | BG3.22

Climate-Driven Land Suitability of Pistachio (pistachia vera L.) under Current and Future Climate Scenario in Mediterranean Region  

Bader Ijaz, Marta Debolini, Antonio Trabucco, and Donatella Spano

Pistachio (Pistacia vera L.) is a high valued perennial crop, and its growth is highly controlled by agro climate especially by the temperature regimes, seasonal variation and water supply. The current climate change is likely to change these conditions in the Mediterranean region, and the long-term sustainability of agricultural systems, crop adaptation, and land-use planning are affected directly. Although the relevance of pistachio as a climate resistant crop is increasing, there is still limited basin scale evaluation of the suitability of this pistachio in Mediterranean. We evaluate the climate-driven land suitability of pistachio in the Mediterranean Basin under the current and future climate scenario by machine learning-driven modelling framework. Data on the occurrence of pistachios in the Mediterranean area were summarized and co-expressed with a collection of agro-climatic and topographic variables based on high-resolution climatic information. The screening of environmental indicators attempted to control multicollinearity and to eliminate a parsimonious, agronomically constructive set to reflect thermal conditions, seasonality of temperature variations, extremes of precipitation and terrain limitations that are pertinent to the cultivation of pistachio. The slope was added as an indicator of land suitability to show the possibility of management and the constraints of the terrain. The Maximum Entropy (MaxEnt) model used to assess the present and future suitability under climate change conditions. Model evaluation metrics suggest a strong predictive performance. Findings demonstrate temperature-related factors and dry-season precipitation as the dominant factors affecting the suitability of pistachio throughout the Mediterranean. The spatial distribution of present suitability indicates the existence of core climatic stable cultivation areas, and the future projections show that there will be significant spatial changes in suitability. Significantly, the findings indicate the development of new potentially appropriate areas where the pistachio can be grown in some parts of the Mediterranean that are marginal or unprofitable today, as well as those areas where suitability could decrease with rising climatic stress.

How to cite: Ijaz, B., Debolini, M., Trabucco, A., and Spano, D.: Climate-Driven Land Suitability of Pistachio (pistachia vera L.) under Current and Future Climate Scenario in Mediterranean Region , EGU General Assembly 2026, Vienna, Austria, 3–8 May 2026, EGU26-20645, https://doi.org/10.5194/egusphere-egu26-20645, 2026.

The socioeconomic development in China has fundamentally reshaped the patterns of grain supply, demand, and interregional flows, with significant implications for both national food security and global environmental sustainability. In this study, we constructed an integrated analytical framework to comprehensively assess and forecast the spatial dynamics of grain flows and their associated environmental impacts under multiple future consumption scenarios. Our findings reveal that by 2040, domestic grain supply will continue to fall short of demand, leading to sustained increases in interprovincial flows, alongside a decelerating trend in overseas grain inflows. Crucially, the environmental footprints along the grain flows, particularly in terms of virtual water and virtual greenhouse gas emissions are increasingly decoupled from flow intensity. This decoupling effect is strongly linked to dietary shifts. The more balanced and health-oriented the diet, the stronger the decoupling effect characterized by increased interprovincial flows but reduced environmental footprints, and reduced overseas flows but increased environmental footprints. These results underscore the environmental trade-offs embedded in dietary transitions, and call for systematic integration of environmental impact assessments into food and nutrition policies. Achieving a sustainable food system requires coordinated efforts in both total quantity control and dietary structural optimization.

How to cite: Fang, G., Sun, X., and Bogaert, J.: Dietary transitions intensify the decoupling between China’s grain flows and their environmental footprints, EGU General Assembly 2026, Vienna, Austria, 3–8 May 2026, EGU26-20863, https://doi.org/10.5194/egusphere-egu26-20863, 2026.

Global crop models such as LPJmL typically represent environmental stress through reductions in photosynthesis and leaf area development. Such predominantly source-limited approaches allow for strong post-stress compensation and exhibit little persistence of stress effects. This results in a weak dependence of yield losses on stress timing and an underestimation of impacts during sensitive developmental phases.

We present an enhancement of the LPJmL crop module that explicitly represents persistent stress effects through sink limitation and tissue damage. The main novelty is the introduction of sink limitation, which constrains growth during vegetative development and yield formation during grain filling. Specifically, the number and potential size of harvest organs are determined during flowering, a phenological phase that is highly sensitive to stress. Stress during this period leads to a persistent reduction in sink capacity, limits subsequent growth, and reduces harvest index. Sink limitation leads to a dynamic downregulation of photosynthesis, a process currently absent from the LPJmL crop module.

In addition, we introduce tissue damage as a distinct and partially irreversible pathway to represent impacts of conditions such as waterlogging and frost, which are poorly captured by existing stress formulations.

The model is initially implemented and evaluated for wheat, focusing on nitrogen and water limitation as well as newly introduced waterlogging and frost stress. Heat stress is addressed in complementary work. By representing persistence, this development improves LPJmL’s sensitivity to stress timing and severity and strengthens its mechanistic basis for climate impact assessments.

How to cite: Heinke, J. and Müller, C.: Representing persistent stress effects in LPJmL through sink limitation and tissue damage, EGU General Assembly 2026, Vienna, Austria, 3–8 May 2026, EGU26-21699, https://doi.org/10.5194/egusphere-egu26-21699, 2026.

EGU26-21894 | PICO | BG3.22

Irrigation water limits reduce crop resilience to climate change in China 

Omarjan Obulkasim, Hongbin Liang, Shulei Zhang, and Yongjiu Dai

Irrigation is widely regarded as an effective strategy to sustain crop production under climate change, especially as droughts intensify. However, droughts continue to cause substantial yield losses even in irrigated regions, indicating that irrigation alone cannot fully offset climate-induced risks. Most existing studies assessing adaptation strategies assume unlimited water availability, potentially underestimating the constraints imposed by irrigation system capacity. To address this, we developed an enhanced irrigation module in a land surface model (Common Land Model, CoLM) that explicitly accounts for source water availability, including local runoff, nearby rivers, and upstream reservoirs. Using this framework, we reproduced observed irrigation amounts, crop yields, and the stagnation of irrigation benefits during droughts across China. Future projections under a high-emission scenario (SSP585) suggest that intensifying droughts will exacerbate irrigation water gaps, leading to larger crop yield deficits, particularly in heavily irrigated regions. Our results highlight that reliable evaluation of climate adaptation strategies in agricultural systems requires explicit consideration of irrigation water limitations, providing critical guidance for sustainable food production under global change.

How to cite: Obulkasim, O., Liang, H., Zhang, S., and Dai, Y.: Irrigation water limits reduce crop resilience to climate change in China, EGU General Assembly 2026, Vienna, Austria, 3–8 May 2026, EGU26-21894, https://doi.org/10.5194/egusphere-egu26-21894, 2026.

EGU26-22021 | PICO | BG3.22

A new crop science and modelling approach to improve mechanistic understanding and quantification of abiotic and biotic stress interactions and their impacts  

Reimund P. Roetter, Munir P. Hoffmann, Michaela A. Dippold, Mercy Appiah, Hans-Peter Piepho, Stefan Siebert, Mutez Ahmed, Habib Ur Rahman, Irsa Ejaz, Komainda Martin, Mareike Köster, Susanne Neugart, Annette Pfordt, Michael Rostas, Stefan Scholten, Markus G. Stetter, Ilka Vosteen, Issaka Abdulai, Peter Bulli, and Dennis Otieno and the other MultiStress members

Global warming has already resulted in higher frequencies and severity of multiple abiotic and biotic stresses occurring concurrently or subsequently in farmers’ fields. This trend will likely amplify in the next decades. Yet, to date, the mechanisms determining interactions between abiotic and biotic stresses and their effects on crop performance under field conditions are unknown for most crops and stress combinations. Field data are particularly scarce and, hence, adequate modelling approaches do not exist so far. While crop‐growth models are the most appropriate tools for quantifying climate change effects, they remain largely radiation use efficiency (RUE)‐based, treating stress effects through empirical reductions in photosynthesis or yield (e.g., drought-related multipliers) rather than using explicit carbon reallocations. Critically, they ignore active defense sinks - the substantial fraction of assimilates moved into mucilage, phenolics and other biochemicals that protect plants under stress.

This paper aims to describe a novel crop science and modelling approach, in which new empirical knowledge from the genetic to the field scale is integrated and formalized in the novel “MultiStress model” - implemented for maize.

There are many examples of crop defence mechanisms towards multiple abiotic and biotic stressors and their interactions that come at carbon costs.  Here, we focus on drought-response and illustrate the implementation of the MultiStress model for mucilage exudation under drought conditions. Many water-stressed plants including maize release root mucilage, a gelatinous polysaccharide that maintains rhizosphere moisture. This “hydraulic sponge” keeps soil around drying roots hydraulically conductive, facilitating higher water uptake in dry soil. Yet, the mucilage benefits come at a cost. It has been estimated that about 10–15% of total carbon assimilation may be diverted into mucilage under drought. This represents a large carbon sink that otherwise could have fueled grain production. Current crop models lack any pool for mucilage, so this carbon diversion is simply “lost” from the crop carbon budget. Empirical stress factors downscale growth but do not track where the saved carbon goes to. Most crop models impose a fractional yield loss under drought but cannot differentiate whether the plant invested extra carbon in mucilage or other survival mechanisms. This leads to misallocation of carbon, and overestimated yield and yield stability, since the metabolic cost of mucilage is never subtracted. The MultiStress model explicitly accounts for such carbon costs.

Current process-based crop models are neither fit for generating the knowledge needed for assessing crop impacts of climate-induced multiple stress interactions; nor for the task of informing breeding of climate-resilient crop cultivars. Overcoming these challenges requires a renewal of crop science and modelling as shown and currently under development by the MultiStress Research Unit.

How to cite: Roetter, R. P., Hoffmann, M. P., Dippold, M. A., Appiah, M., Piepho, H.-P., Siebert, S., Ahmed, M., Ur Rahman, H., Ejaz, I., Martin, K., Köster, M., Neugart, S., Pfordt, A., Rostas, M., Scholten, S., Stetter, M. G., Vosteen, I., Abdulai, I., Bulli, P., and Otieno, D. and the other MultiStress members: A new crop science and modelling approach to improve mechanistic understanding and quantification of abiotic and biotic stress interactions and their impacts , EGU General Assembly 2026, Vienna, Austria, 3–8 May 2026, EGU26-22021, https://doi.org/10.5194/egusphere-egu26-22021, 2026.

EGU26-22400 | PICO | BG3.22

Assessing climate change impacts on Mediterranean durum wheat using DSSAT-CERES-Wheat across contrasting environments 

Chiara Rivosecchi, Marco Bianchini, Michele Denora, Biagio Di Tella, Paride D'Ottavio, Marco Fiorentini, Matteo Francioni, Luigi Ledda, Adriano Mancini, Michele Perniola, and Paola Antonia Deligios

The Mediterranean basin is a climate change hotspot, and this will strongly affect key crops such as durum wheat, a staple for millions and a major commodity in southern Europe. Future productivity remains uncertain, as climate change introduces both limiting and beneficial factors. Understanding crop responses is essential to design effective adaptation strategies and ensure food security.

This study assesses the DSSAT-CERES-Wheat model’s ability to simulate durum wheat growth and yield under climate change across three contrasting Mediterranean environments and support adaptive strategies. The model was calibrated for Tirex, a widely cultivated variety, using long-term field data and Monte Carlo optimization, then evaluated with three independent trials in northern (Rovigo), central (Agugliano), and southern (Genzano) Italy, incorporating leaf area index data from Sentinel-2. Two CMIP5 scenarios (RCP 4.5 and RCP 8.5) and three temporal horizons (baseline 1991–2020, near future 2022–2050, far future 2070–2100) were used to simulate yields, evaluate irrigation as adaptative strategy, and assess water use efficiency (WUE).

Calibration showed strong performance for grain yield (R²=0.98, d-stat=0.98, RMSE=0.3 t/ha), canopy biomass (R²=0.98, d-stat=0.62, RMSE=3 t/ha), and anthesis (R²=0.98, d-stat=0.84, RMSE=7.6 days). Evaluation confirmed good agreement for yield and biomass across sites, while LAI was less accurate.

At Rovigo, climate change reduced yields most under RCP 8.5 near future (-1.8 t/ha, -40%). At Agugliano, responses depended on agronomic management: under enhanced conventional (standard nutrition, supplemental irrigation, and integrated pest management), yields declined most under RCP 4.5 near future (-1.8 t/ha, -28%) but increased under RCP 8.5 far future (+1.0 t/ha, +15%). Under zero-stress (fertigation and chemical pest control), yields increased across all scenarios, reaching the highest gain of +1.5 t/ha (+17%) for RCP 8.5 far future. At Genzano, limited effects were observed, with the largest near-future decline (-0.3 t ha⁻¹, -11%) and a far-future increase (+0.7 t/ha, +30%) under RCP 8.5. The achievement of higher yields in the far future compared to the near future across all scenarios may be due to projected increases in atmospheric CO₂, thereby partially offsetting yield losses caused by changes in temperature and precipitation.

Full irrigation mitigated climate impacts. At Rovigo, it led to +3.9 t ha⁻¹ (+84%) under RCP 8.5 far future and improved WUE from 5 to 10–14 kg/mm. At Agugliano, irrigation increased yields under all scenarios, with the largest gain under RCP 8.5 far future (+3.6 t ha⁻¹, +54%) while maintaining a WUE of 10–15 kg/mm. At Genzano, irrigation produced smaller absolute but higher relative gain (+2.0 t/ha, +90%) under RCP 8.5 far future and WUE slightly increased.

Full irrigation effectively stabilizes and increases wheat yields, but only modestly improves WUE, indicating that higher yields do not necessarily translate into greater water efficiency. Full irrigation should therefore be considered a theoretical upper limit rather than a realistic large-scale strategy due to water availability, cost, and infrastructure constraints. Effective climate adaptation in Mediterranean wheat requires combining agronomic management adjustments and genotype choice, supported by crop modeling to assess trade-offs among productivity, water use, and environmental sustainability.

How to cite: Rivosecchi, C., Bianchini, M., Denora, M., Di Tella, B., D'Ottavio, P., Fiorentini, M., Francioni, M., Ledda, L., Mancini, A., Perniola, M., and Deligios, P. A.: Assessing climate change impacts on Mediterranean durum wheat using DSSAT-CERES-Wheat across contrasting environments, EGU General Assembly 2026, Vienna, Austria, 3–8 May 2026, EGU26-22400, https://doi.org/10.5194/egusphere-egu26-22400, 2026.

EGU26-292 | ECS | Posters on site | BG3.23

Multi-species grass mixtures enhance soil functioning in managed grassland mesocosms 

Robin Tersago, Jeroen Meersmans, Camille Van Eupen, Ben Aernouts, Jan-Willem van Groenigen, Ellen Desie, and Karen Vancampenhout

Multi-species grassland mixtures are gaining popularity in managed grasslands, particularly as a strategy to improve soil functioning and subsequently soil health and climate regulation. However, mechanistic data on the relation between plant diversity and the greenhouse gas (GHG) balance of the soil are still sparse. We conducted a full-factorial mesocosm experiment to determine whether multi-species grassland mixtures can enhance the delivery of ecosystem services compared to traditional perennial ryegrass monocultures. Treatments included two plant communities, two soil types and three cutting frequencies - representing land use intensities under controlled conditions. We measured effects on greenhouse gas (GHG) effluxes (CO2, CH4 and N2O), above- and belowground productivity as well as functional catabolic diversity of soil microbes Linear Mixed Models (LMMs) revealed that plant community and soil type impacted all greenhouse gas effluxes, while cutting frequency only impacted CO2 efflux significantly. Multi-species grass mixtures significantly elevated primary productivity compared to perennial ryegrass monocultures, and influenced functional microbial diversity, even overriding soil type (and therefore legacy) effects on functional microbial diversity over a short timeframe. These improvements in soil functioning can improve the delivery of crucial ecosystem services such as climate regulation, food and feed production and soil habitat and nutrient cycling, which underlines the potential of species-rich grassland mixtures in multifunctional grassland farming systems. Future research should explore long-term field dynamics and validate these findings by making carbon budgets to support climate-smart management strategies.

How to cite: Tersago, R., Meersmans, J., Van Eupen, C., Aernouts, B., van Groenigen, J.-W., Desie, E., and Vancampenhout, K.: Multi-species grass mixtures enhance soil functioning in managed grassland mesocosms, EGU General Assembly 2026, Vienna, Austria, 3–8 May 2026, EGU26-292, https://doi.org/10.5194/egusphere-egu26-292, 2026.

EGU26-350 | ECS | Orals | BG3.23

Productivity at a price: mixed pastures show higher ecosystem respiration vulnerability to drought–grazing stress than grass-only patches 

Pankaj Tiwari, Catriona A. Macdonald, Nicholas Wright-Osment, Nor Azizah Kusai, Sally A. Power, and Elise Pendall

Pastures contain a fine-scale mosaic of grass-only (GP) and mixed (grass–legume–forb; MP) patches, whose functional traits shape belowground C inputs and ecosystem respiration (ER). These traits make ER sensitive to drought and frequent grazing, yet their combined effects across patch types remain poorly understood.

To address this, we conducted a 2×2 rainfall × grazing factorial in GP and MP in a field-based temperate pasture climate-manipulation experiment, quantifying the effects of drought, frequent grazing, and their combination on ER, its temperature and moisture sensitivity, and plant C-use efficiency (AGB/ER). Rainfall was based on 30-year records, and grazing simulated via one or three harvests per season. ER was measured during spring, summer, and autumn 2023–2024, and structural equation modelling identified the key pathways by which biophysical factors regulate ER in each patch type.

Highly productive MP, compared to GP, consistently exhibited higher ER (spring: 0.17 vs. 0.11; summer: 0.32 vs. 0.17; autumn: 0.41 vs. 0.12 g C m-2 hr-1), greater C-use efficiency (3.2 ± 0.63 vs. 0.09 ± 0.02), higher apparent temperature sensitivity (Q10: 1.46 vs. 1.22), and weaker moisture constraints. However, this higher functioning came with greater vulnerability: under combined drought and frequent grazing, ER declined non-additively and more sharply in MP (–14.5%, –42.8%, –67.3%) than in GP (–4.6%, –34.2%, –11.2%). C-use efficiency dropped by 80% in MP but remained stable in GP, accompanied by larger reductions in AGB and Q10. Mechanistically, ER in MP was plant-biomass driven, whereas in GP it was microbial-substrate driven, with both indirectly constrained by moisture and temperature-induced soil drying.

These results show that the higher productivity of MP comes at the cost of greater ER vulnerability to drought–grazing stress, offering guidance for grazing management and strengthening predictions of pasture C–climate feedbacks.


How to cite: Tiwari, P., Macdonald, C. A., Wright-Osment, N., Kusai, N. A., Power, S. A., and Pendall, E.: Productivity at a price: mixed pastures show higher ecosystem respiration vulnerability to drought–grazing stress than grass-only patches, EGU General Assembly 2026, Vienna, Austria, 3–8 May 2026, EGU26-350, https://doi.org/10.5194/egusphere-egu26-350, 2026.

Grassland ecosystems form a cornerstone of terrestrial ecological security and support the livelihoods of millions of people worldwide. Under the combined influences of climate change and human activities, grassland degradation unfolds with pronounced spatiotemporal heterogeneity and marked nonlinearity, features that are particularly evident in ecological transition zones. Here, we focus on the agro–pastoral ecotone of northern China and integrate multi-source remote sensing and geospatial datasets to develop a grassland degradation assessment framework benchmarked against potential maximum net primary productivity(NPPmax). Adopting a change-pathway perspective, we identify long-term trajectory types of grassland degradation and recovery and quantitatively examine their underlying drivers. Our analyses reveal that degradation and recovery processes across the region are largely nonlinear, with abrupt, threshold-like shifts being spatially widespread. Although recovery trajectories dominate at the regional scale, a considerable fraction of grasslands remains locked in persistent moderate to severe degradation, and clear spatial differentiation emerges among trajectory types. Climatic factors primarily shape long-term trends in grassland productivity, while human activities play a pronounced amplifying role: they can accelerate rapid recovery under favorable climatic conditions, yet also precipitate sudden, localized degradation. By moving beyond single rates of change to emphasize dynamic pathways, this study deepens understanding of grassland degradation processes in agro–pastoral ecotones. Our findings underscore the importance of simultaneously accounting for climatic context and human regulation in grassland management and ecological restoration. The proposed framework and insights provide a strong scientific basis for zoned management, risk early warning, and adaptive strategies in ecologically vulnerable regions, and hold broad relevance for ecological transition zones worldwide.

How to cite: Li, W., Zhang, C., and Wang, X.: Nonlinear Grassland Degradation and Recovery Benchmarking Potential Productivity: Evidence from the Agro–Pastoral Ecotone of Northern China, EGU General Assembly 2026, Vienna, Austria, 3–8 May 2026, EGU26-3871, https://doi.org/10.5194/egusphere-egu26-3871, 2026.

EGU26-4573 | ECS | Posters on site | BG3.23

Does space-for-time substitution capture soil carbon recovery in restored dry grasslands of Canada? 

Dauren Kaliaskar and Cameron Carlyle

Canadian grasslands are endangered ecosystems, with nearly two-thirds converted to cropland. Restoring cropland to grassland can help reintroduce biodiversity through the planting of native vegetation, increase soil carbon (С) storage, and reduce greenhouse gases through the establishment of perennial plants. However, grassland restoration is expensive and done primarily on private lands. Consequently, restoration must also benefit farmers by providing forage for livestock and creating healthy, resilient soils.

In the past, few grassland sites have been monitored long-term for soil C accumulation following restoration in the Canadian Prairie, despite the slow rate of change in soil C over time, and even fewer have examined deeper soils (beyond 30 cm).

This study addresses the following questions:

1) How do soil organic and inorganic C pools vary with depth and restoration age?

2) Do these sites also provide other important soil functions and support forage production?

To answer these questions, we sampled 18 restored grassland sites across southern Alberta and Saskatchewan, Canada, spanning a chronosequence from pre-restoration (0 years) to 24 years since seeding. Restoration practice involved a one-time seeding of a mix of native and agronomic plant species, along with exclusion from grazing during the early and mid-growing seasons (April-July) in the year following seeding. Sites were characterized based on local climate conditions and soil properties.

Soil samples were collected in May-June 2024 at depths of 0–15, 15–30, 30–60, and 60–100 cm. Soil samples were analysed for organic and inorganic C, moisture, texture, pH, and electrical conductivity. Plant surveys and biomass harvests were conducted in July 2024 to examine community composition and forage production. Climate variables were summarized using the annual heat-moisture index. Soil C and function, and vegetation responses to restoration were assessed using two complementary approaches: (1) chronosequence analysis to test space-for-time assumptions and assess temporal patterns in soil C pools, and (2) AICc-based model selection to quantify the relative influence of vegetation, climatic, and edaphic predictors.

Local climate and soil conditions played a dominant role in the rate of grassland restoration and C distribution within the soil profile, while established plant community composition was associated with changes in soil C storage and forage quality. This study provides a robust evaluation of space-for-time substitution for soil C recovery by examining organic and inorganic C responses across the one-meter soil profile using a large set of restoration sites, addressing limitations of previous studies. Together, these results improve understanding of soil and vegetation responses to restoration and provide new information for producers and policymakers supporting grassland restoration management.

How to cite: Kaliaskar, D. and Carlyle, C.: Does space-for-time substitution capture soil carbon recovery in restored dry grasslands of Canada?, EGU General Assembly 2026, Vienna, Austria, 3–8 May 2026, EGU26-4573, https://doi.org/10.5194/egusphere-egu26-4573, 2026.

EGU26-5083 | ECS | Posters on site | BG3.23

Between Management Extremes: Moderation Sustains Plant Productivity, Rhizosphere Microbiome, and Nutrient Cycling in Drying Savannahs 

Moses Ngugi, Svenja Stock, Rosepiah Munene, Callum Banfield, Lingling Shi, and Michaela Dippold

Grassland management practices, including frequent plant biomass removal, have intensified globally to enhance productivity. However, intensification leads to shifts in plant composition and plant–microbe interactions, with poorly understood implications for ecosystem functions, such as nutrient cycling, and their stability under climatic stress. We hypothesised that biomass removal frequency has an intermediate optimum at which plant–microbe–soil interactions stabilise ecosystem functions under drought, whereas both low and high removal frequencies reduce resilience to climatic stress. In a native managed African tropical grassland, we applied four above-ground biomass removal frequencies (1×, 2×, 3×, and 6× cuts annually). Intact soil-core mesocosms were grown under controlled conditions and subjected to drought stress in a split-plot, completely randomised design, combined with a 13CO₂ pulse-labelling approach. We determined plant productivity, photosynthetic 13C assimilation, belowground C allocation, arbuscular mycorrhizal fungi (AMF) colonisation, microbial biomass carbon (MBC), extracellular enzyme activities (EEAs), and rhizosphere microbial community structure to assess the impacts on C allocation and nutrient cycling. Under well-watered conditions, high biomass removal frequencies (3× and 6×) increased shoot productivity and 13C assimilation relative to low frequencies (1× and 2×). The EEAs (C, N, and P cycling) and proportion of 13C in rhizodeposits increased progressively with an increase in cutting frequency. Low cutting frequencies promoted fungal-dominated rhizosphere communities, particularly saprotrophic fungi, whereas high frequencies favoured bacterial dominance. Drought stress significantly reduced plant productivity, 13C assimilation and root biomass at high cutting frequencies. In addition, drought reduced 13C incorporation into total phospholipid fatty acids (PLFA) by 53% at high cutting frequencies and by 22% at low frequencies. Notably, despite significant reductions in root biomass and 13C assimilation under drought, root AMF colonisation and 13C allocation to soil AMF were consistently higher under drought and progressively increased with decreasing cutting frequency. This reflects a greater plant reliance on microbially mediated nutrient and water acquisition during drought. Overall, our results demonstrate that biomass removal frequency modulates drought impacts on rhizosphere nutrient cycling via shifts in plant functional traits, from resource-conservative (“slow”) to resource-acquisitive (“fast”) species, alongside a reshaping of soil microbial communities from oligotrophic to copiotrophic dominance. These findings highlight the inherent trade-offs between ecosystem productivity and an enhanced resilience to increasingly frequent and intense climate-change-induced stresses, underscoring the need for locally adapted management practices.

How to cite: Ngugi, M., Stock, S., Munene, R., Banfield, C., Shi, L., and Dippold, M.: Between Management Extremes: Moderation Sustains Plant Productivity, Rhizosphere Microbiome, and Nutrient Cycling in Drying Savannahs, EGU General Assembly 2026, Vienna, Austria, 3–8 May 2026, EGU26-5083, https://doi.org/10.5194/egusphere-egu26-5083, 2026.

EGU26-5788 | ECS | Posters on site | BG3.23

Challenges in estimating plant available water in stony forest soils 

Anne Doat, Caroline Vincke, and Mathieu Javaux

Stony soils are very common in non-agricultural landscapes. Yet, characterizing the hydraulic properties of stony subsoil is necessary but technically complex.

In this study, we aim to improve the characterization of stony subsoils by addressing two critical aspects: (i) the estimation of coarse fragment content and (ii) the water retention of stones. Both factors potentially influence plant available water capacity - a key input for many hydrological models - and its uncertainty, yet they are rarely quantified in deep horizons.

Our methodology involved eleven forest sites in Wallonia (Belgium), where soil pits were excavated down to 2 m depth to capture the vertical variability of soil texture, stoniness, hydraulic properties. Coarse fragment content was assessed by horizon using four approaches: two in situ methods and two laboratory-based methods applied to samples of different sizes. Additionally, we carry out measurements on stones to measure available water between field capacity and wilting point.

Preliminary results underline the importance of adapting soil sampling volume and method to the degree of soil heterogeneity to quantify stone water availability at the profile scale. Our results also indicate that certain rock types can hold up to 15 % of their volume of plant available water, challenging the common assumption that their contribution is negligible.

How to cite: Doat, A., Vincke, C., and Javaux, M.: Challenges in estimating plant available water in stony forest soils, EGU General Assembly 2026, Vienna, Austria, 3–8 May 2026, EGU26-5788, https://doi.org/10.5194/egusphere-egu26-5788, 2026.

EGU26-5939 | ECS | Posters on site | BG3.23

Sustainable subsoil management promotes soil carbon sequestration while sustaining crop productivity 

Zhenzhen Li, Zheng-Rong Kan, Amelung Wulf, Hai-Lin Zhang, Lal Rattan, Roland Bol, Xinmin Bian, Jian Liu, Yaguang Xue, Feng-Min Li, and Haishui Yang

Increasing soil organic carbon (SOC) stocks while maintaining high crop productivity remains a critical challenge in paddy-based cropping systems. Widely adopted conservation practices, such as no-till and straw mulching, often show limited potential for subsoil carbon sequestration and may even reduce yields under flooded conditions. Here, we evaluate a subsoil-oriented management practice, ditch-buried straw return (DB-SR), designed to address both constraints simultaneously. Based on a 15-year rice–wheat rotation field experiment, DB-SR significantly increased SOC stocks at 0–40 cm depth by 46%. DB-SR also increased grain yield by 15% without additional fertilizer inputs. Moreover, DB-SR reduced net CO₂-equivalent emissions by 34% and increased net economic benefits by 18%, indicating clear environmental and agronomic advantages. A meta-analysis of field studies across China further confirmed that DB-SR consistently outperformed other straw return and tillage practices in promoting subsoil SOC accumulation and increasing crop yield. Overall, our findings suggest that DB-SR shows strong potential as a subsoil management strategy to enhance subsoil carbon sequestration while sustaining high crop productivity.

How to cite: Li, Z., Kan, Z.-R., Wulf, A., Zhang, H.-L., Rattan, L., Bol, R., Bian, X., Liu, J., Xue, Y., Li, F.-M., and Yang, H.: Sustainable subsoil management promotes soil carbon sequestration while sustaining crop productivity, EGU General Assembly 2026, Vienna, Austria, 3–8 May 2026, EGU26-5939, https://doi.org/10.5194/egusphere-egu26-5939, 2026.

Understanding the vertical distribution of soil biota is essential for predicting soil functioning, nutrient cycling, and ecosystem responses to environmental gradients such as elevation and climate. We studied the depth distribution of soil macrofauna, nematodes, and soil microbes (using phospholipid fatty acid analysis, PLFA), together with basic soil parameters, along an elevational gradient from approximately 90 to 2700 m a.s.l. in a temperate climate (Europe) and a tropical climate (Papua New Guinea). Soil profiles were sampled using hand-dug soil pits to a depth of 1 m.

The density of all faunal groups as well as microbial biomass decreased with increasing soil depth; however, the depth patterns varied among elevations. Soil biota reached the greatest depths at the lowest part of the gradient, particularly in alluvial soils characterized by a deep A horizon, and also at sites close to or above the tree line where A horizon was also quite deep. These results indicate that both soil development and elevation-related environmental constraints strongly influence the vertical distribution of soil organisms, highlighting the importance of considering soil mainly A horizon depth and landscape position when assessing biodiversity and ecosystem processes along elevational gradients.

How to cite: Frouz, J.: Vertical distribution of soil biota along elevation gradient in temperate and tropical climate., EGU General Assembly 2026, Vienna, Austria, 3–8 May 2026, EGU26-6895, https://doi.org/10.5194/egusphere-egu26-6895, 2026.

EGU26-7169 | Posters on site | BG3.23

Tillage effects on plant water and nitrate uptake compare topsoil to subsoil 

Qiaoyan Li and Kristian Thorup kristensen

Different soil management practices and crop species can significantly influence the plant water and nitrogen use. However, how this affects the plant nitrate (NO3-) and water use efficiency from different soil depths, particularly from deep subsoil layers, remains unclear. In this study, we aimed to investigate variations in plant water and nitrogen uptake efficiency across topsoil and subsoil layers under till and no-till soil management practices. A mixture of 2H2O and Ca (15NO3)2 was injected into the soil columns at depths of 20 cm, 60 cm, and 90 cm using customized suction cups in both till and no-till plots. During the installation of the suction cups, soil samples were taken from 10–20 cm, 50–60 cm, and 80–90 cm depth intervals for subsequent nitrate analysis. Aboveground plant tissues were sampled from winter wheat and maize at two field sites in 2025 as an initial test of the method. We plan to expand this approach to five sites across different European countries in 2026. Plant material was collected on the fourth- and eighth- days following tracer injection, including tillers from winter wheat and top leaves, cobs, and stems from maize. The experimental setup provides a promising approach for tracing plant uptake from different soil depths, especially subsoil. We anticipate that this method will help identify variations in plant water and nitrogen uptake across different soil depths and may become a method that allows more routine inclusion of the subsoil in different studies of plant water and nitrogen uptake. This work will contribute to ongoing efforts to evaluate the impacts of conventional and sustainable soil management practices on resource use efficiency.

How to cite: Li, Q. and kristensen, K. T.: Tillage effects on plant water and nitrate uptake compare topsoil to subsoil, EGU General Assembly 2026, Vienna, Austria, 3–8 May 2026, EGU26-7169, https://doi.org/10.5194/egusphere-egu26-7169, 2026.

EGU26-7970 | Orals | BG3.23

Biogeochemistry and sustainable management of the subsoil 

Wulf Amelung, Haishui Yang, and Sara Bauke

More than half of the soil water and nutrients are allocated below a 30 cm soil depth. Yet, this reservoir is hardly included in soil management strategies and is sometimes not even accessible to plants due to root-restricting layers. Here, we present an overview of different research projects on (i) the coupling and decoupling of subsoil biogeochemistry from topsoil processes under different management practices, (ii) the option to manipulate subsoil access through biopores and deep-rooting plants, and (iii) the success of subsoil management through compost injection and burial of straw for the cropping of rainfed (barley, maize) and flooded cereals (paddy rice), respectively. We show that plants are key to connecting top- and subsoil processes, but that it takes decades to centuries for subsoil processes to reach new steady-state equilibria. The interactions between sub- and topsoils, however, can be disentangled using stable and geogenic isotope tracing techniques, such as δ¹⁸O and ⁸⁷Sr/⁸⁶Sr, and can be utilized for management via biological or mechanical techniques to lower the physical resistance of soil to plant growth. Intelligent management of subsoil offers new options for making land use more resilient to climate change and for maintaining high productivity and sustainability with lower long-term fertilizer requirements.

How to cite: Amelung, W., Yang, H., and Bauke, S.: Biogeochemistry and sustainable management of the subsoil, EGU General Assembly 2026, Vienna, Austria, 3–8 May 2026, EGU26-7970, https://doi.org/10.5194/egusphere-egu26-7970, 2026.

The volume and connectivity of the soil macropore network play a key role in soil functioning. Cylindrical pores formed by biotic processes, known as biopores, are essential components of the network because they are typically continuous over longer distances and connect different soil regions. They are therefore fundamental to near-saturated hydraulic and gas-exchange properties, to delineating habitats for soil fauna, and to low-resistance pathways for root growth to deeper soil layers. So far, detailed studies quantifying soil macropore network morphologies have predominantly focused on topsoils. Little is yet known about macropore networks in the subsoil with respect to soil depth, land use, and soil management, especially at depths greater than 0.5 m. This study addresses this knowledge gap by examining the average and variability of macropore network morphologies and the distribution of biopores across different soil horizons down to 1.5-2 m at three agricultural sites located in Belgium, Germany, and Switzerland. Each site included three sampling pits, two in croplands under two contrasting management systems (e.g., conventional tillage vs. reduced tillage) and one in adjacent grassland. Eight undisturbed 250 cm³ aluminium soil cores were sampled from every soil horizon identified in the respective sampling pits, as well as from the transition area between the A and B horizons, resulting in a total of 434 samples [3 sites × 3 pits × (5 – 7) horizons × 8 replicates]. X-ray computed tomography was performed at a voxel resolution of 90 µm. All imaged air-filled macropores were segmented, and cylindrical pores were extracted as biopores. The effects of soil depth, land use, and cropland management on the imaged pore and biopore network morphologies and on the variability of pore structure across soil horizons will be investigated using linear mixed-effect models. We hypothesize that i) the variability of the soil macropore network morphology will decrease with depth; ii) the diameter and volume of biopores will decrease with depth; and iii) the effects of land use and management will be limited to the uppermost B subhorizon. The results from this study provide insight into how land use, agricultural management, and soil depth influence soil macropore structures, which is crucial for understanding and predicting subsoil health, specifically soil functioning related to air, water, and solute transport properties, and soil habitat quality for roots and fauna.

How to cite: Fu, Y., Koestel, J., and Weller, U.: Quantifying soil macropore morphology and biopore distribution at different subsoil horizons in European agricultural soils using X-ray CT, EGU General Assembly 2026, Vienna, Austria, 3–8 May 2026, EGU26-9667, https://doi.org/10.5194/egusphere-egu26-9667, 2026.

EGU26-9710 | ECS | Orals | BG3.23

Grasslands and soil carbon: What can livestock management practices teach us? A global map of scientific knowledge 

Camille Rousset, Luís mendes, Markus van der Meer, Julian Esteban Rivera, Carmen Segura, Mike Bastidas, Anina Gilgen, Marta Alfaro, Mike Dodd, Batnyambuu Dashpurev, Lutz Merbold, Julián Chará, and Eduardo Vazquez

Grasslands represent a vast resource, covering >40% of the Earth’s land surface, supporting biodiversity, reducing erosion risks, and storing carbon (C) in soils. Yet they are increasingly threatened by land-use intensification, land degradation, and climate change. In response to these multiple pressures, numerous scientific studies have examined how grasslands function and what their environmental and socio-economic roles are across diverse climatic, soil, and management contexts. To provide an integrated overview of this complexity, we developed the first systematic global map that synthesises scientific knowledge from field experiments investigating how grassland management practices influence soil C in livestock systems1.

For this global synthesis, 31215 scientific studies in five languages were screened from several major databases (e.g., Web of Science, Scopus, CABI). Each publication was assessed using strict inclusion and exclusion criteria to ensure the reliability of the data retained1. We extracted and mapped information on management practices, from grazing and fertilisation to irrigation, plant composition, and biochar addition, as well as on soil C measurement types (e.g., concentration, stock, sequestration rate), pedoclimatic contexts, and experimental approaches (e.g., study duration, randomisation).

Between 1991 and 2024, the number of studies investigating the effects of grassland management on soil C increased exponentially. Most research has been conducted in temperate, high or upper-middle-income regions, particularly in China, the United States, and parts of Europe, while major gaps persist in Africa and tropical regions. Research has primarily focused on grazing (presence/absence, stocking density), fertilisation, and plant community management. More than half of the studies relied on established agricultural plots, using a space-for-time substitution approach (i.e. comparing long-term management sites to infer temporal trends).

This global map highlights both areas with relevant knowledge and knowledge gaps: key practices such as silvopastoral systems or grazing duration remain understudied. Gaining a deeper understanding of the effects of management practices on C sequestration and soil C fractions, particularly at depths beyond the top 30 cm, is essential to refine models and enhance the accuracy of global C stock estimates.

The compiled dataset represents a valuable resource for the scientific community. It can support future meta-analyses or the identification of knowledge gaps that merit further investigation.


Acknowledgements
This research was developed within the framework of the European Joint Program for SOIL, "Managing and Mapping Agricultural Soils for Enhancing Soil Functions and Services" (EJP SOIL), project CARBOGRASS, funded by the European Union Horizon 2020 research and innovation programme (Grant Agreement No. 862695).

 Reference

1. Rousset, C., Segura, C., Gilgen, A. et al. (2024). What evidence exists relating the impact of different grassland management practices to soil carbon in livestock systems? A systematic map protocol. Environmental Evidence, 13, 22. https://doi.org/10.1186/s13750-024-00345-2

How to cite: Rousset, C., mendes, L., van der Meer, M., Rivera, J. E., Segura, C., Bastidas, M., Gilgen, A., Alfaro, M., Dodd, M., Dashpurev, B., Merbold, L., Chará, J., and Vazquez, E.: Grasslands and soil carbon: What can livestock management practices teach us? A global map of scientific knowledge, EGU General Assembly 2026, Vienna, Austria, 3–8 May 2026, EGU26-9710, https://doi.org/10.5194/egusphere-egu26-9710, 2026.

EGU26-10372 | Posters on site | BG3.23

Impact of subsoil melioration on water use of arable crops: case studies from Germany and South Africa 

Leah Eitelberg, Wulf Amelung, Elmarie Kotzé, Gert Ceronio, Schweitzer Kathlin, Schmittmann Oliver, and Bauke Sara Louise

Subsoils represent an important yet poorly studied component of terrestrial ecosystems. By storing large quantities of water, carbon and nutrients, the subsoil has the potential to support plant productivity. Especially during dry spells, which are assumed to intensify with climate change, subsoil water resources provide a valuable buffer to reduce water stress. However, deep root growth is frequently hampered by the presence of root-restricting layers, such as dense subsoil horizons. Hence, subsoil management options should be established to support plant growth.

We conducted field experiments in arable regions in Germany and South Africa to test whether soil water storage and crop water use efficiency (WUE) could be enhanced through subsoil amelioration by biological and mechanical deep loosening in combination with the incorporation of organic material.

We analyzed stable oxygen isotope (δ18O) values at different soil depths to determine water uptake depth using the Bayesian statistical model MIXSIAR. A dual-isotope approach using carbon (δ13C) and oxygen isotopes in plant biomolecules was also applied to investigate crop water use efficiency of.

The findings demonstrate that the success of subsoil management depends on soil type. In sandy soils, mechanical deep-loosening promoted root water uptake from deeper soil layers and improved biomass production. In contrast, in silty soils, only biological deep-loosening showed positive effects. However, the associated increase in biomass production intensified water stress in the crops. This effect can be mitigated by compost applications, which enhanced soil water retention and promoted root growth into deeper layers, leading to an improved water supply for crops.

How to cite: Eitelberg, L., Amelung, W., Kotzé, E., Ceronio, G., Kathlin, S., Oliver, S., and Sara Louise, B.: Impact of subsoil melioration on water use of arable crops: case studies from Germany and South Africa, EGU General Assembly 2026, Vienna, Austria, 3–8 May 2026, EGU26-10372, https://doi.org/10.5194/egusphere-egu26-10372, 2026.

EGU26-11005 | ECS | Posters on site | BG3.23

How timing of fertilization affects N2O emissions from a legume grassland on northern mineral soil 

Petra Manninen, Timo Vesala, Olli Peltola, Janne Rinne, and Narasinha Shurpali

Agricultural soils are significant sources of N2O, and they have been estimated to be responsible for about 60% of global anthropogenic N2O emissions. These emissions mainly originate from the application of synthetic fertilizers. Globally, 120 Tg N of new N as synthetic fertilizer is introduced to soil every year to sustain crop and grass production. Agricultural sector is responsible for 14% of the total anthropogenic greenhouse gas (GHG) emissions in Finland, from which 54% are N2O emissions. Growing season in Finland is relatively short (May-September) and all the grazing and feed production happens during those months. About 35% of Finland's cultivated arable land is cultivated with forage. With optimized management practices, such as crop species selection and timing of fertilization, N2O emissions from agricultural fields and per units of feed produced could be reduced. Since N2O is the most potent GHG, even small reductions in its emissions can yield significant climate benefits.

Introducing legumes, such as red clover (Trifolium pratense), to crop rotations reduces the need of synthetic fertilizers, due to the ability of the legumes to fix their own N via a symbiosis with rhizobia bacteria. Previous studies have shown lower N2O fluxes in red clover grass mixtures compared to monocultures and grass mixtures with other grass species. Lower levels of synthetic N fertilization also reduce indirect N2O and CO2 emissions which are generated during the fertilizer manufacturing process. In mineral soils, highest N2O emission peaks are often measured after fertilization events. The fertilizer induced emission peak can be reduced by shifting the timing of fertilization, e.g. week after harvest, when plants are in active growth phase and can utilize nutrients more efficiently.

In this research we tried to answer to two research questions: 1) Do annual N2O emissions from the agricultural field to the atmosphere decrease with increasing red clover coverage? 2) How does the timing of post-harvest fertilizer application influence subsequent N2O emission peaks? The research was conducted in a 6.3 ha agricultural field on a mineral soil, near Maaninka, eastern Finland. N2O exchange of the field was studied using the eddy covariance technique from four years of grass rotation cycle (2022–2025). Crop, soil and environmental variables were also measured to help explain the N2O exchange patterns and N dynamics. We hypothesized that delaying the fertilizer application by approx. one week after harvest decreases the resulting N2O emission peaks and that annual N2O emissions from the agricultural field to the atmosphere decreases with increasing red clover coverage. In this presentation, we highlight the changes in red clover coverage, total yield, N2O emissions originating from fertilization and the annual N2O dynamics.

How to cite: Manninen, P., Vesala, T., Peltola, O., Rinne, J., and Shurpali, N.: How timing of fertilization affects N2O emissions from a legume grassland on northern mineral soil, EGU General Assembly 2026, Vienna, Austria, 3–8 May 2026, EGU26-11005, https://doi.org/10.5194/egusphere-egu26-11005, 2026.

EGU26-11079 | ECS | Posters on site | BG3.23

Faster soil carbon aging with depth at higher elevations in a subtropical forest 

Wanshu Li, Jing Wang, Huanfa Sun, Ning Wei, Liming Yan, Jian Zhang, and Jianyang Xia

Earth system models are increasingly adopting multi-layer soil frameworks to improve simulations of vertical carbon distribution. A critical parameter in these models is the e-folding depth (zτ), which quantifies the rate at which soil organic carbon (SOC) ages with depth. Specifically, zτ represents the soil depth at which carbon becomes e-times older (≈2.7 times older) than surface carbon. Despite its importance, most models assume constant zτ within biomes, leaving its spatial variability largely unclear. To test this assumption, we collected multi-layer soil samples across eight forest plots spanning a subtropical montane elevational gradient (427 to 1,474 m) and employed radiocarbon dating to quantify vertical SOC aging patterns. Our results revealed a robust exponential increase in SOC age with depth at all elevations, alongside a 66% decline in zτ from 78.6 cm at the base to 26.4 cm at the summit. This indicated that a 1-meter increase in soil depth approximately amplified SOC age by 4-fold at the lowest elevation and 44-fold at the highest position. Despite significant changes in vegetation along the elevational gradient, vegetation type did not play an essential role in controlling zτ variability. Instead, this elevational dependence of zτ was primarily driven by soil water content (22.2% of variability explained), mean annual temperature (19.7%), and soil carbon-to-nitrogen ratio (19.0%). These findings suggest zτ as an elevation-sensitive sentinel of soil carbon dynamics, urging models to incorporate its variability for projections of soil carbon persistence under climate change.

How to cite: Li, W., Wang, J., Sun, H., Wei, N., Yan, L., Zhang, J., and Xia, J.: Faster soil carbon aging with depth at higher elevations in a subtropical forest, EGU General Assembly 2026, Vienna, Austria, 3–8 May 2026, EGU26-11079, https://doi.org/10.5194/egusphere-egu26-11079, 2026.

EGU26-11442 | ECS | Posters on site | BG3.23

Grassland management affects soil carbon responses to drought 

Fabrizzio Protti-Sánchez, Louisa Kanis, Tatiana Trubnikova, Herbert Alois Wachter, Olga Vindušková, Christina Biasi, and Michael Bahn

Drought events are increasingly threatening soil organic carbon (SOC) stability in grasslands, yet the role of grassland management in shaping drought and post-drought responses of SOC remains poorly constrained. We examined how grassland management intensity influences microbial respiration responses during drought and recovery, including the Birch effect (a pulse of soil CO2 release following rewetting of dry soils) and SOC priming (changes in SOC decomposition triggered by fresh carbon inputs). These responses were assessed in a controlled soil incubation study with experimentally imposed drought, using soils from grasslands covering a range of management types and elevations.

Grassland management strongly altered soil and root properties, including SOC content, fine-root biomass, and bulk density, and caused distinct soil microbial respiration dynamics in response to drought. Respiration was more strongly reduced by drought in soils from intensively managed grasslands, while its recovery from drought was not affected by management intensity. Similarly, the magnitude of the Birch effect following rewetting varied little among management types. In contrast, SOC priming differed strongly among sites and management regimes. Our results suggest that management-induced changes in soil structure and carbon pools modulate SOC responses to drought and subsequent carbon inputs.

How to cite: Protti-Sánchez, F., Kanis, L., Trubnikova, T., Wachter, H. A., Vindušková, O., Biasi, C., and Bahn, M.: Grassland management affects soil carbon responses to drought, EGU General Assembly 2026, Vienna, Austria, 3–8 May 2026, EGU26-11442, https://doi.org/10.5194/egusphere-egu26-11442, 2026.

EGU26-12265 | ECS | Posters on site | BG3.23 | Highlight

Functional diversity and grassland soil carbon stocks under climate change: Insights from global modelling 

Stephen Björn Wirth, Christoph Müller, Friedhelm Taube, Jens Heinke, Britta Tietjen, and Susanne Rolinski

Grassland stores approximately 20% of global soil organic carbon (SOC). While environmental conditions and management directly affect this storage, the role of functional diversity remains poorly quantified at large scales.

We conducted an assessment of functional diversity effects on SOC storage and productivity of managed grassland under climate change using the LPJmL-CSR model. We simulated low (FD-: single dominant strategy) and high (FD+: multiple strategies present) functional diversity under two climate scenarios (SSP1-2.6 and SSP3-7.0) from 1901 to 2100.

Results show substantial differences between scenarios. Under SSP1-2.6, SOC declined in FD- but remained stable in FD+. In contrast, under SSP3-7.0, SOC increased in both scenarios due to CO2 fertilization and increasing temperatures. For both climate scenarios FD- remained approximately 30% lower than FD+ by 2100. Productivity showed similar spatial and temporal patterns. Regional analysis revealed distinct mechanisms. In tropical climates, removing subordinate functional types reduced total productivity despite increased growth of remaining species, while in temperate regions, prevented adaptation to warming led to productivity breakdown.

Examining the underlying mechanism showed that functional diversity underpins the grassland communities’ potential to adapt to climate change allowing them to compensate for negative effects and acting as an insurance against climate change. To our knowledge, these results confirm findings from local-scale empirical experiments at the global scale for the first time. These findings have implications for carbon farming practices, where maintaining functional diversity could enhance long-term carbon sequestration potential.

How to cite: Wirth, S. B., Müller, C., Taube, F., Heinke, J., Tietjen, B., and Rolinski, S.: Functional diversity and grassland soil carbon stocks under climate change: Insights from global modelling, EGU General Assembly 2026, Vienna, Austria, 3–8 May 2026, EGU26-12265, https://doi.org/10.5194/egusphere-egu26-12265, 2026.

EGU26-12659 | ECS | Orals | BG3.23

Effects of land cover on subsoil physical and hydraulic properties 

Aurélien Lengrand, Mathieu Javaux, Johannes Koestel, and Harry Vereecken

Land cover changes exert growing pressure on soils and can modify their physical structure and hydraulic behaviour. While the influence of land cover on erosion, compaction, and biological activity in the upper 30 cm is well documented, much less is known about how far these effects extend into deeper horizons. Here, we analyse depth-dependent variations in structural and hydraulic properties for soils of comparable texture under cropland, grassland, and forest. We used the EU-HYDI database, comprising 6,014 profiles and over 18,000 samples across Europe (36% with LUCAS land cover information). Samples were grouped by texture classes (using a modified version of the HYPRES texture triangle) and land cover independently of soil profile. For each texture X land cover combination, we fitted generalized additive models (GAMs) with depth, including random effects for data source to account for heterogeneity in analytical methods and sampling protocols. Results reveal significant differences in bulk density and θsat up to 60 cm, with consistent patterns (cropland > grassland > forest for bulk density; cropland < grassland < forest for θsat). These results show that land cover impacts are not restricted to the topsoil, highlight the lack of subsoil data, particularly for fine-textured soils and forested sites and underscores the importance of harmonized measurement procedures to improve comparability in soil hydrological studies.

How to cite: Lengrand, A., Javaux, M., Koestel, J., and Vereecken, H.: Effects of land cover on subsoil physical and hydraulic properties, EGU General Assembly 2026, Vienna, Austria, 3–8 May 2026, EGU26-12659, https://doi.org/10.5194/egusphere-egu26-12659, 2026.

EGU26-13743 | ECS | Posters on site | BG3.23

Forecasting carbon and nitrogen cycling from intensively managed grassland systems using the QUINCY land surface model 

Josua Seitz, Eleanor Lampard, Morad Mirzaei, Rachael Murphy, Matthew Saunders, Lucía Gill, Áine Murray, Eoin Dunne, and Silvia Caldararu

Grasslands cover a substantial part of the global ice-free land area (~40%) and they store about one third of the terrestrial carbon stock globally. These ecosystems and their significant carbon stocks are very susceptible to climate change and are often extensively managed for human use. This management, including grazing, cutting and fertilising is known to have an impact on carbon (C) and nitrogen (N) fluxes with implications for greenhouse gas (GHG) emissions and surface and groundwater pollution. In the Republic of Ireland, grasslands cover roughly 60% of the land area and the agricultural sector is the largest emitter of GHGs and contributes roughly 38% of national emissions. It is therefore critical to be able to understand and predict the interactions between management and GHG budgets. Land surface models can be an invaluable tool in this endeavour, allowing us to test a multitude of management practices and their interactions as an in sillico experiment.

We investigate the ecosystem C and N budgets as affected by long-term management of grasslands in the form of N addition (fertilizer, slurry i.e., organic N) and grazing over 50 years using the QUINCY LSM. Based on local management data, we test different N application rates across time (between 50 and 300 kg N ha-1 year-1) in combination with different grazing intensities (0.5 to 5 livestock units ha-1) and timing of grazing at four Irish grasslands. We show that applying yearly fertilizer amounts exceeding 150 kg N ha-1 does not significantly increase grassland aboveground net primary productivity (ANPP) and most N entering the system is lost through leaching and nitrous oxide (N2O) emissions, while no or very low N addition combined with grazing results in decreasing C storage We further use the resulting N addition and grazing scenarios to identify best potential practices for balancing C storage, GHG emissions and grassland productivity. Beyond providing insights into C and N cycling processes in managed grasslands, our study also points to a pathway for using complex process-based models to guide management practices and policy.

How to cite: Seitz, J., Lampard, E., Mirzaei, M., Murphy, R., Saunders, M., Gill, L., Murray, Á., Dunne, E., and Caldararu, S.: Forecasting carbon and nitrogen cycling from intensively managed grassland systems using the QUINCY land surface model, EGU General Assembly 2026, Vienna, Austria, 3–8 May 2026, EGU26-13743, https://doi.org/10.5194/egusphere-egu26-13743, 2026.

EGU26-17042 | ECS | Orals | BG3.23

Soil Carbon and Nutrient Responses to Woody Encroachment in Alpine Grasslands 

Clara Kopp, Louisa Stilp, Vera Mutz, Michael Bott, Bernd Panassiti, Jörg Ewald, and Mariana Rufino

Mountain pastures in the Alps are cultural landscapes that have been shaped over centuries by traditional grazing practices. These pastures harbour unique biodiversity and provide multiple ecosystem services, such as forage production and soil carbon sequestration. However, in recent decades, socio-economic changes have led to a widespread decline in mountain agriculture, resulting in pasture abandonment and woody encroachment. This study assesses how early successional woody encroachment affects soil carbon storage and nutrient dynamics along an elevation gradient.

To this end, 15-metre transects were randomly placed within non-encroached and encroached areas (with >20% cover of juvenile trees) of eight mountain pastures, which ranged in altitude from 680 to 1270 meters above sea level in the Berchtesgaden National Park in the Northern Limestone Alps in Germany. Soil samples were taken to a depth of 30 cm and analyzed for total organic carbon (TOC), total nitrogen, and available phosphorus (Olsen-P). Bulk density was also measured, and nutrient stocks were calculated.

TOC and nitrogen concentrations, as well as Olsen-P, were significantly higher with encroachment, while carbon and nitrogen stocks showed no significant differences between encroached and non-encroached transects. The effect on TOC was more pronounced in the upper soil layer; in the lower layer, elevation and aspect also significantly affected TOC levels. The magnitude of the TOC increase in encroached sites could be partially explained by soil pH. These results highlight the variable effects of woody encroachment on nutrient and carbon dynamics, which depend on the successional stage, elevation, aspect and parent material.

How to cite: Kopp, C., Stilp, L., Mutz, V., Bott, M., Panassiti, B., Ewald, J., and Rufino, M.: Soil Carbon and Nutrient Responses to Woody Encroachment in Alpine Grasslands, EGU General Assembly 2026, Vienna, Austria, 3–8 May 2026, EGU26-17042, https://doi.org/10.5194/egusphere-egu26-17042, 2026.

EGU26-17058 | Posters on site | BG3.23

Enzyme activities down the soil profile: a meta-analysis 

Naoise Nunan, Fatima El Mekdad, Samuel Abiven, and Xavier Raynaud

Soil enzymes are major contributors the decomposition of soil organic matter. They are believed to reflect microbial nutrient and energy acquisition strategies and limitations. Whilst enzyme activities in surface soil layers have been widely studied, activities down the soil profile have received far less attention. Here, we present the results of a meta-analysis of hydrolase and oxidoreductase activities involved in the C, N and P cycles as a function of soil depth. The aim of the analysis was to understand how the relationship between microbial communities and their nutritional environment changes with depth. We assembled a database of ~1500 soil profiles from diverse locations, soil types, land uses and climates. In order to compare activity profiles, we used Gaussian process regression, followed by hierarchical clustering. Our results show that, when expressed per soil mass, the majority of hydrolase activities decrease with increasing soil depth. Proportionally more oxidoreductase activities, however, remained stable with depth, possibly indicative of changes in microbial community resource acquisition strategies with depth. Microbial biomass specific enzyme activities tended to increase with soil depth, suggesting an increase in microbial allocation to resource acquisition in response to decreased resource (C, N and P) availability and/or an increased enzyme stabilization on mineral and organic surfaces.

How to cite: Nunan, N., El Mekdad, F., Abiven, S., and Raynaud, X.: Enzyme activities down the soil profile: a meta-analysis, EGU General Assembly 2026, Vienna, Austria, 3–8 May 2026, EGU26-17058, https://doi.org/10.5194/egusphere-egu26-17058, 2026.

EGU26-17164 | ECS | Posters on site | BG3.23

How to model N2O emissions of grazed pastures with DayCent? 

Lena Barczyk and Christof Ammann

Nitrous oxide (N2O) is one of the main greenhouse gases (GHG), and it occurs particularly in agricultural soils due to fertilizer applications and livestock grazing. Cattle, for instance, excrete 75-95% of their nitrogen (N) intake. National N2O emission estimates for grazing cattle excreta are highly uncertain as they are typically calculated using global emission factors. A few countries including the U.S. and Australia use biogeochemical models to report N2O emissions from agricultural soils. In Switzerland, the biogeochemical model DayCent was successfully applied for simulations of N2O emissions from cropland with diverse crop rotations (dos Reis Martins et al. 2022; Wang et al. 2025) and mown grasslands with different mangement intensities (dos Reis Martins et al. 2024). However, it has not yet been validated for grazing pasture systems in Switzerland.

In this study, we aim to test DayCent for pasture systems in Switzerland, by a) examining how the grazing activities can be represented appropriately in the model, and b) to test the preformence of Daycent  in reproducing observed N2O emissions.

Datasets from two Swiss field experiments in Posieux (Voglmeier et al. 2019; 2020) and Waldegg (Barczyk et al. 2024) were used. In both experiments, pasture N2O emissions had been measured by eddy covariance over several years (Posieux: 2013-2017; Waldegg: 2020-2023) and the pasture management like the timing of grazing and fertilising events was precisely documented. First, a sensitivity analysis of the model was performed by varying the main grazing parameter flgrem (fraction of live shoots removed by a grazing event) in DayCent. Secondly, the model was applied in two scenarios: GrazMod (using the specific grazing module of DayCent) and HarvFert (representing cattle grazing intake by harvests and excreta depositions by fertilizer applications).

For both sites, the amount of biomass N consumed by the cattle on the pasture varied between 2-30 g N m-2 yr-1 initially increasing in correlation to the flgrem value, however following a saturation curve at higher flgrem values. The amount of N excreted on the pasture was proportional to the amount of N consumed (DayCent default: 80%), which was close to the values estimated by a cattle N budget approach as used in the national GHG inventory. N2O emissions were higher for the HarvFert scenario, possibly due to a lower aboveground biomass which favors the emission loss of N. DayCent tends to underestimate the observed N2O emissions of both pastures. Further results of DayCent simulations will be shown and discussed.

How to cite: Barczyk, L. and Ammann, C.: How to model N2O emissions of grazed pastures with DayCent?, EGU General Assembly 2026, Vienna, Austria, 3–8 May 2026, EGU26-17164, https://doi.org/10.5194/egusphere-egu26-17164, 2026.

EGU26-17253 | Posters on site | BG3.23

Grassland use intensity and climate as key drivers of soil organic carbon across four continents 

Eduardo Vázquez, Camille Rousset, Marta Alfaro, Javier Almorox, Jacobo Arango, Natalia Banegas, Mike Bastidas, Marta Benito, Klaus Butterbach-Bahl, Luis Colcombet, Batnyambuu Dashpurev, Mike Dodd, Anina Gilgen, Sonja M. Leitner, Luis Mendes, Lutz Merbold, Felix Ngetich, Winnie Ntinyari, Julián Esteban Rivera, and Julián Chará

Grasslands cover nearly 40% of the Earth’s terrestrial surface and store large quantities of carbon (C) in their soils. However, grassland-use intensification, unsustainable management practices and climate change threaten this important C reservoir. Understanding how different grassland use intensities (GUI) influence soil C stocks is therefore essential to promote C accumulation and improve grassland sustainability. Although many studies have addressed this issue in recent decades, most have been conducted at local or regional scales, limiting our ability to detect general patterns because the response of soil C to GUI is strongly context dependent. Therefore, disentangling management effects from pedoclimatic factors is crucial to improving our understanding of how grassland management influences soil C.

To address this knowledge gap, we investigated 46 grasslands across 15 sites located in Argentina, Colombia, Germany, Kenya, New Zealand, Spain and Switzerland, all sampled following a standardized protocol. Soil samples were collected at three depths (0–10, 10–20 and 20–30 cm) to quantify soil organic C and additional soil properties. Information on management practices was compiled for each grassland. Using livestock density (livestock unit grazing days ha−1 yr−1), the number of mowing events per year, and annual nitrogen fertilization (kg N ha-1 yr-1), we calculated the GUI index proposed by Blüthgen et al. (2012) which reflects the combined effects of these management practices.

Our sites span a wide climatic gradient, with mean annual temperature ranging from 0.8 to 27.4°C, precipitation from 518 to 2357 mm, and aridity index from 0.42 to 3.49. Tropical and subtropical grasslands were generally characterized by low grazing intensity and little or no N fertilization, whereas temperate sites often combined grazing, mowing and, in some cases, high N fertilizer inputs. As a consequence, we obtained a wide range of GUI index values, from 0 in unmanaged conservation grasslands to values >10 in intensively managed systems in Switzerland and Germany. Preliminary analyses suggest that both the aridity index and the GUI index may play an important role in explaining variation of soil C concentrations across sites, underscoring the importance of GUI in shaping soil C storage. Ongoing analyses incorporating additional explanatory variables (i.e. clay, bulk density, biomass production or soil pH)  will provide deeper insights into the drivers of soil C dynamics in grasslands worldwide.

Acknowledgements

This research was developed within the framework of the European Joint Program for SOIL, "Managing and Mapping Agricultural Soils for Enhancing Soil Functions and Services" (EJP SOIL), project CARBOGRASS, funded by the European Union Horizon 2020 research and innovation program (Grant Agreement No. 862695). UPM was funded by Project PCI2023-143386 funded by MCIN/AEI/ 10.13039/501100011033/EU. ILRI was funded by the CGIAR Science Programs Climate Action and Multifunctional Landscapes.

Reference

Blüthgen, N., Dormann, C. F., Prati, D., Klaus, V. H., Kleinebecker, T., Hölzel, N., ... & Weisser, W. W. (2012). A quantitative index of land-use intensity in grasslands: Integrating mowing, grazing and fertilization. Basic and Applied Ecology, 13(3), 207-220.

How to cite: Vázquez, E., Rousset, C., Alfaro, M., Almorox, J., Arango, J., Banegas, N., Bastidas, M., Benito, M., Butterbach-Bahl, K., Colcombet, L., Dashpurev, B., Dodd, M., Gilgen, A., Leitner, S. M., Mendes, L., Merbold, L., Ngetich, F., Ntinyari, W., Rivera, J. E., and Chará, J.: Grassland use intensity and climate as key drivers of soil organic carbon across four continents, EGU General Assembly 2026, Vienna, Austria, 3–8 May 2026, EGU26-17253, https://doi.org/10.5194/egusphere-egu26-17253, 2026.

The root zone is one of the most important soil horizons through which plant obtains its needs of nutrient and water resources, especially for deep rooted plant. However, few studies exist on the multi-fractal of soil particle size distribution and its great influence on soil chemical properties and soil water status in the root zone for a deep soil profile, with most knowledge gained from shallow rooted plant. We obtained multiple soil profiles with the maximum rooting depth to 21 m, and applied single fractal and multifractal dimensions to characterize the soil particle size distribution, and explored their correlations with soil depth, soil chemistry properties and soil water. Our results found single fractal and multifractal dimensions of soil PSD and soil particle composition (clay, silt and sand content) varied with soil depth in a soil profile that can be categorized according to above and below the depth corresponding to 90% of the total root biomass as R-zone and D-zone, respectively. Soil fractal dimensions except capacity dimension (D1) and correlation dimension (D2), and clay and silt content differed significantly in the R-zone and the D-zone (p < 0.01). Correspondingly, the relationship between the soil PSD and soil chemical properties were higher in the R-zone than those in the D-zone. From the R-zone to the D-zone, the correlations between D1 and D2 and soil water content in dried soil layers changed from positive to negative. Based on these results, we concluded that more heterogeneity of soil physicochemical properties in the R-zone than the D-zone. Our findings highlight the importance and complexities of soil physicochemical properties in the root zone, some of which are valuable to characterize root function in the Critical zone and form integral components of vegetation models.

How to cite: Zhou, Z.: Using multi-fractal analysis to characterize the variability of the soil physical-chemical properties along deep soil profile through multipoint sampling, EGU General Assembly 2026, Vienna, Austria, 3–8 May 2026, EGU26-17549, https://doi.org/10.5194/egusphere-egu26-17549, 2026.

EGU26-18826 | Orals | BG3.23

Sustainable intensification of tropical pastures: Optimize nitrogen supply through integration of legumes and grasses with biological nitrification inhibition? 

Astrid Oberson, Lorenz Allemann, Jacobo Arango, Emmanuel Frossard, Alizon Giraldo, Mauricio Sotelo, Eduardo Vázquez, Jaime E. Velásquez, and Daniel M. Villegas

In the northwestern Amazon region livestock farming typically involves extensive grass-only pastures that do not receive nitrogen (N) fertiliser. Over time, nutrient depletion leads to degradation in vast areas of pasture, with severe economic and ecological consequences. Our project investigates the impact of integrating legumes (e.g., Arachis pintoi) and grasses with biological nitrification inhibition (BNI) capacity on the N cycle in the soil–plant system. The study was conducted on seven farms in the Caquetá department of Colombia, in pasture plots that had been under the present pasture type for 5 to 30 years. We quantified plant biomass yields, N uptake and biological N2 fixation. In topsoil (0-0.1 m) the ammonium and nitrate content was measured and the gross N fluxes quantified using the 15N pool dilution method. The results revealed that the presence of legumes and the species of grass significantly affected the N cycle in the soil-plant system. Higher forage yield and higher mineral N in soils were observed in grass-legume than grass-alone pastures. This was likely due to the N2 fixation capacity of the legumes, which derived more than 70% of their N from atmosphere. The yield benefit in grass-legume pastures was more pronounced when the legumes were combined with the high BNI capacity grass (Urochloa humidicola). Ammonium was the dominant soil mineral N form in all pasture types, and gross and net nitrification tended to be lower in soils from pastures with high BNI capacity grass (P ≤ 0.10). Reduced nitrate production indicates a lower risk of nitrate leaching and N₂O emissions. Data on the impact of pasture type on total soil organic carbon and N contents are under evaluation. To our knowledge, this is the first study to examine the role of high-BNI grasses under low-input farming conditions, combined with legumes to mitigate N deficiency in pastures. Our findings illustrate a pathway towards sustainable intensification through biological interventions, with the potential to reduce soil degradation and harmful N losses across large areas of tropical pastureland.

How to cite: Oberson, A., Allemann, L., Arango, J., Frossard, E., Giraldo, A., Sotelo, M., Vázquez, E., Velásquez, J. E., and Villegas, D. M.: Sustainable intensification of tropical pastures: Optimize nitrogen supply through integration of legumes and grasses with biological nitrification inhibition?, EGU General Assembly 2026, Vienna, Austria, 3–8 May 2026, EGU26-18826, https://doi.org/10.5194/egusphere-egu26-18826, 2026.

EGU26-19838 | Posters on site | BG3.23

Effects of Grazing Management Intensity on Carbon Stocks in Mediterranean Silvopastoral Systems 

Luis Mendes, Eduardo Vázquez, Melanie Estrella, Javier Almorox, Agustín Rubio, Joaquín Cámara, and Marta Benito

Agroecosystems integrate livestock and food production systems to meet global demands, but highly intensive management practices are often associated with soil degradation, erosion, and losses of soil carbon and biodiversity. In Mediterranean silvopastoral systems such as dehesas, grazing management plays a central role in regulating vegetation dynamics, nutrient cycling, and soil organic carbon storage. Understanding how different grazing intensities influence soil carbon stocks is therefore essential to support sustainable land management strategies in these systems.

This study examines the effects of contrasting grazing management intensities on soil carbon stocks and related soil properties within Mediterranean silvopastoral environments. Reforested areas without grazing were compared with two grazing systems characterized by different degrees of rotational intensity, allowing the evaluation of how grazing pressure and management strategies influence carbon distribution across ecosystem compartments. Field assessments to quantify aboveground and belowground carbon stocks included measurements of woody and herbaceous vegetation components, plant necromass, and soil carbon, with particular attention to spatial variability associated with tree canopy presence.

The results revealed consistent differences in soil carbon stocks among grazing management strategies, with lower grazing intensities generally associated with higher soil carbon accumulation compared to higher grazing intensity. The presence of grazing, when managed under rotational schemes, was linked to enhanced soil carbon stocks compared to unmanaged areas, suggesting positive interactions between livestock activity, vegetation turnover, and soil carbon accumulation. Tree canopy effects further influenced soil carbon distribution, highlighting the importance of spatial heterogeneity and vegetation structure in modulating soil carbon dynamics within silvopastoral systems. In addition, soil carbon stocks were closely associated with other indicators of soil fertility and nutrient cycling, reflecting broader changes in soil functioning linked to grazing management.

Acknowledgements

This work was funded by the project “Impact of grassland management on soil carbon storage-CARBOGRASS” (Project PCI2023-143386 funded by MCIN/AEI/ 10.13039/501100011033/EU).


How to cite: Mendes, L., Vázquez, E., Estrella, M., Almorox, J., Rubio, A., Cámara, J., and Benito, M.: Effects of Grazing Management Intensity on Carbon Stocks in Mediterranean Silvopastoral Systems, EGU General Assembly 2026, Vienna, Austria, 3–8 May 2026, EGU26-19838, https://doi.org/10.5194/egusphere-egu26-19838, 2026.

EGU26-19975 | Posters on site | BG3.23

Meta-analysis of the net ecosystem carbon budget of European grasslands 

Christof Ammann and David Schweizer

The agricultural sector's role in climate change is a topic of debate and uncertainty, particularly regarding the soil carbon sequestration effect of grasslands. Numerous studies have examined specific grassland sites using the net ecosystem carbon budget (NECB) approach based on the eddy-covariance (EC) method for measuring the CO2 exchange with the atmosphere and the quantification of ‘lateral’ carbon exports and imports (e.g., harvest and organic fertilizer application). Finding clear and consistent numbers is often complicated by issues of nomenclature and methodology of the carbon budget calculations and presentation in the literature or by missing information about management and lateral carbon flux details.

This review aims to synthesize current data on the NECB of European grasslands (excluding organic soils). For this purpose, a detailed search and screening of the currently available peer-reviewed literature regarding EC-based NECB of grasslands in Europe was conducted. Data for 43 different sites in 16 countries passed the screening and quality checks, totaling 147 site-years of NECB measurements. The gathered NECB data for grasslands are scattered over a large range of NECB values between about –350 and +350 g C m−2 yr−1. The overall average of −33 g C m−2 yr−1 indicates a slight carbon sink, although with a large uncertainty. We could not detect a significant spatial distribution pattern of source or sink sites. In addition, we found that sites at the same location can act as sources or sinks depending on the management practice of the fields. For an improved assessment, a more consistent and complete data reporting of all flux measurement sites would be useful.

How to cite: Ammann, C. and Schweizer, D.: Meta-analysis of the net ecosystem carbon budget of European grasslands, EGU General Assembly 2026, Vienna, Austria, 3–8 May 2026, EGU26-19975, https://doi.org/10.5194/egusphere-egu26-19975, 2026.

EGU26-20471 | Orals | BG3.23

Towards more sustainable organic grassland fertilization – a synthesis based on full N balances 

Michael Dannenmann, David Piatka, Sebastian Floßmann, Elisabeth Ramm, Julia Kepp, Jincheng Han, and Ralf Kiese

Cattle slurry is widely used as organic fertilizer in temperate grasslands, but high nitrogen (N) losses during application cause emissions of greenhouse gases and air pollutants, water quality issues, and biodiversity loss. Furthermore, N balances frequently are negative, causing soil organic nitrogen (SON) mining, often accompanied by soil organic carbon volatilization and associated losses of agronomic and ecological soil functions. Low-emission slurry fertilization such as ground-level application has become obligatory in many countries, but such legal regulations as well as the individual decisions of farmers frequently are largely based on knowledge on ammonia losses only, but not on full N balances. Here, we provide a synthesis of data from experiments with 15N labelled organic fertilizers at 36 field plots, spanning a gradient of 1000 km from the Alps to Northern Germany. This approach allowed to assess effects of management intensity, climate change and different low emission application techniques on fertilizer N fates and full ecosystem N balances.

For intensive management with broadcast spreading of cattle slurry, on average almost half of the applied fertilizer N was lost to the atmosphere with a large contribution of dinitrogen emissions, while leaching of recent fertilizer N was negligible. Surprisingly, less than 10% of fertilizer N was taken up by plants, with the residual almost half of fertilizer N being stored in soil organic nitrogen. Nonetheless, grasslands were highly productive and largely met their N demand from mineralization of SON, which resulted in negative N balances and SON mining of on average 70 kg N ha-1 year-1 which increased with soil organic matter content, management intensity and experimentally induced climate change. Hence, a new paradigm for organic grassland fertilization is needed: the soil, not the plant is fertilized.

Both open slot slurry injection and traditional management with farmyard manure strongly reduced N losses compared to broadcast spreading of slurry, thereby leading to more closed N balances and counteracting N mining. However, slurry injection was more effective for acid soil rather than calcareous soil, where slurry acidification could be more promising to reduce N losses. Slurry dilution with water promoted infiltration, productivity and reduced N losses but avoided N mining only when N fertilizer amounts were maintained at the same level, which increases costs for farmers and the risk for soil compaction. In this context, slurry separation into liquid and solid phases is helpful.

In sum, we recommend either intensive grassland management with targeted low emission fertilization when productivity and fodder quality is prioritized, or extensive grassland management with grazing and fertilization with farmyard manure when soil organic matter formation and biodiversity is prioritized. Coexistence of these two diverging management approaches rather than applying medium management intensities is recommended to maximize both economical and ecological soil functions and ecosystem services at landscape scales.

How to cite: Dannenmann, M., Piatka, D., Floßmann, S., Ramm, E., Kepp, J., Han, J., and Kiese, R.: Towards more sustainable organic grassland fertilization – a synthesis based on full N balances, EGU General Assembly 2026, Vienna, Austria, 3–8 May 2026, EGU26-20471, https://doi.org/10.5194/egusphere-egu26-20471, 2026.

EGU26-21406 | ECS | Orals | BG3.23

Microbial processes controlling organic carbon storage along deep soil profiles 

Yacouba Zi, Louis Jeay, Noise Nunan, Abad Chabbi, and Cornelia Rumpel

Deep soil horizons represent a major but still poorly understood component of the soil carbon pool, despite their important contribution to long-term carbon storage and climate regulation. While carbon dynamics in topsoils have been extensively studied, much less is known about the mechanisms controlling carbon processing and stabilization at depth, particularly the role of microbial functioning and soil structure. This study investigated how microbial carbon use efficiency (CUE) varies with depth in a temporary agricultural grassland soil profile (10, 30 and 60 cm) under temperate conditions in Lusignan, France. Measurements were performed in both bulk soil and biostructures. Microbial CUE was estimated using two independent approaches (13C-based CUE and 18O–H₂O-based CUE), while microbial functional diversity was characterized using MicroResp and organic matter quality using Rock-Eval pyrolysis. Results showed contrasting depth-related patterns depending on the method used. 13C-based CUE increased with depth, with consistently higher values in biostructures than in bulk soil. In contrast, 18O-based CUE declined along the soil profile. Organic matter became progressively more stable and chemically mature with depth, while microbial communities shifted towards assemblages adapted to lower substrate availability and higher organic matter complexity. Variations in soil physical and chemical properties, organic matter quantity and quality, and microbial community structure therefore strongly depended on depth and the presence of biostructures, and jointly controlled microbial efficiency. These findings show that carbon storage in deep soil horizons depends strongly on microbial efficiency, soil structure and organic matter quality, and can be enhanced by management practices that increase carbon inputs and promote biostructure formation.

Keywords: Subsoil carbon storage, Deep soil horizons, Land management practices, Microbial communities

How to cite: Zi, Y., Jeay, L., Nunan, N., Chabbi, A., and Rumpel, C.: Microbial processes controlling organic carbon storage along deep soil profiles, EGU General Assembly 2026, Vienna, Austria, 3–8 May 2026, EGU26-21406, https://doi.org/10.5194/egusphere-egu26-21406, 2026.

EGU26-21994 | Posters on site | BG3.23

DeepHorizon: DEploying Ecosystemic solutions to imProve soil Health and uncOveRing subsoil functIons in the critical ZONe 

Mathieu Javaux, Alexandre Wadoux, Abad Chabbi, Marcello Di Bonito, Gloria Falsone, Sara Koenig, Hans-Joerg Vogel, Victor Burgeon, Anastasios Michaiidis, Ester Miglio, Francisco Jose Blanco Velasquez, and Luke Wardak

 DeepHorizon is a Horizon Europe Soil Mission project which aims to uncover hidden potential of European subsoils, an overlooked but vital component in soil functioning. Knowledge of subsoil dynamics, functions and degradation remains limited, and the pressure of unsustainable land management practices (LMPs) and climate change are increasing. To address this, DeepHorizon is leveraging multi-disciplinary collaborations across 19 international institutions to i) map subsoil properties, ii) identify sustainable subsoil management practices, and iii) develop and refine user-oriented tools to monitor and improve subsoil health.

The initial sampling campaign is underway, with 19 of our 40 sites sampled, which will be completed by the end of Autumn this year. Excavating a soil trench up to 2-meters provides comprehensive physical, chemical and biological data to capture subsoil properties including soil texture, pH, Carbon, Nitrogen and other nutrients, X-ray CT, hydraulics, root length density, fauna, microbiology and more. These data will contribute to a better representation of subsoils in existing databases and calibrate two process-based models to improve representation of subsoil functions.

These models will be validated across 100+ test sites and 3 regional case-study areas (CSA), then adapted to suit the needs of end-users through farmer- and manager-friendly tools. The project will also assess the socio-economic impact and environmental trade-offs of LMPs to generate policy recommendations and incentives to propose the sustainable management and restoration of European subsoil.

To ensure widespread impact, DeepHorizon engages land managers, researchers and policymakers through Community of Practice (CoP) and targeted outreach and communication activities. To facilitate the work planned on future test sites and case study areas, we are looking for constructive feedback, synergies, and collaborations that may be available across existing projects, institutions or individuals.

How to cite: Javaux, M., Wadoux, A., Chabbi, A., Di Bonito, M., Falsone, G., Koenig, S., Vogel, H.-J., Burgeon, V., Michaiidis, A., Miglio, E., Blanco Velasquez, F. J., and Wardak, L.: DeepHorizon: DEploying Ecosystemic solutions to imProve soil Health and uncOveRing subsoil functIons in the critical ZONe, EGU General Assembly 2026, Vienna, Austria, 3–8 May 2026, EGU26-21994, https://doi.org/10.5194/egusphere-egu26-21994, 2026.

EGU26-22428 | ECS | Posters on site | BG3.23

Afromontane Grassland Carbon Dynamics in a Changing World 

Anna Dam, Vincent Ralph Clark, Aud H. Halbritter, Kim L. Holzmann, Peter C. le Roux, Vigdis Vandvik, and Joseph Gaudard

Mountain grasslands play a crucial role in supporting biodiversity, grazing livestock, and regional water supply, while storing large amounts of carbon in their soils and vegetation. Grassland functioning is tightly coupled with climate and management practices, making these ecosystems highly vulnerable to global changes. The Afromontane grasslands of the Maloti-Drakensberg Mountains are among southern Africa’s most important ecological and hydrological systems, providing essential provisioning services. Despite their importance, surprisingly little is known about the impacts of global change drivers on carbon dynamics in these ecosystems. Filling this knowledge gap would improve our understanding of the extent of the Afromontane grasslands carbon sink, and help predict future carbon dynamics.

To address this gap, the NatuRA project has established a global change experiment in the Drakensberg Mountains focused on three global change drivers: warming, increased atmospheric nitrogen deposition, and changing grazing practices. The experiment spans an elevation gradient from 2000 to 3000 meters above sea level in a full factorial design made of a transplant treatment, nitrogen fertilization, and grazing manipulations. Measuring ecosystem carbon fluxes in this experimental design enables the assessment of how these drivers, individually and in interaction, affect key carbon-cycling processes.

Ecosystem carbon fluxes were measured using a closed-loop chamber system connected to an infrared gas analyzer. We measured net ecosystem exchange and ecosystem respiration, from which gross primary productivity was calculated. Pairing these results with treatment-specific microclimate data allows us to assess the amount of carbon captured by the ecosystem and evaluate how the carbon cycle responds to warming, fertilization, and grazing intensity. By revealing how multiple global change drivers interact to shape carbon dynamics in the Drakensberg Mountains, this study can provide critical evidence for predicting the future role of these ecosystems and for informing sustainable land management in a rapidly changing climate.

How to cite: Dam, A., Clark, V. R., Halbritter, A. H., Holzmann, K. L., le Roux, P. C., Vandvik, V., and Gaudard, J.: Afromontane Grassland Carbon Dynamics in a Changing World, EGU General Assembly 2026, Vienna, Austria, 3–8 May 2026, EGU26-22428, https://doi.org/10.5194/egusphere-egu26-22428, 2026.

EGU26-138 | ECS | Posters on site | BG3.25

Management practices to mitigate long-term soil organic carbon losses in arable soils of Bavaria 

David Schubert, Christopher Just, René Dechow, Lorenz Heigl, Konrad Offenberger, Michael Diepolder, Ingrid Kögel-Knabner, Florian Ebertseder, Axel Don, and Martin Wiesmeier

Over the past decades, soil organic carbon (SOC) in agricultural soils has shown a decreasing trend across Europe, reflecting the combined effects of management practices and climate change. Long-term field experiments offer a unique opportunity to study these effects and identify management strategies that can mitigate SOC losses under changing climatic conditions.

This contribution combines results from two long-term experiments located at the same site in Puch/Fürstenfeldbruck, Southern Germany: a compost amendment experiment (1994–2023) and a management comparison experiment (IOSDV, 1983–2021) with varying organic matter inputs and mineral nitrogen fertilization rates. Both experiments revealed a distinct SOC content decline, coinciding with a marked regional temperature rise and increased frequency of drought–rewetting cycles. Despite continuous or even increasing organic inputs, SOC contents declined in most cases, indicating climate-driven acceleration of SOC mineralization.

Across treatments, only management strategies combining multiple organic amendments (e.g., slurry, straw incorporation, and cover crops) or the application of compost can mitigate SOC loss to a certain extent. The results emphasize that improved management can buffer SOC losses and compensate enhanced decomposition processes under a warming climate.

The analysis of both long-term experiments highlights the necessity for improved agricultural management to mitigate SOC losses and maintain soil functionality in a rapidly changing climate.

How to cite: Schubert, D., Just, C., Dechow, R., Heigl, L., Offenberger, K., Diepolder, M., Kögel-Knabner, I., Ebertseder, F., Don, A., and Wiesmeier, M.: Management practices to mitigate long-term soil organic carbon losses in arable soils of Bavaria, EGU General Assembly 2026, Vienna, Austria, 3–8 May 2026, EGU26-138, https://doi.org/10.5194/egusphere-egu26-138, 2026.

EGU26-1724 | ECS | Posters on site | BG3.25

From Shoots and Roots: Ten Years of Warming and Elevated CO₂ Modify Plant Carbon Allocation and Lipid Chemistry in a Boreal Peatland 

Christène Vouillamoz, Erica Ceresa, Melanie A. Mayes, and Guido L. B. Wiesenberg

Ombrotrophic peatlands store a large fraction of global soil carbon, yet their long‑term response to climate warming and elevated atmospheric CO₂ remains uncertain, particularly regarding plant carbon allocation and biochemical inputs to peat. Experimental warming and CO₂ elevation can alter plant community composition, tissue chemistry and carbon partitioning, with potential feedbacks on peat accumulation and decomposition.

Previous work after 3 years of whole‑ecosystem warming and CO₂ elevation showed rapid shifts in carbon allocation and lipid composition in dominant bog plants. Ten years after the onset of these treatments, longer‑term acclimation, community changes and root responses may reinforce, dampen or qualitatively change these initial patterns. This study aims to assess how decadal warming and elevated CO₂ affect carbon partitioning and lipid composition in an ombrotrophic bog plant community, with an additional focus on roots as pathways of belowground carbon input.

The study is conducted on an ombotrophic peatland experiment (SPRUCE, Minnesota, USA), where whole ecosystems  have been exposed for ten years to a gradient of warming (+0, +2.25, +4.5, +6.75 and +9 ◦C), under ambient or elevated atmospheric CO₂ (+500ppm) concentrations in open-top chambers. Within each enclosure, representative samples of the dominant plant functional types (Sphagnum-dominated communities of mosses from hollows and hummocks, ericaceous shrubs Rhododendron groenlandicum and Chamaedaphne calyculata and trees Picea mariana and Larix laricina) were collected. For vascular plants, both aboveground tissues (leaves and branches) and belowground compartments (fine and coarse roots  retrieved from sieved peat) were collected. Bulk tissue analyses include carbon and nitrogen concentrations and stable carbon (δ13C) isotope composition to quantify treatment effects on carbon assimilation and partitioning among tissues. Lipids are extracted and separated into major classes such as n‑alkanes, n‑fatty acids, and n‑alcohols, which serve as biomarkers of plant functional types, membrane properties and potential stress responses.

Here, we show that long‑term warming enhanced allocation to shrubs and alter the elemental and lipid composition of both aboveground and belowground responses with species-specific differences, while elevated CO₂ did not show to alter lipid concentration or composition of plant tissues. In plant tissues, warming promoted shifts in lipid profiles towards more saturated and degradation‑resistant moieties and modified the relative abundance of lipid classes due to stress response and structural adaptation.

By combining new measurements with earlier data on the same plant community and soil profile, this work provides a decadal‑scale view of how warming and elevated CO₂ reshape plant carbon partitioning and molecular composition in an ombrotrophic bog. This will help constrain the trajectories of boreal peatland carbon cycling under global change.

How to cite: Vouillamoz, C., Ceresa, E., Mayes, M. A., and Wiesenberg, G. L. B.: From Shoots and Roots: Ten Years of Warming and Elevated CO₂ Modify Plant Carbon Allocation and Lipid Chemistry in a Boreal Peatland, EGU General Assembly 2026, Vienna, Austria, 3–8 May 2026, EGU26-1724, https://doi.org/10.5194/egusphere-egu26-1724, 2026.

EGU26-1725 | ECS | Posters on site | BG3.25

Incorporation and Turnover of Plant-Derived Polymers in a Warmed Peatland  

Erica Ceresa, Christène Vouillamoz, Melanie Mayes, and Guido Wiesenberg

Soils of boreal peatlands are among the largest terrestrial reservoir of organic carbon (C), yet their long-term response to warming remains uncertain, especially regarding C turnover and stabilization.

Located in a northern American boreal peatland, the SPRUCE (Spruce and Peatland Responses Under Changing Environments) site is a unique warming experiment, which is partially exposed for ten years to warming and elevated CO2 concentration. Here, we aim to assess how different temperature gradients (+0, +2.25, +4.5, +6.75, and +9°C) and CO2 addition (+500ppm above ambient) affected the quantity and quality of soil organic matter (SOM) in a 2 meter deep soil over a 10-year period. Our approach integrates lignin-derived phenol analysis with stable isotope (δ13C) measurements to disentangle C incorporation and decomposition in SOM at the molecular level.

Ten years of applied soil warming and elevated CO2 concentration have altered OM quality and quantity, with contrasting effects in topsoil and subsoil. Warming promoted plant-derived C loss through accelerated decomposition of labile C inputs. Although still unclear, the response to elevated CO2 shows a pattern of increased plant productivity and OM incorporation, which may partly offset C losses. Biomarkers and isotope analyses prove that SOM molecules undergo rapid turnover, demonstrating C instability in soils subject to warming in these vulnerable ecosystems.

How to cite: Ceresa, E., Vouillamoz, C., Mayes, M., and Wiesenberg, G.: Incorporation and Turnover of Plant-Derived Polymers in a Warmed Peatland , EGU General Assembly 2026, Vienna, Austria, 3–8 May 2026, EGU26-1725, https://doi.org/10.5194/egusphere-egu26-1725, 2026.

EGU26-1772 | ECS | Posters on site | BG3.25

Terrestrial ecosystem nitrogen cycling in response to field warming: Global patterns and future trends 

Xudong Wang, Chenrui Ni, Ziyi Fan, Joshua P. Schimel, Margaret S. Torn, and Biao Zhu*

Nitrogen cycling regulates ecosystem productivity and carbon sequestration in terrestrial ecosystems, yet its response to climate warming remains uncertain. Here, we compiled the most comprehensive dataset to date, synthesizing 7,991 observations from 417 field warming experiments worldwide and combining them with random forest regression and Community Land Model (CLM) simulations. Field warming significantly accelerated nitrogen cycling, increasing N₂O emissions (+24.7%), mineralization (+25.8%), nitrification (+51.7%), and denitrification (+41.1%). Soil inorganic nitrogen also increased, while plant nitrogen remained largely unchanged. Elevated natural abundance of ¹⁵N indicated that warming alleviates nitrogen limitation and promotes more open nitrogen cycles. Soil moisture, ecosystem type, and warming magnitude were key drivers. N₂O emission and nitrification further intensified with increased warming magnitude in random forest analyses. In contrast, CLM5-BGC simulated weak responses in N₂O emissions and nitrification and negative changes in nitrogen mineralization, substantially diverging from field observations. These discrepancies highlight the omission of microbial processes and the oversimplification of large-scale ecosystem feedbacks, respectively. Uniquely, this study provides the first direct comparison among empirical data, random forest regression, and CLM simulations, revealing discrepancies and their potential causes. Collectively, our findings provide robust evidence that terrestrial nitrogen cycling is more responsive to climate warming than previously recognized and underscore the importance of integrating multiple analytical approaches to synthesize cross-scale ecological data.

How to cite: Wang, X., Ni, C., Fan, Z., Schimel, J. P., Torn, M. S., and Zhu*, B.: Terrestrial ecosystem nitrogen cycling in response to field warming: Global patterns and future trends, EGU General Assembly 2026, Vienna, Austria, 3–8 May 2026, EGU26-1772, https://doi.org/10.5194/egusphere-egu26-1772, 2026.

Root exudation, the export of low-molecular weight organic carbon (C) compounds from living plant roots into soil, is an important biogeochemical process that links plant and soil C pools. Because changes in root exudation rate and root exudate composition can impact soil C dynamics over short timescales, understanding the response of root exudation to climate change is relevant for predicting future soil C stocks. However, the response of root exudation to climate change could vary depending on the plants in the ecosystem, the local environment, and the acting climate change driver(s). Here, I synthesize data collected from five whole-ecosystem climate change experiments in the United States. I show that warming drives strong but taxon-specific responses of root exudation rate and root exudate composition, and that the direction of this response varies depending on whether the soil or air is being warmed. Negative root exudation responses to soil warming suggest that enhanced soil nutrient mineralization under warming reduces exudate demand, whereas strong positive responses of exudation to air warming suggest that greater productivity increases exudate C supply. Furthermore, I show that elevated CO2 does not induce a consistent increase in root exudation across species and ecosystems, contrary to predicted responses based on source-sink dynamics. I provide evidence that null or negative CO2 effects on root exudation may be due to trade-offs with C allocation to mycorrhizal fungi. Using artificial root exudate experiments, I show that the effects of climate change on exudation rates are likely to interact with climate change-induced shifts in soil microbial community composition to regulate soil C dynamics. I suggest that increases in root exudation due to warming are likely to induce soil C losses which may be partially offset by changes to the soil microbial community, while elevated CO2 effects on root exudation are more likely to scale with root biomass responses.

How to cite: Chari, N.: How will root exudation respond to climate change across plant species and ecosystems?, EGU General Assembly 2026, Vienna, Austria, 3–8 May 2026, EGU26-2454, https://doi.org/10.5194/egusphere-egu26-2454, 2026.

Temperature is a major regulator of soil biogeochemistry, exerting a strong control over microbial growth and respiration, two core processes governing soil organic carbon (SOC) cycling. However, existing temperature dependence models fail to jointly describe growth and respiration, are inaccurate across the full biokinetic range, or require complex parameterisations, limiting their applicability and predictive power.

To overcome these limitations, we developed the Dual-Kinetics Ratkowsky model (Ratkowsky DK), a parsimonious framework that can simultaneously describe temperature dependences for microbial growth and respiration. Compared to established models, Ratkowsky DK shows superior performance and parsimony across soils spanning a broad climatic gradient. Despite its empirical formulation, the model provides robust estimates of microbial thermal traits and climate responsiveness, capturing warm- and cold-shifted adaptations, and offers a biologically meaningful interpretation of temperature-driven decoupling between anabolism and catabolism.

Temperature dependence models were then used to investigate the effects of warming (+5°C for 9 years) on CO2 emissions and SOC stocks. Direct temperature effects initially increased emissions and projected substantial SOC losses, but the progressive optimisation of microbial thermal traits enhanced carbon use efficiency and reduced emissions over time, halving the projected SOC loss and closely matching observations. These findings indicate that microbial thermal trait optimisation can provide a parsimonious explanation for heat-induced carbon losses worldwide, highlighting the importance of integrating microbial dynamics into models.

How to cite: Brangarí, A. C.: From microbial temperature kinetics to soil carbon stocks under warming, EGU General Assembly 2026, Vienna, Austria, 3–8 May 2026, EGU26-3778, https://doi.org/10.5194/egusphere-egu26-3778, 2026.

The stability of soil organic carbon (SOC) governs the carbon resistance to decomposition. Thereby, its response to warming is a key determinant of SOC dynamics under warming. However, SOC stability is an ecosystem property regulated by complex mechanisms, which complicates its quantification. Recent insights suggest that SOC stabilization mechanisms collectively contribute to microbial energy limitation. Accordingly, the bioenergetic perspective provides promising approaches for quantifying SOC stability under warming. Here, based on an 8-year whole-soil warming experiment in an alpine meadow on the Tibetan Plateau, we assess warming (+4℃) effects on the bioenergetic signature of SOC across depth (0-100 cm). We find that the activation energy (Ea, representing potential microbial energy investment) increases with depth, whereas the energy density (Ed,representing potential microbial energy gain) declines. This depth-dependent pattern implies that greater energy limitation may contribute to higher SOC stability in subsoil than in topsoil. Moreover, we find that whole-soil warming decreases Ea across depth while has no significant effect on Ed. The reduction of Ea suggests that warming may lower the energy barrier of decomposition reactions. Overall, our results demonstrate that warming will alleviate microbial energy limitation and thereby may threaten SOC storage.

How to cite: Wu, W. and Zhu, B.: The effect of whole-soil warming on the bioenergetic signature of soil organic carbon, EGU General Assembly 2026, Vienna, Austria, 3–8 May 2026, EGU26-4315, https://doi.org/10.5194/egusphere-egu26-4315, 2026.

Dissolved organic matter (DOM) represents one of the most dynamic organic carbon pools in soils, and its molecular composition ultimately governs carbon mobilization, transformation, and stabilization. However, the profound differentiation in both quantity and quality of DOM across the entire soil profile under long-term warming remains poorly resolved. Therefore, this study conducted an eight-year whole-soil warming experiment (+4 °C) in the alpine grasslands of the Tibet Plateau to investigate the response of DOM molecular composition to warming across four soil layers: 0–10 cm (surface), 10–30 cm (shallow), 30–60 cm (middle), and 60–100 cm (deep). Overall, warming significantly increased DOM concentrations in surface soil, whilst DOM in shallow, middle and deep soil layers showed only marginal increases that did not reach statistical significance. In contrast, warming drives the reconfiguration of DOM composition across the entire profile, primarily concentrated in molecules such as CHO, CHON, CHOS, and CHONP, exhibiting pronounced depth dependence. Concurrently, the relative intensity of aromatic and highly unsaturated compounds in the surface and shallow soils was lower under warming treatment compared to the control, whereas the aliphatic and peptide compounds exhibited the opposite trend. This finding indicates that warming induces a shift in DOM composition from relatively humic towards one dominated by aliphatic/nitrogen-rich components. Furthermore, the relative intensities of carboxyl-rich aliphatic molecules (more recalcitrant DOM fraction) in middle and deep soils significantly increased under warming conditions. Collectively, these results demonstrate that long-term whole-soil warming reshapes the DOM composition through depth-specific pathways, underscoring that deep-soil DOM can respond fundamentally differently from topsoil.

How to cite: Chen, G. and Zhu, B.: Long-term whole-soil warming restructures the molecular composition of soil dissolved organic matter, EGU General Assembly 2026, Vienna, Austria, 3–8 May 2026, EGU26-4317, https://doi.org/10.5194/egusphere-egu26-4317, 2026.

EGU26-4400 | ECS | Posters on site | BG3.25

Diverging patterns at urban-rural forest grandients:biological nitrogen fixation responses to N addition 

Xiao Tao, Ruoxian Fu, and Biao Zhu

The process of rapid urbanization is a global phenomenon that exposes the natural landscape to high levels of nitrogen (N) deposition, leading to serious ecological consequences. How does soil biological nitrogen fixation (BNF), a crucial process for replenishing nitrogen in terrestrial ecosystems, respond to urban expansion and consequent N deposition? To address this, we established a transect from the city center to the countryside to capture the urban–rural gradient. Permanent sites were set up along the gradient to encompass urban, suburban, and remote rural forests. A 5-year large-scale field experiment of N addition was conducted to simulate N deposition, aiming to investigate the impact of N deposition on soil BNF along this urban-rural gradient. We found that soil BNF activity was drastically reduced (dropped by 94.2% to 96.5%) in both urban and suburban forests compared with the rural forest without additional N application. Nitrogen addition treatments had no effect on BNF activity in the urban forest, but significantly decreased BNF activity in the rural forest by over 50% with low N addition. Further analysis revealed that reductions in BNF activity were associated with changes in the composition of diazotrophic communities, favoring facultative diazotrophs that are detrimental to soil BNF. Soil acidification was primarily responsible for limiting soil BNF and associated microbes in the urban forest. Overall, our findings indicate that external N inputs primarily pose a threat to soil diazotrophic communities and their N fixation capacity in rural forests, whereas this adverse effect is not persisted in urban forests, thereby improving our understanding of soil behavior and biogeochemical cycles in forest landscapes.

How to cite: Tao, X., Fu, R., and Zhu, B.: Diverging patterns at urban-rural forest grandients:biological nitrogen fixation responses to N addition, EGU General Assembly 2026, Vienna, Austria, 3–8 May 2026, EGU26-4400, https://doi.org/10.5194/egusphere-egu26-4400, 2026.

EGU26-5524 | ECS | Orals | BG3.25

Tundra Root Responses to Environmental Change - A Meta-Analysis 

Jiahui Lin, Kimberly Montañez, and Wenxin Zhang

Arctic tundra ecosystems are experiencing rapid climatic change, including accelerated warming, altered soil moisture regimes, and widespread permafrost thaw, with potentially strong feedbacks to high-latitude carbon and nutrient cycling. In these ecosystems, a disproportionately large proportion of plant biomass is allocated belowground, making roots as a key player in plant-soil interactions and ecosystem processes in Arctic tundra. Therefore, it is necessary to understand how tundra roots respond to environmental changes and their implications of terrestrial climate-cycle feedback. However, despite their importance, tundra root responses to environmental change remain poorly studied, and existing experimental evidence vary across study sites, conditions and focuses.

In this study, we integrated experimental evidence of root response to environmental changes from 34 studies across the pan-Arctic region, using a comprehensive framework that combines component network meta-analysis, meta-regression, and non-linear models. Across the studies, we collected 14 root traits and investigated their responses to 6 different types of treatments and 8 environmental moderators, respectively.

Warming treatments generally showed modest and insignificant effects on most root traits. However, meta-regression analyses revealed pronounced temperature-driven shifts toward thinner yet longer-lived roots, effects that are frequently obscured by concurrent soil drying in warming experiments. Nutrient addition triggered the strongest belowground responses, where we found an unexpectedly key role of phosphorus and co-limitation of multiple elements. Significant differences in root responses among plant functional types and mycorrhizal strategies further indicate species-specific belowground adaptation pathways. Temporal analyses indicate that environmental changes produce gradual but cumulative effects on root morphology, whereas root chemical traits tend to stabilize following an initial rapid response. Across soil temperature, moisture, nutrient inputs, and active layer depth, we identified widespread non-linear and threshold-dependent responses that were not captured by conventional linear regression approaches.

In summary, our study demonstrates that tundra belowground responses are driven by interacting climatic, hydrological, and nutrient factors, and are further shaped by species-specific strategies and temporal dynamics. We highlight the need to incorporate non-monotonic root responses, multi-element nutrient constraints, species-specific strategies, and temporal patterns into Arctic ecosystem models to improve predictions of climate-carbon feedbacks.

How to cite: Lin, J., Montañez, K., and Zhang, W.: Tundra Root Responses to Environmental Change - A Meta-Analysis, EGU General Assembly 2026, Vienna, Austria, 3–8 May 2026, EGU26-5524, https://doi.org/10.5194/egusphere-egu26-5524, 2026.

EGU26-7296 | ECS | Posters on site | BG3.25

Differential effects of fine root- and mycelium-derived carbon on soil organic carbon in response to warming in an alpine meadow 

Long Chen, Xiaoxiang Zhao, Qiuxiang Tian, Yan Yang, Qinghu Jiang, Carsten W. Müller, and Feng Liu

Plant carbon (C) inputs through fine roots and extramatrical mycelia (EMM) play a crucial role in driving soil organic C (SOC) pools. However, few studies have explored the distinct roles of fine roots and EMM on SOC accumulation, how these inputs drive the priming effect (PE) on native SOC decomposition, and how warming affects these processes in climate-sensitive alpine meadow ecosystems. In this study, we placed ingrowth cores with different mesh sizes (2 mm, 48 μm, and 1 μm) containing C4 soil in the field to quantify fine root- and EMMderived C into particulate organic carbon (POC) and mineral-associated organic carbon (MAOC) and their impact on the decomposition of native SOC in an alpine meadow in the hinterland of Qinghai-Tibet Plateau for 3 years under experimental warming (~2.4 ℃). The results showed that fine roots promote SOC accumulation, particularly as MAOC. In general, newly sequestered C derived from fine roots exceeded the loss of native C via PE induced by fine root C input. In contrast, EMM had no effect on SOC as EMM-derived C inputs were counterbalanced by native C decomposition induced by EMM. Additionally, fine root-derived new SOC and new MAOC were significantly higher than that derived from EMM, while the PE induced by fine roots and EMM showed no significant difference. These findings suggested that warming (~2.4 ℃) had no detectable effect on SOC pool, new SOC inputs, and the PE on native SOC decomposition. However, warming mitigated the loss of native POC induced by either EMM or fine roots. In summary, fine roots play a leading role in SOC accumulation and warming (~2.4 ℃) has minor effects on SOC dynamics in the alpine meadows.

How to cite: Chen, L., Zhao, X., Tian, Q., Yang, Y., Jiang, Q., Müller, C. W., and Liu, F.: Differential effects of fine root- and mycelium-derived carbon on soil organic carbon in response to warming in an alpine meadow, EGU General Assembly 2026, Vienna, Austria, 3–8 May 2026, EGU26-7296, https://doi.org/10.5194/egusphere-egu26-7296, 2026.

EGU26-8277 | ECS | Posters on site | BG3.25

Mineralogical Proxies Constrain Turnover and Warming Responses at Regional Scale 

Moritz Mainka, Marijn Van de Broek, Daniel Wasner, Erick Zagal Venegas, and Sebastian Doetterl

Modeling future soil organic carbon (SOC) dynamics is subject to significant uncertainty due to oversimplified representations of our mechanistic knowledge on C cycling across pedogenetically distinct soil types. To address this issue, we investigated how different calibration strategies affect modeled SOC stocks and turnover times across a pedo-climatic soil gradient in Chile. First, we performed a calibration for each site to obtain site-specific parameters and to derive empirical relationships between mineral associated organic carbon (MAOC)-related model parameters and soil mineralogical properties. Second, we performed a multi-site calibration testing (i) different site-selection strategies and (ii) the use of model parameters calculated based on the obtained relationships with mineralogical properties. Finally, we simulated an intermediate CMIP6-warming scenario (SSP2-4.5) to quantify relative changes in SOC stocks and how they related to the simulation using site-specific parameter sets. Our results show that considering soil heterogeneity through relating soil mineralogical properties to model parameters is a promising way to tackle the common oversimplification of soil landscapes in current modelling frameworks. Multi-site calibrations disregarding established empirical relationships failed to reproduce overall SOC stocks and MAOC turnover times regardless of calibration site selection. Capturing heterogeneity of MAOC turnover times was key to reflect the response of SOC to warming. We conclude that the relation to climatic and soil mineralogical properties and pedogenetic modification of MAOC turnover time, is crucial to improve the simulation of SOC stocks and its future responses to warming at larger scales.

How to cite: Mainka, M., Van de Broek, M., Wasner, D., Zagal Venegas, E., and Doetterl, S.: Mineralogical Proxies Constrain Turnover and Warming Responses at Regional Scale, EGU General Assembly 2026, Vienna, Austria, 3–8 May 2026, EGU26-8277, https://doi.org/10.5194/egusphere-egu26-8277, 2026.

EGU26-9844 | ECS | Orals | BG3.25

Soil organic carbon dynamics along alpine greening gradients on different bedrock 

Annegret Udke, Kyra Marty, Cédric Bührer, Luisa Minich, Michael Zehnder, Marco Griepentog, Sebastian Doetterl, Negar Hagipour, Timothy Eglinton, Christian Rixen, Markus Egli, and Frank Hagedorn

Alpine greening due to climate warming represents a major environmental change in mountain ecosystems, generally assumed to increase soil organic carbon (SOC) storage due to higher C inputs. However, data on SOC dynamics in high elevation soils remain scarce. In this study, we investigated SOC stocks, radiocarbon (14C)-based turnover rates, and mineral C saturation (reflected by the ratio of SOC to pedogenic oxides, PO) along three alpine elevation gradients from (sub)alpine forests to the periglacial zone on different bedrock types. SOC stocks showed pronounced declines from ~10 to 1 kg C m-2 across the transition from alpine grasslands (2000 – 2750 m a.s.l.) to the nival zone (2850 – 3100 m a.s.l.), accompanied by a decrease of 14C-based turnover rates from decades to millennia. Underlying bedrock significantly influenced SOC stocks, with dolomitic soils storing 50% less C than siliceous soils probably due to slower weathering and reduced SOC stabilisation. Soils in the sparsely and non-vegetated periglacial zone showed low SOC:PO ratios, indicating a high capacity to stabilize new incoming C while alpine grassland and forest soils at lower elevation exhibited high SOC:PO ratios and limited additional storage capacity. Below the vegetation line, SOC stocks in alpine grasslands exhibited only minor variation with decreasing elevation, while 14C-derived turnover rates increased. This apparent decoupling suggests that greater plant-derived C inputs under warmer conditions are counterbalanced by enhanced microbial decomposition, thereby limiting long-term SOC accumulation. Overall, these results indicate that SOC sequestration under alpine greening will be limited to a small area around the current vegetation line, with parent material influencing the magnitude of C uptake. Our study provides critical baseline data for predicting carbon cycling and sequestration potential in alpine soils under ongoing environmental change.

How to cite: Udke, A., Marty, K., Bührer, C., Minich, L., Zehnder, M., Griepentog, M., Doetterl, S., Hagipour, N., Eglinton, T., Rixen, C., Egli, M., and Hagedorn, F.: Soil organic carbon dynamics along alpine greening gradients on different bedrock, EGU General Assembly 2026, Vienna, Austria, 3–8 May 2026, EGU26-9844, https://doi.org/10.5194/egusphere-egu26-9844, 2026.

EGU26-10962 | ECS | Orals | BG3.25

How do plant and soil microbial diversity respond differently to climate change? 

Yujiang Li, Junpeng Rui, Yanhao Feng, Bernhard Schmid, and Jin-Sheng He

Diverse plants live in association with an immense diversity of soil microorganisms (e.g., bacteria, fungi) that sustain the functioning and health of natural ecosystems. These biodiversity components are threatened by anthropogenic climate change. Plants and soil microorganisms differ fundamentally in life form and in how they perceive environmental change, making uniform diversity responses to climate change unlikely. However, disciplinary isolation has limited direct comparisons of their responses, and most climate-change experiments focus on either plants or soil microorganisms alone, or rely on short-term or snapshot observations. This makes it impossible to determine trends in their collective responses over the longer term, which hampers our understanding of the dynamics of plant–soil systems under climate change. Here, we report results from a long-term (2011–present) experiment conducted in an alpine meadow on the Tibetan Plateau. The experiment employs a full-factorial manipulation of warming (+2 °C) and precipitation (−50% and +50%). Using a species gain–loss perspective, we reveal how coexisting plants and soil microorganisms unfold divergent diversity trajectories through distinct species turnover in response to simultaneous climate-change variables. These findings contribute to a general understanding of biodiversity responses to climate change across ecosystems and biological groups. We further discuss the broader implications of these divergent responses for ecosystem functioning and stability under ongoing global change.

How to cite: Li, Y., Rui, J., Feng, Y., Schmid, B., and He, J.-S.: How do plant and soil microbial diversity respond differently to climate change?, EGU General Assembly 2026, Vienna, Austria, 3–8 May 2026, EGU26-10962, https://doi.org/10.5194/egusphere-egu26-10962, 2026.

EGU26-11273 | Posters on site | BG3.25

Automating Dynamic Root Measurements to Understand Soil and Ecosystem GHG Fluxes 

Richard Nair, Ryan Brennan, Phoebe Dibben-Dean, Asrit Ganti, Ian Palk, and Jason Schevelier

Root dynamics are difficult to measure at biogeochemical-relevant scales of space and time and the source of many uncertainties in models and scaling.

Because roots grow, respire, host mycorrhizal fungi, produce exudates and eventually turn over, they drive carbon exchanges with both the soil and atmosphere which are just as critical, but more complex, than leaf-level exchanges. But because roots are hard to measure, their temporal dynamics are often ignored or assumed to be coupled to leaves (e.g. root seasonal cycles align with leaf phenology). This paradigm dominates design of field experiments, and vegetation components of climate models assume a simple parameterisation based on broadly untested assumptions.

In contrast, when root dynamics are studied directly, there is ample evidence that roots and leaves are rarely in sync and respond differently to environmental conditions. Triggers and limits to root dynamics are poorly understood. Roots and their partner organisms may grow, function, and turn over coupled, uncoupled or offset from leaves or greenhouse fluxes, as plant resource allocation shifts due to both environmental and physiological constraints.

We are implementing custom automated minirhizotron (‘root camera’) systems across a network of eddy covariance sites to make measurements of root dynamics and phenology directly. Building on previous work, where we measured root dynamics with these systems at unprecedented time frequency, we are now linking these dynamics to measured greenhouse gas fluxes from eddy covariance systems and soil respiration autochambers. But making indirect and image-based measurements belowground is challenging – many aspects of minirhizotron systems are not optimised for high frequency measurements and timeseries data 

Here I will show both some of the results from these systems, and some of the advances in the design and implementation of field root imaging which we are making to improve understanding of this critical component of ecosystems at scales from seasonal to sub-daily.

How to cite: Nair, R., Brennan, R., Dibben-Dean, P., Ganti, A., Palk, I., and Schevelier, J.: Automating Dynamic Root Measurements to Understand Soil and Ecosystem GHG Fluxes, EGU General Assembly 2026, Vienna, Austria, 3–8 May 2026, EGU26-11273, https://doi.org/10.5194/egusphere-egu26-11273, 2026.

EGU26-11785 | Orals | BG3.25

Drought soil legacies and grassland responses to subsequent drought 

Michael Bahn, Natalie Oram, Jesse Radolinski, Marie-Louise Schärer, and Maud Tissink

Droughts are affecting ecosystems worldwide and are expected to become increasingly frequent and intense in the near future. While the detrimental impacts of droughts on terrestrial ecosystems are well documented, it is largely unknown whether and how drought effects on soils can alter ecosystem responses to subsequent drought. We will present several case studies which demonstrate that drought effects on soil microbial communities not only affect soil functioning in response to recurrent drought, but can also have legacy effects on grassland productivity and how it is affected by subsequent drought. Furthermore, we will showcase recent advances in testing for drought legacy effects on soil properties related to plant water availability, highlighting that scenarios of frequent and more intense drought can lead to reduced plant water access even following rain events and during subsequent dry periods. Our findings suggest that drought soil legacies induced by repeated and / or severe drought can have major implications for the functioning of grassland ecosystems and their response to subsequent drought.

How to cite: Bahn, M., Oram, N., Radolinski, J., Schärer, M.-L., and Tissink, M.: Drought soil legacies and grassland responses to subsequent drought, EGU General Assembly 2026, Vienna, Austria, 3–8 May 2026, EGU26-11785, https://doi.org/10.5194/egusphere-egu26-11785, 2026.

EGU26-12636 | ECS | Posters on site | BG3.25

Heterotrophic respiration and microbial functional diversity in a conventional cropland in Hungary 

Ilham Nahal, Katalin Posta, Giulia De Luca, Szilvia Foti, and Janos Balogh

Soil respiration is one of the main carbon fluxes and is controlled by the activity of the heterotrophic microorganisms, in addition to environmental factors, and has a significant influence on soil carbon cycling. This study aimed to examine the temporal patterns of soil respiration under field conditions, especially regarding heterotrophic respiration (Rh), its contribution to soil CO₂ efflux, and its relationship to the microbial functional diversity in a conventionally managed cropland in Hungary. Field measurements were performed in soil-installed tubes (40 cm depth, 16 cm diameter, root exclusion) for measuring Rh  and total soil respiration (Rs) was also measured under natural field conditions during the vegetation period. Soil CO₂ fluxes were measured in the field by an automatic soil respiration system under various environmental conditions. Soil temperature and soil moisture were measured in close conjunction, and data processing was carried out along with statistical analyses using R. During the study period in 2025, we took soil samples and microbial functional activity was measured using the Biolog EcoPlates™ technique in order to gain further insights into carbon substrate utilization by the microorganisms.

Average Rs was 2.77 µmol CO₂ m⁻² s⁻¹, while average Rh amounted to 1.22 µmol CO₂ m⁻² s⁻¹. The contribution of heterotrophic respiration to total soil respiration (Rh/Rs) ranged from 0.16 to 1 depending on the phenological phase.

How to cite: Nahal, I., Posta, K., De Luca, G., Foti, S., and Balogh, J.: Heterotrophic respiration and microbial functional diversity in a conventional cropland in Hungary, EGU General Assembly 2026, Vienna, Austria, 3–8 May 2026, EGU26-12636, https://doi.org/10.5194/egusphere-egu26-12636, 2026.

EGU26-12702 | ECS | Posters on site | BG3.25

Soil microbial communities' compositional and functional response to climate change and different three species 

Giulia Burini, Anita C. Risch, Barbara Moser, Irene Cordero, Sophie Gombeer, and Mark A. Anthony

Microbial communities and their functionality are affected by climate change, which consequently impacts the functionality of soil biogeochemical cycles and in turn the persistence of individual tree species. Despite their importance for forest ecosystems, few studies have investigated the impacts of multiple, concurrent elements of climate change on microbial communities under tree species with contrasting drought tolerance and different biogeographic origins.

In our study, we investigated how soil microbial communities of different native and non-native tree species responded to warming and warming associated with drought. The experiment was located in Switzerland and included three forest sites with different climatic and environmental characteristics where temperature and precipitation have been manipulated since 2022. Soil microbial communities were assessed using DNA metabarcoding, and extracellular enzyme activities were assessed alongside environmental variables and soil nutrient availability.

Preliminary results showed that strong differences across sites shape microbial community composition and modulate their responses to the experimental climate treatments. The strongest effects of climate manipulations were found at the warmest and driest site. Soil microbial community composition responses to the different climate change treatments further among the tree species. In addition to microbial community composition, microbial functioning, as assessed via enzymatic activities, also differed across sites and generally decreased with the climate treatments, suggesting that biogeochemical cycles are likely to change in the future.

Our research aimed to clarify the possible consequences of warming and drought on forest microbiomes and consequently soil biogeochemical cycles under global change. This will support the development of climate change mitigation strategies to maintain forest ecosystem functionality and to choose future tree species able to resist climatic stresses.

How to cite: Burini, G., Risch, A. C., Moser, B., Cordero, I., Gombeer, S., and Anthony, M. A.: Soil microbial communities' compositional and functional response to climate change and different three species, EGU General Assembly 2026, Vienna, Austria, 3–8 May 2026, EGU26-12702, https://doi.org/10.5194/egusphere-egu26-12702, 2026.

Predicting how soil microbial communities respond to drought is a major challenge in terrestrial ecology, especially in heterogeneous landscapes where soils differ in texture, nutrient status, and climatic history. In this study, we combined a controlled laboratory incubation with a coordinated field drought experiment to explore whether background site characteristics and laboratory moisture–response curves can help anticipate ecosystem responses to reduced precipitation. We collected soils from six grassland sites across Italy spanning a broad gradient of pedoclimatic conditions and characterised their microbial and nutrient dynamics under varying levels of water availability.

In the laboratory, soils were incubated at five water-holding capacity (WHC) levels (10–80%) to establish moisture–response functions for a suite of microbial processes. We quantified microbial respiration, microbial biomass C, N and P, microbial growth via ¹⁸O-DNA incorporation, dissolved organic and inorganic nutrients (including dissolved P), and the activities of eight extracellular enzymes involved in C-, N- and P-cycling. These datasets provided site-specific profiles of microbial sensitivity and functional potential across a moisture gradient.

To assess whether these laboratory-derived patterns align with field drought behaviour, an in-situ rain-exclusion experiment was carried out in each grassland, imposing a 2.5-month drought during the plant growing season. The same microbial and nutrient variables were measured in the field following drought, enabling a comparison between controlled moisture–response curves and in situ functional responses.

Although data analysis is ongoing, preliminary results point to systematic links between background soil properties, laboratory moisture sensitivity, and field drought outcomes. Relationships appear to be process-dependent, suggesting that some microbial functions may be more predictable from laboratory assays and site characteristics than others. By integrating both laboratory and field manipulations, this work aims to develop a mechanistic and empirically grounded framework for assessing drought impacts on soil microbial communities.

How to cite: Canarini, A. and the EcoMEMO team: Exploring drivers of microbial drought sensitivity through combined laboratory and field approaches, EGU General Assembly 2026, Vienna, Austria, 3–8 May 2026, EGU26-12830, https://doi.org/10.5194/egusphere-egu26-12830, 2026.

EGU26-13819 | Orals | BG3.25

Mycorrhizal fungal symbionts shape plant growth responses to experimental warming and drought 

Mark Anthony, Artin Zarsav, Giorgia Cantini, Philipp Spiegel, and Arthur Gessler

Climate change is creating locally novel environments for microbial symbioses in forests. Whether fungal symbionts can sustain tree growth under rapid warming and increasing drought has consequences for biodiversity, forestry, and global carbon (C) storage. A key way fungal partners may buffer trees is through extensive extraradical mycelium networks that enhance uptake of growth-limiting nutrients and water. Yet the role of these networks in shaping plant responses to climate stress has rarely been tested in the field, especially for ectomycorrhizal fungi (EMF), the dominant mycorrhizal type in European forests.

We tested how two dominant European trees (Fagus sylvatica and Pinus sylvestris) respond to simulated warming and drought, alone and combined, in relation to experimentally manipulated EMF mycelium networks. We established the Swiss Climate Change × Mycorrhizae experiment in summer 2023 across four long-term forest monitoring plots spanning large environmental gradients. Within this experiment, we focused on EMF shared by both hosts and used nylon meshes to restrict rhizomorph formation, specialized mycelium enabling long-distance resource transport. After two years of seedling growth, we destructively sampled 572 seedlings and quantified above- and belowground processes.

Drought reduced host growth more than warming, with P. sylvestris more sensitive than F. sylvatica. Foliar C isotope signatures corroborated this pattern, with increased δ13C values, reflecting reduced discrimination in primary carboxylation under drought. Allowing EMF to form rhizomorphs and extensive extraradical networks mitigated drought impacts on hosts by 10-25%. EMF communities were themselves drought-sensitive, showing lower biomass and respiration and respiring CO2 that was less 13C-depleted. EMF growth was positively correlated with plant growth, indicating tight coupling and shared sensitivity to drought.

These aboveground effects extended belowground to carbon cycling. Where EMF networks were present, soil C storage declined relative to treatments limiting network formation, likely due to accelerated decomposition inferred from soil organic C isotopes.

Overall, we provide field experimental evidence that EMF mycelium networks help trees cope with climate stress, and that the magnitude of this “myco-support” tracks shifts in EMF growth and respiration. This is important because it demonstrates that fungal symbionts will play important roles in shaping future forest tree responses to climate change. However, this benefit may trade off against soil organic C storage, with implications for future forest carbon budgets.

How to cite: Anthony, M., Zarsav, A., Cantini, G., Spiegel, P., and Gessler, A.: Mycorrhizal fungal symbionts shape plant growth responses to experimental warming and drought, EGU General Assembly 2026, Vienna, Austria, 3–8 May 2026, EGU26-13819, https://doi.org/10.5194/egusphere-egu26-13819, 2026.

EGU26-15185 | ECS | Posters on site | BG3.25

Enhanced Methane Uptake under Light Conditions in an Alpine Tundra Ecosystem 

Lyreshka Castro Morales, Kelsey McGuire, Graeme Morey, Anna Virkkala, and McKenzie Kuhn

Alpine tundra ecosystems are widely regarded as small but persistent sinks of atmospheric methane (CH₄), yet it remains unclear how ongoing climate-driven shifts in vegetation composition and productivity will alter CH₄ exchange. As a result, predicting whether the alpine tundra will act as a CH₄ sink or source in the future requires an understanding of the governing mechanisms and links between vegetation CH₄ production and consumption. To address this gap, we explored the drivers and magnitude of CH₄ and carbon dioxide (CO₂) fluxes across fine scale alpine tundra vegetation gradients in Kaska First Nations Ancestral territory, now known as northern British Columbia. Using a systematic grid approach, we measured fluxes and environmental parameters from 100 plots over a 3-day period during peak growing season. Our design captured dominant vegetation types and key transition zones of microclimatic gradients across a south facing alpine slope. We found that CH₄ uptake was greater under light vs dark chamber conditions across most plant functional types, suggesting a link between photosynthesis and CH₄ uptake. Our light-only chamber condition statistical model further indicated that CH₄ uptake covaries most strongly with net ecosystem exchange, soil temperature, and nutrient availability (Cu, P, and total N). Together, these results suggest that climate-driven changes in vegetation structure and productivity may alter CH₄ uptake strength in alpine tundra ecosystems, underscoring the importance of resolving plant-soil processes for predicting future CH₄ dynamics.

How to cite: Castro Morales, L., McGuire, K., Morey, G., Virkkala, A., and Kuhn, M.: Enhanced Methane Uptake under Light Conditions in an Alpine Tundra Ecosystem, EGU General Assembly 2026, Vienna, Austria, 3–8 May 2026, EGU26-15185, https://doi.org/10.5194/egusphere-egu26-15185, 2026.

EGU26-15470 | Posters on site | BG3.25

Tree species richness reduces soil carbon loss via suppressed priming effects 

Yanghui He and Xuhui Zhou

Global biodiversity manipulative experiments report positive effects of plant diversity on ecosystem productivity. Yet, there is lower confidence in predicting a positive plant diversity effect on soil carbon (C) sequestration, largely due to limited understanding of how the decomposition of native soil C responds to diversity-promoted fresh C inputs, the so-called priming effect. Combining a large-scale biodiversity manipulative experiment with stable isotope (13C-glucose) labeling, we found that the priming effect decreased with increasing tree species richness. This reduction was characterized by decreased positive priming (i.e., stimulating native soil organic C decomposition) alongside enhanced negative priming. The variation in the priming effect with increasing tree diversity was associated with increased soil phosphorus availability, enhanced C stability (characterized by physical protection and chemical recalcitrance) and improved microbial network complexity. Our findings reveal a novel mechanism by which tree species diversity promotes soil C storage through dampening microbial decomposition triggered by fresh C inputs. This suppression of the priming effect suggests that diverse forests are better able to stabilize soil organic matter, highlighting the potential of biodiversity-based afforestation strategies to strengthen nature-based climate solutions.

How to cite: He, Y. and Zhou, X.: Tree species richness reduces soil carbon loss via suppressed priming effects, EGU General Assembly 2026, Vienna, Austria, 3–8 May 2026, EGU26-15470, https://doi.org/10.5194/egusphere-egu26-15470, 2026.

Rhizospheric C, N, and P stoichiometry embodies the dynamic equilibrium between nutrient release through mineralization and the retention of elements during organic matter turnover. Yet, global quantitative assessments of how rhizospheric processes reshape soil and microbial elemental ratios across agricultural ecosystems remain scarce. To address this, we conducted a synthesis of 1,683 data points collected from 122 peer-reviewed studies worldwide. The meta-analysis revealed that rhizospheric processes significantly increased soil C:N, C:P, and N:P ratios by 5.1%, 5.9%, and 3.4%, respectively, relative to bulk soil. In contrast, microbial biomass C:P and N:P ratios decreased by 15.1% and 12.4% under rhizospheric conditions. Importantly, no significant overall effect of the rhizosphere was detected for microbial biomass C:N ratios. The enhancement of soil C:N ratio was most evident under humid climates and mildly acidic soils (pH 5.5–6.5). Conversely, reductions in microbial biomass C:N ratios were less apparent in humid environments with higher ammonium-N availability. Vegetable systems and the rapid growth phase of crops enhanced rhizospheric soil C:N by approximately 8.8% and 4.3%, respectively, whereas microbial C:N declined by 23.3% and 6.3%. Additionally, organic fertilizer raised the soil C:N ratio by about 8.9%, whereas nitrogen fertilization reduced it by roughly 6.0% (P < 0.05), however, neither treatment significantly affected the microbial biomass C:N ratio. Among environmental variables, soil organic carbon and ammonium-N emerged as primary drivers of stoichiometric variation for soil and microbial C:N ratio, explaining 30.6% and 24.1% of total variability, respectively. Overall, this study reveals that rhizospheric effects substantially alter soil C:N ratios, while microbial C:N ratios remain comparatively stable and show no significant association with soil C:N responses, suggesting differential regulation of carbon–nitrogen stoichiometry in soil and microbial pools

How to cite: Han, T. and Cai, A.: Rhizospheric soil-microbial biomass C, N, and P stoichiometry and function across global agroecosystems, EGU General Assembly 2026, Vienna, Austria, 3–8 May 2026, EGU26-16422, https://doi.org/10.5194/egusphere-egu26-16422, 2026.

The influence of living roots on soil organic matter decomposition is termed the rhizosphere priming effect (RPE). Although root traits are critical for understanding the RPE, it is unclear how the trade-offs among root traits, exudation and mycorrhizal symbioses mediate the RPE. The RPEs of 12 grassland species were quantified using a natural 13C tracer method in a mesocosm experiment. Ten root functional traits were measured to examine the trade-offs among root traits, and their linkage with the RPEs. All species produced positive RPEs, with legumes and forbs showing larger RPEs than grasses. The magnitude varied from 32% to 350% compared to the unplanted soil. After accounting for root biomass effect, specific RPEs were positively correlated with specific root length, specific root surface area, root exudation rate, and specific rhizosphere respiration, while negatively correlated with root diameter and arbuscular mycorrhizal fungi colonization. These results demonstrate that plants with thinner roots show efficient root morphology and/or more exudation by inducing larger specific RPEs, while plants with thicker roots associate more with mycorrhizal symbioses and induce smaller specific RPEs. Overall, root functional traits play key roles in mediating the species-specific RPEs and have implications for predicting soil organic matter dynamics.

How to cite: Lu, J.: Rhizosphere priming on soil organic carbon decomposition: the role of root traits, EGU General Assembly 2026, Vienna, Austria, 3–8 May 2026, EGU26-17486, https://doi.org/10.5194/egusphere-egu26-17486, 2026.

Deforestation is a global issue, threatening carbon stock and biodiversity worldwide. African tropical regions are experiencing intense deforestation, primarily driven by agricultural expansion. The strong reliance of rapidly growing populations on forest resources further increases pressure on these ecosystems. Smallholder subsistence farming, combined with weak governance and limited soil and forestry management, has contributed to progressive forest fragmentation, declines in biodiversity, and reductions in ecosystem resilience. The rapid decline of African tropical forests raises critical questions about their ability to recover naturally. This study investigates the role of soil in explaining the persistence of grassland vegetation and the consequent limited forest recovery. Specifically, soil samples from grassland-dominated areas of Kibale National Park in Uganda are collected, air-dried, and analysed to determine key properties influencing soil water availability, including bulk density, gravel content, and soil texture. Bulk density and gravel content are measured because of their influence on porosity and soil water availability. Soil texture is obtained using spectroscopy and used to help explain potential vegetation patterns due to its effect on soil water availability. These properties are also compared with soil data from forested areas within the same park. The results reveal clear differences between grassland and forest soils. Grassland soils contain less clay and show lower porosity than forest soils. These characteristics help explain the persistence of grassland vegetation in the studied tropical landscape and support the conclusion that soil physical properties influence vegetation distribution through their effect on soil-water-plant interactions.

How to cite: Oggier, N. M.: Soil Texture as Physical Driver of Forest and Grassland Occurrence in Kibale National Park, Uganda, EGU General Assembly 2026, Vienna, Austria, 3–8 May 2026, EGU26-18237, https://doi.org/10.5194/egusphere-egu26-18237, 2026.

EGU26-18463 | Posters on site | BG3.25

Spatio-Temporal Shifts in Climatic Suitability for Mycotoxins in Europe 

Richa Raj, Harald Rieder, Darina Balkova, Marco Camardo Leggieri, and Paola Battilani

Mycotoxin contamination of cereals remains a major threat to food security, as the development and toxin production of fungal pathogens are strongly controlled by climate. This study presents a continental-scale assessment of climatic suitability for three key mycotoxigenic fungi, Aspergillus flavus, Fusarium graminearum and Fusarium verticillioides, across Europe over a six-decade period from 1961 to 2020. Using daily ERA5-Land temperature and precipitation data and species-specific thermal response functions, we calculate a composite Risk Index that combines suitability for vegetative growth and sporulation. Days with index values exceeding 0.5 are classified as “risk days.” Results show a substantial increase in the annual number of risk days across Europe for all three species. Aspergillus flavus exhibits the strongest relative increase, exceeding 90 percent in several parts, together with a clear northward expansion into parts of Central Europe. By integrating these results with high-resolution maps of maize and wheat cultivation, we identify agriculturally important regions where warming has transformed fungal risk from occasional to persistent. In several hotspots, the number of risk days has doubled compared to the baseline period. This trend closely mirrors increases in the frequency of hot days above 25 °C during the growing season. These findings indicate that climate warming is rapidly intensifying and redistributing mycotoxin risk in Europe, with serious implications for cereal safety, public health, and climate adaptation strategies.

How to cite: Raj, R., Rieder, H., Balkova, D., Camardo Leggieri, M., and Battilani, P.: Spatio-Temporal Shifts in Climatic Suitability for Mycotoxins in Europe, EGU General Assembly 2026, Vienna, Austria, 3–8 May 2026, EGU26-18463, https://doi.org/10.5194/egusphere-egu26-18463, 2026.

Soils represent a massive reservoir of organic matter, storing approximately three times the carbon found in the atmosphere. While over half of this soil organic carbon (SOC) is stored in subsoils below 30 cm, our understanding of its vulnerability is hindered by a major discrepancy: most field experiments utilizing top-down warming techniques show that warming rapidly attenuates with depth, whereas Earth system models (ESMs) project synchronous warming of the entire soil profile. Here, we resolve this conflict by combining a synthesis of depth-specific soil temperature measurements from 579 in-situ monitoring sites, analysis of 322 field warming experiments, and process-based modeling. The observed warming rates across depths demonstrate that ambient climate change drives nearly synchronous warming down to 3.5 m with only a slight attenuation along depth. This starkly contrasts with the strong thermal dampening recorded in field experiments using top-down warming techniques including open-top chambers, infrared heaters and heating cables. By modifying a land surface model to explicitly simulate lateral heat transfer, we show that heat loss from warmed plots to adjacent unheated soils is the primary mechanism for this attenuation in experiments. Crucially, our modeling reveals that lateral heat loss inherent in plot-scale designs leads to an average 23% underestimation of heterotrophic respiration, resulting in a 10-fold underestimation of SOC loss after 20 years. Our findings reveal a critical bias in the widely used experimental frameworks and highlight the urgent need for whole-soil warming designs to more accurately predict soil carbon-climate feedbacks.

How to cite: Chen, Y. and Zhu, D.: Near synchronous warming of deep soils reveals prevailing underestimation in soil carbon loss in warming experiments, EGU General Assembly 2026, Vienna, Austria, 3–8 May 2026, EGU26-21607, https://doi.org/10.5194/egusphere-egu26-21607, 2026.

Litter decomposition is a key process in the global carbon cycle, primarily driven by microbial communities. At the litter-soil interface, microbes interact directly with both substrates and environmental conditions, often exhibiting distinct functional traits. However, differences between interface and non-interface microbial communities remain underexplored. This study conducted a year-long field litter burial experiment on Segrila Mountain in Tibet (3500–4300 m), using high-throughput sequencing and bioinformatics to investigate how interface microbes influence decomposition in alpine forests. Our findings reveal that, although the dominant bacterial and fungal phyla are similar between interface and non-interface soils, Acidobacteria are less abundant at the interface compared to non-interface soils, whereas Proteobacteria and Actinobacteria are more abundant. Interface microbial networks, constructed by Spearman correlations and modularity detection algorithms, display greater structural dynamics and complexity than those in non-interface soils. Variation partitioning analysis reveals that core microbial modules of the interface and non-interface soils, as well as elevation, account for 32.84 %, 3.79 %, and 5.39 % of the variation in litter decomposition, respectively. In the structural equation model, core interface microbial modules exert a significant and direct positive effect on both litter decomposition and lignocellulosic component breakdown, while non-interface modules are not significantly associated. Overall, the structure and activity of interface microbial communities dominate litter degradation dynamics. This study advances our understanding of the critical litter-soil interface processes in maintaining forest soil functions and offers a basis for managing carbon and nutrient dynamics under changing climate conditions in alpine forest ecosystems.

How to cite: Wei, Y.: Interfacial microbial communities drive litter decomposition along elevation gradients in alpine forest ecosystems, EGU General Assembly 2026, Vienna, Austria, 3–8 May 2026, EGU26-21767, https://doi.org/10.5194/egusphere-egu26-21767, 2026.

EGU26-22890 | ECS | Orals | BG3.25

Catchment-scale modeling of soil carbon dynamics using the Radiocarbon Inventories of Switzerland 

Alexander Brunmayr, Margaux Moreno-Duborgel, Luisa Minich, Timo Rhyner, Benedict Mittelbach, Margot White, Negar Haghipour, Frank Hagedorn, Timothy Eglinton, and Heather Graven

With air temperature anomalies already reaching +3°C, Switzerland is undergoing rapid environmental change, particularly in the Swiss Alps, experiencing alpine greening and an upward shift of the tree line. However, the consequences of these changes for soil carbon storage, turnover, and lateral export remain poorly constrained. Using the national Radiocarbon Inventories of Switzerland database (RICH, rich.ethz.ch), we combine highly informative 13C and 14C isotopic data with a coupled soil–rock–water model to investigate carbon cycle dynamics across spatial scales, from individual sites to entire catchments. At the local scale, isotopic measurements of soil density fractions provide detailed insights into carbon stabilization mechanisms and turnover times. Meanwhile at the catchment scale, riverine ion concentrations and carbon isotopic signatures integrate signals across landscapes. Long-term continuous monitoring of river carbon and solute fluxes over the past 50 years reveal significant changes across both the Swiss Plateau and Alps, reflecting shifts in weathering, hydrology, and soil carbon cycling. By jointly calibrating site-scale soil processes and catchment-scale riverine fluxes using isotopic constraints, our approach enables cross-scale inference of carbon turnover and pathways. With this integrated framework, we aim to improve our understanding of the coupling between vegetation dynamics, soil carbon turnover, bedrock weathering, and lateral carbon export in vulnerable landscapes undergoing change.

How to cite: Brunmayr, A., Moreno-Duborgel, M., Minich, L., Rhyner, T., Mittelbach, B., White, M., Haghipour, N., Hagedorn, F., Eglinton, T., and Graven, H.: Catchment-scale modeling of soil carbon dynamics using the Radiocarbon Inventories of Switzerland, EGU General Assembly 2026, Vienna, Austria, 3–8 May 2026, EGU26-22890, https://doi.org/10.5194/egusphere-egu26-22890, 2026.

EGU26-23017 | Posters on site | BG3.25 | Highlight

Soil CO2 flux responses to experimental warming over time and space: The whole soil story 

Jeffrey Beem-Miller and the Soil Warming to Depth Data Integration Effort Team (SWEDDIE)

Much of our understanding of the warming response of soil respiration (Rs) is derived from experiments that warm only the soil surface, potentially underestimating warming impacts on belowground processes and overestimating contributions from aboveground warming. Although many studies report increased Rs under warming when moisture is not limiting, estimates of temperature sensitivity vary widely across experiments.

The current analysis harnesses data from the Soil Warming to Depth Data Integration Effort (SWEDDIE) to assess the temperature sensitivity of Rs as a function of warming and soil moisture over time and depth across the contrasting climatic and ecosystem conditions of 16 deep soil warming experiments worldwide. We hypothesize that the seasonal pattern of soil CO2 fluxes may differ between warmed and ambient temperature plots, so we will first analyze the data from warmed and treatment plots separately, followed by a traditional synchronous comparison of CO2 fluxes between warmed and ambient plots.

Field warming studies provide a unique opportunity to observe the full complexity of the response of Rs responses to warming at an ecosystem scale, but disregarding warming impacts in biologically active deeper soil layers has the potential to create bias when interpreting the relative contributions of autotrophic and heterotrophic sources of Rs. This work is intended to address this potential bias as well as highlight potential limitations of assuming stationary or globally uniform Rs temperature responses.

How to cite: Beem-Miller, J. and the Soil Warming to Depth Data Integration Effort Team (SWEDDIE): Soil CO2 flux responses to experimental warming over time and space: The whole soil story, EGU General Assembly 2026, Vienna, Austria, 3–8 May 2026, EGU26-23017, https://doi.org/10.5194/egusphere-egu26-23017, 2026.

EGU26-102 | Orals | HS8.3.4

Mechanisms of facilitation of water transport in the rhizosphere 

Lionel Dupuy, Andrew Mair, Beatriz Mezza Manzaneque, Emma Gomez Preal, Iker Martín Sanchez, Gloria de las Heras Martínez, Natalia Natalia Elguezabal Vega, Anke Lindner, Eric Clement, Nicola Stanley-Wall, and Mariya Ptashnyk

Biological activity in soil is very diverse and around plant roots it affects water transport. Root growth displaces soil particles and alters soil porosity, by creating biopores that conduct water. The secretions of plants and microbes modify surface tension, viscosity, absorption and retention of water. Microbial motility may also contribute to water transport, but such effects have not been demonstrated in soil to date. To elucidate how these factors influence root water uptake, we combined dye tracing experiments [1,2], live microscopy and physical characterization of root exudates of winter wheat, along with analyses of cell suspensions and secretions of the bacterium Bacillus subtilis. Using this dataset, we coupled a modified Richards’ equation [3] with the model of Šimůnek and Hopmans [4] to investigate how the combined effects of these processes influence water availability to crops over a complete wet–dry–wet cycle. Results showed that both microbes and plants’ secretions act as facilitators of water infiltration of dry and mildly repellent soil layers. In arid environments, under light and sporadic rainfall events, this effect tends to benefit more deeper-rooted or mature crops. Results also show that microbial motility alone may be inducing an active stress of few Pascals which also contributes to enhance water infiltration. These results have important implications for the management of irrigation in cropping systems.  


References

[1] Liu et al 2025, Biosystems Engineering, https://doi.org/10.1016/j.biosystemseng.2025.02.006

[2] Gómez et al 2025, Plant Cell Environment, https://doi.org/10.1111/pce.70240

[3] Mair et al 2025, Vadose Zone Journal, https://doi.org/10.1101/2025.03.28.645940

[4] Šimůnek and Hopmans 2009, Ecological Modelling, 220(4), 505–521


How to cite: Dupuy, L., Mair, A., Mezza Manzaneque, B., Gomez Preal, E., Martín Sanchez, I., de las Heras Martínez, G., Natalia Elguezabal Vega, N., Lindner, A., Clement, E., Stanley-Wall, N., and Ptashnyk, M.: Mechanisms of facilitation of water transport in the rhizosphere, EGU General Assembly 2026, Vienna, Austria, 3–8 May 2026, EGU26-102, https://doi.org/10.5194/egusphere-egu26-102, 2026.

Emerging contaminants in agricultural soils and irrigation water present significant threats to food safety and environmental health through their uptake and accumulation in edible plant tissues. This study presents a dynamic multicompartment plant-uptake model to simulate the fate and transport of both neutral and ionizable compounds under conditions involving pre-existing soil contamination or continuous contaminant loading via different agricultural practices. The model characterises chemical behaviour across soil, roots, stem, leaves, and fruits, explicitly accounting for gaseous exchange, volatilisation losses, atmospheric deposition, xylem- and phloem-driven translocation, growth dilution, and organelle-level partitioning within plant cells. A comparison of the framework's predictions with previously published multicompartment plant-uptake datasets reveals its ability to predict the observed uptake, transport, and redistribution patterns across plant organs. The model's integration of key physicochemical, physiological, and environmental drivers into a unified mechanistic platform enhances its ability to predict contaminant transfer through the soil–plant continuum. The proposed framework can support risk assessments, guide the selection of safer irrigation sources, and inform management strategies for agricultural systems affected by historical pollution or poor-quality irrigation water.

How to cite: Meena, V. and Swami, D.: A Multicompartment Plant-Uptake Model for Neutral and Ionizable Compounds: Development and Validation, EGU General Assembly 2026, Vienna, Austria, 3–8 May 2026, EGU26-1159, https://doi.org/10.5194/egusphere-egu26-1159, 2026.

EGU26-1234 | ECS | Posters on site | HS8.3.4

Drought-induced shifts in water uptake in winter cereals: Insights from multi-scale measurements across two contrasting years 

Gökben Demir, Anas Emad, Christian Markwitz, David Dubbert, Alexander Knohl, and Maren Dubbert

Croplands are among the systems most vulnerable to shifts in precipitation regimes and prolonged droughts particularly in temperate climates. Although irrigation may increase agricultural productivity, it can’t offer a sustainable long-term solution to compound droughts due to intensified pressure on freshwater resources. Thus, characterizing root water uptake patterns is essential to understand how crops maintain function while sustaining transpiration during drought. We investigated water uptake patterns of winter cereals (wheat, barley) across two contrasting growing seasons (2024, 2025). The research site is in central Germany, it exhibits a suboceanic/subcontinental climate and has a shallow groundwater level (ca. 1.5 m). In the footprint of an eddy covariance (EC) tower, we sampled plant leaves, soil water, precipitation, river water, and groundwater to trace stable water isotopes. We monitored leaf area index (LAI) and installed soil moisture sensors (5–100 cm). Using soil moisture time series and dual-isotope mixing models, we quantified variation in water uptake depth throughout the growing seasons (March-July). In 2024, soil layers were wetted by regular rains in April with only short rain-free periods occurring. On the contrary, frequent and longer dry spells occurred in 2025, totalling 18 days in April and 15 days in May. Moreover, in 2024, ETsoil ranged from 1.2 mm day⁻¹ to over 7 mm day⁻¹ at peak LAI, while ETEC-tower for the same period exceeded 5 mm day⁻¹. In 2025, despite high transpiration demand, ET did not exceed 5 mm day⁻¹ consistently in both methods. Soil water isotope patterns showed expected fluctuations, with deeper layers being depleted in δ²H and δ¹⁸O. We used the Craig–Gordon equation to determine xylem water isotope signatures, followed by mixing models to quantify water sources for transpiration. Xylem and soil water isotope time series suggest that despite more frequent rain events, winter wheat continued to draw water from stable, deeper sources rather than relying on enriched shallow soil layers (5–15 cm). During summer 2024 (June–July), δ²H and δ¹⁸O values in the topsoil enriched through higher soil evaporation, yet water uptake shifted to deeper layers, which agrees with ETsoil variations. Precipitation events in late spring 2024 enabled winter wheat to access deeper soil water sources (≥50 cm) to sustain high transpiration demand. During the drier conditions, barley altered water uptake depths yet transpiration demand was mainly sustained from water sources within 10–40 cm, and contribution from deeper layers was limited. Both species showed similar responses to dry spells, yet the timing of the drought shaped root plasticity and access to stable water sources. Our results demonstrate that water uptake strategies and water use efficiency are tightly linked to the timing and intensity of drought in annual crops, even when deeper water sources remain stable.

How to cite: Demir, G., Emad, A., Markwitz, C., Dubbert, D., Knohl, A., and Dubbert, M.: Drought-induced shifts in water uptake in winter cereals: Insights from multi-scale measurements across two contrasting years, EGU General Assembly 2026, Vienna, Austria, 3–8 May 2026, EGU26-1234, https://doi.org/10.5194/egusphere-egu26-1234, 2026.

Plant water regulation plays a critical role in land–atmosphere coupling and ecosystem responses to climate extremes. Isohydricity is widely used to characterize how plants regulate water loss under water stress, yet its behavior under interacting drought and salinity remains poorly understood. Here, we investigated maize (Zea mays L.) water-use strategies under combined water and salinity constraints using a controlled pot experiment. Maize plants were exposed to two water availability regimes (well-watered and drought conditions) and irrigated with either fresh or saline water. Isohydric behavior was assessed using three complementary hydraulic relationships: (i) transpiration rate (normalized by leaf area) versus soil water potential, (ii) leaf water potential versus soil water potential, and (iii) stomatal conductance versus leaf water potential. In addition, the vulnerability of soil–plant hydraulic conductance was also examined.

Under drought or salinity applied separately, maize tended to exhibit more anisohydric behavior, characterized by relatively weak reductions in transpiration and stomatal conductance with declining water potential and a broader range of leaf water potential variation. In contrast, when drought and salinity occurred simultaneously, maize shifted toward a more isohydric mode of regulation, clearly differing from responses under single stress conditions. Moreover, under drought conditions, isohydricity inferred from the leaf–soil water potential relationship tended toward a more isohydric behavior under saline treatment, whereas isohydricity inferred from transpiration- and stomatal conductance–based relationships under salinity indicated a more anisohydric behavior. This discrepancy highlights the influence of evaluation methods on isohydricity characterization. Furthermore, we conclude that maize isohydricity is closely linked to the vulnerability of soil–plant hydraulic conductance. Under drought or salinity conditions, maize tends to exhibit more anisohydric behavior, which is associated with enhanced resistance of the soil–plant hydraulic system to the loss of hydraulic conductance. These findings advance our understanding of crop water relations under combined water and salinity stress and support integrated irrigation and salinity management strategies to improve water use efficiency and sustain yields in salt-affected regions.

How to cite: Shao, X. and Lei, G.: Interacting drought and salinity reshape maize isohydric behavior through soil–plant hydraulic constraints, EGU General Assembly 2026, Vienna, Austria, 3–8 May 2026, EGU26-2178, https://doi.org/10.5194/egusphere-egu26-2178, 2026.

EGU26-2609 | Posters on site | HS8.3.4

Transforming excavation waste into functional soil: Effects of compost ratios and plant diversity on initial pedogenesis 

Maha Deeb, Cédric Deluz, Patrice Prunier, Fabienne Morch, Pierre-André Frossard, and Pascal Boivin

Soil engineering is gaining increasing attention due to its potential to address soil scarcity while promoting waste recycling. However, functional soils do not arise from simply mixing waste materials. Instead, fundamental pedogenetic processes must be activated and supported, alongside the stabilization of organic carbon through complexation with mineral surfaces. Evidence suggests that interactions between plants and minerals could accelerate these early pedogenic processes—including carbon fixation and mineral–organic associations—while limiting carbon mineralization. This study reports the results of a field experiment conducted in Geneva to investigate these effects.

Excavated geological layers (DSH) from Geneva’s fluvio-glacial deposits were mixed with six levels of green waste compost (GWC) (10–90 %). Each plot was sown with a standardized indigenous plant mixture of 44 species, and plant diversity was maximized under the assumption that higher diversity would enhance the formation of a soil-like structure in the parent material. Treatments were replicated four times and monitored monthly for the first six months, with a final assessment at 12 months. Organic carbon forms were analyzed using Rock Eval® pyrolysis, and soil hydrostructural properties were evaluated through soil shrinkage analysis.

Results showed that a 25 % compost ratio promoted carbon stabilization, while the 10 % mixture demonstrated potential for carbon fixation and mineral–organic associations after 12 months, likely due to slower plant establishment in dry grassland. The 50 % compost mixture supported higher plant species richness, including ruderal and dry grassland species. Additionally, adding 10 % DSH to a 90 % GWC mixture reduced carbon mineralization compared with 100 % GWC, indicating potential for soilless applications. Overall, these findings suggest that pedogenic processes in engineered soils can be optimized by carefully selecting parent material-to-organic carbon ratios and plant combinations.

How to cite: Deeb, M., Deluz, C., Prunier, P., Morch, F., Frossard, P.-A., and Boivin, P.: Transforming excavation waste into functional soil: Effects of compost ratios and plant diversity on initial pedogenesis, EGU General Assembly 2026, Vienna, Austria, 3–8 May 2026, EGU26-2609, https://doi.org/10.5194/egusphere-egu26-2609, 2026.

EGU26-2974 | ECS | Posters on site | HS8.3.4

Quantifying Drivers of Root Depth and Distribution in European Forests: Species, Soil, and Climate Effects 

Dennis Günther Ried, Andrea Carminati, Richard L. Peters, Marco Lehmann, Louis Graup, Lorenz Walthert, Peter Waldner, Ivano Brunner, Fabian Bernhard, and Katrin Meusburger

Deep rooting is a critical trait for drought tolerance, yet quantitative knowledge of root distributions across tree species and soil properties remains limited [1, 2]. This study characterises fine-root distribution patterns and maximum rooting depths in mono and mixed species forests based on ~2,000 soil profiles from Switzerland and it is intended to extend the study to the continental scale with root, tree and soil data from ICP Forests’ Level I and II plots.
Root presence was recorded semi-quantitatively along soil profiles together with maximum rooting depths and associated soil and stand properties. Species specific traits and soil properties were analysed, and root distribution curves (beta curves: Y=1-βd) were modelled to derive species- and soil-specific rooting patterns [3]. Trait-specific beta curves were then compared and analysed for site, stand, and soil properties, such as for topographic, and climate data, focusing on profiles only deeper than 1m soil depth, to avoid skewed beta calculations.
In monospecific stands (dominant species >50% canopy cover), linear models (LMs) explained 29.7% of beta variance across profiles. Tree species identity and soil density were the strongest contributors, while mean annual precipitation exhibited pronounced non-linear effects. Model parsimony improved strongly when tree species identity was aggregated into angiosperms and gymnosperms, although explanatory power decreased slightly to 27.4% of explained beta variance. On average, angiosperms showed a more homogenous fine-root distribution pattern (median β = 0.933) than gymnosperms (median β = 0.888).
In contrast, in mixed species stands, LMs explained 22.1% of beta variance. Tree species identity and soil type emerged as the primary drivers. In comparison, mixed species stands were more difficult to analyse and interpret than monospecific stands due to their higher structural and ecological complexity. Notably, strong collinearity was observed among soil type, hydromorphic condition, and soil density in both monospecific and mixed species stands.
Subsequently, we plan to integrate data from ICP Forests sites to test whether these relationships hold across broader climatic and edaphic gradients. With these results we aim to improve mechanistic modelling of soil water availability, root water uptake, and forest development under current and future climate conditions.

References

[1] Meusburger, K., Trotsiuk, V., Schmidt-Walter, P., Baltensweiler, A., Brun, P., Bernhard, F., Gharun, M., Habel, R., Hagedorn, F., Köchli, R., Psomas, A., Puhlmann, H., Thimonier, A., Waldner, P., Zimmermann, S., & Walthert, L. (2022). Soil–plant interactions modulated water availability of Swiss forests during the 2015 and 2018 droughts. Global Change Biology, 28, 5928–5944. DOI: 10.1111/gcb.16332.

[2] Pietig, K., Kotowska, M., Coners, H., Mundry, R., & Leuschner, C. (2026). Deep rooting revisited: Comparing the rooting patterns of European beech, Sessile oak, Scots pine, and Douglas fir in sandy soil to 3.8 m depth. Forest Ecology and Management, 600, 123288. DOI: 10.1016/j.foreco.2025.123288

[3] Gale, M. R. & Grigal, D. F. (1987). Vertical root distributions of northern tree species in relation to successional status. Can. J. For. Res. 17: 829-834.

How to cite: Ried, D. G., Carminati, A., Peters, R. L., Lehmann, M., Graup, L., Walthert, L., Waldner, P., Brunner, I., Bernhard, F., and Meusburger, K.: Quantifying Drivers of Root Depth and Distribution in European Forests: Species, Soil, and Climate Effects, EGU General Assembly 2026, Vienna, Austria, 3–8 May 2026, EGU26-2974, https://doi.org/10.5194/egusphere-egu26-2974, 2026.

Soil-moisture memory (SMM) regulates the evolution of drought, hydrological predictability, and land–atmosphere coupling, yet many conventional diagnostic metrics simplify this complex phenomenon into a sole memory timescale. In this paper, we introduce a unified observation-driven framework—a scale-aware Linear Integro-Differential Equation (LIDE) for root zone soil moisture—to infer the complete distributed memory kernel that effectively models soil-moisture dynamics. When applied to multi-year in situ observations from energy-limited, water-limited, and intermediate hydro-climatic regimes, LIDE reveals a rich hierarchy of memory structures that conventional e-folding autocorrelation or hybrid deterministic-stochastic metrics are unable to capture. Application of LIDE in examined sites revealed a fast-memory timescale from ∼3–32 days, a short-term slow-memory timescale from 13 to 39 days, an intermediate slow-memory from ∼115–127 days, a long-term slow-memory from ∼218–541 days, and a theoretical saturation timescale from ~9 to 15 years. LIDE also provides additional quantitative information about memory strength, as assessed by actual memory capacity (Q), which is not available through conventional persistence analyses, with Q being relatively constant over the examined sites (1.12–1.24 days⁻²) despite large hydro-climatic contrasts among sites. Applying LIDE on hourly, daily, and monthly data reveals that high-frequency data provides information on sub-daily fast memory timescales (~6 hours at the intermediate site, namely Schöneseiffen in Germany), as well as an additional very short slow-memory timescale (~14 hours at Schöneseiffen) that is not observable in daily or monthly data. The integrated kernel also accounts for the oscillatory saturation dynamics associated with soil-moisture reemergence, making it possible to retrieve this process from observations for the first time. Collectively, these results place LIDE as a state-of-the-art and state-of-the-practice approach in diagnosing multiscale memory of the soil moisture that is physically interpretable and scalable and can greatly advance drought sciences, ecohydrology, and land-surface modeling.

How to cite: Rahmati, M.: A Memory-Based, non-Markovian, Linear Integro-Differential Equation for Root-Zone Soil Moisture, EGU General Assembly 2026, Vienna, Austria, 3–8 May 2026, EGU26-3805, https://doi.org/10.5194/egusphere-egu26-3805, 2026.

EGU26-4133 | Orals | HS8.3.4

Uncovering critical thresholds of root-zone soil moisture for plant water stress in terrestrial ecosystems 

Bin Chen, Zheng Fu, Yuanyuan Huang, Shaoqiang Wang, and Zhihui Chen

The critical root-zone soil moisture (SM) threshold is a fundamental parameter that marks the transition from energy-limited to soil-moisture-limited evapotranspiration (ET) regimes, yet regional and global studies often rely on near-surface SM and its associated threshold as a proxy. This study presents a global, measurement-based evaluation of critical root-zone SM threshold by analyzing 666 dry-down events across 34 eddy covariance flux tower sites equipped with multi-layered SM sensors reaching depths of at least 1 meter. The results demonstrate that critical thresholds derived from near-surface and root-zone SM are significantly inconsistent, with an overall root mean square error (RMSE) of 0.11 m³ m⁻³. This discrepancy is primarily driven by the vertical SM gradient and the decoupling of near-surface and root-zone layers during drydown periods, which leads to substantial errors in identifying the onset and duration of plant water stress. For instance, at a forest site (US-Me2), using the critical threshold derived from near-surface SM delayed the detected onset of moisture stress by 27 days and underestimated the duration of the moisture-limited regime by 36 days. Across the diverse biomes and climate types studied, the global mean  was 0.12 ± 0.11 m³ m⁻³. These findings provide a critical observational benchmark for the evaporative fraction-root zone soil moisture relationship, highlighting that transitioning from near-surface to root-zone-based assessments is essential for accurate land-surface model evaluation and the quantification of ecosystem vulnerability to drought.

How to cite: Chen, B., Fu, Z., Huang, Y., Wang, S., and Chen, Z.: Uncovering critical thresholds of root-zone soil moisture for plant water stress in terrestrial ecosystems, EGU General Assembly 2026, Vienna, Austria, 3–8 May 2026, EGU26-4133, https://doi.org/10.5194/egusphere-egu26-4133, 2026.

Understanding the water use patterns of artificially revegetated plants in arid and semi-arid desert regions with shallow groundwater is crucial for sustainable water resource management and effective vegetation restoration strategies. Despite extensive vegetation rehabilitation in China’s Mu Us Sandy Land, the interspecific and seasonal variations in plant water sources under similar groundwater conditions remain unclear. We conducted isotopic analysis of hydrogen and oxygen in main sand-fixing plants—Pinus sylvestris var. mongolica, Amygdalus pcdunculata Pall, and Artemisia desertorum Spreng—alongside potential water sources during the three growing seasons. Our aim was to elucidate seasonal changes in plant water uptake patterns by correcting isotopic offsets in xylem water using the MixSIAR model. Results indicated that A. desertorum predominantly utilized water from the 0–150 cm soil layer (67.52±14.44 %) throughout all seasons. Conversely, P. sylvestris and A. pedunculata shifted their primary water sources from the 60–240 cm soil layer during the dry season (55.20±2.12 and 57.96±1.45 %, respectively) to the 0–150 cm soil layer during the rainy season (68.44±4.46 and 66.19±1.68 %, respectively), suggesting greater water uptake adaptability in trees and shrubs compared to grasses. Groundwater contribution to plant water uptake showed no significant interspecies difference during the rainy season (P > 0.05). However, P. sylvestris and A. pedunculata significantly increased groundwater absorption during the dry season compared to the rainy season (P < 0.05). Correcting δ2H offsets in xylem water revealed an underestimation of groundwater contributions by 16.06±9.09 % in the dry season and 4.25±0.55 % in the rainy season. Given these interspecific and seasonal variations in water uptake patterns among sand-fixing plants, and the imperative for sustainable groundwater use, tailored water management strategies are essential to prevent the degradation of restored ecosystems in this water-limited desert region.


How to cite: Huang, L.: Adaptive water use strategies of artificially revegetated plants in a groundwater dependent ecosystem: Implications for sustainable ecological restoration, EGU General Assembly 2026, Vienna, Austria, 3–8 May 2026, EGU26-4457, https://doi.org/10.5194/egusphere-egu26-4457, 2026.

EGU26-5037 | ECS | Posters on site | HS8.3.4

Maintaining root–soil contact in drying soils: the role of mucilage and root hairs 

Sara Di Bert and Andrea Carminati

The rhizosphere plays a key role in regulating plant water uptake during soil drying, yet it is often represented in soil–plant models as hydraulically and mechanically equivalent to bulk soil. While the influence of root mucilage and extracellular polymeric substances (EPS) on rhizosphere water retention is well recognized, their mechanical role—together with that of root hairs—in controlling root–soil contact and soil structural dynamics remains insufficiently explored.

Recent biomechanical insights into drying liquid bridges reveal that polymer-rich solutions behave fundamentally differently from water. Whereas capillary water bridges weaken and fail during drying—particularly in coarse-textured soils such as sand—mucilage can form viscoelastic filaments that persist during drying and generate increasing tensile forces as the polymer network is stretched. As a result, the mechanical contribution of mucilage on maintaining root-soil contact is negligible in fine-textured soils where capillary forces are already strong but is particularly relevant in sandy soils where water bridges alone provide little mechanical adhesion.

These biomechanical properties have important consequences for root–soil contact dynamics and rhizosphere structure. Elastic polymer bridges, in combination with root hairs that increase contact area and provide additional anchoring points, offer a mechanism by which plants can maintain physical contact with the surrounding soil as roots shrink during drying. This mechanical reinforcement may delay both hydraulic disconnection and associated mechanical loss of contact of roots from the soil, preserving water uptake at water potentials where capillary connectivity alone would already be limiting.

At the same time, tensile forces generated by drying polymeric gels promote aggregation of soil particles, contributing to the formation of a mechanically coherent rhizosphere with altered pore geometry and connectivity. Such aggregation reinforces the distinction between rhizosphere and bulk soil properties and may further modulate local water distribution and hydraulic conductivity near the root surface.

This perspective highlights the need to move beyond purely hydraulic descriptions of the rhizosphere and to incorporate the mechanical effects of mucilage, EPS, and root hairs into conceptual and numerical models of root water uptake, particularly under drought conditions.

How to cite: Di Bert, S. and Carminati, A.: Maintaining root–soil contact in drying soils: the role of mucilage and root hairs, EGU General Assembly 2026, Vienna, Austria, 3–8 May 2026, EGU26-5037, https://doi.org/10.5194/egusphere-egu26-5037, 2026.

EGU26-5060 | Orals | HS8.3.4

The resilience of barley to drought in a changing climate is determined by its lateral root diameter 

Bo Fang, Johannes Postma, and Christian Kuppe

Climate change is intensifying droughts and threatening food security. Roots are the plants’ organ for water uptake and are crucial for their adaptation, with their structure being a decisive factor. In barley (Hordeum vulgare), lateral roots form~60% of the total root length and are important for water uptake. Hydraulic conductance scales strongly with root diameter: thicker laterals conduct more water per unit length but demand higher carbon for construction and maintenance. During soil drying, this creates a potential carbon-water trade-off. We test whether such a trade-off exists and whether it shapes drought resilience across environments by comparing the diameter that optimizes the trade-off with that maximizing shoot dry mass (SDM).

We used a functional–structural plant model (OpenSimRoot) to simulate barley growth across five climatically and pedologically contrasting global sites, representing different drought regimes. Simulations covered 50 growing seasons (2000–2049) using projected climate data and site-specific soils. Five lateral root diameter classes were evaluated, and outputs included shoot dry mass, root carbon allocation, and root hydraulic conductance. Drought performance was assessed by jointly considering productivity and efficiency-based metrics related to carbon investment and water transport capacity.

Across all environments, barley performance showed a clear dependence on lateral root diameter, with intermediate diameters generally balancing water uptake capacity and carbon costs. SDW and trade-off analyses converged on to the same diameter, reflecting a general trend. However, site-specific analyses revealed substantial divergence, reflecting differences in climate variability, soil properties, and drought characteristics. In several environments, finer lateral roots did not consistently confer advantages in either hydraulic efficiency or biomass production, challenging the notion of a universally optimal “cheap-root” strategy under drought.

A robust carbon–water trade-off underlies lateral root diameter; the diameter that performs best depends on the environment (climate and soil) and the objective (e.g., maximizing SDW versus efficiency/resilience). When data are pooled across all sites, SDM- and trade-off–based optima coincide, but site-level results differ; therefore, breeding for drought resilience should target site- and objective-specific trait values rather than a single fixed optimum.

How to cite: Fang, B., Postma, J., and Kuppe, C.: The resilience of barley to drought in a changing climate is determined by its lateral root diameter, EGU General Assembly 2026, Vienna, Austria, 3–8 May 2026, EGU26-5060, https://doi.org/10.5194/egusphere-egu26-5060, 2026.

Land-atmosphere exchange shifts from energy-limited to water-limited regime at a critical soil moisture, which marks a fundamental transition in the Earth system. Estimates of the critical threshold vary a lot across studies despite its importance for the mechanistic understanding of soil moisture limitation on transpiration and plant productivity.

We introduce a novel, model-based diagnostic approach — the Normalized Transpiration Deficit (NTD) method — and demonstrate that it yields results highly consistent with observational methods such as finding breakpoints in the evaporative fraction. Using a hydraulically-enabled version of the CABLE-POP land surface model, we conducted a factorial experiment across various soil textures, climate regimes, and plant hydraulic parameters. It suggests that the critical threshold occurs at a broadly similar soil matric potential (ψcrit) across soil types, resulting in a quasi-linear relationship between the critical volumetric soil moisture (θcrit) and sand content, as observed in earlier studies. The dependency of θcrit on soil type vanished when it was normalised by field capacity, which yielded hence also a universal threshold of relative extractible water REWcrit, as found empirically for forest ecosystems.

Most of the variance of θcrit, 86%, came from soil texture in the factorial experiment, while the variances of ψcrit and REWcrit were largely explained by plant hydraulic traits, accounting for 87% and 77% of total variance, respectively. Within the plant hydraulic traits, the P50-values of stomatal conductance (ψ50,l) and of xylem conductance (ψ50,x) showed the strongest correlations with the critical thresholds, indicating that vulnerability to hydraulic dysfunction plays a key role in shaping plant responses to soil drying. There was, however, no direct effect of climate on any of the critical thresholds, i.e. the thresholds remained invariant across climates for given soil and vegetation types. This suggests that apparent climate dependencies reported in observational studies may be artifacts due to limited soil moisture ranges at each observational site, or they represent biological adaptation and acclimation that is currently not captured in our static model parameters.

These findings highlight the necessity of incorporating ecosystem-scale hydraulic regulation in biosphere models to reconcile divergent estimates of critical thresholds and to improve predictions of drought impacts on water and carbon fluxes.

How to cite: Lu, Z. and Cuntz, M.: The soil matric potential where ecosystems get water-limited is independent of soil type and climate, EGU General Assembly 2026, Vienna, Austria, 3–8 May 2026, EGU26-5068, https://doi.org/10.5194/egusphere-egu26-5068, 2026.

EGU26-5961 | Orals | HS8.3.4

Plants as Engineers: Carbon Investment and Hydraulic Control in the Rhizosphere 

Mohsen Zare, Bahareh Hosseini, Ruth Adamczewski, and Samantha Spinoso Sosa

Plants actively modify the physical and chemical properties of the rhizosphere to regulate water and nutrient supply, particularly under soil drying conditions. Root mucilage has emerged as a key mediator of these interactions, yet quantitative, mechanistic evidence for how its hydraulic function depends on soil texture and moisture remains scarce. Here we synthesize results from a series of complementary experiments that together demonstrate that rhizosphere hydraulic regulation is an active, texture-dependent process driven by targeted carbon investment belowground.
We combined controlled rhizosphere model systems, isotope tracing, and neutron radiography to disentangle how mucilage alters water retention, unsaturated hydraulic conductivity, and solute diffusion across contrasting soil textures. Using mucilage extracted from maize seedlings, we quantified its effects in sand, sandy loam, and loam under varying moisture conditions. In parallel, we employed 14C pulse labelling and neutron imaging to directly link plant carbon allocation patterns to rhizosphere hydraulic outcomes under contrasting soil texture and water availability.
Across experiments, mucilage effects on rhizosphere hydraulics were strongly texture dependent. In coarse-textured soils, relatively high mucilage concentrations were required to increase water-holding capacity, whereas in finer-textured soils even small additions substantially enhanced retention. Mucilage reduced calcium diffusion in sandy soils across moisture levels, reflecting increased liquid-phase viscosity, while in fine-textured soils it prevented the sharp decline in diffusion during drying by maintaining liquid connectivity. Neutron radiography revealed consistently wetter rhizosphere zones compared to bulk soil, with the strongest hydration gradients occurring in sandy soils, precisely where hydraulic continuity is otherwise most fragile.
Carbon tracing further showed that plants actively adjust their belowground investment in response to soil physical constraints. In sandy soils, particularly under dry conditions, seminal, lateral, and crown roots exhibited elevated 14C allocation to the rhizosphere, indicating enhanced exudation. This sustained carbon investment coincided with root system architectures that maintained access to hydraulically buffered zones near the root surface. Together, these observations demonstrate that plants deploy more, and hydraulically more effective, mucilage where soil texture imposes the strongest physical limitations on water flow.

Taken together, these findings establish a mechanistic link between soil texture, carbon allocation to root exudation, and rhizosphere hydraulic regulation. They reposition mucilage from a passive by-product of root growth to a central component of plant drought strategy and highlight rhizosphere engineering as a key process shaping plant water relations across soils. This perspective opens new avenues for incorporating soil physical context into models of plant drought response and for developing soil- and crop-specific strategies to improve root-zone water availability under increasing climate extremes.

How to cite: Zare, M., Hosseini, B., Adamczewski, R., and Spinoso Sosa, S.: Plants as Engineers: Carbon Investment and Hydraulic Control in the Rhizosphere, EGU General Assembly 2026, Vienna, Austria, 3–8 May 2026, EGU26-5961, https://doi.org/10.5194/egusphere-egu26-5961, 2026.

EGU26-6379 | ECS | Posters on site | HS8.3.4

From Rhizotron Experiments to Functional–Structural Models: Quantifying Root Plasticity Under Soil Water Heterogeneity 

Erfan Nouri, Xavier Draye, and Mathieu Javaux

                         From Rhizotron Experiments to Functional–Structural Models: Quantifying Root Plasticity Under Soil Water Heterogeneity
                                                                                              Erfan Nouri, Xavier Draye, Mathieu Javaux
                                                                                                                         Abstract
Understanding root water uptake under heterogeneous soil moisture conditions is a central objective of this PhD, which aims to improve the mechanistic representation of root–soil interactions under climate-driven drought. Achieving this requires accurate, spatially resolved information on soil water availability at the scales experienced by individual roots rather than whole root systems. However, experimental approaches capable of quantifying soil moisture heterogeneity non-destructively and under controlled hydraulic conditions remain limited.

Within the HYDRA-MAIZE project, we developed a compartmentalized rhizotron platform designed to monitor root growth and soil moisture simultaneously under controlled soil water potential patterns. The system imposes stable, user-defined soil water potentials across
hydraulically isolated compartments while enabling optical measurements of soil moisture via light-transmission imaging.

We established a calibration framework that combines image-based light-transmission measurements with independent determination of soil water retention. Normalized light intensity is used to account for structural heterogeneity unrelated to water content, enabling
assessment of relationships between transmitted light, volumetric water content, and imposed suction. This provides a basis for evaluating theoretical and empirical formulations linking optical signals to soil moisture state.

The platform further enables quantification of spatial resolution and uncertainty in light-transmission-based water content estimation, both horizontally and vertically within rhizotron compartments. By resolving soil water availability at scales relevant to individual root segments, this setup will allow linking local and systemic morphological and hydraulic responses to soil water heterogeneity at high spatial and temporal resolution without
disturbing the plant or substrate. The platform will also support coupling rhizotron data with functional-structural plant models (FSPM) for quantitative analyses of root–soil interactions.

How to cite: Nouri, E., Draye, X., and Javaux, M.: From Rhizotron Experiments to Functional–Structural Models: Quantifying Root Plasticity Under Soil Water Heterogeneity, EGU General Assembly 2026, Vienna, Austria, 3–8 May 2026, EGU26-6379, https://doi.org/10.5194/egusphere-egu26-6379, 2026.

EGU26-7769 | ECS | Orals | HS8.3.4

Root-to-shoot surface ratio adaptation to soil hydraulic constraints: linking experiments to a soil-plant hydraulics model 

Basile Delvoie, Andrea Cecere, Sébastien Fauconnier, Andrea Carminati, and Mathieu Javaux

Climate change is associated with rising temperatures and an increased frequency of drought events. Plants growing in water-limited environments must develop strategies to adapt to soil water availability. In the short term, stomatal regulation enables the control of transpiration and maintenance of plant water status during drought. Under prolonged water deficit, plants are expected to adjust their shoot-root allocation to sustain growth and survival. Although these adaptive responses are conceptually intuitive, the underlying processes and controlling factors remain poorly understood. Understanding short- and long-term plant responses to drought is crucial for investigating plant adaptation to climate changes.

In this work, we hypothesize that soil properties and climatic demand are key factors affecting plant stomatal conductance in the short term and root-to-shoot surface ratio (RSSR) over the longer term. Indeed, results of a simplified soil-plant hydraulic model demonstrated that the regulation of stomatal conductance and of RSSR should be texture dependent. We investigate these relationships through experiments conducted under controlled environmental conditions. Specifically, we assess how soil water content and soil type influence the RSSR of an isohydric species (maize) and an anisohydric species (sunflower). The experimental findings are subsequently analysed using a simplified soil-plant hydraulic model.

The experiment was conducted in a growth chamber controlling photoperiod, temperature, relative humidity, PAR, and VPD. Maize and sunflower were grown in pots using two contrasting substrates, sand and loam, whose hydraulic properties were characterized using the Hyprop system. Two irrigation regimes were imposed to maintain soil water content within predefined target ranges. Each of the 8 species × substrate × treatment combinations included 10 replicates.

Root and shoot biomass and surface were measured at 3 collects to capture plant growth dynamics. Soil water content was monitored by gravimetric measurements before and after each irrigation, with irrigation volumes adjusted to maintain the target moisture range. In addition, stomatal conductance and leaf water potential were punctually measured to characterize plant functioning.

We used a simplified soil-plant hydraulic model representing the system as three resistances in series (soil, roots, xylem), driven by soil-to-leaf water potential gradients (Carminati & Javaux, 2020). This model was employed to predict the optimal RSSR maximizing carbon assimilation while minimizing the risk of embolism.

Our results show that, despite differences in leaf and root surfaces, RSSRs remain within a similar range for both species. RSSR adaptation to soil texture is lower in maize (isohydric) than in sunflower (anisohydric). In addition, RSSR strongly depends on soil water potential (ψsoil), with a stronger response in sunflower. This relationship is further constrained by soil texture through its hydraulic conductivity. For a given RSSR, plants grown in loam are able to sustain at lower ψsoil compared with those grown in sand. To survive at similar ψsoil in a sandy soil, plants would require a substantial increase in RSSR. However, root active surface depends on soil types and modulates the RSSR-ψsoil relationship. Model predictive potential could be further improved by including additional information on active root surface.

How to cite: Delvoie, B., Cecere, A., Fauconnier, S., Carminati, A., and Javaux, M.: Root-to-shoot surface ratio adaptation to soil hydraulic constraints: linking experiments to a soil-plant hydraulics model, EGU General Assembly 2026, Vienna, Austria, 3–8 May 2026, EGU26-7769, https://doi.org/10.5194/egusphere-egu26-7769, 2026.

Cadmium (Cd), a non-essential and toxic heavy metal, severely disrupts plant physiological and biochemical processes by inducing programmed cell death (PCD). Nitric oxide (NO) and hydrogen sulfide (H₂S) are key signaling molecules involved in plant stress responses, but the molecular mechanisms underlying their crosstalk in Cd-induced PCD remain elusive. Here, we first demonstrated that Cd-triggered PCD is accompanied by NO bursts, where NO dynamically modulates PCD progression—exacerbating cell death when depleted and alleviating it when present. Proteomic analysis of S-nitrosylated proteins revealed that differential S-nitrosylation targets in Cd-induced vs. NO-alleviated PCD are enriched in carbohydrate metabolism and amino acid metabolism, with unique targets in cofactor/vitamin metabolism and lipid metabolism. Additionally, S-nitrosylation of proteins involved in porphyrin/chlorophyll metabolism and starch/sucrose metabolism contributes to Cd-induced leaf chlorosis, while in vivo S-nitrosylation of SEC23 (protein transport), ubiquitinyl hydrolase 1, and pathogenesis-related protein 1 was confirmed, with their expressions upregulated in Cd-induced PCD but downregulated by NO treatment (consistently observed in tomato seedlings with elevated S-nitrosylation levels). Building on this foundation, further investigation using GSNOR (S-nitrosoglutathione reductase, a key regulator of NO homeostasis) and LCD (L-cysteine desulfhydrase, a core enzyme for H₂S biosynthesis) knockout and overexpressing transgenic tomato (Solanum lycopersicum L.) demonstrated that both GSNOR and LCD inhibit Cd²⁺-induced PCD. GSNOR and LCD knockout plants exhibited increased Cd sensitivity and enhanced cell death compared to wild-type controls. Mechanistically, S-nitrosylation of GSNOR at Cys47 and LCD at Cys225 altered their subcellular localization, reduced their enzymatic activities, promoted Cd²⁺ uptake, and thereby accelerated PCD. Notably, S-nitrosylation attenuated the interaction between GSNOR and LCD during PCD progression. Collectively, our findings establish that NO modulates Cd-induced PCD via protein S-nitrosylation, and GSNOR-LCD interactions, together with their post-translational S-nitrosylation, constitute a critical regulatory node integrating NO and H₂S signaling in plant responses to Cd stress. These results provide novel insights into the molecular network underlying heavy metal-induced PCD and the regulatory roles of S-nitrosylation in NO-H₂S crosstalk.

How to cite: Huang, D., Chai, Q., and Liao, W.: S-Nitrosylation of GSNOR and LCD integrates NO and H2S signaling to regulate cadmium-induced programmed cell death in tomato, EGU General Assembly 2026, Vienna, Austria, 3–8 May 2026, EGU26-7782, https://doi.org/10.5194/egusphere-egu26-7782, 2026.

EGU26-8245 | Orals | HS8.3.4

Divide or expand? Implications of root growth physiology for soil carbon inputs 

Tino Colombi, Anke Herrmann, Jonathan Atkinson, Rahul Bhosale, Sacha Mooney, Craig Sturrock, and Sofie Sjögersten

Plants and their ability to capture atmospheric CO2 are indispensable for the buildup of soil organic matter, underscoring their crucial role in terrestrial carbon cycling. Yet, the plant physiological processes regulating soil carbon inputs and their environmental controls remain severely underrepresented in soil carbon research, which limits our understanding of soil carbon sequestration potential across biomes and land uses. Root biomass constitutes a major input of organic matter to soil that is particularly difficult to estimate. Here, we outline a framework for the explicit integration of root growth physiology into soil carbon dynamics. Using data acquired in rice (Oryza sativa, L.), we provide mechanistic evidence that the expansion of cortical cells in growing roots is a key process determining the fate of the carbon plants allocate to their root system. We combined measurements of carbon partitioning between biomass formation and respiration in growing roots with three-dimensional quantifications of root cortical cell size using high resolution (1.8 μm) X-ray Computed Tomography. With increasing cortical cell size, indicating greater contribution of cell expansion over cell division to root growth, more carbon was allocated to root biomass formation and less to root respiration (R2 = 0.83). We then integrated our experimental findings with data obtained from the literature covering different land use types to highlight the fundamental importance of including root physiological processes in estimating soil carbon inputs. The established structural-functional relationships between root cortical cell size and carbon partitioning point out the paramount role of root physiology in improving our understanding and prediction of carbon fluxes and retention in plant-soil systems. We therefore propose that measurements of root cortical anatomy be included when assessing global change impacts on soil carbon inputs and the potential of soils to sequester carbon.

How to cite: Colombi, T., Herrmann, A., Atkinson, J., Bhosale, R., Mooney, S., Sturrock, C., and Sjögersten, S.: Divide or expand? Implications of root growth physiology for soil carbon inputs, EGU General Assembly 2026, Vienna, Austria, 3–8 May 2026, EGU26-8245, https://doi.org/10.5194/egusphere-egu26-8245, 2026.

Canopy water use efficiency (WUEc) is an important indicator for understanding the coupling between water and carbon processes in agroecosystems. In arid irrigation districts with shallow groundwater which is an important source of evapotranspiration (ET), previous studies have demonstrated that groundwater table depth (WTD) influences the crop water use efficiency. The dynamic response of water use efficiency at the maize canopy scale to WTD remains unclear, particularly regarding the physiological differences across growth stages, which is critical for understanding plant water-use regulation within the soil-plant-atmosphere continuum under shallow groundwater conditions. Based on eddy covariance observations from 2017 to 2019, along with ET partitioning and statistical modeling, this study systematically analyzed the variations in WUEc and its environmental drivers, with a focus on the stage-dependent responses of photosynthesis and transpiration to WTD. The results showed that average T/ET was 85.7% over the three growing seasons, while groundwater contribution to ET was 38.2%, 37.3%, and 29.9% in 2017, 2018, and 2019, corresponding to mean groundwater depths of 1.60 m, 1.76 m, and 1.81 m, respectively. Mean WUEc was 2.28 ± 0.75, 2.22 ± 1.14, and 3.43 ± 1.01 g C kg⁻¹ H₂O in the three years. The fluctuations in WTD significantly affected WUEc, especially in years with relatively low surface water input. The standardized WUEc (WUEz), which excluded the effects of crop development and atmospheric evaporative demand, decreased with deepening WTD during the vegetative growth stage but increased during the reproductive stage. This shift stemmed from the differential sensitivity of canopy photosynthesis and transpiration to WTD at each stage. During the vegetative stage, a deepening WTD caused the standardized photosynthesis (NEPz) to decline more sharply than transpiration (Tz), reducing WUEz. In contrast, during the reproductive stage, both NEPz and Tz increased in response to a deeper WTD, but the greater increase in NEPz led to an overall rise in WUEz. This study reveals a previously unreported, stage-dependent pattern in how crop water-carbon coupling responds to variations in groundwater depth. Our findings provide critical empirical evidence for refining the representation of plant water use regulation under soil water stress in ecohydrological models.

How to cite: Wu, P. and Huo, Z.: Stage-dependent response of maize canopy water use efficiency to groundwater depth: insights from ecosystem flux observations, EGU General Assembly 2026, Vienna, Austria, 3–8 May 2026, EGU26-9393, https://doi.org/10.5194/egusphere-egu26-9393, 2026.

EGU26-11319 | ECS | Orals | HS8.3.4

Earthworm and Plant Root Bioturbation Succession in Compacted Soil Revealed by 2D Rhizobox and X-ray CT Imaging 

Oliver Clark-Hattingh, Conor Wright, Ehsan Nazemi, Fernando Alvarez Borges, Chris Sandom, Tiina Roose, Daniel McKay Fletcher, Katherine A Williams, and Siul Ruiz

Soil structure plays a vital role in ecosystem functioning. Earthworms and plant roots are key bioturbation agents crucial to building and maintaining soil structure suitable for agriculture. However, following soil compaction, the succession of biophysical activity between these agents remains unclear and understanding this dynamic is critical for sustainable soil management.  This study utilised imaging techniques to assess how compaction affects bioturbation by endogeic earthworms and barley roots and their impact on soil functionality (e.g. hydraulic conductivity, water retention, etc.). To this end, two experimental systems were established: (i) rhizoboxes for 2D imaging, photographed regularly over a six-weeks, and (ii) PVC cylinders for X-ray computed tomography (XCT), scanned at trial end. Each system included compacted and uncompacted treatments, with earthworms and barley co-incubated. Compacted systems were surface loaded at 150kPa. Rhizobox imaging tracked biopore formation and interactions between bioturbation agents, while XCT provided high resolution 3D structural data subsequent to bioturbation. Image analysis involved segmenting biopores using thresholding and filtering techniques, such as median and Gaussian for the 2D images and non-local means for 3D XCT images. These methods enabled us to compare the structural characteristics of the biopore systems (i.e. number of biopores, branches, thickness, branch length, etc.). Both image types were skeletonised and combined with local thickness maps to extract the structural metrics assessed.  Results showed compaction reduced mean trends in earthworm bioturbation activity, while root activity largely stayed the same. The results from the XCT data showed that hydraulic conductivity increased markedly after bioturbation, increasing two orders of magnitude in uncompacted and three orders of magnitude in compacted soil. We concluded that for soil restoration, this suggests a sequential approach, with initial cover crop planting to alleviate compaction stress, enabling earthworms to proliferate and create the structure needed to maintain healthy soil functioning and productivity.

How to cite: Clark-Hattingh, O., Wright, C., Nazemi, E., Alvarez Borges, F., Sandom, C., Roose, T., McKay Fletcher, D., Williams, K. A., and Ruiz, S.: Earthworm and Plant Root Bioturbation Succession in Compacted Soil Revealed by 2D Rhizobox and X-ray CT Imaging, EGU General Assembly 2026, Vienna, Austria, 3–8 May 2026, EGU26-11319, https://doi.org/10.5194/egusphere-egu26-11319, 2026.

EGU26-11437 | ECS | Orals | HS8.3.4

Impact of heavy rainfall and liquid fertilizers on microbial communities and leachate in compost-amended soil 

Helena Vukosavljevic, Xin-Yuan Li, Miriam Monschein, Wisnu Adi Wicaksono, Josef Schneider, Gabriele Berg, and Samuel Bickel

Climate change is increasing risks to agriculture and soil stability, with soil erosion and flooding being significant global threats that reduce crop yields and degrade soil quality. Tightly correlated with the soil’s response to these changes are the impactful and diverse soil microbiota. As primary drivers of organic matter decomposition, microorganisms convert plant inputs into humus and cell residues. This enhances soil’s physical structure, improves pore formation, and consequently, water-retention and infiltration capacity.

To identify and model the effects of agricultural practices, the CARA project [1] is implementing bacterial traits to improve soil resilience under current and future rainfall conditions. This was achieved using a carefully designated rainfall simulator, capable of precisely regulating droplet size and precipitation intensity while maintaining natural terminal velocity, thereby enabling the recreation of various rainfall scenarios. Two scenarios were selected and tested on artificial soil columns with varying content of compost-based organic matter: a current scenario, relating to the precipitation events in Austria, and a future scenario, anticipating increased rainfall intensity and longer dry periods. Furthermore, certain soil columns were supplemented with animal- and plant-based liquid fertilizers to enhance microbial activity.

The aim was to assess the influence of microbial activity on soil structure and its capacity for water retention. We identified that the precipitation scenarios exhibited distinct microbiomes across the treatments and over time, with rainfall intensity influencing soil microbial communities by washing out specific taxa, such as Bacilli and Limnochordia, which were subsequently detected within the leachate. Validation experiments in microcosms confirm the observed evaporation reduction and the treatments with liquid fertilizer showed the highest water retention. Our findings offer a basis for evaluating microbiome-based strategies to enhance soil resilience under climate-driven changes in rainfall patterns.


[1] Climate change adaptation through flood-reducing agriculture (CARA): https://projekte.ffg.at/projekt/4754252


How to cite: Vukosavljevic, H., Li, X.-Y., Monschein, M., Wicaksono, W. A., Schneider, J., Berg, G., and Bickel, S.: Impact of heavy rainfall and liquid fertilizers on microbial communities and leachate in compost-amended soil, EGU General Assembly 2026, Vienna, Austria, 3–8 May 2026, EGU26-11437, https://doi.org/10.5194/egusphere-egu26-11437, 2026.

Plant roots draw soil water locally, increasing the moisture heterogeneity in the soil at the onset of drought. The resulting heterogeneity presents a major challenge for linking observed flux rates to measured soil moisture values using process-based models. As such, soil moisture heterogeneity is a key remaining hurdle to robust, mechanistic predictions of forest canopy fluxes under water limitation and a stubborn source of uncertainty in predictions of the future terrestrial carbon cycle.

Several recent theoretical advances in describing soil-root water flow at plant or larger scale despite heterogeneous moisture distributions (e.g., Hildebrandt et al., 2016; Vanderborght et al., 2021) share one potentially central feature: the conductance- or flux- weighting of water potential at the soil-root interface. Flux-weighted water potential may be a key concept capable of characterising the hydrodynamic state of the soil-plant system in a single value regardless of its instantaneous heterogeneity.

Given the apparent theoretical promise of this concept, we should ask whether we can infer its values from field observations and, if so, what and how to measure. The challenges of directly measuring plant water potential over time are already daunting aboveground. Maintaining a dense network of probes for soil water content and water potential at substantial cost and effort may not yield relevant values, since the potential drop toward the root is nonlinear and largest over the final millimetres of soil. One potentially promising avenue for field observations is afforded by recent advances in optical methods both above and below ground. Separately, key parameters arising from the process-based models will need to be constrained in lab-based experiments. Collaborators within the ongoing HydroScale project aim to develop a complex approach combining traditional and innovative techniques sufficient to infer flux-weighted potentials from field data.

How to cite: Bouda, M.: Can we observe flow-weighted water potential at the root-soil interface in heterogeneously moist soils?, EGU General Assembly 2026, Vienna, Austria, 3–8 May 2026, EGU26-12198, https://doi.org/10.5194/egusphere-egu26-12198, 2026.

EGU26-12447 | ECS | Orals | HS8.3.4

Root Hairs as an Integral Buffer in Stomatal Control of Plant Water Status 

Florian Stoll, Patrick Duddek, and Andrea Carminati

Root hairs are assumed to enhance plant water uptake by increasing root surface area and effective root radius, thereby reducing dissipation of soil water potential in the rhizosphere and increasing transpiration. However, recent field observations indicate that their dominant hydraulic role emerges at short time scales through dynamic regulation of the soil–plant system rather than through steady-state flux enhancement.

Field measurements show that transpiration rates scale with soil texture, with plants in coarse-textured soils transpiring at lower rates than those in finer soils. This reduction reflects longer-term structural and physiological adjustment of the plant (e.g. shoot–root allocation), rather than short-term stomatal control. In contrast, steady-state transpiration has little sensitivity to the presence or absence of root hairs. Instead, plants lacking root hairs exhibit rapid and pronounced dissipation and oscillations of leaf water potential during periods of high atmospheric vapor pressure deficit, particularly in coarse-textured soils. These fluctuations occur on time scales of minutes to tens of minutes, overlapping with typical stomatal response times. In contrast, plants with root hairs showed smooth, non-oscillatory leaf water potential dynamics.

We propose that the most prominent hydraulic effect of root hairs is to buffer excessive oscillations in leaf water potential that are too fast compared to stomatal response kinetics. Root hairs introduce a physical buffering component by increasing the volume of water that can be extracted from the rhizosphere. In this way root hairs integrate short-term fluctuations in transpiration demand and damp rapid water potential changes. In the absence of root hairs, this buffering term is missing, leaving the system vulnerable to high-frequency disturbances that outpace stomatal adjustment.

To investigate this mechanism, we develop a mechanistic soil–plant hydraulic model that explicitly represents rhizosphere processes associated with root hairs and couples them with a dynamic stomatal response model. The model resolves transient water flow and storage and is used to quantify how root hairs modify system capacitance, damping, and stability across soil textures and atmospheric demand.

By focusing on transient dynamics rather than steady-state fluxes, this modelling study advances fundamental understanding of root water uptake regulation and highlights the rhizosphere as a key hydraulic bottleneck which affects the whole plant hydraulic system.

How to cite: Stoll, F., Duddek, P., and Carminati, A.: Root Hairs as an Integral Buffer in Stomatal Control of Plant Water Status, EGU General Assembly 2026, Vienna, Austria, 3–8 May 2026, EGU26-12447, https://doi.org/10.5194/egusphere-egu26-12447, 2026.

EGU26-13463 | ECS | Orals | HS8.3.4 | Highlight

The Timing of Soil Hydraulic Constraints Shapes Plant Drought Responses 

Saniv Gupta, Andreas J. Wild, Alica Heid, Jessica Thiel, Jonas Humpert, Martin Wiesmeier, Tillmann Lueders, Johanna Pausch, Benjamin Hafner, and Mohsen Zare

As soils dry, soil hydraulic conductivity (Ks) declines nonlinearly and can become a dominant bottleneck to root water uptake, constraining plant gas exchange. Although drought regulation involves both physiological and structural mechanisms, it remains unclear how these mechanisms differ between plants exposed to drought during early development versus at later developmental stage, and how soil texture and its hydraulic behavior shape regulation of soil–plant water relations. The objective of this study was to resolve how the timing of drought exposure reorganizes regulation of the soil–plant–atmosphere continuum (SPAC). Specifically, we aimed to (i) compare drought imposed from early vs at late developmental stage in terms of their reliance on physiological versus structural mechanisms of water-use regulation, and (ii) assess how soil texture and hydraulic trajectories condition these mechanisms.

We addressed these objectives using a controlled phenotyping experiment with six maize genotypes (three landraces and three hybrids) grown in contrasting soil textures (sandy loam and silt loam). Drought was imposed either continuously from the onset of growth or at later stage of plant development. Whole-plant transpiration, plant and soil water potentials, and above- and belowground structural traits were quantified to resolve SPAC regulation under contrasting drought timings.

Across soils and genotypes, transpiration declined to comparable fractions of its maximum within a narrow range of Ks, despite large differences in soil water content (θ) and matric potential (Ψsoil) between sandy loam and silt loam, this identifies Ks rather than θ or Ψsoil as the dominant physical control governing transpiration downregulation. Additionally, SPAC regulation differed strongly with drought timing. Under drought, imposed from early development, plants primarily reduced whole-plant water use through structural downscaling, characterized by reduced shoot area and increased root-to-shoot ratios, while maintaining relatively high transpiration rates per unit leaf area. In contrast, plants exposed to drought at later stage retained larger shoot area but reduced transpiration predominantly through strong stomatal regulation, resulting in lower transpiration rates per unit leaf area at comparable Ks and xylem water potential.

Belowground responses mirrored these contrasting strategies. Drought from onset promoted coordinated structural adjustment, including higher total root length, finer mean root diameters, and enhanced rhizosheath formation relative to late drought. These traits increased effective uptake surface area and were associated with higher soil–plant hydraulic conductance under low Ks. Across soils, high-performing plants converged on a common belowground trait syndrome, characterized by high total root length, fine roots, and enhanced rhizosheath formation, although the genotypes expressing this syndrome differed between soil textures.

Overall, our findings show that drought responsiveness emerges from the interaction between the soil’s hydraulic limit and its timing during development. Accounting for the temporal dynamics of hydraulic constraint, rather than treating drought as a static stress, providing a mechanistic framework to link soil texture, plant traits, and genotypic performance, with implications for targeted breeding and improved crop resilience under increasing climate extremes.

How to cite: Gupta, S., Wild, A. J., Heid, A., Thiel, J., Humpert, J., Wiesmeier, M., Lueders, T., Pausch, J., Hafner, B., and Zare, M.: The Timing of Soil Hydraulic Constraints Shapes Plant Drought Responses, EGU General Assembly 2026, Vienna, Austria, 3–8 May 2026, EGU26-13463, https://doi.org/10.5194/egusphere-egu26-13463, 2026.

EGU26-14102 | ECS | Posters on site | HS8.3.4

Relations of salinity and soil physico-chemical and hydraulic properties in the Salar del Huasco, Chile 

Carolina Giraldo, Cristina P. Contreras, Sara E. Acevedo, Sarah Leray, Amanda Peña, and Francisco Suárez

High-Andean wetlands in northern Chile are fragile arid ecosystems that sustain biodiversity, water resources, and cultural heritage. These systems are increasingly threatened by climate change, water scarcity, and mining activities. Despite their ecological relevance, soil properties and their spatial variability in these environments remain poorly characterized. This study investigates the relationship between soil salinity and physical, chemical, and hydraulic properties in the Salar del Huasco salt flat. A combined field and laboratory approach was employed. In-situ measurements were conducted during the dry season and included soil moisture, soil temperature, electrical conductivity, and saturated hydraulic conductivity at a depth of 5 cm. Laboratory analyses compromised pH, organic matter content, cation exchange capacity, soluble cations, and aggregate stability. Field results showed that, in general, soil water content and electrical conductivity were higher in areas closer to water bodies, while soil temperature was lower. In the eastern and western zones, located very close to water bodies, soil water content reached 0.17 and 0.23 m³ m⁻³, electrical conductivity values were 1,435.05 and 1,429.42 µS cm⁻¹, and soil temperatures were 16.72 and 15.86 °C, respectively. In contrast, the northern zone exhibited lower soil water content (0.14 m³ m⁻³) and electrical conductivity (444 µS cm⁻¹). Regarding hydraulic properties, the northern zone showed the highest saturated hydraulic conductivity (0.0043 cm s⁻¹), whereas the southern zone exhibited the lowest value (0.0002 cm s⁻¹). Laboratory results indicated predominantly saline soils, characterized by a mean pH of 9.73 (± 0.59) and an average electrical conductivity of 1,167.84 (± 1,288.72) µS cm-1. Among soluble cations, sodium was the dominant species, exhibiting the highest mean concentration (330.17 ± 208.27 meq L⁻¹), followed by potassium (67.65 ± 75.30 meq L⁻¹). In contrast, calcium and magnesium showed comparatively lower mean concentrations of 19.72 ± 15.15 meq L⁻¹ and 11.15 ± 13.44 meq L⁻¹, respectively. Regarding anions, chloride and sulfate were the most abundant, with mean concentrations of 203.51 ± 169.18 meq L⁻¹ and 214.46 ± 155.65 meq L⁻¹, respectively, whereas bicarbonate concentrations were markedly lower (9.23 ± 6.15 meq L⁻¹). Aggregate stability ranged from low to moderate, with an average value of 50 ± 17 %. Marked spatial differences were observed across the salt flat. The northern zone exhibits higher aggregate stability (72%), sand content (71%). In contrast, the southern zone showed higher electrical conductivity (10,486 µS cm-1), silt content (49%), and higher concentrations of soluble calcium (37 meq/L), magnesium (35.42 meq/L), sodium (425.67 meq/L), bicarbonates (11.2 meq/L), and chlorides (356.57 meq/L). The western zone presented the highest pH (10.06), while the eastern zone displayed intermediate values for most variables. These results revealed pronounced spatial heterogeneity in soil properties within the Salar del Huasco salt flat, suggesting differentiated hydro-saline dynamics at the sub-basin scale. Accounting for this variability is essential to support conservation strategies and the sustainable management of high-Andean wetlands under increasing environmental pressure.

How to cite: Giraldo, C., Contreras, C. P., Acevedo, S. E., Leray, S., Peña, A., and Suárez, F.: Relations of salinity and soil physico-chemical and hydraulic properties in the Salar del Huasco, Chile, EGU General Assembly 2026, Vienna, Austria, 3–8 May 2026, EGU26-14102, https://doi.org/10.5194/egusphere-egu26-14102, 2026.

EGU26-14212 | Orals | HS8.3.4

Ecotones as biological outcomes: spatial variation in tree water use across a boundary of a fog forest. 

Aurora Gaxiola, Víctor García, Álvaro Gutiérrez, and Adrian Rocha

Semi-arid coastal basins where fog sustains fragmented forest patches provide a powerful natural laboratory for examining how vegetation–microclimate feedbacks shape ecotone position and stability. Yet most studies of woodland–open vegetation transitions treat ecotones as passive boundaries imposed by climate or soil conditions, rather than as zones where plant water-use strategies may actively reinforce or relax those boundaries. Here, a coastal Chilean fog forest–shrub ecotone is used to evaluate whether tree water can biologically promote ecotone persistence.

We studied fog-fed relict forests of the endemic temperate tree species Aextoxicon punctatum found on mountain tips of the semiarid coast of central Chile. We quantified sap flux and microclimatic conditions along a transect spanning forest edge to interior, using long-term sap flow measurements from 13 trees of A. punctatum, the dominant tree species in these forest patches, combined with continuous records of temperature, humidity, and vapor pressure deficit (VPD). This design allowed us to assess how tree water use responds to contrasting microclimatic environments across the ecotone.

We found strong edge-to-interior gradients in microclimate, with forest edges experiencing higher temperatures, higher VPD, and greater microclimatic variability than the forest interior. Correspondingly, tree water use differed systematically with tree position along the edge-to-interior gradient. Edge trees exhibited distinct seasonal dynamics and greater sensitivity to atmospheric conditions compared to interior individuals, particularly during periods of higher water availability. Contrary to expectations for a strictly water-limited temperate system, tree water use peaked during cool, foggy autumn and winter months, and contrasts between edge and interior trees were strongest during periods of high water availability, when trees used water most liberally. These patterns indicate that trees occupying different positions within the ecotone persist under contrasting physiological constraints and capacities.

Together, these results support the idea that forest–shrub ecotones are not merely passive boundaries imposed by climate, but may be biologically reinforced by spatial variation in tree water-use strategies. We further suggest that tolerance to edge microclimates, potentially coupled with the ability to exploit non-rain water inputs, may contribute to the persistence and resilience of fog-inundated forest patches. This perspective highlights ecotones as dynamic zones where individual-level physiological performance shapes vegetation boundaries, with implications for predicting coastal dry–humid transitions under climate change.

How to cite: Gaxiola, A., García, V., Gutiérrez, Á., and Rocha, A.: Ecotones as biological outcomes: spatial variation in tree water use across a boundary of a fog forest., EGU General Assembly 2026, Vienna, Austria, 3–8 May 2026, EGU26-14212, https://doi.org/10.5194/egusphere-egu26-14212, 2026.

EGU26-15088 | ECS | Orals | HS8.3.4

Rooted in reciprocity: interactions and feedbacks in the soil-plant hydraulic continuum 

Zishu Tang, Manon Sabot, Ana García Leher, Anke Hildebrandt, Antonia Pachmann, Anne Verhoef, Enrico Weber, and Max Wittig

Soils play a critical role in regulating plant water availability, with characteristics like bulk density, porosity, and texture determining soil hydraulic properties, that is, properties that affect the soil water retention and water transport. Together with mycorrhizal activity, which influences the conductance of water between the soil and the roots, soil hydraulic properties affect the ease with which plants can access soil water. In turn, root growth also modifies soil structures and mycorrhizal communities, influencing soil water retention and soil hydraulics. Despite a good theoretical understanding of the dynamic interactions between soils and plants, limited information is available on: (i) how much soil texture affects plant hydraulic properties across plant species; and (ii) how much plant roots affect soil hydraulic properties across soil textures. To assess the extent of the feedback loop between soil and plant hydraulics, we transplanted 4-year-old Quercus robur (N=12) and Quercus cerris (N=12) saplings into either a loam or a clay loam, in equal numbers for each species. Following an acclimation period of three to five months, a total of 28 soil water retention curves were measured from soil cores collected at depths of 7-12 cm, 25-30 cm, and 55-60 cm in the vicinity of the trees (i.e., likely to contain root fragments, mycorrhiza, etc.). We measured a further eight water retention curves in the absence of trees, allowing the determination of a baseline of soil hydraulic characteristics. Finally, after the soil sample collection, we established two hydraulic vulnerability curves per tree. Preliminary results show no indication of plant hydraulic acclimation to soil under well-watered conditions. The presence of tree roots affected soil bulk density at depth in the loam, as well as hydraulic properties like the field capacity at -33 kPa and the permanent wilting point, but not in the clay loam. Whether these effects are the same after longer acclimation periods or under water-stress conditions remains to be determined.

How to cite: Tang, Z., Sabot, M., García Leher, A., Hildebrandt, A., Pachmann, A., Verhoef, A., Weber, E., and Wittig, M.: Rooted in reciprocity: interactions and feedbacks in the soil-plant hydraulic continuum, EGU General Assembly 2026, Vienna, Austria, 3–8 May 2026, EGU26-15088, https://doi.org/10.5194/egusphere-egu26-15088, 2026.

EGU26-15727 | Orals | HS8.3.4

Soil Structure under No-Tillage Enhances Soybean Root Growth and Access to Subsoil Water 

Moacir Tuzzin de Moraes, Luiz Henrique Quecine Grande, John Kennedy dos Santos, Matheus Batista Neri Pereira, Renato Paiva de Lima, Alvadi Antonio Balbinot Junior, and Henrique Debiasi

Soil structure can mitigate both mechanical impedance and water stress, thereby modulating root elongation and access to deep soil water. Although process-based root growth models represent soil–root interactions, they rarely account explicitly for structural conditions and their consequences for the combined effects of water and mechanical stresses on root growth. We quantify how soil structure under no-tillage influences soybean root elongation, effective rooting depth, and water-deficit mitigation, and we parameterize these effects in a biophysical root-growth model. A long-term field experiment established in 2016 compared three cropping systems preceding soybean (Glycine max): ruzigrass (Urochloa ruziziensis), maize (Zea mays), and fallow. Soybean root length density and soil physical attributes were measured in nine layers down to 210 cm. Effective rooting depth was defined as the depth containing 95% of total root length. Plant-available water was computed from soil water retention between −60 and −15,000 hPa, and readily available water was assumed as 50% of plant-available water within the rooted zone. Grain yield was determined at harvest. In addition, soybean root elongation rate was measured in the laboratory using core from field and repacked samples across gradients of degree of saturation and soil penetration resistance. The structural effect was incorporated as a parameter in a biophysical model that combines water and mechanical limitations to root elongation. Increasing soil penetration resistance from 1.0 to 3.5 MPa reduced relative root elongation by 46% in preserved structure, whereas reductions reached 76% in repacked soil. At 0.5 MPa and 60% degree of saturation, elongation in repacked soil was 29% higher than in preserved structure, but both structural conditions converged as soil penetration resistance increased to 1.0 MPa. Under 90% degree of saturation, elongation in preserved structure was nearly threefold that in repacked soil. In the field, effective soybean rooting depth (in a trench of 210 cm depth) differed among previous cropping systems, with ruzigrass promoting substantially deeper roots (154.7 cm at 95% cumulative distribution) compared with maize (127.9 cm) and fallow (121.0 cm). Root length density in the 0 to 10 cm layer was highest after ruzigrass (4.72 cm cm-3), followed by maize (3.33 cm cm-3) and fallow (2.48 cm cm-3). Cumulative root length in the soil profile from 0 to 210 cm reached 202.2 cm cm-2 after ruzigrass, compared with 128.4 cm cm-2 after maize and 94.3 cm cm-2 after fallow. Soybean yield was 2.9 (after ruzigrass), 2.6 (after maize), and 2.1 Mg ha-1 (after fallow). Plant-available water in the soybean root zone was 175 mm after ruzigrass, compared with 145 mm after maize and 140 mm after fallow, indicating a 25% increase relative to fallow. Assuming evapotranspiration of 7 mm d-1, this represents approximately 15 days of water supply after ruzigrass versus 12 days after fallow. Preserved soil structure improved soybean root performance under strong physical constraints and increased deep water access. Explicitly representing soil structural conditions in simulation models can improve predictions of rooting depth and drought mitigation under no-tillage.

Acknowledgements: AGRISUS Foundation [PA 3534/23], CNPq [409621/2023-4] and FAPESP [23/10427-3 and 23/11945-8].

How to cite: Tuzzin de Moraes, M., Quecine Grande, L. H., dos Santos, J. K., Batista Neri Pereira, M., Paiva de Lima, R., Balbinot Junior, A. A., and Debiasi, H.: Soil Structure under No-Tillage Enhances Soybean Root Growth and Access to Subsoil Water, EGU General Assembly 2026, Vienna, Austria, 3–8 May 2026, EGU26-15727, https://doi.org/10.5194/egusphere-egu26-15727, 2026.

EGU26-15862 | ECS | Posters on site | HS8.3.4

Interactive Effects of Plant Growth-Promoting Rhizobacteria and CO2 levels on Prince Ginseng Health and Quality 

Wen Hui Yan and Charles Wang Wai Ng

The cultivation of medicinal plants focuses not only on biomass yield, but also on the health and quality of medicinal organs with therapeutic effects. Threatened by soil-borne pathogenic fungi Fusarium, the health and quality of Prince Ginseng Pseudostellaria heterophylla (P. heterophylla) is severely reduced. Plant growth-promoting rhizobacteria (PGPR), as a promising sustainable alternative, have demonstrated potential for biocontrol and soil fertilisation. However, PGPR efficacy is significantly influenced by abiotic factors, such as atmospheric CO2 concentration, which govern plant growth. To investigate the interactive effects of PGPR (Bacillus subtilis and Pseudomonas fluorescens) and CO2 levels (425 ppm and 1000 ppm) on P. heterophylla tuber health and quality, greenhouse experiments were conducted. Results show that Pseudomonas fluorescens, coupled with elevated CO2, synergistically decreases tuber disease incidence by 73% and increases the content of active ingredient polysaccharide by 253%. These improvements can be attributed to the suppressed abundance of Fusarium oxysporum and enhanced root development. Biocontrol bacteria, including Actinobacteria and Proteobacteria, are recruited, especially the genera Bradyrhizobium and Rhodanobacter. The reshaping of the rhizosphere microbiome is accompanied by the upregulation of biological pathways related to metabolite biosynthesis in the rhizosphere. Furthermore, increased indole-3-acetic acid production by PGPR under elevated CO2 signficantly promote root growth. Together, PGPR, particularly Pseudomonas, synergistically interact with elevated CO2 to enhance the health and quality of Prince Ginseng. This study sheds light on how PGPR interacts with abiotic factors influencing plant growth, providing a strategic framework for the sustainable cultivation of high-quality medicinal plants. 


The authors would like to acknowledge the financial support provided by the State Key Laboratory of Climate Resilience for Coastal Cities (ITC-SKLCRCC26EG01) and the Research Grants Council of HKSAR (C5033-23G).

How to cite: Yan, W. H. and Ng, C. W. W.: Interactive Effects of Plant Growth-Promoting Rhizobacteria and CO2 levels on Prince Ginseng Health and Quality, EGU General Assembly 2026, Vienna, Austria, 3–8 May 2026, EGU26-15862, https://doi.org/10.5194/egusphere-egu26-15862, 2026.

EGU26-15878 | ECS | Posters on site | HS8.3.4

Effects of Fertiliser Placement on Soil Osmotic Suction and Growth of Pseudostellaria heterophylla 

Lingga Ekaputra Lucky Suryajaya, Wen Hui Yan, and Charles Wang Wai Ng

Pseudostellaria heterophylla (P. heterophylla) is a widely used Traditional Chinese Medicine plant for human healthcare due to the enriched bioactive compounds in its tubers. Sustained market demand has led to large-scale artificial cultivation of P. heterophylla, where soil nutrient use efficiency is one of the essential factors affecting plant growth. However, how fertiliser placements influence plant growth by altering soil water potential in the root zone remains mechanistically unclear, particularly with respect to osmotic effects. This study aims to investigate the effects of two fertiliser placements, i.e., broadcast and banded treatments, on the growth of P. heterophylla. Fertiliser-induced soil osmotic suction will be monitored, and soil nutrient use efficiency will be analysed during plant growth. By analysing soil osmotic suction and plant characteristics, this work will elucidate how fertiliser placement affects plant growth by altering soil osmotic suction in the root zone. The outcomes of this study are expected to provide practical guidance on fertiliser placements for the artificial cultivation of medicinal plants and insights into soil–plant interactions governed by soil osmotic conditions.


The authors would like to acknowledge the financial support provided by the State Key Laboratory of Climate Resilience for Coastal Cities (ITC-SKLCRCC26EG01) and the Research Grants Council of HKSAR (C5033-23G).

How to cite: Suryajaya, L. E. L., Yan, W. H., and Ng, C. W. W.: Effects of Fertiliser Placement on Soil Osmotic Suction and Growth of Pseudostellaria heterophylla, EGU General Assembly 2026, Vienna, Austria, 3–8 May 2026, EGU26-15878, https://doi.org/10.5194/egusphere-egu26-15878, 2026.

EGU26-16718 | ECS | Orals | HS8.3.4

Disentangling hyphal- and root-derived contributions to dissolved organic carbon in mixed tree systems 

Ramona Werner, Marc Goebel, Andre Kessler, and Taryn Bauerle

Soils represent the largest terrestrial reservoir of organic carbon, with dissolved organic matter (DOM) acting as its most mobile and reactive fraction and the immediate precursor to mineral-associated organic matter, the dominant long-term carbon pool. While DOM dynamics have been extensively studied in bulk soil and the rhizosphere, the hyphosphere—soil influenced by fungal hyphae—remains comparatively understudied, despite the extraordinary spatial reach, rapid turnover, and mineral surface interactions of mycorrhizal fungi. Disentangling root- versus hyphal-derived dissolved organic carbon (DOC) inputs is therefore critical for understanding how recent plant carbon is redistributed and stabilized in soils.

Here, we applied a nested ingrowth core system to experimentally separate rhizosphere and hyphosphere DOC pools under semi-controlled greenhouse conditions. The system consisted of an outer mesh core permitting root and hyphal access and an inner fine-mesh core allowing hyphal ingrowth only, both filled with inert sand. Ingrowth cores were installed in pots containing native tree species planted in monocultures and mixtures. At harvest, distinct sand fractions representing bulk sand, rhizosphere, and hyphosphere subsets were recovered and extracted for total organic carbon (TOC) analysis; samples are being further characterized using untargeted metabolomics.

Preliminary results indicate clear differences in TOC concentrations among compartments, with highest values in rhizosphere samples, intermediate values in the hyphosphere, and lowest concentrations in bulk sand. Species composition exerted a strong influence on total TOC concentrations, and root ingrowth into the outer cores varied markedly among species. Metabolomic analyses are currently in progress and will be used to further assess compositional differences between rhizosphere- and hyphosphere-derived DOC.

Together, this work highlights the hyphosphere as a distinct and experimentally accessible domain of DOC production and underscores the need to explicitly consider fungal pathways when linking fresh carbon inputs to persistent soil organic matter formation.

How to cite: Werner, R., Goebel, M., Kessler, A., and Bauerle, T.: Disentangling hyphal- and root-derived contributions to dissolved organic carbon in mixed tree systems, EGU General Assembly 2026, Vienna, Austria, 3–8 May 2026, EGU26-16718, https://doi.org/10.5194/egusphere-egu26-16718, 2026.

EGU26-16759 | Posters on site | HS8.3.4

Experimental Assessment of the Effects of a Lignin-Based Hydrogel on Saturated Hydraulic Conductivity in Soils with Different Textures 

Justína Vitková, Peter Šurda, Monica S. Chandramohan, Katarzyna Grygorczuk-Płaneta, and Katarzyna Szewczuk-Karpisz

Climate change represents a major environmental challenge that adversely affects soil hydrological regimes and water availability for plants. The increasing frequency and intensity of drought events lead to reduced soil moisture, limited infiltration, and deterioration of soil hydrophysical properties, thereby directly constraining crop growth, development, and yield potential. Insufficient soil water availability disrupts key physiological processes in plants, restricts nutrient uptake, and increases vulnerability to abiotic stress.

One promising adaptation strategy to mitigate the adverse effects of drought is the application of hydrogels in agricultural systems. Hydrogels are polymeric materials capable of absorbing and retaining large amounts of water within their structure and subsequently releasing it gradually into the surrounding soil environment. When incorporated into soil, hydrogels can improve soil water regimes and potentially enhance soil hydrophysical properties.

In this study, two soils differing in texture (sandy clay and sandy loam) and a lignin-based hydrogel at 2% application rate were investigated under laboratory conditions. Four incubation periods were established to evaluate the temporal effects of hydrogel application: 1 day, 1 month, 3 months, and 6 months. Saturated hydraulic conductivity was determined using the falling head method.

The results demonstrated that, in sandy clay soil, increasing incubation duration resulted in a statistically significant increase in saturated hydraulic conductivity, ranging from 400 to 800%. In contrast, sandy loam soil exhibited a statistically non-significant decrease (3–10%) during the initial incubation stages, followed by a statistically significant increase of approximately 60% after 6 months. These findings indicate that hydrogel incubation time in combination with soil texture is a key determinant of both the direction and magnitude of hydrogel effects on soil hydrophysical properties.

Overall, the application of lignin-based hydrogels may represent an innovative approach to enhancing agroecosystem resilience to climate change and drought, while supporting sustainable soil and water management at the landscape scale.


Keywords: hydrogel, saturated hydraulic conductivity, drought, climate change


Acknowledgement: The authors would like to thank the National Agency of Academic Exchange for the financial support (NAWA, Strategic Partnerships, BNI/PST/2023/1/00108) and the Scientific Grant Agency (VEGA 2/0065/24).

How to cite: Vitková, J., Šurda, P., S. Chandramohan, M., Grygorczuk-Płaneta, K., and Szewczuk-Karpisz, K.: Experimental Assessment of the Effects of a Lignin-Based Hydrogel on Saturated Hydraulic Conductivity in Soils with Different Textures, EGU General Assembly 2026, Vienna, Austria, 3–8 May 2026, EGU26-16759, https://doi.org/10.5194/egusphere-egu26-16759, 2026.

EGU26-16789 | ECS | Posters on site | HS8.3.4

Observing invisible bridges: Non-invasive imaging of arbuscular mycorrhizal fungal structures in soil pore space 

Henri Braunmiller, Nicolai Koebernick, Michael Bitterlich, Eva Jacob, Anna Heck, Andrea Schnepf, Johanna Pausch, Jan Jansa, and Mutez Ahmed

Arbuscular Mycorrhizal Fungi (AMF) are plant symbionts that colonize the root cortex, but also extend their extraradical hyphal networks deep into the soil. These networks increase root-soil contact, modify soil structure and facilitate water- and nutrient transport towards the root. The fine, almost “invisible” bridges formed by these networks may gain relevance when soil becomes dry and water and nutrient resources scarce. Their pore-bridging function may connect the roots to soil patches containing water and nutrient resources, potentially preventing root shrinkage while maintaining transport.

Only recently, a high-resolution non-invasive imaging tool became available that now allows us to study the fine, delicate AMF structures in pore space in situ. Here we are presenting a workflow based on synchrotron-based X-ray computed microtomography  imaging. We have developed setups to cultivate AMF at different levels of biotic complexity and subsequently image and analyze AMF hyphosphere and rhizosphere structures quantitatively and non-invasively. This approach has been successfully applied to two AMF species in contrasting soil textures, namely sand and loam. We present the 3D results of key architectural and morphological traits of AMF spores, hyphae and intraradical structures. These include structure counts, total hyphal length, branching frequency, volume, and surface area. Moreover, this study measured a set of novel parameters: (i) the AMF-soil and AMF-root interface areas, and (ii) the AMF pore space occupancy. These data can be linked to hyphal length densities measured destructively, as well as to the plant-scale data such as shoot biomass, C-, N- and P-contents in the leaves, and stomatal conductance.

How to cite: Braunmiller, H., Koebernick, N., Bitterlich, M., Jacob, E., Heck, A., Schnepf, A., Pausch, J., Jansa, J., and Ahmed, M.: Observing invisible bridges: Non-invasive imaging of arbuscular mycorrhizal fungal structures in soil pore space, EGU General Assembly 2026, Vienna, Austria, 3–8 May 2026, EGU26-16789, https://doi.org/10.5194/egusphere-egu26-16789, 2026.

EGU26-16810 | ECS | Posters on site | HS8.3.4

Impact of lignin-based hydrogel on wheat growth on different soil types 

Katarzyna Szewczuk-Karpisz, Sylwia Kukowska, Marina Kyrychenko-Babko, and Olena Siryk

The application of hydrogels in soils is intended to enhance water-holding capacity, improve nutrient accessibility, and strengthen soil structure, thereby supporting plant growth and long-term soil sustainability. Therefore, we examined the impact of lignin-based hydrogel on the water evapotranspiration and wheat growth on four Polish soils: two forest soils (collected from Lasy Janowskie and Maziarnia) and two agricultural soil (from Grodzisko Górne and Lublin), as well as its degradation degree. Evapotranspiration measurements were conducted for 21 days, whereas wheat growth and hydrogel degradation were monitored at 1 day, 1 month, 3 months, and 6 months. Wheat growth experiment was conducted in a phytotron, under drought conditions.

Hydrogel degradation studies showed variability depending on soil type. The most pronounced increase in mass loss over time occurred in the soils collected from Lasy Janowskie and Maziarnia sites, while the soils from Grodzisko Górne and Felin-Lublin showed comparatively limited changes, indicating higher durability of hydrogel in agricultural soils. Evapotranspiration measurements showed that hydrogel reduced water loss over time in all soils. This phenomenon translated into increased height and dry mass of wheat shoots, especially in agricultural soils. For example, above-ground part of wheat grown in the soil from Felin-Lublin was 15.6 cm after incubation with hydrogel for 6 months, compared to the 10.5 cm in the not amended soil. On the other hand, a significant decrease of the height was observed for plants grown in the amended soil from Maziarnia (12.8 cm in the control, compared to 8.5 cm in amended soil).

Overall, the obtained results suggested that the lignin-based hydrogel can reduce water evapotranspiration from the soil, which in turn improves wheat growth on the selected soils types.


The research was founded by Polish National Agency for Academic Exchanges under Strategic Partnerships Program (BNI/PST/2023/1/00108).

How to cite: Szewczuk-Karpisz, K., Kukowska, S., Kyrychenko-Babko, M., and Siryk, O.: Impact of lignin-based hydrogel on wheat growth on different soil types, EGU General Assembly 2026, Vienna, Austria, 3–8 May 2026, EGU26-16810, https://doi.org/10.5194/egusphere-egu26-16810, 2026.

EGU26-17300 | Posters on site | HS8.3.4

Preferential rhizosphere rewetting in water repellent sandy soil 

Pascal Benard, Rong Jia, Sara Di Bert, Birgit Wassermann, Samuel Bickel, Anders Kaestner, Huadong Zang, and Andrea Carminati

In a large field trial on sandy loam, Lama et al. (2022)1- albeit involuntary - tested the effect of drought on the performance of 300 genotypes during two contrasting years: 2017 (cool and wet) and 2018 (hot and dry). Remarkably, some genotypes achieved yields under drought conditions (2018) comparable to established high-yielding varieties. The reason for this remains unclear.

One possible explanation is that this positive effect is linked to modifications of rhizosphere wettability. Sandy soils are known to be susceptible to water repellency upon drying, and several crops, such as maize, barley, and wheat, can modify soil wettability through root exudation2. However, it is still uncertain whether rhizosphere water repellency in sandy soils is an advantage, as it can delay rewetting and thereby reduce biological activity and potentially limit root water uptake.

In this study, we investigated the effect of rhizosphere-induced wettability modifications on water dynamics in naturally water-repellent sandy soil. Using time-series neutron radiography, we quantified rewetting dynamics following a dry-down experiment. While the bulk soil exhibited reduced rewetting, preferential rewetting was observed in the rhizosphere of maize. This finding may help to explain why certain plants benefit from reduced precipitation in sandy soils. Firstly, rewetting occurs preferentially in the rhizosphere, where it can directly support microbial activity and root water uptake. Secondly, localized rewetting may reduce nutrient leaching and promote nutrient retention and turnover through localized enzyme activity.


References

1. Lama, S., Vallenback, P., Hall, S. A., Kuzmenkova, M. & Kuktaite, R. Prolonged heat and drought versus cool climate on the Swedish spring wheat breeding lines: Impact on the gluten protein quality and grain microstructure. Food Energy Secur. 11, e376 (2022).

2. Naveed, M. et al. Surface tension, rheology and hydrophobicity of rhizodeposits and seed mucilage influence soil water retention and hysteresis. Plant Soil 437, 65–81 (2019).

How to cite: Benard, P., Jia, R., Di Bert, S., Wassermann, B., Bickel, S., Kaestner, A., Zang, H., and Carminati, A.: Preferential rhizosphere rewetting in water repellent sandy soil, EGU General Assembly 2026, Vienna, Austria, 3–8 May 2026, EGU26-17300, https://doi.org/10.5194/egusphere-egu26-17300, 2026.

EGU26-18106 | ECS | Posters on site | HS8.3.4

Mathematical Modelling of the Root-Mycorrhiza-Soil System System 

Anna Sophia Heck, Daniel Leitner, Henri Michael Braunmiller, Johanna Pausch, Mutez Ali Ahmed, Michael Bitterlich, Holger Pagel, and Andrea Schnepf

Arbuscular mycorrhizal fungi (AMF) are widespread symbiotic partners of most terrestrial plants and form close associations with their roots. While their role in enhancing nutrient uptake, particularly phosphorus, has been well studied, their effects on and of soil structure, and plant water uptake have not been investigated as broadly.

The complexity of interactions between plants, fungi, and soil under varying environmental conditions is difficult to disentangle experimentally. In-silico investigations offer an alternative means to explore these effects. We developed a 3D-model describing AMF colonization of a growing root structure and the growth of extraradical mycelium. We used the model to simulate how extraradical hyphae extend from colonized roots into the soil volume. The model is being implemented as an extension of CPlantBox, a functional-structural model for water and carbon processes at the whole-plant level.

Model parameterization is based on experimental and additional literature data. This includes information on root architecture, AMF colonization rates and locations, and nutrient transport and water flow in tomato plants and their associated hyphal networks. The plants were grown in sandy and loamy soils under both drought and well-watered conditions.

The 3D AMF colonization model explicitly represents hyphal extension rates, branching angles, and the spatial propagation of the extraradical mycelium from infection points along the root system. Key components of the model are the representation of the dynamics of root growth, growth of the intraradical and extraradical mycelium, anastomosis, and the ability of AMF hyphae to fuse and form complex networks.

The model is used to assess, visualize, and quantify how AMF networks develop, branch, and interconnect, providing mechanistic insight into their contribution to plant nutrition and drought tolerance.

How to cite: Heck, A. S., Leitner, D., Braunmiller, H. M., Pausch, J., Ahmed, M. A., Bitterlich, M., Pagel, H., and Schnepf, A.: Mathematical Modelling of the Root-Mycorrhiza-Soil System System, EGU General Assembly 2026, Vienna, Austria, 3–8 May 2026, EGU26-18106, https://doi.org/10.5194/egusphere-egu26-18106, 2026.

EGU26-18935 | ECS | Posters on site | HS8.3.4

Motile bacteria act as pump to move water through soil matrices 

Beatriz Meza-Manzaneque, Emma Gomez, Gloria de las Heras, Iker Martin Sanchez, Nicola Stanley Wall, Anke Lindner, Eric Clement, Natalia Elguezabal, and Lionel X. Dupuy

Rhizosphere microbiomes are known to enhance plants’ resistance to drought, and this effect has been mainly accredited to fungi and their capacity to transport and uptake water. Here, we studied how mechanical energy from motile bacteria can also contribute to water transport in soil, a mechanism we termed microbial pumps. We ran a series of microcosm and apparent surface tension experiments using different motility mutant strains of Bacillus subtilis, and characterised water transport in the pore space. Results confirmed that flagellar-based motility enhances the movements of water in soil reducing the apparent surface tension of the fluid and promotes the rewetting of dry hydrophobic regions of the soil. The effect was confirmed to be biomechanical because it was dependent on cell density and swimming speed. Collectively, these results highlight the potential of motile microorganisms to enhance water availability for crops.

How to cite: Meza-Manzaneque, B., Gomez, E., de las Heras, G., Martin Sanchez, I., Stanley Wall, N., Lindner, A., Clement, E., Elguezabal, N., and X. Dupuy, L.: Motile bacteria act as pump to move water through soil matrices, EGU General Assembly 2026, Vienna, Austria, 3–8 May 2026, EGU26-18935, https://doi.org/10.5194/egusphere-egu26-18935, 2026.

Seed Priming with Silver Ions Decreased Cadmium Absorption by Wheat Grains via Reactive Oxygen Species Generation
Chenghao Ge1, Yixuan Wang1, Dongmei Zhou1*,
1 State Key Laboratory of Pollution Control and Resource Reuse, School of the Environment, Nanjing University, Nanjing 210023, P.R. China
Contact Email: gech@nju.edu.cn
Tel: 13011701863

Abstract: Cadmium (Cd) contamination in wheat grains poses a serious threat to human health, making the development of low-cost and environmentally friendly strategies to reduce Cd accumulation in wheat a critical need. In this study, we demonstrate that priming wheat seeds with silver ions (Ag⁺) leads to the in-situ formation of silver nanoparticles (AgNPs), which function as ROS-generating nanoparticles to improve tolerance to Cd stress across seed, seedling, and mature plant stages. Seeds treated with 0.11 mg L⁻¹ Ag⁺ showed the highest hydrogen peroxide (H₂O₂) levels and the lowest tissue Cd concentrations during seedling growth. The application of diphenyleneiodonium chloride (DPI) during Ag⁺ priming suppressed H₂O₂ production and resulted in increased Cd uptake in seedlings. Notably, elevated H₂O₂ levels were maintained even during the grain-filling period in Ag⁺-primed plants. Transcriptomic analysis revealed that Ag⁺ priming induces extensive transcriptional reprogramming in wheat. KEGG pathway enrichment combined with quantitative real-time PCR indicated activation of stress-signaling and metal-absorption-related pathways, including plant hormone signal transduction and the MAPK signaling pathway. Furthermore, Ag⁺ priming modulated the expression of key Cd-related genes, downregulating the Cd transporter gene TaABCB11, while upregulating vacuolar sequestration genes (TaABCC9 and TaHMA3) and the cellular Cd export gene TaTM20. These changes suggest that Ag⁺ priming triggers a ROS-mediated stress response, establishing a “stress memory” that persists throughout the growth cycle, enhances Cd tolerance, and ultimately reduces grain Cd accumulation by 39.5% in pot trials and 26.4% in field experiments.

Keywords: Seed priming, stress memory, cadmium, sustainable agriculture
Chenghao Ge, postdoctor of Nanjing University, School of the Environment. His research topics are focused on the safe production in heavy metal-contaminated farmland.


How to cite: Ge, C.: Seed Priming with Silver Ions Decreased Cadmium Absorption by Wheat Grains via Reactive Oxygen Species Generation, EGU General Assembly 2026, Vienna, Austria, 3–8 May 2026, EGU26-18957, https://doi.org/10.5194/egusphere-egu26-18957, 2026.

EGU26-20137 | Orals | HS8.3.4

Root mucilage alters stomatal responses to soil and atmospheric drought 

Asegidew Akale, Gaochao Cai, Efstathios Diamantopoulos, Frederic Leuther, Lara Kersting, Scott McAdam, Shurong Liu, and Mutez A. Ahmed

Plants respond to soil and atmospheric water deficits through strategies such as stomatal regulation and belowground adaptations. Root mucilage buffers erratic fluctuations in the rhizosphere water content, yet its influence on soil hydraulic properties, especially unsaturated hydraulic conductivity, and stomatal regulation remains unknown. We hypothesized that mucilage facilitates water uptake by attenuating the drop in matric potential at the root–soil interface during soil and atmospheric drying. We measured the impact of various maize (Zea mays) mucilage contents (0.0%, 0.05%, 0.2%, and 0.4%) on the water retention and hydraulic conductivity of a loamy soil. Leveraging a soil–plant hydraulic model, we investigated the effects of mucilage contents on transpiration and stomatal responses under soil drying and increased vapor pressure deficit (VPD). Higher mucilage contents prevented sharp declines in unsaturated hydraulic conductivity as soils dried. Simulations revealed that higher mucilage contents delayed the onset of hydraulic stress (the threshold transpiration rate beyond which a small increase in transpiration would result in a disproportionate decline in leaf water potential), broadened the hydroscape zone, and shifted stomatal behavior from isohydric to more anisohydric regulation, enabling plants to sustain stable transpiration and lower midday leaf water potentials under drought. The buffering effects on soil–plant hydraulics persisted across varying degrees of VPD, although high mucilage contents accelerated soil drying, indicating a trade-off between improved water uptake and faster moisture depletion during prolonged drought. Our findings underscore the important role of mucilage in modulating soil–plant water relations and stomatal regulation, offering insights into strategies for improving plant responses to soil and atmospheric drought.

How to cite: Akale, A., Cai, G., Diamantopoulos, E., Leuther, F., Kersting, L., McAdam, S., Liu, S., and Ahmed, M. A.: Root mucilage alters stomatal responses to soil and atmospheric drought, EGU General Assembly 2026, Vienna, Austria, 3–8 May 2026, EGU26-20137, https://doi.org/10.5194/egusphere-egu26-20137, 2026.

EGU26-20260 | ECS | Posters on site | HS8.3.4

Do soil microbes maximize their growth? 

Vani Chaturvedi, Thomas Wutzler, and Axel Kleidon

Soil organic matter (SOM) forms the foundation of microbial life in the soil and its processes. However, what drives the organization of organic matter turnover and microbial communities into growth remains unclear. In particular, we ask whether physical conditions in the soil—such as the quantity or quality of litter inputs—exist to which soil microbial processes adapt in order to maximize microbial growth as a proxy for power. We address this question in the frame of the German priority program 2322  by building on the maximum power principle. The principle suggests that biological systems tend to maximize the flux of energy into useful power under given constraints. We study a minimal model of SOM dynamics at steady state. In the model, litter inputs add to the organic matter pool, which is decomposed by microbial enzymes into compounds available for microbial uptake. The flux of Gibbs free energy provided with litter is used to build biomass while dissipating it during cycling, and the microbial decay returns as dead microbial biomass to the soil pool. We explore how different model structures, feedbacks, and parameterizations might lead to a maximum in the flux of free energy to microbial biomass, thereby providing insights into the conditions under which microbial growth is energetically optimized in soils.

How to cite: Chaturvedi, V., Wutzler, T., and Kleidon, A.: Do soil microbes maximize their growth?, EGU General Assembly 2026, Vienna, Austria, 3–8 May 2026, EGU26-20260, https://doi.org/10.5194/egusphere-egu26-20260, 2026.

EGU26-21264 | ECS | Posters on site | HS8.3.4

Simulation of Soil Moisture Dynamics Using Root Water Uptake Models under Stage-Specific Stress Conditions 

Deep Chandra Joshi, Pragna Dasgupta, and Bhabani S. Das

Accurate representation of root water uptake processes is critical for simulating soil water dynamics under crop water stress, particularly when stress coincides with variable rainfall events. HYDRUS provide a useful framework for evaluating plant–soil interactions under contrasting moisture conditions by simulating different modes of root water uptake, such as compensated and non-compensated uptake.

An experimental study was conducted to examine soil–plant water dynamics under water stress occurring at different crop growth stages. The study focused on three distinct stress scenarios: (a) no water stress, (b) water stress during the vegetative phase, and (c) water stress during the flowering stage. Field measurements included soil water potential at 10 cm depth and root traits, specifically root length and root biomass, to characterize plant water availability and rooting behavior under contrasting moisture conditions.

The HYDRUS-1D model was applied to simulate soil water content dynamics using both compensated and non-compensated root water uptake formulations. Root length and biomass data were used to define root distribution functions in the model. Simulated soil water potential patterns were compared qualitatively across growth stages and root water uptake approaches. The results indicated that the compensated root water uptake model better represented soil moisture depletion and redistribution patterns under stress conditions, particularly when rainfall events occurred during flowering and grain filling stages. Overall, the study highlights the importance of incorporating compensation mechanisms in root water uptake models to improve the simulation of soil water dynamics under stage-specific crop water stress.

How to cite: Joshi, D. C., Dasgupta, P., and Das, B. S.: Simulation of Soil Moisture Dynamics Using Root Water Uptake Models under Stage-Specific Stress Conditions, EGU General Assembly 2026, Vienna, Austria, 3–8 May 2026, EGU26-21264, https://doi.org/10.5194/egusphere-egu26-21264, 2026.

EGU26-21300 | ECS | Orals | HS8.3.4

A novel rhizotron platform for studying root–soil hydraulic interactions in heterogeneous environments 

Tian-Jiao Wei, Xavier Draye, and Mathieu Javaux

The objective of this study is to investigate experimentally how plants adjust their structural and functional properties when facing soil water heterogeneity from the plant down to the organ scales. We developed a novel rhizotron platform, each rhizotron equipped with 9 hydraulically isolated compartments, wherein constant spatial patterns of local soil water potential can be imposed while monitoring water consumption and root development. In the validation experiment, maize plants (cv. B104) were grown under constant and homogeneous water potential in this rhizotron platform for four weeks, before entering a fifth week in which different levels of water potential were imposed. The desired local soil water potentials were successfully applied and adjusted. The local water consumption and root morphological trails were monitored in real time, indicating that root water uptake and root elongation correlate with root age and local soil moisture. At the whole-plant scale, more negative soil water potentials resulted in a lower cumulative water uptake, while at the local scale, cumulative water uptake within individual compartments increased more rapidly as root length within the same compartment increased, indicating a direct coupling between local root development and local water extraction. These observations highlight a strong spatial-temporal linkage between root trails and soil water conditions. Together, the validated rhizotron platform enables root plasticity studies by establish a quantitative and dynamic measurements for soil–root hydraulic interactions at the plant and organ scale, providing a promising platform for future studies exploring how maize plants respond to spatial and temporal heterogeneity in soil water environments. 

How to cite: Wei, T.-J., Draye, X., and Javaux, M.: A novel rhizotron platform for studying root–soil hydraulic interactions in heterogeneous environments, EGU General Assembly 2026, Vienna, Austria, 3–8 May 2026, EGU26-21300, https://doi.org/10.5194/egusphere-egu26-21300, 2026.

Polyphosphates (poly-P), consisting of two or more phosphate residues, are not directly available to plants and must first be hydrolyzed to orthophosphate (ortho-P). Although microbial polyphosphatase activity is well established, there is currently no evidence for extracellular poly-P-hydrolyzing enzymes produced by plants in the rhizosphere. This study investigated the capacity of plants to hydrolyze and utilize long-chain and cyclic poly-P forms and sought to identify extracellular poly-P hydrolytic activity of plant origin.

Six plant species were cultivated under sterile conditions with either cyclic poly-P or ortho-P as the sole phosphorus source. Pronounced interspecific differences were observed in poly-P utilization. Lettuce exhibited limited growth on poly-P, whereas pepper achieved biomass levels comparable to those supplied with ortho-P, providing direct evidence of rhizospheric poly-P hydrolysis. Enzymatic assays using intact plant tissues revealed significantly higher hydrolytic activity in pepper roots than in lettuce, while leaves showed minimal activity in both species.

Protein extracts from pepper roots were further analyzed to characterize the enzymatic activity. Poly-P hydrolysis was abolished by heat treatment, confirming enzymatic involvement. Fractionation by fast protein liquid chromatography (FPLC) led to the isolation of an approximately 20 kDa protein displaying strong poly-P hydrolytic activity, exceeding that of known plant phosphatases. The enzyme preferentially hydrolyzed shorter poly-P chains, with activity declining as chain length increased.

These findings provide the first evidence for a polyphosphatase-like enzyme in vascular plants. The identification of an extracellular, root-derived enzyme capable of hydrolyzing long-chain poly-P challenges the prevailing paradigm that plants rely exclusively on soil microorganisms for the conversion of complex polyphosphates into bioavailable forms.

How to cite: Toren, N. and Erel, R.: Evidence for a Polyphosphatase-Like Enzyme Catalyzing the Hydrolysis of Long-Chain Polyphosphates in the Rhizosphere, EGU General Assembly 2026, Vienna, Austria, 3–8 May 2026, EGU26-21534, https://doi.org/10.5194/egusphere-egu26-21534, 2026.

The subsoil contains valuable nutrient and water resources for crop production, but high penetration resistance impedes root growth and therefore resource access. Large-sized biopores formed by deep-rooting perennial taprooted crop species such as chicory and lucerne can provide pathways through compacted subsoil layers. Different field and mesocosm experiments have shown that colonization by anecic earthworms modifies physical and biochemical properties of biopore networks and pore walls, further increasing attractivity of biopores for crop roots. The intensity of biopore exploration by crop roots and resulting nitrogen uptake from biopore walls as assessed with a combination of classical root-length density determination, in-situ endoscopy and 15N-labelling varies across different crop species and seems to be largely determined by root architecture. Long-term field observations show that benefits of precrops forming large-sized biopores for following crops in terms of water and nutrient uptake as well as grain yield generally in dry years and particularly pronounced for spring-sown cereals.

How to cite: Athmann, M.: Root-soil interactions in biopores and their role in climate adaptation of cropping systems, EGU General Assembly 2026, Vienna, Austria, 3–8 May 2026, EGU26-22888, https://doi.org/10.5194/egusphere-egu26-22888, 2026.

EGU26-1742 | ECS | Orals | BG3.27

An ectomycorrhizal fungus alters developmental progression during endogenous rhythmic growth in pedunculate oak 

Felix Zimmermann, Marie--Lara Bouffaud, Sylvie Herrmann, Marco Göttig, René Graf, Mika Tarkka, Lars Opgenoorth, Daniel Croll, Martina Peter, and Benjamin Dauphin

Pedunculate oak (Quercus robur L.), a long-lived forest tree species, forms symbiotic relationships with ectomycorrhizal (ECM) fungi, which can promote nutrient uptake, stress resilience, and growth. Like other tropical and temperate tree species, pedunculate oak exhibits endogenous rhythmic growth (ERG), a trait conferring the ability to repeatedly alternate root and shoot flushes as well as growth cessation as response to changing environmental conditions. However, the effects of different ECM fungal species on the ERG dynamics remain largely unknown. Here, we investigated the impact of two ECM fungi—Piloderma croceum, a basidiomycete previously shown to promote growth while not found in natural oak stands, and Cenococcum geophilum, an oak-native ascomycete with broad ecological range—on growth performance, biomass partitioning, and ERG patterns in a clonal oak system (clone DF159). By combining in vitro experiments with Bayesian modelling, we show that P. croceum promotes tree growth among treatments, without disrupting the endogenous growth rhythm. In contrast, C. geophilum, while showing high mycorrhization rates, led to reduced biomass accumulation and altered developmental progression through the ERG stages, especially by prolonging the steady state development stage—part of the root flush and characterized by peak net carbon assimilation. Co-inoculation revealed a competitive advantage of C. geophilum in root colonization, yet growth responses resembled those of the control. Our findings demonstrate that ECM species exert species-specific effects on biomass production and temporal development of plants, underscoring the functional importance of ECM fungi in shaping host development. Assessing these interactions provides new insights into the functional diversity of ectomycorrhizal symbiosis and can inform forest management strategies aimed at enhanced resilience in oak-dominated ecosystems under rapidly changing climatic conditions.

How to cite: Zimmermann, F., Bouffaud, M.-L., Herrmann, S., Göttig, M., Graf, R., Tarkka, M., Opgenoorth, L., Croll, D., Peter, M., and Dauphin, B.: An ectomycorrhizal fungus alters developmental progression during endogenous rhythmic growth in pedunculate oak, EGU General Assembly 2026, Vienna, Austria, 3–8 May 2026, EGU26-1742, https://doi.org/10.5194/egusphere-egu26-1742, 2026.

EGU26-3958 | Posters on site | BG3.27

Shifts in soil microbial resource limitation along a natural gradient of EcM tree dominance in a subtropical montane forest 

Qiuxiang Tian, Mengzhen Lu, Feng Liu, and Johannes Rousk

The status of microbial resource limitation plays a central role in regulating ecosystem carbon (C) and nutrient cycle. Tree mycorrhizal associations are increasingly known to regulate soil biogeochemical processes due to their contrasting nutrient acquisition strategies and litter quality, while their effectS on saprotrophic microbial resource limitation remain poorly understood. In this study, we collected soil samples from 35 plots with a natural gradient of EcM tree dominance (defined as the proportion of EcM tree basal area relative to the all trees) in a subtropical montane forest. A full factorial C, nitrogen (N) and phosphorus (P) addition experiment were conducted to infer soil microbial resource limitation based on the responses of microbial growth. The activities of exocellular enzyme were also determined to explore the possible links between ecoenzymatic stoichiometry and microbial resource limitation. C addition induced a systematic increase of microbial growth, and C plus P addition elicited even stronger responses in all soils, suggesting that microbial growth in this subtropical forest was primarily limited by C and secondarily limited by P. With increasing EcM tree dominance, microbial C limitation showed no significant trend, while the secondary P limitation decreased. Ecoenzymatic stoichiometry could not reliably represent soil microbial resource limitation along the gradient of EcM tree dominance. In addition, the variation in microbial secondary P limitation was positively associated with leaf P content and soil N availability, but negatively associated with the proportion of labile P and the relative abundance of phosphate-solubilizing microorganisms. These findings highlight the mycorrhizal association can shift soil microbial secondary P limitation in subtropical forest, which may have implications for the maintenance of forest productivity and soil C sequestration potential.

How to cite: Tian, Q., Lu, M., Liu, F., and Rousk, J.: Shifts in soil microbial resource limitation along a natural gradient of EcM tree dominance in a subtropical montane forest, EGU General Assembly 2026, Vienna, Austria, 3–8 May 2026, EGU26-3958, https://doi.org/10.5194/egusphere-egu26-3958, 2026.

  • The common soil nutrient enrichment (nitrogen, N; phosphorus, P) typical of the agro-pasture ecotone may impact plants-arbuscular mycorrhizal fungi (AMF) symbiotic relationships. However, the stoichiometric responses of plants to increased soil nutrient availability and AMF are not yet clear.
  • Thus, we carried a 3-year in situ study to understand how AMF as well as N and P additon alter the dominant plant ecological stoichiometry in a P-impoverished grassland in Northwest China. The grassland type is desert stepp. The soil type is light sierozem, with 1.8 mg kg−1 soil available P and 6.7 mg kg−1 soil inorganic N. A randomized block design (three-way factors) was conducted with four fertilization treatments: control, N input (N), P input (P), and combined N and P input (NP). Each fertilization treatment comprised two AMF treatments: a non-benomyl and a benomyl treatment. N input was provided as an NH4NO3 fertilizer (10 g N m−2 year−1) evenly input by hand to N and NP plots in late June (early growing season) in each year. P input was provided as a Ca(H₂PO₄)₂ fertilizer (10 g P m−2 year−1), similarly distributed as the N input.
  • Overall, our study indicated that P input considerably exacerbated plant P limitations by diminishing their C:P and N:P; the impact of P input on plant C:P and N:P was higher than that of AMF and N input. This observed reduction in plant N:P and C:P owing to the P supply might be due to the higher soil available P level and quick increase in plant P concentration by P input. Conversely, N input and AMF suppression decreased two dominant grasses C:N ratios by increasing their N concentration. Accordingly, plant and soil available N:P could predict plant biomass changes under N and P addition in P-deficient grasslands.
  • Our findings highlight that the importance of P input, but not AMF, in changing plant C:N:P stoichiometry in P-impoverished grasslands.

How to cite: Yang, X.: Phosphorus addition, rather than mycorrhizal fungi or nitrogen addition, alleviate plant phosphorus deficits in phosphorus-impoverished grassland, EGU General Assembly 2026, Vienna, Austria, 3–8 May 2026, EGU26-5305, https://doi.org/10.5194/egusphere-egu26-5305, 2026.

EGU26-6573 | ECS | Orals | BG3.27

Leaf litter decomposition by microbial communities compared among forest stands dominated by arbuscular versus ectomycorrhizal fungi 

Nicolas Tyborski, Valentin B. Kurbel, Elizabeth Huenupi, Richard P. Phillips, and Johanna Pausch

Trees are the dominant primary producers in forest ecosystems and play a central role in global carbon (C) cycling. A substantial fraction of tree-assimilated C enters the soil as leaf litter, where it is decomposed by diverse microbial consortia. Whether C from litter is rapidly mineralized to CO2 or accumulates as soil organic matter largely depends on the functional traits and activities of soil microbes. Understanding the factors shaping litter-decomposing microbiomes is therefore essential for predicting the capacity of forest soils to act as C-sinks.

Most tree species form symbiotic associations with either arbuscular mycorrhizal (AM) or ectomycorrhizal (ECM) fungi. Litter from AM-associated trees typically contains more accessible nutrients and decomposes faster than the more recalcitrant litter from ECM-associated trees. ECM fungi possess broad enzymatic repertoires and, in some taxa, oxidative mechanisms for nutrient mobilization, whereas AM fungi largely depend on interactions with other microbial taxa. Although these contrasts are well established, the multipartite interactions among trees, mycorrhizae, and other soil microorganisms, and particularly the functional differences of decomposer microbiomes in AM- and ECM-dominated forests, remain insufficiently understood.

To address this, we conducted an in-situ incubation experiment using litter from Acer saccharum (AM-associating) and Quercus alba (ECM-associating) in AM- and ECM-dominated forest stands in south-central Indiana, USA. We assessed the changes in the composition of decomposer microbiomes with progressing litter decay and seasonal dynamics in the litter and adjacent soil by metabarcoding of the 16S rRNA and ITS2 regions after 1, 3, 6, and 12 months. Additionally, we performed metatranscriptomic analyses for decomposer communities after 3 months. Combined with existing metagenomic data, these approaches will enable us to identify microbial taxa and processes driving litter decomposition, C- and nutrient processing across contrasting mycorrhizal contexts.

Initial results indicate that fast-growing, opportunistic Aspergillaceae, known to utilize readily available, labile substrates, dominated the early decomposition of AM-litter. In contrast, Sordariomycetes, capable of degrading recalcitrant compounds, were more abundant in ECM-litter. These patterns are consistent with our expectations and demonstrate the potential of our experimental setup to resolve the functions of microbiome members beyond mycorrhizal fungi. Ultimately, this study will enhance our understanding of the microbial taxa that are critical for C cycling in forests and of how decomposer microbiome dynamics are shaped by dominating mycorrhizal types.

How to cite: Tyborski, N., Kurbel, V. B., Huenupi, E., Phillips, R. P., and Pausch, J.: Leaf litter decomposition by microbial communities compared among forest stands dominated by arbuscular versus ectomycorrhizal fungi, EGU General Assembly 2026, Vienna, Austria, 3–8 May 2026, EGU26-6573, https://doi.org/10.5194/egusphere-egu26-6573, 2026.

Most temperate tree species are predominantly associated with either arbuscular mycorrhizal (AM) or ectomycorrhizal (ECM) fungi, which provide mineral nutrients to their host in exchange for carbon (C). As the two mycorrhizal types differ fundamentally in their nutrient economy, they were suggested to provide an integrated index of biogeochemical transformations relevant to C cycling and nutrient retention in forests. Yet little is known about the group-specific role of mycorrhizal type in the relationship between tree diversity and ecosystem functions. The main objective of my Heisenberg research project was to determine the differences between functional groups in rhizosphere C fluxes between diverse AM and ECM tree stands. Among the key biogeochemical processes, I focus on root exudation and decomposition, which represent the cause and consequence of the microbial priming effect to stimulate nutrient release from soil organic matter. Based on the assumed organic nutrient economy of ECM stands, I hypothesize that enhanced root exudation is a primary mechanism by which ECM trees maintain productivity in diverse forest stands, while diverse AM stands mainly depend on nutrient transfer via leaf litter. In my talk, I will derive the importance of mycorrhizal association type as a functional grouping for understanding biogeochemical cycling under climate change, present some results on the mycorrhizal control of biodiversity effects in forests, and discuss open knowledge gaps.

How to cite: Meier, I. C.: The role of mycorrhizal colonization in coupling C and N cycles in diverse tree stands, EGU General Assembly 2026, Vienna, Austria, 3–8 May 2026, EGU26-6752, https://doi.org/10.5194/egusphere-egu26-6752, 2026.

EGU26-6787 | ECS | Posters on site | BG3.27

Evidence for resource transfer via common endophytic networks 

Philipp Spiegel, Philipp Waschk, and Mark Anthony

Fungal symbionts play essential roles in ecosystems by shaping plant development and biodiversity. Among these, mycorrhizal fungi can form common mycorrhizal networks (CMNs) where a single fungus connects the roots of two or more plants through a continuous extraradical mycelium, facilitating transfer of resources, including nitrogen and carbon, between the connected plants.
Remaining understudied, there is another group of fungal mutualists known as endophytes, which are relatively phylogenetically and morphologically distinct from mycorrhizal fungi. Endophytic fungi also support plant development and may form common endophyte networks (CENs). Whether endophytes can transfer soil resources like nitrogen, carbon, and water through such networks remains an open question. To test this, we established a CEN experiment in split petri dishes using Arabidopsis thaliana hosts and three phylogenetically diverse endophytes (Trichoderma viride, Mucor hiemalis, and Fusarium temperatum) to test if isotopically labelled amino acid ¹⁵ nitrogen (N), amino acid ¹³ carbon, ¹⁵ N-ammonium, or deuterated water can be transferred from a donor plants soil to receiver plants connected via a CEN. We show that the tested endophytes can form CENs and transfer growth limiting resources from donor plant soil to receiver plant tissues. F. temperatum boosted plant growth by 38% relative to the uninoculated control, and it enriched plant ¹⁵ N content derived from amino acids by 55%. Surprisingly, we also observed amino acid-derived ¹³ carbon transport from donor plant soil to receiver plant tissues by T. viride (+ 2.83% > control). We also demonstrate that soil resource transfer by all three endophytes shifted in the presence of two versus a single host plant even when root systems were physically separated to avoid competition, underscoring that endophytic functioning, not just that of plants, also shifts when CENs are formed. Our results demonstrate that non-mycorrhizal fungi, in particular endophytes, can form networks similar to the idea of CMNs and transfer plant growth relevant resources. Endophytes display a broad array of symbiotic functions with their hosts, and formation of CENs may be a newly discovered component of their symbiotic tool kit.

How to cite: Spiegel, P., Waschk, P., and Anthony, M.: Evidence for resource transfer via common endophytic networks, EGU General Assembly 2026, Vienna, Austria, 3–8 May 2026, EGU26-6787, https://doi.org/10.5194/egusphere-egu26-6787, 2026.

EGU26-6998 | ECS | Posters on site | BG3.27

Arbuscular mycorrhiza understory alters AM fungal community composition with little effect on other soil fungi in an ectomycorrhizal-dominated forest 

Barbara Brunschweiger, Andrey G. Zuev, Fabian Weikl, Henry Bain, Martin Jansen, and Peter Annighöfer

Temperate forests in Central Europe are largely dominated by ectomycorrhizal (ECM) trees, with arbuscular mycorrhizal (AM) species currently representing a lesser proportion. Climate-driven forest dieback has prompted management strategies to diversify species composition and foster structural complexity to enhance ecosystem resilience. In Brandenburg, eastern Germany, forest transformation efforts primarily promote native ECM-associated trees to increase structural and compositional diversity, while concurrently the AM tree species Prunus serotina has expanded in the understory through natural regeneration. Rising temperatures may increase the prevalence of AM symbiotic systems, yet the consequences for belowground fungal communities in ECM-dominated forests, particularly for symbiotic fungi, remain poorly understood.

We asked whether AM-dominated understory reorganizes communities of AM fungi in ECM-dominated forests, and to what extent forest structure and microclimate explain variation in biomass and community composition of AM fungi relative to other fungal groups. We collected soil samples from 40 plots in a managed forest in Brandenburg, Germany, in Scots pine and mixed conifer–deciduous stands, each with or without AM-dominated understory. AM fungal and total fungal biomass were quantified using neutral and phospholipid fatty acid analysis. Fungal diversity and community composition were assessed by DNA metabarcoding targeting the ITS2 region for the total fungal community and an 18S rRNA region specific for AM fungi. Stand structural metrics derived from laser scanning and microclimatic variables were included as continuous explanatory factors.

Preliminary results indicate that AM-dominated understory increased biomass and beta diversity of AM fungi across pine and mixed conifer-deciduous stands, while alpha and gamma diversity of AM fungi declined. That suggests dominance-driven community reorganization rather than a net increase in diversity. Forest structure and microclimate explained little variation. The total fungal community composition and biomass remained largely unaffected by the presence of AM-dominated understory. In these dry and nutrient-poor Podzol soils, a higher proportion of AM symbiotic systems may add complementary pathways of water and nutrient acquisition to those provided by ECM fungi. This functional diversification could contribute to forest resilience and may become increasingly important under a changing climate.

How to cite: Brunschweiger, B., Zuev, A. G., Weikl, F., Bain, H., Jansen, M., and Annighöfer, P.: Arbuscular mycorrhiza understory alters AM fungal community composition with little effect on other soil fungi in an ectomycorrhizal-dominated forest, EGU General Assembly 2026, Vienna, Austria, 3–8 May 2026, EGU26-6998, https://doi.org/10.5194/egusphere-egu26-6998, 2026.

EGU26-7855 | ECS | Posters on site | BG3.27

From Roots to Depths: Unveiling Functional Traits and Diversity of Arbuscular Mycorrhizal Fungi in Agricultural Top- vs. Subsoil 

Zakaria Islem Ziche, Lingling Shi, and Svenja Stock

Aim: Investigate the functional diversity of top- and subsoil arbuscular mycorrhizal fungi (AMF) communities as well as specific functional traits regarding nutrient mobilization.
Method: In the first experiment, five plant species with distinct functional traits were grown in top- and subsoil cores in a mesocosm experiment. Roots AMF communities’ composition was analyzed by DNA amplicon sequencing of the ITS rRNA gene. In the second experiment, we used 15N and 33P isotope tracers to test the ability of selected distinct AMF communities to stimulate nutrient mobilization from organic matter.
Results: AMF richness is consistently greater in topsoil regardless of plant species (p < 0.001). Both AMF taxonomic and phylogenetic beta diversity show more diversity among subsoil communities than topsoil communities. Furthermore, subsoil AMF communities are hypothesized to be more capable of stimulating N and P mobilization from organic matter than topsoil communities.
Conclusion: These results suggest that AMF communities’ composition is shaped by both plant species and soil depths. Despite topsoil AMF communities supporting greater richness, subsoil communities display greater taxonomic and phylogenetic diversity.

How to cite: Ziche, Z. I., Shi, L., and Stock, S.: From Roots to Depths: Unveiling Functional Traits and Diversity of Arbuscular Mycorrhizal Fungi in Agricultural Top- vs. Subsoil, EGU General Assembly 2026, Vienna, Austria, 3–8 May 2026, EGU26-7855, https://doi.org/10.5194/egusphere-egu26-7855, 2026.

EGU26-9915 | ECS | Posters on site | BG3.27

Ectomycorrhizal fungal communities in relation to stand productivity and drought response in mature European beech forests  

Nathalie Friedl, David Konrad, Katarzyna Retzer, Torsten Winfried Berger, and Mathias Mayer

Mycorrhizal fungi form symbiotic relationships with trees and play a crucial role in tree growth, nutrition, and tolerance to environmental stress. Although numerous studies have shown that mycorrhizal fungi enhance nutrient and water uptake and increase tree resilience to drought, most evidence is derived from pot experiments, while comprehensive field-based studies in forest ecosystems remain scarce. Here, we test whether ectomycorrhizal fungal community composition can predict stand-level biomass productivity, tree nutritional status, and tree responses to severe drought. To address this question, we studied 60 mature European beech stands in Austria located along natural gradients of climate and nutrient availability. Soil samples were collected from the organic layer and mineral soil at depths of 0–10, 10–20, and 20–50 cm. DNA and ergosterol were extracted for fungal community and biomass analyses. Ectomycorrhizal community composition will be assessed using ITS2 amplicon sequencing, followed by bioinformatic processing to assign fungal taxonomy and guilds. These data will be related to stand biomass increment, leaf and soil nutrient data, as well as drought response indices derived from dendrochronological tree-ring analysis. This integrative approach allows us to disentangle the relative importance of ectomycorrhizal community composition and site conditions for forest productivity and drought response.

How to cite: Friedl, N., Konrad, D., Retzer, K., Berger, T. W., and Mayer, M.: Ectomycorrhizal fungal communities in relation to stand productivity and drought response in mature European beech forests , EGU General Assembly 2026, Vienna, Austria, 3–8 May 2026, EGU26-9915, https://doi.org/10.5194/egusphere-egu26-9915, 2026.

EGU26-10448 | ECS | Posters on site | BG3.27

Soil fungal biomass and nitrogen cycling in European beech stands 

David Konrad, Nathalie Friedl, Katharina Keiblinger, Torsten Winfried Berger, and Mathias Mayer

Fungi are a major component of soil microbial communities in forest ecosystems and regulate a wide range of biogeochemical processes. Saprotrophic fungi decompose dead organic matter, pathogenic fungi can influence plant fitness, and symbiotic mycorrhizal fungi support plant nutrient acquisition in exchange for photosynthetically derived carbon. Beyond their functional diversity, fungal biomass represents a substantial pool of soil organic carbon through living fungal tissues and extensive mycelial networks. Soil fungi further interact with other microbial groups, thereby influencing nutrient turnover and overall ecosystem functioning. Here, we investigate how forest stands differ in soil fungal biomass and which environmental parameters best predict variability in fungal biomass. We further test how net nitrogen mineralization, a process often associated with bacteria-dominated nitrogen transformations, relates to fungal biomass. Soil samples were collected from 60 mature European beech stands distributed across the Vienna Woods, Austria. Fungal biomass was estimated by quantifying ergosterol concentrations extracted from soil samples taken from the organic layer and from three depths in the mineral soil (0–10, 10–20, and 20–50 cm). Net nitrogen mineralization rates were determined by measuring ammonium and nitrate concentrations before and after a 12-day laboratory incubation. Fungal biomass was related to nitrogen mineralization rates as well as a wide range of stand-, soil-, and site-level variables. First results are presented and discussed in the context of soil carbon storage and nitrogen availability.

How to cite: Konrad, D., Friedl, N., Keiblinger, K., Berger, T. W., and Mayer, M.: Soil fungal biomass and nitrogen cycling in European beech stands, EGU General Assembly 2026, Vienna, Austria, 3–8 May 2026, EGU26-10448, https://doi.org/10.5194/egusphere-egu26-10448, 2026.

EGU26-11004 | ECS | Orals | BG3.27

Do fungal communities mediate tree species interactions in mixed beech–conifer forests? 

Michela Audisio, Mark Anthony, Ysaline Perraud, Likulunga Emmanuel Likulunga, Carmen Alicia Rivera Pérez, and Andrea Polle

Understanding how tree species interact within forest stands and how these interactions influence forest functioning—particularly biotic interactions with soil microbes—is crucial for informing forest management strategies under a rapidly changing climate.

Altering tree species composition can shift soil fungal community structure and affect tree performance and competitive outcomes. For instance, enriching monospecific beech forests with conifers (mainly spruce or the non-native Douglas fir) can improve beech growth and stress resistance, especially under drought conditions, and it has more recently been linked to higher fungal diversity. Although several mechanisms have been proposed to explain these positive effects on beech growth, site conditions likely play a major role, and potentially also feedback with fungi, such as mycorrhizal symbionts.

Here, we investigated whether belowground fungal communities may act as mediators of tree species interactions in mixed beech–conifer forests. Specifically, we hypothesized that variation in fungal community composition is associated with variation in the intensity of tree species interactions, focusing on European beech. To show how beech growth differs under interspecific competition in beech-spruce and beech-Douglas fir forests, we calculated the relative interaction index (RII). We further hypothesize that the effects of site conditions on beech RII are indirect and mediated by fungal communities.

We calculated diameter increment of beech trees between 2017 and 2024 in pure beech stands and in mixed beech–spruce and beech–Douglas fir stands. Tree growth was estimated using allometric equations to derive annual aboveground biomass increment, which was used as the performance metric for calculating beech RII in mixed stands with either spruce or Douglas fir as competitors.

Soil- and root-associated fungal communities were characterized using DNA metabarcoding. Fungal community composition was analysed separately for soil and root samples using principal coordinates analysis (PCoA), and it was used to predict RII while accounting for the effects of site and stand covariates (e.g., stand age, stand density, and soil properties). To disentangle the relationships among soil environment, fungal community composition, and beech RII, we applied a stepwise regression framework reflecting a hypothesized causal pathway. We further examined associations between beech RII and differentially abundant fungal taxa putatively involved in mediating tree species interactions.

We found that beech RII was associated with fungal community composition but only in beech–spruce forests, indicating a strong neighbour identity effect. In beech–spruce stands, the influence of site conditions on beech RII was mediated by both soil and root fungal communities. Additionally, ectomycorrhizal fungal taxa which significantly differed in relative abundance between beech–spruce and pure beech forests were negatively correlated with beech RII, making them candidates involved in or responding to shifts in tree species interactions.

Overall, our results demonstrate that fungal communities are tightly coupled to tree species interactions in beech–spruce forests but not in beech–Douglas fir forests, where alternative mechanisms beyond soil conditions may predominantly regulate tree interactions.

How to cite: Audisio, M., Anthony, M., Perraud, Y., Likulunga, L. E., Rivera Pérez, C. A., and Polle, A.: Do fungal communities mediate tree species interactions in mixed beech–conifer forests?, EGU General Assembly 2026, Vienna, Austria, 3–8 May 2026, EGU26-11004, https://doi.org/10.5194/egusphere-egu26-11004, 2026.

EGU26-11513 | ECS | Orals | BG3.27

Impact of reduced rainfall and warming on EMF physiology and forest soil carbon cycles 

Artin Zarsav, Giorgia Cantini, Philipp Spiegel, Arthur Gessler, and Mark Anthony

Global carbon (C) cycling plays a vital role in shaping planetary life and the climate system. One of these carbon pools, soil organic matter (SOM), has been estimated to contain twice the C as stored in terrestrial vegetation and the atmosphere combined. In forest ecosystems, a major contributor to SOM cycling are ectomycorrhizal fungal (EMF) species. EMF form symbiotic relationship with most tree species in the northern hemisphere where in exchange for plant-derived C, the fungi provide the host plants with improved access to nutrients and water. Despite their crucial role in ecosystem C cycling, we poorly understand how EMF functioning and mediation of C cycles will shift under a changing climate. To address this, our study investigated how EMF respiration, production, turnover, and biodiversity shift in response to simulated climate change in two Fagus sylvatica forests in northern Switzerland.

We employed an in-growth mesh approach across the growing season to track EMF physiological and biodiversity responses to experimentally reduced rainfall and increased temperatures, both alone and mixed. The lack of initial C in mesh bags allows us to focus on the growth of EMF hyphae in the bags without attracting other microbes such as saprotrophs that require a source of C to grow. After the incubation period of each mesh bag, we measured in situ respiration, and microbial biomass using phospholipid-derived fatty acids (PLFA). The biomass at different stages of the growing seasons enabled us to estimate fungal production and turnover rates. When integrated with EMF respiration measurements, this allowed us to model the EMF CO2 flux and carbon use efficiency for the growing season while taking soil moisture and temperature into account. Further, using DNA metabarcoding, the fungal ITS region of samples were sequenced and analysed to provide a better understanding of fungal community structure.

Our initial results show that the climate treatments significantly shift EMF physiology and turnover. Drought had the strongest negative impact on EMF growth and respiration, but this ameliorated by concurrent warming, and it was linked to variation in host plant growth. We further discovered that EMF turnover over the growing season was not steady, with some samples showing signs of greater biomass loss than could be replaced in the later stages of the growing season. This could be due accumulation of necromass or other exudates over time that negatively feedback to impact EMF physiology. In conclusion, EMF have a critical role in forest soil C cycle which direct and indirectly impacts on ecosystem processes, such as their host plant performance under climate change.

How to cite: Zarsav, A., Cantini, G., Spiegel, P., Gessler, A., and Anthony, M.: Impact of reduced rainfall and warming on EMF physiology and forest soil carbon cycles, EGU General Assembly 2026, Vienna, Austria, 3–8 May 2026, EGU26-11513, https://doi.org/10.5194/egusphere-egu26-11513, 2026.

EGU26-12191 | Posters on site | BG3.27

Dependence of mycorrhizal respiration on soil moisture, soil temperature and gross primary productivity in a dry grassland 

Giulia De Luca, Szilvia Fóti, Katalin Posta, Zoltán Nagy, Krisztina Pintér, and János Balogh

Despite the growing recognition of arbuscular mycorrhizal fungi as key players in the carbon cycle, their independent contribution to soil respiration (Rs) under varying seasonal conditions is still not completely understood. Here, we explore how seasonal variation of soil moisture, soil temperature and gross primary productivity (GPP) influence mycorrhizal respiration (Rmyc) in a temperate grassland.

Soil respiration components were separated using root exclusion method. Gas exchange measurements were performed by a chamber based automated Rs system and an eddy covariance flux tower in two consecutive years (2023 and 2024). Additional soil sampling and analyses were conducted for the estimation of mycorrhizal abundance (hyphal length, PLFA, NLFA).

The two complete study years were characterized by contrasting environmental conditions, which allowed us to monitor interannual differences. GPP exhibited strong seasonal variations reflecting vegetation phenology, with notable differences between the two years. Rs data varied largely in accordance with GPP. The partitioned soil respiration components followed the seasonal dynamics of plant activity, with peaks occurring in the growing season.

The overall sensitivity of Rmyc to drivers differed according to the year effect. In 2023, GPP had a strong linear effect on Rmyc, but soil temperature and soil moisture greatly influenced the strength of this relationship. On the other hand, in the dry year (2024), GPP had much smaller effect on Rmyc and instead, soil temperature and soil moisture proved to be the main drivers.

In conclusion, based on data from the unbiased year, interannual variation in Rmyc sensitivity arises mainly from changes in carbon supply rather than soil temperature and soil moisture. It is also clear that these relationships are co-dependent and greatly affect each other.

How to cite: De Luca, G., Fóti, S., Posta, K., Nagy, Z., Pintér, K., and Balogh, J.: Dependence of mycorrhizal respiration on soil moisture, soil temperature and gross primary productivity in a dry grassland, EGU General Assembly 2026, Vienna, Austria, 3–8 May 2026, EGU26-12191, https://doi.org/10.5194/egusphere-egu26-12191, 2026.

EGU26-13699 | ECS | Posters on site | BG3.27

Responses of ectomycorrhizal extraradical mycelium and associated bacteria to drought and warming 

Giorgia Cantini, Artin Zarsav, Philipp Spiegel, and Mark Anthony

In temperate forest ecosystems, ectomycorrhizal fungi (EMF) are key regulators of global carbon cycling. Up to 70% of the carbon accumulation in the organic soil layer originates from roots and mycorrhizal fungi rather than from aboveground litter deposition. A significant fraction of the photosynthetically fixed carbon that EMF receive from trees is directed toward production of extraradical mycelium, the main fungal component responsible for nutrient uptake. Despite the importance of EMF mycelium, the processes regulating its growth and functioning remain poorly understood in the face of climate change. Even less is known about the role of bacteria in regulating ectomycorrhizal physiology under altered environmental conditions. To address this, carbon-free in-growth sand bags used to "bait" ECM fungi were buried in the soil at two beech forests in Switzerland in an experimental climate warming x drought field study. In-growth mesh bags provide a powerful method for investigating this critical component of the belowground carbon stock, allowing targeted assessment of extraradical mycelium biomass production and turnover, and to study the bacteria associated with EMF mycelium. We quantified fungal and associated bacterial biomass within the sand bags using phospholipid fatty acids (PLFA) analysis, and we compared the composition and potential functions of the bacterial biome using DNA metabarcoding and metatranscriptomics. Across treatments and sampling windows, bacterial biomass was positively correlated with EMF biomass, indicating a tight coupling between extraradical mycelium and associated bacterial communities under climate stress. After the entire growing season, drought reduced the fungal-to-bacterial biomass ratio, while warming and the combined warming × drought treatment had weaker effects. This suggests that bacteria associated with the extraradical mycelium of ectomycorrhizal fungi are relatively more tolerant to drought stress than the fungi themselves. At finer taxonomic resolution, response ratios revealed group-specific and site-dependent responses of bacterial and fungal functional groups to climate treatments. While single stressors usually reduced the biomass of Gram-positive, Gram-negative, actinobacteria and fungi in both experimental sites, the combined warming × drought treatment frequently resulted in contrasting non-additive responses, especially in one of the two sites, indicating complex interactions between climate drivers. Overall, our results highlight that extraradical mycelium-associated bacterial communities remain tightly linked to ectomycorrhizal fungi under climate stress but with distinct tolerances that may shift bacterial contributions which support EMF functioning.

How to cite: Cantini, G., Zarsav, A., Spiegel, P., and Anthony, M.: Responses of ectomycorrhizal extraradical mycelium and associated bacteria to drought and warming, EGU General Assembly 2026, Vienna, Austria, 3–8 May 2026, EGU26-13699, https://doi.org/10.5194/egusphere-egu26-13699, 2026.

EGU26-13969 | ECS | Posters on site | BG3.27

Chemical mapping of the ectomycorrhizal interface using optical photothermal infrared spectroscopy 

Stefan Gorka, Stefanie Imminger, Arno Schintlmeister, and Christina Kaiser

The ectomycorrhizal (ECM) symbiosis underpins forest nutrient cycling through tightly regulated exchange of carbon and nutrients at the plant–fungal interface. Despite their ecological importance, the spatial chemistry of this interface remains poorly characterised. Here, we apply optical photothermal infrared (O-PTIR) spectroscopy to chemically map ECM root tip cryosections, with the aim of visualising potential transfer or storage compounds directly at the mycorrhizal interface.

Spectral mapping reveals consistent spatial patterns across multiple ECM root tip cross sections. Distinct spectral bands are associated with the plant stele and the hyphal mantle, suggesting the presence of tissue-specific spectral bands at the ECM interface. Correspondingly, multivariate analysis shows a clear separation between plant and fungal tissues. In contrast, spectra from a putative Hartig net region overlap with both domains, consistent with a chemically heterogeneous interface where plant and fungal molecular signatures converge.

These first data demonstrate the feasibility of O-PTIR for resolving chemically distinct domains within ECM root tips. This approach provides a promising foundation for investigating the spatial organisation of metabolites at the ECM interface and highlights the potential of high-resolution vibrational spectroscopy for studying nutrient exchange at biologically complex interfaces.

How to cite: Gorka, S., Imminger, S., Schintlmeister, A., and Kaiser, C.: Chemical mapping of the ectomycorrhizal interface using optical photothermal infrared spectroscopy, EGU General Assembly 2026, Vienna, Austria, 3–8 May 2026, EGU26-13969, https://doi.org/10.5194/egusphere-egu26-13969, 2026.

EGU26-14410 | Orals | BG3.27 | Highlight

Tree-microbe mutualisms regulate ecosystem stability in global forests 

Shan Luo and the Bernhard Schmid, Yann Hautier, Forest Isbell, Akira Mori, Richard Phillips, Peter Reich, Guopeng Liang, David Johnson, Zhaohui Luo, Shaopeng Wang, Xuetao Qiao, Neha Mohanbabu, data providers, Jingjing Liang, Nico Eisenhauer

Forests are the Earth’s largest terrestrial carbon sinks, yet they are increasingly threatened by disturbances such as drought. Identifying the mechanisms that allow forests to resist and recover from disturbance, and thereby maintain ecosystem stability, is essential for predicting biosphere-climate feedbacks. Most tree species form symbioses with either arbuscular mycorrhizal (AM) or ectomycorrhizal (ECM) fungi, and emerging evidence suggests that variation in mycorrhizal association represents a key dimension of plant functional diversity. Despite this, the extent to which these contrasting symbioses shape forest stability, and whether their effects vary across heterogeneous environments, remains unresolved. Here we integrate ground-based observations of forest community composition with satellite-derived vegetation indices from more than 600,000 forest plots worldwide and eddy-covariance gross primary production from 73 forests with carbon dioxide flux towers. We show that, compared with forests dominated by a single mycorrhizal association, forests containing both mycorrhizal associations exhibit greater stability in productivity. These effects were strongest in regions with cold, seasonal, dry, or nutrient-limited conditions and in species-poor forests. This enhanced stability potentially reflects functional complementarity among mycorrhizal associations and the greater drought resistance they confer, rather than faster post-drought recovery. Our findings reveal that diversity in plant-microbe mutualisms—complementing plant taxonomic diversity—constitutes a previously underappreciated dimension for forecasting ecosystem resilience, carbon sequestration, and terrestrial climate feedback.

How to cite: Luo, S. and the Bernhard Schmid, Yann Hautier, Forest Isbell, Akira Mori, Richard Phillips, Peter Reich, Guopeng Liang, David Johnson, Zhaohui Luo, Shaopeng Wang, Xuetao Qiao, Neha Mohanbabu, data providers, Jingjing Liang, Nico Eisenhauer: Tree-microbe mutualisms regulate ecosystem stability in global forests, EGU General Assembly 2026, Vienna, Austria, 3–8 May 2026, EGU26-14410, https://doi.org/10.5194/egusphere-egu26-14410, 2026.

EGU26-15348 | ECS | Orals | BG3.27

Arbuscular mycorrhizal fungi as biological entry points to mineral-associated organic matter formation 

Elisa Bussing Hudon, Pierre-Luc Chagnon, and Ariane Vossen

Arbuscular mycorrhizal fungi (AMF) are central components of terrestrial ecosystems, linking plant carbon inputs to soil microbial communities and mineral surfaces. While mineral-associated organic matter (MAOM) is often conceptualized as the product of dissolved organic matter sorption, growing evidence suggests that living mycorrhizal biomass may represent a primary entry point for carbon stabilization, with necromass formation and mineral association emerging downstream of biological colonization.

Here, we present an exploratory field-based study examining how AMF and their associated microbial communities colonize mineral substrates with contrasting surface chemistry under realistic soil conditions. Mineral-filled pouches containing quartz, kaolinite, montmorillonite, or goethite were deployed in agricultural soils under long-term contrasting tillage regimes (tilled vs. no-till), known to host distinct AMF communities. To decouple dissolved organic matter inputs from active mycorrhizal colonization, mineral substrates were deployed under two access conditions: 1 µm mesh bags permitting dissolved organic matter diffusion only, and 30 µm mesh bags allowing access by AMF hyphae and associated microorganisms.

AMF colonization was quantified via hyphal length measurements, and microbial and general fungal biomass were assessed using targeted qPCR. Broader microbial community composition associated with minerals was characterized through DNA extraction and sequencing. In parallel, non-targeted metabolomics will be used to explore the biochemical signatures associated with colonizing communities, and Fourier Transform Infrared (FTIR) spectroscopy will provide insights into emerging mineral–organic associations.

This study explicitly positions AMF-driven colonization as a first-order process structuring mineral–organic interactions, rather than a secondary modifier of mineral sorption. By identifying which minerals are preferentially colonized by AMF, and how colonization patterns vary with mineralogy and tillage regime, this work contributes to a biologically grounded understanding of soil carbon stabilization. Resolving AMF/mineral associations represents a critical step toward integrating mycorrhizal ecology into mechanistic models of soil biogeochemistry and ecosystem functioning.

How to cite: Bussing Hudon, E., Chagnon, P.-L., and Vossen, A.: Arbuscular mycorrhizal fungi as biological entry points to mineral-associated organic matter formation, EGU General Assembly 2026, Vienna, Austria, 3–8 May 2026, EGU26-15348, https://doi.org/10.5194/egusphere-egu26-15348, 2026.

EGU26-15633 | ECS | Orals | BG3.27

Soil fungal communities show little response to CO2 enrichment but significant change over time in a 42-month litter decomposition experiment in mature oak woodland 

Rachel Calder, Michaela Reay, Robert Grzesik, James Gore, Sami Ullah, and Megan McDonald

Soil fungal communities play central roles in decomposition. Rising atmospheric CO2 levels  may impact these communities as additional carbon becomes available for allocation to soil fungi, with potential repercussions for soil carbon and nutrient cycling via decomposition.

To explore this, soil fungal communities were analysed from a long-term litter decomposition experiment at the Birmingham Institute of Forest Research Free Air Carbon dioxide Enrichment Facility (BIFoR FACE), a unique experiment in England in which patches of mature oak-dominated woodland have been exposed to elevated [CO2] (+150 μmol/mol) throughout each growing season since 2017. Litterbags of three different mesh sizes (1 μm, 41 μm, 2 mm) and two litter types (oak roots, leaves) were buried under elevated and ambient [CO2] at BIFoR FACE in November 2020. Each consisted of an inner mesh bag containing the litter within an outer mesh bag containing soil. Soil from within the litterbags collected at three timepoints (March 2021, February 2022, May 2024) was used for ITS metabarcoding and the resulting data were analysed in conjunction with soil chemistry data from the experiment.

Timepoint was found to be the dominant factor structuring fungal communities. Across all mesh sizes, soil from May 2024 showed significantly higher relative abundances of ectomycorrhizal fungi and lower relative abundances of saprotrophs relative to the earlier timepoints, and a concurrent increase in Basidiomycota at the expense of Ascomycota. In parallel with these fungal community shifts, soil C:N returned in May 2024 to levels similar to those of March 2021 (mean 12.9 ± 0.1 SE at both timepoints), having fallen to a minimum in February 2022 (mean 10.8 ± 0.1 SE). The later increase in soil C:N was driven primarily by reduced total soil nitrogen; this may reflect a decline in available N contributing to increased ectomycorrhizal abundance, which in turn led to further N losses through ectomycorrhizal N mining . Having accounted for the effect of timepoint, however, neither saprotrophic nor ectomycorrhizal relative abundances were related to litter mass loss. CO2 enrichment had little impact on soil fungal OTU richness or guild relative abundances and no taxa were differentially abundant between ambient and elevated [CO2]. However, CO2 enrichment was found to be significantly associated with fungal beta diversity (alongside timepoint, mesh size, litter type, dissolved organic carbon, pH, and soil moisture).

These results demonstrate clear patterns of fungal community change as decomposition progresses. These patterns were largely unaffected by CO2 enrichment, despite the fact that decomposition rates have been found to differ between ambient and elevated CO2 in the same experiment. The most notable change was an increased relative abundance of ectomycorrhizal taxa by the final timepoint, likely related to declining N levels.


How to cite: Calder, R., Reay, M., Grzesik, R., Gore, J., Ullah, S., and McDonald, M.: Soil fungal communities show little response to CO2 enrichment but significant change over time in a 42-month litter decomposition experiment in mature oak woodland, EGU General Assembly 2026, Vienna, Austria, 3–8 May 2026, EGU26-15633, https://doi.org/10.5194/egusphere-egu26-15633, 2026.

EGU26-17487 | ECS | Posters on site | BG3.27

Long-term soil nutrient deficiencies reshape connections between arbuscular mycorrhizal fungi and plant communities in a managed grassland 

Kian Jenab, Ksenia Guseva, Hannes Schmidt, Erich M. Pötsch, Andreas Richter, Jan Jansa, and Christina Kaiser

Many agroecosystems experience soil nitrogen (N), phosphorus (P), or potassium (K) deficiencies due to imbalanced fertilization or insufficient replenishment of nutrients withdrawn by biomass harvest. Nutrient deficiencies affect both arbuscular mycorrhizal fungi (AMF) and their associated plant hosts. Since AMF and plant communities are interconnected by their symbiosis, soil nutrient deficiencies can indirectly influence AMF communities through changes in plant community composition and vice versa. Furthermore, changes in soil nutrient availability alter soil physicochemical properties, thereby affecting both AMF and plant communities.

This study examined the coupled responses of AMF and belowground plant communities to long-term soil N, P and K deficiencies in a managed grassland. Additionally, we evaluated the associations between AMF and belowground plant communities, particularly at the genus and functional guild levels, while controlling for edaphic factors.

The study was conducted in a long-term managed grassland experiment in Admont (Styria, Austria), where N, P, and K, as well as lime and organic fertilizers, have been applied in different combinations for more than 70 years. Aboveground vegetation was harvested three times annually for over seven decades, resulting in long-term nutrient depletion of specific nutrients in non-fertilized plots. AMF communities in soil and roots were characterized using RNA- and DNA-based amplicon sequencing of the 18S rRNA gene, respectively. Belowground plant community composition was evaluated by amplicon sequencing of the chloroplast rbcL (RuBisCo large subunit) gene region from mixed root samples.

Our analysis shows that AMF and belowground plant community compositions differed significantly between plots receiving lime and organic fertilizers, and those fertilized with inorganic treatments. N, P, and K deficiencies affected both soil AMF and plant community compositions, whereas root-associated AMF community compositions responded significantly to only K deficiency. Since pH exerted the strongest influence on soil and root AMF as well as belowground plant community compositions, we performed Partial Mantel tests controlling for pH to examine associations between AMF and plant communities. Both soil and root AMF communities were significantly correlated with belowground plant community composition, with comparable correlation strengths for soil AMF (r=0.20, p<0.01) and root AMF (r=0.21, p<0.01). Partial correlation (controlling for pH) analyses between plant and AMF genera showed that more correlations were observed between root-associated AMF and plant genera than between soil AMF and plant genera. Additionally, all AMF genera showing correlations with plant genera belonged to the rhizophilic functional guild, which is characterized by a higher proportion of intraradical relative to extraradical hyphae.

Our findings suggest that long-term soil nutrient depletion influences AMF and plant community composition both directly and indirectly, through shifts in soil parameters and plant–AMF associations. They further indicate that rhizophilic AMF play a central role in mediating plant–AMF associations. These findings highlight that integrating the ecology of subsurface AMF communities—often overlooked beyond monoculture frameworks—can substantially enhance our understanding of plant community responses in a changing environment.

How to cite: Jenab, K., Guseva, K., Schmidt, H., Pötsch, E. M., Richter, A., Jansa, J., and Kaiser, C.: Long-term soil nutrient deficiencies reshape connections between arbuscular mycorrhizal fungi and plant communities in a managed grassland, EGU General Assembly 2026, Vienna, Austria, 3–8 May 2026, EGU26-17487, https://doi.org/10.5194/egusphere-egu26-17487, 2026.

EGU26-20261 | ECS | Posters on site | BG3.27

Ectomycorrhizal colonization reduces ultra-fine root abundance 

Samuele Ceolin, Stanislaus Schymanski, Josh Gerekens, Jérôme Juilleret, and Christophe Hissler

Ectomycorrhizal fungi (ECM) form mutualistic associations with tree roots, enhancing nutrient and water uptake and improving tree resistance to drought stress. ECM associations generally improve plant performance but act as strong carbon sinks, altering carbon allocation within the root system and modifying its architecture. A high degree of ECM colonization has been associated with increased root branching and the formation of short, swollen root tips. However, the role of ECM in shaping root system functional architectural traits remains unclear.

For instance, root diameter is a key trait differentiating fundamentally different functions, with fine roots mainly serving resource uptake and coarse roots mainly serving axial transport. Yet, studies observed ECM colonization leading to both stimulation and suppression of fine‑root production. These contrasting findings might derive from the widespread use of the <2 mm diameter threshold to define fine roots, a broad range lumping together root structures that differ both anatomically and functionally.

In this study, we distinguish two functionally different components of the fine-root system: ultrafine, absorptive feeder roots (diameter <0.5 mm) and thicker, transport/structural fine roots (0.5–2 mm). We then determine whether the degree of ECM colonization is associated with relative changes in ultrafine (<0.5 mm) root abundance.

We collected root samples from oak (Quercus petraea), beech (Fagus sylvatica), and larch (Larix decidua) saplings planted in 2024 at three sites in Northern Luxembourg that differ in land‑use history. At planting, half of the saplings received a commercial mycorrhizal inoculant. We stained root system subsamples with lactophenol cotton blue to facilitate ECM detection and counted the colonized root tips under a digital microscope. All root samples were later imaged using a flatbed scanner, and images were analyzed with WinRhizo software to quantify root length distribution across seven diameter classes (from <0.1 mm to 0.6-2 mm, in 0.1 mm increments). We then assessed relationships between ECM colonization and the proportion of ultrafine roots (< 0.5 mm) for each root sample.

The analysis revealed an overall negative correlation between ECM colonization and ultrafine root proportion. However, when examining sites separately, this trend was not observed at the site with former pasture land use. There, inoculated saplings showed both relatively high ECM colonization and high ultrafine root proportion. As the other two sites were former spruce stands (typically nutrient-poor), we argue that the greater nutrient availability at the ex-pasture site promoted the production of ultrafine roots, whereas high ECM colonization may reflect the legacy of the inoculation treatment rather than indicating substantial hyphal activity. Ongoing soil nutrient analyses will help confirm this interpretation.

Overall, the results suggest that, in nutrient poor soils, root systems may adjust their ultrafine feeder root proportion according to the degree of mycorrhization. We argue that this adjustment may potentially allow plants to maximize the benefits of the ECM association by reducing investment in short-lived feeder roots, whose function can be replaced by ECM.

How to cite: Ceolin, S., Schymanski, S., Gerekens, J., Juilleret, J., and Hissler, C.: Ectomycorrhizal colonization reduces ultra-fine root abundance, EGU General Assembly 2026, Vienna, Austria, 3–8 May 2026, EGU26-20261, https://doi.org/10.5194/egusphere-egu26-20261, 2026.

EGU26-20953 | Posters on site | BG3.27

Fungal Community Responses in Tiny Forests in Urban Areas in Germany  

Miriam Schalamun, Stefan Scharfe, Petra Pjevac, and Woflgang Hinterdobler

Urbanization highly impacts soil properties and microbial communities in remaining soil patches. Tiny Forests, small densely planted native forest patches, represent an increasingly widespread nature-based solution to restore urban biodiversity. However, empirical data on their soil microbial communities remain scarce.

In this study we assessed fungal communities in ten Tiny Forests and ten paired adjacent urban open spaces (control sites) in Berlin and Frankfurt, Germany, using DNA metabarcoding.

We could show, that urban soils harbored high fungal diversity, with significant variation between Tiny Forests and control sites as well as among individual sites. Tiny Forests supported fungal communities specialized in decomposition and nutrient cycling, while control sites showed higher overall species richness. Community composition differed between Tiny Forests and control sites, yet site-specific patterns revealed that local environmental conditions highly shape fungal communities alongside land use effects.

Taxonomic patterns indicated that differences between Tiny Forests and control sites were not limited to community structure but also involved shifts in dominant taxa. Control sites showed higher abundances of plant-associated and potentially pathogenic fungi, whereas Tiny Forests were characterized by saprotrophic taxa linked to organic matter turnover and nutrient mobilization. In addition, regional differences between Berlin and Frankfurt contributed to community composition, emphasizing the combined influence of vegetation, soil conditions, and local environmental context.

These findings show that Tiny Forests harbor distinct fungal communities compared to adjacent control sites, with a shift toward saprotrophic taxa involved in decomposition and nutrient cycling. Our results indicate that Tiny Forests can alter urban soil fungal communities, though the strong site-specific variation highlights that local environmental conditions play an equally important role in shaping these communities.

How to cite: Schalamun, M., Scharfe, S., Pjevac, P., and Hinterdobler, W.: Fungal Community Responses in Tiny Forests in Urban Areas in Germany , EGU General Assembly 2026, Vienna, Austria, 3–8 May 2026, EGU26-20953, https://doi.org/10.5194/egusphere-egu26-20953, 2026.

EGU26-21365 | ECS | Orals | BG3.27

Richness, community structure and distance decay of soil fungi along a sharp aridity gradient in monodominant pine forests 

Stav Livne- Luzon, Amal Hibner, Lior Herol, Camille Troung, Tamir Klein, and Hagai Shemesh

Understanding how aridity shapes fungal communities is essential for predicting ecosystem responses to climate change. Monodominant forests of Aleppo pine (Pinus halepensis) occurring along a steep precipitation gradient, offer the opportunity to test the effect of aridity on distance decay patterns of soil fungi, without the confounding effects of vegetation. We conducted nested soil sampling in four Mediterranean, two semi-arid and three arid forests along an aridity gradient (250-800 mm annual precipitation) and examined distance decay patterns of saprotrophic (SAP) and ectomycorrhizal (ECM) fungi at different spatial scales. ITS2 soil metabarcoding revealed that both fungal richness and diversity increased with precipitation. Fungal communities showed significant spatial autocorrelation at multiple scales, with stronger distance decay patterns in Mediterranean than arid forests. ECM and SAP communities in arid sites were largely subsets of the Mediterranean climate communities. Stochastic assembly processes dominated under mesic conditions, while deterministic processes prevailed in arid regions, particularly for ECM fungi. Our results suggest that aridity can reduce fungal richness and stochasticity in community assembly, and that climate can structure fungal communities independently of vegetation. This study highlights the need to consider scale-dependent ecological processes and emphasizes the role of climate, beyond vegetation, in shaping fungal community assembly in forest soils.


How to cite: Livne- Luzon, S., Hibner, A., Herol, L., Troung, C., Klein, T., and Shemesh, H.: Richness, community structure and distance decay of soil fungi along a sharp aridity gradient in monodominant pine forests, EGU General Assembly 2026, Vienna, Austria, 3–8 May 2026, EGU26-21365, https://doi.org/10.5194/egusphere-egu26-21365, 2026.

EGU26-2865 | ECS | Posters on site | BG3.28

From Moss to Mineral: Soil Organic Carbon Fractionation under Bryophytes in Temperate Forests 

Madhavi Parajuli, Rabindra Adhikari, Xiaoxia Yang, Thomas Scholten, Steffen Seitz, and Corinna Gall

The persistence of soil organic carbon (SOC) in forest ecosystems depicts not only the quantity of organic matter (OM) inputs but also how carbon (C) is distributed among functionally distinct soil pools with different roles. In forest ecosystems, mosses significantly influence SOC dynamics not merely by increasing surface C stocks, but by altering its partitioning into more persistent, mineral associated fractions. However, the influence of mosses on C stability in occluded and mineral-associated SOM fractions based on contrasting temperate forest types has rarely been quantified.

To address this knowledge gap, our study aims to characterize and quantify soil particulate organic matter (POM) fractions to assess C sequestration potential under moss cover and forest types. A total of 42 soil samples were collected from coniferous mixed (Baden-Württemberg) and pine forests (Brandenburg) from the top soil layer (0-2 cm) with and without mosses. Physical density fractionation was done to quantify SOC distribution among free POM (FPOM), occluded POM (OPOM), and mineral-associated POM (MAPOM) which represent soil pools with varying turnover times.

The moss cover across coniferous mixed forest significantly increased the C concentration in MAPOM by up to 75% which indicate a long- term C stabilization via stable MAPOM. But the scenario was different for pine forest, where mosses significantly increased the C:N ratio of labile fractions which denote different decomposition dynamics. The results also indicate that the long-term SOC sequestration was highest in the moss-covered coniferous forests which stored about six- fold more C in MAPOM than pine forests. Further results will be presented at EGU 2026.

How to cite: Parajuli, M., Adhikari, R., Yang, X., Scholten, T., Seitz, S., and Gall, C.: From Moss to Mineral: Soil Organic Carbon Fractionation under Bryophytes in Temperate Forests, EGU General Assembly 2026, Vienna, Austria, 3–8 May 2026, EGU26-2865, https://doi.org/10.5194/egusphere-egu26-2865, 2026.

Biological nitrogen (N) fixation by cyanobacteria on mosses is a critical N source for pristine ecosystems, but studies have largely focused on northern ecosystems, such as boreal and arctic regions. The contribution of moss-associated N fixation in Mediterranean ecosystems remains largely neglected, despite the high abundance of mosses in Mediterranean forests and previous evidence of substantial N fixation activity by their associated cyanobacteria. Here, we combined high-frequency in situ measurements of N fixation in Mediterranean mosses from forest and open sites with a process-based model that incorporates moss-associated N fixation responses to key climatic drivers (light, temperature, humidity). This integrated approach allows us for the first time to simulate diurnal and seasonal dynamics of N fixation and to upscale these dynamics to estimate annual N fixation rates. Our results highlight substantial nocturnal N fixation and indicate that large-scale estimates of N fixation across space and time derived from limited, single-time-point field measurements may be associated with considerable uncertainty. The presented model provides a new framework for simulating N fixation by moss-associated cyanobacteria.

How to cite: Ma, Y. and Rousk, K.: Temporal variation of nitrogen fixation in moss-cyanobacteria associations in the Mediterranean region: integrating experiments and process-based modelling, EGU General Assembly 2026, Vienna, Austria, 3–8 May 2026, EGU26-5644, https://doi.org/10.5194/egusphere-egu26-5644, 2026.

EGU26-7122 | ECS | Posters on site | BG3.28

Future Range Shifts and Diversity Patterns of Antarctic Lecideoid Lichens Under Climate Change Scenarios 

Anna Götz, Mikhail Andreev, Robert R. Junker, Lea Maislinger, Leopoldo G. Sancho, Wolfgang Trutschnig, and Ulrike Ruprecht

Being uniquely adapted to extreme environmental conditions, rock-dwelling lecideoid lichens are a diverse and major component of terrestrial vegetation in Antarctica. Climate change is reshaping Antarctic ecosystems, potentially forcing cold-adapted species to shift their distributions to maintain their climatic niche. Here, we provide a circum-Antarctic assessment of lecideoid lichen diversity and project future distributional changes under contrasting climate change scenarios.

Fungal (mycobiont) and algal (photobiont) symbionts of lecideoid lichen species from a circum-Antarctic sampling were classified using DNA barcoding. The climatic niches of nine common mycobiont species and four photobiont OTUs were predicted, and spatial range shifts were projected across four Antarctic bioregions under three Shared Socioeconomic Pathways: (1) SSP1-2.6: sustainable development, (2) SSP3-7.0: medium–high reference scenario with high methane emissions and (3) SSP5-8.5: continued dependence on fossil fuels.

DNA-barcoding revealed 34 species of lecideoid lichens associated with nine photobiont OTUs for the Antarctic continent, including three previously undescribed species of the genus Lecidella.

Model projections indicate that future warming is likely to promote a range expansion rather than climate-induced habitat loss for both mycobionts and photobionts. Patterns of climate-induced range expansion differ markedly between maritime Antarctica and continental Antarctica. In the maritime Antarctic, Lecidea atrobrunnea and its main photobiont Tr_I01 are predicted to substantially increase their potential distribution, whereas the other species remain restricted to climatically distinct south-eastern regions of maritime Antarctica. In continental Antarctica, species show broadly similar expansion patterns, with the Transantarctic Mountains representing the region with the greatest projected gain in climatically suitable habitat.  Although the greatest range expansion generally occurs under SSP5-8.5, some photobiont OTUs in the Prince Charles Mountains are projected to gain more climatically suitable habitat under the high-methane scenario SSP3-7.0. Notably, areas of high climatic suitability are predicted to shift towards inland regions under future warming scenarios. Consequently, ice-free areas may function as potential refugia for cold-adapted lichen species under ongoing climate warming.

Overall, our results indicate that Antarctic lecideoid lichens are likely to undergo widespread range expansion under future warming, particularly into currently uncolonized ice-free inland areas of continental Antarctica. Projected shifts in climatically suitable areas suggest the emergence of new habitats, with potential consequences for future biodiversity patterns across Antarctica.

How to cite: Götz, A., Andreev, M., Junker, R. R., Maislinger, L., Sancho, L. G., Trutschnig, W., and Ruprecht, U.: Future Range Shifts and Diversity Patterns of Antarctic Lecideoid Lichens Under Climate Change Scenarios, EGU General Assembly 2026, Vienna, Austria, 3–8 May 2026, EGU26-7122, https://doi.org/10.5194/egusphere-egu26-7122, 2026.

EGU26-7206 | ECS | Orals | BG3.28

Mapping of Rodent-Induced Disturbance Impact on Biological Soil Crusts via Deep Learning-Informed Adaptive Graph Cut 

Ruilin Chen, Benfeng Yin, Wei Yang, Zeteng Li, Jianlong Li, Yao Tang, Anqi Li, Kai Tang, Yuanming Zhang, Bettina Weber, and Jin Chen

Biological soil crusts (biocrusts) function as a "living skin" at the soil–atmosphere interface, covering approximately 12% of the global terrestrial surface and providing critical ecosystem services. While climate change and anthropogenic pressures are recognized drivers of biocrust degradation, the extensive disturbance induced by rodent communities represents a pervasive yet under-recognized threat. Rodent burrowing activities mechanically destroy biocrusts, creating a distinctive landscape mosaic of high-albedo, excavated soil patches set against the darker, intact biocrust matrix. In this study, we present a hybrid mapping framework that integrates both data- and model-driven approaches to generate the first regional-scale, multi-year (2017–2025) spatiotemporal map of rodent-induced disturbance in the Gurbantunggut Desert, China. Our methodology employs a two-stage strategy: (1) To identify potential disturbance areas, a Swin Transformer segmentation model is trained using semi-automatically generated pseudo-labels leveraging thresholding based on the brightness contrast between burrows and biocrusts. (2) Final boundaries are then optimized through an adaptive Graph Cut algorithm that integrates deep-learning probability maps with morphological priors and spatial gradient information. Validated against 125 field-surveyed sites, the framework achieved an overall accuracy of 0.95, with specific F1-scores for rodent-induced disturbance and background reaching 0.81 and 0.98, respectively. Our analysis revealed that rodent-induced disturbances followed a "rise-and-fall" temporal trend, peaking around 2019. At its peak, the disturbed area accounted for 8% of the entire desert region, representing a striking 23% of the total biocrust coverage. This work offers a reliable methodology and dataset to assess and understand the neglected role of bioturbation in dryland ecology. Our study is highly relevant for dryland conservation, exemplifying how bioturbation shapes desert ecosystem stability and the functional integrity of biocrust-dominated landscapes.

How to cite: Chen, R., Yin, B., Yang, W., Li, Z., Li, J., Tang, Y., Li, A., Tang, K., Zhang, Y., Weber, B., and Chen, J.: Mapping of Rodent-Induced Disturbance Impact on Biological Soil Crusts via Deep Learning-Informed Adaptive Graph Cut, EGU General Assembly 2026, Vienna, Austria, 3–8 May 2026, EGU26-7206, https://doi.org/10.5194/egusphere-egu26-7206, 2026.

EGU26-7322 | Orals | BG3.28

Light intensity and temperature drive growth investment strategies during resuscitation in desert biocrust communities 

Jaber Abbaszadeh, Stefanie Imminger, Dagmar Woebken, and Dimitri Meier

Drylands cover ~46%% of Earth's surface and support diverse life forms despite water scarcity. In such a harsh environment, living organisms, including microorganisms, lichens, algae, and mosses, form a few mm-thick structure called biological soil crusts (biocrusts), that prevent soil erosion and play a crucial role in ecosystem stability. Biocrusts host microbial communities that survive desiccation by entering a dormant state, reducing metabolic activity. Upon rehydration, the reactivation of these organisms, followed by energy-generating metabolisms and DNA repair, sustains their survival. Previously, we studied microbial activation after a rain event in the daytime at 27 °C1, while nighttime responses at cooler temperatures remained unexplored. Here, we investigate whether microbial reactivation dynamics vary under contrasting light and temperature regimes, and whether these differences are reflected in resource allocation strategies during early rehydration.

A rehydration experiment was conducted in the dark with biocrusts sampled at the LTER Avdat site in the Negev Desert, Israel. Biocrusts were rehydrated (to 75% water-holding capacity) in a climate-controlled chamber, followed by 12 h of night condition at 19°C and 10 h of day at 27 °C with a 2 h transition. The previously conducted light incubation resulted in desiccation of the biocrusts within 39 hours, whereas nighttime incubation resulted in desiccation within 55 hours. Samples were collected at multiple time points during this experiment for metatranscriptome sequencing. RNA reads were mapped to metagenome-assembled genomes (MAGs) from the same samples for differential gene expression analysis.

Metatranscriptomic analyses revealed a rapid reactivation pattern in both conditions. In the dark, about 70% of MAGs showed significant differential gene expression within 15 minutes of rehydration, increasing to 93% of MAGs between 15 minutes and 3 hours. At daytime, 85% of MAGs reactivated in the first 15 minutes and increased to 95% in three hours. During the early hydration stage, dark-incubated samples exhibited a delayed but increasing transcriptional response, with a higher number of differentially expressed genes per MAG between 30 minutes and 3 hours compared to the light-incubated samples. The light-incubated samples exhibited a stronger initial response within the first 30 minutes, followed by fewer changes at later time points. Consistent with this pattern, a ribosomal-protein-based growth index, calculated as the mean normalized expression of ribosomal protein genes per MAG, remained higher during the first 3 hours under dark-incubated conditions but peaked earlier and declined by 3 hours under light-incubated conditions, despite comparable water availability. Together, these results indicate that hydration at dark and cooler conditions supports a more prolonged and gradual transcriptional adjustment, accompanied by sustained investment in translational capacity, whereas daylight and warmer conditions promote a rapid early response followed by earlier stabilization of core cellular functions.

  • Imminger, S. et al. Survival and rapid resuscitation permit limited productivity in desert microbial communities. Nat. Commun. 15, 3056 (2024).

How to cite: Abbaszadeh, J., Imminger, S., Woebken, D., and Meier, D.: Light intensity and temperature drive growth investment strategies during resuscitation in desert biocrust communities, EGU General Assembly 2026, Vienna, Austria, 3–8 May 2026, EGU26-7322, https://doi.org/10.5194/egusphere-egu26-7322, 2026.

Climate projections predict that warming, drought frequency and severity, and water stress will increase in drylands at rates faster than the global means. Notably, drylands, which cover more than 41% of Earth’s terrestrial surface, support various desert ecosystems. An increasing amount of solid evidence indicates that considering biocrusts is of paramount importance when assessing the direct and indirect impacts of climate change on global desert functioning and highlights the significance of biocrusts as modulators of these impacts. Changes in the precipitation regime have stronger negative impacts than warming on the biocrust component and structure, as well as on the linked ecosystem functioning; however, the impacts of warming coupled with precipitation alterations are more prominent. Climate change induces inconsistent responses to warming and precipitation alteration in the biocrust cryptogams, such as mosses and lichens. Warming coupled with precipitation alterations contributes to reducing the wet period and biocrust water availability for lichens and mosses to fix atmospheric CO2 and N2, leading to drought stress and a potential biocrust backslide from the late successional stage to the early stage, which in turn results in global decreases in dryland carbon and nitrogen due to deficits in biocrust carbon sequestration and nitrogen fixation. Alterations of the water balance can also occur when warming influences infiltration, runoff, non-rainfall water entrapment, evaporation and soil water reallocation. These changes in the biocrust ecosystem functioning are unlikely to be conducive to both passive and artificially facilitated eco-restoration of drylands. Conversely, to a large extent, the presence of well-developed biocrusts regulates and alleviates the negative impacts of climate change on dryland ecosystems.

How to cite: Li, X. and Dou, W.: Warming decreases the desert ecosystem functioning of global drylands by altering biocrust cryptogams, EGU General Assembly 2026, Vienna, Austria, 3–8 May 2026, EGU26-8463, https://doi.org/10.5194/egusphere-egu26-8463, 2026.

Global climate change is projected to cause a dramatic increase in precipitation uncertainty (increased or decreased precipitation) in the future, particularly in semiarid ecosystems. Biocrusts are a critical surface cover in semiarid regions, occupying 12% of the global land surface. They perform various ecological functions by influencing soil properties, such as regulating soil water and nutrient cycles, carbon and nitrogen sequestration, biodiversity, and vegetation recovery—effectively impacting nearly all surface ecological processes. Notably, they influence soil carbon emissions through respiration, thereby regulating the carbon balance in drylands. However, the patterns and mechanisms by which biocrust soil respiration responds to precipitation changes under semiarid climates remain unclear. Our precipitation manipulation experiment (–50%, –30%, –10%, +10%, +30%, and +50% of CK) conducted on the Chinese Loess Plateau revealed that increased precipitation (+10% to +50%) suppressed biocrust formation, while moderate precipitation (–10% and –30%) reduction promoted biocrust development. Compared to natural precipitation, increased precipitation (+10% to +50%) reduced biocrust respiration rates by 8.9%–22.1%. Conversely, moderate precipitation reductions (–10% and –30%) enhanced biocrust respiration rates, whereas extreme drought stress (–50%) suppressed these rates. Therefore, the response of biocrust soil respiration to precipitation changes exhibits a negative asymmetry effect. Our structural equation model further indicates that soil temperature and biocrust traits are the primary factors influencing the response of biocrust soil respiration to precipitation variations. These findings suggest that intensified precipitation variability driven by future global climate change may positively impact the stability of soil carbon stocks contributed by biocrusts in semiarid regions, thereby reducing dryland soil carbon emissions.

How to cite: Dou, W. and Li, X.: Asymmetric negative effects of precipitation changes on soil respiration of cryptogamic biocrusts in semiarid ecosystems, EGU General Assembly 2026, Vienna, Austria, 3–8 May 2026, EGU26-8612, https://doi.org/10.5194/egusphere-egu26-8612, 2026.

EGU26-11262 | ECS | Orals | BG3.28

Climate change effects on biological soil crusts in high-alpine regions: experimental setup and first insights 

Janne Creve, Philipp Faulhammer, Stefan Herdy, Stefanie Maier, Minsu Kim, Luciano De Melo Silva, Lina Avila Clasen, Gerald Auer, Markus Herndl, and Bettina Weber

The Alps are warming at approximately twice the global mean rate, accompanied by altered precipitation regimes and rapid snow and ice loss. In high-alpine ecosystems, where low temperatures and short growing seasons constrain the establishment of vascular plants, biological soil crusts (biocrusts) form cohesive surface communities that can become a dominant biological component of the landscape. Composed of cyanobacteria, algae, lichens, and bryophytes, along with heterotrophic bacteria, archaea, and fungi, biocrusts play a key role in soil stabilization, water retention, and carbon and nitrogen cycling. Despite their ecological importance, biocrust responses to climate warming in alpine environments remain poorly understood.

To address this, we developed an integrated, field-based experimental framework to investigate alpine biocrust responses to climate change under realistic conditions in the high-alpine region of the Großglockner (Austria). The setup consists of a full-factorial design combining active infrared warming and manual snow-removal treatments. Biocrust responses are monitored using continuous meso- and microclimatic measurements, repeated image-based classification of surface cover using machine-learning methods, and complementary field sampling targeting DNA-based microbial community composition, nutrient availability, and soil aggregate stability.

The project was launched in May 2024. Following installation and optimization, the setup was fully operational throughout the 2025 growing season, providing a first complete field dataset for assessing warming effects on alpine biocrusts.

The experimental warming setup proved to work reliably under high-alpine conditions, with a minor decline in treatment performance towards the end of the growing season. Microclimatic measurements revealed that the warming treatment increased biocrust surface temperatures by approximately 3 °C and soil temperatures at a 5 cm depth by about 2 °C during most of the season, whereas mesoclimatic measurements captured the characteristic seasonal patterns of the high-alpine climate. Mapping of surface cover revealed pronounced seasonal dynamics in coverage, with vascular plants and mosses peaking and cyanobacteria-dominated crusts declining in the middle of the growing season, while lichen cover remained comparatively stable. More in-depth results on microbial composition and effects on nutrient availability are currently being analysed.

This novel experimental field setup improves our understanding of the resilience and functioning of alpine biocrusts under climate warming and their role in high-alpine ecosystem dynamics.

How to cite: Creve, J., Faulhammer, P., Herdy, S., Maier, S., Kim, M., De Melo Silva, L., Avila Clasen, L., Auer, G., Herndl, M., and Weber, B.: Climate change effects on biological soil crusts in high-alpine regions: experimental setup and first insights, EGU General Assembly 2026, Vienna, Austria, 3–8 May 2026, EGU26-11262, https://doi.org/10.5194/egusphere-egu26-11262, 2026.

EGU26-12260 | ECS | Posters on site | BG3.28

Biopatinas: Cryptogams in urban environment as potential biofilters, CO2 sinks, and bioremediation systems 

Asma Fathinejad, Laura Rabbachin, Minsu Kim, Bettina Weber, and Katja Sterflinger

Biopatina refers to cryptogamic organisms that naturally thrive on urban architectural surfaces, such as buildings, stone walls, and monuments, often influencing the surface coloration and structure. Similar to other cryptogams that thrive in natural environments, biopatinas represent photosynthetic communities composed of various organisms that serve numerous ecosystem functions. Here, we hypothesize that biopatinas can provide a microclimatic cooling effect, serve as a valuable carbon sink, and function as natural biofilters by trapping particulate matter and dust. Additionally, we suggest that they may act as a bioremediation system for breaking down polycyclic aromatic hydrocarbons (PAHs). Our hypothesis will be investigated on representative biopatinas on building surfaces in the city of Vienna in the framework of our project “Biopatinas on buildings in urban environments” funded by WWTF (Wiener Wissenschafts-, Forschungs- und Technologiefonds). We will collect biopatina as well as uncolonized samples from randomly selected buildings during two different seasons (e.g., summer and winter). On these samples, we will conduct CO₂ gas exchange measurements to assess the carbon fixation and measure the dust entrapment properties of wet and dry biopatina. Furthermore, the role of biopatina in regulating surface temperature of building walls will be examined under varying hydration conditions. Since the function of biopatina is related to its microbial composition, we will characterize its composition by means of metagenomics. We will map the biopatina coverage in a representative part of Vienna to be used for upscaling in order to develop predictive models.

In this highly interdisciplinary project, the scientific approach will be supported by the use of participatory art-based practices to achieve greater public awareness and acceptance of biopatina on monuments and architecture in the city. The results of our study will help to embrace the functional complexity of biopatina, which will be essential for protecting cultural heritage, increasing urban environmental quality, and developing biologically informed solutions for sustainable cities.

How to cite: Fathinejad, A., Rabbachin, L., Kim, M., Weber, B., and Sterflinger, K.: Biopatinas: Cryptogams in urban environment as potential biofilters, CO2 sinks, and bioremediation systems, EGU General Assembly 2026, Vienna, Austria, 3–8 May 2026, EGU26-12260, https://doi.org/10.5194/egusphere-egu26-12260, 2026.

EGU26-14839 | Orals | BG3.28

CrustNet: Global determinants of biodiversity in biocrusts, and outcomes for ecosystem function, resistance and resilience 

Matthew Bowker, Sierra Gugel, Javier Ceja-Navarro, Anita Antoninka, Sasha Reed, and Anthony Darrouzet-Nardi

Around the world, and for the past ~2 billion years, surfaces of many soils have a “living skin” made by tiny plants and microbes called a biological soil crust (biocrust). Biocrusts are crucially important for helping to support the ecosystems they inhabit, for example making soil fertile, storing or redirecting water and stopping erosion. Biocrusts also boost the variety of living things present in an area (biodiversity). The CrustNet project will determine what controls the biodiversity of biocrusts globally for the first time, and its outcomes. CrustNet is a networked, distributed study of biocrust ecology, with participants around the world. Participants conduct the same set of studies and collect the same types of data to be pooled together to create an unprecedented global database about biocrusts.  CrustNet addresses: (1) The determinants of the global scale functional biodiversity of biocrusts (2) determinants of the variability and shape of the relationship between biodiversity and ecosystem function across ecosystems, (3) effects of biocrust functional biodiversity on ecosystem resistance and resilience to physical disturbance and climate change, and (4) determinants of plant-biocrust co-occurrence patterns. CrustNet uses a tiered research protocol, including low-cost observational studies and manipulative experiments. Tier 1 includes mandatory detailed surveys of the composition of biocrusts, measurement of ecosystem functions along a biocrust development gradient, and contribution of samples to a trait database. Tier 2 includes low-cost experimentally-applied physical disturbance of the soil and subsequent tracking of the response of biocrusts. Tier 3 includes experimental climate manipulations using reciprocal transplantations and rainfall reduction using passive shelters. These studies will be foundational to our understanding of determinants of biocrust diversity, function and response to disturbance. To date, 14 sites in 5 nations have already been established and sampled, and pledged sites are ever increasing (23 additional sites have been proposed by international sampler-partners). In the process of conducting this research, a world-wide collaboration is being established, leading to greater participation of researchers from diverse backgrounds, and unparalleled training opportunities.

How to cite: Bowker, M., Gugel, S., Ceja-Navarro, J., Antoninka, A., Reed, S., and Darrouzet-Nardi, A.: CrustNet: Global determinants of biodiversity in biocrusts, and outcomes for ecosystem function, resistance and resilience, EGU General Assembly 2026, Vienna, Austria, 3–8 May 2026, EGU26-14839, https://doi.org/10.5194/egusphere-egu26-14839, 2026.

EGU26-16360 | ECS | Orals | BG3.28

Assessing the contribution of microbial primary production to the SOC pools of arid lands. 

Sarah Koger and Ferran Garcia-Pichel

Primary production by photosynthetic soil microbes can contribute to SOC, and this
contribution can take on additional significance in regions where plant productivity is
restricted, as is the case of arid lands. However, a quantitative rate assessment of these
contributions anywhere is still lacking. We used a combination of direct determinations
and meta-analyses of published literature on a large survey of biological soil crust
communities (biocrusts) dominated by cyanobacteria in US arid regions to obtain
relevant estimates. Directly measured SOC accumulation rates in a single site during a
five-year period yielded an estimate of 3.5 ± 2.2 g C m -2 y -1 in the top 1 cm of soil. Indirect
estimates from a multisite (n= 127) but single time-point survey using Chl a content as a
proxy for biocrust development, which was translated to actual time units using rates of
Chl a accumulation obtained from meta-analyses of the literature, yielded an estimate of
6.2 ± 2.0 g C m -2 y -1 for the same parameter. In order to obtain values integrated
through the soil profile, we used a generalized depth decay relationship in SOC under
biocrusts obtained from a survey of soil cores (n = 93). This resulted in contributions to
the overall SOC pool of 0.0630.039 Kg C m -2 yr -1 (single site) and 0.112 ± 0.036 Kg C
m -2 yr -1 (multi-site). Biocrust sit atop SOC stocks ranging from 1.6 to 5.5 Kg m -2 , not
significantly different from those typical of arid and semiarid pedons. Their average
contribution to these pools through a biocrust’s lifetime (by subtraction of the pools
under crustless soils) is estimated at 1.26 Kg C m -2 Kg m -2 . Not having resisted the
temptation to scale up, and based on published global assessments of biocrust cover,
some 22-33 PgC globally, or some 6-8 % of the global SOC pool in arid lands, may be
attributable to microbial photosynthate.

How to cite: Koger, S. and Garcia-Pichel, F.: Assessing the contribution of microbial primary production to the SOC pools of arid lands., EGU General Assembly 2026, Vienna, Austria, 3–8 May 2026, EGU26-16360, https://doi.org/10.5194/egusphere-egu26-16360, 2026.

EGU26-17334 | ECS | Orals | BG3.28

Microclimatic measurement setup to assess the physiological activity patterns of epiphytic cryptogamic communities in the Amazon rainforest 

Philipp Faulhammer, Lina Avila Clasen, Stefan Herdy, Maíra Conde, Carla Webber, Cybelli Barbosa, Nanu Frechen, Gerhard Kast, Cleo Quaresma, and Bettina Weber

Cryptogamic communities (CC) consist of photoautotrophic lichens, bryophytes, algae, and cyanobacteria, as well as heterotrophic fungi, bacteria, and archaea. They colonize soils, rocks, tree stems and leaves across the globe. In the Amazon rainforest, they cover large amounts of tree stem surfaces and potentially play key roles in biogeochemical cycling in these regions. These processes include carbon and nitrogen fixation, as well as water and nutrient cycling. In addition, they emit bioaerosols and are involved in the exchange of volatile organic compounds. Since these processes are driven by the availability of water, light and temperature, knowledge of these parameters is essential in order to quantify these processes at ecosystem scales.

Here we present a novel microclimate sensor system that has been installed on eight trees in two different forest types in the Amazon rainforest. On each tree, sensors measuring temperature, light intensity, and water content of representative bryophytes at 10-minute intervals were installed at three different heights (near ground, at the main stem and in the canopy) in two expositions (north and south). Measurements are sent wirelessly from each tree to a server where data are post-processed, automatically checked for validity and sent to a cloud storage for further analysis. First measurement results of the system provide insights into day and night patterns as well as the hydration status of the investigated bryophyte communities depending on the colonized habitat (height, exposition). Long-term measurements and analyses will improve our understanding of the dynamics of the physiological processes of CC in times of changing climatic conditions, and will serve as a foundation for the upscaling of functional processes.

How to cite: Faulhammer, P., Avila Clasen, L., Herdy, S., Conde, M., Webber, C., Barbosa, C., Frechen, N., Kast, G., Quaresma, C., and Weber, B.: Microclimatic measurement setup to assess the physiological activity patterns of epiphytic cryptogamic communities in the Amazon rainforest, EGU General Assembly 2026, Vienna, Austria, 3–8 May 2026, EGU26-17334, https://doi.org/10.5194/egusphere-egu26-17334, 2026.

EGU26-19484 | ECS | Orals | BG3.28

Interspecies bacterial infomolecules facilitate nutrient exchange in biological soil crusts 

Finlay Warsop Thomas, Jake Drewes, Corey Nelson, Julie Bethany, Emily Higgins Keppler, Suzanne Kosina, Trent Northen, Heather Bean, and Ferran Garcia-Pichel

Nitrogen fixation is crucial for the ecology of N-limited drylands. An important, though only recently recognized, plant-independent avenue for N2-fixation takes place in desert topsoils through “C-for-N” mutualisms between specific heterotrophic diazotrophs and the cyanobacterium Microcoleus vaginatus, where partners need to come together into spatially close and partner-specific associations within the background of a diverse soil microbiome. We hypothesized that chemical signaling within the partner microbe’s exometabolome influences the motility behavior of mutualists, enabling them to collocate and stay together. Although well-characterized in the context of trans-kingdom symbiosis, the use of infomolecules to shape microbiomes in exclusively bacterial mutualisms has not yet been described. Using a combination of culture and field research, exometabolomic analyses, and chemotaxis assays, we showed that the M. vaginatus exometabolome can elicit the enrichment of heterodiazotrophs from the soil microbiome. This effect, when the cyanobacterium is N-starved, could be traced to three specific compounds: N-acetylglutamic acid, N-acetyl-L-methionine, and indole-3-acetic acid, which are only significantly produced under this condition. Together with prior reports that M. vaginatus similarly responds to molecular prompts through GABA and glutamate from carbon-starved heterotrophs, our findings unravel a bidirectional chemical dialogue between partners that can sustain symbiotic proximity in space and time. Interestingly, some, though not all of these infomolecules act as such in plant and animal systems. Together with its unique mode of N-transfer through urea, this keystone symbiosis in drylands can maintain its specificity even in an “open system” through the use of infomolecules and specific chemotactic responses, which also allow M. vaginatus to architect a microbiome that is tailored to its nutritional needs. 

How to cite: Warsop Thomas, F., Drewes, J., Nelson, C., Bethany, J., Higgins Keppler, E., Kosina, S., Northen, T., Bean, H., and Garcia-Pichel, F.: Interspecies bacterial infomolecules facilitate nutrient exchange in biological soil crusts, EGU General Assembly 2026, Vienna, Austria, 3–8 May 2026, EGU26-19484, https://doi.org/10.5194/egusphere-egu26-19484, 2026.

EGU26-19547 | ECS | Posters on site | BG3.28

Symbiotic microbiota of cryptogams regulate VOC emissions and nitrogen fixation in subarctic tundra 

Wanying Zhang, Annika Engroff, Yi Jiao, Kajsa Roslund, Danillo Alvarenga, Kathrin Rousk, and Riikka Rinnan

Cryptogams (mosses, lichens and liverworts) are widespread and can influence nitrogen cycling and biosphere–atmosphere exchange of volatile organic compounds (VOCs), especially in high-latitude ecosystems. However, the contributions of their symbiotic microbiota (e.g. cyanobacteria and other diazotrophs) to both N fixation and VOC emissions remain relatively underexplored. Here, we conducted controlled incubations of multiple subarctic cryptogam species before and after the removal of their symbiotic microbiota on the surface. We quantified N fixation activity using acetylene reduction assays and characterised VOC emissions using complementary GC–MS and PTR–TOF–MS measurements. Preliminary results showed that N fixation rates decreased significantly in several moss species after the removal of the symbiotic microbiota, whereas responses in lichens and liverwort were weaker or non-significant. Both total VOC emission rates and composition were altered for most species. A random forest model identified several sesquiterpenes (SQTs) as key discriminant compounds; their emission rates were increased after the removal of surface-associated symbionts from the cryptogams. Partial least squares analysis further revealed coupling between selected VOC fingerprints and N fixation rates. Overall, these results demonstrate that removable surface symbionts can concurrently regulate cryptogam N fixation and VOC emissions in subarctic systems, with potential implications for ecosystem N inputs and VOC-mediated atmospheric chemistry.

How to cite: Zhang, W., Engroff, A., Jiao, Y., Roslund, K., Alvarenga, D., Rousk, K., and Rinnan, R.: Symbiotic microbiota of cryptogams regulate VOC emissions and nitrogen fixation in subarctic tundra, EGU General Assembly 2026, Vienna, Austria, 3–8 May 2026, EGU26-19547, https://doi.org/10.5194/egusphere-egu26-19547, 2026.

EGU26-20686 | ECS | Orals | BG3.28

Linking functional traits and spectral responses of biocrust at different scales 

Juan Francisco Martinez Sanchez, Carlos Adolfo Urueta Urueta, Carlotta Pagli, Eva Maria Martinez Sanchez, Janira Fernandez Galera, Raul Ramon, Sonia Chamizo de la Piedra, Yolanda Canton, and Emilio Rodriguez Caballero

Biological soil crusts or biocrusts, are complex communities composed of photoautotrophic organisms (cyanobacteria, algae, lichens, and bryophytes) and heterotrophs living in intimate association with soil surface particles covering most open areas of drylands. These poikilohydric communities play a crucial role in the functioning of dryland ecosystems by regulating water, carbon, and nitrogen cycles, stabilizing soil and preventing erosion. In addition, biocrusts accumulate protective and photosynthetic pigments such as scytonemin, carotenoids, and chlorophyll, which, together with their surface roughness, exert a strong control on surface spectral response.

In this study, we aimed at exploring the influence of different biocrust types on surface spectral signal and to explore the relationship between the observed biocrusts spectral traits and related key functional attributes at different spectral and spatial resolutions.

As expected, biocrusts showed higher pigment concentration, carbon and nitrogen content, and surface roughness than bare soil, and this effect increases from low-developed cyanobacteria to well-developed lichen- and moss-dominated biocrusts. These functional differences are reflected in their spectral signal, and more developed biocrusts exhibited more pronounced pigment and water absorption peaks and higher values of broadband spectral indices compared to early cyanobacteria or bare soil. Moreover, this effect is accentuated under wet conditions. Finally, we found a clear relationship between spectral signal and functional traits that facilitates the quantification of key functional attributes using the biocrust spectral signal from both field spectra and UAV This linkage facilitates the identification and estimation of functional traits of biocrusts at the ecosystem scale and improves the interpretation of high-resolution remote sensing data in dryland landscapes.

How to cite: Martinez Sanchez, J. F., Urueta Urueta, C. A., Pagli, C., Martinez Sanchez, E. M., Fernandez Galera, J., Ramon, R., Chamizo de la Piedra, S., Canton, Y., and Rodriguez Caballero, E.: Linking functional traits and spectral responses of biocrust at different scales, EGU General Assembly 2026, Vienna, Austria, 3–8 May 2026, EGU26-20686, https://doi.org/10.5194/egusphere-egu26-20686, 2026.

EGU26-21096 | ECS | Orals | BG3.28 | Highlight

Integrating Biocrusts into Dust Emission Models: A Global Experimental Dataset 

Carlos Urueta Urueta, Juan Francisco Martínez-Sánchez, Raúl Román, Sonia Chamizo, Mattew Bowker, Ning Chen, Ruilin Chen, Ana Giraldo, Alejandro Salazar, Estelle Couradeau, Arnon Karnieli, Sergio Velasco Ayuso, Bo Xiao, Yuhan Qi, Yolanda Cantón, Bettina Weber, and Emilio Rodríguez Caballero

In global drylands, apparently bare soil between plants is frequently covered by biological soil crusts (biocrusts). Biocrusts are poikilohydric communities that play key ecosystem roles in drylands, as they regulate infiltration, evaporation and water retention, provide soil biodiversity, and control biogeochemical cycling of nutrients. Moreover, biocrusts form a rough, cohesive surface layer that prevents soil particle detachment and nutrient mobilization and lost by wind and water erosion.

Approximately 12% of the Earth surface, corresponding to 40% of the global drylands, are currently covered by biocrusts, and it has been estimated that they prevent approximately 700 Tg of dust per year from being emitted into the atmosphere. However, these estimates are based on very few available measurements and do not represent the large variability in biocrust community composition and underlying soil properties.

Within the framework of the CRUST-R forze project, we have developed a global dataset to quantify the effects of biocrusts on potential dust emission. To this end, we measured the threshold friction velocity (TFV), representing the minimum wind velocity at which the soil starts being blown away, and sediment delivery under controlled wind tunnel conditions. We investigated 177 samples representing a wide range of biocrust communities and reference soils from biocrust-dominated habitats worldwide. In addition to TFV and sediment delivery measurements, our dataset also includes functional traits related to biocrust resistance to wind erosion, such as organic matter content, aggregate stability, surface roughness, and extracellular polymeric substances (EPS) content. This database is relevant to understand the underlying mechanisms of an increase in TFV upon biocrust colonization. Our preliminary results show the high relevance of biocrusts in soil stabilization and dust prevention, supporting the explicit inclusion of biocrusts in dust emission parameterizations of Earth system models.

How to cite: Urueta Urueta, C., Martínez-Sánchez, J. F., Román, R., Chamizo, S., Bowker, M., Chen, N., Chen, R., Giraldo, A., Salazar, A., Couradeau, E., Karnieli, A., Velasco Ayuso, S., Xiao, B., Qi, Y., Cantón, Y., Weber, B., and Rodríguez Caballero, E.: Integrating Biocrusts into Dust Emission Models: A Global Experimental Dataset, EGU General Assembly 2026, Vienna, Austria, 3–8 May 2026, EGU26-21096, https://doi.org/10.5194/egusphere-egu26-21096, 2026.

EGU26-21191 | Posters on site | BG3.28

Development of a spectral library of biocrusts and related functional traits 

Emilio Rodriguez-Caballero, Juan Francisco Martinez-Sanchez, Carlos Urueta-Urueta, Jose raul Roman, Sonia Chamizo, Mattew Bowker, Ning Chen, Yuhan Qi, Ruilin Chen, Ana Giraldo, Alejandro Salazar, Estelle Couradeau, Arnon Karnieli, Sergio Velasco-Ayuso, Bo Xiao, Bettina Weber, Yolanda Cantón, and M. Pilar Martin

Drylands are characterized by a high spatiotemporal heterogeneity, which complicates the development of remote sensing applications for these regions. Biological soil crusts are among the key phenomena driving this heterogeneity. Biocrusts   are living communities composed of photoautotrophic organisms (cyanobacteria, algae, lichens, and bryophytes) in intimate association with heterotrophic microorganisms and covering the soil surface across global drylands. Biocrusts modify surface reflectance through specific absorption features arising from insulation-protective and photosynthetic pigments. These features have been used to develop local applications for biocrust mapping and monitoring, but their extrapolation, especially to the global scale, remains difficult because the biocrust reflectance interacts with the underlying soil signal. Moreover, the currently available biocrust spectral datasets do not capture the great variety of biocrust communities and their diverse spectral signals. Furthermore, these data are often collected without standardized protocols, which hampers data comparison, transferability and the development of standard procedures for mapping and monitoring.

To overcome this limitation, we developed a standard protocol to build the first consistent biocrust spectral library, which aims to support new biocrust mapping and monitoring efforts. that aims at supporting new biocrust mapping and monitoring actions. Spectra of 354 samples representing different biocrust communities from around the world were recorded in the laboratory under dry and wet conditions under controlled illumination intensity in the lab. The library includes a reflectance spectrum, a continuum removal spectrum, albedo, and a set of narrow- and broad-band spectral indices commonly applied for vegetation, soil, and characterization. We also used associated metadata, including general descriptors of habitats, location and sampling time information, and physicochemical variables related to biocrusts development and functioning. The latter facilitates the quantification of some key functional traits for comparison with remote sensing products (e.g., photosynthetic pigments, organic matter, stability, surface roughness, EPS concentration). Spectra and physicochemical features of the underlying soil are also included, as they are known to significantly influence the response of biocrust organisms. Overall, this spectral library encompasses a wide range of biocrust functional types from global drylands but further input from currently not well-covered geographic regions is still welcome.

Awknoledgment:CRUST R-Forze (PID2021-127631NA-I00) project funded by MICIU/AEI /10.13039/501100011033 and FEDER, UE; Support for Encouraging Research Consolidation (CNS2024-154916) funded by MICIU/AEI /10.13039/501100011033 and UE NextGenerationEU/PRTR. ERC was supported by the Ramon y Cajal Fellowship (RYC2020-030762-I) founded by MICIU/AEI/10.13039/501100011033 and El FSE invierte en tu future.

How to cite: Rodriguez-Caballero, E., Martinez-Sanchez, J. F., Urueta-Urueta, C., Roman, J. R., Chamizo, S., Bowker, M., Chen, N., Qi, Y., Chen, R., Giraldo, A., Salazar, A., Couradeau, E., Karnieli, A., Velasco-Ayuso, S., Xiao, B., Weber, B., Cantón, Y., and Martin, M. P.: Development of a spectral library of biocrusts and related functional traits, EGU General Assembly 2026, Vienna, Austria, 3–8 May 2026, EGU26-21191, https://doi.org/10.5194/egusphere-egu26-21191, 2026.

EGU26-22143 | Posters on site | BG3.28

Alleviating Biocrust Blindness: An Easy Guide to Morphogroups of Biocrusts  

Lea Condon, Carrie Barker, and Peter Coates

Biological soil crusts (biocrusts) are increasingly recognized as important components of ecosystems. Biocrusts are instrumental in maintaining functions such as soil stability and reduced abundance of invasive annual grasses. Impacts of fire are likely to be less severe where invasive plants are reduced and biocrusts are abundant. These organisms can thrive under drought conditions and help intact ecosystems be more resilient to drought. However, expertise on these organisms remains limited.  Practitioners are often interested in the topic but might feel they would benefit from additional resources on how to identify these organisms. We have developed a single-page, front and back guide that enables anyone, regardless of previous experience, to recognize biocrusts in the field and categorize them into ecologically meaningful groups, with known functional roles. The guide has been tested both in the field and by examining biocrust samples in hand. Data associated with testing the guide was used to improve it. The resulting guide describes higher-level groups of algae, mosses, and lichens. Light algal crusts are described as their own group. Dark algal crusts are presented with gelatinous lichens due to similar ecologies and increased accuracy of identification when these groups are combined. The determination of algal crusts was accepted as correct, regardless of the light or dark designation, due to the quality of our samples. Mosses are split into short and tall. In addition to the gelatinous lichens / dark algal crust group, lichens were classified into five additional categories: crustose, cup, foliose, fruticose, and scale. This tool has been created from the ground up, driven largely by the accuracy with which non-experts can correctly classify presented groups. In addition to reporting on the accuracy of each group, we explain how sample type (resin, dried and in petri dishes, or enlarged photographs) played a role in the accuracy of identification. We describe the ecology and functional roles of the presented groups, giving further justification for their classification. We anticipate that adoption of the guide is likely to have far-reaching implications, such as an increase in the number of studies on biocrusts at the level of functional roles. 

How to cite: Condon, L., Barker, C., and Coates, P.: Alleviating Biocrust Blindness: An Easy Guide to Morphogroups of Biocrusts , EGU General Assembly 2026, Vienna, Austria, 3–8 May 2026, EGU26-22143, https://doi.org/10.5194/egusphere-egu26-22143, 2026.

EGU26-1410 | Posters on site | BG3.29

A robust CWM-PCA for evaluating chemospace of metabolome of root exudates across 9 tropical species 

Lijuan Sun, Jingjing Wang, Xin Wang, Fanbin Zeng, Shangwen Xia, and Xinyao Yang

Root exudate is comprised of complex compounds which have multiple function for plant performance and plant-soil interactions. Although the carbon fluxes of root exudates is considered as an important trait towards the fast-slow growing axis in the multidimensional root economics space, the complexity of the metabolome in root exudates is not well evaluated. Here, we present a community-weighted PCA for species chemospace. Compounds are aggregated to species with two weightings: presence (detection proportion) and relative (softmax of logabundance). Isomer candidates are pooled using Dirichlet priors (A1 symmetric; A2 similarityweighted). Dimensions are selected by Horn's parallel analysis, and robustness is assessed with leave-one-out principal angles. Of 22 descriptors, nine were near-constant or missing and were excluded. Variance concentrated in two components: presence 55.7% and 28.4%; relative 75.8% and 15.5%; both PCs exceeded the 95th percentile noise envelope. The PC1 and PC2 subspace was stable (mean cosine 0.993 to 0.994; largest deletion about 22 degrees), and A1 and A2 produced nearly identical subspaces. PC1 reflected hydrophobicity versus polarity and hydrogen bonding (higher LogP/LogD, lower H-bond acceptors/donors and polar surface area). PC2 captured adsorption and bioconcentration together with molecular flexibility and optical proxies (higher KOC and BCF, more freely rotating bonds, higher refractive index). Relative weighting is recommended as primary; presence serves as a concordant robustness check.

How to cite: Sun, L., Wang, J., Wang, X., Zeng, F., Xia, S., and Yang, X.: A robust CWM-PCA for evaluating chemospace of metabolome of root exudates across 9 tropical species, EGU General Assembly 2026, Vienna, Austria, 3–8 May 2026, EGU26-1410, https://doi.org/10.5194/egusphere-egu26-1410, 2026.

EGU26-2096 | ECS | Posters on site | BG3.29

Technical note: Methodological choices influence root carbon exudation measurements 

Melanie Brunn, Sophie Obersteiner, and Tamir Klein

Root exudation is a significant pathway for belowground carbon (C) allocation in forest ecosystems, with profound implications for soil processes, nutrient cycling, and overall ecosystem functioning. Despite its importance, quantifying root exudation from mature trees in situ remains technically challenging, and methodological inconsistencies among studies hinder the synthesis and upscaling of findings. Here, we evaluated how variations in commonly used exudate collection protocols influence measured C fluxes. Specifically, we tested the effects of root resting, trap moisture, and trap solution composition on exudation rates in two contrasting ecosystems: a temperate forest in Germany and a Mediterranean forest in Israel. By incorporating both inter- and intraspecific root combinations, we also accounted for potential species-interaction effects.

Our results highlight several methodological sensitivities. Omitting root resting can streamline sampling. Moisture conditions within cuvettes strongly affect flux estimates, with saturated traps yielding higher values than moist traps. Exudation responses were further influenced by soil phosphorus availability in the trap solutions, with elevated root C exudation under P-deficiency.

Together, these findings emphasize that methodological variation can substantially alter root exudation C flux rates. We conclude that while some streamlining of protocols is feasible, careful attention to incubation procedures and the use of second flush samples yield more reliable results. Standardized approaches- or, at a minimum, transparent and detailed reporting - are essential to improve comparability across studies. Addressing these methodological challenges will allow more accurate quantification of root exudation, strengthen its integration into terrestrial C models, and ultimately refine our understanding of belowground C allocation under global change.


How to cite: Brunn, M., Obersteiner, S., and Klein, T.: Technical note: Methodological choices influence root carbon exudation measurements, EGU General Assembly 2026, Vienna, Austria, 3–8 May 2026, EGU26-2096, https://doi.org/10.5194/egusphere-egu26-2096, 2026.

EGU26-2616 | Posters on site | BG3.29

Root-root communication within Solanaceae and its effects on root exudate composition 

Shimon Rachmilevitch and Aye Nyein Ko

The ability of plants to distinguish between self and non-self roots significantly influences competitive dynamics and resource allocation. However, the mechanisms underlying these discriminatory responses remain largely elusive. This study investigated the responses of cherry tomato (Solanum lycopersicum L.) and bell pepper (Capsicum annuum L.) grown as self by using a polypropylene separator for the roots (C, B) and in non-self-pairings, without a separator (CC, BB and CB) in a semi-commercial greenhouse experiment. Root respiration increased in non-self-pairings and awas highest in low degrees of relatedness pairings (L-DOR). Cherry tomato exhibited enhanced morphology, physiology, fruit quality, and quantity, and root thickening when paired with bell pepper, whereas bell pepper showed reductions in these parameters. Root exudate carbon and nitrogen concentrations were highest in non-self-combinations and highest in CB pairings. Distinct metabolic profiles were observed in root exudates and root tissues depending on the existence and identity of the neighbor. Upregulation of TCA cycle intermediates, specifically citric acid, was associated with enhanced root respiration in L-DOR pairing, suggesting a metabolic cost associated with neighbor recognition. Auxin analogue indole-3-lactic acid was significantly upregulated in cherry tomato when paired with bell pepper, coinciding with improved morphological traits, while being downregulated in bell pepper under the same conditions. Amino acid profiles further differed between species in L-DOR pairings, reflecting species-specific metabolic regulation. These findings suggest that exudate composition may serve as a specific communication language between individuals that can change in response to the existence and identity of a neighbor.

How to cite: Rachmilevitch, S. and Nyein Ko, A.: Root-root communication within Solanaceae and its effects on root exudate composition, EGU General Assembly 2026, Vienna, Austria, 3–8 May 2026, EGU26-2616, https://doi.org/10.5194/egusphere-egu26-2616, 2026.

Transitioning from monocultures to mixed-species plantations is a key strategy for enhancing soil organic carbon (SOC) sequestration. However, the specific mechanisms by which tree species interactions, particularly through root exudation and morphological traits, shape rhizosphere SOC stability remain poorly understood. This study investigated the effects of introducing broad-leaf species into coniferous plantations on rhizosphere SOC dynamics.

We examined a near-mature Pinus massoniana monoculture and two paired plantations interplanted with Erythrophleum fordii (a nitrogen-fixing species) and Castanopsis hystrix. We quantified root exudation rates, root morphological traits, microbial biomass carbon, and rhizosphere physicochemical properties to identify the controlling factors of SOC stability.

Our results revealed divergent stabilization pathways depending on the companion species. Interplanting with C. hystrix significantly stimulated the root exudation of P. massoniana. This increase in exudates was positively correlated with the mass proportion and carbon content of both large and small macro-aggregates, suggesting that exudate-mediated physical protection is the primary driver of SOC stability in this mixture. Conversely, interplanting with the N-fixing E. fordii did not significantly alter root exudation rates or their relationship with aggregation. Instead, SOC stability in the P. massoniana rhizosphere was primarily attributed to increased nitrogen availability.

Our findings highlight that root exudates play a conditional role in SOC stabilization, heavily dependent on the identity of neighbor species. We conclude that selecting appropriate companion species is critical for managing specific SOC sequestration pathways in mixed-species plantations.

How to cite: Xia, Q.: Divergent pathways of rhizosphere SOC stabilization in mixed-species plantations: The role of root exudates versus nitrogen availability, EGU General Assembly 2026, Vienna, Austria, 3–8 May 2026, EGU26-2909, https://doi.org/10.5194/egusphere-egu26-2909, 2026.

EGU26-3516 | ECS | Posters on site | BG3.29

Soil and genotype-driven root exudation patterns in barley, faba bean, potato, and sweet potato 

Henning Schwalm, Carmen Escudero-Martinez, Molly Brown, Lawrie Brown, David Roberts, Susan M Mitchell, Ignacio Romero Lozano, Natacha Bodenhausen, Davide Bulgarelli, Kelly Houston, Timothy S George, and Eva Oburger

Root exudates play a central role in rhizosphere processes, many of which support plant growth. While increased exudation under abiotic stresses has been frequently linked to enhanced plant resilience, crop- and genotype- and soil-specific exudation patterns under non-stress conditions remain poorly understood. This study aimed to assess how soil type and genotype influence quantity and quality of root exudation in major and emerging European crops and to explore how root morphology and plant growth are related to exudation.

Four genotypes each of barley (Hordeum vulgare), faba bean (Vicia faba), potato (Solanum tuberosum), and sweet potato (Ipomoea batatas (L.) Lam.) were grown in three distinct European soils under non-stress conditions. Exudates were collected using a soil–hydroponic hybrid approach and analysed for dissolved organic carbon and nitrogen, total carbohydrates, amino acids, and phenolic compounds. In addition, broader exudation patterns were explored using non-targeted analytical approaches. Shoot and root samples were collected for the analysis of biomass and root morphology to examine correlations with exudation patterns.

Results showed that soil type and genotype affected exudation patterns, but their influence varied by crop. Plant growth was negatively correlated with exudation rates across most crops, likely reflecting a trade-off in carbon and nitrogen allocation between biomass accumulation and rhizodeposition. Root morphological traits partly correlated with root exudation rates, but no universal relationships were detected across crops.

Our results provide novel insights into belowground resource partitioning and broaden the understanding of soil and genotype-specific exudation patterns to previously underexplored crops, thereby improving our knowledge of mechanisms driving exudation dynamics.

How to cite: Schwalm, H., Escudero-Martinez, C., Brown, M., Brown, L., Roberts, D., Mitchell, S. M., Lozano, I. R., Bodenhausen, N., Bulgarelli, D., Houston, K., George, T. S., and Oburger, E.: Soil and genotype-driven root exudation patterns in barley, faba bean, potato, and sweet potato, EGU General Assembly 2026, Vienna, Austria, 3–8 May 2026, EGU26-3516, https://doi.org/10.5194/egusphere-egu26-3516, 2026.

EGU26-4498 | ECS | Posters on site | BG3.29

Beyond the Root: Linking Economics Space, Symbiosis and Exudation in Phosphorus-Stressed Eucalyptus Species 

Zhe Zhang, Kosala Ranathunge, Duccio Migliorini, Felipe Albornoz, and Hans Lambers

Plant roots exhibit coordinated suites of functional traits that reflect different strategies for nutrient acquisition, commonly described along the root economics space (RES). In phosphorus (P)-limited systems, plants may rely on contrasting pathways for P acquisition, including fine-root proliferation, root exudation, and mycorrhizal symbioses. However, how these strategies are coordinated across genotypes within a single tree genus remains poorly understood.

Here, we investigate root economic traits, mycorrhizal colonization, and root-associated metabolites in twelve eucalypt species grown under controlled low-P conditions. We quantify key root morphological traits (e.g. root diameter, specific root length), mycorrhizal (AM and ECM) colonization, extraradical hyphal development, and the composition of root exudates, with a particular focus on organic acids and phenolic compounds.

Preliminary analyses indicate pronounced interspecific variation in root traits and associated P-acquisition strategies across eucalypt species. Trait coordination patterns suggest potential trade-offs between root morphological investment, symbiotic associations, and metabolic pathways involved in P mobilization. In particular, variation in root diameter appears to be associated with shifts in the relative reliance on root-based versus mycorrhiza-mediated strategies for P acquisition, although the strength and consistency of these relationships are still being evaluated.

Overall, this study aims to provide a trait-based framework for understanding how woody plant species coordinate alternative P-acquisition pathways under nutrient limitation. By integrating root economics, symbiotic interactions, and root metabolic traits, our work contributes to a more mechanistic understanding of belowground resource foraging strategies in forest ecosystems.

How to cite: Zhang, Z., Ranathunge, K., Migliorini, D., Albornoz, F., and Lambers, H.: Beyond the Root: Linking Economics Space, Symbiosis and Exudation in Phosphorus-Stressed Eucalyptus Species, EGU General Assembly 2026, Vienna, Austria, 3–8 May 2026, EGU26-4498, https://doi.org/10.5194/egusphere-egu26-4498, 2026.

EGU26-6538 | ECS | Posters on site | BG3.29

Contrasting belowground strategies of maize varieties under combined water and phosphorus deficiency: the role of root exudation.  

Anaclara Visconti, Sizhong Yang, Johanna Pausch, Andreas J. Wild, Steffen Kolb, Valerie Pusch, Mirriam C. Chibesa, Mohammad-Reza Hajirezaei, and Maire Holz

Although many temperate agricultural soils contain substantial P, most of this P is unavailable to plants, and its mobility is further restricted by drought. Root exudation contributes to drought tolerance and P mobilization and is considered to play a major role in soil resource acquisition strategies in crops. Its position, however, within the root economics space (RES) remains contradictory. We assessed differences between maize landraces and modern cultivars in root economic strategies, plasticity under combined water and phosphorus deficiency, and the consequences for plant performance. We investigated root and rhizosphere responses of six maize varieties (three landraces, three modern hybrids) grown in a controlled pot experiment under combined water and P limitation. Pots were assigned four treatments: well-watered (20% Water content (WC)) and water-stressed (8% WC) condition, combined with high (47.97 mg P kg-1) or low (23.3 mg P kg-1) P. After four weeks of growth, water-stressed plants underwent a two-week drought period, adjusting to 8% WC after one week, while well-watered plants continued to grow under optimally watered conditions. Root traits were assessed through root scanning and dry biomass measurements. Root exudates were collected using a soil-hydroponic hybrid method and analysed for dissolved organic carbon, sugars, organic acids, carboxylates and phenolics. Soil DNA was analysed for its bacterial and fungal composition. We found that landraces followed a “do-it-yourself” RES strategy, whereas modern varieties adopted an “outsourcing” strategy that was associated with increased root exudation. Water availability drove rapid plastic responses in root exudation, with the strongest response under combined deficiency. In contrast, morphological root traits were driven by P, rather than water. Under combined deficiency, landraces maintained higher P use efficiency while moderns exhibited greater P acquisition efficiency. These findings demonstrate that contrasting root economic strategies of different maize varieties shaped the performance under combined P and water stress.


How to cite: Visconti, A., Yang, S., Pausch, J., Wild, A. J., Kolb, S., Pusch, V., Chibesa, M. C., Hajirezaei, M.-R., and Holz, M.: Contrasting belowground strategies of maize varieties under combined water and phosphorus deficiency: the role of root exudation. , EGU General Assembly 2026, Vienna, Austria, 3–8 May 2026, EGU26-6538, https://doi.org/10.5194/egusphere-egu26-6538, 2026.

EGU26-6765 | ECS | Orals | BG3.29

Relationship of compound-specific root exudation with nitrogen and water status of temperate tree species 

Melissa Wannenmacher, Simon Haberstroh, Jürgen Kreuzwieser, and Christiane Werner

The rhizosphere is a hotspot of biological activity, representing a zone of interaction between plants and microbial communities. Root exudates are a key factor shaping this unique environment by significantly influencing belowground processes, such as carbon (C) and nutrient cycling. Despite this importance, main drivers of root exudation are still unknown. In this study, we investigated how the composition of root exudation in temperate forests relates to nitrogen (N) concentrations and δ13C isotopic signatures in different tree tissues. Enriched δ13C values can hereby serve as an indicator for drought stress.

Root exudates were sampled at four temperate forest sites in Germany in sycamore maple (Acer pseudoplatanus), European beech (Fagus sylvatica) and Norway spruce (Picea abies). We used an in-situ approach, where cleaned roots were incubated in cuvettes with glass beads and a diluted nutrient solution for 24h. Compound-specific root exudation rates from four sampling events in late spring and late summer of two consecutive years (2023 & 2024) were analysed by gas chromatography-mass spectrometry.
Tree tissues were sampled in late summer 2023 and in late spring 2024, including roots, branch bark, branch wood and leaves from the sun-lit tree crowns and analysed by isotope ratio mass spectrometry to determine C and N concentrations and the isotopic signature δ13C.

In maple, a higher N status in leaves, bark and wood went along with an elevated exudation of hydrocarbons, including fatty acids and sugars. In contrast, the exudation of N-containing compounds, namely amino acids, was reduced under higher tree N concentrations. Therefore, the exudation of hydrocarbons could be a mechanism to scavenge for N, while the loss of N through exudation is reduced. A reduced water availability indicated by more enriched δ13C values led to compound-specific reactions in the exudates of maple. While the exudation of hydrocarbons was reduced under more enriched δ13C values in leaves, bark and wood, N-containing compounds were exuded in higher rates, even though not significantly higher. This suggests a targeted exudation of specific compounds under reduced water availability.
In spruce, we observed significant tissue dependent correlations between tree N status and exudation. In contrast to maple, higher tree N concentrations in needles, bark and roots generally went along with reduced exudation. Also contrasting maple, spruce tended to decrease N exudation and increase the exudation of other compounds, when tree tissues were more enriched in 13C. This effect was especially strong and significant for roots, indicating an elevated investment into roots and root exudates under drier conditions. 
In beech, no significant correlations between N concentration or δ13C and exudation could be observed.

Our results indicate that the interaction of N and water status in tree tissues with root exudation strongly depends on the tree species, which could partially explain contrasting results reported in literature. While differing abiotic conditions are often held responsible for inconsistencies, our results suggest species identity as an important factor.

How to cite: Wannenmacher, M., Haberstroh, S., Kreuzwieser, J., and Werner, C.: Relationship of compound-specific root exudation with nitrogen and water status of temperate tree species, EGU General Assembly 2026, Vienna, Austria, 3–8 May 2026, EGU26-6765, https://doi.org/10.5194/egusphere-egu26-6765, 2026.

EGU26-7075 | Orals | BG3.29

Linking root abundance and exudation with soil CO2/O2 fluxes ratio in three crops 

Anna Lengert, Dan Frederik Lange, Gerd Gleixner, Qiwen Zhang, and Boaz Hilman

Measuring root abundance, root exudation, and exudation chemistry requires destructive and cumbersome measurement protocols. Respiratory CO2 and O2 fluxes are simpler to measure and are related to these processes: 1) greater root abundance and exudation of labile compounds are expected to increase respiratory fluxes; 2) the apparent respiratory quotient (ARQ, the CO2/O2 fluxes ratio) is primarily derived from the nominal oxidation state of carbon (NOSC) of the respiratory substrate, with high expected ARQ in roots and rhizosphere (fed by exudates) and low ARQ in bulk soil. To test the control of root abundance and exudation on respiration fluxes, we conducted a pot experiment in a greenhouse with three crops (Brassica napus, Helianthus annuus and Panicum miliaceum). We measured CO2 and O2 fluxes from soil chambers and from jar incubations of excised roots and soil samples. Additionally, we measured root abundance and exudation rates and characterized exudate composition using untargeted direct-infusion Orbitrap mass spectrometry. Molecular formulas were assigned to derive NOSC and stoichiometric indices (H/C, O/C, N/C and P/C). We found that the species differed in their CO2 and O2 fluxes, reflecting their distinct root traits. Higher respiration fluxes were associated with greater root abundance and exudation rates, but a higher exudate N/C ratio was the strongest predictor. While the effect of species on ARQ was insignificant, small and consistent interspecific differences in ARQ were observed. Brassica napus exhibited comparatively high ARQ values, coinciding with exudates with high N/C ratio and NOSC, fast root respiration, and high root abundance. Overall, our results indicate promising links between root exudation and respiratory fluxes, with exudate N/C emerging as a significant factor in flux variability.

How to cite: Lengert, A., Lange, D. F., Gleixner, G., Zhang, Q., and Hilman, B.: Linking root abundance and exudation with soil CO2/O2 fluxes ratio in three crops, EGU General Assembly 2026, Vienna, Austria, 3–8 May 2026, EGU26-7075, https://doi.org/10.5194/egusphere-egu26-7075, 2026.

EGU26-7131 | Orals | BG3.29

A plant’s deepest secret: translating root exudate profiles into their effects on soil microbial respiration in grasslands  

Marie J. Zwetsloot, Bobby Zetterlind, Ellis Hoffland, Liesje Mommer, and Dorian Tamminga

Plant roots release a great diversity of root exudates into soil, creating hotspots of biochemical activity. Species-level differences in root exudate chemistry may modulate these dynamics, with consequences for soil biogeochemical cycles at larger spatial scales. Therefore, the aim of this research was to investigate the link between species variation in root exudates and soil microbial respiration in temperate grasslands. We hypothesized that sugars would stimulate and phenolics would suppress soil microbial respiration across species. Second, we hypothesized that species variation in sugars and phenolics would be oppositely associated with root traits indicating fast vs. slow growth and their degree of collaboration with mycorrhizal fungi, allowing for these results to be generalized across grassland species.

To test these hypotheses, we conducted a greenhouse study with 53 plant species (grasses, forbs, legumes) common to managed and semi-natural grasslands on sandy soil in the Netherlands. We collected root exudates during peak vegetative growth using a hybrid soil-hydroponic collection method. Root exudates were analysed for total organic carbon, phenolic and sugar content, as well as individual metabolites using untargeted LC-MS analyses. Collected root exudates were freeze-dried and applied at the same carbon concentration to soil using an incubation setup in order to test their effects on soil microbial respiration. Root morphological traits and mycorrhizal colonization of plant species were also measured and aboveground growth was monitored during the study. Preliminary results suggest that species variation in root exudate chemical classes does not relate to core root traits representing nutrient use and acquisition strategies. Results on more detailed metabolite analysis and species-specific root exudate effects on soil microbial respiration will be presented at the conference.

How to cite: Zwetsloot, M. J., Zetterlind, B., Hoffland, E., Mommer, L., and Tamminga, D.: A plant’s deepest secret: translating root exudate profiles into their effects on soil microbial respiration in grasslands , EGU General Assembly 2026, Vienna, Austria, 3–8 May 2026, EGU26-7131, https://doi.org/10.5194/egusphere-egu26-7131, 2026.

EGU26-7727 | Orals | BG3.29

 Seasonal Drought Reshapes Root Exudate Chemistry and Microbial Associations in a Mixed Mediterranean Forests 

Yaarao Oppenheimer-Shaanan, Sophie Obersteiner, David Yalin, Dagan Sade, Vered Zavaro, Ziv Reich, and Tamir Klein

Tree root exudates and rhizosphere microbe interactions are a key pathway influencing tree health in the forest. However, the chemical mechanisms mediating these belowground interactions, particularly under climate driven drought stress, remain poorly understood. Mediterranean forests experience recurrent seasonal drought, providing a natural system to examine how water limitation alters root derived carbon inputs and associated microbial responses. We conducted a two-year field experiment in a mixed Mediterranean forest comprising mature trees of Pinus halepensis, Quercus calliprinos, and Pistacia lentiscus. Across four seasons, we simultaneously quantified root exudation rates and metabolite composition and characterized soil and root associated microbiomes using 16S rRNA gene sequencing at species level resolution. This integrative approach allowed us to directly link drought-induced changes in root chemistry with microbial community structure and interaction patterns. Root exudation rates increased on average 2.7-fold during the dry compared to the wet season, reaching up to 21.7 μg C cm⁻² day⁻¹ across all three tree species. Metabolomic analyses identified 89 drought responsive compounds, dominated by amino acids (24), phenolics (22), carbohydrates (11), and terpenoids (8). While metabolite profiles varied strongly with both tree species and season, eight metabolites consistently responded to drought across all species, suggesting conserved metabolic responses to water stress. In contrast to the pronounced chemical shifts, rhizosphere microbial community composition remained largely stable across seasons, although it differed among host tree species. Despite this taxonomic stability, correlation analyses revealed multiple bacterial taxa that were positively or negatively associated with drought responsive metabolites. Notably, 19 actinobacterial species correlated with compounds such as the terpenoid glaucocalyxin A, deoxyribose, and a C5 sugar alcohol, highlighting diverse microbial strategies for exploiting drought altered root exudates. Together, our results demonstrate that seasonal drought reshapes belowground interactions primarily through changes in root exudate chemistry rather than large scale microbial turnover. We propose that drought-induced shifts in root derived metabolites act as finely tuned metabolic signals that selectively modulate microbial interactions while preserving the overall structural stability of the rhizosphere community in Mediterranean forests.


How to cite: Oppenheimer-Shaanan, Y., Obersteiner, S., Yalin, D., Sade, D., Zavaro, V., Reich, Z., and Klein, T.:  Seasonal Drought Reshapes Root Exudate Chemistry and Microbial Associations in a Mixed Mediterranean Forests, EGU General Assembly 2026, Vienna, Austria, 3–8 May 2026, EGU26-7727, https://doi.org/10.5194/egusphere-egu26-7727, 2026.

EGU26-8110 | Orals | BG3.29

Glucose as a surrogate for root exudates overestimates greenhouse gas emissions from anoxic soils 

E. Marie Muehe, Marie Mollenkopf, Sarah Keldenich, and Andreas Kappler

Glucose is frequently used as a surrogate for root exudates in priming studies because it plays a central role in plant metabolism. Glucose-induced priming can accelerate the decomposition of organic matter via co-metabolism, thereby enhancing the release of greenhouse gases such as CO₂, N2O, and CH₄. However, despite Glucose’s widespread use as a proxy, actual root exudates are far more complex and further include organic acids, phenolic compounds, and nitrogen-containing molecules. Many studies fail to capture this complexity, particularly functions related to mineral dissolution, nutrient acquisition, and microbial interactions.

We hypothesized that glucose, compared to plant-derived exudates, leads to disproportionately high soil respiration and methanogenesis, thereby overestimating carbon decomposition and associated biogeochemical processes. To test this hypothesis, we collected thawed permafrost mineral soil from Abisko, Sweden. Permafrost soils store nearly twice as much carbon as is currently present in the atmosphere, thus, they represent a critical component of the global carbon cycle. The soil was incubated in anoxic microcosms and amended with four different exudate mixtures at environmentally realistic concentrations: glucose; a more complex carbon mixture composed of sugars and organic acids without nitrogen; the same complex carbon mixture with nitrogen-containing glycine; and exudates derived from graminoid plants obtained from thawed permafrost soil in Abisko. Within days of amendment, plant-derived and nitrogen-containing exudates resulted in lower CO₂ emissions than glucose and the nitrogen-free mixture, highlighting a key role of nitrogen in diversifying microbial metabolism. The effects on CH₄ emissions were even more pronounced than those on CO₂: glucose and the nitrogen-free mixture produced significantly higher CH₄ emissions compared to plant-derived and nitrogen-containing exudates.

Together, our results suggest that artificial mixtures of sugars, organic acids, and nitrogen-containing compounds should be preferentially used in priming studies to better reflect the complexity of root exudation.

How to cite: Muehe, E. M., Mollenkopf, M., Keldenich, S., and Kappler, A.: Glucose as a surrogate for root exudates overestimates greenhouse gas emissions from anoxic soils, EGU General Assembly 2026, Vienna, Austria, 3–8 May 2026, EGU26-8110, https://doi.org/10.5194/egusphere-egu26-8110, 2026.

EGU26-9447 | ECS | Posters on site | BG3.29

Soil development stage shapes shoot-to-soil carbon flow and organo-mineral association under variable phosphorus supply 

Sasha Pollet, Jean-Thomas Cornelis, Chaoqun Wang, Thorsten Knipfer, Cindy Prescott, Amir Ahkami, Vimal Kumar Balasubramanian, Sophie Lehmann, Tanya Winkler, Tamas Varga, Young-Mo Kim, Kylee Tate, and Guillaume Lobet

Understanding plant–soil–microbe interactions is key to increasing nutrient use efficiency and soil carbon (C) storage. Root exudates play a central role in nutrient acquisition, structure microbial communities and influence organo-mineral association. Yet, how soil development stage and resulting soil chemical properties regulate root exudation and the fate of C in the rhizosphere remain poorly understood.

We used a soil–plant–microbe–mineral approach to assess how soil development stage influences plant stoichiometry, rhizosphere C release, microbial activity, and organo-mineral associations. In a growth chamber, we grew Lupinus albus, a model species for phosphorus (P) acquisition, for 30 days under three P levels (5, 15, and 40 mg P kg⁻¹) in three podzolic horizons representing contrasting soil development stages: an organic matter- and quartz-rich Ae, an iron (Fe) and aluminum (Al) oxide-rich Bh, and a primary silicate-dominated BC. Plant-derived C transfer to the rhizosphere, microbes, and reactive iron oxides was traced using a 13C-CO₂ pulse-labeling experiment, with Fe-oxide mesh bags used to assess newly stabilized organo-mineral C. We measured plant biomass, shoot stoichiometry, rhizosphere metabolites, microbial biomass, and enzyme activities.

Soil development stage strongly influenced shoot response to P supply and the fate of root-derived C. Shoot biomass was highest and insensitive to P supply in the primary mineral-rich BC, while it was lowest and responding to P supply in the Bh horizon, due to P sorption onto Fe and Al oxides. While dissolved rhizosphere organic C was similar, the metabolomic profile of rhizosphere solutions and microbial parameters varied markedly among soil horizons. 13C recovery in the rhizosphere varied strongly between soil horizons and P levels, reflecting interactions between mineral sorption capacity, metabolomic profiles and microbial activity. In the Ae horizon, high microbial biomass likely enhanced microbial processing of root-derived ¹³C, whereas in the Bh horizon, lower microbial biomass combined with high Fe and Al oxide content likely favored greater adsorption of 13C onto reactive minerals. Iron oxides in mesh bags showed pronounced, horizon-specific capacity to stabilize C, peaking in Bh, followed by Ae and BC.

Overall, soil development stage and resulting chemical and mineralogical properties tightly control plant P responses and the fate of C in the rhizosphere. These results highlight the tight coupling of plants, microbes, and minerals, and underscore the importance of soil genesis and integrative approaches for tracing the fate of photosynthates in soil–plant systems. Extending these findings to agroecosystems will require further validation though field trials.

How to cite: Pollet, S., Cornelis, J.-T., Wang, C., Knipfer, T., Prescott, C., Ahkami, A., Balasubramanian, V. K., Lehmann, S., Winkler, T., Varga, T., Kim, Y.-M., Tate, K., and Lobet, G.: Soil development stage shapes shoot-to-soil carbon flow and organo-mineral association under variable phosphorus supply, EGU General Assembly 2026, Vienna, Austria, 3–8 May 2026, EGU26-9447, https://doi.org/10.5194/egusphere-egu26-9447, 2026.

EGU26-9461 | Orals | BG3.29

Wanted: Micronutrients – Exploring the efficiency of phytosiderophores and grass root exudates in mobilizing metals in soils.  

Andreea Spiridon, Tim Causon, Stephan Hann, Nicolas Kratena, Christian Stanetty, and Eva Oburger

Micronutrient (MN) deficiencies, particularly iron (Fe), zinc (Zn), and copper (Cu), severely limit crop productivity and frequently coincide with regions of human micronutrient malnutrition ("hidden hunger"), a problem exacerbated by high‑pH, calcareous soils that restrict metal availability through the formation of insoluble metal pools. In these challenging environments, grasses (Poaceae) rely on root exudates, most notably phytosiderophores (PS), to mobilize micronutrients such as Fe through the release of specialized ligands that promote metal dissolution and uptake.

However, the ecological complexity surrounding PS-driven micronutrient acquisition remains largely understudied, primarily due to limited availability of these compounds. Our previous work showed that grass species exhibit distinct PS exudation patterns, varying in both quantity and quality, with exudation decreasing in the order Fe > Zn > Cu deficiency. Building on these findings, we conducted detailed PS–soil interaction studies using naturally Zn- and Fe-deficient soils to examine whether specific PS types differ in their micronutrient mobilizing efficiency. Our results show that metal mobilization is soil-specific and largely dependent on the inherent availability of the metals themselves, following trends similar to the DTPA-extractable metal pool, i.e., the more available the metal, the more effectively it can be mobilized by PS. While soil properties primarily dictated overall mobilization patterns, differences among PS themselves also emerged. Despite their structural similarities, the eight PS displayed distinct mobilization efficiencies that changed with time and PS concentration.

Mobilization occurred rapidly within the first few hours but plateaued after approximately six hours, consistent with rapid PS depletion in an active rhizosphere. Notably, only a small fraction of the applied PS contributed to metal mobilization; most remained inaccessible, likely due to strong sorption to soil particles even under sterile conditions. When real root exudates were supplied together with PS, mobilization increased synergistically, enhancing the release of several metals, including Zn and Mn, beyond the capacity of PS alone.

These results highlight that MN acquisition is not a one-dimensional process but relies on multiple, complex rhizosphere interactions. Understanding these dynamics brings us closer to optimizing crop breeding and management practices that harness root exudation and soil potential for improved micronutrient uptake.

How to cite: Spiridon, A., Causon, T., Hann, S., Kratena, N., Stanetty, C., and Oburger, E.: Wanted: Micronutrients – Exploring the efficiency of phytosiderophores and grass root exudates in mobilizing metals in soils. , EGU General Assembly 2026, Vienna, Austria, 3–8 May 2026, EGU26-9461, https://doi.org/10.5194/egusphere-egu26-9461, 2026.

EGU26-9532 | ECS | Posters on site | BG3.29

Identifying key root and rhizosphere traits for efficient zinc uptake in barley 

Uxue Otxandorena-Ieregi, Andreea Spiridon, David Aleksza, Michael Santangeli, Carmen Escudero-Martinez, Dagmar Woebken, Timothy S. George, Joanne Russell, Tim Causon, Stephan Hann, Christian Stanetty, Nicolas Kratena, and Eva Oburger

It is estimated that about half of the cultivated soils are deficient in zinc (Zn), contributing substantially to human Zn deficiency. As cereals constitute a major component of the human diet, improving their Zn content by breeding is a crucial agricultural goal to mitigate human Zn deficiency. However, breeding nutrient-rich cereals requires the identification of the plant traits that most strongly contribute to efficient Zn acquisition under deficient soil.

Plants can enhance Zn acquisition through multiple, potentially interacting mechanisms. They can enhance the uptake by adapting their root morphology or by increasing the expression of Zn cell-membrane transporters. Beyond the physical root system, roots secrete a chemically diverse blend of high- and low-molecular weight compounds that mobilise Zn from the soil. Cereals employ a strategy based on phytosiderophores (PS), metal-chelating agents released by roots into the soil. Root-associated microorganisms can also impact the plant's micronutrient status either by directly mobilising micronutrients or enhancing general plant health. While the mechanistic importance of individual traits has been demonstrated, their relative contributions have rarely been evaluated within a single integrative framework.

Using barley (Hordeum vulgare L.) as a model crop, sixteen genotypes representing the northern European germplasm were grown in a Zn-deficient soil. A diverse array of root and rhizosphere phenotypes was screened. We quantified and characterised the root exudate metabolome, placing a special focus on phytosiderophores. Root morphological traits such as root length and surface area were characterised. The expression levels of genes involved in Zn uptake were also assessed. Amplicon sequencing of the 16S rRNA gene and the ITS2 region was conducted to explore the root-associated microbiome.

Zn uptake efficiency varied substantially among barley genotypes. Barley genotypes that efficiently acquired Zn, exuded higher amounts of phytosiderophores and exhibited a distinct exudate metabolome profile, suggesting that exudates may play a key role in plant Zn nutrition. Specific root length also emerged as a possible key phenotype. While root-associated microorganisms were influenced by the plant’s Zn status and genotype, we found only subtle microbial differences between Zn-efficient and less efficient genotypes, providing little indication of their role in Zn uptake. This study establishes an integrative framework for root and rhizosphere phenotyping with the aim of identifying key traits for producing nutrient-rich crops.

How to cite: Otxandorena-Ieregi, U., Spiridon, A., Aleksza, D., Santangeli, M., Escudero-Martinez, C., Woebken, D., George, T. S., Russell, J., Causon, T., Hann, S., Stanetty, C., Kratena, N., and Oburger, E.: Identifying key root and rhizosphere traits for efficient zinc uptake in barley, EGU General Assembly 2026, Vienna, Austria, 3–8 May 2026, EGU26-9532, https://doi.org/10.5194/egusphere-egu26-9532, 2026.

EGU26-10998 | ECS | Posters on site | BG3.29

Comparative assessment of root exudation in maize: Influence of experimental setup, growth conditions and root hairs 

Michael Santangeli, Anna Heindl, Lisa Stein, Alice Tognacchini, and Eva Oburger

A major challenge in root exudation research is obtaining exudate samples that accurately reflect exudation processes under natural soil growth conditions, as both the growth environment and the experimental setup can significantly influence root exudation dynamics. This study investigated the effects of different experimental systems and growth conditions on carbon (C) exudation in maize (Zea mays L.) roots, and whether these factors affect the ability to resolve genotypic differences between the wild type (B73) and its root hairless mutant (rth3). 
Plants were cultivated under various experimental conditions, including soil-based and hydroponic systems, and root exudates were collected using a combination of traditional and innovative sampling approaches. Carbon exudation rates were compared across systems and genotypes, and laboratory results were additionally evaluated against data from a separate field experiment.
Carbon exudation rates varied greatly with experimental design and environmental context, whereas the contribution of root hairs to total C exudation was minor in comparison. Notably, exudation rates measured in soil-based laboratory systems were consistent with those obtained in the field when growth temperatures were similar, indicating that soil-based laboratory experiments can provide ecologically relevant estimates of C exudation when designed to match field-relevant conditions. However, large differences in root biomass introduced systematic bias into exudation measurements, especially when the root-to-sampling volume ratio (RSVR) differed substantially among systems or genotypes. These findings demonstrate how experimental setup and environmental conditions influence measured exudation rates and can potentially outweigh genotypic effects. 
Overall, these results provide methodological guidance for reliably quantifying root carbon exudation in maize. Specifically, soil-based laboratory systems that closely replicate field conditions, particularly temperature, together with maintaining a consistent RSVR, can provide comparable estimates of maize root carbon exudation for field experiments.

How to cite: Santangeli, M., Heindl, A., Stein, L., Tognacchini, A., and Oburger, E.: Comparative assessment of root exudation in maize: Influence of experimental setup, growth conditions and root hairs, EGU General Assembly 2026, Vienna, Austria, 3–8 May 2026, EGU26-10998, https://doi.org/10.5194/egusphere-egu26-10998, 2026.

EGU26-10999 | ECS | Posters on site | BG3.29

A mesocosm study: Carbon release dynamics in young alluvial oak trees affected by flooding stress and elevated temperature  

Maxi Bergmann, Awaz Mohamed, Jens Dyckmans, Kai Jensen, and Ina C. Meier

Estuarine alluvial forests, which are characterized by short, intense flooding events, are recognized as global carbon (C) hotspots. However, predicted increases in flooding intensity and prolonged summer droughts due to climate change may alter the timing, quantity and quality of C transfer from alluvial trees to soil, with potential consequences for the C sink strength of alluvial forests. The surplus C hypothesis suggests that trees assimilate a surplus of photosynthates at the onset of resource limitation (Prescott et al. 2020) and that, consequently, frequent shifts from hypoxia to water drainage (or even summer drought) may result in particular high levels of surplus C in alluvial trees, which can be released by alternative root respiration or by root exudation into the rhizosphere. To test this hypothesis for alluvial trees, we conducted an outdoor mesocosm study with young pedunculate oak (Quercus robur L.) trees exposed to different climate change scenarios and examined the consequences for the release of surplus C by alternative root respiration and root exudation. Specifically, we simulated flooding events and increases in average temperature in a full factorial experiment. Over the course of one growing season aboveground performance of trees was monitored, fine roots were sampled to measure alternative root respiration, determined from the isotopic discrimination against 18O in O2, and root exudates were repeatedly collected with the culture-based cuvette method, quantified as TOC and later analyzed by LC-MS. We observed that flooding reduced the C sink strengths of aboveground and belowground growth and biomass by up to 40%, independent from temperature. In my presentation I will focus on C release dynamics via root exudation and root respiration and discuss the potential role of flooding and temperature rise on surplus C in alluvial forest trees, and potential consequences for root-microbiome interactions. Our findings will contribute to a broader understanding of the C sink strength of estuarine alluvial forests under climate change.

Prescott CE, Grayston SJ, Helmisaari H-S, Kaštovská E, Körner C, Lambers H, Meier IC, Millard P, Ostonen (2020) Surplus carbon drives allocation and plant–soil interactions. Trends in Ecology & Evolution 35: 1110-1118.

How to cite: Bergmann, M., Mohamed, A., Dyckmans, J., Jensen, K., and Meier, I. C.: A mesocosm study: Carbon release dynamics in young alluvial oak trees affected by flooding stress and elevated temperature , EGU General Assembly 2026, Vienna, Austria, 3–8 May 2026, EGU26-10999, https://doi.org/10.5194/egusphere-egu26-10999, 2026.

EGU26-11011 | ECS | Posters on site | BG3.29

Shaping rhizosphere properties enables better root water uptake performance in contrasting soil conditions 

Ruth Adamczewski, Maire Holz, Johanna Pausch, Anders Kaestner, and Mohsen Zare

Plants actively modify their rhizosphere by releasing carbon-rich exudates that alter the physical and hydraulic properties of the surrounding soil. High-molecular-weight compounds such as mucilage are known to enhance rhizosphere water retention and increase liquid-phase viscosity. However, it remains poorly understood whether maize strategically modulates mucilage exudation in response to contrasting soil textures and water availability. Soil hydraulic properties differ strongly between textures, particularly under drying conditions, where non-linear relationships between matric potential and hydraulic conductivity may constrain root water uptake. We hypothesized that maize enhances mucilage exudation in soils with reduced soil–root contact and low hydraulic conductivity in order to maintain water uptake.

We grew maize plants in rhizoboxes filled with two contrasting soil textures (sand and loam) under well-watered and water-limited conditions. Rhizosphere extension around newly emerged roots was quantified using neutron radiography. In a second experiment, soil water was labeled with deuterated water to quantify root water uptake dynamics using time-resolved neutron radiography combined with a diffusion–convection model.

Rhizosphere extension was significantly larger in sand than in loam, indicating an adaptive modification of rhizosphere properties in response to reduced soil–root hydraulic connectivity. This pattern is consistent with enhanced mucilage exudation, which increases soil–root contact and maintains liquid-phase continuity under hydraulically limiting conditions. For the first time, in situ water retention curves of the maize rhizosphere were quantified for both sandy and loamy soils. Root water uptake rates of individual roots were similar across soil textures and moisture regimes; however, individual roots in sandy soils contributed more strongly to total plant transpiration than those in loamy soils. Notably, single roots maintained water uptake under water-limited conditions, demonstrating the capacity of maize to sustain water acquisition even as soil moisture declined.

These results demonstrate a high degree of adaptive plasticity in maize, highlighting its ability to engineer rhizosphere hydraulic properties to optimize water uptake under contrasting soil textures and moisture regimes.

How to cite: Adamczewski, R., Holz, M., Pausch, J., Kaestner, A., and Zare, M.: Shaping rhizosphere properties enables better root water uptake performance in contrasting soil conditions, EGU General Assembly 2026, Vienna, Austria, 3–8 May 2026, EGU26-11011, https://doi.org/10.5194/egusphere-egu26-11011, 2026.

EGU26-11151 | Posters on site | BG3.29

Programmed cortical cell death as a driver of root exudation in barley and maize genotypes 

Maire Holz, Valerie Pusch, Anaclara Visconti, Peng Yu, and Hannah Schneider

Root-derived carbon (C) inputs via root exudates are a key pathway linking crops to soil C and nutrient cycling. Yet, it remains insufficiently understood how programmed cell death (PCD) processes such as root cortical senescence or aerenchyma formation control root exudation. In cereals, PCD processes can lower the metabolic costs of soil exploration and reshape radial transport and rhizosphere interactions. These anatomical strategies may therefore influence both the magnitude and composition of rhizodeposition. Here, we assessed whether genotypic contrasts in cortical cell death are reflected in root exudation patterns in two cereal species.

We compared five barley (Hordeum vulgare) and six maize (Zea mays) genotypes obtained from the IPK genebank in Gatersleben and from University of Bonn selected for contrasting root anatomical properties. Plants were grown in pots for one month in a common garden experiment. Root morphology was quantified via root scanning (e.g., total root length and root surface area), and root biomass was determined. Root exudates were collected using a semi-hydroponic hybrid system and analysed for dissolved organic carbon (DOC), soluble sugars, and phenolic compounds (CGA equivalents); amino acid analyses are ongoing. After root exudation sampling, two cm long root sections were sampled from each node. Samples were taken 5-8 cm behind the root tip. Root anatomy was imaged and root cortical senescence and aerenchyma formation were quantified and are currently analysed.

Across barley genotypes, exudate DOC, sugars and phenolics showed limited differentiation during. In contrast, maize exhibited pronounced genotypic variation in root system size (root surface area, total root length) and biomass, accompanied by genotype-specific exudation profiles. Total C exudation per root surface area were lowest in Zea141 and highest in Zea90 and Zea3426, while sugar exudation was reduced in Ky228, Zea141 and Zea294 relative to other genotypes.

Overall, our results reveal strong genotype dependence of rhizodeposition in maize but comparatively conservative early patterns in barley under the tested conditions. Ongoing analyses of root cortical senescence and aerenchyma will directly test whether genotypes exhibiting greater PCD show altered root exudation pattern providing a mechanistic basis for trait-based selection of cereal genotypes to enhance root-derived C inputs to soils.

How to cite: Holz, M., Pusch, V., Visconti, A., Yu, P., and Schneider, H.: Programmed cortical cell death as a driver of root exudation in barley and maize genotypes, EGU General Assembly 2026, Vienna, Austria, 3–8 May 2026, EGU26-11151, https://doi.org/10.5194/egusphere-egu26-11151, 2026.

EGU26-12112 | ECS | Posters on site | BG3.29

Intraspecific diversity of cereals – root architecture and quantification of root carbon inputs 

Bradley Sparkes, Nadia Maaroufi, Naoise Nunan, Ali Moazzami, Tino Colombi, and Anke Herrmann

Crop diversification as an agricultural practice has been proposed for increasing carbon (C) storage in agricultural soils. Plants allocate C belowground differently depending on biotic and abiotic factors, which can be observed through variations in root architecture and root economics space. Root exudates are an important source of organic matter inputs to soils, and their composition is an important driver of plant-soil interactions in the rhizosphere. However, little is known about whether varieties of the same species differ in terms of organic matter inputs and thus their potential influence on soil functioning (e.g., C sequestration potential), and whether there is a relationship between root architecture and the composition of exudates. In a growth chamber experiment, we investigated root exudate compositions of commonly used cereal species and varieties, and their architectures were determined. Cereals were grown in rhizoboxes (40.2 x 26.1 x 3cm) for 21 days with 12-h light, 24°C and 19°C during the day and night respectively with a relative humidity of 60%, and included: 3 oat (Avena sativa L., varieties Galant, Fatima, and Ferry), 2 wheat (Triticum aestivum L., varieties Informer, and Julius), and 2 barley (Hordeum vulgare L., varieties Anneli, and SW Judit). Root system development and architecture were quantified from pictures taken regularly during the growth period, while exudate composition, collected via the soil-hydroponic-hybrid approach, were determined by 1H Nuclear Magnetic Resonance. Root system architecture varied significantly across species, while within species variation was only significant for barley and wheat. This coincided with patterns of significant variations in exudate profiles across and within species. Furthermore, our results show both how root systems and organic matter inputs can vary depending on choice of genotype within commonly grown cereals. In this presentation, we will discuss the possible link between C input and root architecture, as well as the use of intraspecific diversity in cereals to increase C storage in agricultural soils.

How to cite: Sparkes, B., Maaroufi, N., Nunan, N., Moazzami, A., Colombi, T., and Herrmann, A.: Intraspecific diversity of cereals – root architecture and quantification of root carbon inputs, EGU General Assembly 2026, Vienna, Austria, 3–8 May 2026, EGU26-12112, https://doi.org/10.5194/egusphere-egu26-12112, 2026.

EGU26-12590 | ECS | Orals | BG3.29

Modeling the role of root exudation and plant-microbe interactions in the response of soil respiration to P fertilization 

Kristian Schufft, Katrin Fleischer, Min Zhao, Belinda E. Medlyn, Lin Yu, Anja Rammig, and Sönke Zaehle

Root exudation is a substantial carbon (C) flux from plants to soils and a key pathway by which vegetation influences soil respiration. Especially in phosphorus (P) limited ecosystems, enhanced nutrient availability as a consequence of root exudation links plant C allocation to microbial activity and soil respiration. However, we have limited knowledge of how root exudation and soil microbial activity modulate soil respiration when P limitation is alleviated through fertilization. Previous studies have showed that the response of soil respiration to P fertilization is ambiguous and dependent on the ecosystem but the underlying causes often remain unidentified.

Here we used the microbial-explicit terrestrial biosphere model QUINCY-JSM, including an implementation of dynamic root exudation based on plant carbon surplus and nutrient deficiency, to investigate the role of plant-soil interactions in the response of soil respiration to P fertilization. The root exudation implementation was previously tuned and tested for the Eucalyptus Free Air Carbon Enrichment (EucFACE) experiment, where the role of increased root exudation under CO2 fertilization on soil organic matter cycling and soil respiration in a P-limited forest was evaluated. This experiment has now been fertilized with P, and here we take advantage of this modification to the experiment by simulating the EucFACE experiment under P fertilization. We investigate how microbial stoichiometry and P availability influenced simulated responses. In agreement with measurements, our model reproduced a decrease in soil respiration on P addition. Our simulations reveal root exudation as a key driver in this response: P fertilization alleviated plant P limitation, leading to a decrease in root exudation by up to 40 %. Consequently, the reduced C supply to the rhizosphere decreased microbial respiration up to 10 % and soil respiration up to 5 %. However, in simulations with high microbial P demand, microbes out-competed plants for the additionally available P and therefore suppressed the feedback to root exudation.

Our results highlight the role of root exudation in modulating soil respiration response to nutrient addition and the influence of soil microbial stoichiometry and baseline soil P availability. We make recommendations for further research by identifying critical variables for future modeling and observational studies.

How to cite: Schufft, K., Fleischer, K., Zhao, M., Medlyn, B. E., Yu, L., Rammig, A., and Zaehle, S.: Modeling the role of root exudation and plant-microbe interactions in the response of soil respiration to P fertilization, EGU General Assembly 2026, Vienna, Austria, 3–8 May 2026, EGU26-12590, https://doi.org/10.5194/egusphere-egu26-12590, 2026.

EGU26-16653 | ECS | Posters on site | BG3.29

 Phenol-Driven Changes in Root Exudation and Nutrient Cycling 

Sierra Grange, Pratikshya Khatiwada, Clara Mendoza-Lera, Hermann Jungkunst, and Melanie Brunn

Invasive plant species often alter soil chemistry through root exudates, including phenolic compounds, which can inhibit native plant growth. Understanding how these compounds influence soil-plant interactions is crucial for predicting the ecological impacts of invasive species. This study focuses on the effects of phenolic compounds, particularly coumaric acid, a widely occurring phenol in invasive plant species, on biomass production, nitrogen cycling, and exudation dynamics of a native plant grown in soil affected by contrasting water regimes (regularly flooded and non-flooded). To test the hypothesis that phenols affect nitrogen cycling and impact plant growth, initial experiments evaluated the effects of four phenols in inhibiting nitrification. Subsequent experiments focused on coumaric acid, as it was the phenol with the strongest reduction of nitrification rates in soil, measuring its influence on biomass production of the native plant Persicaria lapathifolia as well as their exudation patterns under flooded and non-flooded soil conditions. Preliminary findings suggest that phenolic compounds reduce biomass production, primarily above ground, supporting the hypothesis of growth inhibition. Exudation patterns showed high variability, with phenols disrupting established exudation trends. In flooded soil conditions, plants exposed to phenols exhibited increased nitrogen uptake, potentially as an adaptive response to altered nutrient dynamics. These findings highlight the complex interactions between phenols, root exudation, and nitrogen dynamics in riparian soil that underwent varying flooding patterns. The results suggest that invasive species may leverage phenolic compounds to inhibit native plant growth and alter nutrient cycling, providing insight into invasion strategies and their potential implications under climate change.

How to cite: Grange, S., Khatiwada, P., Mendoza-Lera, C., Jungkunst, H., and Brunn, M.:  Phenol-Driven Changes in Root Exudation and Nutrient Cycling, EGU General Assembly 2026, Vienna, Austria, 3–8 May 2026, EGU26-16653, https://doi.org/10.5194/egusphere-egu26-16653, 2026.

EGU26-18987 | ECS | Posters on site | BG3.29

Root exudates help to rewet dry soil and may improve root water uptake performance in certain environmental conditions. 

Emma Gómez Peral, Andrew Mair, Iker Martín Sánchez, Mariya Ptashnyk, and Lionel Dupuy

Root exudates can significantly modify soil hydraulic properties by affecting water surface tension. When released into the rhizosphere, exudates from certain plant species can act as natural surfactants, notably influencing water movement and retention in the soil.

This study analyzes how root exudates affect water infiltration and redistribution in soils composed of wet and dry layers. Transparent soil microcosms were constructed using Nafion particles in glass chambers, with a wet top layer, a dry intermediate barrier, and a wet bottom layer. Exudates extracted from winter wheat roots, along with a dye tracer, were added to the wet top layer in half of the chambers, while the controls contained only water with the tracer. Time-lapse image analysis was used to quantify the movement of the wetting front and assess the effect of the exudates on soil permeability.

The results show that the presence of exudates promotes water infiltration through the dry barrier and improves hydraulic connectivity between different soil layers. These results demonstrate that the natural surfactant activity in root exudates can facilitate water movement, highlighting it as an important mechanism in the interaction between root systems and soil water dynamics.

How to cite: Gómez Peral, E., Mair, A., Martín Sánchez, I., Ptashnyk, M., and Dupuy, L.: Root exudates help to rewet dry soil and may improve root water uptake performance in certain environmental conditions., EGU General Assembly 2026, Vienna, Austria, 3–8 May 2026, EGU26-18987, https://doi.org/10.5194/egusphere-egu26-18987, 2026.

EGU26-19613 | ECS | Posters on site | BG3.29

Bimodal diurnal patterns of belowground carbon exudation and nitrogen uptake and release in beech and spruce suggest source and sink driven controls 

Benjamin D. Hafner, Christian Friedl, Jacob B. Scharfetter, Taryn L. Bauerle, and Mohsen Zare

Root exudation constitutes a major pathway by which plants exchange carbon and nitrogen with the soil, yet its temporal dynamics remain poorly understood under field conditions. In particular, it is unclear to what extent short-term variations in exudation reflect diurnal carbon assimilation patterns or are driven by transport-related processes within the plant.

We investigated diurnal patterns of root carbon exudation and nitrogen uptake and release in two temperate tree species, European beech (Fagus sylvatica) and Norway spruce (Picea abies), at high-resolution (4-hour) sampling intervals over three full diel cycles. For each species, we studied both mature canopy trees and juvenile understory individuals to assess the dependency of exudation dynamics on light availability and plant internal storage capacity. In addition, we quantified non-structural carbohydrate (NSC) pools in fine roots.

Across species and tree age, root carbon exudation exhibited a pronounced bimodal diurnal pattern, with one peak occurring during midday and a second peak during the evening. These peaks were separated by two distinct minima in the early morning and afternoon. Nitrogen was released during the day with a peak during midday, similar to the time of carbon release. In turn we found that nitrogen uptake by fine roots happened during the night, while carbon exudation was still detectable. Nighttime carbon release and nitrogen uptake was higher in mature than in understory trees.

Our results demonstrate that root exudation in forest trees follows diurnal dynamics that cannot be explained by instantaneous carbon assimilation alone. We propose that transport-related processes and internal carbon storage play an important role in regulating belowground carbon release. (Net) nitrogen uptake occurred exclusively at night, possibly to support nighttime tree growth or regeneration. These diurnal carbon and nitrogen dynamics have important implications for associated soil biogeochemical processes.

How to cite: Hafner, B. D., Friedl, C., Scharfetter, J. B., Bauerle, T. L., and Zare, M.: Bimodal diurnal patterns of belowground carbon exudation and nitrogen uptake and release in beech and spruce suggest source and sink driven controls, EGU General Assembly 2026, Vienna, Austria, 3–8 May 2026, EGU26-19613, https://doi.org/10.5194/egusphere-egu26-19613, 2026.

EGU26-19687 | ECS | Posters on site | BG3.29

A novel design for sampling root exudates: Does root exudation differ depending on root tissue type and along the root axis? 

Flora Brumen, Eva Oburger, and Michael Santangeli

Roots release soluble organic compounds, known as root exudates, into the soil that influence carbon and nutrient cycling. Understanding the quantity, quality and spatial dynamics of root exudates is crucial to gain deeper insights into plant-soil-microbe interactions. Despite advances, knowledge gaps remain regarding exudate dynamics and composition in soil systems, as many studies mainly relied on hydroponic methods, which may not accurately replicate natural conditions of soil. This study investigated the spatial variability and composition of root exudates by assessing the difference between localized root segment sampling and whole root system (WRS) sampling as well as the contribution of root hairs to exudation. Two genotypes of Zea mays, wildtype B73 (WT) and root-hairless mutant (rth3), were grown in soil-filled rhizoboxes under controlled conditions in a growth chamber. Root exudates were collected by custom-designed exudation traps targeting different positions along the root axis and root tissue types, and were compared to WRS exudation rates obtained with a soil-hydroponic-hybrid approach. Exudates were analysed spectrophotometrically for total dissolved organic carbon, soluble carbohydrates, phenolic compounds, and amino acids. Results revealed significant spatial variability in exudation along the root axis, with young root tissue exhibiting higher exudation rates than older segments, and double those of WRS. Root hairs and genotypic differences showed less influence than anticipated, with position along the root axis being the dominant factor. Extrapolating exudation rates of individual segments to WRS consistently overestimated whole root system exudation, emphasizing the need for careful interpretation of exudation hotspots and WRS rates. This study highlights the importance of soil-based approaches and ecologically relevant root exudate sampling for spatially resolved insights into carbon input via plant roots into the soil.

How to cite: Brumen, F., Oburger, E., and Santangeli, M.: A novel design for sampling root exudates: Does root exudation differ depending on root tissue type and along the root axis?, EGU General Assembly 2026, Vienna, Austria, 3–8 May 2026, EGU26-19687, https://doi.org/10.5194/egusphere-egu26-19687, 2026.

EGU26-20338 | ECS | Posters on site | BG3.29

An exudate extravaganza – how changes in root traits and exudation in response to insect-based fertilizer could elucidate differences in crop species nitrogen uptake strategy 

Franklin Harris, Gerlinde De Deyn, Inge Knoester, Hugo Glashier, Ellen Kandeler, Christian Poll, and Marie Zwetsloot

Root exudates are a primary pathway through which plants can recruit and interact with microbial communities surrounding their roots. Yet little is known about how crop species differing in root exudate quantity and quality influence the microbial mineralization of organic nitrogen in the rhizosphere. This is a particularly urgent question considering the need for effective novel organic fertilizers, such as insect-based fertilizer from black soldier fly (flytilizer), without compromising crop yields. Therefore, the aim of this study was to examine root exudation across 20 crop species, then link this to root traits indicative of fast vs. slow-growing strategies, mineralization of nitrogen in the rhizosphere, and plant nitrogen uptake. Additionally, we wanted to examine how these patterns changed when flytilizer was added. We expected that the total organic carbon (TOC) of root exudation would be positively correlated to rhizosphere microbial nitrogen cycling enzyme activity and plant N content. We also expected higher TOC and sugar to phenolic ratio to be positively correlated to strategies where plants grow quickly. Finally, we expected that when flytilizer is added, the relationship between TOC of root exudates and rhizosphere microbial nitrogen cycling activity to be weakened. To fill this gap, we conducted a greenhouse experiment with 20 crop species from 10 families grown in sandy field soil without and with flytilizer. We ensured the plants were nitrogen limited by applying mineral fertilizer containing all essential elements for plant growth apart from nitrogen. We measured relative growth rate and, after 7 weeks, we measured a variety of root traits, root exudation, as well as microbial biomass and the activity of five nutrient-cycling enzymes in the rhizosphere. Plant productivity and plant nitrogen (N) content were also quantified and for each crop species.

How to cite: Harris, F., De Deyn, G., Knoester, I., Glashier, H., Kandeler, E., Poll, C., and Zwetsloot, M.: An exudate extravaganza – how changes in root traits and exudation in response to insect-based fertilizer could elucidate differences in crop species nitrogen uptake strategy, EGU General Assembly 2026, Vienna, Austria, 3–8 May 2026, EGU26-20338, https://doi.org/10.5194/egusphere-egu26-20338, 2026.

EGU26-21404 | ECS | Orals | BG3.29

Drivers of Tree Root Exudation in Forest Ecosystems: A Global Synthesis  

Ahmet Aydogdu, Alexia Stokes, Lorenzo Rossi, Guangqi Zhang, Santiago Trueba, Gaëlle Viennois, Awaz Mohamed, and Zhun Mao

Forest ecosystems are particularly relevant for global root exudation rates as they cover about 31% of Earth’s land area and store ~861 Pg C as live biomass, dead wood, litter, and soils—making them one of the largest terrestrial carbon reservoirs. Root exudation represents a dynamic carbon flux pathway linking plant allocation to soil microbial activity, potentially accounting for 7–14% of global gross primary productivity. However, current global estimates often aggregate diverse biomes (forests, grasslands, croplands) or rely on seedling experiments, leaving the specific environmental and biological drivers of root exudation in established forest ecosystems poorly quantified. This study presents the first meta-analysis of in-situ root exudation rates focusing specifically on forest trees, aiming to evaluate how biotic and abiotic factors jointly influence belowground carbon flux. We conducted a meta-analysis to compile a curated database of in-situ root exudation measurements. To ensure ecological relevance, we excluded greenhouse and seedling experiments, restricting the analysis to established forest stands during the growing season (April–November). The final dataset includes 248 monthly observations from 33 studies across 76 tree species. Time-series observations allow for an in-depth analysis of seasonal root exudation patterns. These observations were integrated with global databases (GRooT, FungalRoot, WorldClim, Harmonized World Soil Database) to test drivers of root exudation rates including climatic variables, soil types, mycorrhizal type and Root Economic Spectrum (RES) traits. Preliminary results from 189 growing-season observations indicate that exudation rates were low in tree species associated with ectomycorrhizas (that were potentially forming a sheath around root tips and reducing exudates transferred into soil). Evergreens had greater exudation rates than deciduous species, but climate was purely linked to exudation. Furthermore, exudation rates were only weakly aligned with the main axes of the RES (e.g., specific root length and root tissue density), suggesting that exudation rates vary largely independently of morphological conservation-acquisition trade-offs. Furthermore, our analyses highlight a critical lack of data outside the growing season, particularly in winter and early spring. In conclusion, ectomycorrhizas are major C sinks, with little carbon from exudates reaching soil in colonised roots. Root traits are overall poor predictors of exudation and we postulate that root tips should be measured preferentially, as tips are the site of exudation in tree roots. This synthesis provides a more robust framework for understanding rhizosphere carbon dynamics, which is vital for improving the representation of root-soil processes in global carbon models.

How to cite: Aydogdu, A., Stokes, A., Rossi, L., Zhang, G., Trueba, S., Viennois, G., Mohamed, A., and Mao, Z.: Drivers of Tree Root Exudation in Forest Ecosystems: A Global Synthesis , EGU General Assembly 2026, Vienna, Austria, 3–8 May 2026, EGU26-21404, https://doi.org/10.5194/egusphere-egu26-21404, 2026.

EGU26-21438 | ECS | Orals | BG3.29

Root exudate and litter impacts on microbial turnover and soil carbon stabilization are species specific 

Chupei Shi, Elly Morriën, Boris Jansen, Wolfgang Wanek, and Franciska de Vries

Differences in root exudate and litter quality are known to regulate microbial activity and net soil carbon (C) accumulation. For example, legume root exudates are known to have high amino acid content, and their root litters are characterized by low lignin and high C/N ratio.  Therefore, root-derived C from legumes can potentially enhance microbial activity and turnover rates, and facilitate microbial necromass production – the precursor for mineral-associated organic matter (MAOM) in soils.

Stable isotope probing has been widely applied to trace C fluxes into microbial respiration and soil C pools such as particulate organic matter (POM) and MAOM. However, most existing studies rely on artificial substrates or single compounds as proxies for root exudates, thereby neglecting the chemical complexity of root exudates and potential interactions between root exudates and litters on microbial C processing.

Here, we address this gap by isolating ¹³C-labelled species-specific root exudates and litter derived from three grassland species (L. perenne, P. lanceolata, and T.pratense) with contrasting root traits for an incubation experiment. Matured plants were pulse-labelled with ¹³CO₂ for three days, after which ¹³C-labelled root exudates and litter were collected and amended to bare soil either individually or in combined in a 75-day incubation experiment. We expect high quality root exudate and litter from T.pratense to induce higher microbial respiration and priming effect, and overtime,  elevated necromass production and C stabilization in MAOM.

Root exudates and litter derived from P. lanceolata, and T. pratense induced higher cumulative priming effects than those from L. perenne. Thereafter, microbial respiration rates declined over time. By the end of the incubation, the highest microbial turnover rate was observed in the T. pratense litter treatment, suggesting rapid microbial mortality and substantial necromass production over the incubation period.

Consistent with this pattern, mean residence times of P. lanceolata, and T. pratense root exudates in MAOM (1973 and 1754 yrs) were higher than those of L. perenne root exudates (493 yrs). In addition, T. pratense root litter exhibited the longest mean residence time in POM (149 yrs). Together, these results suggest that legumes can increase soil C accumulation through the positive impacts of their root exudate and litter on microbial turnover.

How to cite: Shi, C., Morriën, E., Jansen, B., Wanek, W., and de Vries, F.: Root exudate and litter impacts on microbial turnover and soil carbon stabilization are species specific, EGU General Assembly 2026, Vienna, Austria, 3–8 May 2026, EGU26-21438, https://doi.org/10.5194/egusphere-egu26-21438, 2026.

EGU26-21644 | Posters on site | BG3.29

Species-specific root exudation drives Carbon and Nitrogen Dynamics in Young Reforested Alder and Oak Forests  

Novalia Kusumarini, Liam Cox, Iseult Lynch, and Sami Ullah

Root exudates are key regulators of rhizosphere processes, which control nitrogen (N) and carbon (C) cycling in the rhizosphere that underpin forest ecosystem functioning. However, how species and season-specific exudate quantity and quality influence these processes remain poorly understood. We compared exudates quantity and quality from an N₂-fixing alder (Alnus glutinosa), with a non-N₂-fixing oak (Quercus robur) tree across the growing season and its implications for N and C dynamics in the rhizosphere of a young forest (c.5 years old). We also scanned and recorded root traits of relevance to nutrient acquisition. We investigated how tree species and seasonality affect root exudate composition, soil N transformation, and mineralization potential of soil organic matter (SOM) among fast- and slow-cycling SOM pools. To isolate exudate effects, we complemented field observations with controlled additions of artificial exudates cocktails to soils mimicking natural concentrations and C:N ratios.

Root exudates were collected in situ as in Philip et al. (2008). Exudate quantity and composition differed markedly between species and varied seasonally. Oak exudates exhibited substantially greater exudation rates, including 57.0% higher carbon (p = 0.005) and 64.5% higher nitrogen exudation (p< 0.001). In contrast, alder exudates had a 15.9% higher C:N ratio than oak across the growing season, indicating lower organic C quality and reduced lability. Furthermore, oak exhibited a more acquisitive root strategy than alder, with higher specific root length (+125.8%, p = 0.016) and root tissue density (+86.8%, p = 0.186). Root exudation peaked in summer and declined in autumn, tracking seasonal photosynthetic activity. Exudates metabolomic analyses showed dominance of secondary metabolite biosynthesis pathways, followed by amino acid metabolism, which was more pronounced in alder, whereas oak exudates were characterized by enhanced aromatic compound degradation, likely reflecting stronger microbial processing in the oak rhizosphere.

Artificial root exudate addition showed that oak exudates, characterized by lower C:N ratios and higher carbon (C) inputs, stimulated stronger microbial nutrient cycling responses than alder exudates, increasing soil respiration by up to 1.74-fold, microbial biomass C by 1.62-fold, microbial biomass N by 11-fold, and gross N mineralization by fourfold. N Mineralization rates increased with exudate concentration and incubation time, with the strongest responses under oak exudates. However, net nitrification declined at high exudate inputs, likely due to microbial immobilization of N and gaseous N losses.

Carbon fractionation revealed that mineral-associated organic carbon (MAOC) dominated soil C and N stocks (>90%), whereas particulate organic carbon (POC) varied seasonally and between species (alder > oak; autumn maximum). Despite its smaller pool size given that this restored forest stand was 5 years old at the time of sampling, POC mineralized over 25 times faster per unit C than MOAC overall.

Overall, root exudate quantity and quality regulate microbial activity, nutrient retention, and C–N coupling in young forest soils, with consequences for productivity, carbon sequestration, and ecosystem–climate feedbacks.

How to cite: Kusumarini, N., Cox, L., Lynch, I., and Ullah, S.: Species-specific root exudation drives Carbon and Nitrogen Dynamics in Young Reforested Alder and Oak Forests , EGU General Assembly 2026, Vienna, Austria, 3–8 May 2026, EGU26-21644, https://doi.org/10.5194/egusphere-egu26-21644, 2026.

Roots regulate a variety of carbon cycle processes in ecosystems. I will discuss the scope of inferring rhizosphere function from broad spatial scale analyses of root traits and carbon cycle state factors. In the first example, fine root carbon (FRC) in soils is typically hypothesized to be positively related to soil organic carbon (SOC). However, FRC inputs can also enhance SOC loss through priming. We tested the broad-scale relationships between SOC and FRC at 43 sites across the US National Ecological Observatory Network (Malhotra et al. 2025). We found that SOC and FRC stocks were positively related with an across-ecosystem slope of 7 ± 3 kg SOC m−2 per kg FRC m−2, but this relationship was driven by grasslands. Grasslands had double the slope compared to the across-ecosystem slope while forest FRC and SOC were unrelated. Furthermore, deep grassland soils primarily showed net SOC accrual relative to FRC input. Conversely, forests had high variability in whether FRC inputs were related to net SOC priming or accrual. We conclude that while FRC increases could lead to increased SOC in grasslands, especially at depth, the FRC-SOC relationship remains difficult to characterize in forests; suggesting a disproportionate role of priming in shaping forest SOC. In addition to regulating SOC, roots influence trace gas production in ecosystems. I will also discuss examples relating root form to methane function in wetlands (Määttä and Malhotra 2024), highlighting the elusive role of root exudation in methanogenesis. 

Citations:

Malhotra A,  JAM Moore, S Weintraub-Leff, K Georgiou, AA Berhe, SA Billings, M-A de Graaff, JM Fraterrigo, AS Grandy, E Kyker-Snowman, M Lu, C Meier, D Pierson, SJ Tumber-Dávila, K Lajtha, WR Wieder & RB Jackson. Fine root and soil carbon stocks are positively related in grasslands but not in forests. Communication Earth & Environment 6, 497 (2025). https://doi.org/10.1038/s43247-025-02486-9

Määttä T and A Malhotra, The hidden roots of wetland methane emissions (2024). Global Change Biology. 30, e17127

How to cite: Malhotra, A.: Fine root and carbon cycle relationships across broad scales: what can we infer about rhizosphere function?, EGU General Assembly 2026, Vienna, Austria, 3–8 May 2026, EGU26-22018, https://doi.org/10.5194/egusphere-egu26-22018, 2026.

EGU26-22130 | Orals | BG3.29 | Highlight

Sampling Root Exudates – Mission Impossible II: Small Details Matter 

Eva Oburger, Uxue Oxtanorena-Ieregi, Michael Santangeli, Andreea Spiridon, Henning Schwalm, Eithne Browne, Molly Brown, Lawrie Brown, David Roberts, Aoife Duffe, Jennifer Morris, Pete Hedely, James Abbot, Peter Thorpe, Fiona Brennan, Davide Bulgarelli, Tim George, and Carmen Escuerdo-Martinez

The input of soluble carbon from living plant roots (i.e., root exudation) into soil has received increasing attention over recent decades, as root exudates are recognized as key drivers of plant–soil–microbe interactions. However, obtaining ecologically meaningful root exudate samples remains challenging. In this presentation, I will highlight insights into often overlooked aspects of existing exudate sampling schemes, including the effects of sampling solution volume, sampling matrix, and microbial activity. Furthermore, I will introduce a new experimental scheme that integrates established approaches for root exudate collection with rhizosphere microbiota characterization into a single, unified protocol. Fine-tuning our exudate sampling techniques is essential for advancing our understanding of the identity, fate, and function of plant metabolites released into soil and their impact on (soil) ecosystem processes.

How to cite: Oburger, E., Oxtanorena-Ieregi, U., Santangeli, M., Spiridon, A., Schwalm, H., Browne, E., Brown, M., Brown, L., Roberts, D., Duffe, A., Morris, J., Hedely, P., Abbot, J., Thorpe, P., Brennan, F., Bulgarelli, D., George, T., and Escuerdo-Martinez, C.: Sampling Root Exudates – Mission Impossible II: Small Details Matter, EGU General Assembly 2026, Vienna, Austria, 3–8 May 2026, EGU26-22130, https://doi.org/10.5194/egusphere-egu26-22130, 2026.

EGU26-1169 | ECS | Orals | BG3.30

Modelling Nitrous Oxide Emissions from Croplands in sub-Saharan Africa Using the CN-Model 

Muhammad Aammar Tufail, Phillip Agredazywczuk, Turry Ouma, Matti Barthel, Abigael Otinga, Ruth Njoroge, Sonja M. Leitner, Yuhao Zhu, Collins O. Oduor, Kevin Churchil Oluoch, Johan Six, Benjamin D. Stocker, and Eliza Harris

Nitrous oxide (N₂O), a potent greenhouse gas, contributes significantly to climate change, with agricultural soils being a major source. In sub-Saharan Africa (SSA), increasing fertilization to boost productivity is expected to elevate N₂O emissions, however data scarcity and regional variability challenge accurate predictions. Thus, quantifying these fluxes remains a major challenge for both science and policy. Here, we present a process-based modelling study of N2O emissions using the CN-model, recently introduced as a mechanistic tool for simulating carbon-nitrogen coupling in terrestrial ecosystems [1], extended here for soil nitrogen transformations and N2O emissions. We apply the CN-model to an experimental maize cropping site in Eldoret, Kenya, as part of the N₂O-SSA project, which investigates greenhouse gas emissions in sub-Saharan African agroecosystems. The site in Eldoret (Kenya), features two annual rainfed maize and potato cropping seasons, with varied nitrogen fertilization regimes (0, 50, 100, and 125 kg N ha-¹ yr-¹). Our analysis covers the 2024 growing period (April 2024-January 2025), during which high-frequency flux measurements of N₂O, CH₄, and CO₂ were collected. The CN-model simulates microbial nitrification and denitrification pathways, soil moisture interactions, and fertilization impacts, providing process-level insights into observed N₂O flux dynamics. Model outputs are evaluated against measured greenhouse gas fluxes to assess predictive performance and to explore the effects of nitrogen input levels, precipitation patterns, and cropping cycles. Simulations under both current and future climate scenarios are used to assess potential trajectories under alternative management practices. This modeling framework is critical for improving nitrogen budgeting by enabling more precise and efficient fertilizer use, reducing unnecessary nitrogen losses, and supporting climate-smart agricultural practices. Preliminary results show that the CN-model captures both background and event-driven emissions effectively, highlighting the sensitivity of N₂O emissions to rainfall timing and nitrogen inputs. This work illustrates the value of combining mechanistic modelling with targeted field observations in sub-Saharan African smallholder systems to better constrain N₂O budgets and inform mitigation strategies under a changing climate.

ACKNOWLEDGEMENT
This research was generously supported by the Swiss National Science Foundation (SNSF) under grant number 200021_207348.

REFERENCE
1. Stocker, B. D. & Prentice, I. C. CN-model: A dynamic model for the coupled carbon and nitrogen cycles in terrestrial ecosystems. bioRxiv, 2024.2004.2025.591063 (2024). https://doi.org/10.1101/2024.04.25.591063

How to cite: Tufail, M. A., Agredazywczuk, P., Ouma, T., Barthel, M., Otinga, A., Njoroge, R., Leitner, S. M., Zhu, Y., Oduor, C. O., Oluoch, K. C., Six, J., Stocker, B. D., and Harris, E.: Modelling Nitrous Oxide Emissions from Croplands in sub-Saharan Africa Using the CN-Model, EGU General Assembly 2026, Vienna, Austria, 3–8 May 2026, EGU26-1169, https://doi.org/10.5194/egusphere-egu26-1169, 2026.

EGU26-3931 | ECS | Posters on site | BG3.30

Nitrogen cycling (deposition, leaching and N trace gas) in lowland tropical forests of the Congo Basin 

Serge Alebadwa, Marijn Bauters, Dries Landuyt, Matti Barthel, Isaac Makelele, Corneille Ewango, Pascal Boeckx, and Ralf Kiese

Congo Basin forests are exposed to high nitrogen inputs by atmospheric deposition which so far could not be matched by measured nitrogen losses and plant uptake (Bauters et al., 2019, Makelele et al., 2022, Barthel et al., 2022). High nitrogen deposition in the Congo Basin mainly originates from biomass burning as practiced during shifting cultivation (Bauters et al., 2018). Overall, this N budget imbalance suggests that other gaseous N-losses, such as N2 fluxes, may play a major role in the N-cycle of Afrotropical forests (Barthel et al., 2022) although not yet quantified as such in the Congo Basin. Thus, the main research question we focus upon here: Can the high fire-derived nitrogen deposition be balanced by N2 emissions in the Congo Basin?  To answer this key question, we first used permanently installed throughfall and lysimeter networks, sampled weekly, in Gilbertiodendron dewevrei forests to analyse nitrogen deposition and leaching (ammonium, nitrate, nitrite, total dissolved nitrogen (TDN), dissolved inorganic nitrogen (DIN) and dissolved organic nitrogen (DON)) over a full year. Secondly, we measured weekly soil greenhouse gas fluxes (CO2, CH4 and N2O) in the same forest over a full year based on manual static chamber measurements. Thirdly, we used the He/O2 gas-flow-soil-core method to measure for the first time N2 and N2O fluxes and calculated the denitrification product ratio (N2O/(N2O+N2)). Our results confirmed, in line with previous studies, high atmospheric N deposition in the Gilbertiodendron dewevrei forest with substantially low in-situ soil nitrous oxide fluxes. Furthermore, Gilbertiodendron dewevrei forest, with ectomycorrhizal symbiosis, showed highest reduction rates of N2O to N2 (complete denitrification). Therefore, the N budget imbalance in the Congo basin, and especially the Gilbertiodendron dewevrei forests of the Congo Basin, can be explained by high N2 emissions from denitrification processes.  

How to cite: Alebadwa, S., Bauters, M., Landuyt, D., Barthel, M., Makelele, I., Ewango, C., Boeckx, P., and Kiese, R.: Nitrogen cycling (deposition, leaching and N trace gas) in lowland tropical forests of the Congo Basin, EGU General Assembly 2026, Vienna, Austria, 3–8 May 2026, EGU26-3931, https://doi.org/10.5194/egusphere-egu26-3931, 2026.

EGU26-4977 | ECS | Orals | BG3.30

Combined measurement of 15N-NH4+, NH2OH, NO2- and NO3- via derivatization and UPLC-MS 

Nathalie Heldwein, Katharina Kitzinger, and Wolfgang Wanek

15N tracing is an important tool to study N transformations in soils, cultures and aquatic systems. The most commonly used methods for quantification of 15N in NH4+, NH2OH, NO2- and NO3- rely on conversion to N2O and subsequent analysis by GC-IRMS. The disadvantage of these methods is that all four compounds are converted to the same product and thus cannot be measured in one run. Here, we convert each N species into a unique derivatization product that can be distinguished by high resolution mass spectrometry. For application in soils, the workflow includes the following steps: (1) extraction, (2) derivatization, (3) solid phase extraction (SPE) and (4) UPLC coupled to ESI-MS, in our case a Q-Exactive Orbitrap. NH4+, NO2- and NO3- can be extracted together with 1 M KCl. NH2OH, however, is not stable under these conditions and requires a different, newly developed extraction procedure. Steps (2) and (3) are carried out separately for each N compound. For the derivatization we employ reagents commonly used for the spectrophotometric detection of the respective N species: ortho-phthalaldehyde for NH4+, quinoline-8-ol for NH2OH, and n-naphthylethylenediamine with sulfanilamide or sulfanilic acid for NO2- and NO3-, respectively. Before reversed phase separation by UPLC, the derivatization products need to be cleaned up by SPE (step 3) to remove salts originating from extraction and derivatization that would harm the mass spectrometer. After clean-up, the SPE eluates can either be measured individually to achieve maximum sensitivity or be combined to measure all four compounds in one run on the UPLC-MS system. So far, we have optimized steps (1) to (3) and are currently working on optimizing the UPLC-MS method for concurrent separation and (isotope) quantification of all four N forms.

How to cite: Heldwein, N., Kitzinger, K., and Wanek, W.: Combined measurement of 15N-NH4+, NH2OH, NO2- and NO3- via derivatization and UPLC-MS, EGU General Assembly 2026, Vienna, Austria, 3–8 May 2026, EGU26-4977, https://doi.org/10.5194/egusphere-egu26-4977, 2026.

EGU26-7571 | Posters on site | BG3.30

Improving and combining isotopic approaches to optimize sensitivity and accuracy of N2 and N2O fluxes in the field 

Caroline Buchen-Tschiskale, Thade Potthoff, Henrike Mielenz, Tristan Rösel, Jaqueline Stenfert Kroese, and Reinhard Well

Nitrous oxide (N2O) emissions contribute notably to the greenhouse effect and are driven mainly by agricultural practices, while nitrogen (N) losses as N2O and dinitrogen (N2) also impair plant N nutrition. The 15N gas-flux method (15NGF) can be used for the direct quantification of N2 and N2O from denitrification, while the natural abundance isotopic composition of N2O provides valuable clues about its microbial sources and its reduction to N2. However, both methods suffer from limited sensitivity, causing field data sets to have gaps when fluxes are below the detection limit. Soil air sampling can, in principle, overcome these limitations. Accounting for diffusive isotopic effects, admixture with atmospheric N2O, and changes in produced N2 and N2O during transport in the soil remains challenging. To evaluate detection limits and to correct raw data, calibration with standard gases that cover the isotopic range of the experimental samples is required. Until recently, suitable gases were not commercially available. Our aim is to develop and test solutions that overcome these limitations.

To obtain continuous field and lab data, we combined results from conventional N2O flux studies with isotopic data. 15NGF was applied in the field under normal atmosphere as well as under artificially N2-depleted atmosphere (15NGF+) to improve detection limits. Additionally, under normal atmosphere, chamber accumulation was extended to 20 hours and soil air was analyzed. Precision and bias were evaluated using custom-made gas standards. In parallel treatments, isotopic N2O fluxes at natural abundance were determined and evaluated using the N2O isotopocule mapping approach to evaluate N2O pathways. To enhance our understanding of N2O processes, a combined approach of 15NGF and N2O isotopocules is also promising. All approaches were compared to evaluate how the data can be combined to obtain continuous field flux data.

How to cite: Buchen-Tschiskale, C., Potthoff, T., Mielenz, H., Rösel, T., Stenfert Kroese, J., and Well, R.: Improving and combining isotopic approaches to optimize sensitivity and accuracy of N2 and N2O fluxes in the field, EGU General Assembly 2026, Vienna, Austria, 3–8 May 2026, EGU26-7571, https://doi.org/10.5194/egusphere-egu26-7571, 2026.

Biogeochemical models are useful tools for modeling nitrous oxide (N2O) emissions from agricultural mineral soils. However, most biogeochemical models assume that conditions favoring N2O producing reactions, nitrification and denitrification, are spatially homogeneous distributed in soil. Recent studies have shown, that conditions favoring N2O producing, like the availability of easy degradable organic carbon, nitrate and ammonium and the establishment of anaerobic conditions are often concentrated in hot spots around particular organic matter originating from crop residues and organic amendments. In contrast to common biogeochemical models, spatially explicit models are required to better describe dynamics of N2O emissions.

To address the role of spatial heterogeneity of conditions responsible for nitrification and denitrification, we introduce a model approach combining biogeochemical process descriptions at hot spots and the bulk soil. The „hot spot” part of the model includes the description of diffusive transport of solutes and gases in a spherical object combined with process descriptions like mineralization, nitrification, nitrifier denitrification and denitrification. Several instances of the hot spot module then interact with the model approach describing processes in the bulk soil.

In this study, a laboratory experiment will be modeled in order to simulate the application of a single type of manure on the surface and the injection of manure into the center of a column in sandy and loess soils with water contents set at 40% and 60% WFPS.

The submodel will be integrated into the DNDCv.Can model, which provides the boundary conditions and input data required for the submodel and also participates in determining the O2 concentration by explicitly calculating the diffusion from the surface to the soil layer where the hot spot is located.

Our hypothesis is that the DNDCv.Can model with the hot spot submodule will be able to describe the daily dynamics of the nitrification and denitrification processes generated by the hot spot induced in the experiment more accurately, which would greatly help the further development of the model for the application of this approach in real agricultural practice.

How to cite: Grosz, B. and Dechow, R.: Integration and testing of the Hot-Spot submodel with the DNDCv.Can model on the results of a manure-soil laboratory experiment, EGU General Assembly 2026, Vienna, Austria, 3–8 May 2026, EGU26-10754, https://doi.org/10.5194/egusphere-egu26-10754, 2026.

Under the East Asian monsoon, Karst forest hillslopes in SW China experience strong soil erosion and nutrient runoff, yet the influence of rainfall event on soil nitrogen (N) transformation pathways and nitrous oxide (N2O) emission from these fragile soil systems remains poorly constrained. We conducted in situ measurements of soil N2O fluxes along a forested hillslope at the Yaji karst experimental site (Guilin, SW China), covering two contrasting topographic positions with replicated plots sampled across five summer rainfall events. We quantified soil moisture and extractable substrates (mineral N and dissolved organic carbon), measured nitrate dual isotopes (δ15N and δ18O), the abundance of denitrification-related functional genes and N2O isotopocule site preference (SP). The FRactionation And Mixing Evaluation (FRAME) model was used to partition pathway contributions and to estimate the fraction of N2O reduction.

Our results demonstrated that the topographic position significantly shapes the spatial distribution of soil moisture and inorganic N substrate, leading to divergent N2O emission patterns. Soils at the footslope functioned as a biogeochemical hotspot characterized by the preferential accumulation of nitrate (NO3-) with elevated water-filled pore space (WFPS), which resulted in two-fold higher N2O fluxes on average compared to the upper hillslope. Superimposed on this spatial contrast, fluxes varied strongly among events. During intensive rainfall, near-saturated conditions led to a strong dampening of the N2O flux (r = -0.75). FRAME results indicate that rainfall shifts the balance between nitrification-associated and denitrification-associated N2O production, with the direction and magnitude varying by topographic position. FRAME further suggests that the fraction of N2O reduction to N2 tends to increase under rainfall-influenced conditions at the footslope but decrease at the upper slope.

These findings highlight that hillslope topography acts as a key landscape variable in explaining spatial heterogeneity of water and N substrate balance as well as N2O emission patterns. Our study underscores the importance of integrating topographic driven resource redistribution into greenhouse gas models for subtropical Karst landscapes.

Keywords: Karst hillslope; N2O dynamics; Denitrification; Isotopic signature

How to cite: Zou, N., Gan, Z., Wu, Z., Li, J., Zhu, T., and Yu, L.: Topographic differences constrain event-scale soil nitrogen and N2O dynamics on a subtropical karst hillslope: Insights from isotopic signatures, EGU General Assembly 2026, Vienna, Austria, 3–8 May 2026, EGU26-10873, https://doi.org/10.5194/egusphere-egu26-10873, 2026.

EGU26-11221 | Posters on site | BG3.30

Long-term organic fertilisation shifts N2O production towards denitrification in an alpine grassland soil 

Johannes Friedl, Carlos Claramonte Manrique, Kathiravan Meeran, Andreas Bohner, Robert Kirkby, Sebastian Wieser, Martin Gerzabek, and Katharina Keiblinger

Organic fertilisers including farmyard and liquid manure supply organic matter and nutrients to grassland soils, with potential benefits for organic carbon (C) storage, soil fertility and ultimately, productivity. However, these benefits may be partially offset by changes in nitrogen (N) turnover and associated emissions of nitrous oxide (N₂O), a potent greenhouse gas, contributing to climate change. Here, we investigated legacy effects of long-term fertilisation on N transformations and N₂O production pathways from an alpine grassland soil from Styria, Austria, subjected to organic (ORG), mineral (NPK), or no fertilization (NIL) since 1971. Combining the 15N pool dilution and the 15N gas flux method enabled to quantify gross rates of mineralisation, nitrification, and dissimilatory nitrate reduction to ammonium (DNRA), together with N2O production pathways and the reduction to environmentally benign dinitrogen (N2) in a soil microcosm experiment. Long-term organic fertilisation increased soil organic C and CO2 emissions compared to NPK and NIL, consistent with increased rates of mineralisation, nitrification, and increased N retention via DNRA. Under the conditions of the experiment, long-term fertilisation showed no effect on magnitude of N2O and N2 emissions. Denitrification was the main pathway of N2O production across treatments, with its contribution increasing from 65% under NIL and NPK, to >85% under ORG. The main product of denitrification was N2, accounting for 95% of N2O+N2 under NIL and NPK. Organic fertilisation however shifted the N2O:N2 ratio towards N2O, accounting for more than 15% of N2O+N2 emitted. These results show a clear legacy effect of long-term organic fertilisation on N2O production, which may be explained by higher C availability, fuelling microbial activity and O2 consumption, shifting N2O production towards denitrification. Even though not reflected in overall amounts of N2O and N2 emitted, the shift in the N2O:N2 ratio towards N2O under organic fertilisation denotes an increased risk for N2O emissions, likely amplified by increased N supply via nitrification. Our findings demonstrate a clear increase of N substrate supply via mineralisation and nitrification turnover under long-term organic fertilisation and highlight the need to consider potential environmental offsets for alpine grassland management in the form of N2O emissions, driven by denitrification.

How to cite: Friedl, J., Claramonte Manrique, C., Meeran, K., Bohner, A., Kirkby, R., Wieser, S., Gerzabek, M., and Keiblinger, K.: Long-term organic fertilisation shifts N2O production towards denitrification in an alpine grassland soil, EGU General Assembly 2026, Vienna, Austria, 3–8 May 2026, EGU26-11221, https://doi.org/10.5194/egusphere-egu26-11221, 2026.

EGU26-11594 | Orals | BG3.30 | Highlight

Overview of isotope modelling in the context of the Nitrogen cycle 

Benjamin Wolf, Leilee Chojnacki, David Kraus, Andrew Smerald, Kathrin Fuchs, Clemens Weber, Dominika Lewicka-Szczebak, and Ralf Kiese

The nitrogen (N) cycle is a complex interplay of different processes including the mineralization of soil organic matter, uptake of N by plants, microbial N immobilization, and nitrification and denitrification. These key processes result in the formation of various N-containing species, some of which have detrimental environmental effects. Unfortunately, some processes yield the same molecules, for instance nitrous oxide, complicating clear source partitioning. Process-based biogeochemical models are increasingly being used to assess the fate of N species in the environment. However, to reflect the complexity of N cycling, these models often include numerous mathematical descriptions of processes that depend on pool sizes, reaction rate constants, soil temperature, soil moisture or oxygen concentration. It has remained a challenge to determine a sufficient set of these quantities in high temporal resolution or for a given specific measurement site, resulting in a scarcity of easily available validation variables compared to a surplus of modeled quantities.

The fundamental processes of isotopic fractionation and mixing result in the characteristic isotopic compositions of the various N species at natural abundance level. In this context, the natural abundance isotopic compositions can be used to determine relative contributions of different processes to – for instance – nitrous oxide production or as an integrating validation quantity, since the soil 15N enrichment reflects N loss pathways on a time scale of decades. Similarly, labelling studies using fertilizers enriched in 15N have been used to study the allocation of fertilizers to soil and plants or to determine N2 emission. This is a significant, yet poorly understood component of N budgets and is extremely challenging to measure.

Thus, the aforementioned characteristics of the 15N isotopic composition make it a powerful tool for improving our understanding of the N cycle and for testing process-based biogeochemical models. In this presentation, we provide an overview of different model types used in the context of the N cycle, focusing specifically on isotope mixing models and process-based isotope models. We demonstrate how natural abundance 15N and 15N tracing studies can be employed to interpret measurement data, identify model weaknesses, refine models and reduce uncertainty of modeled N2O emissions.

How to cite: Wolf, B., Chojnacki, L., Kraus, D., Smerald, A., Fuchs, K., Weber, C., Lewicka-Szczebak, D., and Kiese, R.: Overview of isotope modelling in the context of the Nitrogen cycle, EGU General Assembly 2026, Vienna, Austria, 3–8 May 2026, EGU26-11594, https://doi.org/10.5194/egusphere-egu26-11594, 2026.

EGU26-11665 | ECS | Orals | BG3.30

mecHONO: a mechanistic model of reactive nitrogen gas emission from drying soils  

Minsu Kim, Stefanie Maier, Luciano Melo Silva, and Bettina Weber

Soil is a major source of reactive nitrogen (N) gases, such as nitric oxide (NO) and nitrous acid (HONO), that influence the atmospheric oxidative capacity by affecting near-surface hydroxyl radical (OH) and ozone (O3) concentrations. Microbial N cycling activities in soil, particularly nitrification and denitrification, are recognised as significant biological sources of these gases, with emissions being especially notable after fertilizer application. Soil water content is the main variable determining the rates of nitrification (aerobic) and denitrification (anaerobic); however, calculations relating these processes to N gas emissions are often based on empirical relations without explicitly accounting for soil physical processes. Here, we introduce a mechanistic model, mecHONO, that integrates soil N transformation processes with soil pore drying dynamics, subject to physical constraints of mass conservation and liquid-gas interfacial transport. The model specifically accounts for evaporative concentration changes that impact pore chemistry, and, consequently, the transformation of microbial N products and their partitioning into NO and HONO. Through its application to controlled experiments, the model elucidates interactions between microbial activity and soil evaporation dynamics. Our results provide insights into effective nitrogen fertilizer application and land management to optimize nutrient utilization while simultaneously minimizing soil-derived NOx and OH emissions.

How to cite: Kim, M., Maier, S., Melo Silva, L., and Weber, B.: mecHONO: a mechanistic model of reactive nitrogen gas emission from drying soils , EGU General Assembly 2026, Vienna, Austria, 3–8 May 2026, EGU26-11665, https://doi.org/10.5194/egusphere-egu26-11665, 2026.

EGU26-12162 | ECS | Posters on site | BG3.30

Establishing denitrification (N2O+N2) budgets – a data driven scaling approach in grains systems 

Naoya Takeda, Taleta Bailey, Robert Kirkby, Lillian O'Hearn, Johannes Friedl, David Rowlings, Graeme Schwenke, Roger Armstrong, Michael Bell, and Peter Grace

Accounting for denitrification losses from agroecosystems remains challenging, particularly due to methodological challenges regarding measurements and upscaling of highly episodic nitrous oxide (N₂O) and dinitrogen (N₂) emissions to seasonal and system levels. Denitrification losses, and thus nitrogen (N) budgets remain therefore poorly constrained across a wide range of agro-ecosystems, hindering targeted development of N loss mitigation strategies. Here we present an innovative data driven upscaling approach using high-frequency N₂O datasets, and the XGBoost model, establishing seasonal N2O and N2O emissions. Emissions of N2O and N2 were measured in-situ using the 15NGF method. The XGBoost model was trained using in-situ N2O and N2 data across eight site-seasons in different grains systems in southeastern Australia, expressing the ratio of N2 to N2O emitted as a function of water-filled pore space, nitrate content and soil temperature. The trained model was then applied to additional 38 site-season-treatment high-frequency N2O datasets to estimate daily N₂ emissions, followed by aggregation to seasonal scales. Emissions N2O over the cropping season accounted for only 3.2% (on median, 2.1–4.1% at quartiles) of denitrification. Seasonal denitrification losses ranged from 2.6 to 66.1 kg N ha⁻¹ and were dominated by N2, exceeding N2O emissions by a factor of ~30 (on median, 23–46 at quartiles). Our approach delivers for the first time denitrification budgets for a range of different grains systems, providing a blueprint to investigate the effects of environmental drivers and management on denitrification. Extending this approach to other soil types and production systems offers the opportunity to derive more generic relationships between drivers and the N2O:N2 ratio as way forward to improve N budgeting for agronomic and environmental benefits.

How to cite: Takeda, N., Bailey, T., Kirkby, R., O'Hearn, L., Friedl, J., Rowlings, D., Schwenke, G., Armstrong, R., Bell, M., and Grace, P.: Establishing denitrification (N2O+N2) budgets – a data driven scaling approach in grains systems, EGU General Assembly 2026, Vienna, Austria, 3–8 May 2026, EGU26-12162, https://doi.org/10.5194/egusphere-egu26-12162, 2026.

EGU26-12996 | ECS | Posters on site | BG3.30

The denitrification in the drainage zone as an important process of the nitrogen cycle 

David Schoner, Neha Begill, Reinhard Well, Caroline Buchen-Tschiskale, and Florian Stange

Denitrification, the degradation of nitrate (NO3-) into nitrous oxide (N2O) or dinitrogen (N2), is an important process of the soil nitrogen cycle. Without denitrification, NO3- is leached through the soil and reaches the groundwater. In the groundwater NO3- lowers the water quality and leads to eutrophication of water bodies. Therefore, denitrification in soil and groundwater is a well-observed topic. But what happens with the denitrification in the unsaturated zone between soil and groundwater? The drainage zone, also known as deep vadose zone, has been widely overlooked until now. But this zone may play an important role in reducing NO3- leaching into the groundwater. Indeed, the frequent lack of available organic carbon as an electron donor and mostly oxic conditions in large parts of the drainage zone typically prevent intense denitrification. But due to the possibly large thickness of the drainage zone and the long travel time of NO3-, it is possible that even low denitrification rates could lead to relevant NO3- attenuation.

In the project DeniDrain, we focus on the denitrification process in the drainage zone. Using the direct push drilling method, we collect undisturbed samples at depths between 2 and 10 meters at representative locations throughout Germany. In the laboratory, we measure the N2O and N2 emissions with the 15N gas flow method to obtain the current denitrification rates. Our initial findings suggest that denitrification happens in certain sections of our investigated profiles, where the amount of degraded NO3- depended on the properties of the drainage zone. Therefore, the denitrification in the drainage zone plays an important role in the nitrogen cycle and should be incorporated in future research about the fate of NO3- leached from soil. To minimize the effort of measuring the denitrification in the drainage zone, the application of models is useful. Therefore, using our data we test the existing soil models DENUZ and BODIUM in their ability to predict denitrification in the drainage zone.

We will show the initial results of our measuring and modelling work.

How to cite: Schoner, D., Begill, N., Well, R., Buchen-Tschiskale, C., and Stange, F.: The denitrification in the drainage zone as an important process of the nitrogen cycle, EGU General Assembly 2026, Vienna, Austria, 3–8 May 2026, EGU26-12996, https://doi.org/10.5194/egusphere-egu26-12996, 2026.

EGU26-16721 | ECS | Posters on site | BG3.30

Constraining uncertainty of modelled N2O emissions using isotopic composition 

Leilee Chojnacki, Clemens Weber, Benjamin Wolf, David Kraus, Edwin Haas, Andrew Smerald, Joachim Mohn, Clemens Scheer, and Ralf Kiese

Process-based models provide an avenue to assess greenhouse gas emissions on scales where measurements alone are impractical. However, outcomes obtained from models are also subject to sources of error, which include model parameter uncertainty, model input uncertainty and model bias. For process-based models, the high-dimensional parameter spaces lead to large uncertainty contributions arising from model parameterization. Here, we show how time series measurements of 15N intramolecular N2O isotopic composition, i.e., site preference (SP), can be used to constrain parameter uncertainty in the process-based biogeochemical model LandscapeDNDC in connection with the Stable Isotope MOdel for Nutrient cyclEs  (SIMONE). We develop a multivariable calibration framework that incorporates isotope tracing simulations from SIMONE into the calibration of LandscapeDNDC parameters, based on measurements of both N2O and SP simultaneously. We perform site-scale calibrations using the SP and N2O flux measurements from Swiss grassland at Chamau, and use a Sampling Importance Resampling scheme to estimate model parameter uncertainties, both with and without using SP as a calibration variable. Our results show that including SP into a calibration-uncertainty estimation framework for N2O emissions significantly reduces model parameter uncertainty.

How to cite: Chojnacki, L., Weber, C., Wolf, B., Kraus, D., Haas, E., Smerald, A., Mohn, J., Scheer, C., and Kiese, R.: Constraining uncertainty of modelled N2O emissions using isotopic composition, EGU General Assembly 2026, Vienna, Austria, 3–8 May 2026, EGU26-16721, https://doi.org/10.5194/egusphere-egu26-16721, 2026.

EGU26-16932 | ECS | Posters on site | BG3.30

Phosphorus additions promote soil nitrogen runoff in a tropical forest 

Huijun Ye, Xianzhen Luo, Zhaofeng Chang, Zhimin Li, Conghui Guo, Enqing Hou, and Roland Bol

Abstract: Human activities have dramatically increased the deposition of reactive nitrogen (N) globally, leading to enhanced N losses from terrestrial ecosystems through hydrological pathway. This loss of reactive N from soils is controlled by complex transformation and transport processes, which are influenced by a suite of factors, including soil water conditions, vegetation types, soil microorganisms, and soil physicochemical properties. A crucial, yet often overlooked, factor is the availability of phosphorus (P). P is a limiting nutrient for soil microbial activity and vegetation productivity in many regions worldwide, especially in tropical ecosystems. Here we established a P addition experiment (+0, +25, +50, +100 kg P ha−1 yr−1) in an evergreen broadleaf mixed plantation. We found that cumulative dissolved total N (DTN) exhibited a concave-shaped nonlinear response to P addition. During the wet season (July 20 to September 18, 2023), a sharp cumulative increase in the mean values of DTN runoff was observed under P additions. In contrast, the cumulative DTN flux from runoff showed minimal increase during the dry season. Furthermore, the enhanced DTN runoff under P additions were linked to the elevated inorganic N assimilatory reduction genes and SWC, and seasonal precipitation. These findings offer insights into the hydrological loss of N under different P supply conditions in tropical forests, with direct implications for projecting and managing nutrients in tropical forests in the context of global change.
Acknowledgements: This work was supported by the National Natural Science Foundation of China (32301443), the Guangdong Basic and Applied Basic Research Foundation (2022A1515110926, 2023A1515010957 and 2022B1515020014, and NSFC Sino-German Mobility Program (No. M-0749).

How to cite: Ye, H., Luo, X., Chang, Z., Li, Z., Guo, C., Hou, E., and Bol, R.: Phosphorus additions promote soil nitrogen runoff in a tropical forest, EGU General Assembly 2026, Vienna, Austria, 3–8 May 2026, EGU26-16932, https://doi.org/10.5194/egusphere-egu26-16932, 2026.

EGU26-17366 | Orals | BG3.30

Linking organic carbon inputs to microbial nitrogen mineralization-immobilization turnover and nitrous oxide dynamics using 15N tracer techniques 

Barira Shoukat Hafiza, Sobia Bibi, Wolfgang Wanek, Mariana Vezzone, Christian Resch, Maria Heiling, Reinhard Pucher, Magdeline Vlasimsky, and Gerd Dercon

Soil carbon (C) and nitrogen (N) cycles are closely coupled, with the nature of organic C input to soils, from crop residues to recalcitrant biochar, strongly influencing microbial N mineralization-immobilization turnover (MIT) and associated N2O/N2 emissions. However, the extent to which different organic C inputs regulate MIT and thereby control soil N retention and greenhouse gas emissions in agricultural systems remains poorly understood. An incubation experiment using field soils from a long-term fertilization trial (NPK application since 1954, with or without biochar since 2022) on a loess-derived Cambisol soil from Northern Austria (Grabenegg) was carried out to evaluate the short-term effects of maize-derived crop residues and biochar amendment on MIT. 15N-labeled fertilizers (15NH4NO3, NH415NO3; 150 kg N/ha) were applied to quantify gross N mineralization and immobilization, gross nitrification and NO3 immobilization, fertilizer N retention, and N2O and N2 emissions. Microbial biomass N (MBN), mineral N pools (15NH4+, 15NO3), and gaseous N fluxes (15N2O and 15N2) were measured using established 15N isotope tracing and mass spectrometric techniques, allowing to track crop residue and biochar amendment effects on the partitioning of N transformation pathways and N2O reduction to N2.

Preliminary results revealed amendment-specific effects. After one week of incubation, laboratory amendment with crop residues increased NH4+ availability by 26% (2.50 ± 0.47 mg N kg−1) in soil with long-term biochar, but slightly decreased it by 8% (3.14 ± 0.69 mg N kg−1) in soil without long-term biochar treatment, relative to unamended controls (2.00 ± 0.79 mg N kg−1; 3.42 ± 0.82 mg N kg−1). In contrast, lab amended biochar strongly decreased NH4+ availability (~99%) in both field soils (0.03 ± 0.01 mg N kg−1; 0.04 ± 0.04 mg N kg−1), indicating a consistent response across soils regardless of field biochar application. Gross N mineralization, derived using 15N isotopic techniques with 15NH4NO3, was strongly stimulated by crop residues during first week, increasing rates by 172% and 290% relative to controls in soils with and without long-term biochar treatment, respectively, whereas lab amended biochar caused moderate increases of 59% and 39%. Compared to biochar, crop residues enhanced gross N mineralization 1.7-fold and 2.8-fold in soils with and without long-term biochar treatment, highlighting the stronger stimulation of N mineralization by labile C inputs. These findings show highly amendment-specific responses of MIT, differentially affecting soil N retention, and the mitigation of agricultural greenhouse gas emissions.

Keywords: nitrogen cycling, mineralization-immobilization turnover, organic amendments, biochar, crop residue, N2O emissions, N2 emissions, 15N tracer, climate-smart agriculture

How to cite: Hafiza, B. S., Bibi, S., Wanek, W., Vezzone, M., Resch, C., Heiling, M., Pucher, R., Vlasimsky, M., and Dercon, G.: Linking organic carbon inputs to microbial nitrogen mineralization-immobilization turnover and nitrous oxide dynamics using 15N tracer techniques, EGU General Assembly 2026, Vienna, Austria, 3–8 May 2026, EGU26-17366, https://doi.org/10.5194/egusphere-egu26-17366, 2026.

EGU26-17816 | Posters on site | BG3.30

Using 15N tracer experiments and the stable isotope model SIMONE to test and refine nitrogen cycling processes in the biogeochemical model LandscapeDNDC 

Kathrin Fuchs, Clemens Scheer, David Kraus, Andrew Smerald, Ralf Kiese, and Benjamin Wolf

Understanding soil nitrogen (N) cycling is essential for predicting nutrient availability and losses in agricultural systems. Although microbial processes such as mineralization and immobilization control the internal N supply to plants, these sub-processes remain poorly constrained in biogeochemical models. This limits our ability to accurately simulate N flows and environmental N losses in agricultural systems.

In this study, we combined data from a 15N tracer experiment with the biogeochemical model LandscapeDNDC and the isotope model SIMONE to test and refine N cycling processes. Initial model–data comparisons revealed a consistent bias: LandscapeDNDC overestimated the uptake of fertilizer N by plants while underestimating the recovery of 15N in soils and N losses. These discrepancies indicated insufficient mineralization of soil organic nitrogen (SON) and an imbalance in the mineralization–immobilization sub-cycle that regulates the internal nitrogen supply.

To address these issues, we reparametrized key soil process rates in LandscapeDNDC using constraints from the 15N data. Specifically, we increased mineralization rates and adjusted immobilization parameters to improve the partitioning between fertilizer-derived N and mineralized SON in plant uptake. The recalibrated model improved the simulations of observed seasonal dynamics of 15N in plant and soil pools, and N loss estimates.

Our results demonstrate that integrating ¹⁵N tracer data with isotope modeling provides a powerful approach for constraining microbial N processes in biogeochemical models. Improving the representation of mineralization–immobilization dynamics resulted in more realistic estimates of the internal N supply, thereby enhancing confidence in modelled fertilizer use efficiency and environmental losses, and improving the prediction of nitrogen dynamics in agricultural ecosystems under future climate and land use change scenarios.

How to cite: Fuchs, K., Scheer, C., Kraus, D., Smerald, A., Kiese, R., and Wolf, B.: Using 15N tracer experiments and the stable isotope model SIMONE to test and refine nitrogen cycling processes in the biogeochemical model LandscapeDNDC, EGU General Assembly 2026, Vienna, Austria, 3–8 May 2026, EGU26-17816, https://doi.org/10.5194/egusphere-egu26-17816, 2026.

EGU26-19327 | ECS | Orals | BG3.30

Combining automated field gas sampling with 15N gas flux method: lessons from 8 site-seasons of measuring denitrification in Australian grains cropping 

Taleta Bailey, Naoya Takeda, Robert Kirkby, Johannes Friedl, Lillian Hearn, Graeme Schwenke, Michael Bell, Roger Armstrong, David Rowlings, and Peter Grace

Measuring denitrification losses including both N2O and N2 emitted from soil remains one of the biggest challenges in closing nitrogen (N) budgets in cropping systems. Despite being considered a major N loss pathway, direct field measurements of N2 emissions are lacking. The 15N gas flux (15NGF) method is one of the few approaches to measuring in situ N2 fluxes, yet its application remains limited due to technical complexity and the need to meet key assumptions, all of which become more challenging under field conditions. Furthermore, infrequent sampling schedules may miss peak emission events, particularly when field access is limited after heavy rainfall. Here we present findings from applying the 15NGF method in 8 field campaigns over 2 seasons at 4 sites in Australian grains cropping systems.

The field experiments covered summer and winter cropping systems under varying N fertiliser and irrigation treatments in subtropical to temperate climates, giving a range of environmental and management conditions. Gas samples were collected into evacuate vials using automated chamber systems consisting of 8 electronically actuated chambers connected to a control box containing a gas sampling manifold and injection actuator. Gas samples were analysed for N2O by gas chromatography and for 15N2O and 15N2 by isotope ratio mass spectrometry (IRMS).

The method of calculating N2 flux by Spott et al. 2006 based on R29 and using the denitrifying pool enrichment estimated from N2O (ad) gave the greatest number of valid fluxes with >600 measurements passing quality control. The method detection limit (MDL) averaged 33 g N2-N ha-1 d-1 across all sites and seasons, but varied from 6.3 to 290 g N2-N ha-1 d-1 with IRMS precision and as ad declined after fertiliser application. Average N2 fluxes ranged from <30 to 3300 g N2-N ha-1 d-1, although many fluxes were lower, not exceeding 400 g N2-N ha-1 d-1 in multiple seasons. Most N2 flux measurements occurred within 100 days after applying fertiliser, however in some seasons split fertiliser applications lengthened the measurement period.

Experiences from the sampling campaigns highlighted the challenges of applying the 15N gas flux method across diverse systems and environments. Nonetheless, the aggregated data set represents a significant contribution to in situ denitrification measurements, supporting both direct quantification of seasonal gaseous N losses, and incorporation into modelling approaches for estimating denitrification at wider scales.

How to cite: Bailey, T., Takeda, N., Kirkby, R., Friedl, J., Hearn, L., Schwenke, G., Bell, M., Armstrong, R., Rowlings, D., and Grace, P.: Combining automated field gas sampling with 15N gas flux method: lessons from 8 site-seasons of measuring denitrification in Australian grains cropping, EGU General Assembly 2026, Vienna, Austria, 3–8 May 2026, EGU26-19327, https://doi.org/10.5194/egusphere-egu26-19327, 2026.

EGU26-20191 | ECS | Posters on site | BG3.30

Mechanistic insights into in situ N₂O fluxes in a German crop rotation integrating chamber measurements, isotopocule signatures, and functional nitrogen cycling genes  

Paulina Englert, Caroline Buchen-Tschiskale, Lukas Beule, Antonios Apostolakis, Stefan Siebert, Reinhard Well, and Ana Meijide

Nitrous oxide (N2O) is one of the most relevant anthropogenic greenhouse gases, mainly produced in agricultural soils. Understanding the mechanisms responsible for N2O production and consumption is crucial for developing N2O mitigation strategies in croplands but field studies combining N2O flux measurements with isotopocule signatures and metagenomic analysis are very rare.

With the aim to clarify how isotopic signatures and functional genes can help explaining N2O fluxes in a cropland, we conducted a two years study, from February 2023 to January 2025, at the Reinshof experimental farm of the University of Göttingen in Germany (51.49° N, 9.93° E). The crop sequence was sugar beet, winter wheat and winter barley.

We measured N2O fluxes with eight manually-operated static chambers and gas chromatography and additionally collected samples for analysis of N2O isotopocule signatures. We applied FRAME, a three-dimensional model based on 15N site preference, bulk 15N and 18O isotopic signatures to distinguish between the source processes (bacterial denitrification, nitrifier denitrification, fungal denitrification, nitrification) and to estimate the reduction of N2O to N2.

We regularly monitored soil water content, mineral nitrogen (Nmin) and dissolved organic carbon (DOC). Additionally, every four months we collected soil samples for real-time quantitative polymerase chain reaction (qPCR)-based quantification of bacterial and fungal DNA, as well as functional genes involved in nitrification (ammonia-oxidizing archaea and bacteria amoA genes) and denitrification (nirK, nirS, and nosZ clade I and II).

We observed mean N2O fluxes of 19.8 µg N2O-N m-2 h-1. Individual chamber measurements ranged from -26.7 to 573.1 µg N2O-N m-2 h-1. The spatial variability between chambers within one day showed a high coefficient of variation of 123%. N2O fluxes increased after fertilization, rewetting and harvest while highest fluxes occurred after a freeze-thawing event. Cumulative fluxes showed that 0.97% of applied fertilizer N was emitted as N2O-N. We observed a significant positive effect of soil moisture on N2O fluxes, no significant effect of Nmin and a significant negative effect of DOC.

Preliminary results showed that bacterial denitrification was the dominant process responsible for N2O production. As N2O fluxes increased, the proportion of bacterial denitrification increased while the proportion of nitrification decreased. Following freeze-thawing, there was more bacterial denitrification than after the fertilization events and very little fungal denitrification. Overall, the residual N2O fraction of 45.9 ± 15.0% suggested extensive nitrogen loss as N2 via denitrification. The dominance of nosZ over nirK and nirS further implied substantial conversion of nitrogen to N₂.

In addition, bacterial DNA was more abundant than fungal DNA, and denitrifiers were more abundant than nitrifiers. No clear differences in processes or gene copy numbers were observed between chambers. Seasonally, gene copy numbers of most functional genes were higher during the growing season and lower in winter, consistent with higher N₂O fluxes during the growing season and lower fluxes in winter.

In future analysis, we will show how soil characteristics, isotopic signatures, and functional genes jointly shape the spatial and temporal variation of the measured N2O fluxes.

How to cite: Englert, P., Buchen-Tschiskale, C., Beule, L., Apostolakis, A., Siebert, S., Well, R., and Meijide, A.: Mechanistic insights into in situ N₂O fluxes in a German crop rotation integrating chamber measurements, isotopocule signatures, and functional nitrogen cycling genes , EGU General Assembly 2026, Vienna, Austria, 3–8 May 2026, EGU26-20191, https://doi.org/10.5194/egusphere-egu26-20191, 2026.

EGU26-22998 | Posters on site | BG3.30

Mitigating denitrification N-losses with optimized liquid organic fertilizer application strategies 

Jaqueline Stenfert Kroese, Caroline Buchen-Tschiskale, Johannes Cordes, Rene Dechow, Klaus Dittert, Bryan Dix, Kathrin Fuchs, Andreas Gattinger, Balazs Grosz, Michael Hauschild, Mahboube Jarrah, Johannes Kühne, Henrike Mielenz, Thade Potthoff, Clemens Scheer, Franz Schulz, Conor Simpson, Benjamin Wolf, and Reinhard Well

Denitrification is the main pathway of nitrogen loss from soils, releasing nitrous oxide (N2O) and dinitrogen (N2). These emissions reduce nitrogen availability for crops and N2O also contributes to climate change. Nitrogen-based fertilizers drive soil nitrogen transformations – including denitrification. The magnitude of resulting emissions varies with management practices, climate and soil properties. Transitioning toward climate-smart agriculture requires understanding the interconnected nature of N-losses and possible trade-offs associated with mitigation strategies. For instance, suppressing N2O emissions through nitrification inhibitors might increase ammonia volatilization (Zhang et al. 2022). Quantifying soil-emitted N2 at the field-scale remains a significant challenge, and consequently, this component is often absent from evaluations of management practices. As a result, agricultural practices that improve nitrogen use efficiency while reducing denitrification losses have yet to be clearly identified.

The overall objective of the joint project MinDen is to assess mitigation measures aimed at reducing both direct and indirect denitrification emissions while enhancing nitrogen use efficiency. To this end, a three-year field experiment was conducted across three sites in Germany, representing a gradient from heavy clayey soils with higher emissions to lighter, sandy soil with lower emissions.

Four liquid-organic fertilizer application techniques - drag hose with incorporation, slit injection, slit injection with nitrification inhibitor, and drag hose with acidified slurry - were tested alongside two mineral-fertilizer treatments (a standard rate according to crop demand and a 20% reduced rate). At one site, an additional comparison was made between organically- and conventionally-managed fields. Ammonia (NH3), N2O and N2 fluxes were determined using passive samplers, static chambers and the 15N gas flux method. Here, we present the temporal dynamics of NH3, N2O and N2 emissions from the first two years at all three sites. Ultimately, these data sets are being used to validate biogeochemical models to regionalize N-losses from agricultural soils across Germany.


Zhang, C., Song, X., Zhang, Y., Wang, D., Rees, R. M., & Ju, X. (2022). Using nitrification inhibitors and deep placement to tackle the trade-offs between NH₃ and N₂O emissions in global croplands. Global Change Biology, 28(14), 4409–4422. https://doi.org/10.1111/gcb.16198

How to cite: Stenfert Kroese, J., Buchen-Tschiskale, C., Cordes, J., Dechow, R., Dittert, K., Dix, B., Fuchs, K., Gattinger, A., Grosz, B., Hauschild, M., Jarrah, M., Kühne, J., Mielenz, H., Potthoff, T., Scheer, C., Schulz, F., Simpson, C., Wolf, B., and Well, R.: Mitigating denitrification N-losses with optimized liquid organic fertilizer application strategies, EGU General Assembly 2026, Vienna, Austria, 3–8 May 2026, EGU26-22998, https://doi.org/10.5194/egusphere-egu26-22998, 2026.

EGU26-1300 | ECS | Orals | SSS4.1

Biochar Modulates Leucine Aminopeptidase Hotspots and Kinetics under Salinity Stress in the Wheat Rhizosphere 

Tahereh Hozhabri, Akram Halajnia, Amir Lakzian, and Seyed Sajjad Hosseini

Salinity stress is a major factor limiting microbial activity in soils, as it can impair enzymatic processes by destroying microbial cells and disrupting root exudation. In contrast, biochar, through the improvement of soil physicochemical properties, may stimulate microbial growth and functionality. However, the response of soil enzymes to the simultaneous presence of biochar and salinity stress has been scarcely investigated. In the present study, we assessed the effects of two salinity levels (0 and 150 mM NaCl) under two biochar treatments (0 and 2%) on spatial distribution and kinetic parameters of leucine aminopeptidase (LAP) activity in the rhizosphere of wheat by combining zymography with enzyme kinetics.

In the presence and absence of biochar, salinity reduced the hotspots of LAP activity by 15.8% and 15.7% compared to the respective control, respectively. In contrast, at both biochar levels, salinity increased the rhizosphere extent of LAP compared to the respective control. Biochar nearly doubled hotspots of LAP activity compared to its absence, yet it simultaneously reduced the rhizosphere extent of LAP at both salinity levels. Generally, the highest LAP activity hotspots and the lowest rhizosphere extent of LAP were observed in the of 2% biochar treatment under non-saline condition. The analysis of enzyme kinetics (Vmax, Km) in the hotspots showed salinity caused an increase in enzyme affinity for substrate (Km decreased by 37.9% to 97.2%) at both levels of biochar. In contrast, biochar decreased enzyme affinity for the substrate (as indicated by a 1.1- to 2.2-fold increase in Km) under both salinity levels. Biochar increased potential enzymatic activity (Vmax) in the hotspots, reaching 1.9 times higher than without biochar. Conversely, under salinity conditions, this activity decreased relative to optimal conditions at both biochar levels. Overall, the 2% biochar treatment under non-saline condition showed the highest Vmax and Km, whereas the non-biochar treatment under saline condition indicated the lowest.

These patterns collectively indicate that salinity and biochar exert contrasting controls on rhizosphere enzymatic functioning by modifying both microbial physiology and microhabitat conditions. Salinity imposes physiological stress and reduces root-derived substrates, driving microbial communities toward more dispersed activity and the production of high-affinity enzymes optimized for resource scarcity. In contrast, biochar enhances microhabitat quality, stimulating microbial activity and catalytic capacity despite reducing enzyme affinity, likely due to changes in community composition or enzyme–biochar interactions. Overall, biochar strengthens rhizosphere functioning but cannot fully offset the inhibitory effects of salinity on microbial metabolism and enzymatic efficiency.

How to cite: Hozhabri, T., Halajnia, A., Lakzian, A., and Hosseini, S. S.: Biochar Modulates Leucine Aminopeptidase Hotspots and Kinetics under Salinity Stress in the Wheat Rhizosphere, EGU General Assembly 2026, Vienna, Austria, 3–8 May 2026, EGU26-1300, https://doi.org/10.5194/egusphere-egu26-1300, 2026.

Root exudates are key drivers of microbial activity and carbon cycling in the rhizosphere, but their transient and localised nature makes microbial responses hard to measure. We used reverse microdialysis to deliver glucose as a root exudate analogue and trace microbial synthesis and carbon allocation.  Deuterated water (D₂O) quantified baseline rates of synthesis in unamended soil, while 13C-glucose traced microbial synthesis fuelled by C from localised glucose input.  Over 72 hours, we quantified incorporation of 2H and 13C into metabolites, membrane lipids, and storage compounds. Glucose perfusion significantly increased microbial respiration and synthesis rates, particularly for polyhydroxybutyrate (PHB) and triacylglycerols (TG), indicating strong stimulation of intracellular carbon storage. The rapid incorporation of 2H and 13C into diacylglycerols (DGs), coupled with slow turnover, suggests DGs may function in intracellular carbon storage or as membrane lipids rather than solely as transient metabolic intermediates.  Glucose perfusion also increased membrane lipid synthesis, with differences in 13C incorporation among membrane lipids indicating differential growth among microbial groups.  In contrast to larger increases in synthesis of intracellular C storage and membrane lipids, synthesis and turnover of compatible solutes such as trehalose and mannitol were largely unaffected by glucose perfusion, implying their roles are independent of carbon supply and tied to metabolic regulation in well-watered soil. Our results highlight the utility of reverse microdialysis and dual isotope labelling for disentangling effects of root exudates on microbial metabolism. This approach provides new insights into how localized carbon inputs shape microbial function and community dynamics, and emphasises intracellular carbon storage as a key microbial response for coping with transient resource availability in the rhizosphere.

How to cite: Warren, C.: Reverse Microdialysis and Isotope Labelling Reveal Microbial Strategies for Carbon Storage in the Rhizosphere, EGU General Assembly 2026, Vienna, Austria, 3–8 May 2026, EGU26-2294, https://doi.org/10.5194/egusphere-egu26-2294, 2026.

EGU26-2809 | ECS | Orals | SSS4.1

Temporally resolved microbial community dynamics reveal the parallel proliferation of copiotrophic bacteria, fungi and protists after labile substrate addition irrespective of nitrogen availability 

Martin-Georg Endress, Longfei Kang, Nourhan El Kouche, Kenneth Dumack, Sergey Blagodatsky, and Michael Bonkowski

Microbial metabolism represents the major pathway for both the formation and the decomposition of soil organic matter, as carbon (C) consumed by microbes is either respired during catabolism and leaves the soil system as CO2 or is incorporated into new biomass compounds during anabolism and eventually becomes stabilized as microbial necromass. The partitioning of C between these two metabolic branches, also known as the microbial carbon use efficiency (CUE), depends on the complex interplay of many factors such as the quality of the carbon substrate and the availability of nutrients such as nitrogen (N) and phosphorus (P).

In this contribution, we combined measurements of soil respiration, DNA and RNA content with highly temporally resolved metatranscriptomics and dynamic modeling to study microbial activity and community changes in an arable soil after batch input of glucose as a labile C source and further factorial addition of N and P sources in mineral form. While the respiration results indicated a strong N limitation in the studied soil, we observed similar short-term changes in the bacterial, fungal and protist communities regardless of nutrient addition, with an expansion of copiotrophic taxa in all three groups. Notably, while the resulting communities were comparable after two days, these shifts occurred at a faster rate in treatments that received additional N. These observations suggest that glucose stimulated the growth of the same species in the soil under both nutrient-rich and nutrient-poor conditions, with N availability modulating the kinetics and the efficiency of copiotroph growth instead of stimulating a distinct group of specialists adapted to nutrient limitation. This interpretation is also supported by the observed ratio of RNA to DNA as a metric of microbial activity status as well as by a simple dynamic model of microbial growth, both of which reveal a faster activation and more efficient growth in nutrient-rich treatments.

Overall, our findings demonstrate that the input of a labile C source determines a relatively small subset of actively growing copiotrophs in the bacterial, fungal and protist communities, whereas the stoichiometric availability of other nutrients such as N only controls the rate and efficiency with which
these species are able to grow.


How to cite: Endress, M.-G., Kang, L., El Kouche, N., Dumack, K., Blagodatsky, S., and Bonkowski, M.: Temporally resolved microbial community dynamics reveal the parallel proliferation of copiotrophic bacteria, fungi and protists after labile substrate addition irrespective of nitrogen availability, EGU General Assembly 2026, Vienna, Austria, 3–8 May 2026, EGU26-2809, https://doi.org/10.5194/egusphere-egu26-2809, 2026.

EGU26-4089 | Orals | SSS4.1

Microbial growth rate is a stronger predictor of soil organic carbon than carbon use efficiency 

Xianjin He, Gaëlle Marmasse, Junxi Hu, Rebecca M. Varney, Stefano Manzoni, Philippe Ciais, Ying-Ping Wang, Yongxing Cui, Edith Bai, Rose Z. Abramoff, Elsa Abs, Erik Schmidt, Haicheng Zhang, and Daniel S. Goll

The extent to which microbial processes control soil organic carbon (SOC) dynamics remains uncertain. Carbon use efficiency (CUE)—the fraction of assimilated carbon allocated to growth—has been used as a key parameter, but its relationship with SOC reflects carbon partitioning rather than the absolute magnitude of microbial fluxes. Microbial growth rate could provide a more mechanistic link to SOC accumulation, as it quantifies biomass production and reflects necromass formation. Here we combine a global ¹⁸O–H2O dataset (n = 268 paired observations) with outputs from four land surface models to test whether growth rate predicts SOC more strongly than CUE. In the incubation experiments, growth rates are more closely associated with SOC than CUE, although soil properties and climate explain equal or greater variance. Models reproduce the stronger role of growth rate over CUE but tend to underestimate the abiotic controls. The models also emphasize CUE as the main predictor of the SOC/NPP ratio, in contrast to observations, which indicates the soil’s capacity to retain plant carbon inputs. Together, these findings identify microbial growth rate as a diagnostic that can help bridge models with empirical data and guide a more balanced representation of microbial and mineral controls in SOC projections.

How to cite: He, X., Marmasse, G., Hu, J., Varney, R. M., Manzoni, S., Ciais, P., Wang, Y.-P., Cui, Y., Bai, E., Abramoff, R. Z., Abs, E., Schmidt, E., Zhang, H., and Goll, D. S.: Microbial growth rate is a stronger predictor of soil organic carbon than carbon use efficiency, EGU General Assembly 2026, Vienna, Austria, 3–8 May 2026, EGU26-4089, https://doi.org/10.5194/egusphere-egu26-4089, 2026.

The adoption of biodegradable plastics, such as poly (butylene adipate-co-terephthalate) (PBAT), in agriculture is promoted as a sustainable alternative to conventional polyethylene (PE) mulching. However, concerns persist regarding their incomplete degradation into microplastics (MPs) and their long-term impact on soil ecosystems. Based on a multi-year field experiment initiated in 1998 with a completely randomized design comparing three treatments: no mulching (NoMul), continuous PE mulching (PolyMul), and a transition from 15 years of PE to 11 years of biodegradable film (PBAT) mulching (BioMul). We evaluated the effects of mulch transition on soil carbon dynamics, microbial communities, and MPs accumulation.

Results show that soils under BioMul accumulated a higher load of MPs than those under PolyMul, with the presence of finer particles and unique polymer intermediates indicating ongoing degradation. Despite MPs accumulation, BioMul increased total soil organic carbon (SOC) and the mineral-associated organic carbon (MAOC) fraction throughout the soil profile (0–100 cm). In surface soil (0–30 cm), SOC under BioMul was 4.0–13.0% higher than under PolyMul or NoMul. This carbon accrual was accompanied by an increase in avtive carbon pools, with dissolved organic carbon (DOC) and microbial biomass carbon (MBC) showing higher concentrations under BioMul in 0–30 cm and 60–100 cm depths. Microbial alpha diversity was decreased, while community composition shifted toward a more functionally integrated structure, characterized by the enrichment of bacterial phyla such as Proteobacteria and Bacteroidetes, and increased fungal (Ascomycota) participation. Co-occurrence network analysis further revealed that BioMul formed a more connected and robust microbial network with stronger bacterial-fungal associations, indicating improved functional synergy within the soil microbiome.

Our findings demonstrate that long-term biodegradable film mulching can increase both stable carbon pools, while fostering a cooperative and functionally integrated microbial community, despite the accumulation of MPs. This study provides field evidence that PBAT mulch supports key aspects of soil ecological function and highlights the importance of management practices in realizing the environmental benefits of biodegradable plastics in agriculture.

How to cite: Jiang, R. and Wang, K.: Biodegradable Film Mulching Increases Soil Carbon Sequestration and Microbial Network Complexity in a Long-Term Field Study, EGU General Assembly 2026, Vienna, Austria, 3–8 May 2026, EGU26-4455, https://doi.org/10.5194/egusphere-egu26-4455, 2026.

Microbial life in soils is highly heterogeneous in space and time, as the intensity of microbial activities and processes depends strongly on the availability of nutrients and water, as well as a wide range of environmental factors. Identifying these hotspots requires high-resolution approaches, which can be achieved using advanced soil imaging techniques. In parallel, molecular methods provide powerful tools to characterize the microbial community structure and functional potential within these regions.

In this talk, I will present the opportunities and challenges associated with soil zymography for detecting microbial hotspots by mapping the activity of enzymes directly in soil over time and space. Additionally, I will demonstrate how molecular techniques, such as DNA sequencing, can be employed to identify the dominant microbial species inhabiting particular hotspots and determine which microorganisms are active and what functions they perform. Finally, I will discuss how co-localizing different imaging approaches combined with molecular methods can help to distinguish between microbial strategies for acquiring nutrients, offering new insights into how soil microbes drive key ecosystem processes.

How to cite: Bilyera, N.: Seeing the Invisible: Opportunities and Challenges in Studying Microbial Life in Hotspots, EGU General Assembly 2026, Vienna, Austria, 3–8 May 2026, EGU26-5080, https://doi.org/10.5194/egusphere-egu26-5080, 2026.

EGU26-7494 | ECS | Posters on site | SSS4.1

Different methods, different growth rates: disentangling in situ microbial growth quantification 

Yujia Luo, Judith Prommer, Lisa Stein, and Andreas Richter

Microbial growth drives carbon mineralization, nutrient turnover, and nearly all biogeochemical cycling. Accurately quantifying (in-situ) microbial growth rates is therefore fundamental for linking microbial activity to soil processes and ecosystem functioning, not only in soils but across ecosystems. Numerous methods have been developed for this purpose. Microbial growth varies across soil properties (e.g., soil type, substrate quantity and quality, pH) and microbial life-history strategies (e.g. oligotrophic vs. copiotrophic lifestyles). At the same time, methodological differences, whether or not they depend on soil and microbial characteristics, make it difficult to compare microbial growth rate across studies, with community-level estimates frequently spanning several orders of magnitude.

Here, we aim to benchmark commonly used microbial growth measurements in soil to enable meaningful comparison of in situ microbial growth rates and ultimately improve our understanding of microbial contributions to soil carbon and nutrient dynamics. We conducted a systematic comparison of four widely applied growth methods across contrasting soils and depths. These included two substrate-free stable isotope probing (SIP) approaches: ¹⁸O–DNA-SIP (incorporation of labelled water into DNA) and 2H–FAME-SIP (incorporation of labelled water into phospholipid fatty acids), as well as two radioactive isotope approaches using labeled organic substrates: the ¹⁴C-leucine method (incorporation of labelled leucine into protein) and ³H-thymidine method (incorporation of thymidine into DNA). Soils were collected from four forest sites around Vienna, spanning sandy to clay-rich textures, at two depths. Incubation experiments were initiated under identical conditions with sieved soil in the lab.

Across all four methods, consistent patterns were observed: topsoils exhibited higher microbial growth rates and respiration than subsoils, with higher moisture and organic matter availability. Despite these shared trends, substantial methodological divergence was observed in estimated specific growth rates within the same soils. This divergence is expected, as the four methods target distinct cellular processes and macromolecular pools (DNA, protein, lipids). Comparability among methods implicitly assumes balanced growth, where all cellular components are synthesized at a given rate, that doesn’t change with external conditions. In natural environments, however, microorganisms frequently experience unbalanced growth, where cell division and synthesis of storage compounds or other metabolic processes become decoupled from each other. In addition, radiotracer approaches rely on extraction of microbes from soil and use of carbon-substrates that may not be taken up at the same rate by all microbial taxa, whereas SIP methods are applied directly to intact soils without substrate addition, introducing further variability in growth estimates. Consequently, carbon use efficiencies (CUE), derived by the four methods, were significantly different.

In summary, our study provides the first controlled comparison of four widely used methods to measure in situ soil microbial growth. Our results demonstrate how methodological choices shape apparent microbial growth rate estimates and identify systematic sources of variation among approaches. By deriving empirically based conversion factors between methods, our work facilitates cross-study comparisons and synthesis, ultimately advancing our understanding of microbial growth and its role in soil ecosystem functioning.

How to cite: Luo, Y., Prommer, J., Stein, L., and Richter, A.: Different methods, different growth rates: disentangling in situ microbial growth quantification, EGU General Assembly 2026, Vienna, Austria, 3–8 May 2026, EGU26-7494, https://doi.org/10.5194/egusphere-egu26-7494, 2026.

EGU26-8161 | ECS | Orals | SSS4.1

Constrained hybrid modelling to predict microbial dynamics and organic matter turnover in soil systems 

Paul Collart, Jürgen Gall, Andrea Schnepf, Lars Doorenbos, and Holger Pagel

Soil microorganisms control organic matter cycling and, to a large extent, determine how soil systems can cope with and mitigate climate change and environmental threats. Integrating them explicitly into process-based soil models is critical for predicting how soil carbon (C) flows and stocks change in ecosystems with time. Models are critical tools for integrating datasets with theory. However, integrating information from modern omics-based datasets is a challenge due to the nonlinear relationship between genomes and the actual function microbes express in their local environment. Functional traits can be defined and inferred from these genomic datasets to better leverage their information and better understand the complexity of the soil microbiome. Integrating trait information with process-based microbially explicit models provides an opportunity leverage genomic data for an improved soil carbon prediction.

We present a hybrid modeling framework that uses a data-driven neural network approach to derive microbial parameters of process-based models from metagenome inferred functional traits, leveraging information from metagenomic and DNA sequencing datasets. We combine a neural network (multi-layer perceptron) with a process-based soil model to set up a hybrid model. The neural network uses genomic trait data as the input and predicts biokinetic parameters of the process-based model. We trained the hybrid model with synthetic genomic trait datasets of varying complexity and time series of state variables of the process-based model (e.g. carbon dioxide production) to demonstrate the approach. Using trait inference from genomes, the model can learn several biokinetic parameters such as growth rates, dormancy rates, affinities to organic matter, growth yields or decay rates. The training uses a complex constraint-based loss function, informing the model from ecological theory and literature data, ensuring the realistic behavior of every non observed state variable during training such as active and dormant microbial pools. Compared to a ‘naïve’ hybrid model, the use of a more complex loss function reduces model equifinality and ensure realistic behavior of the non-observed state variables. Naïve loss function cannot efficiently learn the behavior of non-observed state variables and fail to predict realistic microbial dynamics. We present i) the concept of the hybrid soil modelling framework, ii) the constraint-based loss function approach, iii) the performance of constrained versus naïve hybrid models after training with different synthetic datasets.

How to cite: Collart, P., Gall, J., Schnepf, A., Doorenbos, L., and Pagel, H.: Constrained hybrid modelling to predict microbial dynamics and organic matter turnover in soil systems, EGU General Assembly 2026, Vienna, Austria, 3–8 May 2026, EGU26-8161, https://doi.org/10.5194/egusphere-egu26-8161, 2026.

EGU26-8645 | ECS | Orals | SSS4.1

From Buffering to Collapse: A Hump-shaped Rhizosphere Response to Shelterbelt Forest Degradation 

Guan Wang, Huijie Xiao, Linlin Shi, Tianshuo Liu, Zhiming Xin, Chenxi Yang, and Junran Li

Forest degradation is widely assumed to drive a monotonic decline in belowground functioning, yet plant-soil feedbacks may transiently buffer stress. We tested this idea by quantifying the rhizosphere effect (RE), the percent difference between rhizosphere and bulk soil, for soil carbon (C), nitrogen (N) and phosphorus (P) pools, enzymatic activities, and microbial biomass across four degradation stages in three types of shelterbelt forests. We found that RE generally increased or remained stable from undegraded to mild-moderate degradation stage and then declined sharply at severe degradation stage. This pattern was consistent across species but differed in amplitude, with Populus thevestina showing the largest early increases, Populus alba maintaining RE longer before decline, and Populus popularis sustaining higher RE for N-acquiring enzymes at early degradation stages. Early positive RE coincided with lower pH and higher water-soluble organic carbon (WSOC), soil water content (SWC), NH₄+, and NO₃⁻ in rhizospheres, conditions that stimulate microbial activities and nutrient turnover. As degradation intensified, RE contracted toward zero or negative values, reflecting reduced root exudation and weaker plant-microbe feedbacks. Random-forest and redundancy analyses highlighted rhizosphere P, rhizosphere N, bulk soil WSOC, rhizosphere SWC, and bulk-soil stoichiometry as the most influential factors, consistent with a transition from compensatory stimulation to functional collapse beyond a tipping zone. Our study provides the first field evidence that rhizosphere functioning responds nonlinearly to forest degradation. Recognizing this transient compensatory phase advances our understanding of ecosystem belowground resilience and can inform the intervention windows for dryland forest restoration.

How to cite: Wang, G., Xiao, H., Shi, L., Liu, T., Xin, Z., Yang, C., and Li, J.: From Buffering to Collapse: A Hump-shaped Rhizosphere Response to Shelterbelt Forest Degradation, EGU General Assembly 2026, Vienna, Austria, 3–8 May 2026, EGU26-8645, https://doi.org/10.5194/egusphere-egu26-8645, 2026.

EGU26-9990 | Posters on site | SSS4.1

Consumption of easily-available carbon does not alter microbial carbon use efficiency in soils 

Lingling Shi, Guodong Shao, Callum C. Banfield, Xin Xu, Weichao Wu, Kyle Mason-Jones, and Michaela A. Dippold

Microorganisms metabolize soil organic carbon (C) as a source of energy and biosynthetic precursors. Conventional metabolic flux analysis (MFA), coupled to 13C-labelling, can reconstruct C allocation through central metabolic pathways, but only reflects mass flow and not the thermodynamics of metabolism. We coupled metabolic energetics (13C), mass flow (18O) and calorespirometry in soil using an optimal set of isotopomer tracers. Fifteen position-specific or uniformly 13C-labelled isotopomers - four for alanine, seven glucose, and four glutamic acid – were added to a Luvisol, and substrate-derived 13CO2 fluxes along with microbial use efficiencies (CUE and SUE) were quantified as well as heat dissipation via isothermal microcalorimetry. Our results demonstrate that the temporal dynamics of catabolic CO2 release resemble that of heat dissipation, with both peaking approximately 18 h after substrate addition, irrespective of whether the tracer enters the central metabolic pathway at the monosaccharide level (glucose), at the pyruvate level (alanine) or the citric acid cycle (glutamic acid). This indicates that heat dissipation during the growth phase was strongly dominated by the microbial metabolic processes. Heat dissipation declined disproportionally compared to C mineralization after multiplicative growth, resulting in a lower calorespirometric ratio. Substrate-derived microbial biomass C (13C-MBC) pools showed that amino acids were incorporated, and retained in the biomass with intensive recycling, whereas glucose gets taken up, incorporated but ongoingly consumed, which leads to the peak biomass. This suggests that sugar may be a good tracer for metabolism. Glucose isotopomer utilization indicated dominance of the pentose phosphate and Entner Douderoff pathways over glycolysis, suggesting high activity of fast-growing organisms with considerable C allocation to anabolism. While calorespirometric ratio declined stepwise from 2426 kJ mol-1 , SUE and EUE were close to 100% during initial stage after the addition and declined when substance respiration started. In contrast, neither 18O-water- nor 13C-MFA-based CUE were altered by substrate supply, indicating that exogeneous substrate did not alter the microbial utilization and microbial quick regulation. Therefore, substrate mixtures do not induce a major shift in metabolic pathways during growing on them, leaving overall CUE largely unaffected. This study shows that the heat dissipation of growing microbial communities under high C supply is closely linked to their catabolic CO2 release. Consumption of easily-available carbon does not alter CUE (i.e. metabolic and physiological state of the soil microbiome), but strongly reduces SUE and EUE during ongoing substrate use. We furthermore demonstrated that coupled MFA and calorespirometry provides a powerful tool to understand in-situ microbial C and energy use in soils.

How to cite: Shi, L., Shao, G., Banfield, C. C., Xu, X., Wu, W., Mason-Jones, K., and Dippold, M. A.: Consumption of easily-available carbon does not alter microbial carbon use efficiency in soils, EGU General Assembly 2026, Vienna, Austria, 3–8 May 2026, EGU26-9990, https://doi.org/10.5194/egusphere-egu26-9990, 2026.

Soil organic carbon (SOC) sequestration is closely linked to the functioning of microbial communities present in soil microenvironments. However, it is unclear how the distribution of microbial communities or carbon resources within soil pore space influences the formation and long-term storage of microbial necromass. Using a cellular automaton simulating the exploration of pore space by bacterial cells, we estimated the relative production of necromass in different soil pore sizes, taking into account (i) the initial distribution of carbon resources used by microbial cells, (ii) soil moisture, and (iii) the microbial biomass recycling threshold. We show that carbon resources located in macropores are consumed more rapidly than those located in narrow pores. Microbial mobility appears to be highly dependent on the pore context: it is advantageous in connected macropores but becomes costly and inefficient in confined micropores, reducing carbon-use efficiency. Necromass tends to accumulate preferentially in small pores, where reduced connectivity limits its recycling. These results highlight the importance of soil spatial organization and water status in regulating microbial carbon fluxes and suggest that explicit integration of pore heterogeneity and microbial functional traits is essential for improving soil carbon dynamics models.

How to cite: Maestrali, M.: How do pore size and microbial mobility shape necromass distribution in soils ?, EGU General Assembly 2026, Vienna, Austria, 3–8 May 2026, EGU26-10654, https://doi.org/10.5194/egusphere-egu26-10654, 2026.

EGU26-11278 | Orals | SSS4.1

Hydrogen isotopes of lipids as a proxy for central metabolism and carbon use efficiency in soil microbes 

Nemiah Ladd, Nathalie Amacker, Reto Wijker, Laura Meredith, and Daniel Nelson

Microbial carbon use efficiency (CUE) represents the proportion of carbon consumed by microbes that is accumulated in biomass instead of respired, and is important for understanding carbon cycling and storage in soils. Existing methods for quantifying CUE rely on additions of isotopically labeled material and/or incubations in laboratory settings, which may differ from in situ conditions. We propose an alternative strategy to study microbial growth and metabolism using hydrogen isotopes of microbial phospholipid fatty acids (δ2HPLFA). 

In bacterial monocultures, δ2HPLFA values are strongly influenced by central metabolism. In particular, the most 2H-depleted PLFAs produced by heterotrophic bacteria are those with precursors derived from the Embden-Meyerhof-Doudoroff (EMP) and pentose phosphate pathways. When glycolysis proceeds through the Entner-Doudoroff (ED) pathway, fatty acids are significantly enriched in 2H. However, the highest δ2HPLFA values are from cultures grown on precursors from the tricarboxylic acid (TCA) cycle as the sole carbon source. These naturally occurring differences in δ2HPLFA values in cultures are one to two orders of magnitude greater than spatial and temporal variability soil water δ2H values. Therefore, δ2HPLFA values offer the opportunity to detect relative changes in TCA activity by soil microbes. As the TCA cycle is typically associated with higher respiration and lower CUE, and specific PLFAs are primarily derived from distinct microbial groups, δ2HPLFA values have potential as indicators of CUE for different groups of soil microbes.

Soil communities are inherently more diverse and dynamic than monocultures. As a first step to assess the utility of δ2HPLFAs as indicators of group-specific metabolism, we established a two-species system using a gram-negative bacteria (Pseudomonas sp.) and gram-positive bacteria (Bacillus sp.). These taxa produce distinct PLFAs from each other and utilize distinct pathways for glycolysis. We grew monocultures and co-cultures in a minimum media (M9) with either glucose or succinate as the sole carbon source. We harvested cultures at mid-exponential phase and measured δ2H values of extracted fatty acids.

First, we confirmed the results of previous monocultures with different strains of Pseudomonas and Bacillus. When grown on glucose, Bacillus, which uses the EMP pathway, produced fatty acids with an average δ2H value of -184 ± 12 ‰, while Pseudomonas, using the ED pathway, produced fatty acids with an average δ2H value of -20 ± 2 ‰. When they were grown on succinate and thereby forced to rely on the citric acid cycle, both bacteria produced fatty acids that were much more enriched in 2H (δ2H = +24 ± 5 ‰ for Bacillus and +192 ± 5 ‰ for Pseudomonas). When grown in co-cultures on glucose, δ2H values for PLFAs produced by Bacillus were similar to when it was grown alone on glucose (-189 ± 8 ‰), but δ2H values for PLFAs produced by Pseudomonas increased to +58 ± 18 ‰, indicating an increase in TCA cycle activity due to consumption of acetate secreted by Bacillus. These results demonstrate how metabolic changes driven by community interactions can be detected through δ2HPLFA values and provide a foundation for applications in more complex systems.

How to cite: Ladd, N., Amacker, N., Wijker, R., Meredith, L., and Nelson, D.: Hydrogen isotopes of lipids as a proxy for central metabolism and carbon use efficiency in soil microbes, EGU General Assembly 2026, Vienna, Austria, 3–8 May 2026, EGU26-11278, https://doi.org/10.5194/egusphere-egu26-11278, 2026.

EGU26-11679 | Posters on site | SSS4.1

Thermodynamic quantification of microbial energy turnover in soils using calorespirometry  

Yuan Du, Sonia Ohls, Anja Miltner, Matthias Kastner, and Thomas Maskow

Microbial processes play a key role in soil organic matter turnover and stabilisation, by controlling both matter and energy fluxes. While carbon cycling has been intensively studied, microbial energy fluxes - and their conservation during soil biogeochemical processes - remain insufficiently explored. Existing thermodynamic concepts and calorimetric approaches provide important insights, but they often rely on oversimplified representations of microbial metabolism and do not sufficiently account for soil heterogeneity, redox dynamics, and the simultaneous occurrence of multiple turnover processes

This study aims to develop a solid thermodynamic framework for assessing microbial energy turnover in soils by linking calorimetric heat flux measurements with carbon-fluxes (CO2 evolution, substrate consumption, biomass formation, etc.) within an enthalpy-based balance approach, using cellobiose turnover as an example.

The framework will be explored in controlled soil experiments covering a range of redox conditions, availability of biomass building blocks, and the abundance of the microbial catalysts. A key focus will be the quantitative reliability of thermodynamic balances derived from current experimental methods. To address this, we are initiating a calorimetric interlaboratory comparison. Furthermore, we will outline first concepts for extending the framework toward Gibbs energy changes, entropy production, and energy conservation in complex soil systems.

The poster presents the conceptional framework and experimental approaches, together with initial results demonstrating how calorespirometric and C-flux data can be integrated to quantify microbial energy turnover in soils.


[1] M. Kästner et al., Assessing energy fluxes and carbon use in soil as controlled by microbial activity – a thermodynamic perspective, Soil Biology & Biochemistry, 193, 109403 (2024).

How to cite: Du, Y., Ohls, S., Miltner, A., Kastner, M., and Maskow, T.: Thermodynamic quantification of microbial energy turnover in soils using calorespirometry , EGU General Assembly 2026, Vienna, Austria, 3–8 May 2026, EGU26-11679, https://doi.org/10.5194/egusphere-egu26-11679, 2026.

EGU26-12541 | Orals | SSS4.1

Accumulation of mineral-associated organic carbon under decade warming on the Tibetan Plateau 

Ji Chen, Siyi Sun, Jiacong Zhou, Yixuan Zhang, Xin Chen, Shuo Liu, Lei Liu, and Yalan Chen

Soil carbon persistence under climate warming depends critically on how microbial processes regulate the transformation and stabilization of organic inputs. In cold alpine ecosystems, low temperatures constrain microbial metabolism, and warming has the potential to reshape microbial carbon processing with long-term consequences for soil organic carbon (SOC) storage. Using a 14-year in situ warming experiment in an alpine meadow on the Qinghai–Tibetan Plateau, we examined how sustained temperature increases alter microbially mediated SOC fractions across soil depths. Warming did not change particulate organic carbon (POC), but led to a pronounced accumulation of mineral-associated organic carbon (MAOC), increasing by 11% in surface soils and 6% in subsoils. This enrichment was driven by enhanced formation of iron- and aluminum-associated organic carbon in topsoil and calcium-associated organic carbon in deeper layers. Notably, MAOC stocks were tightly linked to fungal biomass and fungal-derived necromass carbon, indicating that warming preferentially stimulates fungal pathways that channel microbial residues into mineral-stabilized carbon pools. In contrast, the stability of POC under warming likely reflects counteracting effects of increased plant inputs and accelerated microbial breakdown. Together, these findings demonstrate that long-term warming reorganizes SOC through microbially driven mineral associations rather than bulk carbon inputs, highlighting microbial necromass formation and organo–mineral interactions as key mechanisms governing carbon stabilization in cold-region soils under climate change.

How to cite: Chen, J., Sun, S., Zhou, J., Zhang, Y., Chen, X., Liu, S., Liu, L., and Chen, Y.: Accumulation of mineral-associated organic carbon under decade warming on the Tibetan Plateau, EGU General Assembly 2026, Vienna, Austria, 3–8 May 2026, EGU26-12541, https://doi.org/10.5194/egusphere-egu26-12541, 2026.

EGU26-13129 | ECS | Orals | SSS4.1

Global control of both temperature and microbes on soil carbon 

Rebecca M. Varney, Erik Schwarz, Xianjin He, and Stefano Manzoni

While soil biotic and abiotic processes control carbon emissions and storage in terrestrial ecosystems, biotic processes are key for understanding the future fate of carbon. The faster the rate of decomposition and the lower the fraction of decomposed carbon that is converted to new biomass, the more carbon released to the atmosphere. Despite this known pathway, quantifying this control is uncertain in models. Microbial implicit models capture general environmental controls, but omit direct controls of microbial biomass and its interactions with organic matter. Microbial explicit models account for key processes, but are prone to instability and parameter identifiability issues. This leads to the question, is there an alternative approach that blends simplicity and sufficient process representation? Here, we test whether metabolic theory of ecology (MTE) can be used for predictions of soil carbon fluxes and storages. MTE captures key features of biological processes at the individual level by considering both body size and temperature effects on metabolic rates, and can be used to scale up controls to a community or ecosystem level. Motivated by the need to explain variations in soil carbon fluxes and storages with intermediate-complexity, robust models, MTE is shown to explain scaling relations between respiration rates and microbial biomass, microbial growth rates and temperature, and between the contents of soil organic carbon and microbial biomass. This presents an opportunity to compare scaling relations in observational data and models, and potential to provide insight into global scale parameterising of microbial explicit models. This may help to reduce uncertainties in the future carbon feedback in the soil.

How to cite: Varney, R. M., Schwarz, E., He, X., and Manzoni, S.: Global control of both temperature and microbes on soil carbon, EGU General Assembly 2026, Vienna, Austria, 3–8 May 2026, EGU26-13129, https://doi.org/10.5194/egusphere-egu26-13129, 2026.

EGU26-14188 | Posters on site | SSS4.1

Tracing litter-derived soil organic nitrogen across the intact soil structure at microscale 

Werbson Lima Barroso, Vincent Poirier, Pierre-Luc Chagnon, Carmen Hoeschen, Steffen Schweizer, Gertraud Harrington, Joann K. Whalen, Denis Angers, and Isabelle Basile-Doelsch

At the microscale, soil organic matter (OM) and the mineral matrix are highly heterogeneous, shaping microbial activity and nitrogen (N) transport within soils and thereby influencing detritusphere formation. Although native soil OM determines the stabilization of new organic inputs in bulk soil, it is unclear whether the native soil OM is also controlling processes at the microscale, within the detritusphere. Here, using Nanoscale Secondary Ion Mass Spectrometry (NanoSIMS), we examine the microscale spatial expression of native soil OM effects on detritusphere formation through direct isotopic mapping. Intact soil macroaggregates (1–2 mm) from topsoil and subsoil differing only in native OM content and containing occluded 15N-labelled straw were analysed by NanoSIMS (30 µm fields of view; ~120 nm lateral resolution) after 51 days of incubation. Two-dimensional mosaic images show that litter-derived N is redistributed into the surrounding soil matrix as discrete, micrometre-scale hotspots extending up to 150 µm from particulate OM. In both topsoil and subsoil, the size, spatial separation, and persistence of these hotspots are consistent with biologically structured transfer pathways, potentially moving along the saprotrophic fungal hyphae and through micropores within macroaggregate. Hotspots were more abundant in subsoil than in topsoil, consistent with more mineral binding sites and greater microbial acquisition of scarce N resources in low-OM subsoils. The observed microscale heterogeneity in the redistribution of litter-derived N within the mineral matrix of the detritusphere illustrates the importance of spatially explicit biological processes and soil architecture in governing soil N dynamics within macroaggregates.

How to cite: Lima Barroso, W., Poirier, V., Chagnon, P.-L., Hoeschen, C., Schweizer, S., Harrington, G., K. Whalen, J., Angers, D., and Basile-Doelsch, I.: Tracing litter-derived soil organic nitrogen across the intact soil structure at microscale, EGU General Assembly 2026, Vienna, Austria, 3–8 May 2026, EGU26-14188, https://doi.org/10.5194/egusphere-egu26-14188, 2026.

EGU26-16596 | ECS | Posters on site | SSS4.1

Estimating Effects of Microbial Functional Diversity on Marsh Ecosystem Carbon Balance  

Michelle Schimmel, Albert Dumnitch, Wolfgang Streit, and Philipp Porada

Microbial processes are known to substantially influence carbon dynamics in soil, which can be altered by changes in community structure. However, the explicit representation of soil microbial diversity in ecosystem models is still in need of improvement. Model-based estimates are crucial to quantify links between functional diversity of soil microbes and ecosystem functioning, in particular soil carbon turnover and storage.

Incorporating functional diversity is well established in vegetation models and is the methodological basis for the presented approach. Trait-based modelling is used here to directly connect community structure to corresponding carbon fluxes and thereby enable implications for the marsh soils of the Elbe estuary, which represent an important carbon sink. Modelled microbial diversity is based on multiple functional types that vary in key traits related to carbon cycling. The simulated microbial community develops population dynamics based on the environmental conditions, leading to selection of certain functional types. This allows predictions of the abundances and potential shifts in the community structure resulting in altered soil carbon dynamics. Parameter values for the microbial model are derived from empirical data and a specifically developed experimental approach that investigates microbial growth and uptake kinetics. We assess the impact of functional diversity on carbon dynamics in marsh soils by comparing soil carbon fluxes in the model with and without explicitly modelled microbial functional diversity. The findings of the study are expected to enhance projections of soil organic carbon storage in wetland ecosystems as well as emphasizing the role of microbial functional diversity for ecosystem carbon dynamics.

How to cite: Schimmel, M., Dumnitch, A., Streit, W., and Porada, P.: Estimating Effects of Microbial Functional Diversity on Marsh Ecosystem Carbon Balance , EGU General Assembly 2026, Vienna, Austria, 3–8 May 2026, EGU26-16596, https://doi.org/10.5194/egusphere-egu26-16596, 2026.

Pyrogenic carbon (PyC), commonly applied as biochar in agricultural soils, is widely promoted as a stable carbon pool for climate mitigation. However, this passive framing overlooks the central role of microbial metabolism and turnover in governing PyC-associated carbon cycling. Here, our study reveal that biochar should be conceptualized not as an inert carbon reservoir but as a dynamic microbial interface that actively regulates soil carbon turnover through coupled heterotrophic and autotrophic processes. Drawing on incubation experiments, microbial functional profiling, and field-scale analyses, we show that biochar–microbe interactions are driven by integrated physical, chemical, and biological mechanisms. Biochar restructures microbial habitats through pore-mediated colonization, nutrient retention, and pH buffering, while simultaneously enabling extracellular and interspecific electron transfer that mediates redox-sensitive metabolic pathways. These processes directly regulate microbial metabolic activity, community structure, and functional assembly, positioning biochar as an active regulator of soil biogeochemical function. Biochar-induced priming effects on native soil organic carbon (SOC) arise primarily from shifts in microbial metabolic strategies rather than from carbon recalcitrance alone. Biochar promotes SOC persistence by stabilizing soil physicochemical conditions and selectively enriching microbial consortia associated with reduced heterotrophic disturbance and efficient secondary metabolite turnover. These findings identify microbial accessibility and functional redundancy as key determinants of carbon turnover and persistence in biochar-amended soils. Critically, biochar also activates an overlooked autotrophic carbon input pathway. We demonstrate that biochar substantially alters Calvin cycle–mediated CO₂ fixation by regulating the abundance, activity, and community structure of cbbL- and cbbM-containing autotrophic microorganisms. The rhizosphere emerges as a hotspot of biochar-enhanced CO₂ assimilation. This autotrophic CO2 fixation is tightly coupled with essential elemental cycling in soil, integrating PyC-driven microbial metabolism into broader soil biogeochemical networks. Our study supports a conceptual shift from passive PyC stabilization to microbially regulated carbon turnover, highlighting microbial metabolism and turnover as central controls on long-term soil carbon sequestration and soil function.

How to cite: Zhu, X.: From heterotrophic priming to autotrophic CO₂ fixation: biochar-driven shifts in microbial turnover of soil carbon, EGU General Assembly 2026, Vienna, Austria, 3–8 May 2026, EGU26-17741, https://doi.org/10.5194/egusphere-egu26-17741, 2026.

EGU26-18157 | ECS | Orals | SSS4.1

Microscale mechanisms behind the priming effect - Insights from a novel experimental model system 

Moritz Mohrlok and Christina Kaiser

Pulses of labile substrate, as for example exuded by plant roots, have been shown to accelerate decomposition of complex Soil Organic Matter (SOM), with strong implications for soil carbon balance and the global carbon cycle. Despite its importance, the mechanisms behind this so-called priming effect’ are still not fully clear. Most studies to date focus on investigating priming effects at the bulk soil scale. However, as this effect is caused by the action of soil microbes, it can be assumed that it fundamentally emerges from microscale processes. Observing the activities of microbial decomposers at the microscale could thus be the key for a better mechanistic understanding of the priming effect, but this has been hampered by technical challenges of microscale in-situ observations in soil so far. 

Here, we present a novel approach to study the priming effect on scales relevant to its main actors. We developed a microfluidic model system and image analysis pipeline that allows us to track microbes living on transparent agarose patches containing carboxymethylcellulose (CMC) with time-resolved fluorescence microscopy. Using this system, we exposed fluorescently tagged cellulose-degrading soil bacteria (Bacillus subtilis) to pulses of labile substrate at different concentrations. Total CMC decomposition was finally assessed by Congo Red staining of the substrate patches.

After 42 days of incubation with periodic observations, we observed a positive priming effect in our system: Increased decomposition of CMC upon addition of enough labile substrate. Our image analysis suggests that different mechanisms caused decomposition at different substrate concentrations: In chips supplied with the highest concentration of labile substrate, decomposition was associated with microbial biomass, which peaked shortly after the substrate pulse but then quickly declined, possibly due to depletion of essential nutrients or waste accumulation. On the contrary, a lower but more sustained and spatially organized biomass at intermediate concentration led to the same amount of decomposition. Additionally, we found that motility was transiently increased in the bacterial population after the pulse, suggesting that substrate pulses can facilitate the colonization of soil microhabitats. 

Our approach, albeit strongly simplifying the microbial environment in soils, allows novel insights into fundamental microbial mechanisms at the microscale that could play a role during rhizosphere priming.

How to cite: Mohrlok, M. and Kaiser, C.: Microscale mechanisms behind the priming effect - Insights from a novel experimental model system, EGU General Assembly 2026, Vienna, Austria, 3–8 May 2026, EGU26-18157, https://doi.org/10.5194/egusphere-egu26-18157, 2026.

EGU26-18524 | ECS | Orals | SSS4.1

Unmixing soil bacterial diversity considering community microgeography 

Samuel Bickel, Gabriele Berg, and Dani Or

Similar to human settlements, soil bacteria are distributed into numerous cell clusters whose sizes encode their function and environmental context. We show that bacterial cell cluster size distributions follow log-normal patterns, predicted by proportionate growth (Gibrat’s law). This log-normal distribution of cell cluster sizes is robust across biomes spanning a wide range of resource availabilities. Importantly, we show how characteristic cluster sizes vary with soil carrying capacity and transport limitations. In soils with high bulk cell density, cell cluster size distribution gives rise to rare but disproportionately large, ‘mega’ communities, that, in turn, disproportionately drive metabolism leading to anoxic microsites in largely oxic soils. A cursory evaluation of the statistical features of soil bacterial microgeography suggests that standard bulk soil sampling conflates many small, endemic clusters with a few dominant mega clusters. Consequently, accurate assessment of diversity and composition requires “unmixing” of genetic information across the likely original distributions and bacterial cluster size spectrum. We outline an analytical and modeling framework that translates soil carrying capacity into expected community size heterogeneity based on the observed cell cluster size distributions with heavy tails. We combine global soil and microbiome data sets to model putative community size structures across different ecosystems. Our approach reframes soil microbiomes as size-structured meta-communities and provides testable predictions for diversity-function relationships under changing moisture and carbon regimes.

How to cite: Bickel, S., Berg, G., and Or, D.: Unmixing soil bacterial diversity considering community microgeography, EGU General Assembly 2026, Vienna, Austria, 3–8 May 2026, EGU26-18524, https://doi.org/10.5194/egusphere-egu26-18524, 2026.

EGU26-18977 | ECS | Orals | SSS4.1

The role of mineral surfaces in soil organic carbon dynamics across soil pores  

Haotian Wu, Maelle Maestrali, Xavier Raynaud, Naoise Nunan, and Steffen Schweizer

The spatial distribution of soil organic matter (OM) and its accessibility to microbial decomposers are key regulators of microbial functioning and soil carbon dynamics. However, how the interactions between soil pore sizes and mineral surfaces shape microbial activities remain unclear. In this study, we conducted a 21-day incubation experiment using ceramic microcosms with soil-like pore networks, coated with different mineral surfaces (illite and goethite). We selectively distributed 13C-labelled organic matter into distinct pore size classes (<10 μm and >20 μm). By monitoring carbon mineralization and microbial carbon use efficiency (CUE), we elucidated the interplay between microbial microenvironments and metabolic activities. We compared a simple mix of organic low-molecular-weight compounds with water-extractable OM of wheat root, to determine the role of different types of OM on microbial metabolism and OM decomposition. Mean comparisons for microbial respiration, fraction of added carbon respired, microbial biomass, and CUE were performed using linear models with pore size, mineral surface and OM type as fixed factors, allowing us to identify the dominant drivers of microbial OM decomposition across distinct microenvironments. Post-incubation NanoSIMS analyses were used to quantify pore-scale patterns of the incorporation and spatial retention of freshly added OM across mineral surfaces and pore size classes. Our findings provide insights on how localized interactions between microbes and their organo-mineral microenvironments within pores modulate the persistence and turnover of soil organic carbon.

How to cite: Wu, H., Maestrali, M., Raynaud, X., Nunan, N., and Schweizer, S.: The role of mineral surfaces in soil organic carbon dynamics across soil pores , EGU General Assembly 2026, Vienna, Austria, 3–8 May 2026, EGU26-18977, https://doi.org/10.5194/egusphere-egu26-18977, 2026.

EGU26-19135 | ECS | Posters on site | SSS4.1

Microbial carbon and nitrogen dynamics during soil development in post-mining sites 

Kateřina Čápová, Olga Vindušková, Jan Frouz, and Kateřina Jandová

Microorganisms play a key role in the cycling of elements in soil systems by driving organic matter decomposition and regulating nutrient availability. Biomarkers provide an effective approach to studying microbial communities and their functions. In this study, phospholipid fatty acids (PLFAs) and amino sugars (ASs) are used as complementary indicators of short- and long-term microbial processes involved in the cycling and storage of carbon and nitrogen. While PLFA and amino sugar analyses are not interchangeable, their combined application allows for a clear distinction between living microbial biomass and accumulated microbial residues.

The study is set at two chronosequences using heaps of various stages of soil development, differing in type of reclamation (alder reclamation vs. spontaneous succession), at post-mining sites in northwestern Czech Republic. Carbon and nitrogen cycling during soil development are tightly coupled through microbial activity, particularly via the formation and persistence of microbial biomass and necromass. These microbially derived pools form an important link between microbial activity and biogeochemical processes during soil development.

The aim of this study is to monitor changes in PLFA and amino sugar concentrations along two chronosequences and to evaluate how microbial processes contribute to the long-term storage of carbon and nitrogen in soil. By combining biomarkers of living microbial biomass and microbial necromass across different successional pathways, this study improves our understanding of microbial community development during soil formation.

How to cite: Čápová, K., Vindušková, O., Frouz, J., and Jandová, K.: Microbial carbon and nitrogen dynamics during soil development in post-mining sites, EGU General Assembly 2026, Vienna, Austria, 3–8 May 2026, EGU26-19135, https://doi.org/10.5194/egusphere-egu26-19135, 2026.

EGU26-20400 | Orals | SSS4.1

Microbial traits are shaped by soil type with potential implications for microbial necromass carbon cycling 

Kate Buckeridge, Alberto Vinicius Sousa Rocha, and Malte Herold

Microbial necromass carbon (MNC) is 15-80% of SOC and is controlled by necromass production (microbial growth and death), stabilisation (minerals and aggregates), and consumption (recycling and destabilisation). Microbial traits (i.e., quantitative measures that capture differences in life strategies or niche segregation among taxa) provide a step-change in understanding the interactions between microbes and soil organic carbon (SOC) cycling, particularly regarding the contribution of MNC. However, it remains unclear which traits consistently inform MNC and its relationship with SOC in cropland soils. Here, we address this gap by collecting soil samples from 22 farm fields spanning 4 soil types in Luxembourg, then we inferred genomic bacterial traits using representative genomes available in the Genome Taxonomy Database (GTDB) and the Bacterial Diversity Metadatabase (BacDive) and correlated them with SOC and MNC stocks.

Our preliminary results suggest that soil-type selects traits linked to resource acquisition and high-yield microbial strategies, including genome size, GC content, 16S rRNA copy number, and motility. We also observed positive or negative correlations between the traits themselves, suggesting possible trade-offs in community-level life history strategies, with potential implications for carbon derived from microbes. However, these traits or trade-offs had no direct links with bulk SOC stocks. Our ongoing analysis will instead link these traits and trade-offs directly to MNC stocks, to assess whether genome-derived traits can be useful for informing the necromass cycle. If this microbial trait relationship with MNC stocks holds true, the results and method will be useful for better understanding the MNC cycle in cropland soils and for improving next-generation SOC models.

How to cite: Buckeridge, K., Sousa Rocha, A. V., and Herold, M.: Microbial traits are shaped by soil type with potential implications for microbial necromass carbon cycling, EGU General Assembly 2026, Vienna, Austria, 3–8 May 2026, EGU26-20400, https://doi.org/10.5194/egusphere-egu26-20400, 2026.

EGU26-20487 | Orals | SSS4.1

The carbon use efficiency paradox: why what we measure is not what we need 

Michaela A. Dippold, Guodong Shao, Ranran Zhou, and Lingling Shi

The pivotal role of the soil microbiome in global biogeochemical cycles is undisputed. The subsequent demand for simplified quantitative descriptions of its functions in modelling approaches resulted in transferring the pure-culture based microbial yield concept into microbial carbon use efficiency (CUE) – a “one-number” approach to partition C input to soils and to describe the physiological efficiency of the microbiome.

The holy grail lost its sanctity once our challenges to reliably determine it became evident. The method comparison of Geyer et al. (2019) identified which critical assumptions underly the contrasting outcomes in CUEs derived from these methods. Our own data just underline this: While substrate-based CUE has a temporal and substrate dependency, 18O-based and metabolic CUE remain often unaffected by substrate addition but cover, with either DNA-replication or anabolic precursor-based upscaling of biomass C formation contrasting physiological processes of microbial cells.

Such divergent findings highlight that despite decades of research, current methods do not allow an unambiguous quantification of microbial substrate use in soils, owing to two overlapping methodological challenges: 1) Neither extracting microbial biomass nor predicting it from de-novo formed DNA can deliver a reliable quantitative estimation of the newly formed microbial biomass carbon; and 2) Whatever we add as substrate to soils does not reflect what microbes use for growth under native conditions. Our progress in quantitatively covering an increasing number of cellular pools (e.g. also considering cell walls and membranes), the increased consideration of storage, and first concepts on how to integrate secreted extracellular carbon offer perspectives to tackle the first of the two challenges. However, experimentally representing the incredible diversity of organic molecules accessible to microbes for consumption in soils is yet rather avoided, although Lehmann et al (2020) postulated compound diversity as a central factor determining the fate of carbon in soils. Comparing incubations with individual compounds to those of complex monomer mixture revealed that the microbial use of an individual compounds is significantly affected by the presence or absence of other compounds, i.e. the molecular diversity in soil solution. This can readily be explained by viewing microbes through the lens of their metabolic capacities, which impose fundamental constraints on their functioning. Formation of microbial biomass requires a defined ratio of precursor building blocks, which are products of distinct pathways of the basic carbon metabolism. De-novo production requires expression and formation of all pathway-related enzymes, while direct precursor uptake from soil solution allows for “saving” this energy. Therefore, we postulate that monomer diversity would positively affect microbial efficiency. This may be contrasting for polymer diversity, where extracellular enzyme costs exceed those of intracellular de-novo formation and thus a low diversity may be bioenergetically favorable. Thus, substrate diversity-efficiency relationships may centrally underlie deviations between our current CUE approaches. We recommend microbial ecologists to whenever possible replace CUE by the actual processes of interest, i.e. the ecophysiological response and subsequent changes in microbial pools (metabolome, growth) and fluxes (fluxome). This would provide parameters allowing for quantitative upscaling to pools and fluxes required for higher scale soil system models.

How to cite: Dippold, M. A., Shao, G., Zhou, R., and Shi, L.: The carbon use efficiency paradox: why what we measure is not what we need, EGU General Assembly 2026, Vienna, Austria, 3–8 May 2026, EGU26-20487, https://doi.org/10.5194/egusphere-egu26-20487, 2026.

EGU26-20639 | ECS | Posters on site | SSS4.1

Energetic and Metabolic Costs of Organic Phosphorus Mineralization in Microbial Hotspots 

Nataliya Bilyera, Ningkang Sun, Callum C. Banfield, Gu Feng, Benjamin L. Turner, Yakov Kuzyakov, and Michaela A. Dippold

Phosphorus (P) is essential for life but is often poorly available to plants, limiting biological processes in ecosystems. Microbial transformations increase P availability through enzymatic hydrolysis of organic P compounds; however, these processes are metabolically and energetically costly and occur predominantly in microbial hotspots, such as the rhizosphere and other microsites with elevated microbial activity. Microorganisms invest cellular energy, primarily in the form of ATP, to produce phosphatase enzymes required for P mineralisation.

This study aimed to quantify the energetic and metabolic costs of enzymatic hydrolysis of organic P compounds of increasing complexity within microbial hotspots. We hypothesized that (i) energy investment for enzyme production increases with substrate complexity and its interaction with soil minerals, and (ii) enzyme-mediated P mineralization requires higher energy input than direct P uptake. To test these hypotheses, a soil–sand mixture was incubated with different P substrates while measuring heat dissipation (microcalorimetry), enzyme activities, soil ATP content, and available P.

Four treatments were applied: inorganic P (control), glycerol phosphate, DNA, and phytic acid (phytate). Heat release increased with substrate complexity, from phosphomonoester to DNA, indicating higher energetic investment. Microorganisms invested more energy in enzyme production than in P uptake, and phosphomonoesterase activity increased with substrate complexity. In contrast, phosphodiester hydrolysis was constrained by low phosphodiesterase activity, reflecting higher metabolic costs.

These results demonstrate that microbial hotspot activity governs the energetic efficiency of organic P transformations in soils, highlighting the importance of microscale processes for soil P cycling.

Acknowledgments and Funding: This work was funded by the German Research Foundation (DFG, BI 2570/1-1), project number 525137622.

How to cite: Bilyera, N., Sun, N., Banfield, C. C., Feng, G., Turner, B. L., Kuzyakov, Y., and Dippold, M. A.: Energetic and Metabolic Costs of Organic Phosphorus Mineralization in Microbial Hotspots, EGU General Assembly 2026, Vienna, Austria, 3–8 May 2026, EGU26-20639, https://doi.org/10.5194/egusphere-egu26-20639, 2026.

EGU26-20812 | Posters on site | SSS4.1

Soil microbial resource limitation along a postmining chronosequence 

Christoph Rosinger, Michael Bonkowski, and Hans-Peter Kaul

Soil microorganisms regulate fundamental biogeochemical processes, including carbon sequestration and nutrient cycling, yet their activity and growth are frequently constrained by the availability of limiting resources. Microbial resource limitation is highly dynamic and context dependent, shaped by interacting biotic and abiotic drivers such as soil organic carbon, nutrient availability, land-use, and pedo-climatic conditions. Despite its central role for ecosystem functioning, we still lack a comprehensive and mechanistic understanding of how microbial resource limitation emerges and shifts along soil development gradients, largely due to the confounding nature of multiple co-varying environmental factors in natural ecosystems.

Post-mining chronosequences offer a powerful framework to disentangle such drivers, as they share highly comparable initial soil conditions while differing in time since reclamation. We used a 66-year post-mining chronosequence at the open-cast lignite mine Inden (Western Germany) to investigate patterns of soil microbial resource limitation along a pronounced soil organic carbon gradient. Soils originated from a standardized loess-based substrate and encompassed two land-use systems: reclaimed arable fields under conventional management and adjacent, unmanaged field margins. Topsoil samples (0–15 cm) spanning SOC contents from 0.6-4.0% were subjected to multifactorial carbon, nitrogen, and phosphorus additions, followed by measurements of microbial biomass growth and heterotrophic respiration.

Across both land-use systems, microbial growth and respiration responded most strongly to treatments receiving carbon, either alone or combined with nitrogen and phosphorus, indicating a prevailing state of microbial carbon limitation along the chronosequence. Microbial biomass responses to carbon amendments declined exponentially with increasing soil organic carbon, revealing a critical soil organic carbon threshold around 1-1.5%, below which strong carbon limitation prevailed and above which carbon limitation was progressively alleviated. In arable soils with low soil organic carbon, evidence for carbon and nitrogen co-limitation emerged, while high-soil organic carbon soils - particularly field margins - showed indications of phosphorus co-limitation in respiratory responses. Extrapolation of the observed response functions suggests that even soils with substantially higher soil organic carbon contents may retain a measurable, albeit diminishing, degree of microbial carbon limitation.

Overall, our results highlight soil organic carbon as a dominant regulator of microbial resource limitation during early to intermediate soil development and emphasize the value of post-mining chronosequences for advancing a mechanistic understanding of microbial constraints on soil biogeochemical functioning.

How to cite: Rosinger, C., Bonkowski, M., and Kaul, H.-P.: Soil microbial resource limitation along a postmining chronosequence, EGU General Assembly 2026, Vienna, Austria, 3–8 May 2026, EGU26-20812, https://doi.org/10.5194/egusphere-egu26-20812, 2026.

EGU26-21795 | Orals | SSS4.1 | Highlight

Going deeper underground – unravelling microbial activity and carbon cycling in deep soils in the Central Amazon 

Lucia Fuchslueger, Nathielly Pires Martins, Laynara Figueiredo Lugli, Crisvaldo Cassio Souza, Flavia Santana, Nathalia Marinho, Maria Pires, Iain Hartley, Richard Norby, and Carlos Alberto Quesada and the AmazonFACE team

Tropical forest soils are important carbon stocks, despite often being highly weathered and depleted in mineral nutrients. In these soils, microbial communities play a crucial role in carbon, nitrogen and phosphorus cycling, and contribute largely to the soils’ nutrient pools. However, as tropical primary forests are remote, and deep soil layers are difficult to access, little is still known about the role of microbial activity affecting carbon cycling beyond the more frequently studied top layers.

We conducted a carbon and nutrient stock inventory in soils down to two meters at the experimental site of the AmazonFACE program, located in Central Amazonia, near Manaus, Brazil. Additionally, we investigated microbial community composition with phospholipid fatty acids (PLFA) and measured microbial respiration and potential extracellular enzyme activity rates in short-term incubations. 

We found that the Amazon FACE site harbors 180.0 (±6.50) Mg C ha-1 in the upper two meters of soil, with almost 60% already being stored in the first 50 cm. Below the organic upper 5 cm of soil, C:N ratios remained constant at around 14.5, however, δ13C signatures of soil organic carbon increased, indicating more often turned-over carbon at deeper layers. We found a faster decrease in fungal than bacterial PLFA markers with depth, and no 16:1w5 markers (representing arbuscular mycorrhizal fungi) below 20 cm of soil. In contrast, our results showed less strong declines in microbial respiration rates.

Overall, our data shows that the upper 50 cm of soil have a crucial function in forest carbon storage and turnover, likely related to plant nutrient inputs by roots, facilitating higher microbial activity, making these upper layers more prone to environmental changes. As in deeper soil layers fine root biomass and microbial activity are relatively low, these layers can play an important role in forest resilience. However, normalized by microbial biomass, carbon mineralization is still high in deeper layers, suggesting that they are not static and could be sensitive to climate change. 

How to cite: Fuchslueger, L., Pires Martins, N., Figueiredo Lugli, L., Souza, C. C., Santana, F., Marinho, N., Pires, M., Hartley, I., Norby, R., and Quesada, C. A. and the AmazonFACE team: Going deeper underground – unravelling microbial activity and carbon cycling in deep soils in the Central Amazon, EGU General Assembly 2026, Vienna, Austria, 3–8 May 2026, EGU26-21795, https://doi.org/10.5194/egusphere-egu26-21795, 2026.

Biodegradable plastics have been proposed as an alternative to mitigate the environmental persistence of conventional petroleum-based plastics, however, securing bacterial resources capable of degradation is essential to achieve stable biodegradation under treatment conditions such as composting. Although bacteria that can degrade biodegradable plastics have been reported, there remains a need to obtain degrader resources applicable across different plastic types and diverse environmental conditions. Conventional approaches based on strain isolation followed by degradation activity tests are labor-intensive and time-consuming, which limits efficient screening and isolation of target degraders. To address these limitations, we introduced a network-based analytical framework that leverages metagenomic information from enrichment cultures and functional gene information to identify candidate bacteria contributing to biodegradable plastic degradation. Two composts were used as inocula, and enrichment cultures were conducted for 100 days at mesophilic (35 °C) and thermophilic (58 °C) conditions using Polylactic acid (PLA) or Polybutylene adipate terephthalate (PBAT) as the sole carbon source. Bacterial community structure was characterized across 20 enrichment cultures using 16S rRNA gene amplicon sequencing. To evaluate functional potential related to biodegradable plastic degradation, predicted functional gene profiles were inferred at the KEGG Orthology (KO) level using PICRUSt2. Co-occurrence network analysis was then performed to link changes in genus-level dominance with shifts in predicted functional gene abundances and to explore candidate bacterial resources with high degradation potential for PLA and PBAT. As a result, genera whose dominance increased over time and showed positive associations with predicted secondary-metabolism–related functional genes (K10804, K01432, K15739, and K00467)—processes involved in polymer breakdown to lower-molecular-weight compounds and/or transformation and accumulation of intermediates such as lactate—were highlighted as candidate degraders, including Pseudoxanthomonas, Thermoflavifilum, and Thermopolyspora. This study provides microbiological insights for inoculum design and process optimization for composting-based biodegradation, and demonstrates that a network analysis approach integrating community and predicted functional gene information can be applied to explore diverse microbial resources in future studies.


Keywords

Biodegradable plastics, Bacterial resource, Metagenome, Functional genes, Network analysis


Acknowledgement

This research was supported by Particulate Matter Management Specialized Graduate Program through the Korea Environmental Industry & Technology Institute (KEITI) funded by the Ministry of Environment (MOE), and by the Ministry of Trade, Industry and Energy (MOTIE) (RS-2025-07902968).

How to cite: Hwang, S., Lee, S. Y., Cho, I., and Cho, K.-S.: Network-Based Exploration of Candidate Biodegradable Plastic-Degrading Bacteria Using Metagenomic and Functional Gene Data from Enrichment Cultures, EGU General Assembly 2026, Vienna, Austria, 3–8 May 2026, EGU26-21930, https://doi.org/10.5194/egusphere-egu26-21930, 2026.

EGU26-45 | Posters on site | BG3.36

Fire disturbances to manganese cycling in the plant-soil continuum 

Rixiang Huang, Shyrill Mariano, Joseph D. Birch, Jessica Miesel, Carmen Sánchez-García, Cristina Santin, and Jonay Neris

Fires are a common and probably the most pervasive disturbance to many terrestrial vegetated ecosystems. By burning a great portion of aboveground biomass and producing gases, aerosols, and solid residues deposited on the ground surface, as well as changing other ecosystem properties, fires not only immediately transform aboveground pools of ecologically important elements but, more importantly, has a lasting impact on their post-fire cycling. In this work, we focus on the immediate changes of fire to the chemistry of manganese (Mn) and evaluate the effects of vegetation-fire interactions. Leveraging field and laboratory studies, we characterized the chemical speciation and reactivity of Mn in ash samples and revealed the effects of vegetation and fire thermal conditions. Combined with ecosystem-dependent fire behaviors, the results were extrapolated to reveal the differential impacts of fires, in terms of immediate changes to and long-term effects on Mn cycling.

How to cite: Huang, R., Mariano, S., D. Birch, J., Miesel, J., Sánchez-García, C., Santin, C., and Neris, J.: Fire disturbances to manganese cycling in the plant-soil continuum, EGU General Assembly 2026, Vienna, Austria, 3–8 May 2026, EGU26-45, https://doi.org/10.5194/egusphere-egu26-45, 2026.

EGU26-119 | ECS | Posters on site | BG3.36

Ecosystem stability and productivity dynamics of Inner Mongolian grasslands under climate extremes 

Md. Lokman Hossain and Derrick Yuk Fo Lai

Understanding how ecosystems function under frequent climatic disturbances is crucial for predicting their long-term stability. Although previous research indicates that stable ecosystems can mitigate the impacts of climate extremes, there remains debate over whether this stability is primarily driven by resistance, resilience, or a combination of both. In this study, we analyzed annual net primary productivity (NPP) in relation to the Standardized Precipitation Evapotranspiration Index (SPEI) and the aridity index (AI) to examine: (i) the spatiotemporal variations in NPP, (ii) the correlations between NPP, SPEI, and AI, and (iii) the resistance and resilience of four grassland types—meadow steppe, typical steppe, desert steppe, and steppe desert—across Inner Mongolia during the period 2000–2019. Despite noticeable interannual fluctuations, all grassland types exhibited an overall increase in NPP, with rates ranging from 1.21 g C m⁻² yr⁻¹ in desert steppe to 4.54 g C m⁻² yr⁻¹ in meadow steppe. Meadow steppe recorded the highest average NPP (251 g C m⁻²), followed by typical steppe (160 g C m⁻²), steppe desert (95 g C m⁻²), and desert steppe (83 g C m⁻²). NPP was significantly correlated with increasing SPEI values across all grasslands, and with higher AI values in steppe desert and desert steppe. Species richness varied from 9–14 in meadow steppe, 7–17 in typical steppe, and 5–10 in steppe desert, with NPP rising with greater species diversity—indicating a positive biodiversity–productivity relationship. Vegetation showed lower resistance but higher resilience under dry conditions, and the opposite under wet conditions, across most grasslands except desert steppe. Although typical steppe, meadow steppe, and steppe desert were more vulnerable to extreme droughts due to low resistance, their strong resilience suggests a quicker recovery following dry periods compared to wet conditions. The identified positive relationship between biodiversity and productivity suggests that preserving higher species richness may help mitigate productivity declines during climatic extremes.

How to cite: Hossain, Md. L. and Lai, D. Y. F.: Ecosystem stability and productivity dynamics of Inner Mongolian grasslands under climate extremes, EGU General Assembly 2026, Vienna, Austria, 3–8 May 2026, EGU26-119, https://doi.org/10.5194/egusphere-egu26-119, 2026.

Hotter and drier conditions under ongoing climate change are altering forest dynamics worldwide, frequently inducing events of forest mortality. These mortality events have profound implications for the carbon and water balances of ecosystems, from the plot to the global scale. However, their prediction remains a substantial research challenge, even if the mechanisms involved are relatively well understood. I will discuss this apparent paradox highlighting the limitations of current approaches, which rely almost exclusively on the use of traits and process-based modelling. These are powerful approaches but also face important challenges due to the scale- and context-dependency of trait effects on individual performance and vegetation dynamics. I will argue that better predictions require multi-scale approaches that complement the essentially reductionistic view based on traits with systems thinking. Current developments of forest monitoring schemes through continuous, on-site measurements and enhanced remote sensing tools provide excellent opportunities to reconcile our detailed mechanistic understanding at fine scales (e.g., ecophysiology) with patterns and processes at coarser scales.

How to cite: Martínez-Vilalta, J.: Predicting drought-induced impacts on forests: mechanisms, challenges and novel approaches, EGU General Assembly 2026, Vienna, Austria, 3–8 May 2026, EGU26-1826, https://doi.org/10.5194/egusphere-egu26-1826, 2026.

EGU26-8089 | ECS | Posters on site | BG3.36

Soil microbial and organic matter responses to short-interval reburns in the Pacific Northwest, USA 

Katherine McCool, Bennett Fate, Georgia Seyfried, Steven Perakis, and Kevin Bladon

The area burned by high severity wildfire is increasing in many regions on the planet as a product of fuel accumulation, fire suppression, and climate change. As more forested land is impacted by high severity wildfires, there is greater potential for short-interval reburns, where the same area is burned by two or more wildfires within 20 years. Though reburn effects on vegetation are gaining significant research attention, it remains unclear how soil biogeochemical processes will respond to short-interval reburns. Studies in some forests have shown that short-interval reburns drive compounding losses of soil carbon (C) and nitrogen (N), but results vary based on ecosystem type, age, and fire dynamics. A key uncertainty is how reburn history influences dissolved organic carbon (DOC) quantity and composition and microbial respiration, which together influence C processing and organic matter (OM) cycling in soils.

To address this knowledge gap, we quantified differences in soil biogeochemistry across soils from forest stands that experienced zero, one (in 2023), or three (in 2003, 2017, and 2023) wildfires within a 20-year period, and classified those stands as unburned, long-interval reburn, and short-interval reburn, respectively. These fires occurred in the Pacific Northwest, USA, in wet conifer forests with higher productivity than most previously studied reburns. We collected five replicate soil samples from 0–5 cm mineral soil depths and quantified microbial biomass C and N, soil organic C and N, and OM concentrations, pH, and DOC and total dissolved N concentrations. Additionally, we carried out a 35-day lab incubation to quantify microbial CO2 respiration and net inorganic N fluxes. Finally, we characterized the chemical quality of DOC using excitation-emission indices and parallel factor analysis.

While wildfire decreased soil C and microbial biomass C and N in both short-interval and long-interval reburns, we observed no effect of fire nor short-interval reburn on soil N, pH, or OM. However, soil from short-interval reburn sites had lower DOC concentrations (F2,12 = 14.5, p < 0.001) and CO2 fluxes (F2,10 = 26.6, p < 0.001) than both long-interval reburn and unburned stands. Chemical quality analyses indicated that “fresh” DOC comprised a larger proportion of overall DOC contents after short-interval reburn (F2,10 = 4.2, p = 0.048) compared to long-interval reburn, with similar “freshness” between unburned and short-interval reburn soils.

Taken together, our preliminary results suggest that the short-interval reburn soils exhibited lower DOC concentrations and suppressed microbial respiration. Interestingly, these lower CO2 fluxes were not fully explained by microbial biomass C and N, which appeared to be buffered, possibly due to less fuel consumption during the third fire. Instead, we hypothesize that reduced DOC quantity, rather than DOC composition (“freshness”), was the primary constraint on microbial processing under our experimental conditions. As such, carbon quantity appears to exert stronger control than DOC composition. These results suggest that slower decomposition may facilitate soil C retention following short-interval reburns. Our findings have implications for soil recovery trajectories, as decreased microbial processing may contribute to rebuilding soil OM over time after short-interval reburns.

How to cite: McCool, K., Fate, B., Seyfried, G., Perakis, S., and Bladon, K.: Soil microbial and organic matter responses to short-interval reburns in the Pacific Northwest, USA, EGU General Assembly 2026, Vienna, Austria, 3–8 May 2026, EGU26-8089, https://doi.org/10.5194/egusphere-egu26-8089, 2026.

EGU26-8617 | Posters on site | BG3.36

Continuous monitoring of rice responses to elevated temperature and CO2 in a T-FACE experiment using tower-based hyperspectral observation 

Qian Zhang, Chuang Cai, Xiaojie Wang, Zhengjun Wang, and Lian Song

The global atmospheric CO₂ concentration and the surface temperature keep rising since the industrial era. This ongoing change profoundly affects crop photosynthesis and yield formation. Therefore, accurately and timely monitoring the combined effects of elevated CO₂ (eCO₂) and warming on crop production is of great scientific and practical importance. In recent years, the development of continuous spectral observation technology, which captures a range of vegetation indices (VIs) and the solar-induced chlorophyll fluorescence (SIF) signal, has provided a new approach for vegetation dynamic monitoring. However, the responses and underlying mechanisms of SIF and various vegetation indices to the interactive effects of eCO₂ and warming remain unclear.

This study investigates the responses of two rice cultivars, Ningxianggeng (NXG) and Yongyou (YY), to elevated CO₂ (C⁺) and warming (T⁺), both individually and in combination, using a T‑FACE system in Nanjing, Jiangsu Province. The experiment included four treatments: ambient control (CT), elevated CO₂ (C⁺T), warming (CT⁺), and combined elevated CO₂ and warming (C⁺T⁺). Continuous canopy spectral observations, covering both full‑range (400–1000 nm) and hyperspectral (650–800 nm) measurements, were integrated with key physiological parameters such as net photosynthetic rate (Aₙ), biomass, and yield.

SIF proved to be a more sensitive and earlier indicator of photosynthetic dynamics than VIs. Under elevated CO₂ alone (C⁺T), SIF increased in both cultivars, reflecting a clear CO₂ fertilization effect. The interaction with warming (C⁺T⁺), however, revealed a diurnal dual effect: SIF was higher in C⁺T⁺ than in C⁺T during the morning, but slightly lower in the afternoon, indicating the complex effects of temperature on modulating photosynthetic activity. YY generally exhibited higher photosynthetic capacity than NXG across treatments, with a marked afternoon enhancement (up to 40%) under C⁺T⁺ during certain growth stages, though this advantage varied seasonally. In contrast, NXG showed a stronger positive response in photosynthetic efficiency under the combined C⁺T⁺ treatment. The Photochemical Reflectance Index (PRI) indicated that light‑use efficiency (LUE) declined at midday during periods of sustained high temperatures (mid‑July to early August), particularly for NXG under C⁺T, while YY under C⁺T⁺ maintained relatively higher LUE, suggesting a greater warming tolerance in YY.

The approach by integrating SIF with multiple VIs may provide a robust methodology for rapid, non‑invasive assessment of cultivar‑specific climate adaptability, offering valuable insights for precision agriculture management and climate‑resilient breeding strategies that deserve further investigation.

How to cite: Zhang, Q., Cai, C., Wang, X., Wang, Z., and Song, L.: Continuous monitoring of rice responses to elevated temperature and CO2 in a T-FACE experiment using tower-based hyperspectral observation, EGU General Assembly 2026, Vienna, Austria, 3–8 May 2026, EGU26-8617, https://doi.org/10.5194/egusphere-egu26-8617, 2026.

EGU26-10342 | Posters on site | BG3.36

Differences in nonstructural carbohydrates use and radiocarbon ages between fine roots, coarse roots, and stems 

Boaz Hilman, Juliane Helm, Ernst-Detlef Schulze, Tamás Varga, Jan Muhr, Henrik Hartmann, and Susan Trumbore

Radiocarbon measurements indicate that nonstructural carbohydrates (NSCs) in trees can be decades old. The NSCs can be critical resource during ecological disturbances that impede carbon assimilation, however, it is unclear to what degree old NSCs are accessible to tree metabolism and growth, or how their allocation and use differ between above- and belowground. To address these knowledge gaps, we girdled the stems of 60–70-year-old aspen trees, a species which can grow in clones and establish root connections with neighboring trees. During the first years after girdling (2018–2021), the girdled tree stems contained six times less NSC than the controls, respired at a rate five times slower, and increasingly used older carbon for respiration, reaching 10 years old by 2021 (Helm et al., 2024). Although most root sampling took place later, during 2021–2023, the roots’ response to the girdling was much milder. In cross sections of roots > 10 cm in diameter in 2022, the girdled trees had two to three times less NSC and NSC that was 8–14 years older than the controls. Individual NSCs showed inverted trends along the annual rings: the oldest sugars (as estimated by water-soluble carbon) were found in the bark and outer rings, whereas the oldest starch was found in the interior rings. Some rings contained NSCs aged 20–30 years. In fine roots (less than 2 mm in diameter), compared to the controls, the girdled trees contained half of the NSC, respired 30% slower while emitting 1–5 years older CO₂, and contained 1–6 years older NSC. In contrast to these relatively young ages, fine roots collected from screens buried in the soil for up to one year – probably representing growth from spring and early summer – had radiocarbon ages of 16–33 years with no clear effect of girdling. Overall, the NSC pools in the tree stems depleted faster than those in the large coarse and fine roots, suggesting either that the root NSCs were replenished by carbon from neighboring trees or that the tree stems play a more significant role in storage at the tree level. The extremely old radiocarbon ages of new fine roots suggest that old reserves in large roots are accessible and have a physiological function, even in undisturbed trees.


Helm, J., Muhr, J., Hilman, B., Kahmen, A., Schulze, E. D., Trumbore, S., Herrera-Ramirez, D., & Hartmann, H. (2024). Carbon dynamics in long-term starving poplar trees-the importance of older carbohydrates and a shift to lipids during survival. Tree Physiol, 44(13), 173-185. https://doi.org/10.1093/treephys/tpad135

How to cite: Hilman, B., Helm, J., Schulze, E.-D., Varga, T., Muhr, J., Hartmann, H., and Trumbore, S.: Differences in nonstructural carbohydrates use and radiocarbon ages between fine roots, coarse roots, and stems, EGU General Assembly 2026, Vienna, Austria, 3–8 May 2026, EGU26-10342, https://doi.org/10.5194/egusphere-egu26-10342, 2026.

EGU26-10605 | ECS | Orals | BG3.36

Interactions between genetics and the environment determine tolerance to ash dieback disease in an ecosystem model 

Carmen Watkins, Dheeraj Rathore, Jie Huang, Ricardo Pimenta, Sebastian Fuchs, and Silvia Caldararu

Pathogens, insects, and parasites (PIPs) are a common disturbance in many forest ecosystems that lead to reduced tree growth and increased mortality over time. While native PIPs can be key to maintaining biodiversity, PIP outbreaks are becoming more common and devastating to forests in a changing climate. Outbreaks of invasive PIPs pose a particular risk as host trees may have no evolved defences. Process based models are ideal for studying and predicting forest responses to disturbance as they can be used to test hypotheses about processes, test conditions that are challenging to experimentally create, and can inform further experimentation. PIPs have been incorporated in some forest ecosystem models to determine the effects of a PIP on tree growth and mortality. However, the host response to PIPs, including defences that lead to resistance or tolerance of a particular pest, have not been represented in process-based models, despite their demonstrated role in determining the resulting severity of PIP impacts on tree growth and mortality. Modelling both sides of the host-PIP interaction will provide more accurate forecasts of tree mortality and growth in the face of disturbance and allow us to test hypotheses about host defence processes and tolerance to disease. We develop a process-based model to quantify the impacts of pathogen infection on tree growth and function, while incorporating host defence and tolerance mechanisms, to simulate the effects of the widespread invasive pathogen, Hymenoscyphus fraxineus, on ash (Fraxineus excelsior) across Europe. H. fraxineus, is the causal agent of ash dieback disease that has led to the steep decline of native ash trees in Ireland, UK and Europe, killing up to 85% of trees in some areas. A small percentage of trees are genetically tolerant to the disease, but tolerance levels are variable and environmental conditions, tree age, and pathogen load may all further influence the level of susceptibility. Combining the model with ash tree trial data, we show that disease tolerance has a genetic component, but even among genetically tolerant trees, high disease pressure in wet environments may outweigh genetic tolerance. Further the effects of the environment and site characteristics on disease severity are mediated primarily through effects on pathogen abundance rather than tree growth. In addition to providing insights into drivers of ash dieback tolerance, our study showcases the power of process-based models combined with field trial and genetic data to reveal aspects of plant function that cannot be inferred from data alone.


How to cite: Watkins, C., Rathore, D., Huang, J., Pimenta, R., Fuchs, S., and Caldararu, S.: Interactions between genetics and the environment determine tolerance to ash dieback disease in an ecosystem model, EGU General Assembly 2026, Vienna, Austria, 3–8 May 2026, EGU26-10605, https://doi.org/10.5194/egusphere-egu26-10605, 2026.

Alpine shrublines are assumed to be highly sensitive to climate change and play a vital role in maintaining biodiversity and ecosystem functions. However, where and how alpine shrublines are distributed is poorly understood due to the difficulty in distinguishing between dwarf shrubs and grass. In this study, we proposed a novel framework to map alpine shrublines in Xizang Rezhen National Forest Park in 2020 using multi-source spatial data, probabilistic vegetation mapping, and seed-filling algorithm. Validation against high-resolution Google Earth imagery demonstrated a high accuracy, with a mean absolute error (MAE) of 3.13 m and R² of 0.99. The results indicated that the average elevation of alpine shrublines was about 4,873 m, ranging from 4,518 m to 5,195 m. South-facing alpine shrublines averaged approximately 145 m higher than north-facing counterparts. Meanwhile, shrublines at higher elevations exhibited lower EVI2 and NDVI values along with reduced soil quality compared to those at lower elevations. This study reveals geographical influencing factors of alpine shrubline patterns, thus offering insights into the ecological responses of high-altitude woody ecosystems to climate change.

How to cite: Ren, Z., Zhang, L., Wang, Q., Hu, W., and Shi, Z.: A novel framework for assessing shrublines and their geophysical constraints in alpine regions through probabilistic vegetation mapping and seed-filling algorithm, EGU General Assembly 2026, Vienna, Austria, 3–8 May 2026, EGU26-10840, https://doi.org/10.5194/egusphere-egu26-10840, 2026.

EGU26-11208 | ECS | Orals | BG3.36

Extreme heat-stress events rapidly alter soil microbial carbon use efficiency and nutrient cycling 

Emily C. Cooledge, Charlie J. Davis, David R. Chadwick, and Davey L. Jones

Extreme weather events, such as heatwaves, can disrupt biogeochemical cycling at a regional and global scale, leading to devastating environmental and socioeconomic impacts across the agrifood system. Previous studies exploring extreme heat-stress events rarely exceed 35 °C or have replicated global surface air temperature models where soils are subjected to mean annual temperature (MAT) ± 1.5 to 5 °C. However, this overlooks the rapid, short-term temperature extremes where soil surfaces heated by solar irradiation can reach >40 °C, exceeding the microbial thermal optima.

This study replicated heatwave conditions recorded in July 2025 in North Wales, UK, where bare, unshaded soil surface temperature reached up to 59.7 °C. Using 14C-radioisotope tracing, we explored the impact of varying duration (15-minutes to 7-days) of extreme heat-stress and thermal diffusion within the upper soil profile (0-5 cm) on microbial carbon (C) cycling, carbon use efficiency (CUE), and biogeochemistry.

We found that 14C-glucose mineralisation rapidly increased 1.5- to 2-fold from 37 ± 1 % in the control (20 °C) to 44-77 % in soils subjected to 59.7 °C for >1-hour, with a noticeable lag-phase in C cycling occurring in the first 8-hours following 14C-glucose addition. This subsequently reduced microbial CUE at a rate of 0.01 units min-1 from 0.62 ± 0.01 (control) to 0.19 ± 0.01 after 2-hours exposure to extreme heat, after which no further decline occurred. Soil pH and extractable ammonium increased with heat exposure due to nitrification inhibition, with microbial biomass C decreasing stepwise (from 2.36 ± 0.15 to 0.63 ± 0.06 g C kg-1) with increasing heat-stress duration. Notably, after a 14-day recovery period these trends still occurred, indicating that the critical temporal threshold reached (>1-hour) has a legacy effect on microbial activity and soil nutrient cycling, with implications for soil C sequestration.

How to cite: Cooledge, E. C., Davis, C. J., Chadwick, D. R., and Jones, D. L.: Extreme heat-stress events rapidly alter soil microbial carbon use efficiency and nutrient cycling, EGU General Assembly 2026, Vienna, Austria, 3–8 May 2026, EGU26-11208, https://doi.org/10.5194/egusphere-egu26-11208, 2026.

EGU26-11799 | ECS | Posters on site | BG3.36

Integrating ground observations and remote sensing to assess Swiss forest growth over the past 25 years 

Yunpeng Luo and Arthur Gessler

Drought- and heat-induced tree mortality has been increasingly observed and is expected to intensify under ongoing climate change, raising urgent concerns about forest vulnerability across Europe. Identifying the forest ecosystems most susceptible to climate extremes and understanding the mechanisms underlying their responses are therefore critical. Here, we integrate multiple hydrological and satellite-based proxies of large-scale forest growth with long-term ground-based forest monitoring data across Switzerland. From 2000 to 2024, hydrological stress, quantified by the Standardized Precipitation Evapotranspiration Index (SPEI), has increased consistently across the country. In contrast, vegetation structure (represented by Normalized Difference Vegetation Index, NDVI) and carbon uptake (represented by gross primary productivity, GPP) exhibit coherent but spatially contrasting trends, with pronounced declines in northwestern regions and increasing trends in the southeastern Alpine areas. Ground-based observations corroborate these patterns, showing higher crown defoliation rates, stronger declines in net primary productivity, and reduced tree growth in areas characterized by decreasing NDVI and GPP, while tree mortality rates remain comparable across regions. Species-specific responses were also evident, with European beech exhibiting increasing growth trends, whereas other dominant Swiss tree species show overall growth declines in recent decades. By jointly analyzing these patterns with environmental drivers, including meteorological factors and soil conditions, we aim to identify the dominant forcing mechanisms driving forest growth stress and to develop models for predicting forest GPP in Switzerland. We further quantify how interacting environmental stressors, such as vapor pressure deficit and soil water availability, jointly regulate forest productivity dynamics, providing an integrated assessment of forest vulnerability to climate extremes.

How to cite: Luo, Y. and Gessler, A.: Integrating ground observations and remote sensing to assess Swiss forest growth over the past 25 years, EGU General Assembly 2026, Vienna, Austria, 3–8 May 2026, EGU26-11799, https://doi.org/10.5194/egusphere-egu26-11799, 2026.

Phenotypic plasticity is essential for plant adaptation to environmental change and competition, yet the mechanisms that constrain or enhance it remain unclear. In alpine tundra ecosystems experiencing rapid climate change, we examined how phenotypic integration and within-environment trait variation jointly shape plasticity in the invasive herb Deyeuxia angustifolia and the native shrub Rhododendron aureum. Along an elevation (2050–2200 m) and encroachment gradient on Changbai Mountain, we measured 42 functional traits to assess whether integration limits plasticity, how this relationship is mediated by within-environment variation, and how trait relationship influences these dynamics. We found that in D. angustifolia, synergistic trait networks—characterized by high edge density, unique correlations, and a predominance of positive interactions—enhanced plasticity, whereas in R. aureum, trade-off–dominated networks imposed structural constraints that limited plasticity. Within-environment trait variation was the primary driver of plasticity in both species, with a stronger influence in D. angustifolia, particularly at higher elevations. This variation enabled D. angustifolia to exploit micro-environmental heterogeneity more effectively, while R. aureum’s limited variation and trade-off constraints reduced its adaptive capacity. Our results reveal that the combination of high trait variation and synergistic integration confers D. angustifolia a competitive advantage, facilitating its upward encroachment. In contrast, R. aureum’s restricted plasticity may hinder its persistence under ongoing environmental change, highlighting the importance of trait network structure and within-environment trait variation in shaping species responses to global change.

How to cite: Li, N.: Phenotypic integration predicts phenotypic plasticity in the invasive species Deyeuxia angustifolia but not the native shrubby species Rhododendron aureum, EGU General Assembly 2026, Vienna, Austria, 3–8 May 2026, EGU26-11994, https://doi.org/10.5194/egusphere-egu26-11994, 2026.

EGU26-12181 | Posters on site | BG3.36

Predictability of the biological activity of a sandy grassland under optimal and stress conditions  

Szilvia Fóti, Giulia De Luca, Gabriella Süle, Péter Koncz, Krisztina Pintér, Zoltán Nagy, and János Balogh

The biological activity of a sandy pasture was quantified and modeled by integrating multiple categories of attributes and reducing the set of explanatory variables to the smallest subset with a highly statistically significant influence on the response variable. The attribute groups consisted of terrain-related factors (surface heterogeneity, altitudinal difference, topographic position index, etc.), soil properties (soil carbon, soil moisture, etc.), meteorological conditions (e.g., air temperature and precipitation), botanical characteristics (species abundance and diversity metrics), reflectance-based variables (vegetation indices), and physiological activity-related indicators (leaf area index, gross primary production). The datasets were collected from a one-ha spatial grid with a 10 m × 10 m resolution. The data collection spanned 10 occasions during the vegetation periods from autumn 2016 to autumn 2019.

Vegetation biological activity exhibits strong sensitivity to variability in both biotic and abiotic drivers, and species richness represents a key determinant of grassland response capacity. To quantify these processes, we constructed a composite variable that integrated below-ground functioning (derived from soil respiration measurements), above-ground productivity (based on above-ground biomass values), and the diversity of the sandy pasture. This composite metric was termed the biological activity factor (BF). To account for interannual and seasonal variability, all components of BF were rescaled before aggregation.

To gain a deeper insight into the key factors responsible for BF prediction and predictability, the upper and lower quartiles of the BF were modeled separately. This approach enabled the identification of the key drivers determining the biological activity of the vegetation under optimal (upper BF quartile) and stressed (lower BF quartile) conditions. We used linear and generalized additive models (GAMs) to estimate BF quartiles employing a reduced set of explanatory attributes selected through stepwise procedures based on statistical significance. 

How to cite: Fóti, S., De Luca, G., Süle, G., Koncz, P., Pintér, K., Nagy, Z., and Balogh, J.: Predictability of the biological activity of a sandy grassland under optimal and stress conditions , EGU General Assembly 2026, Vienna, Austria, 3–8 May 2026, EGU26-12181, https://doi.org/10.5194/egusphere-egu26-12181, 2026.

EGU26-13722 | ECS | Posters on site | BG3.36

Carbon storage in banana – a key trait under stress? 

Mathilde Vantyghem, Laura Peraire-Brudey, Régis Ramassamy, Kelly Lakhia, and Gaëlle Damour

Banana (Musa sp.) is the most important fruit worldwide, as well as a major food crop. It is a semi-perennial herb that reproduces vegetatively through suckers. After bunch formation, the main banana plant senesces and the sucker forms the start of the next cycle. The belowground corm and the aboveground pseudostem are hypothesized to function as carbon storage organs supplying energy for fruit and sucker growth, particularly under stress. However, neither the existence of such reserves nor their role under stress has been experimentally confirmed. Accordingly, a field experiment was initiated in Guadeloupe (Caribbean) with a twofold objective: to quantify carbon storage and remobilization throughout the banana growth cycle and to assess its potential role under stress. More specifically, we evaluated the impact of stress caused by Black Sigatoka disease, one of the most important biotic limitations to banana production worldwide and the number one constraint in the region. The disease, as well as its management (sanitary leaf removal) causes a substantial reduction in source strength. We hypothesize that carbon reserves become particularly important under stress causing carbon depletion, as can be deducted indirectly from research on drought stress. Two banana varieties (Cavendish (AAA) and Big Ebanga (AAB)) were subjected to two contrasting leaf removal treatments (minimal and severe de-leafing). De-leafing, as well as leaf surface measurements were carried out on a weekly basis. Corm samples were taken at six predetermined times during the plant cycle, using a tree increment borer. During the vegetative phase and during fruit filling, four plants per treatment were furthermore destroyed for pseudostem sampling and in order to assess biomass allocation between leaves, pseudostem, corm, sucker and fruit. NSC (non-structural carbon) content of corm and pseudostem samples were determined through alcohol and enzymatic extraction, followed by spectrophotometric quantification. This is the first study focusing on carbon storage in banana and its potential role under stress. As climate change is expected to exacerbate a wide range of biotic (Black Sigatoka, Fusarium wilt) and abiotic (drought, heat) stresses, it is critical we gain insight into the role of carbon reserves in the banana plants' stress response. 

How to cite: Vantyghem, M., Peraire-Brudey, L., Ramassamy, R., Lakhia, K., and Damour, G.: Carbon storage in banana – a key trait under stress?, EGU General Assembly 2026, Vienna, Austria, 3–8 May 2026, EGU26-13722, https://doi.org/10.5194/egusphere-egu26-13722, 2026.

EGU26-13728 | ECS | Posters on site | BG3.36

The Influence of Slow-Moving Landslides on Soil Carbon Recovery: Decoupling Soil Organic Carbon and CO₂ Fluxes 

Kirill Grachev, Thomas Glade, and Stephan Glatzel

Soils store a considerable amount of global carbon. Landslides, meanwhile, impair the soil’s ability to store carbon by disturbing vegetation and removing organic soil layers. In this context, it is becoming increasingly important to account for post-failure soil carbon recovery, and more specifically, for both structural and functional components of soil carbon recovery. We hypothesise that soil CO₂ efflux follows soil organic carbon content during post-event recovery. However, field evidence is still scarce, particularly regarding soil carbon recovery mechanisms and CO₂ efflux dynamics in slow-moving post‑landslide systems in temperate grasslands. This study compares soil organic carbon and CO₂ effluxes in post-failure and non-failure slow-moving landslides and suggests potential sources of carbon inputs in landslide-susceptible pre-Alpine managed grasslands.


To achieve this, we conducted two years of observations in control areas and slow-moving landslide areas that experienced a large landslide event in 2013 and have since exhibited slow creep with varying dynamics. Monthly monitoring includes land displacement velocities derived from manual and automatic inclinometer measurements, UAV surveys, greenhouse gas sampling, vegetation parameters, and land-use activity. Additionally, we collected a number of physico-chemical soil characteristics such as soil texture and structure, soil nitrogen and carbon properties, soil pH and electrical conductivity. All of this enabled us to analyse the recovery of CO₂ fluxes and soil organic carbon under different landslide conditions.


We found that CO₂ fluxes in the post-failure area recovered to 39% over a decade, which is slower than in lower-latitude regions. However, soil organic carbon recovered even more slowly, reaching only 17% relative to other slow-moving landslide areas and 25% relative to the control site. This divergence between CO₂ effluxes and soil organic carbon recovery dynamics is consistent with current literature. Our observations reveal a clear decoupling between CO₂ fluxes and SOC, suggesting that functional recovery may precede structural carbon recovery; we assume that CO₂ effluxes are influenced mostly by inputs of dissolved and labile organic carbon via surface and groundwater runoff. These findings may have implications at the global scale, given the thousands of landslides occurring worldwide each year and their potential influence on the global carbon cycle. Moreover, highlighting the distinct roles of structural and functional components of soil carbon recovery could support the development of more robust approaches to assess the soil carbon recovery trajectories and management strategies for post-event landslide areas.

How to cite: Grachev, K., Glade, T., and Glatzel, S.: The Influence of Slow-Moving Landslides on Soil Carbon Recovery: Decoupling Soil Organic Carbon and CO₂ Fluxes, EGU General Assembly 2026, Vienna, Austria, 3–8 May 2026, EGU26-13728, https://doi.org/10.5194/egusphere-egu26-13728, 2026.

EGU26-14075 | Posters on site | BG3.36

Integrated Proximal Sensing and Ground-Based observations for drought and heat stress monitoring in a Mediterranean holm oak savanna 

Arnaud Carrara, Luis Alonso, Javier Pacheco-Labrador, Vicente Burchard-Levine, and M. Pilar Martin

We enhance the observation capabilities of existing high-grade ICOS flux tower site by implementing continuous proximal remote sensing and tree scale measurements to build a unique integrated multiscale, high frequency (10-30 min) observational system to address critical knowledge gap regarding how Mediterranean tree species respond and recover from climate extremes such as compound heat and water stress. This issue is particularly relevant for Quercus ilex, the dominant species in Mediterranean area, which combines drought tolerance with limited understanding of its threshold responses to stress.

The main objective is to explore the potential of these combined observations in monitoring and understanding the mechanistic processes that regulate the functional response of Mediterranean holm oak open woodlands to heat and water stress, where structural heterogeneity and fast stress responses remain poorly captured by current limitations of remote sensing based Earth Observation systems (medium spatial resolution, revisit frequencies of days to weeks) and by standard monitoring approaches, insufficient to capture short-term adaptive physiological responses occurring at hourly or minute timescales, such as stomatal closure, water transport regulation, photoprotective mechanisms, and xanthophyll cycle dynamics.

The flux tower and related infrastructure deliver continuous ecosystem scale measurements of turbulent fluxes of energy, evapotranspiration (ET) and CO2 (NEE, GPP), together with a comprehensive suite of meteorological variables and enhanced dense soil water observations (i.e. multiples soil water content and soil water potential profiles), complemented by point dendrometers, micro-tensiometers and sap flow measurements providing detailed information on tree water status and water transport dynamics at tree scale, and an innovative integration of state-of-the-art proximal remote sensing techniques: Thermal Infrared Imaging (TIR) coupled to a multispectral camera to resolve spatial patterns of vegetation surface temperature variations; Short-Wave Infrared Spectroscopy (SWIR) with novel Fabry-Perot micro-spectrometers for monitoring vegetation water content; Sun-Induced Fluorescence (SIF) and Visible-NIR Reflectance via FLOX system to distinguish active photosynthesis from photoprotective responses; and LED-Induced Fluorescence (LEDIF) to measure basal photosynthetic state and plant recovery.

In addition to provide comprehensive information to assess physiological and functional vegetation response to drought and heat stress, the integrated observational dataset is foreseen to be used for: (i) improving TSEB/3SEB evapotranspiration models to better characterize hydraulic and physiological constraints on water and energy fluxes and to enhance model performance; (ii) contribute to FLuorescence EXplorer (FLEX) mission Cal/Val activities by testing upscaling strategies in heterogeneous dehesa ecosystems within SPAFLEX project.

How to cite: Carrara, A., Alonso, L., Pacheco-Labrador, J., Burchard-Levine, V., and Martin, M. P.: Integrated Proximal Sensing and Ground-Based observations for drought and heat stress monitoring in a Mediterranean holm oak savanna, EGU General Assembly 2026, Vienna, Austria, 3–8 May 2026, EGU26-14075, https://doi.org/10.5194/egusphere-egu26-14075, 2026.

Long-term fertilization alters plant traits and is widely thought to reduce grassland drought resilience. While these effects are often attributed to species turnover, trait responses can also arise within species, through phenotypic plasticity and evolutionary divergence among populations. However, whether intraspecific evolutionary changes in response to long-term fertilization alter ecosystem responses to drought remains poorly understood. Here, using the >100-year Park Grass Experiment (UK), we tested whether long-term fertilization has led to heritable trait divergence and altered drought resilience in a dominant grass species. We collected 20 genotypes of Anthoxanthum odoratum from each of two fertilized plots and control plots and grew them under common garden conditions to isolate genetic differentiation from phenotypic plasticity in plant traits. Plants were then subjected to a two-week simulated drought followed by two weeks of recovery, during which CO2 fluxes were measured. We found that genotypes originating from fertilized plots showed higher vegetative and reproductive height compared to those from control plots, indicating heritable divergence after a century of nutrient enrichment. Nevertheless, drought resilience of CO2 fluxes, including drought resistance and recovery, did not differ among genotypes from different plots. Across all genotypes, drought recovery was positively associated with shoot biomass, root tissue density, and root diameter, but negatively associated with reproductive height. Our findings reveal that long-term fertilization can drive evolutionary shifts in plant height-related traits without affecting intrinsic drought resilience, highlighting a decoupling between evolutionary responses to nutrient enrichment and functional responses to climate extremes. This underscores the need to integrate eco-evolutionary processes into predictions of ecosystem responses to global change.

How to cite: Jing, Y., Davison, J., and Semchenko, M.: Long-term fertilization drives genetic trait differentiation without changing intrinsic drought resilience in grassland populations, EGU General Assembly 2026, Vienna, Austria, 3–8 May 2026, EGU26-14405, https://doi.org/10.5194/egusphere-egu26-14405, 2026.

EGU26-14803 | ECS | Orals | BG3.36

Effects of Wildfire on Nitrogen and Phosphorus Availability in Arctic Tundra Soils 

Camille Jones, Léa Cornette, Oliver Sonnentag, and Christian von Sperber

The Arctic is warming faster than the rest of the globe, leading to intense disturbances including permafrost thaw, thermokarst development, and wildfire. These disturbances alter rates of biogeochemical cycling of nitrogen (N) and phosphorus (P), further altering the ecology and permafrost dynamics of the region. My goal is to understand the effects of wildfires on soils and plants in the western Canadian Arctic tundra. Ash is high in available nutrients which promote plant growth immediately after fire, but may increase N and P loss after fire. In tundra ecosystems, nitrate and ammonium concentrations are particularly low, meaning that an increase in concentrations of these nutrients after a wildfire can have a particularly large effect on biological activity. Not all plant species are equally able to take advantage of the pulse of nutrients available after a wildfire; some will have an advantage over others. Large woody shrubs can outcompete smaller evergreen shrubs, lichens, and mosses during the recovery period, which  increases the amount of above-ground biomass and thus the risk of future wildfires. This may result in a positive feedback loop where wildfire increases shrub growth and shrub growth increases wildfire risk, leading to major changes in plant species and biogeochemical cycles in the ecosystem. I examine whether wildfire can be a realistic mechanism for providing the nutrients necessary for shrub growth, leading to permanent changes in the tundra ecosystem.

To study the effects of fire on plants and soil nutrients, I collected soil and vegetation samples from five burned sites and one unburned control site near Inuvik, Northwest Territories, during the summer of 2024. Tunda fires occurred in 1968, 1983, 2003, 2012, and 2023. In the field, I measured the active layer depth, soil temperature, soil moisture, and plant community composition. In the laboratory, I measured available phosphate, nitrate, and ammonium concentrations in soils through wet chemical extraction, measured heavy metal concentrations using X-ray fluorescence (XRF), measured microbial phosphate concentrations, performed sequential phosphate fractionation to measure a gradient of phosphorus availability, and measured basic soil parameters such as soil texture, gravimetric soil moisture, soil organic carbon content, and soil pH.

This work is necessary to understand the future of tundra ecosystems in a changing climate. At present, carbon emissions due to permafrost thaw and potential carbon uptake by increased plant growth in the tundra are poorly understood and must be quantified if we are to understand the carbon budget of the circumpolar Arctic-boreal region. As such, my work will inform terrestrial biosphere models. Of greater local importance is the future of culturally relevant tundra plant species and the future of ecosystem services that determine the identity and livelihoods of local communities.

How to cite: Jones, C., Cornette, L., Sonnentag, O., and von Sperber, C.: Effects of Wildfire on Nitrogen and Phosphorus Availability in Arctic Tundra Soils, EGU General Assembly 2026, Vienna, Austria, 3–8 May 2026, EGU26-14803, https://doi.org/10.5194/egusphere-egu26-14803, 2026.

EGU26-15828 | Orals | BG3.36

Effective soil incubations for studying nitrogen cycling in permafrost soils — practical and ecological considerations 

Maija E. Marushchak, Wasi Hashmi, Paula Martínez-Risco Martínez, Carlos Palacin-Lizarbe, Dhiraj Paul, Lukas Kohl, and Jenie Gil

Soil nitrogen (N) cycling and nitrous oxide (N2O) production and consumption dynamics have received relatively little attention in Arctic biogeochemistry, largely because of the classical understanding of general N limitation and negligible N gas losses. Now, this understanding is becoming outdated by recent studies, which have revealed active N cycling in permafrost-affected soils by looking into processes and habitats previously ignored and possibly also because of actual intensification of soil N cycling with warming and permafrost thaw. Since enhanced N availability versus N limitation is of crucial importance for future carbon balance and ecosystem-climate feedback in the rapidly warming Arctic, there is a dire need for more information on N cycling in permafrost soils. Soil incubations can be used to study N turnover rates in controlled conditions and to tease apart various processes, but they need to be well designed to realistically represent the soil N cycle in its full complexity.

Here, we summarize our experience from N cycling studies by soil incubations over the years, with an emphasis on the ongoing Thaw-N project which investigates the fate of permafrost N following thaw. We give our suggestions for the balancing act between simple experiments that can be easily conducted over large numbers of samples to improve spatial representativeness, and detailed experiments with advanced methods to uncover the actual rates of individual processes and link them with microbial activities. . Our experience highlights the role of microbial versus substrate limitation in shaping the soil N cycle as time passes following disturbances, such as permafrost thaw. We also discuss the special challenges of studying N2O production in comparison to the other, more commonly studied greenhouse gases carbon dioxide and methane.

How to cite: Marushchak, M. E., Hashmi, W., Martínez-Risco Martínez, P., Palacin-Lizarbe, C., Paul, D., Kohl, L., and Gil, J.: Effective soil incubations for studying nitrogen cycling in permafrost soils — practical and ecological considerations, EGU General Assembly 2026, Vienna, Austria, 3–8 May 2026, EGU26-15828, https://doi.org/10.5194/egusphere-egu26-15828, 2026.

EGU26-16298 | ECS | Posters on site | BG3.36

Geomorphic Disturbance as a Driver of Species Phenotypic Plasticity, Vegetation Cover, and Biodiversity in High-Elevation Belts 

Katharina Ramskogler, Sofia Castlunger, Sarah Kinzner, and Erich Tasser

Climate change imposes increasing stress on ecosystems worldwide through rising temperatures, altered precipitation regimes, and more frequent extreme events. In high-elevated environments, these pressures are often compounded by geomorphological disturbances, which represent a major stress factor shaping vegetation dynamics and biodiversity. Understanding how plant traits and functional diversity respond to such disturbances is therefore essential for predicting ecosystem responses to ongoing environmental change.

In this study, we investigated how geomorphic disturbance influences plant functional traits and biodiversity along elevational gradients in subalpine to alpine ecosystems. We hypothesised that: (i) disturbance-driven differences in species composition leads to functional differentiation at the community level, (ii) disturbance acts as a stressor inducing intraspecific variability in functional traits, and (iii) the proportion of thermophilic species increases on disturbed plots, particularly at higher elevations. Across three study sites, we sampled the five most abundant species per plot to test the interspecific variability as well as the three most frequent species shared across plots to test the intraspecific variability along elevation gradients. Key plant functional traits (leaf area, leaf dry weight, SLA, plant height) were measured and analysed using t-tests and non-parametric statistical approaches. For explaining the differences found Generalise Additive Models were performed.

Our results showed that, at the community level, only Specific Leaf Area (SLA) differed significantly between disturbed and undisturbed plots for the five most common species (interspecific variability). Furthermore, we could observe significant differences for the relative cover of bryophytes, lichens, dwarf shrubs, and trees. For herbs and graminoids the climate-induced growth (RC1) and the improved edaphic conditions (RC2) revealed to be more important. At the species level, disturbance-related stress led to significant intraspecific trait variability in several species, highlighting flexible trait responses under changing environmental conditions. Contrary to our expectations, the proportion of thermophilic species was consistently lower on disturbed plots compared to undisturbed plots across the entire elevational gradient, although it decreased with elevation in both plot types as expected.

Overall, differences in SLA likely reflect shifts in functional group composition under disturbance stress. Observed intraspecific trait variability along abiotic and disturbance gradients provides valuable insight into the capacity of alpine plant species to adjust their morphology and physiology in response to environmental stress, with important implications for biodiversity and ecosystem resilience under climate change.

How to cite: Ramskogler, K., Castlunger, S., Kinzner, S., and Tasser, E.: Geomorphic Disturbance as a Driver of Species Phenotypic Plasticity, Vegetation Cover, and Biodiversity in High-Elevation Belts, EGU General Assembly 2026, Vienna, Austria, 3–8 May 2026, EGU26-16298, https://doi.org/10.5194/egusphere-egu26-16298, 2026.

Warming is expected to increase both soil organic matter decomposition and plant growth in alpine ecosystems, leading to an uncertain fate of soil carbon (C) stocks in these temperature-vulnerable ecosystems. There are very few empirical data over decadal timescales to address this uncertainty. Here, we conducted a 10-year warming experiment in which surface soil C stocks, together with C inputs (plant production) and outputs (microbial respiration), were measured each year under ambient and elevated temperatures in an alpine grassland. We observed that the decadal warming enhanced soil C stocks, particularly in the late stages of the experiments, due to warming-induced increases in plant C inputs. The increase in soil C stock was mainly due to the following three mechanisms. First, plant C input significantly increased under warming by shifting plant community composition towards grass dominance that had taller plant height and higher belowground productivity and allocation. The mechanisms were also related to the higher temperature optimum of grasses compared to non-grass species. Second, abundant precipitation and humid environments facilitated positive responses of ecosystem carbon uptake to warming. Third, ecosystem carbon fluxes showed optimal temperatures and were able to thermally adapt to climate warming, which benefit ecosystem carbon uptake. The above findings revealed the key response mechanisms of soil C stocks in alpine ecosystems to long-term climate change, enriched the understanding of the feedback relationship between the carbon cycle and climate change, and provided important parameters and experimental evidence for carbon cycle models.

How to cite: Niu, S.: Decadal warming-induced shifts in plant community composition and biomass allocation enhance alpine soil carbon accrual, EGU General Assembly 2026, Vienna, Austria, 3–8 May 2026, EGU26-16473, https://doi.org/10.5194/egusphere-egu26-16473, 2026.

EGU26-17045 | ECS | Posters on site | BG3.36

Influence of freeze-thaw cycles on natural colloids release of a forest soil 

Jay Carl Cacerez, Anne E. Berns, Jens Kruse, Lutz Weihermüller, and Nina Siebers

Freeze-thaw events (FTE) induce stress in the soil matrix, leading to the disruption of soil aggregates and consequently causing the release and mobilization of natural soil colloids. Hence, it is fundamental to understand the effect of FTE on the formation of natural soil colloids and colloid-facilitated transport of elements, especially nutrients such as P. In this study, the influence of FTE on natural colloids mobilized after precipitation was investigated. Therefore, columns were packed with 17 cm of disturbed forest topsoil. The soil columns were exposed to either ambient temperature throughout the experiment (control) or to freeze-thaw (FT) conditions, which involved 2 days of freezing at -14 °C followed by 1 day of thawing at ambient temperatures. The FT cycles were repeated five times. Leachate was collected from the columns a day after precipitation (or irrigation using artificial rainwater) after each FTE. Size-resolved elemental composition of colloids in the leachates was determined using Asymmetrical Flow Field-Flow Fractionation (AF4). Findings showed that FTE resulted in higher colloidal organic C (+135%) and P (+85%) loads in the leachates than the control at first FTE, and Fe (+37%) and Al (+67%) at the second FTE. Moreover, higher loads of the smaller colloidal Fe and Al were observed with FT than with the control at first and second FTE. For larger colloids, FT showed higher organic C and P than the control from the first to fourth FTE, and Ca, Mg, Mn, and Zn at the fourth FTE. In terms of bulk elemental load, FT released lower Ca, Mg, Mn, and Zn than the control at the second and third FTE. At the last FTE, higher cumulative colloidal Al (+122%) and P (+114%) were observed with FT than with the control. FT resulted in lower cumulative bulk load of Ca, Mg, Mn, and Zn than the control after the second FTE. Furthermore, colloidal Fe, Al, Ca, Mg, Mn, and Zn mainly consisted of smaller colloids, while larger colloids dominated colloidal P. The findings from this study suggest that repeated freeze-thaw cycles can increase mobilization of colloids and colloid-associated elements in the soil.

How to cite: Cacerez, J. C., Berns, A. E., Kruse, J., Weihermüller, L., and Siebers, N.: Influence of freeze-thaw cycles on natural colloids release of a forest soil, EGU General Assembly 2026, Vienna, Austria, 3–8 May 2026, EGU26-17045, https://doi.org/10.5194/egusphere-egu26-17045, 2026.

EGU26-18132 | Posters on site | BG3.36

Deciphering organic matter degradation in the continuous permafrost zone of Alaska based on biomarker analyses. 

Carolin Frauhammer, Fabian Seemann, Guido Grosse, Lutz Schirrmeister, Hanno Meyer, Gesina Mollenhauer, Torben Windirsch, and Jens Strauss

Permafrost regions are highly vulnerable to global warming, as they warm much faster and store large amounts of organic matter (OM), which makes them key to the carbon-climate-cycle. Thermokarst processes, and coastal erosion strongly reshape permafrost landscapes. As thermokarst lakes (TL) have been shown to release organic carbon due microbial decomposition, drained thermokarst lake basins (DTLBs) can sequester OM again due to the potential to reaggregate permafrost in a cold climate, though this potential will slow or not occur in a warming climate. Therefore, understanding these processes is key to predict future potential greenhouse gas (GHG) emissions.  

This study investigates the OM characteristics in such a TL-DTLBs landscape on the Baldwin Peninsula, located in the continuous permafrost zone of Alaska. A multiproxy approach of biogeochemistry, hydrochemistry, sedimentology and n-alkane biomarker analysis was used to investigate (1) the paleoenvironment of the landscape and (2) the characterization of the OM by its quantity, source and quality in terms of its degradation state, which is critical for mineralization processes and potential GHG release upon permafrost thaw. Four sediment cores were collected in 2024 along a transect representing multiple thermokarst stages, from an undisturbed permafrost upland through a thermokarst lake and a recently drained thermokarst basin to a nearshore marine environment.  

Our findings show a continuous Pleistocene deposition in a strongly aeolian regime, with the oldest sediments of > 50 cal. ka BP in the drained lake basin (50 – 150 cm b.s.l.). The sediments are generally of coarse silt,  and show with high water contents, and organic-rich layers typical characteristics of late Pleistocene Yedoma, while the deep layers show signs of an ancient fluvial environment and early Holocene thermokarst processes. Also, the biomarker analysis support a common terrestrial origin of the OM, indicating a secondary marine infiltration for the marine site, as well as a slightly aquatic influences, especially in the deeper layers, resulting from ancient thermokarst processes and the lake / marine phases. The carbon quantity decreases significantly from the upland to the marine site, with higher preserved OM in the taliks than in the perennial frozen layers (e.g. CPIthermokarst lake = 15.77 vs CPIupland = 8.08 in median).  

Due the high ice amount and carbon quality, the studied deposits reveal a strong vulnerability to continued warming and thus constitute a high GHG release potential. 

How to cite: Frauhammer, C., Seemann, F., Grosse, G., Schirrmeister, L., Meyer, H., Mollenhauer, G., Windirsch, T., and Strauss, J.: Deciphering organic matter degradation in the continuous permafrost zone of Alaska based on biomarker analyses., EGU General Assembly 2026, Vienna, Austria, 3–8 May 2026, EGU26-18132, https://doi.org/10.5194/egusphere-egu26-18132, 2026.

Climate change is intensifying environmental extremes, subjecting soil ecosystems to unprecedented and overlapping stressors. Yet the impact of such stressors on the mechanisms that protect soil carbon—the largest terrestrial carbon reservoir—remains poorly understood. In this presentation, I will explore how climatic extremes and their associated stressors impact carbon protection mechanisms in soils. Drawing on evidence from controlled model systems, climate manipulation experiments, and field studies, I will highlight how key stressors—including water and nutrient limitation, viral infection, and oxidative stress—alter the effectiveness of multiple carbon protection mechanisms. Together, our results highlight the immediate response of otherwise “protected” soil carbon to environmental stressors, underscoring the soil carbon persistence is not fixed, but dynamically regulated by environmental conditions. I will conclude by discussing the implications of these findings for predicting short- and long-term soil carbon dynamics in a rapidly changing climate.

How to cite: Keiluweit, M.: Feeling Stressed? How Soil Carbon Protection Mechanisms Respond to Climate Extremes, EGU General Assembly 2026, Vienna, Austria, 3–8 May 2026, EGU26-18219, https://doi.org/10.5194/egusphere-egu26-18219, 2026.

EGU26-18948 | ECS | Posters on site | BG3.36

Differences in reactive nitrogen availability and N2O production between active layer and ice-rich Yedoma permafrost 

Paula Martínez-Risco Martínez, Wasi Hashmi, Jens Strauss, Fabian Seemann, Carlos Palacín-Lizarbe, and Maija E. Marushchak

Warming of the Arctic is causing permafrost thaw and the acceleration of the nitrogen (N) cycle. Permafrost thaw releases previously unavailable organic N reservoirs that are now available for decomposition. This is expected to increase the availability of inorganic N, which may ultimately lead to enhanced emissions of nitrous oxide (N2O). This is particularly relevant for Yedoma, ice-rich permafrost sediments that store large amounts of N and are commonly found across large areas affected by permafrost. Despite the few previous studies investigating the effects of permafrost thaw on the N cycle and N2O emissions, there is still poor understanding of the difference in N dynamics between the active and permafrost layers during and after thaw.

Here, we address this knowledge gap by conducting a N cycling study using 3 intact soil cores collected across the Baldwin Peninsula in northwest Alaska. These 2-m-long cores include the active layer, the interface between the active layer and permafrost, and more than one meter of ice-rich Yedoma permafrost. The study consisted of N2O measurements during initial thawing of the soil, detailed depth profiling of extractable N, including ammonium (NH4+), nitrate (NO3-), and total dissolved N (DN), right after the thaw, and a soil incubation experiment at 5 oC to determine N2O production under oxic and anoxic conditions. Also, we included a treatment under anoxic conditions with acetylene inhibition to estimate the total denitrification, including N2. Furthermore, we amended the soil with NO3- under anoxic conditions to investigate potential N2O production and denitrification and to reveal possible NO3- limitation of these processes.

The permafrost layers presented an accumulation of NH4+ content compared to the active layer, whereas NO3- was only found in the active layer and in minimal amounts. The active layer had the highest potential denitrification rate in the presence of NO3- and acetylene, but showed very low or negligible N2O production when NO3- was not added. No N2O production was observed in the permafrost layers in any of the treatments, even with the addition of NO3- or NO3- and acetylene, indicating that denitrification is not occurring. We suggestthat this lack of N2O production and denitrification activity is due to microbial limitation. These results can help better understand the significance of permafrost N release during permafrost thaw to the Arctic ecosystem and its climate feedback.

How to cite: Martínez-Risco Martínez, P., Hashmi, W., Strauss, J., Seemann, F., Palacín-Lizarbe, C., and Marushchak, M. E.: Differences in reactive nitrogen availability and N2O production between active layer and ice-rich Yedoma permafrost, EGU General Assembly 2026, Vienna, Austria, 3–8 May 2026, EGU26-18948, https://doi.org/10.5194/egusphere-egu26-18948, 2026.

EGU26-19783 | ECS | Orals | BG3.36

Linking tree physiology, carbon fluxes, and root growth dynamics under constraining soil water and atmospheric treatments  

Marili Sell, Priit Kupper, Marian Klaus, Ain Kull, Aliya Sultonova, Gristin Rohula-Okunev, Mai Kukumägi, and Ivika Ostonen

Combining carbon flux measurements with tree above- and belowground phenology enables a holistic assessment of plant functioning and ecosystem carbon balance under future climatic conditions. The stress caused by rising air temperature and drought affecting the asynchrony in trees above- and belowground phenology might cost more than the carbon gains, weakening future forest carbon sinks. 

Norway spruce seedlings were grown in organic soils (drained Histosol) in climate chamber separately in transparent boxes for 13 weeks in 2023. Ten trees were grown under ambient conditions based on June-July 2021 data, which reflects long term average weather conditions in the Estonian forest. Another ten under low air relative humidity (-10% of ambient) and ten under high temperature (+6°C) treatment, whereas both treatments are equivalent to +30% increase in water vapor deficit. The treatment period lasted for 30 days, whereas half of the trees had 65% of soil moisture from field capacity and other half experienced drought (45%). The recovery period with ambient conditions lasted for 20 days. The ecosystem gas exchange (NEE, Rs) was measured in four key time points during the experiment; photosynthesis, other physiological parameters, shoot length and fine root area was measured weekly. Destructive measurements such as biomass and fine root carbon exudation was measured at the end of the experiment.

Elevated air temperature caused a stronger carbon sink, although there was an increase in soil respiration. However, in the recovery phase the ecosystem-level gas exchange decreased and reached the same level as the ambient condition indicating that some of the physiological changes were strongly tied to the changes in temperature conditions. Soil moisture was a critical constraint to reduced photosynthesis and diminished root relative growth rate highlighting water limitation as a dominant stressor for both carbon assimilation and belowground development. Interestingly, low humidity showed positive effects on fine root growth compared to elevated temperature (but only under 65% of soil moisture), perhaps indicating a compensatory carbon allocation to belowground biomass, which enhances water uptake under drier climate. Meanwhile the aboveground growth increased significantly only under high temperature. Other parameters, including fine root carbon exudation, will be discussed in the context of tree ecosystem carbon flux. 

How to cite: Sell, M., Kupper, P., Klaus, M., Kull, A., Sultonova, A., Rohula-Okunev, G., Kukumägi, M., and Ostonen, I.: Linking tree physiology, carbon fluxes, and root growth dynamics under constraining soil water and atmospheric treatments , EGU General Assembly 2026, Vienna, Austria, 3–8 May 2026, EGU26-19783, https://doi.org/10.5194/egusphere-egu26-19783, 2026.

EGU26-20348 | Posters on site | BG3.36

Effects of agrovoltaic shading on grapevine physiological status and stress responses 

Pablo A. Morales-Rodríguez, Jesús D. Peco, Jaime Villena, Concepción Atance, Jesús A. López-Perales, Pablo L. Higueras, and Marta M. Moreno

Agrovoltaics has been proposed as an innovative strategy to combine renewable energy production with agricultural activity, particularly in Mediterranean regions characterized by high solar radiation. In woody crops such as grapevine, the partial shading associated with these systems can modify the canopy microclimate and help mitigate the effects of excessive radiation on plant physiological status. However, information is still limited on how different shading systems affect the physiological response of grapevine.

In this study, we evaluated the effect of shading generated by agrovoltaic systems on the leaf physiological status of grapevine under field conditions. Three varieties (Tempranillo, Moscatel de grano menudo, and Garnacha) were studied under three treatments: an unshaded control, a shading net, and elevated solar panels installed above the vineyard, with the shading net and solar panels covering an equivalent shaded surface. Parameters related to incident radiation, photosynthetic pigment content, and different indicators of oxidative stress and antioxidant capacity in leaves were analyzed.

The results show that shading reduces incident radiation on the canopy, particularly in the upper part of the vine, and promotes physiological acclimation to lower radiation conditions. In this context, shaded plants tend to show higher chlorophyll content as a compensatory mechanism for reduced light availability. At the same time, a lower activation of mechanisms associated with light and oxidative stress was observed, with a stronger effect under the solar panel system. The response was variety-dependent, with Tempranillo and Moscatel showing higher sensitivity to shading, while Garnacha exhibited a more moderate response.

Overall, these results indicate that agrovoltaic systems, in addition to their role in energy production, may contribute to improving grapevine physiological status by attenuating the impact of excessive radiation. However, further studies are needed to assess how these physiological responses may translate into effects on yield and fruit quality. Within this context, agrovoltaics emerges as a promising approach for the adaptation of Mediterranean viticulture to scenarios of high radiation and climate change.

Keywords: agrovoltaics, grapevine physiology, radiation stress, mediterranean viticulture

Acknowledgements: This publication is part of project CPP2022-010020, funded by MCIU/AEI/10.13039/501100011033 and by the European Union “NextGenerationEU”/PRTR.

How to cite: Morales-Rodríguez, P. A., Peco, J. D., Villena, J., Atance, C., López-Perales, J. A., Higueras, P. L., and Moreno, M. M.: Effects of agrovoltaic shading on grapevine physiological status and stress responses, EGU General Assembly 2026, Vienna, Austria, 3–8 May 2026, EGU26-20348, https://doi.org/10.5194/egusphere-egu26-20348, 2026.

EGU26-20830 | Posters on site | BG3.36

The older, the better: ageing improves the efficiency of biochar-compost mixture to alleviate drought stress in plant and soil. 

Charlotte Vedere, Manhattan Lebrun, Philippe Biron, Séverine Planchais, Marianne Bordenave Jacquemin, Nicolas Honvault, Stéphane Firmin, Arnould Savouré, David Houben, and Cornelia Rumpel

Due to increased drought frequency following climate change, practices improving water use efficiency and reducing water-stress are needed. The efficiency of organic amendments to improve plant growth conditions under drought is poorly known. Our aim was to investigate if organic amendments can attenuate plant water-stress due to their effect on the plant-soil system and if this effect may increase upon ageing. To this end we determined plant and soil responses to water shortage and organic amendments added to soil. We compared fresh biochar/compost mixtures to similar amendments after ageing in soil.

Results indicated that amendment application induced few plant physiological responses under water-stress. The reduction of leaf gas exchange under watershortage was alleviated when plants were grown with biochar and compost amendments: stomatal conductance was least reduced with aged mixture aged mixture (-79 % compared to -87% in control), similarly to transpiration (-69 % in control and not affected with aged mixture), . Belowground biomass production (0.25 times) and nodules formation (6.5 times) were enhanced under water-stress by amendment addition. This effect was improved when grown on soil containing the aged as compared to fresh amendments. Plants grown with aged mixtures also showed reduced leaf proline concentrations (two to five times) compared to fresh mixtures indicating stress reduction. Soil enzyme activities were less affected by water-stress in soil with aged amendments.

We conclude that the application of biochar-compost mixtures may be a solution to reduce the effect of water-stress to plants. Our findings revealed that this beneficial effect is expected to increase with aged mixtures, leading to a better water-stress resistance over time. However, while being beneficial for plant growth under water-stress, the use of amendments may not be suited to increase water use efficiency.        

How to cite: Vedere, C., Lebrun, M., Biron, P., Planchais, S., Bordenave Jacquemin, M., Honvault, N., Firmin, S., Savouré, A., Houben, D., and Rumpel, C.: The older, the better: ageing improves the efficiency of biochar-compost mixture to alleviate drought stress in plant and soil., EGU General Assembly 2026, Vienna, Austria, 3–8 May 2026, EGU26-20830, https://doi.org/10.5194/egusphere-egu26-20830, 2026.

EGU26-21249 | Posters on site | BG3.36

Understanding the role of hydraulic diversity on temperate forest growth across the USA 

Daijun Liu and Sheng Wang

mortality, canopy die-off and forest carbon sink decline. Forest adaptation and resistance to drought stress largely rely on hydraulic diversity – the variety and range of hydraulic traits that regulate water use under drought conditions. Yet, how hydraulic diversity emerges within temperate forests and links to forest growth remains poorly resolved. To fill these gaps, we use eight hydraulic traits relating to stomatal closure, structural demand management, water storage, hydraulic resistance and rooting depth to quantify hydraulic diversity within forests, explore how it varies across temperate regions and explore its relationship with forest stem growth using the USA forest inventory data. A total of 31,304 forest plots were aggregated at a 1° grid-cell resolution and hydraulic diversity (721 metacommunities; those with fewer than three tree species are excluded) was quantified as the hypervolume size along the first two axes of principal component analysis (PCA). We found that higher diversity values were observed in the regions of the eastern USA while lower diversity values were found in the western and central USA and boreal regions. The variation in strategy diversity in temperate forests aligns mostly with changes along the acquisitive – conservative axis, spatial hydraulic diversity within temperate forest metacommunities indicates summer precipitation is more crucial than other climate variables. Interestingly, forests with low diversity are widely distributed across the full range of summer precipitation, suggesting that factors beyond water availability – such as temperature – may play an important role, particularly in the Pacific coast of Northern America. Moreover, we observed there is a positive relationship between hydraulic diversity and stem growth across the USA forest metacommunities. Our results provide a foundation for understanding forest hydraulic diversity and improving the accuracy in predicting forest carbon sink potential under a warmer and drier conditions.

How to cite: Liu, D. and Wang, S.: Understanding the role of hydraulic diversity on temperate forest growth across the USA, EGU General Assembly 2026, Vienna, Austria, 3–8 May 2026, EGU26-21249, https://doi.org/10.5194/egusphere-egu26-21249, 2026.

EGU26-21306 | Orals | BG3.36

Linking Canopy Phenology to Drought-Induced Physiological Stress in Cocoa Agroforestry Systems Using Multispectral Drones 

Issaka Abdulai, Nikolas Piont Konwski Grünther, Richard Asare, Muhammad Habib-ur-Rahman, Reimund P. Rötter, and Munir Hoffmann

Sustainable cocoa production underpins rural livelihoods across the tropics and offers significant potential for both climate change adaptation and mitigation. Although the biodiversity value of cocoa agroforestry systems is well documented, their functional capacity to buffer drought stress and enhance climate resilience remains insufficiently understood. In particular, scalable methods for monitoring plant physiological responses to water stress across structurally heterogeneous agroforestry landscapes are urgently needed. In this study, we assess the potential of multispectral drone imagery to detect drought-related physiological dynamics in cocoa agroforestry systems, with a specific emphasis on the role of shade tree leaf phenology.

We integrated high-resolution multispectral drone imagery with in situ physiological measurements across ten smallholder cocoa plantations of comparable age in the northern cocoa belt of Ghana. Thirteen shade tree species, representing distinct functional groups based on leaf phenology, were selected. For eight individuals per species, we quantified structural traits (diameter at breast height, tree height, and canopy area) and phenological status, and measured leaf-level transpiration and stomatal conductance using a LI-600 porometer. Multispectral imagery acquired during the late wet, mid-wet, and peak dry seasons between 2021 and 2023 was used to derive the Green Normalized Difference Vegetation Index (GNDVI), a spectral proxy sensitive to chlorophyll content and photosynthetic activity. We observed pronounced seasonal and functional-group-specific differences in canopy reflectance, with significant interactions between season and shade tree phenology. GNDVI was strongly correlated with key physiological traits, particularly stomatal conductance, and exhibited consistent responses to seasonal climatic variation. These results demonstrate that drought-induced physiological stress, expressed as reductions in stomatal conductance, can be reliably predicted from spectral traits derived from high-resolution multispectral drone imagery, highlighting its potential as a scalable tool for assessing drought resilience in cocoa agroforestry systems.

How to cite: Abdulai, I., Grünther, N. P. K., Asare, R., Habib-ur-Rahman, M., Rötter, R. P., and Hoffmann, M.: Linking Canopy Phenology to Drought-Induced Physiological Stress in Cocoa Agroforestry Systems Using Multispectral Drones, EGU General Assembly 2026, Vienna, Austria, 3–8 May 2026, EGU26-21306, https://doi.org/10.5194/egusphere-egu26-21306, 2026.

Fine roots (<2 mm in diameter) are among the most functional components of the plant system, playing a critical role in nutrient and water uptake as well as in regulating the carbon cycle. Despite their importance, fine roots remain one of the least studied components of forest ecosystems, even though they make a substantial contribution to forest productivity, carbon allocation, nutrient uptake, and turnover.
In the Himalaya, banj oak (Quercus leucotrichophora) is a major forest forming species that is increasingly challenged by the encroachment of chir pine (Pinus roxburghii), along with anthropogenic disturbances and climate change. While aboveground dynamics of banj oak and chir pine forests are well documented, studies on belowground processes are limited.  The present study aims to understand fine root dynamics, including biomass, productivity, turnover, and nutrient concentration, in banj oak, chir pine, and banj oak-chir pine mixed forests, and to assess the belowground impacts of chir pine encroachment into banj oak forests.
Three sites were selected for each forest type following a reconnaissance survey. Site selection was based on forest age structure determined through phytosociological analysis. Aspect, slope, elevation, and terrain were also considered to ensure comparability among sub-sites. At each selected site, a uniform plot was established, and six sub-plots were marked for fine root sampling using the sequential coring method. Five samples were collected from each sub-plot on a monthly basis. Sampling involved removal of surface litter followed by coring up to 30 cm soil depth using an 8 cm diameter corer.  The separated roots are oven-dried at 65°C until constant weight achieved. Dried samples are grounded using a Willey mill and stored in plastic containers for further analysis.
Preliminary results indicate that fine root biomass production is highest in banj oak forests, followed by oak–pine mixed forests and pine forests, reflecting distinct patterns of carbon allocation and belowground dynamics among the three forest types. Fine root turnover rates are lowest in pine forests, suggesting rapid growth and mortality of fine roots in pine-dominated stands. The study will provide important insights into belowground processes associated with chir pine encroachment into banj oak forests and will aid in assessing ecosystem services related to fine root production, carbon cycling, and nutrient dynamics in Himalayan forest ecosystems.

How to cite: Verma, A. K. and Chand, T.: Fine Root Dynamics: Belowground Carbon and Nutrient Cycling in Oak, Pine, and Oak–Pine Mixed Forests of the Central Himalaya, EGU General Assembly 2026, Vienna, Austria, 3–8 May 2026, EGU26-21730, https://doi.org/10.5194/egusphere-egu26-21730, 2026.

EGU26-21836 | Orals | BG3.36

Loess-derived soils under stress: Lessons learned from pedogenic response patterns 

Kai Uwe Totsche, Tom Guhra, Thomas Ritschel, Leon Frederic van Overloop, and Nina Siebers

Pedogenesis is the complex interplay of biogeophyical and biogeochemical mechanisms operating simultaneously. Resolving the interactions and feedbacks requires experimental and analytical approaches that provide and integrate multiple, highly resolved signals into a coherent process-based framework (Totsche et al. 2024). Here, we investigate the response of loess-derived Regosol and Luvisol topsoils to controlled hydraulic and chemical stress using water-unsaturated column experiments conducted over seven months. Effluent, including pH, electrical conductivity (EC), major ions and elements, inorganic carbon, particle concentrations, and organic matter (OM) quality and quantity,  was monitored with high frequency.

To evaluate parameter interdependence and their joint response to forced perturbations, we applied a multivariate decomposition. Our analysis yielded distinct “effluent patterns” that represent recurring combinations of physicochemical parameters that evolve coherently over time. These patterns reflect the interplay among multiple processes, including solute release, particle mobilization, and OM transport, rather than isolated parameter responses.

The effluent course of both soils was dominated by four patterns, which together explained approximately 90% of the total variance. Pattern one reflects EC-driven transport and tracer-induced cation exchange, integrating conservative solute movement with the release of exchangeable mono- and polyvalent cations. Pattern two combines particle export with the mobilization of aluminum, iron, and phosphorus and fluorescence signatures of recalcitrant OM, indicating the destabilization and transport of organo-mineral associations (Lehmann et al., 2021). Pattern three is dominated by inorganic carbon dynamics and alkaline earth cations, revealing carbonate dissolution and diffusion-controlled release processes, following hydraulic stress. The fourth pattern is linked to the reversible exchange of surface-associated OM, coupled to the dynamics of monovalent cations, and the re-establishment of cation bridging after chemical perturbation (see Ritschel et al., 2023).

Clear differences in pattern expression were observed between soil types. Regosol responded to chemical stress primarily through carbonate dissolution and cation exchange, thereby buffering ionic strength gradients and limiting particle mobilization. In contrast, the Luvisol exhibited pronounced disaggregation and enhanced particle and hydrophobic, pedogenic OM export under electrolyte shifts, reflecting advanced pedogenic development and reduced stress resistance.

By capturing these contrasting responses to the forced stresses, we demonstrate how soil development governs the susceptibility of soils to environmental perturbations and, consequently, the (im-)mobilization pathways of particles, ions, and OM. The study addresses challenges associated with fluctuations in salinity, wetting and drying cycles, and the extensive use of liquid mineral fertilizers, as well as their effects on soil aggregation, organic matter dynamics, and nutrient availability. Together, these findings provide the basis for a conceptual framework for enhancing soil resilience in vulnerable agroecosystems under changing climate/environmental conditions.


Lehmann, K., Lehmann, R., Totsche, K. U. (2021) Event-driven dynamics of the total mobile inventory in undisturbed soil account for significant fluxes of particulate organic carbon. Sci. Total Environ. 756, 143774, doi: 10.1016/j.scitotenv.2020.143774

Totsche, K.U., Ray, N. and Kögel-Knabner, I. (2024), Structure–function co-evolution during pedogenesis—Microaggregate development and turnover in soils. J. Plant Nutr. Soil Sci., 187: 5-16. https://doi.org/10.1002/jpln.202400012

Ritschel, T., Aehnelt, M., Totsche, K.U., (2023). Organic matter governs weathering rates and microstructure evolution during early pedogenesis. Geoderma 429, 116269, https://doi.org/10.1016/j.geoderma.2022.116269

How to cite: Totsche, K. U., Guhra, T., Ritschel, T., van Overloop, L. F., and Siebers, N.: Loess-derived soils under stress: Lessons learned from pedogenic response patterns, EGU General Assembly 2026, Vienna, Austria, 3–8 May 2026, EGU26-21836, https://doi.org/10.5194/egusphere-egu26-21836, 2026.

EGU26-96 | ECS | Orals | BG3.37

Mapping temperature thresholds and safety margins of temperate plant species under global change 

Helena Vallicrosa, Arthur Simon, Thibaut Juillard, Pablo Sánchez-Martínez, Peter Waldner, and Noel Holbrook

Global climate change imposes growing challenges to vegetation thermoregulation through rising temperatures and increasing drought frequency. Understanding plant thermal limits (e.g., Tcrit and T50) and their associated temperature safety margins is essential to evaluate canopy resistance to thermal stress. Despite intensified heatwave events in temperate regions, research on plant temperature thresholds has predominantly focused on tropical ecosystems, and methodological inconsistencies have limited cross-study comparability.


In this study, we address these knowledge gaps by: (1) quantifying thermal thresholds (Tcrit, T50) for temperate plant species through field sampling, (2) compiling published datasets standardized under a homogenized methodology, (3) analyzing the global drivers of T50 and the inter- and intraspecific variability linked to temperature, phenology, genetics, and methodological factors, and (4) mapping temperature safety margins by integrating field data, upscaling models, and satellite-derived land surface temperatures. Finally, we project future temperature safety margins for temperate vegetation under anticipated climate scenarios. Our findings provide a comprehensive framework to assess and predict the thermal resilience of temperate plant species under ongoing and future climatic stress.

How to cite: Vallicrosa, H., Simon, A., Juillard, T., Sánchez-Martínez, P., Waldner, P., and Holbrook, N.: Mapping temperature thresholds and safety margins of temperate plant species under global change, EGU General Assembly 2026, Vienna, Austria, 3–8 May 2026, EGU26-96, https://doi.org/10.5194/egusphere-egu26-96, 2026.

EGU26-1623 | ECS | Orals | BG3.37

 Scorched, not senescent: When hot droughts burn leaves instead of aging them 

Maxwell Bergström, Arianna Milano, Thibaut Juillard, Léo Jacquat, Günter Hoch, Ansgar Khamen, and Yann Vitasse

Hot droughts are becoming increasingly frequent worldwide, causing widespread and abrupt leaf discoloration in temperate forests. Because changes in leaf colour are commonly associated with autumnal senescence, such abrupt discoloration is often interpreted as premature or stress-induced senescence. Nonetheless, under hot droughts, excessive heating and/or hydraulic failure may cause leaf tissue damage, leading to leaf scorching. This process produces visual symptoms similar to senescence but arises from fundamentally different physiological processes. Despite its potential importance, leaf scorching remains poorly studied.

Using climate chambers, we exposed three species (Fagus sylvatica, Quercus Pubescens, and Prunus mahaleb) to four temperature treatments (25°C, 35°C, 40°C, and 45°C) under severe water limitation. Through regular physiological (predawn and midday water potential, chlorophyll content, stomatal conductance, maximum potential quantum efficiency of Photosystem II, leaf embolism) and continuous leaf colour measurements, we aimed to identify the physiological tipping points of leaf scorching and to provide a clearer distinction between the leaf discoloration processes.

 Leaf scorching occurred only under the highest temperature treatments (40°C and 45°C), with its extent varying among species according to their inherent thermotolerance. Notably, in Fagus sylvatica, leaf tissue damage appear to develop prior to leaf embolism, indicating that temperature excess rather than hydraulic dysfunction was the primary trigger of scorching under extreme heat.

How to cite: Bergström, M., Milano, A., Juillard, T., Jacquat, L., Hoch, G., Khamen, A., and Vitasse, Y.:  Scorched, not senescent: When hot droughts burn leaves instead of aging them, EGU General Assembly 2026, Vienna, Austria, 3–8 May 2026, EGU26-1623, https://doi.org/10.5194/egusphere-egu26-1623, 2026.

EGU26-2008 | ECS | Orals | BG3.37

Effects of experimental drought on post-hurricane recovery of an ever-wet tropical forest 

Chris Smith-Martin, Laura Boeschoten, Luis Esbri, Rebecca Montgomery, Chris Nytch, Monique Picon, Tana Wood, Xiangtao Xu, Jess Zimmerman, and María Uriarte

The changing climate is increasing the frequency and intensity of hurricanes and drought, which cause tree crown damage and widespread tree mortality. Forests undergoing post-hurricane succession may be particularly vulnerable to drought because crown damage alters tree carbon allocation, which could be exacerbated by drought. Hurricane canopy damage also results in elevated light in the understory, leading to the recruitment of fast-growing early succession species that tend to be more vulnerable to drought. Yet, our understanding of the effects of drought on post-hurricane forest recovery is extremely limited. Hurricane María is the strongest hurricane to make direct landfall in Puerto Rico since 1928. We are leveraging the disturbance caused by Hurricane María in 2017 to gain important new knowledge on the compound effect of hurricanes and droughts by conducting a large-scale throughfall exclusion experiment. We have established three 20 x 20 m experimental plots and three 20 x 20 m control plots in the Luquillo Experimental Forest, in northeastern Puerto Rico. The forest is an ever-wet tropical forest at approximately 300 m above sea level and has a mean annual temperature of 24 °C and a mean annual precipitation of 3500 mm. We tagged and identified to species the trees in the six plots. We selected 62 target individuals from the five dominant tree species and one dominant palm on which we installed point dendrometers and are measuring predawn (PDΨ) and midday leaf water potential (MDΨ) and sap flow three times per year (during the driest, wettest, and highest solar irradiation period of the year). We have collected one year of pre-treatment data, have finished installing the throughfall exclusion roofs in the three experimental plots, and have begun post-treatment sampling of tree responses. We have also started collecting leaf samples and sapwood cores to extract nonstructural carbohydrates and histological sections for imaging of stored starch distribution and depletion. Our pre-treatment data show similar mean PDΨ (-0.2 to -0.4 MPa) and MDΨ (-0.5 to -0.6 MPa) among the three pre-treatment campaigns, meaning that there was no significant drought stress. Sap flow was higher during the highest solar irradiation (mean species-level pick whole tree sap flow 1,500 to 8,000 cm3 h-1), whereas during the wettest and cloudiest time of year, there was ~ 50% reduction in sap flow (1,000 to 4,000 cm3 h-1). On the same dominant species, we measured xylem vulnerability to embolism (P50), leaf turgor loss point (TLP), and calculated stomatal safety margins (SSM = TLP-P50). Species fell along a range of P50 from drought-vulnerable (P50 =  -1MPa; SSM = 0 MPa) to relatively drought-tolerant (P50 = -3 MPa; SSM = 1 MPa). Given the differences in trait values among the dominant tree species, we expect very different species-level responses to the imposed drought that will likely change seasonally and throughout time as the experimental drought progresses.

How to cite: Smith-Martin, C., Boeschoten, L., Esbri, L., Montgomery, R., Nytch, C., Picon, M., Wood, T., Xu, X., Zimmerman, J., and Uriarte, M.: Effects of experimental drought on post-hurricane recovery of an ever-wet tropical forest, EGU General Assembly 2026, Vienna, Austria, 3–8 May 2026, EGU26-2008, https://doi.org/10.5194/egusphere-egu26-2008, 2026.

A conceptual understanding on how the vegetation’s carbon (C) balance is determined by source activity and sink demand is important to predict its C uptake and sequestration potential now and in the future. We have gathered trajectories of photosynthesis and growth as a function of environmental conditions described in the literature and compared them with current concepts of source and sink control. There is no clear evidence for pure source or sink control of the C balance, which contradicts recent hypotheses. Using model scenarios, we show how legacy effects via structural and functional traits and antecedent environmental conditions can alter the plant’s carbon balance. We, thus, combined the concept of short-term source–sink coordination with long-term environmentally driven legacy effects that dynamically acclimate structural and functional traits over time. These acclimated traits feedback on the sensitivity of source and sink activity and thus change the plant physiological responses to environmental conditions. We postulate a whole plant C-coordination system that is primarily driven by stomatal optimization of growth to avoid a C source–sink mismatch. Therefore, we anticipate that C sequestration of forest ecosystems under future climate conditions will largely follow optimality principles that balance water and carbon resources to maximize growth in the long term.

How to cite: Geßler, A. and Roman, Z.: Beyond source and sink control – toward an integrated approach to understand the carbon balance in plants, EGU General Assembly 2026, Vienna, Austria, 3–8 May 2026, EGU26-2543, https://doi.org/10.5194/egusphere-egu26-2543, 2026.

EGU26-3173 | Orals | BG3.37

The kinetic basis of photosynthetic heat tolerance 

Sean Michaletz and Nicole Bison

Photosynthesis fuels the biosphere and is a key regulator of Earth’s climate. As Earth warms, heat stress threatens to irreversibly impair the molecular machinery of photosynthesis, potentially pushing ecosystem productivity and carbon sequestration beyond a tipping point. Current approaches to quantifying photosynthetic heat tolerance often focus solely on temperature, overlooking exposure time, or rely on temperature-time correlations that do not identify causal mechanisms, limiting inference and prediction. Here we develop a mechanistic theory for heat inactivation of photosynthesis based on principles of chemical kinetics, and test it using data for photosystem II (PSII), the first step in the photosynthetic apparatus. Our framework links the effects of both temperature and exposure time, and enables direct tests of competing hypotheses for how heat impairs photosynthesis. Data from diverse plant species suggest that protein (not lipid membrane) denaturation is the primary mechanism of heat-induced inactivation of PSII. The theory also predicts a general upper temperature limit of 55-60 °C for acclimation of photosynthetic heat tolerance, a prediction supported by global PSII data. This quantitative, mechanistic framework can be incorporated into global change models to improve forecasts of how vegetation and the biosphere will respond to future climate change.

How to cite: Michaletz, S. and Bison, N.: The kinetic basis of photosynthetic heat tolerance, EGU General Assembly 2026, Vienna, Austria, 3–8 May 2026, EGU26-3173, https://doi.org/10.5194/egusphere-egu26-3173, 2026.

EGU26-3219 | ECS | Posters on site | BG3.37

Barents Sea ice loss substantially enhances spring vegetation growth and wheat yields in Eastern Europe 

Zhi Huang, Jun Wang, and Weimin Ju

Arctic sea ice decline is known to influence mid-latitude climate, yet its impacts on terrestrial vegetation productivity and agriculture production remain insufficiently understood. Using four decades of satellite observations, agricultural statistics, and earth system model simulations, we show that variations in Barents Sea ice area (BSIA) exert a strong control on spring vegetation gross primary productivity (GPP) across Europe. BSIA loss enhanced spring GPP in eastern Europe but suppresses it in the western Europe, driving a pronounced increasing trend in of GPP in eastern Europe. Wheat yields respond similarly, with low-ice years producing up to +16.51% higher national yields and more than 20% increases at the pixel scales. These impacts are dominated by temperature: reduced BSIA induces large-scale circulation anomalies that warm eastern Europe through cyclonic conditions, enhanced horizontal temperature advection, and increased shortwave radiation, collectively alleviating frost risk and promoting photosynthesis. Current ESMs capture the sea-ice–temperature linkage but systematically underestimate the GPP response, primarily due to weak GPP–temperature sensitivities. Our results highlight BSIA decline as a major but underrepresented driver of spring ecosystem productivity in mid-latitude Europe, and indicate that existing models may substantially underestimate future productivity changes in a rapidly warming Arctic. 

How to cite: Huang, Z., Wang, J., and Ju, W.: Barents Sea ice loss substantially enhances spring vegetation growth and wheat yields in Eastern Europe, EGU General Assembly 2026, Vienna, Austria, 3–8 May 2026, EGU26-3219, https://doi.org/10.5194/egusphere-egu26-3219, 2026.

EGU26-3502 | ECS | Posters on site | BG3.37

Environmental and functional drivers of tree radial growth and water status in the Congo basin rainforest 

Lucette Adet, Rafael Poyatos, Oliver John Binks, Maurizio Mencuccini, Gilles Dauby, Claire Fortunel, Isabelle Maréchaux, Pierre Ploton, Santiago Trueba, Geraldine Nguemo Djamnou, Franck Yvan Ndjock, Aïcha Vessah Mfout, Raphaël Pélissier, and Jordi Martínez-Vilalta

High temperature, and atmospheric vapor pressure deficit and soil water stress increasingly threaten tree functions that regulate forest ecosystem productivity. Tree growth reflects the dynamic balance between carbon acquisition and allocation, and is highly sensitive to water availability, yet the mechanisms linking short-term water status to radial growth remain poorly understood, particularly in tropical forests experiencing intensifying dry seasons. Here, we explored the environmental and functional drivers of tree growth and water status in the Congo basin rainforest, the second largest tropical forest on Earth.

Specifically, in the Dja faunal reserve of eastern Cameroon, we quantified radial growth (RG) and tree water deficit (TWD) over an entire year and assessed their drivers, with a particular focus on understanding tree responses during dry periods. High-frequency (15-minute resolution) automatic dendrometer data were used to quantify dynamics of growth and stem shrinkage in 100 individuals of 16 tree species along a water availability gradient (wet vs dry conditions). Key functional traits related to resource use strategies and drought response syndromes were also measured on the same trees, including specific leaf area (SLA), wood density, water storage capacity, capacitance, turgor loss point, minimal conductance and variations in leaf water potential and relative water content over the dry season, enabling analyses of individual-level growth and water status, response to edaphoclimatic drivers, and functional trait syndromes.

In line with the view that species with rapid carbon acquisition capitalize on short favorable periods but remain highly sensitive to water limitations, we hypothesized that trees with acquisitive resource-use traits (e.g., high SLA, low wood density) and larger tree size would grow faster, but that trees with higher drought tolerance traits would show smaller growth reductions during dry periods and sustain functions under higher TWD. We found that prolonged dry seasons extended the duration of stem shrinkage, delayed post-drought growth recovery, and reduced the proportion of dry-season growth relative to annual growth, particularly in drought-sensitive species. By jointly analyzing individual growth, water status and functional traits, this study revealed how contrasting strategies of resource acquisition and drought tolerance regulate growth-water trade-offs and shape tropical forest resilience under increasing climatic stress, with implications for ecosystems functioning under future climate extremes.

How to cite: Adet, L., Poyatos, R., Binks, O. J., Mencuccini, M., Dauby, G., Fortunel, C., Maréchaux, I., Ploton, P., Trueba, S., Djamnou, G. N., Ndjock, F. Y., Mfout, A. V., Pélissier, R., and Martínez-Vilalta, J.: Environmental and functional drivers of tree radial growth and water status in the Congo basin rainforest, EGU General Assembly 2026, Vienna, Austria, 3–8 May 2026, EGU26-3502, https://doi.org/10.5194/egusphere-egu26-3502, 2026.

EGU26-3789 | Posters on site | BG3.37

Starch concentrations in branches are not consistently changing with drought stress in mature temperate tree species 

Guenter Hoch, Sophie Fröhlicher, and Ansgar Kahmen

Starch is the ubiquitous carbon reserve in trees that is stored decentralized in sapwood parenchyma of branches, stems and roots. As a transitory carbon pool between photosynthesis and carbon sinks (growth, respiration,...), tissue concentrations of starch are assumed to mirror carbon source-sink-relations, with concentrations positively correlating with the net balance between gross primary productivity and the sum of all carbon sink activities of a tree. In this study, we investigated if starch concentrations in branch sapwood of mature trees are suitable indicators for drought induced changes of the trees’ carbon source-sink activities.

Taking advantage of the Swiss Canopy Crane II facility, we studied mature trees of 6 common European broadleaved species over five consecutive growing seasons that varied significantly in terms of temperature and precipitations. Despite the very different climatic conditions, we found surprisingly small variations of end-of-season starch concentrations in terminal branches for most years and species. This is in stark contrast to leaf gas-exchange and growth that both declined significantly in all species in years with extended drought periods. Further, among all investigated species, deviations from the species-specific average starch concentrations in some years were not consistently correlated with climatic anomalies (e.g., exceptionally dry seasons were not uniformly associated with decreased branch starch concentrations). Overall, these findings suggest that starch formation in branch sapwood possesses a high priority, and the fast refilling of starch reserves in wood parenchyma of younger branches after spring bud break occurs largely independent of the total tree annual carbon balance.

How to cite: Hoch, G., Fröhlicher, S., and Kahmen, A.: Starch concentrations in branches are not consistently changing with drought stress in mature temperate tree species, EGU General Assembly 2026, Vienna, Austria, 3–8 May 2026, EGU26-3789, https://doi.org/10.5194/egusphere-egu26-3789, 2026.

Extreme heat is intensifying across the tropics, often coinciding with high atmospheric drought, forcing trees to balance evaporative cooling against the risk of hydraulic failure. A possible response that challenges major climate–vegetation stomatal model assumptions is the decoupling of photosynthesis and stomatal conductance (gs), where gs stays high while photosynthesis declines.

We aimed to quantify how widespread photosynthesis–gs decoupling is across tropical tree species from contrasting climates and test whether it trades off with sensitivity to heat, drought, or vapour pressure deficit (VPD). We measured  in-situ temperature responses (22-49°C, VPD=2.5kPa) of photosynthesis, gs, and g1 in 80 mature individuals encompassing 16 species along an elevation gradient in Panama, as well as leaf-level turgor loss point and VPD sensitivity.

All individuals showed an exponential rise in g1 with temperature, indicating widespread decoupling between photosynthesis and stomatal conductance. Although both photosynthesis and gs declined above their thermal optima, stomatal re-opening at extreme temperatures (~45°C) occurred in 55% of curves. Notably, the temperature at which gs increased again was higher in lowland than upland individuals, potentially indicating greater heat tolerance in trees from hotter environments. Contrary to expectations, there was no coordination between stomatal sensitivity to extreme heat, stomatal sensitivity to vapour pressure deficit, and turgor loss point, indicating that heat avoidance and hydraulic drought tolerance represent largely independent axes of variation in the tropical trees studied.

These results provide rare field-based evidence that tropical trees exhibit diverse temperature-dependent stomatal strategies that may shape forest resilience under future heatwaves. Future research must prioritise in situ measurements at extreme leaf temperatures (>45 °C), where tropical trees approach critical thermal thresholds and where the physiological mechanisms governing survival under heatwaves remain largely unresolved.

How to cite: Middleby, K., Rojas-Gonzalez, A., and Slot, M.: In situ evidence for a critical temperature threshold driving stomatal re-opening and widespread photosynthesis–conductance decoupling in tropical trees, EGU General Assembly 2026, Vienna, Austria, 3–8 May 2026, EGU26-3846, https://doi.org/10.5194/egusphere-egu26-3846, 2026.

EGU26-3954 | Orals | BG3.37

When drought, heat and canopy dieback turn a Mediterranean forest into a net annual carbon source for two consecutive years 

Jean-Marc Limousin, Jean Kempf, Jeanne Poughon, Serge Rambal, and Jean-Marc Ourcival

Increasing temperature and drought conditions can result in leaf dehydration and summer defoliation even in drought-adapted tree species such as the Mediterranean evergreen oak Quercus ilex. This phenomenon was widespread in forests of Southern France in 2022-2023 when record-breaking temperatures of 2022 were associated with two consecutive years of low precipitation, severe drought episodes and recurrent heatwaves.

Using the 20-year data series (2001-2021) of eddy-covariance carbon and water fluxes measured at the ICOS Mediterranean forest site FR-Pue (Puéchabon) prior to this event, we assess the impacts of these two exceptional years on the carbon budget of the forest. While the Puéchabon forest always behaved as a net carbon sink between 2001 and 2021, with an annual net ecosystem exchange (NEE) ranging between -450 and -137 gC m-2 y-1, the carbon balance was reversed to a net annual carbon source of +14 and +65 gC m-2 y-1 in 2022 and 2023, respectively. This anomaly is caused by a deficit of photosynthetic carbon uptake, as leaf physiology was severely impacted by both water stress and heat stress. Significantly lower photosynthetic rates than in the previous years were, however, not restricted to the most stressful conditions of heat or soil water deficit but manifested under most meteorological conditions even outside the summer period. This observation suggests that neither heat nor drought alone can explain the photosynthesis limitation in 2022 and 2023 but that the two acted in synergy. It also demonstrates that such extreme meteorological events have long lasting effects on tree physiology, mediated by cell physiological damage, leaf hydraulic failure and canopy dieback that limit photosynthetic recovery when favorable temperature and soil moisture conditions return.

Interestingly, these negative effects on photosynthesis were not observed during the following year 2024 when a complete recovery of photosynthetic rates was achieved with the production of new leaves, highlighting a strong resilience of Quercus ilex to drought and heat. Nevertheless, the annual carbon budget in 2024 was also particularly low because of an excess of total ecosystem respiration compared to the long-term mean. The higher respiration rates in 2024 could be caused by the decomposition of dead trees and organs after the extreme years 2022-2023, and by the reallocation of trees carbon reserves to the production of short-lived organs such as new leaves and seeds.

This study is, yet, a rare example of an inversion of a forest carbon balance driven merely by meteorological conditions and it highlights the value of long-term observations to better understand and interpret the consequences of extreme events on ecosystem functioning.

How to cite: Limousin, J.-M., Kempf, J., Poughon, J., Rambal, S., and Ourcival, J.-M.: When drought, heat and canopy dieback turn a Mediterranean forest into a net annual carbon source for two consecutive years, EGU General Assembly 2026, Vienna, Austria, 3–8 May 2026, EGU26-3954, https://doi.org/10.5194/egusphere-egu26-3954, 2026.

EGU26-4079 | ECS | Posters on site | BG3.37

Drought Propagation as a Nonlinear Amplifier of Ecohydrological Damage 

Zhuoran Qu, Xiaoyan Li, and Josep Peñuelas

Escalating droughts are posing unprecedented challenges to environmental stability and sustainable development. In particular, meteorological drought can propagate to soil and ecological droughts, triggering cascading disruptions in ecosystem functioning. However, whether the ecohydrological damage—the sum of standardized vegetation greenness and soil moisture losses—is disproportionately amplified through drought propagation has not been systematically assessed, which severely limits our ability to anticipate catastrophic drought cascades and implement timely adaptation strategies. Using global remote sensing data, we found that ecohydrological damage reached 162% to 310% of the initial meteorological drought intensity, due to prolonged drought duration and increased peak intensity. Once meteorological drought intensity exceeded the standardized threshold of 2.18, ecohydrological damage escalated nonlinearly. Externally, soil and ecological droughts were more sensitive to meteorological droughts driven by precipitation deficits and potential evapotranspiration surpluses, respectively, but the former propagated more efficiently. Internally, vegetation–soil feedbacks promoted the propagation from soil to ecological drought, while dampened the reverse process, resulting in the greatest ecohydrological damage when meteorological drought first triggered soil drought and then ecological drought. Declining ecosystem resilience and increasing climate variability may exacerbate future drought propagation and its damage. These insights are critical for advancing early warning systems and mitigating cascading drought losses.

How to cite: Qu, Z., Li, X., and Peñuelas, J.: Drought Propagation as a Nonlinear Amplifier of Ecohydrological Damage, EGU General Assembly 2026, Vienna, Austria, 3–8 May 2026, EGU26-4079, https://doi.org/10.5194/egusphere-egu26-4079, 2026.

EGU26-5488 | ECS | Posters on site | BG3.37

Global vegetation responses to wet and dry soil moisture extremes 

Xueyan Cheng, Chunhui Zhan, Martin De Kauwe, Anke Hildebrandt, and Rene Orth

Hydrological extremes are continuing to intensify under climate change. However, the responses of vegetation to dry and wet soil moisture extremes, and the dominant drivers of these responses, have not yet been analyzed consistently. In this study, we utilize long-term observations of Normalized Difference Vegetation Index (NDVI) as a proxy of vegetation responses to soil moisture extremes. We then analyze related drivers with a machine-learning attribution approach to assess the role of pre-extreme vegetation conditions, characteristics of extremes, and of the environmental background. Vegetation generally loses greenness during dry extremes, indicated by widespread and consistent negative NDVI anomalies. This is mainly modulated by pre-extreme vegetation conditions and the characteristics of the extreme (especially seasonal timing) which reflect varying vegetation vulnerability. In contrast, wet extremes lead to more heterogeneous responses, including both positive and negative NDVI anomalies. This is modulated by multiple aspects including pre-extreme vegetation conditions, the characteristics of the extreme (especially seasonal timing) as well as environmental background variables such as climate (e.g., long-term mean air temperature, aridity) and topography (topographic variability). This illustrates that vegetation response to wet extremes is complex and potentially influenced by different processes. Further, regions with negative NDVI anomalies during extremes that are strongly modulated by environmental background indicate localized vulnerability arising from adverse climatic, soil or topographic conditions, such that vegetation stress can occur even under extremes with less severity. These results highlight the roles of seasonal timing and of environmental background conditions for impacts of soil moisture extremes on vegetation. This clarifies the predictability of ecosystem responses to hydrological extremes, and serves as a basis for related management planning.

How to cite: Cheng, X., Zhan, C., De Kauwe, M., Hildebrandt, A., and Orth, R.: Global vegetation responses to wet and dry soil moisture extremes, EGU General Assembly 2026, Vienna, Austria, 3–8 May 2026, EGU26-5488, https://doi.org/10.5194/egusphere-egu26-5488, 2026.

EGU26-6547 | ECS | Orals | BG3.37

Root water uptake depth explains drought response of temperate tree species 

David Steger, Richard L. Peters, Tobias Zhorzel, Raphael Dups, Günter Hoch, Daniel B. Nelson, Cedric Zahnd, David Basler, Katrin Meusburger, Fabian Bernhard, Matthias Arend, Bernhard Schuldt, and Ansgar Kahmen

Climate change is increasing drought frequency, duration, and severity in large parts of the world, thereby reducing soil water availability and increasing risks for forest decline and mortality. The drought response of a tree can be described by the tree’s 'drought sensitivity', indicating reversible processes such as stomatal responses to soil drying, and 'drought vulnerability', indicating irreversible damages, such as the risk of hydraulic failure. Different tree species differ substantially in their drought sensitivity and vulnerability. Yet, the underlying physiological and morphological mechanisms remain poorly understood. We tested whether species-specific differences in root water uptake depth (RWUD) can explain differences in drought sensitivity and vulnerability of mature trees belonging to nine temperate European tree species. Using a unique six-year dataset (2018–2024) from the Swiss Canopy Crane II site, we quantified drought sensitivity from the response of daily maximum sap flux density to soil drying. We quantified drought vulnerability by calculating hydraulic safety margins of trees relative to species-specific critical xylem hydraulic thresholds. RWUD was estimated from stable water isotopes and analyzed against sensitivity and vulnerability traits.

We show that species differ markedly in both sensitivity and vulnerability. We discuss that these differences are largely determined by variation in the tree's maximum RWUD: shallow-rooted species closed stomata early and rapidly approached hydraulic thresholds during drought, while deep-rooted species sustained transpiration and maintained wide hydraulic safety margins. RWUD alone explained more than 65 % of the interspecific variation in both drought sensitivity and vulnerability. Our results demonstrate that RWUD is a key morphological trait linking belowground water access to aboveground drought physiology. By quantifying this connection in mature trees, our study identifies RWUD as a strong predictor of forest drought resilience and a critical parameter for integrating rooting traits into ecosystem and Earth system models to improve forecasts of forest–climate feedbacks under intensifying drought regimes.

How to cite: Steger, D., Peters, R. L., Zhorzel, T., Dups, R., Hoch, G., Nelson, D. B., Zahnd, C., Basler, D., Meusburger, K., Bernhard, F., Arend, M., Schuldt, B., and Kahmen, A.: Root water uptake depth explains drought response of temperate tree species, EGU General Assembly 2026, Vienna, Austria, 3–8 May 2026, EGU26-6547, https://doi.org/10.5194/egusphere-egu26-6547, 2026.

EGU26-6715 | ECS | Orals | BG3.37

Predictions of the energy and carbon balance of Mediterranean shrub species under future climate scenarios 

Margaux Didion-Gency, Miquel de Càceres, Maurizio Mencuccini, and Jordi Martinez-Vilalta

Chronically rising air temperatures and increasing soil drought threaten terrestrial ecosystems by pushing plants closer to their physiological limits, thereby altering carbon uptake, growth, and survival. However, how vegetation responds to current and future warm and dry conditions remains poorly understood, especially in high-risk Mediterranean shrublands characterized by hot, dry summers.

In this study, we combine extensive field measurements and process-based modeling to assess shrubland responses to current and future climate conditions. During summer 2024, we collected leaf and wood traits related to plant economic spectra, thermal and drought tolerances, and photosynthesis. Data were obtained for six dominant Mediterranean shrub species (Amelanchier ovalis, Arbutus unedo, Pistacia lentiscus, Rhamnus alaternus, Buxus sempervirens, and Salvia rosmarinus) across six sites along a climatic gradient in Catalonia (North-East Spain). Additional climatic data were compiled from national meteorological station networks. These datasets were used to parameterize the trait-enabled ecosystem model MEDFATE 2.9.3 to simulate daily individual-level photosynthesis, net carbon uptake, respiration, transpiration rates, and energy balance. Originally developed for forest ecosystems, MEDFATE was adapted here to represent shrubland structure and function. Simulations were conducted under current climate conditions and future scenarios of increased temperature and reduced soil water availability based on IPCC projections. To maintain model tractability, simulations focused on the summer period, when climatic stress is highest.

By comparing interspecific differences in physiological responses across current and projected climate scenarios, this research aims to advance understanding of future vegetation dynamics in Mediterranean shrublands exposed to increasing heat and drought stress. Overall, this work helps bridge key knowledge gaps in plant ecophysiological responses to climate extremes and provides valuable insights for predicting shrubland vulnerability and informing future management strategies.

How to cite: Didion-Gency, M., de Càceres, M., Mencuccini, M., and Martinez-Vilalta, J.: Predictions of the energy and carbon balance of Mediterranean shrub species under future climate scenarios, EGU General Assembly 2026, Vienna, Austria, 3–8 May 2026, EGU26-6715, https://doi.org/10.5194/egusphere-egu26-6715, 2026.

EGU26-7475 | ECS | Posters on site | BG3.37

 The CausalHeat Project: Land–climate feedbacks shaping ecosystem vulnerability to dry–hot extremes 

Daniel F.T. Hagan, Fareeha Siddique, Feihong Zhou, Min Liu, João M. Geirinhas, and Diego G. Miralles

Grasslands and forests play a central role in regulating terrestrial water, energy, and carbon (WEC) cycles. Vegetation–atmosphere interactions shape and respond to hydroclimatic extremes such as heatwaves, droughts and compound dry–hot events. Under climate change, the influence of these extremes on ecosystem functioning is intensifying, altering the extent to which vegetation modulates WEC fluxes and, in some regions, driving ecosystems toward turning points or functional role reversals. The CausalHeat project aims to characterize the causal dynamics underlying dry–hot extremes, their impacts on ecosystem resilience and vulnerability, and the subsequent ecosystem–climate feedbacks influencing the development and persistence of these events. Using entropy-based information-theoretic causality methods, we quantify the dominant drivers of dry–hot episodes and assess how these drivers propagate through ecohydrologic process networks to influence vegetation structure and function across biomes.

Observational evidence reveals a pronounced biome-dependent divergence in ecosystem responses — more resilient or vulnerable. Forested ecosystems and croplands exhibit strengthened ecohydrologic process coupling and increased network organization, consistent with adaptive reorganization under recurrent drought exposure. However, enhanced vapor pressure deficit (VPD) coupling to forest function and structure yields episodic shocks that can push systems into transiently vulnerable states. In contrast, grassland-, savanna-, shrubland-, and wetland-dominated ecosystems show progressive decoupling of ecohydrologic processes, indicative of potential declining resilience. Grassland ecosystems emerge as particularly sensitive to aridification, with vulnerability driven by the synergistic amplification of atmospheric water demand and declining soil moisture, rather than by the dominance of either factor alone. Together, these results highlight how hot extremes reorganize ecosystem process networks in biome-specific ways, with important implications for terrestrial WEC partitioning, ecosystem stability and ecosystem–atmosphere feedbacks. CausalHeat provides a framework for improving the prediction of dry–hot extremes and assessing ecosystem responses relevant to food and water security under climate change.

How to cite: Hagan, D. F. T., Siddique, F., Zhou, F., Liu, M., Geirinhas, J. M., and Miralles, D. G.:  The CausalHeat Project: Land–climate feedbacks shaping ecosystem vulnerability to dry–hot extremes, EGU General Assembly 2026, Vienna, Austria, 3–8 May 2026, EGU26-7475, https://doi.org/10.5194/egusphere-egu26-7475, 2026.

EGU26-8431 | ECS | Posters on site | BG3.37

Warming offsets productivity losses from high evaporative demand in a widespread C3 pasture grass 

Manjunatha Chandregowda, Mark Tjoelker, Elise Pendall, and Sally Power
  • Atmospheric warming and high vapour pressure deficit (VPD) often co-occur and threaten forage production by constraining photosynthetic capacity and stomatal regulation. Yet their relative effects on plant productivity remain poorly resolved, necessitating a mechanistic understanding of how plants respond to heat and atmospheric dryness.
  • We experimentally isolated the effects of warming and VPD on growth and physiology of the perennial C3 pasture grass Dactylis glomerata by growing plants in controlled-environment chambers at 26 °C and 30 °C under low (1 kPa) and high (2.4 kPa) VPD.
  • High VPD reduced productivity more strongly at ambient than at elevated temperature, driven by a higher respiration-to-photosynthesis ratio, revealing an antagonistic interaction between warming and VPD. At ambient temperature, high VPD induced conservative water-use strategies that restricted stomatal conductance and suppressed photosynthesis. Under warming, however, thermal acclimation enhanced carbon assimilation and partially offset the negative effects of high VPD.
  • Our results demonstrate that rising VPD poses a major threat to forage productivity primarily through stomatal limitation. Although reduced stomatal sensitivity under high VPD curbed water loss, sustained stomatal closure constrained carbon assimilation and growth. Warming partially mitigated these effects, indicating that atmospheric dryness—not temperature alone—may dominate future constraints on plant production.

How to cite: Chandregowda, M., Tjoelker, M., Pendall, E., and Power, S.: Warming offsets productivity losses from high evaporative demand in a widespread C3 pasture grass, EGU General Assembly 2026, Vienna, Austria, 3–8 May 2026, EGU26-8431, https://doi.org/10.5194/egusphere-egu26-8431, 2026.

EGU26-10163 | ECS | Orals | BG3.37

High xylem redundance in the branches buffers the water household of trees against changes in the Huber Value 

Jaycie C. Fickle, Cedric Zahnd, Isaac Wells, and William R.L. Anderegg

A common effect of drought is the reduction of the hydraulic capacity as xylem is embolised. Furthermore, trees can prematurely shed leaves during more severe droughts, presumably to protect xylem from excessive embolisms. Both of these effectively change the ratio of water supply and demand (i.e. the ratio of sapwood to leaf area; Huber value). While changes in this ratio during drought should therefore affect a trees’ water household, this has never been experimentally tested at the branch level. 

We asked: How does experimentally changing the branch Huber value affect the branch water household in deciduous and evergreen trees? To address this question, we experimentally changed the Huber value of trembling aspen (Populus tremuloides) and subalpine fir (Abies lasiocarpa) branches and measured regular stomatal conductance and water potentials. We did this with a fully factorial experiment either removing half of the leaf area, cutting through half of the xylem area, or both on branches in situ.  At the end of the experiment, we conducted native and max hydraulic conductivity and dye perfusion measurements. We hypothesized that reducing leaf area leads to increased area-specific stomatal conductance, resulting in constant whole-branch transpiration. We also hypothesized that reducing sapwood area leads to a decrease in water potentials, stomatal conductance and hydraulic conductivity. 

We found that after leaf removal there was a small increase of stomatal conductance in aspen but not enough to keep whole-branch transpiration constant, otherwise we did not see any effects. Surprisingly, after cutting through the xylem area there was no difference in any measured traits. This implies that removing leaf area, at least in aspen, has a greater effect on the water household than removing xylem area. We found that in aspen, the xylem was transporting much less water than its potential, implying high xylem redundance. This pattern was not as strong in subalpine fir, as they were operating closer to their potential. These different responses between the species may be explained by their different anatomical types, as fir xylem is more resistant and less conductive than aspen wood. The high degree of branch xylem redundancy found here shows that the water household of trees can be buffered against substantial changes in the Huber value, indicating that drought-related seasonal changes in xylem or leaf area may not affect water relations as much as hitherto assumed.

How to cite: Fickle, J. C., Zahnd, C., Wells, I., and Anderegg, W. R. L.: High xylem redundance in the branches buffers the water household of trees against changes in the Huber Value, EGU General Assembly 2026, Vienna, Austria, 3–8 May 2026, EGU26-10163, https://doi.org/10.5194/egusphere-egu26-10163, 2026.

EGU26-10923 | ECS | Posters on site | BG3.37

Stronger impacts of spatial extent than duration on tree growth during megadroughts 

Huijuan Chen, Yao Zhang, and Hongying Zhang

Megadroughts are extreme drought events defined by exceptional severity, duration, and spatial extent, potentially causing irreversible impacts on regional hydrological conditions and terrestrial ecosystems. With climate change driving more frequent global droughts, the likelihood of megadroughts has increased. Yet, their spatiotemporal patterns, evolutionary trends, and ecological impacts over the past century remain underexplored. By using a state-of-the-art clustering method, we identified 50 megadrought events between 1901 to 2020, with geographical hotspots concentrated in the western United States, southern Africa, and the Mediterranean region. Both drought duration and spatial coverage have increased markedly alongside global warming. Analysis of tree-ring chronologies from 4,595 sites worldwide using mixed-effects models reveals that the spatial extent of droughts exhibit stronger negative impact on radial growth than drought duration. Extensive droughts are likely associated with enhanced atmospheric aridity and increased risks of insect outbreaks facilitated by regional-scale migration, thereby amplifying growth reductions. Our findings challenge the long-standing emphasis on drought duration as the primary determinant of ecosystem functioning.

How to cite: Chen, H., Zhang, Y., and Zhang, H.: Stronger impacts of spatial extent than duration on tree growth during megadroughts, EGU General Assembly 2026, Vienna, Austria, 3–8 May 2026, EGU26-10923, https://doi.org/10.5194/egusphere-egu26-10923, 2026.

EGU26-11192 | ECS | Posters on site | BG3.37

Drought and Heat Jointly Drive Forest Canopy Injury During Compound Climate Extremes 

Chuying Yu, Christopher Still, Matteo Detto, Yuhao Feng, Zhengfei Guo, Yingyi Zhao, Jinlong Peng, Adam Sibley, Loren Albert, and Jin Wu

Forests worldwide are increasingly exposed to compound climate extremes, yet the physiological and ecological pathways through which concurrent heat and drought damage vegetation remain poorly understood. These compound stresses pose significant risks to ecosystem resilience, but their interactive effects have rarely been quantified across large landscapes. The unprecedented June 2021 Pacific Northwest “Heat Dome” provided a unique natural experiment to address this gap. Using high‑resolution satellite imagery and spectral–temporal diagnostics, we mapped leaf scorch across 93,420 ha with 87% accuracy and quantified the relative contributions of abiotic drivers and species identity. Unexpectedly, water-stress variables, particularly rapid atmospheric drought captured by vapor pressure deficit anomaly, dominated spatial variation in canopy injury (35.5%), slightly exceeding the contribution from heat‑associated stress (33.1%). The synergistic effect of hydraulic stress and heat stress further amplified canopy injury. Species identity accounted for 19.1%, with divergent sensitivities: Thuja plicata was disproportionately vulnerable to water deficit, whereas Abies amabilis was most sensitive to elevated heat. Trait‑based analysis linked these vulnerabilities to distinct functional syndromes, enabling predictive insight into species‑specific responses. By disentangling damage drivers at the landscape scale, our findings advance understanding of forest responses to compound climate extremes, trait based predictive frameworks and provides actional insights for adaptive management under accelerating climate change.

How to cite: Yu, C., Still, C., Detto, M., Feng, Y., Guo, Z., Zhao, Y., Peng, J., Sibley, A., Albert, L., and Wu, J.: Drought and Heat Jointly Drive Forest Canopy Injury During Compound Climate Extremes, EGU General Assembly 2026, Vienna, Austria, 3–8 May 2026, EGU26-11192, https://doi.org/10.5194/egusphere-egu26-11192, 2026.

EGU26-11379 | Orals | BG3.37

Drought-induced water losses after stomatal closure across vascular plants 

Santiago Trueba, Régis Burlett, Guillaume Forget, Maximilien Larter, Daniela N’Do, Camille Ziegler, Kali Middleby, Guillermo Ángeles, Tarin Toledo-Aceves, Carolina Madero-Vega, and Sylvain Delzon

Drought and heat events can impose high evapotranspiration demands, pushing plants to close their stomata to prevent excessive water loss. Yet, plant leaves are not perfectly hermetic and water losses continue through leaky stomata and the cuticle. Post stomatal closure residual water losses, known as minimum conductance (gmin), are relevant since they indicate the water depletion rates under severe stress. We present the first standardized dataset of gmin values for 101 species spanning high phylogenetic and ecological diversities, from ferns to flowering plants. Our sampling also included different growth forms and life cycles from annual herbs to longevous trees. We show that minimum water vapor conductance is highly variable across species, and gmin shows a weak phylogenetic signal across vascular plants. Residual water lossesdiverged across growth forms and phenologies with greater water losses in annual herbaceous as compared to woody plants. Moreover, deciduous species showed higher water lossrates as compared to evergreen species, highlighting the integration of gmin in leaf economics, where long-lived leaves show higher capabilities to retain water under stress. We used stomatal measurements to model the other side of the conductance spectrum and estimated the maximum (gth max) leaf conductance capabilities. In the sampled vascular plants gmin was dissociated with gth max, revealing the lack of a clear tradeoff between maximum potential conductance efficiency and water retention. Unlike gmin, stomata-driven gth max has a high phylogenetic signal indicating that related species have similar maximal capacities of water conductance. Leaf conductance rates are negatively correlated with climate variables such as mean annual temperature and precipitation seasonality, revealing economies in water expenses in more seasonal, and hotter environments. As major drought events are coupled with significant heat stress, we further explored the relationship of gmin and photosynthetic thermotolerance (Tcrit, T50) in the diverse genus Quercus, to investigate potential interactions of thermal and drought sensitivities. Altogether, this presentation will provide recent advances on our understanding of the evolutionary physiology of water loss dynamics under heat- and drought-stress which will be cardinal to predict the fate of vegetation under global climatic changes.

How to cite: Trueba, S., Burlett, R., Forget, G., Larter, M., N’Do, D., Ziegler, C., Middleby, K., Ángeles, G., Toledo-Aceves, T., Madero-Vega, C., and Delzon, S.: Drought-induced water losses after stomatal closure across vascular plants, EGU General Assembly 2026, Vienna, Austria, 3–8 May 2026, EGU26-11379, https://doi.org/10.5194/egusphere-egu26-11379, 2026.

EGU26-11854 | ECS | Orals | BG3.37

Physiology of Pinus taeda: an Ice Age legacy?  Intraspecific variability in drought-related physiological traits among provenances from east and west of the Mississippi River Valley 

Elisabeth Ilinca, William M. Hammond, Andrew R. Cinquini, José M. Torres-Ruiz, Hervé Cochard, and Marylou Mantova

Human activities are increasing temperatures and reducing water availability, intensifying climate variability and extremes including heat waves and droughts, which threaten forest ecosystems. Here, we characterize and model intraspecific variability in physiological traits related to resistance to hotter droughts in loblolly pine (P. taeda). For this, we use complementary approaches to evaluate trait variation and potential differences between two populations that have been geographically and spatially separated since the last glacial maximum (21,000–5,000 years before present). Adaptive variation was investigated by phenotyping provenances originating east and west of the Mississippi River Valley, where long-term geographic separation has resulted in distinct population genetic structure. We used an integrated indicator, time to hydraulic failure (THF), predicted by a mechanistic hydraulic model, SurEau, to assess how trait combinations contribute to tree resistance to hotter droughts. Measured physiological traits included xylem vulnerability to cavitation, leaf and bark residual conductance, and leaf turgor loss point, each of which is known to be essential for tree drought resistance. Surprisingly, results indicate a tendency for THF to be lower in western provenances compared to eastern ones. Time to Hydraulic Failure was negatively correlated with residual stomatal conductance and leaf mass per area. This pattern suggests a physiological differentiation between populations, although it is not only determined by traits associated with drought resistance. Ongoing work aims to leverage this intraspecific variation to guide selection within and among tree species for more drought-resistant forests under continued climate change.

How to cite: Ilinca, E., Hammond, W. M., Cinquini, A. R., Torres-Ruiz, J. M., Cochard, H., and Mantova, M.: Physiology of Pinus taeda: an Ice Age legacy?  Intraspecific variability in drought-related physiological traits among provenances from east and west of the Mississippi River Valley, EGU General Assembly 2026, Vienna, Austria, 3–8 May 2026, EGU26-11854, https://doi.org/10.5194/egusphere-egu26-11854, 2026.

EGU26-11890 | ECS | Orals | BG3.37

Dry or hot air? Unraveling the growth stressors of European beech during drought periods 

Gerhard Schmied, Tina Köhler, Torben Hilmers, Yanqiao Li, Philip Hegarty, Mutez Ahmed, Chien Chen, Bálint Jákli, Thorsten Grams, Roman Meier, Nadine Rühr, and Richard Peters

Increasing atmospheric evaporative demand is a key driver of drought stress in European forests. Yet, it remains unclear whether high vapor pressure deficit (VPD) arising from elevated temperature or, in contrast, from reduced atmospheric humidity exerts a stronger constraint on tree growth. European beech (Fagus sylvatica L.), a dominant species in Central Europe, is particularly sensitive to drought-induced growth reductions, making it an ideal model to disentangle these mechanisms.

We conducted a unique controlled phytochamber experiment at the TUMmesa facility to isolate the effects of contrasting VPD drivers on intra-annual growth dynamics of beech trees. Six climate chambers simulated (i) control conditions with low VPD (max. ~1.3 kPa), (ii) high-VPD conditions induced by elevated temperature under control relative humidity (“hot air”), and (iii) high-VPD conditions induced by low relative humidity under control temperature (“dry air”). Both atmospheric drought treatments reached the same maximum VPD levels (~2.3 kPa), allowing direct comparison of temperature- versus humidity-driven VPD effects.

Tree growth was continuously monitored using high-resolution dendrometers, providing sub-hourly insights into stem growth. Atmospheric treatments were combined with contrasting soil textures and progressive soil drying to assess whether growth responses to VPD depend on soil hydraulic context.

By disentangling the growth effects of hot versus dry air under equivalent VPD, this study advances mechanistic understanding of how atmospheric drought shapes tree growth under climate change and improves predictions of forest productivity responses to increasing evaporative demand. Moreover, this experiment provides the basis for us developing advanced mechanistic growth models which can incorporate the impact of atmospheric and soil droughts.

How to cite: Schmied, G., Köhler, T., Hilmers, T., Li, Y., Hegarty, P., Ahmed, M., Chen, C., Jákli, B., Grams, T., Meier, R., Rühr, N., and Peters, R.: Dry or hot air? Unraveling the growth stressors of European beech during drought periods, EGU General Assembly 2026, Vienna, Austria, 3–8 May 2026, EGU26-11890, https://doi.org/10.5194/egusphere-egu26-11890, 2026.

EGU26-11930 | Posters on site | BG3.37

Stronger vegetation productivity responses to simultaneous atmospheric and soil compound drought–heat events 

Bo Yuan, Sung-Ching Lee, Jian Peng, and Peijun Du

Under climate warming, compound drought–heat events have become increasingly frequent and intense, posing growing threats to terrestrial ecosystem productivity. However, the spatiotemporal patterns of atmospheric and soil drought–heat stresses under different compound occurrence modes, and their impacts on vegetation productivity, remain poorly understood. In particular, atmospheric drought–heat events (ACDHE), soil drought–heat events (SCDHE), and simultaneous atmospheric and soil drought–heat events are often not explicitly distinguished, limiting clear assessments of ecosystem responses to compound climate extremes. Here, we identify ACDHE and SCDHE during 1982–2020 using ERA5 reanalysis data and the daily Standardized Precipitation Evapotranspiration Index (SPEI). ACDHE was detected based on maximum air temperature (Tmax) and SPEI, while SCDHE was identified using soil temperature and soil moisture. Based on their temporal concurrence, compound events are classified into three occurrence modes, including independently occurring ACDHE events (Indep_ACDHE), independently occurring SCDHE (Indep_SCDHE), and simultaneous atmospheric–soil compound events (Simultaneous). We quantified long-term changes in event frequency, duration, and intensity across the three modes, and further assess vegetation productivity losses using FluxSat gross primary productivity (GPP) data. Results show that during 1982–2020, all three compound drought–heat modes exhibit significant increasing trends in event frequency, duration, and intensity (p < 0.001). Indep_SCDHE shows the fastest increase in occurrence frequency (+0.14 events decade⁻¹), whereas simultaneous events display the strongest increase in duration (+0.51 days decade⁻¹). Indep_ACDHE exhibits comparatively smaller increases across all event characteristics. Analyses of vegetation responses indicate that simultaneous events are associated with more prolonged and severe vegetation impacts than independent events. Specifically, simultaneous events are associated with longer decline and recovery times than independent events, with decline and recovery times extended by about 1–2 days. In addition, simultaneous events exhibit greater productivity losses, with maximum GPP loss (Z-score) and cumulative GPP loss exceeding those of Indep_ACDHE by 0.09 and 4.60, and those of Indep_SCDHE by 0.01 and 0.99, respectively. This study explicitly distinguishes Indep_ACDHE, Indep_SCDHE, and simultaneous events, enabling a clearer quantification of vegetation productivity responses across compound drought–heat occurrence modes and highlighting the disproportionate impacts of simultaneous atmospheric–soil drought–heat events on ecosystem productivity under climate extremes. Building on these results, we are further investigating the relative roles of atmospheric, soil, and ecosystem-related drivers in shaping vegetation productivity responses across different compound drought–heat occurrence modes.

How to cite: Yuan, B., Lee, S.-C., Peng, J., and Du, P.: Stronger vegetation productivity responses to simultaneous atmospheric and soil compound drought–heat events, EGU General Assembly 2026, Vienna, Austria, 3–8 May 2026, EGU26-11930, https://doi.org/10.5194/egusphere-egu26-11930, 2026.

EGU26-12560 | ECS | Posters on site | BG3.37

Balancing heat and drought tolerance: evidence for physiological trade-offs in Quercus ilex 

Cross Heintzelman, Christoph Bachofen, Lindsey Urban, Helena Vallicrosa, Arianna Milano, Jean‐Marc Limousin, and Romà Ogaya

The combined occurrence of drought and heatwaves, known as hot droughts, poses a major threat to forest ecosystems by disrupting plant physiological processes and increasing tree mortality. Yet, the key physiological mechanisms underlying tree acclimation to hot droughts remain poorly understood, particularly where potential trade-offs between drought tolerance and thermotolerance may constrain acclimation. In addition, canopy microclimate, especially differences between sun-exposed and shaded leaves, may strongly modulate these responses but is rarely explicitly considered.

We investigated how acclimation to long-term precipitation exclusion (>20 years) in mature Quercus ilex trees affects their drought and heat tolerance. During the summer of 2025 (June, July, and August), we assessed physiological responses under control and drought treatments in sun-exposed and shaded leaves. Key measurements included thermal tolerance of photosynthesis and cell integrity (TEL), gas exchange, and plant water status.

We observed clear site- and treatment-dependent differences in thermal tolerance. Overall, control trees exhibited higher TEL than droughted trees, although the magnitude and direction of this effect varied between sites. In contrast, plant water potential showed limited treatment effects, potentially indicating hydraulic acclimation to long-term drought. Across both sites, sun-exposed and shaded leaves differed markedly in thermal tolerance, underscoring the role of microclimate. In droughted trees, sun-exposed leaves had higher TEL than shaded leaves in Spain, but in France, shaded leaves had higher TEL than sun-exposed leaves. In the control treatments, shaded leaves consistently had higher TEL at both sites.

Our results suggest that long-term drought acclimation alters physiological responses to heat stress in a canopy-position-dependent manner. While canopy microclimate strongly shapes thermotolerance, the extent to which drought and heat tolerance are linked by physiological trade-offs remains unclear. Understanding these interactions is critical for predicting forest resilience under future climate change.


How to cite: Heintzelman, C., Bachofen, C., Urban, L., Vallicrosa, H., Milano, A., Limousin, J., and Ogaya, R.: Balancing heat and drought tolerance: evidence for physiological trade-offs in Quercus ilex, EGU General Assembly 2026, Vienna, Austria, 3–8 May 2026, EGU26-12560, https://doi.org/10.5194/egusphere-egu26-12560, 2026.

The summer of 2022 was marked by unprecedented heatwaves and droughts across Europe and the Yangtze River Basin (YRB) in China, triggering record-breaking negative anomalies in gross primary productivity (GPP) since 2000. To elucidate the drivers of these shifts, we employed a machine-learning-based factorial experimental design using FluxSat GPP data to quantify the contributions of concurrent climatic drivers and short-term legacy effects—specifically biotic vegetation growth carryover (VGC) and abiotic lagged climatic effects (LCE). Our results demonstrate that legacy effects are the primary drivers of GPP fluctuations, with the preceding month exerting the strongest influence. Attribution analysis further reveals that during the peak of these compound hot-dry events, vapor pressure deficit (VPD) was the dominant driver of GPP anomalies. However, VGC from the previous month subsequently emerged as the leading factor, with its relative contribution intensifying as the events progressed.

How to cite: Wang, J. and Yan, R.:  Elucidating the Mechanisms of GPP Decline Triggered by Compound Drought-Heatwave extremes, EGU General Assembly 2026, Vienna, Austria, 3–8 May 2026, EGU26-13061, https://doi.org/10.5194/egusphere-egu26-13061, 2026.

EGU26-14027 | ECS | Posters on site | BG3.37

The stomatal regulation of 38 tree species as a window into water-use strategies under climate change 

Lena Sachsenmaier, Camilla Ahner, Lena Kretz, Ronny Richter, Ingmar Staude, Manon Sabot, and Christian Wirth

Climate change is increasing the compounding of droughts and heatwaves, causing widespread tree growth decline and mortality. To improve predictions of forest vulnerability, understanding current tree water-use strategies is critical. However, few data exist that contrast more than a handful of species’ responses to the same growth conditions.

We investigate water-use in 38 temperate tree species (27 angiosperms, 11 gymnosperms) at a research arboretum in Germany (ARBOfun, Großpösna). In the summer of 2024, we measured stomatal conductance (gs; which regulates carbon assimilation and transpiration) in three individuals per species repeatedly over diurnal cycles. The summer was hot, yet soil water availability remained sufficient. This allowed us to isolate stomatal responses to vapor pressure deficit (VPD), a key component of tree water-use strategies under atmospheric drought, and determine proxies of stomatal sensitivity to increasing atmospheric aridity, such as the inflection point of the gs-VPD curve. Species showed a wide variation in stomatal sensitivity to VPD, ranging from early-closing to high-VPD-tolerant strategies. Ongoing analyses relate these species-specific sensitivity proxies to leaf traits and growth responses, advancing our understanding of water-use diversity under climate change.

How to cite: Sachsenmaier, L., Ahner, C., Kretz, L., Richter, R., Staude, I., Sabot, M., and Wirth, C.: The stomatal regulation of 38 tree species as a window into water-use strategies under climate change, EGU General Assembly 2026, Vienna, Austria, 3–8 May 2026, EGU26-14027, https://doi.org/10.5194/egusphere-egu26-14027, 2026.

EGU26-14062 | ECS | Posters on site | BG3.37

Tree growth responses to extreme drought events are not well predicted by climate 

Victor Van der Meersch, Benjamin Cook, Michael Betancourt, and Elizabeth Wolkovich

The shifts in temperature, vapor pressure deficit, and soil moisture associated with anthropogenic climate change are causing new extremes for trees. Understanding their impact on tree growth, however, remains challenging given limited large-scale soil moisture data, the complex interaction between multiple climate drivers, and size-dependent tree growth. We developed a new modeling framework that integrates individual-level growth trends with species-specific climate sensitivities. This hierarchical Bayesian model can accommodate different sampling regimes and is specifically designed to capture extreme growth responses across trees, species and ecosystems. Using new soil moisture data from WLDAS, we apply the model to 1.6 million observations of tree-ring width across Western North America. We identify the significant drought period of the 2000-2007 as causing exceptional reductions in tree growth. These reductions are well beyond those predicted from direct responses to temperature, vapor pressure deficit and soil moisture or their interactions, suggesting gaps in our fundamental understanding of tree growth responses to climate. Ultimately, these results demonstrate that tree growth is a critical indicator of drought, and that many current models may underestimate growth declines associated with extreme drought events.

How to cite: Van der Meersch, V., Cook, B., Betancourt, M., and Wolkovich, E.: Tree growth responses to extreme drought events are not well predicted by climate, EGU General Assembly 2026, Vienna, Austria, 3–8 May 2026, EGU26-14062, https://doi.org/10.5194/egusphere-egu26-14062, 2026.

EGU26-14524 | ECS | Posters on site | BG3.37

Snow Drought Impacts on GPP Anomalies Across Ecoregions of the Northern Hemisphere  

Mariangela Varela, Franziska Koch, and David Gampe

Snow is critical for many ecosystems across the Northern Hemisphere, as snowmelt provides a reliable water supply during spring. However, the increasing frequency of snow droughts, defined by reduced or absent winter snow accumulation, poses a growing threat to soil moisture recharge and consequently, to terrestrial ecosystem functioning. Snow droughts are commonly quantified by reductions in snow water equivalent (SWE), which represent the amount of water stored in the snowpack. Reduced SWE limits soil water recharge during melt, leading to soil moisture deficits that can persist into the growing season, diminish late-season water availability and ultimately reducing plant productivity.

Despite their importance, the impacts of snow droughts on the terrestrial carbon cycle remain poorly understood, particularly with respect to gross primary productivity (GPP). Moreover, interactions between snow droughts, soil moisture and precipitation during the growing season, and their potential to amplify or offset ecosystem impacts are largely unknown.

Here, we investigate how and where snow droughts have adversely impacted GPP across various ecoregions of the Northern Hemisphere over the past decades. Using the LPJmL dynamic global vegetation model and observational, gridded snow and GPP products, we attribute summer GPP anomalies to snow droughts and identify a wide range of ecoregions where snow droughts both directly reduce GPP and amplify productivity losses when occurring in combination with low spring precipitation.

This research advances understanding the feedback mechanism across seasons between snow, soil moisture, and vegetation productivity, providing new insights into ecosystem vulnerability under a changing climate.

How to cite: Varela, M., Koch, F., and Gampe, D.: Snow Drought Impacts on GPP Anomalies Across Ecoregions of the Northern Hemisphere , EGU General Assembly 2026, Vienna, Austria, 3–8 May 2026, EGU26-14524, https://doi.org/10.5194/egusphere-egu26-14524, 2026.

EGU26-15298 | ECS | Posters on site | BG3.37

Restoring evergreen forests: trait-based evaluation and field monitoring for climate-resilient restoration 

Sharath Paligi, Ashish Kumar Yadav, Mohabbat Singh, Milind Patil, Nasla Najeeb, Samarpitha Sahu, Sharvani Deshpande, Soniya Gaude, Sushil Jangra, Vishal Sadekar, Tamanna Mishra, Rohit Naniwadekar, and Jaideep Joshi

The biodiverse northern Western Ghats, historically characterized by tropical evergreen forests, have undergone a pronounced shift toward deciduous vegetation following long-term anthropogenic disturbance, such as logging, plantations, and fire. This vegetation transition has led to declining biodiversity, altered ecosystem processes, and reduced hydrological stability. In the context of rising temperatures, prolonged dry periods, and increasingly variable moisture regimes, climate-smart restoration approaches are urgently needed to reestablish the native evergreen forest structure through strategic, trait-informed species selection.

To inform species choice for restoration programs, we established a replicated juvenile pot experiment comprising 16 species spanning a slow–fast growth spectrum. We measured functional traits associated with drought and heat resilience, including diurnal water-use patterns (stomatal conductance), embolism resistance, dehydration tolerance, and thermal tolerance.

Our preliminary analysis reveals trait covariation describing distinct hydraulic strategies among coexisting species. Clear differences emerge in diurnal water use patterns and dehydration tolerance among the studied species. Such differences in hydraulic strategies might improve ecosystem performance compared to monocultures under climate change. We are further investigating whether species with comparatively higher dehydration tolerance, and putative embolism and heat resistance can better withstand climatic stressors and exhibit improved growth performance, or trade-offs exist. Field monitoring of planted saplings will be essential to validate these preliminary insights and guide climate-resilient restoration in the northern Western Ghats.

How to cite: Paligi, S., Yadav, A. K., Singh, M., Patil, M., Najeeb, N., Sahu, S., Deshpande, S., Gaude, S., Jangra, S., Sadekar, V., Mishra, T., Naniwadekar, R., and Joshi, J.: Restoring evergreen forests: trait-based evaluation and field monitoring for climate-resilient restoration, EGU General Assembly 2026, Vienna, Austria, 3–8 May 2026, EGU26-15298, https://doi.org/10.5194/egusphere-egu26-15298, 2026.

EGU26-16939 | Orals | BG3.37

Leaf-scale physics and thermal infrared sensing provide a glimpse into drought and heat stress of beech trees 

Stan Schymanski, Richard Keim, Martin Schlerf, and Max Gerhards

Thermal infrared remote sensing is widely used to estimate transpiration rates and drought stress in crops (e.g. the Crop Water Stress Index, CWSI). However, interpretation of surface temperature data in forests is more difficult due to more complex canopy structure and uncertainty in the canopy aerodynamic resistance. To better understand the utility of canopy temperature data for drought detection in a deciduous forest, we mounted three thermal infrared (TIR) sensors on a tower, pointing onto the crowns of three individual beech trees, which were at the same time equipped with sap flow sensors and dendrometers used to record reductions in sapflow and increase in tree water deficit during dry periods. The tower was also equipped with sensors for air temperature, relative humidity, horizontal wind speed and net radiation, and the site was equipped with a rain gauge and soil moisture sensors at different depths down to 1 m depth.

Observed crown temperatures were put into relation with simulated temperature variations of two single 3 cm wide leaves, one with 0 stomatal conductance and one with infinite stomatal conductance, representing the extreme cases of a non-transpiring dry leaf, and a wet leaf, respectively.

Simulated dry leaf temperatures exceeded critical temperatures of 50 oC on several summer days in 2023 and 2024, indicating that evaporative cooling is needed to avoid permanent heat damage. At the same time, measured canopy temperatures deviated upwards from the simulated wet leaf temperatures with declining soil moisture and increasing tree water deficit as deduced from high-resolution dendrometer data. This illustrates the crucial effect of combined heat and drought stress, when evaporative cooling is most needed, but hampered by inadequate water supply.

The striking consistency between observed crown temperatures and simulated single-leaf temperatures of dry and wet leaves suggests that meteorological conditions at the top of the canopy (net radiation, air temperature and humidity, wind speed) are decisive for the energy balance of the majority of the leaves seen by the TIR sensors and opens the path to spatially resolved assessments of tree drought and heat stress. Hereby, characteristic leaf sizes play an important role for the interpretation of canopy temperature data, and for the vulnerability of plants to thermal stress during heat and drought waves. This presentation highlights these roles quantitatively and points to common pitfalls and knowledge gaps when modelling and interpreting leaf and canopy temperature data.

How to cite: Schymanski, S., Keim, R., Schlerf, M., and Gerhards, M.: Leaf-scale physics and thermal infrared sensing provide a glimpse into drought and heat stress of beech trees, EGU General Assembly 2026, Vienna, Austria, 3–8 May 2026, EGU26-16939, https://doi.org/10.5194/egusphere-egu26-16939, 2026.

EGU26-17558 | ECS | Posters on site | BG3.37

Seasonal variation in tolerance to short-term heat and freezing extremes across land-use-driven successional stages in Calluna vulgaris 

Bente Sagabraaten, Eirik Skogstad, Vigdis Vandvik, and Sonya Geange

Climate change is not only increasing mean temperatures but also the frequency and intensity of climatic extremes, including heat waves and freezing events. Such extremes directly affect plant physiological performance and increase stress and mortality risk in terrestrial ecosystems. Combined with land-use change such as shifts in agricultural management practices, increasing climate variability poses a growing threat to the semi-natural coastal heathlands of Europe, where the dwarf shrub Calluna vulgaris functions as a keystone species, influencing ecosystem structure and resilience.

Responses of Calluna to environmental stressors are known to vary across successional stages, which are determined by fire regimes which promote grazing, yet empirical data on how short-term temperature extremes affect physiological tolerance across life stages remain scarce. In addition, most studies address heat or cold tolerance in isolation, limiting our understanding of plant responses to the full range of thermal stress encountered throughout the seasons and under increasingly variable climatic conditions.

To address this knowledge gap, this experimental study investigates seasonal and ontogenic variation in leaf-level thermal tolerance limits of Calluna in the red-listed Norwegian coastal heathlands. The work is a contribution to an ongoing multi-season research effort at the semi-managed heathlands on Lygra in western Norway and includes four post-fire successional stages (pioneer, building, mature, and degenerative). Here, we focus on data collected so far during two key seasonal phases (autumn and winter), capturing contrasting physiological states relevant to thermal acclimation. Across these seasons, Calluna individuals are sampled from each successional stage and exposed to controlled short-term heat and freezing treatments designed to simulate extreme temperature events.

Thermal tolerance is quantified at leaf level using chlorophyll fluorescence to determine the temperature at which photosynthetic efficiency declines by 50% (T₅₀). Heat tolerance is assessed using water bath exposures across a temperature range of 20–56 °C, while freezing tolerance is measured using controlled freezing treatments down to −20 °C. In parallel, leaf functional traits are measured to examine links between seasonal shifts in key traits such as leaf area, thickness, and mass with the physiological temperature limits.

By identifying when and which successional stages are most vulnerable to thermal extremes, this work will improve our understanding of shrub-dominated ecosystem sensitivity and inform predictions of heathland resilience under an increasingly variable climate and increasing land abandonment. 

How to cite: Sagabraaten, B., Skogstad, E., Vandvik, V., and Geange, S.: Seasonal variation in tolerance to short-term heat and freezing extremes across land-use-driven successional stages in Calluna vulgaris, EGU General Assembly 2026, Vienna, Austria, 3–8 May 2026, EGU26-17558, https://doi.org/10.5194/egusphere-egu26-17558, 2026.

EGU26-17693 | ECS | Orals | BG3.37

Drought characteristics alters neighbourhood diversity effects on tree growth responses during extreme events  

Hernán Serrano-León, Haben Blondeel, Damien Bonal, Joannès Guillemot, Nicolas Martin-StPaul, Charlotte Grossiord, Florian Schnabel, Michael Scherer-Lorenzen, Georgios Skiadaresis, Jan Van den Bulcke, Kris Verheyen, Lander Baeten, and Jürgen Bauhus and the TreeDivNet-MixForChange team

Drought events of increasing frequency, intensity, and duration are driving widespread forest dieback and mortality worldwide. While mixed-species forests are promoted as a strategy to enhance resistance and resilience to drought, increasing species richness alone does not consistently improve tree growth responses. Moreover, the tree diversity effects under unprecedented multi-year droughts remain poorly understood.

Here, we used a network of planted tree diversity experiments to assess how neighborhood tree diversity and species-specific hydraulic traits influence drought-induced growth responses. We analysed tree-rings on 948 trees from 19 species across nine experiments spanning Europe’s major climate zones. All sites experienced recent severe droughts, including the record-breaking 2018–2020 multi-year drought. Experimental gradients in tree species richness (1–6 species) allowed us to disentangle tree diversity effects while controlling for environmental heterogeneity.

We quantified radial biomass growth using X-ray computed tomography, and assessed the physiological drought stress using the carbon isotope signal of tree rings in dry and wet years (∆δ13Cdry-wet). We used a functional trait framework to evaluate diversity effects at neighbourhood scale, using hydraulic safety margin (HSMTLP​) to characterise the species’ drought tolerance.

Tree growth responses were driven by drought characteristics, species drought tolerance, and neighborhood functional diversity, but not by neighborhood species richness per se. Increasing drought duration within a growing season shifted neighborhood diversity effects on growth from beneficial to negative. Under consecutive drought years, diversity effects on growth responses depended on site context, but strengthened in sites showing positive or negative effects. Neighborhood diversity reduced physiological drought stress (lower ∆δ13Cdry-wet) for drought-susceptible species (low HSMTLP) growing alongside drought-tolerant neighbors. Yet such changes in carbon isotopic composition were not directly coupled to growth responses during the same drought year.

Our results demonstrate that functional trait diversity—rather than species richness—determines how trees respond to extreme and prolonged drought. While mixing species with contrasting hydraulic strategies can alleviate physiological drought stress, increasing tree diversity does not always enhance growth resilience. The effectiveness of tree mixing is highly context dependent at neighborhood scale, and can shift with increasing drought duration and intensity. This underscores the need for trait-based approaches and locally-adapted solutions to make our forests more resilient to longer and harsher droughts.


Keywords: tree diversity, mixed plantation trials, TreeDivNet, multi-year drought, drought tolerance, functional traits, tree rings, X-ray computed tomography, 13C isotopic composition

How to cite: Serrano-León, H., Blondeel, H., Bonal, D., Guillemot, J., Martin-StPaul, N., Grossiord, C., Schnabel, F., Scherer-Lorenzen, M., Skiadaresis, G., Van den Bulcke, J., Verheyen, K., Baeten, L., and Bauhus, J. and the TreeDivNet-MixForChange team: Drought characteristics alters neighbourhood diversity effects on tree growth responses during extreme events , EGU General Assembly 2026, Vienna, Austria, 3–8 May 2026, EGU26-17693, https://doi.org/10.5194/egusphere-egu26-17693, 2026.

EGU26-17986 | ECS | Orals | BG3.37

Die or survive from drought? The role of cambium integrity in saplings resilience  

Marylou Mantova, Jansen Steven, Hervé Cochard, Claire Szczepaniak, Nicole Brunel-Michac, Sylvain Delzon, Andrew King, and José M. Torres-Ruiz

Hydraulic failure has been causally linked to cellular damage at the leaf level, yet the functional pathway connecting xylem dysfunction to whole-tree mortality remains unresolved. One recent hypothesis is that tree death ultimately depends on the loss of meristem vitality. However, because meristems are difficult to access and assess, their response to drought has rarely been investigated. Here, we aimed to identify whether reduced water supply resulting from hydraulic dysfunction directly compromises cambial integrity and determines tree survival. We subjected potted saplings of a gymnosperm species, Abies concolor, and an angiosperm species, Fagus sylvatica L. to severe drought by withholding water, generating different levels of loss of hydraulic functioning ranging from 30% to complete loss of conductivity (PLC 100). Prior to rewatering, water potential, percentage of embolism, relative water content, and level of cellular damage were quantified at the stem level, while cambial cell integrity was assessed using transmission electron microscopy. Sapling survival was monitored for one year following drought release.

Surprisingly, saplings of both species could display similar water potentials, relative water content status or level of hydraulic failure at the time of rewatering but exhibited different survival capacities. Saplings that maintained structurally intact cambial cells recovered, whereas those showing cambial damage died, regardless of their level of hydraulic status. Thus, our results provide direct evidence that cambium integrity represents a critical bottleneck linking hydraulic failure to tree mortality. They also evinced that the mechanisms behind loss of cambial cell integrity are mainly explained by the consequences of tree dehydration after hydraulic failure. Focusing on the water relocation towards cambial cells during a drought event could help understand the mechanisms associated with cambial cell death, and identify potential thresholds for improving the precisions of the mechanistic models aiming at predicting tree mortality.

How to cite: Mantova, M., Steven, J., Cochard, H., Szczepaniak, C., Brunel-Michac, N., Delzon, S., King, A., and Torres-Ruiz, J. M.: Die or survive from drought? The role of cambium integrity in saplings resilience , EGU General Assembly 2026, Vienna, Austria, 3–8 May 2026, EGU26-17986, https://doi.org/10.5194/egusphere-egu26-17986, 2026.

Abstract:

Increased frequency and duration of extreme heat and drought events threaten European forests. The mechanisms that trees, and oaks in particular, have evolved to cope with such events are not fully understood. In August 2024, forests across Central and Southeastern Europe experienced an unprecedented episode of premature leaf senescence (PLS). The most widespread PLS occurred in forests of northern Croatia, as well as in Hungary, Bosnia and Herzegovina, Serbia, Romania, and Bulgaria. The aim of our work was to investigate the extent, timing, and species-specific characteristics of PLS and, based on recovery in the following year, to which degree the observed senescence reflected a controlled physiological response or tree mortality.

We used meteorological data (FORESEE, ERA5-Land) in combination with satellite-derived spectral reflectances and vegetation indices (VI), to detect the event at the regional scale with Terra/MODIS (2000–2025) and place it in a multi-decadal context. At the local scale, we used 30 m resolution Harmonized Landsat–Sentinel-2 (HLS, 2017–2025) data for precise characterization of the onset and spectral signature of PLS. Forest management maps and soil data were used to investigate PLS occurrence and intensity with the respect to tree species and location in Croatia.

GRVI and red reflectance proved superior to NDVI for discriminating heat- and drought-induced PLS from the gradual damage of oak lace bug (Corythucha arcuata, Say), an invasive species affecting oaks and complicating remote-sensing monitoring of phenology events. Species-specific analyses revealed that although extreme meteorological conditions reduced photosynthetic activity across multiple forest types, premature leaf senescence predominantly affected sessile oak (Quercus petraea, (Matt.) Liebl.), while European beech (Fagus sylvatica) remained mostly unaffected. In central Croatia in 2024 approximately 67% of sessile oak experienced PLS, occurring on average 54 days earlier than the long-term mean timing of autumn senescence.

Spring 2025 green-up confirmed that PLS in sessile oak was a reversible stress response rather than widespread mortality. Our results highlight the capacity of sessile oak for controlled premature senescence as an adaptive strategy under compound climate extremes, with implications for forest resilience, carbon cycling, and management.


Keywords:

Premature leaf senescence, Sessile oak, Space-borne remote sensing, GRVI, extreme weather, HLS, MODIS.


Funding:

The study was supported by the EU NextGenerationEU through the Recovery and Resilience Plan for Croatia under the project Dendro-Carbon (No. 400-01/23-01/6-2), the Hungarian Scientific Research Fund (OTKA FK-146600), National Multidisciplinary Laboratory for Climate Change (RRF-2.3.1-21-2022-00014) project within the framework of Hungary's National Recovery and Resilience Plan, supported by the Recovery and Resilience Facility of the European Union.

How to cite: Marjanović, H. and Kern, A.: Extreme heat and drought induced large-scale leaf senescence in sessile oak in summer 2024 with near-full recovery in the following year, EGU General Assembly 2026, Vienna, Austria, 3–8 May 2026, EGU26-19269, https://doi.org/10.5194/egusphere-egu26-19269, 2026.

EGU26-19418 | ECS | Posters on site | BG3.37

Soil water uptake strategies of European tree species: a comparative study in a drought-prone forest ecosystem 

Mladen Ognjenovic, Martin Greve, Janna Wambsganß, Philipp Reiter, Friderike Beyer, and Matthias Arend

Understanding how tree species access and use water resources under conditions of more frequent and intense droughts is important for predicting the resilience of forest ecosystems to climate change. This knowledge is particularly needed in the light of recent droughts, which have led to unprecedented rates of tree mortality in European forests. The southern Rhine valley region of Rhineland-Palatinate and Hesse (Germany) was one of the most affected forest areas where massive crown dieback and tree mortality have been observed. The species-rich Lenneberg Forest in the centre of this region was selected for setting up an intensive monitoring plot for studying water use strategies in native broadleaved European tree species. The hydrological regime of this old-grown, species-rich forest is exclusively shaped by atmospheric precipitation and a deep reaching soil profile and thus offers ideal conditions for studying effects of drought on soil-plant water relations.

The research aim was to investigate the differences in soil water uptake depths among six co-occurring tree species (Fagus sylvatica, Quercus robur, Tillia cordata, Acer platanoides, Fraxinus excelsior, Prunus avium). Four sampling campaigns were carried out from 2023 to 2025 to collect soil water samples from various depths within the rooting zone of 57 selected trees. Thermal dissipation sap flow sensors were installed on all trees and the calculated sap flow velocities were used to estimate the water uptake time. Based on this, twigs for xylem water extraction were collected by tree climbers from the upper canopies. Stable isotope ratios of hydrogen (δ2H) and oxygen (δ18O) were measured in both soil and xylem water. Bayesian stable isotope mixing models were employed to estimate the relative contribution of each Root Water Uptake depth to the xylem water mixture on a species and individual-tree level. Electrical resistivity tomography was additionally used to visualize the spatial distribution of humidity across the soil profile.

During wet conditions the dominant source of xylem water was the topsoil layer (0-10 cm) across all species. However, with drying of the soil profile we found three different responses: (i) a pronounced downward shift in water uptake depth (Quercus robur, Fagus sylvatica, Fraxinus excelsior), (ii) slight shift toward deeper sources while maintaining primary reliance on the topsoil layer (Acer platanoides, Prunus avium), and (iii) continuous uptake from the topsoil (Tillia cordata). None of the species showed substantial contributions of deeper soil to the xylem water (20-30, 30-70 cm). This observation is consistent with a sustained depletion of water reserves in deeper soil layers during the vegetation period. Our findings contradict previous reports that trees continuously shift water uptake deeper into the soil profile with increasing drought. The consistent reliance on shallow soil water observed in this study highlights potential vulnerabilities of certain species to prolonged drought and underscores the need to integrate site-specific rooting and soil hydraulic constraints into forest management and climate adaptation strategies.

How to cite: Ognjenovic, M., Greve, M., Wambsganß, J., Reiter, P., Beyer, F., and Arend, M.: Soil water uptake strategies of European tree species: a comparative study in a drought-prone forest ecosystem, EGU General Assembly 2026, Vienna, Austria, 3–8 May 2026, EGU26-19418, https://doi.org/10.5194/egusphere-egu26-19418, 2026.

Since its spread across Central Europe, the Oak lace bug (Corythucha arcuata, Say 1832), an invasive species rapidly spreading since 2012, has caused persistent and spatially extensive canopy stress in oak-dominated forests, clearly detectable in satellite-derived vegetation indices. Between 2016 and 2024, characteristic NDVI declines associated with repeated infestations were consistently observed during the late summer, indicating chronic biotic stress superimposed on background climatic variability. During this period, the oak lace bug after establishment in an area showed only a weak interannual variability, but no signs of retreating.

Unexpectedly, in 2025 these biotic stress signals were largely absent across the affected regions. NDVI time series in 2025 showed substantially reduced late summer declines compared to previous years both in Hungary and Croatia, suggesting a sudden weakening of the oak lace bug-related canopy impacts. This abrupt change raises the question of which climatic mechanisms may have contributed to the apparent collapse of remotely sensed infestation signals. Two non-exclusive hypotheses are considered: (i) legacy effects of the extreme heat and drought conditions in August 2024, which caused widespread deterioration of oak canopy condition and may have disrupted host–insect interactions, and (ii) adverse winter conditions following the 2024 growing season, potentially affecting overwintering survival of the insect.

Using multi-year satellite time series (Harmonised Landsat-Sentinel-2, MODIS, VIIRS) and meteorological data (FORESEE), we investigated the changes in canopy greenness dynamics in relation to the preceding thermal, hydrological and seasonal weather extremes. Our analysis reveals a striking shift in the detectability of biotic stress signals and discusses possible climate-related controls on their persistence. The results demonstrate the value of satellite-based monitoring for capturing not only the emergence and spread of forest pests, but also their sudden decline, emphasizing the importance of considering compound and lagged climate effects when interpreting vegetation stress signals.

Keywords: Space-borne remote sensing, Vegetation indices, MODIS, Harmonized Landsat-Sentinel-2 dataset, invasive pest detection, extreme weather

Funding: The research has been supported by the Hungarian Scientific Research Fund (NKFIH FK-146600). This work has been implemented by the National Multidisciplinary Laboratory for Climate Change (RRF-2.3.1-21-2022-00014) project within the framework of Hungary's National Recovery and Resilience Plan, supported by the Recovery and Resilience Facility of the European Union. The study was supported by the EU NextGenerationEU through the Recovery and Resilience Plan for Croatia under the project Dendro-Carbon (No. 400-01/23-01/6-2).

How to cite: Kern, A. and Marjanović, H.: Reduction of oak lace bug-related NDVI signals in 2025 following nearly a decade of persistence: legacy effects of extreme heat & drought in 2024 or subsequent winter conditions?, EGU General Assembly 2026, Vienna, Austria, 3–8 May 2026, EGU26-20008, https://doi.org/10.5194/egusphere-egu26-20008, 2026.

EGU26-20659 | Orals | BG3.37

The European Psi-leaf network for monitoring tree water status during extreme drought 

Bernhard Schuldt, Benjamin Hafner, and Psi-leaf network

Central Europe experienced extremely dry conditions in spring 2025, with weather forecasts predicting another extreme summer drought similar to that of 2018. To evaluate the impact of extreme climatic and edaphic drought on Central European tree species, coordinated midday leaf water potential measurement campaigns were carried out at 51 forest sites across Europe, covering a total of 12 common native tree species (four conifers, four diffuse- and four ring-porous broadleaves). Fortunately, the summer turned out to be rather moist, contrary to the early summer weather forecasts, while Northern and Southern Europe experienced extremely hot and dry conditions, setting several negative records. Nevertheless, the members of this initiative performed monthly measurements campaigns between June and October 2025 at their sites as baseline measurements, awaiting the next extreme summer drought to continue the measurement campaigns.

Here, we introduce the European Psi-leaf network, which is open to everyone as long as common protocols are followed. These include water potential measurements using classic pressure chambers, as well as additional information at tree and site levels. We also present species-specific results on leaf water status regulation during a non-drought year, revealing clear patterns across wood porosity types.

How to cite: Schuldt, B., Hafner, B., and network, P.: The European Psi-leaf network for monitoring tree water status during extreme drought, EGU General Assembly 2026, Vienna, Austria, 3–8 May 2026, EGU26-20659, https://doi.org/10.5194/egusphere-egu26-20659, 2026.

EGU26-21212 | ECS | Orals | BG3.37

VPD ≠ VPD: Heat-driven increases in evaporative demand amplify water use sensitivity to soil drying in European beech (Fagus sylvatica L.) 

Yanqiao Li, Hegarty Philip, Dikshya Maharjan, Gerhard Schmied, Jana Zeppan, Nadine Rühr, Bálint Jakli, Roman Meier, Torben Hilmers, Richard Peters, Mutez Ahmed, and Tina Koehler

Earth is currently undergoing global warming and “atmospheric drying” as a result of the increase in atmospheric water vapor pressure deficit (VPD). Rising heat and VPD are exposing plants to two problems: water and temperature stress. Through closing, stomata prevent excessive water loss when the VPD is high, thereby protecting their hydraulic integrity. Conversely, through opening stomata, plants avoid overheating. As high temperatures increase VPD, an emergent trade-off arises between water saving and latent cooling. In nature, VPD inherently covaries with both temperature and relative humidity. The resulting net effect on the degree of stomatal openness and its variability in relation to pedoclimatic conditions remains elusive.  

To close this knowledge gap, we grew European beech (Fagus sylvatica L.) in controlled climate chambers leveraging lysimeters filled with loam or sand to simulate contrasting soil hydraulic environments.. Trees were subjected to irrigated and drought-stressed conditions. Three VPD treatments were imposed: (1) low VPD (1.3 kPa) via decreasing relative humidity (RH) and increasing temperature, (2) elevated VPD (2.3 kPa) via decreasing RH at stable temperature, and (3) elevated VPD (2.3 kPa) via increasing temperature at stable RH. We measured the following parameters: soil water content and potential, transpiration via custom-made sensors (TransP), gas exchange using LI-6800, and leaf water potential via optical dendrometers calibrated against Scholander Bomb point measurements.

When elevated VPD was driven by increasing temperature, plants transpired linearly with rising VPD until higher thresholds in wet soil compared to humidity-driven elevated VPD, and consequently exhibited a more pronounced sensitivity to soil drying across both textures, i.e., reductions in transpiration rate and leaf water potential in wetter soil conditions. In the temperature increase treatment, trees also demonstrated enhanced thermal tolerance in both soil textures, as indicated by a higher temperature at which the plant's photosynthetic efficiency drops by 50% (T50). No VPD treatment-induced differences emerged in above- and belowground morphology (e.g., root and leaf area), whole-plant hydraulic conductance, or pre-dawn stomatal conductance, suggesting primarily physiological rather than structural-hydraulic acclimation. Soil texture modulated response strength but not direction.

These results demonstrate that different drivers of increasing VPD profoundly alter plant water-use regulation: warming-induced rises in evaporative demand allow for sustained transpiration until higher VPD in wet soil but increases water use sensitivity to soil drying. Our results indicate the need for disentangling temperature- from humidity-mediated VPD, as VPD ≠ VPD.

How to cite: Li, Y., Philip, H., Maharjan, D., Schmied, G., Zeppan, J., Rühr, N., Jakli, B., Meier, R., Hilmers, T., Peters, R., Ahmed, M., and Koehler, T.: VPD ≠ VPD: Heat-driven increases in evaporative demand amplify water use sensitivity to soil drying in European beech (Fagus sylvatica L.), EGU General Assembly 2026, Vienna, Austria, 3–8 May 2026, EGU26-21212, https://doi.org/10.5194/egusphere-egu26-21212, 2026.

The Kranzberg Forest Roof Experiment (KROOF: https://www.lss.ls.tum.de/en/lsai/kroof/) is a long-term study investigating the impact of drought on about 100 mature European beech and Norway spruce trees in both pure and mixed stands. From 2014 to mid-2019, the trees were exposed to severe experimental drought conditions, after which they underwent a five-year recovery period. The main focus of the current study is to investigate how drought-naïve and drought-legacy trees respond to renewed droughts. Did the preceding drought, which caused a significant decline in physiological and morphological parameters such as photosynthesis, water consumption, growth and leaf area, weaken or strengthen the trees? Does growth in mixtures affect the response to renewed droughts?

Here, we present the results of two datasets. The first study made use of the natural summer drought in 2022. Drought-naïve trees exhibited strong negative effects of drought, such as reduced stomatal conductance and xylem sap flow, as well as reduced growth. Conversely, legacy trees recovering from the preceeding drought period showed significantly reduced drought stress. This was due to the lower water consumption of spruce trees, caused by their reduced whole-tree leaf area. Three years after the drought treatment, the leaf area of legacy spruce trees was still 30% lower than that of drought-naïve trees. Interestingly, legacy beech trees also benefited from the previous drought treatment despite not showing significant reductions in leaf area. It seems that beech trees benefited from the water saving of neighboring spruce trees, as their roots reach far into the soil under spruce.

The second study started in spring 2025 as the third phase of the KROOF experiment. Here we compare drought-naïve and legacy trees under experimentally induced drought conditions. In this phase of the KROOF experiment, the trees are exposed to extreme, potentially lethal drought conditions, with full exclusion of precipitation throughfall and stem runoff, over the whole year. Initial data support the hypothesis that legacy trees have acclimatised to the previous drought period. For instance, we observed a delayed reduction in predawn twig water potential in legacy trees compared to drought-naïve trees. While all trees have survived the extreme drought treatment thus far, we anticipate the first trees to die within the next two years, likely beginning with spruce. In the following years, we will study whether there are differences in mortality patterns between drought-naïve and legacy trees, and between growth in pure and mixed stands.

How to cite: Grams, T.: Come back stronger? The response of mature beech and spruce trees to renewed drought in a long-term throughfall exclusion experiment, EGU General Assembly 2026, Vienna, Austria, 3–8 May 2026, EGU26-21722, https://doi.org/10.5194/egusphere-egu26-21722, 2026.

EGU26-21906 | ECS | Posters on site | BG3.37

Predicting the imediate and legacy impact of the 2022 UK extreme summer on forest productivity. 

Cale Baguley and Martin De Kauwe

Climate change is increasing the frequency, intensity and duration of drought events. Globally, the observed area in drought was on average 27% for the period 2018-2022, up 74% compared to the period 1981-2017 (S. H. Gebrechorkos et. al. 2025). This global amplification of droughts has contributed to widespread declines in forest productivity and increased drought-induced mortality.

In line with global trends, the United Kingdom has experienced increasingly dry and hot summers, with record temperatures in excess of 40 °C measured in the summer of 2022. As this trend continues under climate change, predicting the immediate and legacy impact of droughts on forests is increasingly important for forecasting ecosystem functioning and resilience, and for constraining how carbon uptake modulates carbon-climate feedbacks.

Land surface models, including the UK land surface model (LSM) JULES (the Joint UK Land Environment Simulator), tend to overestimate the direct effects of water stress on gross primary productivity (GPP) and latent energy (LE) fluxes, whilst lacking a mechanistic representation of post-drought legacy effects. In this study, we implement two stomatal optimisation models into the JULES improving predictions of GPP and LE under drought conditions. We extend the hydraulic components of these models to capture the legacy impact of drought-induced hydraulic conductance loss. The first approach treats conductance loss as instantaneous, depending solely on the historic maximum water stress under drought. The second approach treats conductance loss as cumulative, depending on both the magnitude and length of the drought event.

Focussing on the 2022 UK drought at the Alice Holt eddy covariance site in Southern England, we find that our models predict reductions in GPP and LE of -6% and -20% respectively when comparing 2022 to non-drought years. Flux tower observations indicate a -20[+1,-11]% reduction in LE. While the instantaneous and cumulative hydraulic legacy models predict permanent conductance losses of 11.56[+0.02,-0.3]% and 7[±1]%, respectively, neither captures a notable decline in GPP or LE in the year following the 2022 drought.

We then asked what change in drought extremes would be required to induce hydraulic failure in this UK Oak Woodland. To test this, we repeated the simulated experiment,  intensifying the drought by removing spring rainfall (broadly consistent with spring 2025) and progressively reducing 2022 rainfall, first by half and then to a quarter of its original amount. The instantaneous and cumulative hydraulic legacy models, when applied to the half (quarter) rainfall, predict permanent conductance losses of 16.6[+0.1,-0.4]% (34[+0,-2]%) and 39[+2,-0]% (65.2[+0.6,-0.2]%) respectively. The larger permanent conductance losses under the increased drought conditions were sufficient to induce significant reductions in GPP and LE in the year following the drought.

Our results present an important advance in our ability to forecast the long-term impact of drought on tree productivity and resilience within LSMs. By mechanistically capturing both immediate and legacy hydraulic responses, these predictions provide a robust evidence base for decision-making related to forest management, the resilience of restoration plantings, and the role of forests in achieving net-zero emission strategies.

How to cite: Baguley, C. and De Kauwe, M.: Predicting the imediate and legacy impact of the 2022 UK extreme summer on forest productivity., EGU General Assembly 2026, Vienna, Austria, 3–8 May 2026, EGU26-21906, https://doi.org/10.5194/egusphere-egu26-21906, 2026.

EGU26-22742 | Posters on site | BG3.37

Impacts of climate anomalies on sap flow rates in a montane beech forest in the Italian eastern Alps 

Matteo Eccher, Tommaso Anfodillo, and Luca Belelli Marchesini

Beech is one of the most ecologically and economically important tree species in Europe and in the context of climate change it is expected to expand towards higher and cooler elevation in the Alpswhile facing stress and potential decline at its lower, warmer limits due to increased drought and heat.

Studying this species ecology is therefore essential to understanding its ability to cope with shifts of climatic regimes towards warmer mean temperatures and more frequent climatic anomalies.

This study evaluated the xylematic sap flux response of a beech stand in the eastern Alps at an elevation of 1250 m in the area of Cembra (Trentino, Italy), in relation to the climate anomalies occurred between 2019 and 2024, determined from a 20+ years archive of standard meteorological observations.

Experimental data were collected using Tree Talker (TT+) devices, which allow continuous monitoring of sap flux density (SFD) at hourly step by application of the thermal dissipation technique; probes were installed on 32 trees of similar size and hierarchy divided into three plots.

Raw flux data from individual trees were routinely subjected to data quality check, including the scrutiny of temperature probes correct functioning, data transmission errors, anomalous differences of temperature between heated and reference temperature probes produced by below canopy solar irradiance gradients

We first characterized the temporal variability of SFD from hourly to seasonal scale as well as the spatial one at individual tree scale and across plots.

The functional resistance of individual trees and of the stand during the identified anomalies in air temperature and VPD were analyzed by quantifying the variation in the daily mean and maximumSFD observed at the peak of the climate anomalies compared to pre-event conditions. Similarly, functional resilience was retrieved considering post-event conditions.

SFD differences among plants was large (up tp a factor 5), and to some extent explained by factors such as tree density and topography (slope, aspect). No significative relationships with tree diameter or height were found.

The seasonal and monthly pattern of sap flux resulted in being driven by two fundamental variables: total solar radiation and VPD, the former triggering the flux while the latter modulating its intensity.

Beech trees appeared to be able to maintain stable SFD values during moderate droughts and heat waves but showed a significant reduction (-45%) under more intense anomalies combining drought and heat waves, as in July 2022. Nevertheless, even after even such cases the monitored trees were able to restore pre-anomaly sap flux rates, exhibiting good resilience.

How to cite: Eccher, M., Anfodillo, T., and Belelli Marchesini, L.: Impacts of climate anomalies on sap flow rates in a montane beech forest in the Italian eastern Alps, EGU General Assembly 2026, Vienna, Austria, 3–8 May 2026, EGU26-22742, https://doi.org/10.5194/egusphere-egu26-22742, 2026.

EGU26-1004 | ECS | Posters on site | BG3.38

Assessing the ability of LPJ-GUESS-HYD to predict water stress responses in boreal forests 

Rose Brinkhoff, Filipe Gomes de Almeida, Thomas Pugh, Ceclia Akselsson, and Natascha Kljun

Boreal forests are increasingly exposed to extreme heat and altered precipitation patterns, leading to periods of water stress that threaten their capacity to provide important ecosystem services. Management interventions can improve the resilience of forests to water stress, but our ability to implement such adaptation methods is contingent upon accurate identification of areas most susceptible to the adverse effects of this water stress. Recent advances in dynamic vegetation modelling have improved our ability to predict water stress responses in forests, including the integration of plant hydraulic processes into the ecosystem model LPJ-GUESS. Here, we evaluate the ability of this new adaptation, LPJ-GUESS-HYD, to detect water stress in three forests across Sweden. We identified periods of moderate, severe and extreme drought based on the Standardized Precipitation-Evapotranspiration Index (SPEI), and compared LPJ-GUESS-HYD carbon flux simulations with ICOS eddy-covariance flux data and satellite-based vegetation indices in drought and non-drought periods from 2015 to 2022. We found that LPJ-GUESS-HYD could accurately capture many water-stress-induced shifts in carbon fluxes and vegetation indices. However, its ability to detect these water stress responses varied largely between sites and years, and depended on the duration and intensity of the water stress. Our results provide insight into the factors determining the efficacy of LPJ-GUESS-HYD for predicting water stress responses, and highlight areas where improvement is needed.

How to cite: Brinkhoff, R., Gomes de Almeida, F., Pugh, T., Akselsson, C., and Kljun, N.: Assessing the ability of LPJ-GUESS-HYD to predict water stress responses in boreal forests, EGU General Assembly 2026, Vienna, Austria, 3–8 May 2026, EGU26-1004, https://doi.org/10.5194/egusphere-egu26-1004, 2026.

EGU26-1574 | ECS | Posters on site | BG3.38 | Highlight

Remote Sensing of Urban Forests in Nairobi City linking it to policy changes and implementation 

Rita Kabugi and Balázs Székely

Rapid urbanization in Nairobi (Kenya) is rapidly degrading its urban forests, threatening the city’s long-held identity as the “green city in the sun.” The loss of tree cover in Karura, Ngong Road Forest, and Oloolua reflects a broader problem of deforestation driven by development pressure and weak policy enforcement. This issue is particularly specific because Nairobi’s unique combination of rapid urban growth, legal gaps, and intense competition for land makes forest decline occur more severely here than in many other African cities. It also represents a distinct case where national legislation such as the Forest Act (2005) and EMCA (2015) exist but their implementation within an urban setting remains inconsistent. 

The data for this research included multi-temporal satellite imagery accessed through Google Earth Engine, focusing on Landsat and Sentinel datasets spanning 2000 to 2024. These datasets were used to generate vegetation indices such as NDVI to quantify forest cover change across the three major urban forests. Complementary policy documents, county urban planning records, and environmental legislation were analyzed to contextualize the observed changes. 

The methodology combined remote sensing analysis and GIS mapping using platforms such as Google Earth Engine and QGIS. NDVI computation, supervised classification, and change detection techniques were applied to assess temporal and spatial forest cover decline. This geospatial work will be integrated with qualitative policy evaluation to identify the governance gaps driving the ecological trends. 

The results showed a clear downward trend in forest cover over the last five decades, with sharper losses occurring during periods of accelerated urban expansion. We anticipated demonstrating misalignment between policy intentions and actual land-use outcomes, particularly were development overrides environmental protections. These results will likely reveal the need for stronger urban forest governance. 

This research is important because it offers a science-based understanding of how policy failures directly shape ecological degradation in growing cities. It contributes to the broader field of global environmental change by linking remote sensing evidence with governance analysis. Ultimately, the study provides an outlook for improving urban sustainability, guiding policymakers and planners in protecting Nairobi’s remaining forests while addressing future urban growth pressures. 


How to cite: Kabugi, R. and Székely, B.: Remote Sensing of Urban Forests in Nairobi City linking it to policy changes and implementation, EGU General Assembly 2026, Vienna, Austria, 3–8 May 2026, EGU26-1574, https://doi.org/10.5194/egusphere-egu26-1574, 2026.

Rising air temperature and atmospheric evaporative demand are fundamentally altering plant water relations, yet their long-term consequences for drought vulnerability and mortality remain poorly constrained. While short-term physiological responses to heat and high vapor pressure deficit (VPD) are increasingly well documented, far less is known about how chronic exposure reshapes plant water-use strategies, hydraulic regulation, and the mechanisms underlying mortality risk under future climates.

Here, I synthesize experimental and field evidence showing that exposure to elevated temperature and evaporative demand can induce lasting acclimation in plant water-use behaviour. Results from manipulative experiments in mature forests and controlled conditions reveal that acclimation to atmospheric conditions can modify stomatal regulation, whole-plant transpiration, crown structure, and the coordination between soil and atmospheric drought responses. In some cases, these adjustments maintain carbon gain under moderate stress but accelerate soil water depletion and shift physiological thresholds governing stomatal closure and hydraulic safety during drought. Such acclimation effects can translate into altered drought outcomes, including changes in mortality risk. Together, these findings suggest that acclimation to warmer and drier atmospheric conditions does not necessarily confer increased drought resistance, but may instead reconfigure vulnerability by modifying how and when plants restrict water loss.

By linking physiological acclimation, water use, and emerging mortality patterns, this presentation highlights the need to explicitly account for atmospheric history and acclimation processes when predicting vegetation responses to future climate scenarios. Understanding when acclimation buffers stress, and when it amplifies risk, will be critical for improving projections of forest resilience under continued warming and intensifying atmospheric drought.

How to cite: Grossiord, C.: When acclimation backfires: how chronic heat and atmospheric drought reshape plant water-use strategies and mortality risk, EGU General Assembly 2026, Vienna, Austria, 3–8 May 2026, EGU26-1705, https://doi.org/10.5194/egusphere-egu26-1705, 2026.

Deadwood is an important component of the global forest carbon pool, with its decomposition regulated by both biotic and abiotic factors. Current Earth system models typically predict that global warming will accelerate microbial-mediated decomposition, however, these models often overlook the biogeographical constraints of wood-decay fungal communities. In this study, we integrated distribution and decomposition data of 19 representative wood-decay fungi into an interpretable machine-learning framework to simulate spatiotemporal patterns of fungal communities and quantify variations in deadwood carbon fluxes under climate change. We show that the fungal richness will increase rapidly in the future, but the global net carbon emission flux driven by fungal decomposition is projected to decline rather than rise under the high-emission scenario (SSP5-8.5). By 2100, net carbon emissions decrease by approximately 25.1% relative to the baseline (from 0.147 ± 0.052 Pg C to 0.110 ± 0.036 Pg C). This trend primarily stems from a community functional restructuring driven by temperature and moisture: the expansion of brown-rot fungi in boreal forests (+72.7%) leads to significantly enhanced carbon retention (+14.12%), whereas warming-induced moisture stress suppresses white-rot fungi decomposition rates, reducing carbon emissions in tropical and temperate forests by 37.4% and 11.7%, respectively. Our results reveal the "biological buffering" role of wood-decay fungal functional restructuring in the global carbon cycle, providing a foundation for improving future forest carbon sink simulations.

How to cite: Ni, C., Liu, S., and Zhu, B.: Climate-driven functional restructuring of wood-decay fungi dampens global deadwood carbon emissions, EGU General Assembly 2026, Vienna, Austria, 3–8 May 2026, EGU26-3736, https://doi.org/10.5194/egusphere-egu26-3736, 2026.

EGU26-3924 | ECS | Orals | BG3.38

High Biomass Forests are more Susceptible to Bark Beetle Disturbance in Europe 

Viola Heinrich, Katja Kowalski, Alba Viana Soto, Simon Besnard, Wanda de Keersmaecker, Ruben Van de Kerchove, and Cornelius Senf

European forests have seen a rise in both harvest and natural disturbances (i.e., bark beetle and windthrow disturbances) in the last decades, with consequences for Europe’s Forest carbon sink, which is already declining in some countries. Among natural disturbances, drought-driven bark beetle outbreaks accounted for a third of unplanned canopy openings between 2015 and 2020. Bark beetles are theorised to preferentially target high-biomass forests, due to favourable breeding material, suggesting that the major outbreaks in 2018–2020 were inevitable in high-biomass spruce forests. However, direct comparison of forest biomass in pre-disturbance and undisturbed forests using remote sensing data remain unexplored despite their critical implications for future forest management.

We hypothesise that forests subject to upcoming bark beetle disturbances have a higher biomass than forests that have remained undisturbed throughout the satellite era. To test this, we combine 30m spatial scale forest disturbance data (1984 to 2023) with a 30m PlanetScope-based aboveground biomass (AGB) map for 2019 and a 10m forest genus map based on Sentinel-1/2. This approach allows us to examine forest AGB in 2019 before disturbances between 2021 and 2023 occurred, which we term “forests with upcoming disturbances.” We compared this with AGB in nearby (within 10km) forests that remained unaffected by disturbances throughout the entire period, termed “undisturbed forests”. Additionally, we included nearby forests that experienced disturbances between 1984 and 2019, referred to as “disturbed forests”.

Preliminary results show that needleleaf forests subject to upcoming unplanned disturbances have significantly higher AGB compared to nearby undisturbed forests, particularly in spruce forests, where biomass values are, on average, 30Mg/ha higher than undisturbed spruce forests. In contrast, no statistical difference was found between the biomass of spruce forests subject to upcoming harvest and undisturbed forests.

Enhancing the carbon sink in European forests is a crucial climate mitigation strategy and for achieving the European Green Deal goals. Prioritising the restoration of spatially heterogeneous forests over merely high biomass forests is therefore a crucial consideration. This strategy could help mitigate the increasing risk of bark beetle outbreaks under global warming.

How to cite: Heinrich, V., Kowalski, K., Viana Soto, A., Besnard, S., de Keersmaecker, W., Van de Kerchove, R., and Senf, C.: High Biomass Forests are more Susceptible to Bark Beetle Disturbance in Europe, EGU General Assembly 2026, Vienna, Austria, 3–8 May 2026, EGU26-3924, https://doi.org/10.5194/egusphere-egu26-3924, 2026.

EGU26-4330 | ECS | Orals | BG3.38

 Pervasive increase in tree mortality across the Australian continent 

Ruiling Lu, Laura Williams, Raphael Trouvé, Brett Murphy, Patrick Baker, Hannah Carle, David Forrester, Peter Green, Michael Liddell, Crispen Marunda, David Mannes, Richard Mazanec, Michael Ngugi, Victor Neldner, Lynda Prior, Katinka Ruthrof, Shaun Suitor, Jianyang Xia, and Belinda Medlyn

Widespread climate-driven increases in background tree mortality rates have the potential to reduce the carbon storage of terrestrial ecosystems, challenging their effectiveness as natural buffers against atmospheric CO2 enrichment with major consequences for the global carbon budget. However, the global extent of trends in tree mortality and their drivers remains poorly quantified. The Australian continent experiences one of the most variable climates on Earth and is host to a diverse range of forest biomes that have evolved high resistance to disturbance, providing a valuable test case for the pervasiveness of tree mortality trends. Here, we compiled an 83-year tree dynamics database (1941-2023) from > 2,700 forest plots across Australia covering tropical savanna and rainforest, and warm and cool temperate forests, to explore spatiotemporal patterns of tree mortality and the associated drivers. Over the past eight decades, we found a consistent trend of increasing tree mortality across the four forest biomes. This temporal trend persisted after accounting for stand structure and was exacerbated in forests with low moisture index or a high competition index. Species with traits associated with high growth rate – low wood density, high specific leaf area, and short maximum height – exhibited higher average mortality, but the rate of mortality increase was comparable across different functional groups. Increasing mortality was not associated with increasing growth, given that stand basal area increments either declined or remained unchanged over time, but it was associated with increasing temperature over time. Our findings suggest that ongoing climate change has driven pervasive shifts in forest dynamics beyond natural recovery in a range of forest biomes with high resilience to disturbance, threatening the enduring capacity of forests to sequester carbon under current and future climate scenarios.  

How to cite: Lu, R., Williams, L., Trouvé, R., Murphy, B., Baker, P., Carle, H., Forrester, D., Green, P., Liddell, M., Marunda, C., Mannes, D., Mazanec, R., Ngugi, M., Neldner, V., Prior, L., Ruthrof, K., Suitor, S., Xia, J., and Medlyn, B.:  Pervasive increase in tree mortality across the Australian continent, EGU General Assembly 2026, Vienna, Austria, 3–8 May 2026, EGU26-4330, https://doi.org/10.5194/egusphere-egu26-4330, 2026.

Rising temperatures and droughts increasingly affect tree growth in European forests. However, there is a limited understanding of how the changing climate alters intra-annual growth dynamics and phenology, which are key drivers of tree productivity and carbon uptake. To address this knowledge gap, we investigated how changes in temperature, precipitation and vapour pressure deficit (VPD) affect tree growth dynamics as well as the timing and duration of the growing season using a network of automatic dendrometers installed on more than 2500 trees of various functional types (broadleaf, coniferous, deciduous, evergreen) in major European forest ecosystems - boreal, temperate, and Mediterranean. In this ongoing project, the dendrometers have been measuring tree growth with high precision (1 µm) and frequency (15 minutes) for over 4 years, covering both climatically average and unusually hot years 2022 and 2023. The growth and growth phenology variables derived from dendrometer data were modelled as a function of the climate variables obtained from the E-OBS database. Significant variations in intra-annual growth dynamics were observed across all forest ecosystems over the study period. The growing period was substantially shorter in hot and dry years compared to hot and wet years or years with average conditions. This reduction was primarily due to a significantly earlier growth cessation (by over a month in some years), which offset a slightly earlier growth onset after winter dormancy (by up to 7 days). The large shifts in growth cessation to earlier dates were strongly associated with lower precipitation and higher VPD during the month with maximum growth (May-July), while the earlier growth onset was related to elevated early spring temperatures. Also, higher VPD and lower precipitation were the main causes of reduced growth rates in the hot and dry years. Although the magnitude of the effect varied, the pattern of precipitation and VPD strongly influencing growth and phenology, with temperature playing a lesser role, was consistent across ecosystems and species. Because lower growth rates and the shorter growing season were strongly linked to a decline in total yearly growth in all the ecosystems, it is evident that changes in atmospheric dryness and water availability are likely to be the main drivers of climate-induced shifts in tree growth phenology, productivity and carbon uptake in European forests under a warming climate.

How to cite: Matula, R. and Plichta, R.: Unravelling the influence of climate change on tree growth patterns and phenology in European forests , EGU General Assembly 2026, Vienna, Austria, 3–8 May 2026, EGU26-4526, https://doi.org/10.5194/egusphere-egu26-4526, 2026.

EGU26-4778 | ECS | Posters on site | BG3.38

Early Warning Signals for Tree Mortality: A Review of Indicators, Limitations, and Emerging Opportunities 

Pascal Schneider, Arthur Gessler, and Jelle Lever

Tree mortality is increasing worldwide, intensifying the need for forest monitoring systems that can detect vulnerability before irreversible damage occurs. Predicting mortality remains difficult because tree death results from interacting predisposing conditions, inciting disturbances, and contributing agents that unfold over time. These drivers interact with recovery processes in highly non-linear ways, creating cascading stress trajectories in which trees may cross tipping points beyond which recovery becomes impossible.

This review synthesizes the literature on resilience indicators and early warning signals for assessing tree mortality risk. Existing approaches span a broad range, from threshold-based indicators and model-based risk predictions to disturbance-focused recovery metrics and indicators derived from changes in time-series dynamics. Despite their conceptual diversity, most approaches share two key limitations. First, many overlook the tree-level physiological stress history, such that similar drought events may lead to minimal or catastrophic damage depending on prior stress exposure. Second, many indicators are often too late for operational resilience monitoring, relying on retrospective data or signals that typically emerge only after substantial structural damage has already occurred.

Physiological theory and empirical evidence indicate that stress responses relevant to mortality risk arise at the level of hormonal regulation and stomatal control, affecting photosynthesis, transpiration, and leaf reflectance well before structural damage occurs. Recent advances in sensor technology now enable high-frequency observation of these processes through a growing range of in-situ and remote measurements. Yet few frameworks exist to interpret such time series as early warning signals. While resilience theory offers promising concepts for understanding critical transitions, it has rarely been applied to real-time forest monitoring. We highlight this gap and emphasize the role of controlled experiments in validating which physiological signals reliably precede mortality, enabling the translation of high-frequency measurements into actionable early warning indicators.

How to cite: Schneider, P., Gessler, A., and Lever, J.: Early Warning Signals for Tree Mortality: A Review of Indicators, Limitations, and Emerging Opportunities, EGU General Assembly 2026, Vienna, Austria, 3–8 May 2026, EGU26-4778, https://doi.org/10.5194/egusphere-egu26-4778, 2026.

EGU26-4817 | Orals | BG3.38

Record decline and slowing down of canopy-greenness in Amazonia during the 2023/2024 drought 

Allan Buras, Vanessa Ferreira, Nathielly P. Martins, Franziska Schnell, and Anja Rammig

In 2023/2024 Amazonia was struck by a record drought[1]. To date, only few studies have quantified the impact of this event on the Amazon rainforest. While these studies provide first insights on the response of Amazonia to the record drought, they did not include the second peak of drought in September 2024 or assess recovery trajectories succeeding this event.

To fill this gap, we here present analyses based on observations spanning 23 years of canopy-greenness. In particular, we compare the impact of the 2023/2024 drought with previous major droughts and quantify long-term trends of the enhanced vegetation index (EVI), extending the period under investigation from previous studies by more than a year. Moreover, we evaluate indicators of slowing down and reduced forest resilience, i.e. temporal autocorrelation and variance[2]. Finally, we assess how shallow water-table depth have buffered canopy-greenness decline as done in previous studies[3,4].

We observed record low EVI and declining forest resilience as indicated by a rising temporal autocorrelation and variance which remained on record levels even after the drought relaxation early in 2025. Specifically, the area featuring more than 10 % EVI decline reached a record spatial extent of 14 % early in 2025, while the spatial shares of regions featuring high temporal autocorrelation and variance were 2 and 3.4 times higher than under average conditions. Moreover, we observed shallow water tables to significantly buffer the negative drought impact on canopy greenness. Interestingly, shallow water tables appeared to be more prone to a slowing down which remains subject to further investigation. Taken together, our results point at an unprecedented decline and slowing down of canopy greenness dynamics in Amazonia up until September 2025, indicating the necessity to more closely assess direct and ongoing impacts of this event by means of ground observations, remotely-sensed indicators of productivity (e.g. SIF, VOD), and simulations from dynamic vegetation models.


[1]        Ferreira V, Buras A, Zscheischler J, Mahecha M and Rammig A 2025 Evaluating the 2023–2024 record dry-hot conditions in the Amazon in the context of historical compound extremes Environ. Res. Lett. 20 084055

[2]        Scheffer M, Bascompte J, Brock W A, Brovkin V, Carpenter S R, Dakos V, Held H, van Nes E H, Rietkerk M and Sugihara G 2009 Early-warning signals for critical transitions Nature 461 53–9

[3]        Costa F R C, Schietti J, Stark S C and Smith M N 2023 The other side of tropical forest drought: do shallow water table regions of Amazonia act as large-scale hydrological refugia from drought? New Phytologist 237 714–33

[4]        Chen S, Stark S C, Nobre A D, Cuartas L A, de Jesus Amore D, Restrepo-Coupe N, Smith M N, Chitra-Tarak R, Ko H, Nelson B W and Saleska S R 2024 Amazon forest biogeography predicts resilience and vulnerability to drought Nature 631 111–7


How to cite: Buras, A., Ferreira, V., Martins, N. P., Schnell, F., and Rammig, A.: Record decline and slowing down of canopy-greenness in Amazonia during the 2023/2024 drought, EGU General Assembly 2026, Vienna, Austria, 3–8 May 2026, EGU26-4817, https://doi.org/10.5194/egusphere-egu26-4817, 2026.

EGU26-7155 | Orals | BG3.38

Is it really only due to the drought? 

Paolo Cherubini

Since 2010, when Allen et al.'s highly-cited seminal paper was published in Forest Ecology and Management, a flood of studies have been published on the impact of drought on forest health and condition as well as tree physiology, greatly advancing our understanding of tree physiology and mortality processes. However, these findings have been interpreted by many as signs of a global forest decline due to the increasing frequency and severity of droughts linked to climate change. Upon closer examination of the literature, it appears that forest decline is limited to certain areas in certain regions and is not always induced by drought and associated or related disease and pest attacks, but also by other disturbances, such as windstorms or forest fires. All these disturbances  are often facilitated by past changes in land use, such as afforestation in not suited sites or deforestation due to conversion of land to agricultural crops. Social pressure on land and forest appears to play a key role in forest decline, in addition to the role played by drought, as in the case of the forest decline observed in Central Europe in the 1980s, probably triggered by the drought of 1976, although it is generally believed to have been caused by atmospheric pollution.

How to cite: Cherubini, P.: Is it really only due to the drought?, EGU General Assembly 2026, Vienna, Austria, 3–8 May 2026, EGU26-7155, https://doi.org/10.5194/egusphere-egu26-7155, 2026.

EGU26-7181 | ECS | Posters on site | BG3.38

Degradation amplifies Amazon forest vulnerability to extreme drought: evidence from the 2023–2024 ENSO event 

Yi Zhao, Yuhao Pan, Guangqin Song, and Jin Wu

The Amazon rainforest is a cornerstone of global climate regulation, carbon sequestration, and biodiversity conservation. However, its resilience is increasingly undermined by the combined pressures of mega-scale recurrent ENSO droughts and forest degradation. Such mega-droughts, amplified by rising temperatures and declining water, are known to suppress tropical forest functioning. Yet the basin-wide sensitivity of degraded versus intact forests to these events has remained poorly quantified. Here, we present preliminary basin-scale analyses of the unprecedented 2023–2024 Amazon drought, which was driven by a confluence of large-scale climatic anomalies, including a strong El Niño, tropical North Atlantic warming, and widespread marine heatwaves. This drought event produced record-low rainfall, sustained soil moisture deficits, and temperature anomalies across much of the basin. Leveraging satellite-derived canopy greenness (Enhanced Vegetation Index, EVI) and spatially paired comparisons between degraded and intact forest areas, we find that degradation markedly amplifies drought impacts: degraded forests exhibited an average greenness loss 2.43 times greater than intact forest during this drought event. Machine-learning attribution highlights drought duration and soil fertility as the dominant drivers of this vulnerability gap, with secondary modulation by baseline climatic conditions and canopy height loss. Predictive simulations further indicate that even moderate future degradation of currently intact forests could trigger functional impairment under recurring drought regimes, with northern white-sand zones and southern Arc of Deforestation emerging as high-risk hotspots. These preliminary results provide the basin-wide evidence that forest degradation and extreme drought act synergistically to intensify vegetation greenness decline, reframing Amazonian resilience as conditionally stable and highly sensitive to forest degradation. This work underscores the urgent need to incorporate forest degradation into climate impact assessments and conservation strategies to safeguard the Amazon’s ecological and climate-regulating functions.

How to cite: Zhao, Y., Pan, Y., Song, G., and Wu, J.: Degradation amplifies Amazon forest vulnerability to extreme drought: evidence from the 2023–2024 ENSO event, EGU General Assembly 2026, Vienna, Austria, 3–8 May 2026, EGU26-7181, https://doi.org/10.5194/egusphere-egu26-7181, 2026.

EGU26-7359 | ECS | Orals | BG3.38

A Process-Based Framework for Predicting Climate-Driven Insect Outbreaks and Their Forest Biogeochemical Impacts 

Yimian Ma, Jofre Carnicer, Christian Wirth, Lena Wunderlich, Detlef Bernhard, Albert Jornet Puig, Zaehle Sönke, and Ana Bastos

Insect outbreaks have been reported to increase worldwide in association with more frequent   droughts and warming temperatures. Outbreaks of bark beetles and defoliators can cause substantial tree mortality and forest die-off, posing significant threats to carbon sequestration and forest functioning. Climate change can exacerbate such outbreaks by expanding insect habitats, reducing overwinter mortality rates, and enabling multiple generations within a single year. However, the dynamics and potential global impacts of insect outbreaks under climate change remain poorly understood due to the lack of fully coupled terrestrial biosphere models that incorporate both predictive insect population dynamics and their biogeochemical effects. Here, we propose a novel framework to simulate the population dynamics of representative insect types. The model simulates degree-day-based insect development to track transitions among life stages during the growing season, capturing climatic regulation on both phenology and outbreak emergence. This framework successfully reproduced realistic intra-annual population dynamics and temperature-triggered outbreaks at reported bark beetle and defoliator outbreak sites. Idealized future climate simulations reveal increasing outbreak frequency and potential perturbations to forest functioning and carbon storage under warming scenarios. Our work provides a novel approach for predicting insect outbreak risks under future climates and supports improved forest and pest management strategies.

How to cite: Ma, Y., Carnicer, J., Wirth, C., Wunderlich, L., Bernhard, D., Jornet Puig, A., Sönke, Z., and Bastos, A.: A Process-Based Framework for Predicting Climate-Driven Insect Outbreaks and Their Forest Biogeochemical Impacts, EGU General Assembly 2026, Vienna, Austria, 3–8 May 2026, EGU26-7359, https://doi.org/10.5194/egusphere-egu26-7359, 2026.

Global warming is expanding the length of the growing season. However, within this longer window, the number of effective growing days is decreasing due to drought, so that warming often leads to growth losses on dry sites. Tree species mixtures can enhance productivity and biodiversity and may mitigate climate-change impacts. To better understand the effects of climate and species mixing, high-resolution seasonal growth observations are valuable. Nevertheless, mixing effects have rarely been examined at the seasonal scale.

In pure and mixed oak–pine stands at Maissau (475 m a.s.l.; mean annual temperature 10.1 °C; precipitation 475 mm year⁻¹), hourly radial growth of 48 trees has been monitored since 2017 using band dendrometers installed on dominant, intermediate, and suppressed trees. A hierarchical generalized additive model (GAM) with components for seasonal growth, shrinkage and swelling following rainfall, and diurnal water uptake was fitted to the data.

The model explained 95% of cumulative diameter increment. Increment differed significantly among years, species, dominance classes, and mixtures. There was pronounced interannual variability, with lower growth rates and a shorter growing season in drier years. Growth of Quercus robur and Q. petraea started earlier and lasted longer than that of Pinus sylvestris. Dominant trees grew for approximately one month longer than suppressed trees. Mixture effects were small. Both species exhibited pronounced diurnal cycles of water uptake, which were stronger around the summer solstice than in spring and more pronounced in P. sylvestris than in Quercus spp.; differences due to mixture were again minor.

Pinus sylvestris was more affected by drought than Quercus spp., which can be traced to their differing physiology. As a conifer, P. sylvestris pursues a conservative water-use strategy, closing stomata earlier than Quercus spp.; under drought this leads to strongly reduced photosynthesis and lower growth. Mixture had only a small beneficial effect for the two species studied, likely because niche complementarity is limited.

How to cite: Vospernik, S.: Seasonal growth dynamics in pure and mixed oak–pine stands under drought: insights from hierarchical generalized additive models, EGU General Assembly 2026, Vienna, Austria, 3–8 May 2026, EGU26-8147, https://doi.org/10.5194/egusphere-egu26-8147, 2026.

EGU26-9528 | Orals | BG3.38

Disentangling growth, water-use and nutritional constraints underlying forest dieback in drought-prone pine forests 

Ester González de Andrés, Antonio Gazol, José Ignacio Querejeta, Cristina Valeriano, Michele Colangelo, Cristopher Fernández-Blas, Marina Rodes-Blanco, Paloma Ruiz-Benito, and J. Julio Camarero

Increasing drought frequency and intensity under climate change is driving widespread forest dieback and tree mortality, particularly in water-limited regions such as the Mediterranean Basin. Despite extensive research on drought-induced growth decline, mechanistic understanding of how interacting hydraulic, carbon, and nutritional constraints predispose individual trees to dieback remains incomplete. Most studies have focused on single processes, limiting our ability to identify early-warning signals and robust predictors of mortality risk. Here, we apply a multi-proxy, tree-level approach that links growth dynamics, water-use patterns, and nutrient status to diagnose drought-induced canopy dieback in Pinus sylvestris, Pinus pinaster, and Pinus halepensis forests along an aridity gradient in north eastern Spain. Within each stand, dominant and co-dominant trees were selected and classified as non-declining or declining trees based on crown defoliation. For each individual, we combined dendrochronological analyses with foliar elemental and isotopic composition, morphological traits, and soil properties measurements. Growth vulnerability to drought was quantified by combining long-term growth trajectories and growth–climate relationships. Leaf carbon and oxygen isotopic composition data (δ¹³C, δ¹⁸O) were used to infer intrinsic water-use efficiency (iWUE) and time-integrated stomatal conductance. Foliar macro- and micronutrient contents, expressed per unit leaf area, were measured to evaluate nutrient imbalances associated with drought stress and senescence, and were interpreted in relation to soil pH and nutrient availability. Tree size and needle morphological traits, including leaf mass per area (LMA), were also measured. We applied multivariate analyses (principal component analysis, partial least squares regression) to integrate physiological, nutritional, and structural variables, discriminate between non-declining and declining trees, and identify key predictors of crown defoliation as a proxy for vigour decline. Our approach provided mechanistic insight into how chronic drought stress propagates through coordinated reductions in growth and stomatal conductance combined with nutrient imbalances, while revealing species-specific pathways to dieback. Overall, this study addresses key gaps in drought-induced forest mortality research and contributes to improving diagnostic and prognostic frameworks on forest dieback under ongoing climate change.

How to cite: González de Andrés, E., Gazol, A., Querejeta, J. I., Valeriano, C., Colangelo, M., Fernández-Blas, C., Rodes-Blanco, M., Ruiz-Benito, P., and Camarero, J. J.: Disentangling growth, water-use and nutritional constraints underlying forest dieback in drought-prone pine forests, EGU General Assembly 2026, Vienna, Austria, 3–8 May 2026, EGU26-9528, https://doi.org/10.5194/egusphere-egu26-9528, 2026.

EGU26-10048 | Orals | BG3.38

Can we use critical thresholds to better inform drought damage modeling in forests? 

Ryan Bright, Stephanie Eisner, Morgane Merlin, and Rasmus Astrup

In 2018, northern Europe was hit with an extreme summer drought event whose impacts on regional forest carbon cycling remain poorly understood and sparsely documented.  Using southern Norway as a case study, we developed a remote sensing-based algorithm to investigate the relationship between drought severity and forest resilience, identify critical thresholds, characterize damages, and study the factors shaping them.  We then trained stastical models to predict damages upon critical threshold exceedance and found that the event reduced gross primary productivity (GPP) by 4.55 Mt-CO₂ yr⁻¹ between 2018-2023, driven by loss of resistance (66%) with prolonged recovery and mortality (34%).  This reduction explains 26% of the observed weakening in Norway’s forest carbon sink over the same period.  Site-level features were the strongest predictors of damage.  Our results highlight extreme drought's role as a major carbon cycle disturbance in northern European forests and provides a framework to inform adaptive management strategies and benchmark other, more mechanistic modeling tools.

How to cite: Bright, R., Eisner, S., Merlin, M., and Astrup, R.: Can we use critical thresholds to better inform drought damage modeling in forests?, EGU General Assembly 2026, Vienna, Austria, 3–8 May 2026, EGU26-10048, https://doi.org/10.5194/egusphere-egu26-10048, 2026.

EGU26-10096 | ECS | Posters on site | BG3.38

The surprising resistance of trembling aspen (Populus tremuloides) to experimental drought. 

Cedric Zahnd, Jaycie Fickle, Lillie Congram, Matteo Campioli, and William Anderegg

Under climate change, not only are droughts becoming more severe, but seasonal precipitation patterns are changing, as well as the timing of snowmelt. Especially in mountainous or northern forests, where trees may depend strongly on snowmelt, it is therefore crucial to understand how the timing of droughts affects tree health and performance. Trembling aspen (Populus tremuloides Michx.) is the most widespread tree species in North America, and, like many other species, it has experienced large-scale, drought-related diebacks over recent decades. Depending on where they grow, aspens rely to various degrees on snowmelt for growing season transpiration, however it remains unclear whether droughts during different seasons affect the trees differently. Using a field experiment, we tested the effect of spring and summer drought on aspen leaf gas exchange, growth and hydraulics.

Over two years (2024 & 2025), we conducted a fully factorial experiment in a mature aspen forest in northern Utah, USA. In the year before the experiment, plots were trenched to ca 70cm depth. Each year, we induced a spring drought by removing most of the snowpack (ca 1.7m3 m-2; > 95 % of total snowpack) in early spring, while for the summer drought, starting in June, we covered ca 60 % of the forest area with rainout shelters. We measured stem growth and various physiological parameters including water potentials (Ψ) and leaf gas exchange up to weekly throughout the growing season. Additionally, we assessed hydraulic conductivity and vulnerability, in early and late summer each year.

Snow removal led to slightly more negative predawn Ψ in early summer, but these effects were small and short-lived. Otherwise, to our surprise, neither drought treatment affected Ψ, leaf gas exchange, growth or hydraulic conductivity, despite extremely dry topsoil. Interestingly however, during the much drier growing season 2025, trees showed reduced predawn Ψ, stomatal conductance and assimilation compared to 2024 irrespective of experimental treatment. These findings suggest that our trees were more affected by regional-scale droughts than by plot-level precipitation manipulation. One possible explanation for this is that these trees may have access to the water table. This is surprising as aspens are typically thought to mostly rely on water from shallow soil layers.

How to cite: Zahnd, C., Fickle, J., Congram, L., Campioli, M., and Anderegg, W.: The surprising resistance of trembling aspen (Populus tremuloides) to experimental drought., EGU General Assembly 2026, Vienna, Austria, 3–8 May 2026, EGU26-10096, https://doi.org/10.5194/egusphere-egu26-10096, 2026.

EGU26-11171 | ECS | Posters on site | BG3.38

Accounting for the potential of oak-savanna decline caused by Phytophthora cinnamomi: conceptual framework  

Maria Zafra, Eva Contreras, Raquel Gómez-Beas, Antonio Molina, Pablo González-Moreno, Francisco Ruíz-Gómez, Rafa Pimentel, and Ana Andreu

Mediterranean agroforestry systems, dominated by holm oak and cork oak woodlands, constitute ecosystems of high ecological, productive and socio-economic value. However, these systems are currently undergoing global decline as a result of multiple factors, among which climate change and the activity of some diseases, mainly Phytophthora cinnamomi Rands stand out. This soil-borne oomycete causes necrotic lesions in roots and stems, leading to fine-root loss, reduced water uptake, progressive decline, and tree mortality. Its life cycle includes both sexual and asexual phases; during the latter, motile zoospores require free soil water for infection, enabling movement and contact with host roots. In this context, Mediterranean climatic conditions are particularly favorable for pathogen proliferation, characterized by relatively warm and wet winters and springs with frequently waterlogged soils, followed by long, dry summers that induce severe water stress in trees, exacerbate root disease symptoms, and contribute to the decline of these agroforestry systems. Therefore, it is essential to identify areas more prone to be affected by the pathogen and, when affected, their potential to be a source for pathogen spread. Despite the enormous efforts carried out for monitoring and improving the understanding of pathogen propagation, there is still a way forward to better quantify pathogen spread potential. 

In this study, we adapted an existing index-based framework to assess the potential for non-point pollution (PNPI) at the watershed scale to model the spread of Phytophthora. The study has been carried out in Guadalquivir river basin, southern Spain. We assume that the spread of Phytophthora follows the same logic as the one followed by other substances previously modeled using PNPI. Hence, we reinterpret this framework to map the spatial potential for hydrologically mediated pathogen spread, assuming water as the main vector, the importance of landscape connectivity, and enhanced spread potential during wet years. The adapted index integrates three components: (i) a source indicator, accounting for land cover, landscape connectivity, inoculum pressure, and soil characteristics; (ii) a hydrological connectivity indicator, representing the potential for subsurface and downslope transport; and (iii) a runoff generation and transport capacity indicator, describing the landscape ability to mobilize and convey inoculum. Temporal variability in precipitation is incorporated to capture interannual climate control on spread potential. The main methodological challenge was redefining the source indicator to include: (a) host presence and density (oak cover, woodland fraction, fragmentation), (b) inoculum pressure (distance to known infection foci and presence of symptomatic trees), and (c) soil and site suitability (texture, drainage, water retention, and conditions favoring pathogen persistence). 

We prove that using simple mathematical expressions and low data requirements, we produced annual maps of estimated Phytophthora decline potential, providing a spatially explicit screening tool to identify areas with higher potential for hydrologically driven spread, showing correspondence with known infection sources. 

Acknowledgments: This research was performed within DRYAD Project, which has received funding from the European Union’s Horizon Europe research and innovation program under grant agreement 101156076. This work is part of the grant RYC2022-035320-I, funded by MCIN/AEI/10.13039/501100011033 and FSE+ 

How to cite: Zafra, M., Contreras, E., Gómez-Beas, R., Molina, A., González-Moreno, P., Ruíz-Gómez, F., Pimentel, R., and Andreu, A.: Accounting for the potential of oak-savanna decline caused by Phytophthora cinnamomi: conceptual framework , EGU General Assembly 2026, Vienna, Austria, 3–8 May 2026, EGU26-11171, https://doi.org/10.5194/egusphere-egu26-11171, 2026.

EGU26-13257 | ECS | Posters on site | BG3.38

Livestock Grazing Alters Seasonal Water-Use Strategies of Mediterranean Oaks  

Simon Ludovicy, Jose Grünzweig, and Efrat Sheffer

A dry climate and intense grazing by livestock are dominant drivers of vegetation structure and ecosystem processes in Mediterranean woodlands. Ecological studies predict contrasting effects of grazing on tree drought stress, reflecting a balance between browsing damage and reductions in competition for water with the herbaceous layer.

We investigated the combined effects of grazing and drought on the water status of Quercus coccifera, the dominant evergreen oak of the Eastern Mediterranean region. We set up an ecophysiological experiment in Southern Israel, at the dry edge of distribution of oak woodland ecosystems. We compared mature oak trees exposed to continuous cattle grazing with four nearby individuals protected from grazing by fencing. Trees have been monitored using high-frequency sensors measuring sap flow, stem water content, and radial stem growth, complemented by continuous meteorological observations and soil water content. We analysed the effects of grazing, season, and their interaction effects using linear mixed-effects models. Furthermore, we applied structural equation modelling to disentangle direct and indirect relationships between climatic drivers and ecophysiological variables.

All ecophysiological variables exhibited strong seasonal patterns, with a significant buffering effect of grazing on tree water use in the dry season. Grazed trees maintained higher stem water content and higher transpiration rates relative to ungrazed trees during periods of high atmospheric and soil drought. The climatic control on tree water deficit and sap flow differed between seasons, with vapor pressure deficit dominating during the wet season and radiation controlling water fluxes during the dry season. Stem water content functioned as an internal water reservoir, buffering tree water deficit in winter and sustaining transpiration during summer drought.

Our results suggest that grazing can buffer drought stress during periods of low water availability, likely by reducing competition for soil water with the herbaceous layer. By improving the tree water status, grazing may increase tree resilience under drought stress and mitigate climate change effects.

How to cite: Ludovicy, S., Grünzweig, J., and Sheffer, E.: Livestock Grazing Alters Seasonal Water-Use Strategies of Mediterranean Oaks , EGU General Assembly 2026, Vienna, Austria, 3–8 May 2026, EGU26-13257, https://doi.org/10.5194/egusphere-egu26-13257, 2026.

EGU26-13580 | Orals | BG3.38

The widespread Quercus ilex L. dieback in Mediterranean forests: investigation of the causes at plant and ecosystem level 

Francesca Alderotti, Fabiano Sillo, Antonella Gori, Mauro Centritto, Francesco Ferrini, Dalila Pasquini, Matthias Saurer, Raffaella Balestrini, Paolo Cherubini, and Cecilia Brunetti

Over the past two decades, the occurrence of extreme climatic events in the Mediterranean region has increased, and this climatic pressure has contributed to the spread of vegetation dieback over several forest communities. Dieback has also affected Quercus ilex L., and since this decline has worsened over the last 15 years in many Mediterranean areas, it is crucial to develop effective tools for studying this phenomenon, combining different scales of measurement. Our study was conducted over four years (2019-2023) in declining (D) and non-declining (ND) Q. ilex stands in southern Tuscany (IT), assessing physiological and biochemical traits such as gas exchange, water relations, carbohydrate analysis in the wood, and xylem sap isotopic signal (δ18O). Dendrochronological and tree-ring δ13C analyses were combined to investigate the effects of previous droughts on tree growth and water-use efficiency.

The results of physiological analyses showed that seasonality had a strong effect on these traits, with the main stress occurring during the summer of 2020, as evidenced by the lowest gas exchange values. According to the results of δ18O analyses, holm oaks mainly took up water from deep soil sources (bottom soil or groundwater) owing to their deep-root systems, resulting in only slightly different ring-width patterns and a low responsiveness to seasonal climatic variations in both stands. By contrast, the δ13C results combined with SSR genotyping revealed a more conservative water use of the population in the ND stand, underlying the potential of combining these powerful tools for the selection of seed-bearing genotypes putatively tolerant to water deficit.

How to cite: Alderotti, F., Sillo, F., Gori, A., Centritto, M., Ferrini, F., Pasquini, D., Saurer, M., Balestrini, R., Cherubini, P., and Brunetti, C.: The widespread Quercus ilex L. dieback in Mediterranean forests: investigation of the causes at plant and ecosystem level, EGU General Assembly 2026, Vienna, Austria, 3–8 May 2026, EGU26-13580, https://doi.org/10.5194/egusphere-egu26-13580, 2026.

EGU26-13751 | Posters on site | BG3.38

Restore and improve the conservation status of threatened forests by holm oak dieback   

Cecilia Brunetti, Francesca Alderotti, Sara Beltrami, Raffaella Balestrini, Fabiano Sillo, Bruno Scanu, Andrea Brandano, Antonio Deidda, Cristina Vettori, Cesare Garosi, Giovanni Marino, André Pierre Marie Fabbri, Mauro Centritto, and Antonella Gori

Both biotic and abiotic factors are raising concerns about Mediterranean oak forests resilience to climate change, particularly Holm oak (Quercus ilex L.) forests. In the last decade, many drought events impacted this species in several Mediterranean countries, and a widespread decline of holm oak forests has been observed due to a combination of drought and the soil pathogen Phytophthora cinnamoni. In addition, climate change has induced a rise in mean winter temperatures, a seasonal shift of precipitation from summer to wintertime, and a tendency towards heavy rain and prolonged droughts, which are triggering factors for the current decline of holm oak in Mediterranean regions. The resulting reduction in holm oak forest vitality and productivity can ultimately lead to profound changes in ecosystem processes and functions. Previous studies based on tree-ring δ13C and SSR genotyping showed that different holm oak populations can differ in their water use efficiency, resulting in different drought tolerance. This study highlighted the potential of this analysis for the selection of seed-bearing genotypes aimed to preserve Mediterranean holm oak ecosystem and improving its forest management. In this context, LIFE RECLOAK project aims to restore and improve the conservation status of threatened forests by holm oak dieback using genotypes characterized by high level of drought tolerance and pathogen resistance. A step-by-step approach will allow the achievement of this ambitious goal over the five years of the project. In the first instance, drought-tolerant and pathogen-resistant genotypes will be selected through a genetic screening based on SSR genotyping and the identification of genetic markers associated with stress tolerance. A mesocosm trial will be carried out to confirm the drought tolerance and the pathogen resistance of the holm oak genotypes. Then, the selected seedlings will be planted in four pilot sites areas located in Mediterranean holm oak forests included in Natura 2000 network and affected by widespread dieback: Monti dell’Uccellina in Parco della Maremma (Tuscany, Italy); Parco della Maddalena (Sardinia, Italy); Muela de Cortes y el Caroche (Valencia province, Spain), Raso del Conejo Forest (Sierra Morena, Andalucia, Spain) and Wied il-Mielaħ u l-Inħawi tal-Madwar (Malta). After that, seasonal and multi-year monitoring for three years after the plantation will begin at each pilot site. The monitoring of pilot sites will be done by visual assessment and through the measurement of plant physiological performances by integrating gas exchange measurements with proximal sensing measures. The effects of reforestation on ecosystem functioning and climate mitigation will be investigated by measuring soil moisture, respiration, and microbial communities’ composition, as well as monitoring understory and overstory vegetation cover and biomass accumulation. Overall, this project will provide a reliable demonstration of restoring forest structure, thereby promoting forestry with conservation objectives and opening the possibility of restoring other Mediterranean areas affected by holm oak dieback.

How to cite: Brunetti, C., Alderotti, F., Beltrami, S., Balestrini, R., Sillo, F., Scanu, B., Brandano, A., Deidda, A., Vettori, C., Garosi, C., Marino, G., Fabbri, A. P. M., Centritto, M., and Gori, A.: Restore and improve the conservation status of threatened forests by holm oak dieback  , EGU General Assembly 2026, Vienna, Austria, 3–8 May 2026, EGU26-13751, https://doi.org/10.5194/egusphere-egu26-13751, 2026.

EGU26-14190 | Posters on site | BG3.38

Drought, fog and vegetation resilience: Potential tipping points of forests in semiarid coastal basins of central Chile. 

Alvaro Gutierrez, Ignacio Núñez-Hidalgo, Aurora Gaxiola, Pérez-Evens Matías, and Chavez-Oyanadel Roberto

Semi-arid forests are becoming increasingly vulnerable to climate change as drier conditions are more frequent. In the coastal basins of semi-arid Chile, that are disconnected from the Andes, snow and rainfall contribute little to forest water supply. Instead, fog can provide an important moisture subsidy that helps sustain forest function and persistence, potentially increasing drought tolerance. Since 2010, however, the co-occurrence of stronger drought conditions and a decline in fog frequency have raised concern about the possibility of large-scale forest collapse.

Here we evaluate forest resilience and ask whether these forests are moving toward bifurcation-driven tipping points across a 4,067 km² coastal landscape. Using satellite time series spanning 1984–2024, we reconstructed land-surface phenology and identified post-2010 anomalies to quantify the magnitude and spatial extent of drought impacts. We then combined multiple satellite-derived indices in a multivariate framework to describe vegetation states associated with drought stress, explicitly contrasting the pre-2010 period with the subsequent drought years. From this analysis, we selected pixels showing the strongest evidence of potential state change and examined them with univariate time-series methods. We computed early warning signals (EWS) and critical slowing down (CSD) metrics, including variance, lag-1 autocorrelation (AR1), and the restoring rate (λ), using rolling ten-year windows to track changes in stability through time.

Results show that the extreme 2019 drought affected 82% of the forest area. Despite this widespread impact, forest patches were generally more resilient than adjacent shrublands: across the landscape, many forests remained stable and some showed signals consistent with recovery even under high drought severity. Univariate EWS analyses indicate that drought is increasingly constraining forest states; however, CSD metrics do not yet provide consistent evidence that the system has crossed a tipping point. Even so, continued extreme drought combined with further reductions in fog could erode buffering capacity and raise collapse risk. Overall, the relative stability of forests compared with shrublands supports the idea that fog-inundated forests persist with a higher resilience under progressive drying in this region.

How to cite: Gutierrez, A., Núñez-Hidalgo, I., Gaxiola, A., Matías, P.-E., and Roberto, C.-O.: Drought, fog and vegetation resilience: Potential tipping points of forests in semiarid coastal basins of central Chile., EGU General Assembly 2026, Vienna, Austria, 3–8 May 2026, EGU26-14190, https://doi.org/10.5194/egusphere-egu26-14190, 2026.

EGU26-15563 | Orals | BG3.38

Global warming reduces the carrying capacity of the tallest angiosperm species (Eucalyptus regnans) 

Raphaël Trouvé, Patrick Baker, Mark Ducey, Andrew Robinson, and Craig Nitschke

Rising temperatures and increased drought intensity are driving accelerated tree mortality rates worldwide. We investigated how these changes affect the carrying capacity of mountain ash forests (Eucalyptus regnans), the world's tallest flowering plant and one of the most carbon-dense forests on Earth (450-819 tonnes carbon per hectare).

Using data from a large network of silvicultural experiments collected between 1947 and 2000 in southeastern Australia, we quantified temporal trends in mortality rates and carrying capacity, and their relationships to spatiotemporal climate variations. We analyzed how maximum stand density changes with tree size (self-thinning line) across different climatic conditions and over time, disentangling spatial variation among sites from temporal variation within sites.

Our results show forests growing in the warmest and driest conditions (highest vapour pressure deficit) had the lowest carrying capacity. This capacity further decreased with rising temperatures. Each one-degree Celsius increase in mean annual temperature was associated with a 9% reduction in carrying capacity. Based on these relationships, a projected three-degree Celsius increase by 2080 (CSIRO RCP8.5 scenario) could reduce tree density and carbon stocks by 24%, equivalent to losing 240,000 hectares of mature mountain ash forests or releasing 108 million tonnes of carbon.

Trees that died were 0.62 times the size of living trees (i.e., they were suppressed), with no detectable effect of climate on this ratio. These findings demonstrate that reduced carrying capacity could undermine carbon sequestration and global forest restoration efforts, particularly in seasonally dry regions where warming accelerates water limitations. We discuss implications for incorporating changing carrying capacity into forest management and carbon accounting.

How to cite: Trouvé, R., Baker, P., Ducey, M., Robinson, A., and Nitschke, C.: Global warming reduces the carrying capacity of the tallest angiosperm species (Eucalyptus regnans), EGU General Assembly 2026, Vienna, Austria, 3–8 May 2026, EGU26-15563, https://doi.org/10.5194/egusphere-egu26-15563, 2026.

EGU26-15837 | ECS | Posters on site | BG3.38

Multi-scale controls on water availability shape the distribution of karri (Eucalyptus diversicolor) in southwestern Australia 

Dominik Fabry, Jake Eckersley, Matthias Leopold, Tim Bleby, Michael Renton, and Pauline Grierson

Tolerance of tree species to changing water availability plays a critical role in determining forest resilience to climate change, particularly in drought prone warm temperate regions. However, the specific environmental drivers and water availability thresholds governing current distribution of many southern hemisphere tree species remain largely unknown. We investigated how climate, landscape position, and soil properties influence water availability and the distribution of karri (Eucalyptus diversicolor), a tall forest tree species endemic to southwestern Australia. While predominantly found in areas with rainfall above 800 mm/year, some outlying karri stands also occur in lower rainfall zones. Using a binomial generalised linear model (GLM) with a logit link, we modelled the probability of karri presence across the southwest range as a function of mean annual rainfall (bio12), mean temperature of the warmest quarter (bio10), and the topographical wetness index (TWI). On a regional scale, we found this simple model to predict karri occurrence with high accuracy, showing the importance of high rainfall, mild summer temperatures, and well drained upland landscapes. Second, we analysed a comprehensive reference dataset of soil physical and chemical properties across southwest Australia to better characterise local scale conditions associated with karri growth. We also investigated soil depth using passive seismic and contrasts in soil electrical resistivity between karri stands and neighbouring forest types. Our preliminary results indicate that karri preferentially occurs on deep, well drained, clay rich soils, but also persists in landscape positions where shallow soils or soil types with poor water-holding capacity (e.g. sands) maintain higher water-availability, owing to deeper water storage (e.g. karstic systems) or regular rapid recharge (e.g. runoff from adjacent rocky outcrops). Our research confirms that karri distribution is likely determined primarily by water availability, but this is moderated at different scales by interacting climatic, topographic, and soil controls. This study provides a more nuanced foundation for predicting vulnerability of particular populations to future drought stress. Ongoing studies are quantifying water use across the distribution range under varying site conditions.

How to cite: Fabry, D., Eckersley, J., Leopold, M., Bleby, T., Renton, M., and Grierson, P.: Multi-scale controls on water availability shape the distribution of karri (Eucalyptus diversicolor) in southwestern Australia, EGU General Assembly 2026, Vienna, Austria, 3–8 May 2026, EGU26-15837, https://doi.org/10.5194/egusphere-egu26-15837, 2026.

EGU26-16457 | ECS | Posters on site | BG3.38

A Machine Learning Framework for Urban Drought Risk Assessment under Future Climate Scenarios: A Case Study of Gangneung City, South Korea 

Yunseo Bae, Yujin Jung, Jiyoon Choe, Younghun Lee, and Sangchul Lee

A Machine Learning Framework for Urban Drought Risk Assessment under Future Climate Scenarios: A Case Study of Gangneung City, South Korea

Yunseo Bae1, Yujin Jung1, Jiyoon Choi1, Younghun Lee2 Sangchul Lee1,2*


1 Division of Environmental Science & Ecological Engineering, Korea University, Seoul 02841, Republic of Korea

2 Department of Environmental Science & Ecological Engineering, Korea University, Seoul 02841, Republic of Korea


* Corresponding author: Sangchul Lee (slee2024@korea.ac.kr)


Abstract:

In 2025, a national disaster was declared in the Republic of Korea due to severe drought, particularly Gangneung City in Gangwon State. In urban areas, drought risk is shaped not only by meteorological conditions but also by anthropogenic factors. However, conventional drought assessments largely rely on climatic or hydrological indices and often fail to reflect these socio-infrastructure factors. Recently, machine learning (ML) is widely adopted due to its ability to capture complex, nonlinear interactions among various factors. Accordingly, this study develops a ML-based framework to reproduce historical drought and to predict future urban drought risk under climate change scenarios in Gangneung City. Drought occurrence data from 2016 to 2025 were classified into five stages (Normal, Attention, Caution, Warning, and Severe) and used as multi-class target variables. Input data included meteorological (precipitation, temperature, humidity, wind speed, and evapotranspiration), topographic (DEM-based elevation, slope, aspect, watershed characteristics, and land cover), and anthropogenic variables (water supply infrastructure, population, and tourism activity). All input variables were spatially aggregated to administrative units, ensuring consistency with the spatial resolution of the observed drought occurrence data. An AutoML approach was applied to compare multiple classification algorithms and to identify the optimal model. Model performance was evaluated using time-aware validation strategies, including a temporal train–test split and time-series cross-validation. SHAP analysis was also employed to interpret the relative importance of key drought drivers. Future drought risk was projected by applying meteorological inputs derived from SSP2-4.5, SSP3-7.0, and SSP5-8.5 scenarios to the trained model, while other factors were assumed to remain. Administrative-unit-based drought occurrence probabilities were analyzed for the near (2030–2050), mid (2051–2060), and far future (2080–2100). In addition, hypothetical policy-oriented scenarios were explored by modifying anthropogenic variables, such as water leakage rates and tourism demand, to assess the sensitivity of drought risk to management assumptions. The findings from this study would demonstrate the ML-based framework is efficient to predict urban drought risk, supporting region-specific drought mitigation and climate adaptation strategies.


Key words: machine learning, urban drought, anthropogenic factors, drought risk mapping, climate change


Acknowledgement

Following are results of a study on the "Convergence and Open Sharing System "Project, supported by the Ministry of Education and National Research Foundation of Korea

How to cite: Bae, Y., Jung, Y., Choe, J., Lee, Y., and Lee, S.: A Machine Learning Framework for Urban Drought Risk Assessment under Future Climate Scenarios: A Case Study of Gangneung City, South Korea, EGU General Assembly 2026, Vienna, Austria, 3–8 May 2026, EGU26-16457, https://doi.org/10.5194/egusphere-egu26-16457, 2026.

EGU26-17394 | ECS | Orals | BG3.38

Coastal Monitoring in the Mediterranean Basin: Issues and Technical Approaches 

Sara Beltrami, Francesca Alderotti, Antonella Gori, Martina Pollastrini, Mauro Centritto, Francesco Ferrini, Dalila Pasquini, and Cecilia Brunetti

Extreme weather events, including prolonged droughts and heat waves, are increasingly causing forest dieback and tree mortality across many ecosystems, particularly in the Mediterranean region. In recent years, widespread decline of Quercus ilex L. (holm oak) has been reported in Southern Europe, notably in the Iberian Peninsula and Italy. As a dominant tree species, holm oak dieback has the potential to reshape understory shrub and herbaceous communities. Furthermore, Mediterranean vegetation is a major source of Biogenic Volatile Organic Compounds (BVOCs), whose emissions are highly sensitive to environmental conditions.

This study examines seasonal variations in holm oak canopy cover, understory species richness, and alpha diversity indices (Shannon–Wiener and Pielou) in two holm oak stands located in the Maremma Regional Park (Tuscany, Italy). The stands differ in crown defoliation intensity and are classified as high defoliated (HD) and low defoliated (LD). Seasonal field surveys were conducted between 2019 and 2023 to characterize temporal changes in vegetation composition. Plant species inventories were used to assess the biological spectrum within stands and estimate habitat explanatory factors using Ellenberg's indicator values. Additionally, relationships between vegetation dynamics and ecosystem-level BVOC emissions were evaluated.

During the study period, both stands experienced a 50 % reduction in holm oak canopy cover. This canopy loss increased light availability and was associated with a temporary rise in understory species richness in 2021. In contrast, a marked decline in species richness was observed in 2022, falling below 2019 levels in both stands. This reduction is likely linked to the accumulation of dead wood on the forest floor and the extreme temperatures recorded during that year. By 2023, species richness recovered to values comparable to those observed in 2020 and 2021. Notably, the Shannon-Wiener and Pielou indices did not significantly vary in the two stands, where the biological spectrum displayed a clear Mediterranean characteristic. However, both stands exhibited a progressive increase in geophytes and therophytes, suggesting worsening water stress conditions. From October 2020, the LD stand was mainly characterized by scapose hemicryptophytes and phanerophytes and caespitose phanerophytes, whereas the HD stand was dominated by nano-phanerophytes. BVOC measurements closely mirrored vegetation changes, showing a clear reduction in monoterpene emissions associated with increasing holm oak defoliation and mortality. Elevated Ellenberg indicator values for light and temperature further confirmed the Mediterranean imprint of the vegetation and revealed signs of anthropogenic disturbance in the HD stand. This was reflected in the higher abundance of nitrophilous and medicinal herbaceous species, such as Atropa belladonna L. and Datura stramonium L., whose historical introduction and subsequent expansion may have been facilitated by canopy opening and tree decline.

Overall, although diversity indices remained statistically stable, holm oak dieback induced notable shifts in species composition, particularly in the HD stand. The pronounced canopy reduction and increasing dominance of nano-phanerophytes suggest that part of the forest is undergoing a transition toward shrubland. Additionally, the observed decline in BVOC emissions highlights the potential consequences of holm oak dieback for ecosystem functioning and atmospheric chemistry.

How to cite: Beltrami, S., Alderotti, F., Gori, A., Pollastrini, M., Centritto, M., Ferrini, F., Pasquini, D., and Brunetti, C.: Coastal Monitoring in the Mediterranean Basin: Issues and Technical Approaches, EGU General Assembly 2026, Vienna, Austria, 3–8 May 2026, EGU26-17394, https://doi.org/10.5194/egusphere-egu26-17394, 2026.

EGU26-17466 | Orals | BG3.38

Fire refugia recovery trends and patterns in Mediterranean pine forest ecosystems 

Paola Mairota, Maria Floriana Spatola, Aristides Moustakas, Luigi Marfella, Emilio Padoa Schioppa, Ioannis N. Vogiatzakis, and Flora Angela Rutigliano

Climate change, land cover changes, and fuel accumulation are altering the historical fire regimes in Mediterranean fire-prone ecosystems. Disentangling the role of climate and spatial structure on post-fire recovery of fire biological legacies is critical, as these unburned or low-severity areas within fire scars (fire refugia), by containing residual pre-fire vegetation, facilitate post-fire species persistence. Fire refugia were identified within burned patches of six Pinus halepensis Mill. stands in a Natura 2000 Network site, based on the reconstruction of a 40-year (1981-2020) fire chronology. Landsat annual time-series of Normalised Burn Ratio (NBR) were used to assess fire refugia post-fire recovery temporal trends and patterns. Climate parameters (maximum and minimum temperature and precipitation of four seasons, over time) and fire severity mosaic heterogeneity metrics (landscape and class level) were used as predictors to identify drivers of post-fire vegetation condition. Exploratory analyses concerning the distribution, the temporal structure, and the interrelationships among variables indicated that the dataset is characterised by (i) a strong temporal recovery signal in NBR, (ii) non-stationary climate drivers, especially temperature, and (iii) highly variable and skewed precipitation regimes. The multivariate structure and collinearity of climate predictors, assessed by means of principal component and correlation analyses, showed that climate variability is structured around a dominant temperature signal and a secondary precipitation-seasonality gradient. Random Forest regression analysis implemented to assess the relative importance of climate and fuel mosaic heterogeneity metrics in explaining post-fire recovery, through a non-parametric perspective, reinforced and extended the insights obtained from exploratory and multivariate analyses. It revealed that post-fire recovery, as appraised by the NBR, is governed by a combination of strong climatic constraints and landscape-mediated buffering mechanisms. These findings suggest that climate sets the overarching limits to recovery, while fire refugia connectedness modulates their recovery trajectories, thus providing spatially structured sources of resilience. From the perspective of an integrated approach to fire management, silvicultural interventions aimed at increasing forest structure horizontal and vertical heterogeneity, by mitigating fire behaviour, may determine the preconditions for heterogeneous fire mosaics with well-connected fire refugia, likely to enhance forest recovery under future climatic stress.

How to cite: Mairota, P., Spatola, M. F., Moustakas, A., Marfella, L., Padoa Schioppa, E., Vogiatzakis, I. N., and Rutigliano, F. A.: Fire refugia recovery trends and patterns in Mediterranean pine forest ecosystems, EGU General Assembly 2026, Vienna, Austria, 3–8 May 2026, EGU26-17466, https://doi.org/10.5194/egusphere-egu26-17466, 2026.

EGU26-17723 | Orals | BG3.38

Species-Specific Water-Stress Responses in Coniferous and Deciduous Trees: Insights from Sap Flow and Hysteresis Analysis 

Mohammad Abdoli, Robin Jo Borger, Heye Reemt Bogena, Anke Hildebrandt, Felix Pohl, Theresa Blume, Stefan Mayr, and Michael Leuchner

Climate change is intensifying the frequency and duration of water-limited conditions, increasing the risk of climate-induced physiological stress in trees and potentially altering their function as critical carbon sinks. Understanding species-specific responses to water stress is crucial for predicting shifts in ecosystem processes and functionality. This study investigates the photosynthetic and water-use responses of two contrasting tree species—Norway spruce (Picea abies), a conifer, in Wüstebach, and European hornbeam (Carpinus betulus), a deciduous species, in Hohes Holz—over a three-year period using sap flow measurements, in situ photosynthetically active radiation (PAR) data, and eddy covariance technique. Results show that gross primary production (GPP) declines under high vapor pressure deficit (VPD), with regulatory thresholds differing between species. Norway spruce exhibits reduced stomatal conductance and photosynthetic activity beyond a VPD threshold of 10 hPa, whereas European hornbeam maintains photosynthesis up to 16 hPa. Sap flow density measurements corroborate these thresholds, highlighting that water stress diminishes ecosystem GPP, yet conifers and deciduous trees employ distinct coping strategies. Hysteresis analysis of the relationships between sap flow and VPD, as well as sap flow and absorbed PAR (APAR), revealed significant interspecies differences. Norway spruce exhibited a directional shift in hysteresis (from counterclockwise to clockwise) in both sap flow-VPD and sap flow-APAR relationships at specific VPD thresholds, suggesting dynamic adjustments to water stress. In contrast, European hornbeam exhibited directional hysteresis changes only in sap flow-APAR relationships, implying differing physiological mechanisms underlying their water-stress responses. These findings underscore the utility of hysteresis analysis in elucidating species-specific water-stress regulation mechanisms. The study provides valuable insights into how coniferous and deciduous trees modulate stomatal conductance and sap flow under elevated atmospheric demand, shedding light on the broader implications of climate change for forest carbon dynamics.  Keywords: Water stress, GPP, Sap flow, Hysteresis analysis

How to cite: Abdoli, M., Borger, R. J., Bogena, H. R., Hildebrandt, A., Pohl, F., Blume, T., Mayr, S., and Leuchner, M.: Species-Specific Water-Stress Responses in Coniferous and Deciduous Trees: Insights from Sap Flow and Hysteresis Analysis, EGU General Assembly 2026, Vienna, Austria, 3–8 May 2026, EGU26-17723, https://doi.org/10.5194/egusphere-egu26-17723, 2026.

EGU26-17984 | ECS | Orals | BG3.38

Tree Mortality in Boreal Primary Forests is Sensitive to Climate and Stand Structure: High-Resolution Evidence Across a Gradient of Protected Landscapes 

Samuli Junttila, Antti Polvivaara, Mete Ahishali, Minna Blomqvist, Anwarul Islam Chowdhury, Eija Honkavaara, Mikko Vastaranta, Teja Kattenborn, Stéphanie Horion, Martin Brandt, William Hammond, Craig D. Allen, and William Anderegg

Climate-driven increases in tree mortality represent a major uncertainty in projections of boreal forest carbon balance and ecosystem resilience. Detecting climate sensitivity in mortality patterns is particularly challenging in managed landscapes, where harvesting and silvicultural legacies obscure underlying ecological signals. Here, we analyse a large dataset of individual standing dead trees collected in 2023–2024 across 11 protected primary boreal forest areas along a north–south gradient in Finland, using aerial image-based detection methods. This setting provides an opportunity to assess tree mortality drivers under near-natural conditions.

The analysis covered 7,495 forest stands spanning 69,791 ha, with a total of 304,458 standing dead trees detected in the upper canopy layer (typically DBH ≥20–25 cm), paired with stand-level data on forest structure, development stage, species dominance, and habitat characteristics. Tree mortality was modelled using a two-part hurdle framework that separates the occurrence of mortality from its intensity (dead trees per hectare). Occurrence was estimated using ridge-regularized logistic regression, while mortality intensity was modelled with negative binomial generalized linear models to account for strong overdispersion. Stand area was included via offsets, and model robustness was evaluated using leave-one-area-out sensitivity analyses.

Across all model formulations and spatial subsets, stand structural attributes—most notably total standing volume—emerged as the strongest and most stable predictors of mortality intensity. A one-standard-deviation increase in log-transformed volume was associated with a 55–85% increase in expected mortality, indicating that biomass-rich stands exhibit heightened vulnerability to mortality processes. Field-measured total deadwood volume, where available, further amplified mortality signals, consistent with cumulative effects of past disturbance or chronic stress.

Forest development stage showed systematic but secondary effects. Relative to old-growth stands, younger and mid-successional development classes consistently exhibited lower mortality intensity, while differences among mature and old stands were modest once structural variation was accounted for. This suggests that apparent age-related patterns are largely mediated through biomass accumulation and stand structure rather than chronological stand age alone. Dominant tree species had comparatively weak effects: spruce-dominated and mixed species stands tended to show slightly lower mortality than pine-dominated stands, while birch-dominated stands exhibited reduced mortality in some model formulations. Overall, species effects were less stable than structural predictors.

Categorical habitat descriptors, including vegetation type and Natura 2000 habitat class, exhibited limited explanatory power after accounting for stand structure, development stage, and species dominance. Together, these results indicate that the climate sensitivity of tree mortality in boreal primary forests is primarily mediated by structural factors rather than habitat type. High-biomass stands may amplify the impact of climate-related stressors—such as drought, thermal extremes, or biotic agents—by increasing competition and physiological demand via increased evaporative area and metabolic costs.

Our findings provide a quantitative baseline for detecting climate-induced changes in boreal forest mortality and highlight the importance of structurally explicit approaches for assessing ecosystem vulnerability under ongoing climate change.

How to cite: Junttila, S., Polvivaara, A., Ahishali, M., Blomqvist, M., Chowdhury, A. I., Honkavaara, E., Vastaranta, M., Kattenborn, T., Horion, S., Brandt, M., Hammond, W., Allen, C. D., and Anderegg, W.: Tree Mortality in Boreal Primary Forests is Sensitive to Climate and Stand Structure: High-Resolution Evidence Across a Gradient of Protected Landscapes, EGU General Assembly 2026, Vienna, Austria, 3–8 May 2026, EGU26-17984, https://doi.org/10.5194/egusphere-egu26-17984, 2026.

Between 2018 and 2020, severe summer droughts caused unprecedented mortality of Norway spruce (Picea abies) in Central Europe. Large amounts of standing deadwood remained in forests, appearing grey or brown and contrasting with surrounding vegetation, making them detectable via remote sensing. Remote sensing-based monitoring of tree mortality is an important source, alongside ground-based observations, providing consistent spatial and temporal coverage over large areas.

In this study, we used satellite-derived standing deadwood data to develop a weather-driven empirical model of Norway spruce mortality and integrated it into the European forestry version of the dynamic vegetation model LPJ-GUESS. The model successfully reproduces observed patterns of tree mortality and associated biomass declines in Germany for 2010–2020. Summer solar radiation anomalies emerged as a key predictor, reflecting the combined effects of drought stress, canopy heat stress, and increased bark beetle activity. Incorporating large-scale satellite data substantially improved the model’s explanatory power, outperforming previous approaches based solely on ground-based mortality data.

Future simulations (2021–2070) under RCP2.6 and RCP8.5 scenarios indicate recurring drought-induced mortality comparable to post-2018 events, resulting in substantial reductions in forest carbon stocks and increases in calamity timber, while harvests of target-diameter timber are projected to decline in subsequent years. Without the weather-driven mortality component, LPJ-GUESS strongly underestimates drought impacts.

Our results highlight the significant risks to carbon storage in Norway spruce-dominated forests under recurring droughts in Germany. Given the central role of forests in Germany’s climate mitigation strategy, continued reliance on Norway spruce plantations poses challenges to both climate goals and the stability of the timber industry. We strongly recommend a rapid transition to diverse mixed forests across Central Europe to mitigate these risks.

How to cite: Anders, T., Hetzer, J., Tölle, M., Forrest, M., Kattenborn, T., and Hickler, T.: Combining satellite-derived forest deadwood estimates and vegetation modelling to predict drought impacts on Norway spruce forest biomass, timber harvest and carbon cycling in Central Europe, EGU General Assembly 2026, Vienna, Austria, 3–8 May 2026, EGU26-18031, https://doi.org/10.5194/egusphere-egu26-18031, 2026.

EGU26-18037 | Posters on site | BG3.38

Intense tree growth monitoring reveals increasing moisture limitation in a former treeline stand 

Vaclav Treml, Hana Kuželová, Jelena Lange, Jiří Mašek, Piyush Yele, and Jan Tumajer

Warming shifts isotherms upwards and previously cold-limited stands can reveal signs of moisture-limited growth. However, the pace of this transition and its characteristics are unclear. To bridge this gap, we present outputs of an intense monitoring effort of tree growth and phenology from a Picea abies stand located originally at the treeline in the Krkonoše Mts. at the Czech-Polish border. This site has been gradually lagging behind the advancing treeline isotherm. During a 12-year period between 2014 and 2025, we collected xylogenesis data, measured stem expansion and shrinkage using dendrometers, and monitored microclimate and leaf phenology. For each year, we derived critical growth dates (start, end, peak growth date), and mean and maximum growth rates for both xylogenesis and dendrometer data. In addition, we evaluated the time series of the tree water deficit. Our results show that despite high inter-annual variability, there was a trend towards a longer duration of xylogenesis, mainly associated with the extension of the cell wall thickening phase. Secondly, we found a reduction in the mean daily rate of cell formation. These trends observed at the cellular level were consistent with observations from dendrometers. The period of growth extended towards the end of the summer and the mean growth rates slightly decreased over time. Interestingly, tree water deficit increased over time with more frequent summer periods with negative climatic water balance and strongly negative soil water potentials. This was reflected in stem growth mainly in the driest years (2018, 2019, 2024) when growth cessation was the earliest within the entire period of monitoring. Our intense growth monitoring witnesses a transition from a strictly cold-limited treeline stand towards tree growth with occasional signs of moisture limitation. Although tree growth was unambiguously affected by drought only during the warmest and driest years, mean growth rates have been slightly declining due to increasing latent tree water deficits.

How to cite: Treml, V., Kuželová, H., Lange, J., Mašek, J., Yele, P., and Tumajer, J.: Intense tree growth monitoring reveals increasing moisture limitation in a former treeline stand, EGU General Assembly 2026, Vienna, Austria, 3–8 May 2026, EGU26-18037, https://doi.org/10.5194/egusphere-egu26-18037, 2026.

Forest disturbances and excess tree mortality are increasingly reported worldwide, yet satellite monitoring is still often limited to coarse-resolution, binary forest loss products that miss fine-scale mortality where only a few trees decline within an otherwise intact canopy. This limits our ability to quantify emerging disturbance dynamics, compare regions with consistent metrics, and identify early signals of larger forest change.

We present yearly, wall-to-wall maps (2018–2025) of fractional forest cover and fractional standing deadwood cover at 10 m resolution for Europe and beyond. We use these maps to provide a first Europe-wide quantitative overview of recent mortality patterns, summarizing the spatial distribution of elevated standing deadwood and its year-to-year dynamics from 2018 to 2025. These map products enable new analyses of disturbance dynamics at unprecedented spatial detail: tracking year-over-year mortality progression patterns; distinguishing general tree removal from trees dying standing by jointly analyzing forest and deadwood fractions; and quantifying subtle early-stage disturbance signals before they aggregate into larger forest change.

The maps link centimeter-scale aerial reference data from the crowd-sourced deadtrees.earth drone archive with multi-year Sentinel-2 reflectance time series: tree and standing-deadwood masks are derived on drone orthophotos using semantic segmentation, aggregated to sub-pixel cover fractions, and used to train a per-pixel computer vision model that translates reflectance signatures into annual forest and standing deadwood cover. As the deadtrees.earth drone archive continues to grow, its automated processing pipelines can feed regular model retraining, allowing the maps and models to be iteratively improved in space and time with each new contribution.

How to cite: Mosig, C. and the co-authors: deadtrees.earth Maps: Tree Mortality and Disturbance Mapping from Sentinel-2 Timeseries Across The Globe, EGU General Assembly 2026, Vienna, Austria, 3–8 May 2026, EGU26-18072, https://doi.org/10.5194/egusphere-egu26-18072, 2026.

Drought is a major driver of change in forest ecosystems, yet its quantification remains highly inconsistent across ecological studies. Consequently, the same period or location may be classified as under the effect of drought in one study and as near-normal in another, undermining comparability, synthesis, and inference. A systematic reanalysis of 161 drought events reported in forest ecosystem studies was conducted, to assess how drought definitions and quantification practices affect the accuracy of reported drought conditions.

Drought definitions were categorized into general descriptors (e.g., “dry,” “dry season,” or “different from normal”) and specific, quantifiable metrics (e.g., reduced precipitation, low soil moisture, standardized drought indices). We then examined how these definitions varied across forest types, drought “spheres” (atmospheric, soil, and hydrological), study approaches, and global regions. A clear pattern emerged showing that drought definitions are strongly biased toward atmospheric metrics, with soil and hydrological droughts being underrepresented, largely due to differences in data availability.

Across both experimental and observational studies, drought quantification proved to be a critical determinant of classification accuracy. General, non-quantified terms such as “dry” or “dry season” were frequently used but contradicted when benchmarked against the Standardized Precipitation–Evapotranspiration Index (SPEI). This highlights the importance of explicitly defined thresholds in ecohydrological research. Clearly stated and standardized thresholds would substantially improve global comparability, reduce subjective bias, and strengthen links among observational, experimental, and modeling studies of drought impacts on forests. Such improvements are essential for robust synthesis of drought attribution, development of mechanistic physiological understanding, and effective forest management under climate change.


How to cite: Gharun, M.: When ‘Dry’ Isn’t Dry: How drought definitions shape our understanding of forest responses to drought, EGU General Assembly 2026, Vienna, Austria, 3–8 May 2026, EGU26-19476, https://doi.org/10.5194/egusphere-egu26-19476, 2026.

Adaptation measures are needed to protect forests from the impacts of climate change. To do so, forest management throughout Europe has largely shifted toward climate-smart forestry, i.e. focusing on species portfolios which are suitable under a wide range of possible future climates. These strategies primarily take into account different climate scenarios based on the Shared Socioeconomic Pathways outlined and consistently updated by the IPCC. However, evidence is mounting that the risk of the Atlantic Meridional Overturning Circulation (AMOC) collapsing in the second half of the 21st century is increasing. Such a collapse would likely entail drier and cooler conditions across Europe. This possibility is not accounted for in current climate-smart forestry approaches an complicates the task of forest management regarding suitable species choices to ensure the integrity of European forests throughout the next century. 

To determine optimal species portfolios for climate-smart forestry, dynamic vegetation models (DVMs) have been used due to their ability to model ecological processes under different future scenarios. However, as of yet, DVMs have not been applied to investigate the consequences of a possible AMOC collapse. Here, we use LPJ-GUESS to model the impact of an AMOC collapse on European forests from both a species composition and a carbon perspective taking into account current forest management and species selection practices. 

Our results suggest that an AMOC collapse in the second half of the 21st century will lead to diverging responses across Europe. Northern Europe, including the British Isles and Scandinavia is at risk of "shrubification" and subsequent decrease of forest carbon. On the other hand, coastal areas, particularly in the Mediterranean region are likely to experience an increase in forest area due to the cooler climate. Across Europe, our simulations suggest that a shift in species selection will need to occur to ensure the continued productivity and integrity of forest ecosystems. Our results underscore the need to consider the possibility of an AMOC collapse in forest management plans to ensure that the forests established today will remain viable tomorrow. 

How to cite: Meyer, B. F., Wittenbrink, M., Rammig, A., and Buras, A.: A world run AMOC: Simulating the forest carbon and water cycle past the tipping point of the Atlantic Meridional Overturning Circulation with a dynamic vegetation model, EGU General Assembly 2026, Vienna, Austria, 3–8 May 2026, EGU26-19684, https://doi.org/10.5194/egusphere-egu26-19684, 2026.

EGU26-20083 | ECS | Posters on site | BG3.38

Historic analogues and species-specific tree growth responses to the 2018-2022 drought sequence in Germany 

Felix Pohl, Burkhard Neuwirth, Mohammad Abdoli, Marvin Müsgen-von den Driesch, David Steger, Theresa Blume, Ingo Heinrich, Heye Bogena, Michael Leuchner, and Anke Hildebrandt

In recent decades, Central Europe has experienced an increase in the clustering of hot and dry compound extremes, with significant implications for forest health and carbon uptake. The multi-year drought from 2018 to 2022 is a prime example of this, but the severity of persistent drought and its impact on growth likely varies among species and landscapes. Here, we investigate how recent and historical droughts influence radial growth across a hydroclimatic gradient in Germany.

Tree-ring cores were sampled from multiple sites spanning western and eastern Germany to capture contrasts in water availability and elevation. The dataset includes broadleaf and conifer species common in managed and semi-natural forests (Fagus sylvatica, Quercus robur, Q. petraea, Pinus sylvestris, Pseudotsuga menziesii). To quantify drought impact and persistence, we relate growth to multi-timescale drought indices (SPEI) and compare the 2018–2022 sequence against earlier drought episodes. Species-specific growth responses are estimated using a non-linear hierarchical modelling framework (generalized additive mixed models, GAMM) that can simultaneously account for size and age effects, stand context, between-tree variability, and the repeated-measures structure of annual rings.

We present results on (i) how exceptional recent drought persistence is in a historical context, and (ii) which species–site combinations are most sensitive to sustained water limitation, by linking multi-timescale drought metrics to species-specific growth responses across contrasting environments. Our findings reveal that the 2018–2022 period stands out as the most severe multi-year drought event at longer accumulation scales across regions. Meanwhile, growth responses demonstrate pronounced species dependence and site modulation along the gradient. Our work provides valuable insights into recent forest growth anomalies and helps to inform expectations under increasing climate variability. 

How to cite: Pohl, F., Neuwirth, B., Abdoli, M., Müsgen-von den Driesch, M., Steger, D., Blume, T., Heinrich, I., Bogena, H., Leuchner, M., and Hildebrandt, A.: Historic analogues and species-specific tree growth responses to the 2018-2022 drought sequence in Germany, EGU General Assembly 2026, Vienna, Austria, 3–8 May 2026, EGU26-20083, https://doi.org/10.5194/egusphere-egu26-20083, 2026.

EGU26-20335 | Posters on site | BG3.38

Large-scale forest responses to droughts using national forest inventories: a systematic review 

Paloma Ruiz-Benito, Marina Rodes-Blanco, Julián Tijerín-Triviño, Pedro Rebollo, Xavier Serra-Maluquer, Julen Astigarraga, Miriam Bravo-Hernández, Verónica Cruz-Alonso, Cristopher Fernández-Blas, Cristina Grajera-Antolín, Asier Herrero, and Miguel A. Zavala

Drought and temperature trends are shifting under recent climate change, resulting in decreased water availability. These changes are leading to widespread tree growth declines, increased mortality, and regeneration impairment, having direct implications for forest biodiversity and functioning. Despite growing evidence of drought-induced impacts on forests, characterising drought effects at large spatio-temporal scales remains challenging due to the limited availability of long-term continuous data over space and time and the multidimensional nature of drought. As a result, assessment of drought effects on forest responses varies widely across studies. National Forest Inventories (NFIs) systematically record forest structure and composition, enabling demography and biomass estimation. Their extensive spatial coverage and systematic data collection make NFIs invaluable tools for long-term monitoring of climate-driven spatio-temporal changes in forests. To understand how drought impacts on forests are assessed using NFIs, we systematically analysed the scientific literature on the use of NFIs to evaluate drought effects on forests. We conducted a scoping review using the Scopus database to identify studies published in English that explicitly link drought to forest responses based on NFIs. We found that most of the studies are conducted in North America and Europe, reflecting NFI data availability, and focused on species- or stand –level responses- growth or mortality- and accounted for only one drought dimension (e.g. intensity). Our review aimed to consolidate existing knowledge on drought impacts on forests using NFIs, identify dominant methodological approaches, and highlight critical gaps that must be addressed to improve understanding and prediction of forest responses to drought under ongoing climate change.

How to cite: Ruiz-Benito, P., Rodes-Blanco, M., Tijerín-Triviño, J., Rebollo, P., Serra-Maluquer, X., Astigarraga, J., Bravo-Hernández, M., Cruz-Alonso, V., Fernández-Blas, C., Grajera-Antolín, C., Herrero, A., and Zavala, M. A.: Large-scale forest responses to droughts using national forest inventories: a systematic review, EGU General Assembly 2026, Vienna, Austria, 3–8 May 2026, EGU26-20335, https://doi.org/10.5194/egusphere-egu26-20335, 2026.

EGU26-21486 | ECS | Posters on site | BG3.38

Resilience dynamics of European forests under consecutive drought events 

Agata Elia, Mark Pickering, Giovanni Forzieri, Alessandro Cescatti, and Diego Fernandez Prieto

The increasing frequency and persistence of drought and compound hot and dry extreme events have raised growing concerns about the future of forest ecosystems, given the strong link between climatic stress, tree mortality, and declining biomass carbon stocks. European forests are particularly vulnerable, as the continent is among the regions most affected by compound hot and dry extremes in terms of both spatial extent and duration. Assessing how forests respond to repeated drought events is therefore important in understanding ecosystem vulnerability under ongoing climate change and to pinpoint adaptation strategies.

In the presented study, we investigate the dynamics of the resilience of stable European forests where repeated drought events occur. Using a 2003-2022 time series of Normalized Difference Vegetation Index (NDVI) anomalies at an 8-day temporal resolution from MODIS satellites, we quantify ecosystem resilience via the lag-1 temporal autocorrelation (AC1). Drought events are retrieved from the Dheed global database of dry and hot extreme events based on ERA5 (Weynants et al., 2025). 

Trends in AC1 in between the events are then assessed to identify dynamics in forest resilience across Europe and to explore their correlation with drought frequency and a set of drought metrics. The link between forest resilience and drought events is also explored at the biogeographical scale. This approach assesses the potential cumulative impact of repeated extreme events on forest resilience beyond a single-event recovery analysis. By understanding if and how repeated droughts shape European forests' response to extreme events we aim to eventually identify preconditions, such as ecosystem heterogeneity, that positively influence their resilience.

How to cite: Elia, A., Pickering, M., Forzieri, G., Cescatti, A., and Fernandez Prieto, D.: Resilience dynamics of European forests under consecutive drought events, EGU General Assembly 2026, Vienna, Austria, 3–8 May 2026, EGU26-21486, https://doi.org/10.5194/egusphere-egu26-21486, 2026.

Drought is a major abiotic stressor that constrains key physiological processes in forest trees and influences their resilience. Climate models predict increasing frequency and intensity of drought events, which will shorten the intervals available for recovery between successive stress episodes. This study investigated the effects of water deficit on photosystem II (PSII) functioning in European beech (Fagus sylvatica L.) saplings, and recovery of PSII-related functional parameters following rewatering.

A total of 41 F. sylvatica saplings were grown under a transparent roof with controlled irrigation in a forest gap in central Poland. The experimental design included a well-watered control and a water deficit treatment consisting of a 30-day irrigation withdrawal followed by 40 days of rewatering to track recovery. Eight measurement series were conducted during the summer of 2024 at regular 7–10-day intervals. Chlorophyll a fluorescence was measured after 20 min of dark adaptation using a HandyPEA fluorimeter.

The progressive decrease in soil water content led to a significant decline in PSII efficiency (FV/FM) in F. sylvatica saplings. The applied stress prolonged the time required to reach maximum fluorescence (TFM) and decreased the maximum fluorescence level (FM) indicating slower and incomplete reduction of QA molecules​ and a reduced pool of available reaction centres (Area). These changes increased excitation pressure per reaction centre, reflected by higher ABS/RC, thereby elevating the risk of photodamage. However, we also observed increased dissipation of excess energy as heat (DI₀/RC), providing evidence for the activation of PSII protective mechanisms.  Following rewatering, F. sylvatica saplings exhibited partial recovery of PSII performance, suggesting that drought-induced impairments of photochemical efficiency were at least partly reversible under the applied experimental conditions. Taken together, our results suggest that while F. sylvatica can engage photoprotective responses under drought, incomplete post-drought recovery may increase vulnerability under scenarios of recurrent drought with short recovery intervals, with implications for the management of beech-dominated forests.

How to cite: Dubińska, A. and Niemczyk, M.: What chlorophyll fluorescence reveals about PSII functioning during water deficiency in European beech (Fagus sylvatica L.) saplings?, EGU General Assembly 2026, Vienna, Austria, 3–8 May 2026, EGU26-22265, https://doi.org/10.5194/egusphere-egu26-22265, 2026.

EGU26-22382 | Orals | BG3.38

Amazon forest carbon sinks are surprisingly resilient, but vulnerable to increasing drought length 

Shuli Chen, César Terrer, Luz Adriana Cuartas, Bruce W Nelson, Antonio Donato Nobre, Natalia Restrepo-Coupe, Scott C Stark, Julia V Tavares, Cleo Quaresma, Santiago Botia, Scott Saleska, Juliana Schietti, and Izabela Aleixo

Amazon tropical forests, the most extensive on earth, are a major but now declining sink for atmospheric CO2, due to both direct human-caused deforestation and increasing mortality in intact forests from rising temperatures and more frequent droughts. However, specific mechanisms underlying rising mortality in intact forests (and associated C sink declines), and its heterogeneous spatial distribution remain unresolved. Using MODIS-based remotely sensed observations of forest responses to the exceptionally hot 2023/2024 El-Niño drought (whose duration was unprecedented in the satellite era), we tested whether a statistical model of the biogeography of remotely sensed photosynthetic responses to droughts (2005, 2010, 2015/16 and 2023/24)---including vulnerability and resilience of canopy greenness---could also explain the biogeography of forest carbon sink vulnerability and resilience across the basin. 


We found that the remote sensing-derived biogeography of canopy greenness also explained decadal C sink trends in ground-based forest plots, with the resilience of canopy greenness predicting which plots had sustainable C sinks and which had weakening C sinks over time due to increasing tree mortality. Factors predicting vulnerability to increased mortality (and declining C sequestration) included: deep water tables (where water resources are far from trees’ roots), shorter forests with shallow rooting depths (where tree access to water is limited), and especially, forests on fertile soils (which grow quickly with little investment in drought tolerance traits). Our biography of carbon sink resilience and vulnerability suggests that the distribution of ground-based monitoring plots are biased towards more vulnerable regions, and hence they over-estimate the rate of carbon sink decline. Adjusting for the distribution of biogeographic factors controlling carbon sink dynamics, we find the recent basin-wide carbon sink remains effectively stable. However, the exceptionally long 2023 drought guided identification of a critical drought-length threshold of 6 months, beyond which vulnerable forest regions expanded, suggesting that since longer droughts are becoming more common, C sinks may be destabilizing. This new approach, based on remotely derived forest sensitivity to climatic perturbations, identifies key drivers of forest demography and carbon dynamics, and reveals drought-length as a major contributor to the risk of forest tipping points and loss of carbon storage, with implications for resilience of Earth’s climate system.

How to cite: Chen, S., Terrer, C., Cuartas, L. A., Nelson, B. W., Nobre, A. D., Restrepo-Coupe, N., Stark, S. C., Tavares, J. V., Quaresma, C., Botia, S., Saleska, S., Schietti, J., and Aleixo, I.: Amazon forest carbon sinks are surprisingly resilient, but vulnerable to increasing drought length, EGU General Assembly 2026, Vienna, Austria, 3–8 May 2026, EGU26-22382, https://doi.org/10.5194/egusphere-egu26-22382, 2026.

The Maasai Mau Forest is part of Kenya’s Mau Forest Complex, which is one of East Africa’s most vital tropical water towers. Over the recent decades, it has experienced significant disturbances from encroachment, unauthorised livestock grazing, and illegal abstraction of forest resources. These pressures have significantly altered the structural composition of forests, reduced aboveground biomass, and weakened critical ecosystem services. Currently, countries have engaged in national initiatives aimed at forest ecosystem restoration, including AFR100, REDD+, and SDG15, and Kenya has an ambitious objective to plant 15 billion trees by 2032. These offer a significant opportunity to assess the large-scale recovery of tropical forests. However, monitoring efforts remain limited by weak indicators, a lack of baseline data, and inconsistent reporting systems.

This study examines disturbances and recovery in restored areas of the Maasai Mau Forest using an integrated remote sensing and machine-learning approach. The analysis focuses on assessing vegetation growth, area restored in hectares and carbon sequestered during the process using Sentinel-1 radar, Sentinel-2 optical imagery, GEDI lidar, and ground measurements. They are used to quantify spatial, temporal, and structural (3D) changes in vegetation following disturbance and during recovery.

Data from 2019 to 2025 were processed to develop fused satellite products for the region of interest. Sentinel-1 (VV, VH) was corrected and speckle-filtered using the refined Lee method, while Sentinel-2 imagery was cloud-masked and reduced to relevant spectral bands. From these datasets, radar-based indices, VV/VH ratios, and optical vegetation indices (NDVI, EVI, SAVI, PSSRa) were derived. The indices and selected bands were fused, and principal component analysis (PCA) was performed to generate harmonized inputs for classification.

K-means clustering was applied to the PCA outputs and subsequently labelled as forest and non-forest classes. NDVI was also used to derive annual indices and assess time-series trends. Comparing the classified outputs over time enabled a change detection of forest loss and gain. NDVI-based thresholds and temporal metrics were combined with classified outputs to identify restored areas and map vegetation recovery trajectories.

The results show a clear pattern of forest regeneration. NDVI analysis and satellite-based classification indicate a stable increase in forest cover and a decline in non-forest areas between 2019 and 2025. Dense vegetation increased after 2023, while moderate vegetation declined and sparse vegetation remained relatively stable, with a trend of y = 2336.2x + 30453 (R² = 0.510). PCA-based classification shows forest cover increasing from 32,424 ha to 36,791 ha, while non-forest areas decreased from 13,751 ha to 9,385 ha. Linear trend analysis supports this positive trajectory (forest: y = 1202.7x + 31066, R² = 0.643; non-forest: y = –1202.7x + 15110, R² = 0.643), suggesting a progressive transition from non-forest to forested conditions.

This research shows how tropical forests regenerate after disturbance and enhances understanding of vegetation response to structured efforts. The findings offer valuable evidence for policymakers, conservation planners, and climate practitioners aiming to strengthen restoration outcomes across tropical landscapes.

How to cite: Mutwiri, F. and Vitti, A.: Leveraging Geospatial Techniques to Monitor Restoration Efforts and Assess Associated Forest Ecosystem Services: Case Study of Maasai Mau Forest in Kenya, EGU General Assembly 2026, Vienna, Austria, 3–8 May 2026, EGU26-525, https://doi.org/10.5194/egusphere-egu26-525, 2026.

EGU26-642 | Posters on site | BG3.39

Fire Risk Assessment of Ise Forest Reserve, Ekiti State, Nigeria 

Daniel Abiodun Akintunde-Alo, Taiwo Tolulope Ade-Onojobi, and Okikiola Michael Alegbeleye

Fires are very important proponents of disturbance within an ecosystem. The direct impacts of fires on the forests cause mortality in biodiversity such as birds, reptiles, and other organisms which may use the forests as a means of survival and livelihood. However, critical information on the level of forest fire risk in most forest ecosystem in Nigeria is scares. However, this study was designed to determine the susceptibility of Ise Forest Reserve to fire hazard.


Climatic variables such as temperature (°C), relative humidity (%), and precipitation (mm/day)  for

1994, 2004, 2014, and 2024. were assessed using data obtained from NASA Power. Vegetation and moisture status was spatially obtained from Vegetation indices: Normalized Difference Vegetation Index (NDVI), Normalized Difference Moisture Index (NDMI). Landsat satellite imagery (1994–2024) to assess trends. Fire risk maps were developed, after observing the fuel load throughout the area. Areas of risk were identified and classified into high risk, moderate risk, and low risk areas.

Temperature increased steadily from 24.59 °C in 1994 to 25.34 °C in 2024.  The precipitation of the study area had an overall decrease from 5.08mm/day in 1994 to 3.61mm/day in 2024. There was a slight increase in relative humidity from 67.6 in 1994 to 68.4% in 2024 which was an overall 1.26% change within the period. Further variations were observed between the years. NDVI, and NDWI revealed moderate to high tree vigour with the reserve occasionally experiencing regions with robust vegetative growth (SAVI > 0.5). However, the existence of low-SAVI patches highlights persistent issues with changing land use, degraded soil, or climate stresses.

The fuel load index showed that the reserve is largely low risk of fire ranging from 8 to 0. However, the reserve may generally be of moderate risk by 2034 since the area of high risk has increased.

This study highlights the increasing degradation on the fringe areas of the forest which may have adverse effects on the conserved Pan African Chimpanzee, which is conserved within the reseerve.

Keywords: Fire risk, fuel load, fire prediction, climate variations Ise forest reserve

How to cite: Akintunde-Alo, D. A., Ade-Onojobi, T. T., and Alegbeleye, O. M.: Fire Risk Assessment of Ise Forest Reserve, Ekiti State, Nigeria, EGU General Assembly 2026, Vienna, Austria, 3–8 May 2026, EGU26-642, https://doi.org/10.5194/egusphere-egu26-642, 2026.

EGU26-1615 | ECS | Orals | BG3.39

Tree growth after a major hurricane reflects pre-disturbance vigorrather than canopy damage 

Laura Boeschoten, Roi Ankori-Karlinsky, Gabriel Arellano, Alyssa Brown, Dingyi Fang, Veronika Leitold, Douglas Morton, Gan Yuan, Tian Zheng, Jess Zimmerman, and Maria Uriarte

Tree crown damage from disturbance events can strongly influence forest demography, yet its effect on stem growth remains poorly quantified. Hurricanes provide a powerful natural experiment to examine these dynamics, as they inflict a broad range of structural damage across individuals and forest stands. Here we assess how crown damage from Hurricane Mar´ıa (2017) affected post-storm stem growth in a wet
subtropical forest in Puerto Rico by combining airborne LiDAR with field measurements for 1,082 trees. Unlike previous studies, we used a continuous, objective measure of crown damage and explicitly separated individual- from neighborhood-level effects using a causal inference framework. Across the population, stem growth rates after the hurricane were similar to pre-hurricane values. Larger and more heavily damaged trees exhibited moderately reduced growth, while neighborhood crown damage and neighborhood mortality had no detectable effect. However, these damage effects were smaller than the influence of pre-hurricane growth rates, indicating that pre-hurricane individual vigor outweighed biomass loss and competitive release
in shaping growth responses. Our findings highlight the resilience of surviving trees in sustaining carbon uptake after a severe disturbance, while challenging the assumption of a strong growth suppression following biomass loss, embedded in dynamic vegetation models. 

How to cite: Boeschoten, L., Ankori-Karlinsky, R., Arellano, G., Brown, A., Fang, D., Leitold, V., Morton, D., Yuan, G., Zheng, T., Zimmerman, J., and Uriarte, M.: Tree growth after a major hurricane reflects pre-disturbance vigorrather than canopy damage, EGU General Assembly 2026, Vienna, Austria, 3–8 May 2026, EGU26-1615, https://doi.org/10.5194/egusphere-egu26-1615, 2026.

EGU26-2587 | ECS | Posters on site | BG3.39

Quantifying selective logging impacts in Central African forests using UAV imagery: from individual trees to canopy gaps 

Zoé Rousseau, Jean-François Bastin, and Jean-Louis Doucet

The recently adopted EU Deforestation Regulation (EUDR) requires fine-scale verification of deforestation and forest degradation associated with timber supply chains. In Central Africa, however, region-specific data remain scarce, limiting the ability to distinguish the impacts of different logging practices and to differentiate regulatory definitions of degradation from actual ecological outcomes. This study addresses this gap by proposing a drone-based methodology to assess post-harvest impacts at the tree level. Focusing on FSC-certified selective logging, which typically removes only one to two trees per hectare, we aim to establish direct relationships between harvested tree characteristics and resulting canopy openings. Using high-resolution UAV imagery acquired before and after logging, combined with forest inventory data, canopy gaps are delineated and linked to individual trees. Gap size is analyzed in relation to species identity, tree diameter, felling conditions, forest type, topography, and crown-related traits derived from allometric equations. By identifying the key drivers of canopy opening at the individual level, this approach seeks to provide operational tools to better characterize forest degradation and support more robust monitoring frameworks under the EUDR.

How to cite: Rousseau, Z., Bastin, J.-F., and Doucet, J.-L.: Quantifying selective logging impacts in Central African forests using UAV imagery: from individual trees to canopy gaps, EGU General Assembly 2026, Vienna, Austria, 3–8 May 2026, EGU26-2587, https://doi.org/10.5194/egusphere-egu26-2587, 2026.

EGU26-2826 | ECS | Posters on site | BG3.39

Analysis of Congo Basin rainforest regrowth trajectories by land use history 

Andrés Martínez de Velasco, Sacha Delecluse, Félicien Meunier, Pierre Defourny, Hans Verbeeck, and Marijn Bauters
As the world’s second largest rainforest, the Congo Basin rainforest plays a crucial role in the global carbon cycle. Furthermore, recent data suggests that it is more carbon-dense and more resistant to climate change than the Amazon (White et al, 2021). It is also a vital resource for local livelihoods and regional climate regulation. Increasing human disturbance to this rainforest due to demographic growth is generating large uncertainties in the regional carbon balance, mainly due to a lack of understanding of forest regrowth trajectories. The Afrocards consortium (U. Gent, U. Liege and U. catholique de Louvain) works to better understand regional regrowth trajectories following slash-and-burn agriculture, which is the dominant cultivation system in the region. In particular, we aim to shed light on the role of land use history and environmental variables in determining forest regrowth. To that end, we work to develop a regional land surface model calibrated on field, airborne, and satellite remote sensing data.
 
Here we present results related to the calculation of regrowth curves based on satellite remote sensing data using a space-for-time approach, where forest patches of different age are coupled with their above ground biomass (AGB). Building on a methodology initially established at the Laboratoire des Sciences du Climat et de l’Environnement (P. Ciais, Y. Xu), we use the time since last disturbance as a proxy for forest age, derived from the Tropical Moist Forest dataset, paired with gridded AGB estimates as our input data. The coupled age/AGB data is grouped by land use history classes and used as input to fit local sigmoidal (Richard-Chapman) regrowth curves using a Bayesian approach at the 1-degree grid cell level, across the Congo Basin. By using a Bayesian modeling approach, we can better account for uncertainties on the input data and output model parameter estimates. We use the posterior distributions of the fit parameters for all 312 grid cells and 3 land use history classes together with gridded bioclimactic variable datasets to carry out an exploratory analysis of variable importance and interaction by means of machine learning techniques, including Decision Tree ensemble methods and clustering methods. Ultimately, we aim to use such local regrowth curves to calibrate the Ecosystem Demography Biosphere model (version 2) to carry out mechanistic modeling of forest regrowth in the Congo Basin under different climate change and demographic growth scenarios.

How to cite: Martínez de Velasco, A., Delecluse, S., Meunier, F., Defourny, P., Verbeeck, H., and Bauters, M.: Analysis of Congo Basin rainforest regrowth trajectories by land use history, EGU General Assembly 2026, Vienna, Austria, 3–8 May 2026, EGU26-2826, https://doi.org/10.5194/egusphere-egu26-2826, 2026.

EGU26-2827 | ECS | Posters on site | BG3.39

Projected High-Resolution CO2 Concentrations over the Amazon Rainforest under the SSP5-8.5 Pathway through the End of the Century 

Angel Liduvino Vara-Vela, Noelia Rojas, Santiago Botía, Luciana Rizzo, and Luiz Augusto Toledo Machado

The continued degradation of the Amazon rainforest, exacerbated by rising air temperatures and increased hydric stress in recent decades, is altering its capacity to absorb carbon. However, the scarcity of local observations and the difficulty of representing the vast and diverse Amazon biome in numerical models make it challenging to accurately quantify carbon exchanges across the region. Consequently, determining whether the Amazon as a whole currently functions as a carbon source or sink remains a key priority for future research.

In this study, we conducted high-resolution simulations of CO2 concentrations over the Amazon rainforest using the Weather Research and Forecasting Greenhouse Gas (WRF-GHG) model for April and September of selected years through the end of the century. Initial and boundary conditions for
meteorological variables and background CO2 concentrations were derived from projections of the Intergovernmental Panel on Climate Change (IPCC) worst-case climate scenario based on the Coupled Model Intercomparison Project 6 (CMIP6) under the Shared Socioeconomic Pathway 5-8.5 (SSP5-8.5). To ensure consistency, SSP5-8.5 land-use projections from the Land-Use Harmonization version 2 (LUH2) dataset were reclassified to match WRF-GHG land-use categories. All simulations included a 15-day spin-up period, followed by a two-day rolling simulation framework for the target month.

The results indicate that by 2050, CO2 concentrations over the Amazon are projected to reach approximately 550-650 ppm, exceeding the global, Northern Hemisphere, and Southern Hemisphere annual mean concentrations for that year, which are estimated at about 563 ppm, 567 ppm, and 558
ppm, respectively. Notably, the simulations also suggest a slight reduction in Net Ecosystem Exchange (NEE) fluxes between 2030 and 2050.

How to cite: Vara-Vela, A. L., Rojas, N., Botía, S., Rizzo, L., and Toledo Machado, L. A.: Projected High-Resolution CO2 Concentrations over the Amazon Rainforest under the SSP5-8.5 Pathway through the End of the Century, EGU General Assembly 2026, Vienna, Austria, 3–8 May 2026, EGU26-2827, https://doi.org/10.5194/egusphere-egu26-2827, 2026.

EGU26-3087 | ECS | Posters on site | BG3.39

Improving net carbon flux estimates in Tropical South America by accounting for forest degradation and recovery in a Vegetation Photosynthesis and Respiration Model 

Mario Cárdenas-Vélez, Theo Glauch, Cleo Q. Dias-Junior, Carla Souza, Shujiro Komiya, Hella van Asperen, Luan de Paula Cordeiro, Noelia Rojas, Luciana Rizzo, Luiz Machado, Rafael Stern, Eric Cosio, Rodrigo Jimenez, Luis Morales, Christoph Gerbig, Katja Trachte, and Santiago Botía

The net carbon exchange between ecosystems and the atmosphere (Net Ecosystem Exchange, NEE) is determined by the balance between Gross Primary Production (GPP) and Ecosystem Respiration (Reco). However, in tropical South America (TSA), the spatial variability of these factors and the factors that influence them are not well understood, especially in areas affected by forest degradation and secondary forest recovery. Here, we use a new implementation of the Vegetation Photosynthesis and Respiration Model (pyVPRM) to generate hourly, spatially explicit estimates of NEE, GPP, and Reco across TSA. The model is constrained by eddy-covariance measurements from 22 flux towers spanning Amazonian upland and lowland forests, Andean-influenced forests, tropical wetlands, and Orinoco savannas, combined with remotely sensed vegetation indices (EVI), meteorological forcing, and annually varying land-cover maps from MapBiomas. We extend the standard pyVPRM land-cover classification to explicitly represent forest disturbance and recovery states, distinguishing undisturbed, degraded, deforested, and regenerating forests. This allows us to quantify how forest degradation and regrowth alter the magnitude and spatial distribution of gross carbon fluxes compared with simulations that do not distinguish between degradation classes. We expect that resolving these disturbance states will reduce systematic biases in both GPP and Reco over human-modified landscapes and improve the attribution of carbon sources and sinks across the TSA region beyond what is captured by climate forcing alone. By separating disturbance-driven from climate-driven flux variability, this framework provides a more realistic prior for regional atmospheric inverse modelling and a stronger basis for assessing the carbon consequences of tropical forest degradation and recovery.

How to cite: Cárdenas-Vélez, M., Glauch, T., Q. Dias-Junior, C., Souza, C., Komiya, S., van Asperen, H., de Paula Cordeiro, L., Rojas, N., Rizzo, L., Machado, L., Stern, R., Cosio, E., Jimenez, R., Morales, L., Gerbig, C., Trachte, K., and Botía, S.: Improving net carbon flux estimates in Tropical South America by accounting for forest degradation and recovery in a Vegetation Photosynthesis and Respiration Model, EGU General Assembly 2026, Vienna, Austria, 3–8 May 2026, EGU26-3087, https://doi.org/10.5194/egusphere-egu26-3087, 2026.

EGU26-4631 | Orals | BG3.39

Assessing the risk of a fire-driven tipping point in the Congo Basin  

Hannah Stouter, Douglas Morton, Paulo Brando, Shane Coffield, Benis Egoh, Yue Li, Landing Mané, Denis Sonwa, Isabella Zouh, and Elsa Ordway

Fires have long played an important role in social-ecological and agricultural systems across the tropics, but until the early 1990s, these fires rarely posed a threat to surrounding forests. Since then, the size, intensity, and frequency of fires in tropical forests in the Amazon and South East Asia have increased, particularly during periods of drought. This increase in fire activity is fueled by a combination of changing climate conditions and land-use practices and poses a significant threat to biodiversity and carbon storage. In the Congo Basin, home to Earth’s second-largest tropical forest and the largest tropical peatland complex, fire activity has increased in recent decades according to the satellite record. However, current fire regimes and drivers, as well as the long-term response of Congo Basin forests to fire, remain poorly understood. This is in part due to limitations the of current satellite-based datasets to detect fire in the region. We 1) synthesize what is known about fire in the Congo Basin, 2) examine trends in existing remotely sensing fire datasets, 3) discuss difficulties detecting fire in the Congo Basin to highlight why current methods are likely under-detecting fire, 4) explore possible social-ecological drivers of fire by highlighting changes in forest disturbances and climate, and 5) report research needs to advance understanding of changing fire dynamics in the Congo Basin. This work highlights a key knowledge gap and provides a roadmap for improving the ability to detect and monitor fire in the Congo Basin, to improve understanding of tropical carbon flux dynamics, and support local fire adaptation and management plans for communities across the Congo Basin.

How to cite: Stouter, H., Morton, D., Brando, P., Coffield, S., Egoh, B., Li, Y., Mané, L., Sonwa, D., Zouh, I., and Ordway, E.: Assessing the risk of a fire-driven tipping point in the Congo Basin , EGU General Assembly 2026, Vienna, Austria, 3–8 May 2026, EGU26-4631, https://doi.org/10.5194/egusphere-egu26-4631, 2026.

EGU26-5962 | ECS | Orals | BG3.39

Forest edge effects amplify impacts of 2023-2024 Amazon drought on forest productivity 

Dayang Zhao, Gregory Duveiller, Alessandro Cescatti, Philippe Ciais, Ruochen Cao, Zhaoying Zhang, Lei Zhu, Josep Peñuelas, Wei Li, and Yongguang Zhang

The Amazon rainforest is increasingly affected by both forest fragmentation and extreme droughts. However, the interacting impacts of these two disturbances on forest carbon dynamics remain poorly understood. Here, we investigated how fragmentation-induced forest edges modulated productivity responses to the 2023–2024 “once-in-a-hundred-years” drought in the Amazon. Using high-resolution satellite observations of photosynthetic indices together with canopy height and forest cover data, we compared the differences in drought responses between edge and interior forests across the basin. We found that, at the basin scale, edge forests exhibited stronger drought-induced productivity declines than interior forests and contributed 64.0 ± 18.1% of the total productivity loss during this drought, indicating that edge effects overall amplify drought impacts on productivity. However, edge responses exhibited strong regional contrasts during this drought. In the northeastern Amazon, where water tables were deeper and droughts were more severe, edge forests exhibited 4.9 ± 2.4% greater productivity declines than interior forests. In contrast, in the southwestern Amazon, characterized by shallow water tables, edge forests showed 2.9 ± 1.8% smaller productivity reductions than interior forests. In addition, edge-related forest structural degradation, reflected by reduced canopy height, further intensified the differences in drought responses between edge and interior forests. Our findings show that edge–drought interactions substantially undermine the carbon uptake across large areas of the Amazon, highlighting the urgent need to curb further fragmentation and protect remaining interior forests, particularly in drought-prone edge regions.

How to cite: Zhao, D., Duveiller, G., Cescatti, A., Ciais, P., Cao, R., Zhang, Z., Zhu, L., Peñuelas, J., Li, W., and Zhang, Y.: Forest edge effects amplify impacts of 2023-2024 Amazon drought on forest productivity, EGU General Assembly 2026, Vienna, Austria, 3–8 May 2026, EGU26-5962, https://doi.org/10.5194/egusphere-egu26-5962, 2026.

EGU26-7220 | ECS | Posters on site | BG3.39

Forest regrowth dataset for globally key deforestation regions 

Jinlong Zang

Deforestation-driven forest loss substantially alters the global carbon budget and degrades ecosystem services, while subsequent forest regrowth is critical for ecosystem recovery and carbon sequestration. However, comprehensive datasets explicitly characterizing post-deforestation forest regrowth remain lacking. Here, we integrate multiple remote sensing products to develop the first spatially explicit dataset quantifying forest structural regrowth following deforestation across globally important deforestation regions at 30 m resolution. The dataset characterizes regrowth dynamics of forest height, aboveground biomass (AGB), leaf area index (LAI), and the fraction of photosynthetically active radiation (FPAR). For each structural attribute, regrowth ratios and rates are provided at 5-year intervals, primarily spanning 1985–2020. This dataset enables a detailed assessment of post-deforestation forest regrowth across spatial, temporal, and structural dimensions, supporting improved quantification of forest carbon budgets and enhanced evaluation of forest ecosystem services.

How to cite: Zang, J.: Forest regrowth dataset for globally key deforestation regions, EGU General Assembly 2026, Vienna, Austria, 3–8 May 2026, EGU26-7220, https://doi.org/10.5194/egusphere-egu26-7220, 2026.

EGU26-7498 | ECS | Orals | BG3.39

Net carbon losses in Central African forests revealed by high-resolution biomass change maps 

Liang Wan, Philippe Ciais, Aurélien de Truchis, Yidi Xu, Martin Brandt, Jérome Chave, Clément Bourgoin, Jean-Pierre Wigneron, Jean-François Bastin, Wei Li, Youngryel Ryu, Shidong Liu, David Purnell, Ibrahim Fayad, Le Bienfaiteur Sagang, Arthur Vander Linden, Timothée Besisa, and Pierre Ploton

Dense humid forests in Central Africa hold vast biomass carbon stocks but face increasing pressure from logging, clearings, and fire disturbances. Many of these disturbance events have a small spatial scale and are missed by current satellite observations. To address this knowledge gap we generated annual 10 meter resolution maps of canopy height from 2019 to 2022 using a deep learning model fusing spaceborne lidar height measurements with Sentinel radar and optical imagery. The maps reveal widespread previously undetected small disturbance patches, with 87% of all the disturbances being of less than 1 ha in size. These disturbance patches smaller than 1 ha account for 48% of the biomass carbon gains in regrowing forests and for 37% of carbon losses from deforestation. We found a net carbon loss of −58 ± 9 Tg C yr−1 composed of a gross loss of −126 ± 7 Tg C yr−1 partially offset by a gain of 68 ± 6 Tg C yr−1, implying a turnover of biomass carbon from disturbances of 0.52% per year. The Democratic Republic of the Congo is a small net source of carbon (−46 ± 6 Tg C yr−1) due to degradation, despite having the largest carbon gains in young secondary forests. Across the Congo Basin, protected areas show a net biomass loss of −4 ± 1 Tg C yr−1, with a gross loss of −14 ± 1 Tg C yr−1, highlighting uneven conservation outcomes. Our remote-sensing data aggregated into national carbon budgets align well with country-level inventories and bookkeeping model estimates, paving the way for spatially explicit and transparent carbon monitoring.

How to cite: Wan, L., Ciais, P., de Truchis, A., Xu, Y., Brandt, M., Chave, J., Bourgoin, C., Wigneron, J.-P., Bastin, J.-F., Li, W., Ryu, Y., Liu, S., Purnell, D., Fayad, I., Sagang, L. B., Vander Linden, A., Besisa, T., and Ploton, P.: Net carbon losses in Central African forests revealed by high-resolution biomass change maps, EGU General Assembly 2026, Vienna, Austria, 3–8 May 2026, EGU26-7498, https://doi.org/10.5194/egusphere-egu26-7498, 2026.

EGU26-9146 | ECS | Orals | BG3.39

Clearing the air: atmospherically corrected hyper temporal observations reveal Central African forest dynamics 

Liezl Mari Vermeulen, Wei Li, Kazuhito Ichii, Pierre Ploton, Nicolas Barbier, and Gregory Duveiller

Understanding how African tropical forests respond to climate and land use change requires dense, reliable time series of vegetation dynamics, yet persistent cloud cover and atmospheric variability strongly limit existing satellite products over the Congo Basin. As a result, key aspects of forest phenology, seasonality, and short term variability remain poorly resolved, constraining our ability to detect early signs of functional change or destabilisation.

Here, we develop and evaluate a high quality vegetation time series for Central African forests by combining hyper temporal resolution observations from the MSG SEVIRI geostationary sensor with high spatial resolution Sentinel 2. At a later stage, these results will also be compared with drone data and ground surveys from the CoForFunc international project. To ensure that observed variability reflects changes in vegetation rather than atmospheric fluctuations, we implement a dedicated atmospheric correction for the SEVIRI data adapted from recent developments for Himawari geostationary satellites and further optimised for humid tropical forest conditions. The near continuous sampling of SEVIRI is exploited to reduce cloud related artefacts and improve temporal consistency, while Sentinel 2 and drone observations provide spatial detail and validation at finer scales. The study establishes a robust observational baseline of forest canopy dynamics against which future climate and land use impacts can be more reliably assessed.

Initial results indicate that the combined dataset captures vegetation dynamics and seasonal transitions more consistently than commonly used products such as MODIS, revealing phenological patterns that are otherwise obscured by cloud contamination and atmospheric noise. By improving the accuracy of functional signals in one of the world’s most data limited tropical regions, this work provides a critical foundation for assessing carbon dynamics, ecosystem resilience, and potential tipping behaviour in African tropical forests under ongoing environmental change.

How to cite: Vermeulen, L. M., Li, W., Ichii, K., Ploton, P., Barbier, N., and Duveiller, G.: Clearing the air: atmospherically corrected hyper temporal observations reveal Central African forest dynamics, EGU General Assembly 2026, Vienna, Austria, 3–8 May 2026, EGU26-9146, https://doi.org/10.5194/egusphere-egu26-9146, 2026.

EGU26-9821 | ECS | Orals | BG3.39

Topography is a major determinant of forest–savanna distributions in coexistence landscapes in Central Africa 

Aart Zwaan, Arie Staal, Mariska te Beest, and Max Rietkerk

Forests and savannas frequently coexist as patches within tropical landscapes, yet the mechanisms controlling their spatial configuration remain unclear. The presence of both vegetation states under similar climatic conditions is often attributed to fire–vegetation feedbacks, but could also reflect variation in overlooked external drivers. In Central Africa, forest–savanna coexistence becomes more common with increasing topographic roughness, but how well topographic heterogeneity explains the forest–savanna configuration within coexistence landscapes is unknown.

Here we address this question and examine the role of individual topographic variables that may influence tree cover by, for instance, changing water availability and fire spread. We identify coexistence landscapes from remotely sensed tree cover data and derive topographic variables from a digital elevation model. We use these variables to develop machine learning algorithms predicting vegetation state within coexistence landscapes.

Models achieved an average prediction accuracy of 0.75, with local elevation (relative to the surrounding 500 m or 5000 m) emerging as the strongest predictor of vegetation state. Both model accuracy and the role of topographic predictors varied strongly among landscapes, reflecting the diverse pathways by which topography can influence tree cover. This highlights the need to consider local context when analysing the distribution and stability of tropical forest and savanna ecosystems. Overall, our findings indicate that topographic heterogeneity is a major driver of forest–savanna coexistence in Central Africa. Coexistence landscapes are more deterministic than previously assumed, suggesting that their response to disturbances and climate change will be spatially heterogeneous, thereby reducing the likelihood of abrupt large-scale shifts between forest and savanna states.

How to cite: Zwaan, A., Staal, A., te Beest, M., and Rietkerk, M.: Topography is a major determinant of forest–savanna distributions in coexistence landscapes in Central Africa, EGU General Assembly 2026, Vienna, Austria, 3–8 May 2026, EGU26-9821, https://doi.org/10.5194/egusphere-egu26-9821, 2026.

EGU26-10854 | Orals | BG3.39

Disturbance-recovery cycles of tree growth after droughts in tropical forests 

Pieter Zuidema, Flurin Babst, Peter Groenendijk, Mizanur Rahman, and Valerie Trouet and the Tropical Tree-ring Network

Tropical forests will be increasingly impacted by intensifying droughts under ongoing climate change. Droughts may have large implications for the capacity of tropical forests to store carbon in wood and act as long-term carbon sinks. To assess this possible implication, pantropical analyses of tree growth recovery from past droughts are needed. 
Here we use tree-ring data from 250 tropical forest sites (>5000 trees) in the tropical tree-ring network (tropicaltreeringnetwork.org) to evaluate the capacity for woody growth to recover after droughts. We assessed impacts on stem growth of the 10% and 5% driest years since 1930 and the extent to which stem growth recovered in the subsequent years. We selected years with the lowest rainfall, highest vapour pressure deficit, and largest climatic water deficit. 
We found that the pantropical impact of droughts on stem growth was a modest 2.8% reduction (CI95%: -3.0 to -2.4%) during the 10% driest years, and 2.9% (CI95%: -3.4 to -2.4%) during the 5% driest years. Yet, in a quarter of sites located predominantly in the drier tropical forest regions, growth was reduced by over 10%. 
Growth recovery was generally rapid: postdrought years exhibited significantly smaller negative growth anomalies, and anomalies often shifted to positive. Thus, this rapid recovery of stem growth to predrought levels suggests that no strong or long lag effects exist at the pantropical scale. We also analysed regional, taxonomic and seasonal differences in growth recovery, and compared the results to drought responses in photosynthesis. 
We conclude that stem growth of tropical forest trees has so far been able to recover from droughts, but that this capacity may diminish under aggravating climate change.

How to cite: Zuidema, P., Babst, F., Groenendijk, P., Rahman, M., and Trouet, V. and the Tropical Tree-ring Network: Disturbance-recovery cycles of tree growth after droughts in tropical forests, EGU General Assembly 2026, Vienna, Austria, 3–8 May 2026, EGU26-10854, https://doi.org/10.5194/egusphere-egu26-10854, 2026.

EGU26-11112 | ECS | Orals | BG3.39

Airborne LiDAR Reveals the Wood Density and the Ecological Succession of Central African Forests through Canopy Gaps 

Arthur Vander Linden, Jean-François Bastin, and Sassan Saatchi

Wood density stands as one of the most integrative functional traits of trees, reflecting fundamental trade-offs in adaptive strategies and closely connected to ecosystem history and dynamics. Wood density is linked to multiple key processes including carbon accumulation and mechanical support, determining how plants allocate resources between growth and survival. Yet, despite its recognized importance for understanding forest ecology and improving carbon stock estimates, spatially explicit knowledge of local wood density variation remains severely limited, particularly in tropical rainforests.

Community wood density integrates ecological processes operating at the stand scale, primarily through species composition. Regeneration guild strategies drive much of this variation: fast-growing pioneer species exhibit low wood density while shade-tolerant species show substantially higher values. These compositional differences are also expressed through distinct forest structure patterns —early succession stages with pioneer-dominated composition generally develop lower, more uniform canopies, whereas mature forests with non-pioneer light demanding and shade-tolerant species build taller, more complex vertical architectures. We hypothesized that vertical canopy opening profiles, capturing the proportion of gaps at successive height aboveground, contain the ecological signatures of floristic composition and successional stages that ultimately determine community wood density.

These ecological relationships create opportunities to leverage high-resolution airborne LiDAR for detecting wood density variation at large scale through canopy structure. To test these hypotheses, we modeled community wood density at the stand level across 76 one-hectare plots in 18 Central African forests. We derived canopy stratification metrics from cumulative gap proportion curves extracted from Canopy Height Models, characterizing vertical opening patterns.

We show that canopy opening profiles effectively capture structural signatures associated with community wood density variation. Canopy openness at approximately 20 m and overall canopy stratification emerged as the strongest predictors. Variance partitioning and structural equation modelling reveal that this structure-wood density relationship is entirely mediated by floristic composition and successional stage, which jointly determine both forest structure and wood density. Canopy structure thus acts as a proxy for species composition.

These findings have direct implications for remote sensing applications in tropical forests such as Central African ones. The strong covariation between vertical stratification and species assemblages opens a pathway to account for local wood density variation when mapping AGB through LiDAR-derived indicators. This approach could substantially reduce uncertainties in carbon stock estimates and improve our technique for monitoring forest degradation and successional dynamics across this critical biome.

How to cite: Vander Linden, A., Bastin, J.-F., and Saatchi, S.: Airborne LiDAR Reveals the Wood Density and the Ecological Succession of Central African Forests through Canopy Gaps, EGU General Assembly 2026, Vienna, Austria, 3–8 May 2026, EGU26-11112, https://doi.org/10.5194/egusphere-egu26-11112, 2026.

EGU26-11562 | ECS | Posters on site | BG3.39

Linking MAX-DOAS measurements of formaldehyde and glyoxal to precursor substances at the canopy-atmosphere-interface at ATTO 

Sebastian Donner, Bianca Lauster, Steffen Ziegler, Paulo Artaxo, Steffen Beirle, Achim Edtbauer, Leon Kuhn, Luiz A. T. Machado, Andrea Pozzer, Akima Ringsdorf, Jonathan Williams, and Thomas Wagner

Multi-AXis Differential Optical Absorption Spectroscopy (MAX-DOAS) uses trace gas absorptions in spectra of scattered sun light recorded at different elevation angles to retrieve vertical profiles of trace gas concentrations and aerosol extinctions in the lower troposphere as well as their total tropospheric vertical column densities. A major advantage of MAX-DOAS is the possibility to observe multiple trace gases, such as formaldehyde and glyoxal, simultaneously for the same air mass. We operate two MAX-DOAS instruments at the Amazon Tall Tower Observatory (ATTO) at altitudes of 80 m (since 2017) and 298 m (since 2019) above ground. Besides the full profile retrievals for both instruments, this setup allows the determination of (small-scale) vertical gradients of trace gas abundances in the altitude range between both instruments (ca. 200 m) by directly comparing their measurements.

Located in a pristine rain forest region in the central Amazon Basin about 150 km north-east of Manaus, the ATTO site offers a unique opportunity to study the chemical processing of tropospheric trace gases far from major anthropogenic emission sources. Further, the site hosts long-term and campaign-based measurements of a large variety of different atmospheric constituents and parameters. Combining these measurements allows investigating chemical processes at the canopy-atmosphere-interface and directly above it. Comparisons with model data yield further insights, e.g. the identification of processes that are not (fully) represented by the simulations or the confirmation of surprising observational results. 

In this study, the MAX-DOAS results of formaldehyde and glyoxal are compared to measurements of their major precursor substances, i.e. isoprene and monoterpenes. This includes assessments of their respective seasonal and diel variations as well as their (small-scale) vertical gradients. For selected time periods, the results of these atmospheric measurements are also compared to model simulations performed with WRF-Chem, using the MOZART-4 chemical mechanism, in order to investigate whether the characteristic variations and vertical gradients found for the measurement data are also reflected in model simulations.

How to cite: Donner, S., Lauster, B., Ziegler, S., Artaxo, P., Beirle, S., Edtbauer, A., Kuhn, L., Machado, L. A. T., Pozzer, A., Ringsdorf, A., Williams, J., and Wagner, T.: Linking MAX-DOAS measurements of formaldehyde and glyoxal to precursor substances at the canopy-atmosphere-interface at ATTO, EGU General Assembly 2026, Vienna, Austria, 3–8 May 2026, EGU26-11562, https://doi.org/10.5194/egusphere-egu26-11562, 2026.

EGU26-11997 | ECS | Orals | BG3.39

Monitoring forest regrowth using SAR images: The Cusum approach 

Solène Renaudineau, Bertrand Ygorra, Valentine Sollier, Marijn Bauters, Joseph Lokana Mande, Sara Motte, Serge Alebadwa, Wannes Hubau, Viktor Van de Velde, Jean-Pierre Wigneron, Marc Peaucelle, and Frédéric Frappart

Small-scale shifting cultivation is the main cause of disturbance in African tropical forests. As a consequence, being able to monitor and precisely quantify deforestation and secondary forest regrowth remains a challenge compared to large scale deforestation processes observed in South American and South-East Asian forests. Remote sensing data has been widely used to identify spatio-temporal variability in forest regrowth. However current approaches primarily rely on optical imagery, which is known to be subject to multiple limitations (e.g.cloud cover) in tropical area . The Synthetic Aperture Radar (SAR) is a promising way for overcoming these limitations. In this study, we developed an approach based on SAR signal (Sentinel-1 and PALSAR-2) to monitor forest regrowth. Our approach is based on a recent change detection technique relying on the cumulated sum of the signal anomalies (CuSum algorithm) that has been developed for detecting deforestation. Here, we show that this method is also able to monitor, not only forest regrowth, but also various land use dynamics and land use changes. Our approach was tested on a small area, east of Kisangani in the Democratic Republic of the Congo. We quantified the number of changes that could be attributed to increased vegetation, for which we compared plots occupied by different vegetations and transition types: 'Agroforestry', 'Cropland' and ' Forest Regrowth'. We showed that each vegetation type can be defined by very specific signal change. These preliminary results suggest that the CuSum method applied on SAR data is promising for monitoring land-use dynamics at a small spatial scale, and specifically for identifying secondary forest regrowth. 

How to cite: Renaudineau, S., Ygorra, B., Sollier, V., Bauters, M., Lokana Mande, J., Motte, S., Alebadwa, S., Hubau, W., Van de Velde, V., Wigneron, J.-P., Peaucelle, M., and Frappart, F.: Monitoring forest regrowth using SAR images: The Cusum approach, EGU General Assembly 2026, Vienna, Austria, 3–8 May 2026, EGU26-11997, https://doi.org/10.5194/egusphere-egu26-11997, 2026.

EGU26-12372 | ECS | Posters on site | BG3.39

From native forests to planted tree crops: disentangling tree cover transitions driven by deforestation, fire, and plantation development using satellite observations 

Rodrigo San Martín, Catherine Ottlé, Philippe Peylin, Celine Lamarche, and Florent Mouillot

Land-use change in tropical regions has profoundly altered forest structure, disturbance regimes, and recovery pathways over recent decades, with important implications for fire activity and land–atmosphere interactions. Medium-resolution global land cover products are widely used to analyze these dynamics in climate and Earth system studies, yet their capacity to distinguish native forests from planted tree crops across disturbance and recovery phases remains limited. This raises critical questions about how forest loss, recovery, and resilience are inferred from satellite-based observations in human-modified tropical landscapes.

Here, we examine how forest-to-tree-crop transitions are represented in the ESA CCI Land Cover medium-resolution land cover (MRLC) product at 300 m spatial resolution over the period 1992–2022, and how these transitions relate to fire occurrence across Southeast Asia. We combine MRLC land cover maps and land cover transition layers with a high-resolution global dataset of planted tree crops providing spatial extent and year of establishment (Descals et al., 2024), together with fire information from FireCCI v5.1 at 250 m resolution (2001–2022) and fire polygon data from FRY v2.0. This integrated framework allows us to place land-cover changes associated with plantation establishment and maturation in the context of disturbance–recovery processes.

Our analysis focuses on land cover trajectories from native evergreen broadleaf forest to mosaic classes during plantation establishment, followed by reclassification to broadleaf tree cover as plantations mature. We examine the timing and duration of these transitions and their association with fire occurrence during land-use change. Preliminary results show systematic patterns in which oil palm expansion is linked to transient forest loss and elevated fire activity during early plantation stages, followed by reduced fire occurrence as plantations develop before being mapped again as tree cover.

These results demonstrate that confusion between native forests and planted tree crops in medium-resolution land cover products can lead to misleading interpretations of post-disturbance recovery and forest resilience. In particular, apparent forest recovery detected by satellite products may in some cases reflect a land-use replacement rather than true ecosystem recovery with important implications for the interpretation of disturbance–recovery dynamics, as well as for climate modeling and projections in human-modified tropical landscapes. This highlights the need for complementary high-resolution land cover information, such as that developed within the ESA CCI High Resolution Land Cover (HRLC) project, to better disentangle recovery from land-use change.

How to cite: San Martín, R., Ottlé, C., Peylin, P., Lamarche, C., and Mouillot, F.: From native forests to planted tree crops: disentangling tree cover transitions driven by deforestation, fire, and plantation development using satellite observations, EGU General Assembly 2026, Vienna, Austria, 3–8 May 2026, EGU26-12372, https://doi.org/10.5194/egusphere-egu26-12372, 2026.

EGU26-13106 | ECS | Orals | BG3.39 | Highlight

Clarifying tropical secondary forest estimates: results from a growing reference dataset on post-disturbance regrowth 

Hannah Graham, Viola Heinrich, Nandika Tsendbazar, Joao Carreiras, Rene Beuchle, Clement Bourgoin, Silvia Carboni, Savanah Freitas, Jose Lastra Munoz, and Martin Herold

The global forest sink, particularly the tropical forest sink, plays a critical role in the global carbon cycle (Bueno et al., 2020; Pan et al., 2024). Carbon stored in forests is equivalent to almost half the carbon emitted from fossil fuels between 1990 and 2019; however, persistent patterns of deforestation and degradation threaten this carbon sink and its vital role in climate regulation (Pan et al., 2024). Abandoned or left to recover, post-disturbance landscapes can lead to naturally regenerating forests that contribute to significant carbon sequestration, biodiversity benefits, and ecosystem services (Chazdon et al., 2016). Therefore, it is crucial to understand when and where regenerating forests occur to highlight their environmental contributions and promote forest restoration (de Jong et al., 2025). Advancements in RS technologies have enabled a proliferation of RS-based land cover datasets with the potential to estimate secondary forest age and extent (Xu et al., 2024; Baker et al., 2025). However, many have not been explicitly validated for the age or extent of post-disturbance forest regrowth. First comparisons of datasets on secondary forest extent reveal substantial differences at the pixel scale, calling for the need for a reference dataset.

Creating a high-quality reference dataset is essential to ensure the reliability of remote sensing-based maps (Baker et al., 2025) and deliver meaningful results to policymakers (Xu et al., 2024; Tyukavina et al., 2025). Here, we propose a robust methodology and reference dataset to validate different secondary forest estimates and support a broader analysis of tropical forest regrowth dynamics. Using a stratified sampling design based on Potapov et al. (2022) and Zhang et al. (2023)'s land cover products, samples were extracted from areas of agreement and disagreement on forest gain, forest loss, stable forest, and stable non-forest regions. Forest trajectories, drivers of disturbance and regrowth, and years of disturbance and regrowth were interpreted using Landsat, Planet, and Google Earth Pro imagery from 2000-2020. Focusing on tropical biomes outside the Amazon Basin which are often overlooked, weighted area estimates from a preliminary 500-sample reference dataset in South America reveal 87.97Mha (5.12% ± 1.00%) of deforestation, 21.70Mha (1.24% ± 0.25%) of secondary forests, and 82.34Mha (4.72% ± 0.92%) of degraded forests. Although the preliminary sample does not indicate systematic over- or under-estimation of secondary forest age, results reveal high commission errors in the extent of naturally regenerating secondary forests outside the Amazon Basin. Furthermore, high uncertainty in the interpretation of tropical dry forest samples highlights the challenges in identifying secondary forests outside the humid tropics and emphasizes the need for more research outside of the Amazon. 

This dataset has the potential to expand across the pan-tropics to harmonize essential information on regenerating forests and guide urgent action needed to protect the forest carbon sink. Learning from the preliminary study in South America, we emphasize the importance of data quality and draw attention to the uncertainty of large-scale secondary forest products. 

How to cite: Graham, H., Heinrich, V., Tsendbazar, N., Carreiras, J., Beuchle, R., Bourgoin, C., Carboni, S., Freitas, S., Lastra Munoz, J., and Herold, M.: Clarifying tropical secondary forest estimates: results from a growing reference dataset on post-disturbance regrowth, EGU General Assembly 2026, Vienna, Austria, 3–8 May 2026, EGU26-13106, https://doi.org/10.5194/egusphere-egu26-13106, 2026.

EGU26-13150 | Orals | BG3.39

Bridging Scales in Tropical Forest Monitoring with UAV Observatories Integrating Ecosystem Function, Biodiversity, and Satellite Data 

Nicolas Barbier, Pierre Ploton, Patrick Heuret, Julien Engel, Benoît Burban, James Ball, Jean-François Bastin, Bhely Angoboy Ilondea, Germain Mbock, Bonaventure Sonké, Bertrand Endezoumou, Baptiste Leborgne, Elsa Ordway, Jean-Christophe Lombardo, Liezl Vermeulen, Adeline Fayolle, Donald Midoko Iponga, Lucette Adet, Geraldine Derroire, and Ninon Besson and the Canobs team

Tropical forests play a critical role in the global carbon cycle, biodiversity conservation and climate regulation, yet their internal functioning, phenology and fine-scale dynamics remain poorly characterized. While satellite observations have revolutionized large-scale assessments of forest change, their interpretation is still limited by the scarcity of intermediate-scale observations bridging ground-based measurements and orbital sensors. This gap is particularly acute in dense African forests, where diffuse degradation, small canopy openings and climate-driven stress processes are difficult to detect and attribute, and the capacity of space-borne optical observation is limited by clouds and other atmospheric effects.

Here we present the potential of a network of UAV-based forest observatories (Canobs.net), deployed across tropical forest regions, in South America, Central Africa, South East Asia and Oceania. These observatories combine repeated drone acquisitions (RGB, multispectral photogrammetry and LiDAR), permanent forest inventories, targeted ecophysiological measurements and multi-sensor satellite time series. This integrated framework enables spatially continuous and temporally dense monitoring of canopy structure, forest functioning and biodiversity at resolutions inaccessible to satellites alone.

We show that such observatories are essential to: (i) resolve forest phenology and canopy functioning by linking UAV-based monitoring of canopy dynamics with photosynthetic capacity and satellite signals; (ii) quantify the dynamics and mortality of large trees, which dominate carbon stocks and fluxes; (iii) interpret, calibrate and validate satellite-derived biomass products, Essential Biodiversity Variables and functional forest maps. A major recent advance is the application of the Pl@ntNet AI-based species identification app to UAV imagery, allowing identification and monitoring of canopy tree diversity.

The Canobs network forms a critical link between plant- and leaf-scale ecophysiology, field inventories and continental-scale satellite studies, providing a robust framework to better understand and monitor the shifting dynamics of tropical forests under climate and land-use change.

How to cite: Barbier, N., Ploton, P., Heuret, P., Engel, J., Burban, B., Ball, J., Bastin, J.-F., Angoboy Ilondea, B., Mbock, G., Sonké, B., Endezoumou, B., Leborgne, B., Ordway, E., Lombardo, J.-C., Vermeulen, L., Fayolle, A., Midoko Iponga, D., Adet, L., Derroire, G., and Besson, N. and the Canobs team: Bridging Scales in Tropical Forest Monitoring with UAV Observatories Integrating Ecosystem Function, Biodiversity, and Satellite Data, EGU General Assembly 2026, Vienna, Austria, 3–8 May 2026, EGU26-13150, https://doi.org/10.5194/egusphere-egu26-13150, 2026.

EGU26-13904 | Posters on site | BG3.39

Modeling methane biogenic emissions using different wetland and soil carbon pool maps in Amazonia 

Ben-hur Martins Portella, Luciana Varanda Rizzo, Noelia Rojas Benavente, Santiago Botía, Hella van Asperen, Luiz Augusto Toledo Machado, and Angel Vara-Vela

The Amazon rainforest has a large area occupied by rivers and wetlands, responsible for the majority of biogenic methane (CH4) emission in the region. Biogenic emissions of CH4, which is a potent greenhouse gas, are a key source of uncertainty for the global budget. Atmospheric transport models can be useful to assess the spatial distribution of CH4 concentrations and the influence of land use and climate change. It is important to use computational models with updated emission data to obtain more accurate results in atmospheric gas transport simulations. Here we present an analysis performed with the Weather Research and Forecasting model coupled with the Greenhouse Gases module (WRF-GHG), using updated maps of wetland and fast carbon pool to calculate biogenic emissions of CH4 in the Amazon region. Three wetland maps (wetmaps) and two fast carbon pool (CPOOL) maps were used in the simulations. The resulting methane concentrations were compared to in situ observations at the ATTO tower (Amazon Tall Tower Observatory). The simulations were performed from 1st to 13th January 2023 (considering the first seven days as spin up), in a single domain with 6 km resolution and grid of 212 x 121 centered at ATTO. Boundary conditions were provided by ERA5 and CAMS. The simulation using the default emission model along with the minimum inundation wetmap and the updated CPOOL map showed results closer to observational data (bias of 15 ppb) than the other simulations (bias in the range 20-320 ppb). Using the default maps resulted in an overestimation of 4.1% in CH4 concentrations at ATTO. The modeled CH4 concentrations time series showed a pronounced diurnal variability, likely driven by boundary layer dynamics and advection. On the other hand, observations showed rather constant concentrations, suggesting that background regional emissions dominate the CH4 signal at ATTO. Considering a model grid cell over a section of the Amazon River near the ATTO site (150 km southeast), simulated emissions ranged between 42 (minimum inundation and updated CPOOL map) and 623 (maximum inundation and default CPOOL map) mg CH4 m^-2 day^-1, while WetCHARTs emission inventories are in the range 153-276 mg CH4 m^-2 day^-1 and the literature reports averages of 18-21 mg CH4 m^-2 day^-1 for the Amazon River, based on field measurements. Overall, the results show a high sensibility of the WRF-GHG model towards the choice of wetland and CPOOL maps in Amazonia. Also, the correct representation of CH4 background concentrations is key to improve the simulations of near surface concentrations in areas less impacted by local wetland emissions, like ATTO.

How to cite: Martins Portella, B., Varanda Rizzo, L., Rojas Benavente, N., Botía, S., van Asperen, H., Augusto Toledo Machado, L., and Vara-Vela, A.: Modeling methane biogenic emissions using different wetland and soil carbon pool maps in Amazonia, EGU General Assembly 2026, Vienna, Austria, 3–8 May 2026, EGU26-13904, https://doi.org/10.5194/egusphere-egu26-13904, 2026.

EGU26-14859 | Orals | BG3.39

Combining experiments, observations and modelling to assess the role of soil cation depletion on secondary forest regrowth in the Congo basin 

Dries Landuyt, Joseph Lokana Mande, Merveille Bondongwe Wombe, Serge Alebadwa Mombenga, Pascal Boeckx, and Marijn Bauters

Intensification of shifting cultivation practices across the Congo basin are causing a rise in secondary forest area across the African tropical belt. Nutrient exports during burning (e.g. ash pulses) and cultivation of the land (e.g. biomass export and nutrient leaching) are potentially limiting the regrowth potential of the secondary forests that reestablish after land abandonment, potentially putting a break on the C accumulation rates of these forests. Among the nutrients that are being exported from the land, cations (Ca, Mg, K) are expected to be particularly vulnerable, especially on the old, highly weathered soils that are characteristic for the majority of lowland tropical forests in the Congo basin. Past studies on forest chronosequence data have already shown that (1) the availability of cations in the soil declines over time, and (2) cations accumulate in woody biomass over time and might get lost from the system permanently when timber or fire wood is being extracted from the system.

In our study, we aim to integrate data from a large fertilization experiment and observations along a chronosequence of secondary forest stands to assess the role of cation depletion on forest regrowth in the Congo basin. Here, we aim to present our (1) preliminary data and first findings and (2) our approach to integrate these findings into a biogeochemical forest growth model PnET-BGC. Via model-based scenario analyses, we present potential impacts of cation limitation on forest regrowth in the Congo basin and discuss how management can conserve nutrients and sustain carbon uptake in regenerating tropical forests.

How to cite: Landuyt, D., Lokana Mande, J., Bondongwe Wombe, M., Alebadwa Mombenga, S., Boeckx, P., and Bauters, M.: Combining experiments, observations and modelling to assess the role of soil cation depletion on secondary forest regrowth in the Congo basin, EGU General Assembly 2026, Vienna, Austria, 3–8 May 2026, EGU26-14859, https://doi.org/10.5194/egusphere-egu26-14859, 2026.

EGU26-14967 | Posters on site | BG3.39

Forest regrowth in the Democratic Republic of the Congo: A field data/vegetation model comparison 

Félicien Meunier, Viktor Van de Velde, Steven De Hertog, Pascal Boeckx, Marijn Bauters, Wim Verbruggen, Marc Peaucelle, and Hans Verbeeck

Tropical forests of Central Africa play a fundamental role in the global carbon cycle, the regional moisture recycling, and also act as biodiversity hotspots. Yet, afrotropical forests experience important anthropogenic pressure, including slash-and-burn agriculture that is particularly widespread in the region. Despite their significance, the post-disturbance recovery dynamics of these forests remain poorly understood, particularly compared to the other tropical regions. With increasing anthropogenic pressures and projected shifts in rainfall regimes in the future, an improved understanding of forest regrowth processes is critical to anticipate the future of the Congo Basin carbon sink and simulate the land carbon sink of secondary forests/

This study presents a comprehensive model intercomparison of forest regrowth trajectories in the Democratic Republic of the Congo, combining ground inventory data with outputs from multiple Dynamic Global Vegetation Models (DGVMs). We compiled a harmonized dataset of field sites, representing dozens of site/age combination, along wide climatic gradients in the country. Multiple DGVMs were benchmarked against empirical regrowth curves derived from plot networks, with additional models currently under evaluation to extend the model ensemble. Each model was forced by consistent climate and land-use datasets but exhibited heterogeneous process representations and carbon allocation schemes.

Results reveal a systematic overestimation of above-ground biomass accumulation across models, particularly during the first decades of succession. Modelled forests typically regained 80–100% of their pre-disturbance biomass within 50 years, whereas inventory data indicate substantially slower recovery rates, often below 60%. Sensitivity analyses showed that the divergence between simulated and observed regrowth trajectories could be linked to differences in parameterization of turnover rates and demography. Furthermore, the influence of climatic drivers varied markedly across models: while some exhibited strong sensitivity to precipitation seasonality, others were dominated by temperature and radiation effects. Such discrepancies highlight structural uncertainties in how models capture key processes controlling regrowth, including recruitment limitation, and resource constraints.

Our findings underscore the need for process-based improvements based on existing field data. By confronting models with empirical data from the Congo Basin, this intercomparison provides an essential step toward reducing uncertainties in projections of African forest resilience under climate and land-use change. 

How to cite: Meunier, F., Van de Velde, V., De Hertog, S., Boeckx, P., Bauters, M., Verbruggen, W., Peaucelle, M., and Verbeeck, H.: Forest regrowth in the Democratic Republic of the Congo: A field data/vegetation model comparison, EGU General Assembly 2026, Vienna, Austria, 3–8 May 2026, EGU26-14967, https://doi.org/10.5194/egusphere-egu26-14967, 2026.

EGU26-17350 | ECS | Posters on site | BG3.39

Long-term NEE at ATTO (2014–2024): drought legacy effects and seasonal controls on Amazon carbon uptake 

Carla Souza, Cléo Dias-Júnior, Shujiro Komiya, Hella van Asperen, Sönke Zaehle, Raoni Santana, Luan Cordeiro, Luciana Rizzo, Ivan Mauricio Cely, Alessandro de Araújo, Carlos Quesada, Anke Hildebrandt, and Santiago Botía

The Amazon rainforest stores ~150–200 Pg of carbon and plays a central role in the global carbon cycle, yet it is highly vulnerable to land-use change, fire, and climate change, leaving its future carbon balance uncertain. Net Ecosystem Exchange (NEE) quantifies the balance between ecosystem carbon uptake and release, but long-term NEE assessments in Central Amazonia remain scarce due to limited observational coverage from eddy covariance towers and CO₂ profile measurements. The Amazon Tall Tower Observatory (ATTO; https://www.attoproject.org) helps overcome this limitation by providing more than a decade of continuous measurements and by capturing two extreme drought events (2015/2016 and 2023/2024). In this work, we analyzed 11 years of NEE estimates at ATTO (2014-2024) and we propose a methodology for selecting the friction velocity threshold (u*), based on the identification of a plateau in the NEE-u* relationship, where NEE becomes independent of increasing turbulence, and all periods with u below the threshold are filtered due to insufficient turbulence*. We estimate monthly u* thresholds ranging from 0.18 to 0.21 m s⁻¹. We found that, on average, the forest in the ATTO flux footprint generally acted as a net carbon sink. However, in years following severe droughts, such as 2016 and 2024, we detect a temporary reversal, with the ecosystem becoming a CO₂ source during the wet season. We also quantified the effect of environmental drivers modulating NEE across seasons. We find that higher air temperature reduces carbon uptake during the wet season. In contrast, soil moisture shows opposite relationships depending on season: during the dry season, increasing soil moisture (10 cm depth) reduces net carbon uptake, whereas during the wet season, increasing it enhances net carbon uptake. Our findings deliver critical observational evidence to refine model parameterizations of tropical carbon-water interactions and to reduce uncertainty in predictions of the Amazon carbon balance under future climate scenarios.

How to cite: Souza, C., Dias-Júnior, C., Komiya, S., van Asperen, H., Zaehle, S., Santana, R., Cordeiro, L., Rizzo, L., Cely, I. M., de Araújo, A., Quesada, C., Hildebrandt, A., and Botía, S.: Long-term NEE at ATTO (2014–2024): drought legacy effects and seasonal controls on Amazon carbon uptake, EGU General Assembly 2026, Vienna, Austria, 3–8 May 2026, EGU26-17350, https://doi.org/10.5194/egusphere-egu26-17350, 2026.

EGU26-17643 | ECS | Orals | BG3.39

Modeling Carbon and Functional Diversity Recovery in Central African Secondary Forests Using Canopy Structure 

Thibauld Collet, Trésor Mbavumoja, Arthur Vanderlinden, and Jean-François Bastin

Central african forests are subject to increasing anthropic disturbance, with slash and burn agriculture and wood extraction as the leading causes of disturbance. The extent of resulting fallows and secondary forests are currently poorly investigated in the region while they are crucial to map and to monitor to better understand forest state, functioning and potential recovery of the second largest tropical forest of the world.
In this study, we explore the hypothesis that recovery rate of carbon and functional diversity can be modelized by change in canopy structure. To estimate the carbon recovery rate in secondary forest, 15 permanent forest inventories of 1ha each are conducted in the Mabali research centre of the Equateur province in DRC. We use space for time substitution method to create a chronosequence covering forests of different ages and/or different types of past disturbance. UAV’s LIDAR data acquired during the field campaign over the plots and the surrounding forest are processed to extract meaningful canopy features. By exploring the relationship between forest structure and forest recovery rate, we aim to deepen the understanding of the complexity of secondary forests and provide datasets for the calibration of Land Surface Modeling and satellite-based biomass estimation.

How to cite: Collet, T., Mbavumoja, T., Vanderlinden, A., and Bastin, J.-F.: Modeling Carbon and Functional Diversity Recovery in Central African Secondary Forests Using Canopy Structure, EGU General Assembly 2026, Vienna, Austria, 3–8 May 2026, EGU26-17643, https://doi.org/10.5194/egusphere-egu26-17643, 2026.

EGU26-17743 | ECS | Orals | BG3.39

Advancing trait mapping of Congo basin secondary forests using multispectral and hyperspectral satellite imagery 

Sacha Delecluse, Marijn Bauters, and Pierre Defourny

The forests of Central Africa remain understudied compared to those of the Amazon and Southeast Asia. The unique dominance of smallholders shifting cultivation as the driver of disturbance in the region also increases uncertainty about the future of the forest. This activity is poorly monitored and is associated with cycles of forest regeneration and deforestation, creating a complex mosaic of primary and secondary forests and agricultural fields. As slash-and-burn practices are expected to intensify with population growth in the region, understanding forest regeneration and the dynamics of secondary forests is essential, particularly for accurate carbon accounting.

Extensive studies on secondary forest morphological and physiological traits have been conducted using field inventory from logging concession and study plots throughout the basin. While detailed, these studies are limited spatially due to the constraint of field inventory. On the other hand, studies using satellite remote sensing are spatially extensive but lack the detailed view given by field measurements or are limited by an insufficient spatial resolution for the mosaic landscape of secondary forest.

In this study we evaluate the potential of high-resolution multispectral (Sentinel-2) and hyperspectral (EnMAP) for quantifying key morphological and physiological traits of secondary forests along successional stages in the Congo Basin. Using fields measurement in secondary forests plot and advanced Sentinel-2 processing algorithm, we explore the capability of satellite-based spectral data to capture and predict forest characteristics typically assessed through ground-based inventories. By correlating the spectral signatures from EnMAP with specific vegetation properties such as leaf area index and foliar biochemical properties we identify spectral indicators of structural and physiological development. The spectral analysis focuses on identifying the drivers of the shifts in reflectance patterns as the forest matures, linking spectral characteristics to ecological changes along the successional trajectory.

Preliminary results reveal a notable decrease in forest reflectance with age across the entire spectrum, indicating a darkening trend in the canopy as secondary forests mature. Forests aged 50-80 years show spectral signatures similar to those of primary forests, despite still exhibiting differences in structural traits and above-ground biomass. The retrieval of leaf properties like SLA and LNC is made possible with robust Sentinel-2 image processing.

This study highlights the potential of combining high-resolution multispectral and hyperspectral data to provide spatially extensive and detailed information on the structural and functional dynamics of secondary forests. Improving the ability to monitor secondary forest characteristics and their recovery trajectories in regions where shifting cultivation is prevalent.

How to cite: Delecluse, S., Bauters, M., and Defourny, P.: Advancing trait mapping of Congo basin secondary forests using multispectral and hyperspectral satellite imagery, EGU General Assembly 2026, Vienna, Austria, 3–8 May 2026, EGU26-17743, https://doi.org/10.5194/egusphere-egu26-17743, 2026.

EGU26-18838 | ECS | Posters on site | BG3.39

Microbial activity of a secondary forest succession after shifting agriculture in the Afrotropics 

Christian Ranits, Lucia Fuchslueger, Viktor Van de Velde, Hannes Schmidt, Hana Prosser, Isaac Makelele, Corneille Ewango, Marijn Bauters, Pascal Boeckx, and Andreas Richter

Tropical secondary forests, i.e. regrowing forests after clearcutting through human activities, cover a larger area than primary tropical forests. This increasingly dynamic tropical landscape warrants a comprehensive understanding of carbon (C) sequestration and nutrient cycling in secondary tropical forest succession, particularly on the soil microbiome governing these processes. Yet, our current knowledge of soil microbial dynamics in secondary successions of tropical forests and their role in C turnover and sequestration is limited, particularly in deeper soil layers which are seldomly explored.

Here, we investigated microbial activity and growth along a soil depth gradient in an established space-for-time-substitution experiment in the Yoko forest reserve, Democratic Republic of the Congo. We sampled soils from four differently aged secondary forests (3 years, 8 years, 15 years and 63 years), and a primary forest acting as a control at six depths (10 cm, 30 cm, 50 cm, 100 cm, 175 cm, 250 cm). We assessed microbial growth through the incorporation of deuterium-labelled water into phospholipid fatty acids (2H-SIP), allowing us to distinguish growth and biomass of distinct microbial groups.

Microbial growth was highest in early successions, 3 to 15 years after the last biomass removal, whereas microbial respiration steadily increased with succession resulting in a decrease in soil microbial carbon use efficiency with forest successional age. Primary forests showed significantly lower microbial growth rates than early and middle-aged successions. This trend, while also present in shallow soil depths, was most evident at the depth of 100 cm.

Our results suggest an increase of labile C availability for soil microorganisms in early and middle-aged successions, most likely through higher quality and/or quantity of C inputs of regrowing plant biomass compared to the climax plant community. We further show that the response of microbial activity during secondary succession was seen beyond soil depths that are commonly considered, highlighting the importance of sampling deeper soil layers when assessing responses to land use changes. Contrary to our expectations, microbial growth decreased with successional age, and primary forests fostered lower microbial activity compared to secondary forests. Our results therefore demonstrate a complex response of soil microorganisms to secondary succession in Afrotropical forests that is decoupled from aboveground plant biomass.

How to cite: Ranits, C., Fuchslueger, L., Van de Velde, V., Schmidt, H., Prosser, H., Makelele, I., Ewango, C., Bauters, M., Boeckx, P., and Richter, A.: Microbial activity of a secondary forest succession after shifting agriculture in the Afrotropics, EGU General Assembly 2026, Vienna, Austria, 3–8 May 2026, EGU26-18838, https://doi.org/10.5194/egusphere-egu26-18838, 2026.

EGU26-19253 | ECS | Posters on site | BG3.39

Process-Based Evaluation of Tropical Forest Responses to Drought at the Amazon Tall Tower Observatory 

Gerrit Eisele, Phillip Papastefanou, Hella van Asperen, Santiago Botía, Cléo Dias-Júnior, Flávia Durgante, Viviana Horna, Anja Rammig, Manon Sabot, Carla Alves de Souza, and Sönke Zaehle

Tropical forests play a central role in regulating the Earth's climate and the global carbon cycle, yet their accurate representation in terrestrial biosphere models (TBMs) remains a challenge: High species diversity, strong climatic variability, and lack of long term observations lead to high parameter uncertainty and hinder model calibration. Consequently, many questions regarding the long-term carbon storage capacity of tropical forests and especially the Amazon, as well as their vulnerability to extreme events, particularly droughts, remain open. 

In this study, we apply the TBM QUINCY (Thum et al., 2019), with a new implementation of plant hydraulics, to simulate seasonal and interannual vegetation dynamics at the Amazon Tall Tower Observatory (ATTO, http://attoproject.org), central Amazon, Brazil. The model is evaluated using eddy covariance data (NEE, GPP, ET) from 2014 to 2023 and complementary observational data including time series of soil water content, sap flow, and dendrometer measurements. This evaluation allows us to assess the representation of soil and plant water dynamics and to identify model limitations.

Specifically, our objective is to identify systematic mismatches between modeled processes and observations, in order to support targeted model development and parameterization. By linking uncertainties in carbon and water fluxes to specific model components and processes, we aim to establish a structured pathway toward improving TBM performance at ATTO, and to better understand the ecosystems sensitivity to drought under future climate change.

How to cite: Eisele, G., Papastefanou, P., van Asperen, H., Botía, S., Dias-Júnior, C., Durgante, F., Horna, V., Rammig, A., Sabot, M., Alves de Souza, C., and Zaehle, S.: Process-Based Evaluation of Tropical Forest Responses to Drought at the Amazon Tall Tower Observatory, EGU General Assembly 2026, Vienna, Austria, 3–8 May 2026, EGU26-19253, https://doi.org/10.5194/egusphere-egu26-19253, 2026.

EGU26-19399 | ECS | Posters on site | BG3.39

Mapping of the forest extent in the Congo Basin at 10m-resolution with Sentinel-2 

Sacha Delecluse, Thomas De Maet, and Pierre Defourny

The tropical forests of Central Africa, storing approximately 10% of the world’s terrestrial carbon play a vital role in the global carbon cycle. These forests also constitute a hotspot of biodiversity and a source of livelihood and ecosystem services for local communities. The need to monitor forest loss and gain in the region has led to the development of a variety of forest maps through the use of orbital sensors in recent years.

In this study, we map the extent of the tropical moist forest of Central Africa at 10m resolution using an advanced Sentienel-2 processing technique. Initial calibration is performed with existing dataset (GFW, TMF) before refining with VHR data. Sentinel-2 data are processed into spatially coherent cloud-free annual composites. Classification into a forest/non forest map is then performed with XGBoost and the addition of ancillary variables, yielding yearly maps of the forest’s extent. This allows forest extent to be monitored with unprecedented resolution, which is crucial for the Congo Basin complex landscape, dominated by small-scale agriculture.

How to cite: Delecluse, S., De Maet, T., and Defourny, P.: Mapping of the forest extent in the Congo Basin at 10m-resolution with Sentinel-2, EGU General Assembly 2026, Vienna, Austria, 3–8 May 2026, EGU26-19399, https://doi.org/10.5194/egusphere-egu26-19399, 2026.

EGU26-20082 | Orals | BG3.39

Fire-driven dynamics in Amazonia: Contrasting ancient legacies and modern degradation in soils and vegetation 

Ted Feldpausch, Plinio Barbosa de Camargo, Lidiany Carvalho, Wanderlei Bieluczyk, João Pompeu, Mario Naval, Facundo Alvarez, Oliver Phillips, Michael Bird, Luiz Aragão, Maracahipes-Santos Leonardo, Karina Silva, Carlos Quesada, Beatriz Schwantes Marimon, Paulo Brando, Kita Macario, and Ben Hur Marimon Junior

Fire regimes and human impacts on Amazonian forests have varied over decades to centuries, resulting in disturbances and recoveries that leave lasting legacies on vegetation and soil. While intact (old-growth) forests were once thought to be largely fire-free, our work has shown these forests to have a history of infrequent but recurrent fire. Wildfires have left their signatures in the soil in the form of black carbon (pyrogenic carbon or PyC), the product of incomplete combustion of organic matter. Vegetation has also likely responded to past fire; however, the mechanistic effects of these past disturbances remain poorly understood. Here, we examine Amazon disturbance and recovery processes over space and time (ancient to modern) in relation to fire.


We utilise permanent forest plot data (soil PyC, physicochemical properties, vegetation) from two large-scale projects across the Amazon Basin, combined with remote sensing data. The analysis shows that soil texture and hydrology primarily explain the spatial variation of soil PyC at 30 cm depth, while historical climate played a relatively minor role. Furthermore, soil PyC from ancient wildfires is associated with increased soil fertility in intact forests. We also found that distinct groups of tree species in Amazonia are associated with ancient soil PyC. In contrast, modern fires increase soil PyC but result in a reduction in total SOC, degrade soil health, and reduce species richness.


These findings indicate that infrequent ancient wildfires recurring at intervals spanning several hundred years had positive impacts on soil fertility and left legacy effects on modern forest composition. Conversely, modern fires, which are extensive and have short return intervals, negatively impact Amazon soils and vegetation on decadal scales. To better assess the long-term impacts of fire on soil carbon, we are incorporating soil PyC into Land Surface Models.

How to cite: Feldpausch, T., Barbosa de Camargo, P., Carvalho, L., Bieluczyk, W., Pompeu, J., Naval, M., Alvarez, F., Phillips, O., Bird, M., Aragão, L., Leonardo, M.-S., Silva, K., Quesada, C., Schwantes Marimon, B., Brando, P., Macario, K., and Marimon Junior, B. H.: Fire-driven dynamics in Amazonia: Contrasting ancient legacies and modern degradation in soils and vegetation, EGU General Assembly 2026, Vienna, Austria, 3–8 May 2026, EGU26-20082, https://doi.org/10.5194/egusphere-egu26-20082, 2026.

Village relocations from protected areas provide natural experiments for understanding forest recovery dynamics. We investigated vegetation recovery across 14 villages relocated from Panna Tiger Reserve, India, spanning 8-30 years post-relocation, to test whether recovery follows classical successional trajectories or diverges into alternative stable states. Using 198 plots, we surveyed trees, seedlings, saplings, shrubs, herbs, grasses, and invasive species, and compared communities with adjacent buffer forest. Contrary to succession theory predictions, time since relocation had no significant effect on woody vegetation recovery (p = 0.607). Instead, landscape position determined recovery trajectory: all riverine villages (n = 7) achieved forest state while all interior villages (n = 7) remained grassland, regardless of time elapsed. Riverine sites supported 4.7 times higher seedling abundance and 2.5 times higher sapling abundance than interior sites. Beta diversity partitioning revealed turnover-dominated differentiation (>92%) rather than nestedness, indicating species replacement between states rather than progressive accumulation. NMDS ordination showed discrete forest-grassland clusters, and indicator species analysis identified state-specific assemblages: fire-adapted Themeda-Heteropogon grasses dominated grassland while shade-tolerant Dichanthium-Oplismenus characterized forest state. Critically, seedling-to-tree ratios were identical between states (10.1 vs 10.3), demonstrating that recruitment limitation occurs post-germination rather than at seed dispersal. Invasive species declined autonomously (10.4%/year, p = 0.008), suggesting competitive exclusion by native grasses. These findings demonstrate that grass-fire feedbacks maintain alternative stable states, with landscape position determining initial trajectory. Passive restoration is insufficient for interior sites; active intervention breaking grass-fire feedbacks is required. Village relocation alone does not guarantee forest recovery as outcome depends fundamentally on landscape context.

How to cite: Singh, A., Krishnamurthy, R., and Page, N.: Vegetation recovery following disturbance removal revealed forest-grassland alternative stable states in a tropical dry forest of central India, EGU General Assembly 2026, Vienna, Austria, 3–8 May 2026, EGU26-20788, https://doi.org/10.5194/egusphere-egu26-20788, 2026.

EGU26-20803 | ECS | Orals | BG3.39

Decoupled recovery of soil and vegetation carbon reveals mineral-driven stabilisation in reforested tropical montane ecosystems 

Matthew Cooper, Marijn Bauters, Kars Riemer, Wouter van Goor, Kadiri Mugenyi, Laura Summerauer, Jeremy Cook, Richard Kigenyi, and Sebastian Doetterl

Reforestation is increasingly promoted as a nature based climate solution, yet the degree to which soil carbon recovers alongside vegetation remains uncertain, particularly in deeply weathered tropical soils. While rapid gains in above ground biomass are often interpreted as indicators of ecosystem recovery, it is unclear whether such gains translate into meaningful changes in below ground carbon pools.

We investigated soil and vegetation carbon dynamics across a thirty year gradient of forest disturbance and recovery in tropical montane forests of Kibale National Park, Uganda, spanning primary forest, passive natural regeneration, and actively replanted stands. The study integrates depth resolved soil organic carbon stocks to one metre, stable carbon isotope profiles, soil physical and geochemical properties, and long term forest inventory data from permanent monitoring plots. By combining carbon stocks, isotopic indicators, and soil mineral properties, we assess how strongly soil carbon is coupled to forest recovery and at what depths soils respond to changes in vegetation. The analysis reveals clear contrasts between above ground and below ground carbon trajectories and highlights the role of soil depth and legacy effects in shaping carbon storage in recovering tropical forests.

Our results provide new insight into the limits of using biomass recovery as a proxy for soil carbon sequestration and underline the importance of depth resolved and process oriented approaches when evaluating reforestation outcomes.

How to cite: Cooper, M., Bauters, M., Riemer, K., van Goor, W., Mugenyi, K., Summerauer, L., Cook, J., Kigenyi, R., and Doetterl, S.: Decoupled recovery of soil and vegetation carbon reveals mineral-driven stabilisation in reforested tropical montane ecosystems, EGU General Assembly 2026, Vienna, Austria, 3–8 May 2026, EGU26-20803, https://doi.org/10.5194/egusphere-egu26-20803, 2026.

EGU26-21337 | ECS | Orals | BG3.39

Tracking Aboveground Biomass Dynamics in Africa: Evidence for a Changing Role in Carbon Cycling 

Nezha Acil, Pedro Rodriguez-Veiga, Casey M. Ryan, Penelope J. Mograbi, Steven Hancock, Shaun Quegan, Mathias Disney, Lorena Benitez, Duncan Chalo, Kyle G. Dexter, Gregor Feig, John Godlee, Tatenda Gotore, Collins Masinde, Iain McNicol, Jonathan Muledi, Tshililo Ramaswiela, Helga Van der Merwe, Buster Mogonong, and Heiko Balzter and the SEOSAW Partners / data providers

With their dense tropical forests and vast woody savannas, African ecosystems play a crucial role in global carbon regulation. However, recent findings show their role is shifting from carbon sink to source. Assessing changes in aboveground biomass (AGB) requires consistent time series to reflect temporal continuity and epoch comparability. Here, we leverage machine learning and satellite time series data to 1) produce temporally consistent annual maps of AGB in Africa for the period 2015-2021 and 2) provide a spatially and temporally detailed assessment AGB changes and their drivers at a resolution relevant for land management (100 m). Our retrieval algorithm estimates AGB using a combination of metrics that reflects canopy structure and cover fraction from spaceborne Synthetic Aperture Radar (SAR), Light Detection and Ranging (LiDAR) and optical data, as well as additional covariates influencing tree size and biomass (woody plant functional traits and prevailing moisture and topographic conditions). Trend analysis and breakpoint change detection from LandTrendR are used to evaluate overall AGB changes and to differentiate periods of gradual (e.g. natural growth, degradation) versus abrupt changes (e.g. disturbances, deforestation, replanting). Drivers of the changes are further inferred from temporally aligned land cover dynamics, alongside other ancillary data reflecting vegetation alterations (e.g. fire occurrence, management). AGB changes, quantified in terms of direction, magnitude, rate, and duration are finally summarized across multiple stratification levels (i.e. by driver, biome, country, etc.) to estimate carbon gains and losses. The results provide observation-based carbon stock trajectories over time, which are useful and timely to inform policy decisions on forest restoration and climate mitigation and support Measurement, Reporting and Verification (MRV) frameworks for REDD+, the new Tropical Forests Forever Facility (TFFF) and other policy instruments.

How to cite: Acil, N., Rodriguez-Veiga, P., M. Ryan, C., J. Mograbi, P., Hancock, S., Quegan, S., Disney, M., Benitez, L., Chalo, D., G. Dexter, K., Feig, G., Godlee, J., Gotore, T., Masinde, C., McNicol, I., Muledi, J., Ramaswiela, T., Van der Merwe, H., Mogonong, B., and Balzter, H. and the SEOSAW Partners / data providers: Tracking Aboveground Biomass Dynamics in Africa: Evidence for a Changing Role in Carbon Cycling, EGU General Assembly 2026, Vienna, Austria, 3–8 May 2026, EGU26-21337, https://doi.org/10.5194/egusphere-egu26-21337, 2026.

EGU26-22013 | ECS | Orals | BG3.39

Woody species diversity and regeneration dynamics along environmental and disturbance gradients in a community-managed Afromontane forest, southwest Ethiopia 

Thierno Bachir Sy, Byongjun Hwang, Matthew Snell, Mohammed S Ozigis, Adrian Wood, and Motuma Tolera

Tropical montane forests are globally important for biodiversity conservation, carbon storage, and regulation of hydrological and biogeochemical cycles, yet they are increasingly shaped by interacting environmental gradients and human-induced disturbances. In the Eastern Afromontane biodiversity hotspot in southwest Ethiopia, community-managed forests represent a growing governance model intended to reconcile conservation and livelihoods. To date empirical evidence on how disturbance and recovery processes operate within these systems remains limited. In this paper, we examine woody species diversity, forest structure, and regeneration dynamics in the Andaracha Participatory Forest Management (PFM) forest of, with a specific focus on how environmental heterogeneity and disturbance intensity structure forests ecology.

We conducted a field-based ecological assessment using 44 systematically distributed nested plots across 11 forest management units (Gots). Floristic inventories recorded species identity and diameter at breast height (DBH) for all woody species, alongside plot-level regeneration data based on seedling counts. Environmental variables (altitude, slope, canopy cover) and a composite disturbance index integrating logging, grazing, fuelwood extraction, and access trails were recorded. In addition, institutional context was characterised using a PFM engagement score derived from participatory monitoring of annual plan and bylaw enforcement, meeting frequency, forest patrolling, and reporting mechanisms. Multivariate analyses, including hierarchical clustering, principal component analysis (PCA), non-metric multidimensional scaling (NMDS), and PERMANOVA, were used to assess relationships between species composition, regeneration patterns, and environmental-disturbance gradients.

Across the study area, a total of 60 woody species belonging to 38 genera and 28 families were recorded, with Rubiaceae and Euphorbiaceae among the most species-rich families. Forest structure was heterogeneous, with reverse-J DBH distributions at the landscape scale indicating ongoing recruitment, but substantial plot-level variation in size-class structure. Species composition clustered into five distinct community types aligned primarily along altitudinal, slope, and canopy gradients. Regeneration dynamics were highly uneven: more than two-thirds of all seedlings were concentrated in fewer than 10% of the plots, revealing strong spatial patchiness in recovery processes.

Ordination analyses highlighted disturbance intensity and canopy cover as key axes structuring both adult community composition and regeneration assemblages. Moderate disturbance levels were associated with higher species diversity and more balanced regeneration, whereas heavily disturbed and open-canopy plots showed reduced recruitment and greater dominance by disturbance-tolerant taxa. Conversely, steep, high-altitude plots with low disturbance exhibited environmentally filtered regeneration characterised by low diversity but stable species composition. These patterns indicate that woody species composition and regeneration in the Andaracha community-managed forest are shaped not by disturbance alone, but by its interaction with topographic constraints and canopy structure.

Our findings demonstrate that community-managed Afromontane forests can sustain high woody biodiversity and active regeneration, but that recovery is highly spatially uneven and sensitive to ecological thresholds of disturbance. These findings underscore the importance of site-specific, ecologically informed management strategies to enhance regeneration resilience in tropical montane forests undergoing rapid socio-ecological change.

How to cite: Sy, T. B., Hwang, B., Snell, M., Ozigis, M. S., Wood, A., and Tolera, M.: Woody species diversity and regeneration dynamics along environmental and disturbance gradients in a community-managed Afromontane forest, southwest Ethiopia, EGU General Assembly 2026, Vienna, Austria, 3–8 May 2026, EGU26-22013, https://doi.org/10.5194/egusphere-egu26-22013, 2026.

EGU26-859 | ECS | Orals | BG3.41

Idiosyncratic Photosynthetic Traits in a Montane Subcanopy Tree Species Under Low-Light Microclimates Reveal Microclimatic Acclimation Trade-Offs 

Ambuj Mishra, Rajman Gupta, Rajendra Kumar Joshi, and Satish Chandra Garkoti

Montane forests exhibit complex, heterogeneous microclimatic regimes that challenge the physiological plasticity of canopy and subcanopy species. In a Himalayan subalpine forest, we investigated how topographically mediated light environments shape the expression of photosynthetic traits in co-dominant trees — Quercus semecarpifolia (canopy) and Rhododendron arboreum (subcanopy)—across north- and south-facing slopes. Using leaf-level gas exchange measurements, we identified consistent patterns of light acclimation in Q. semecarpifolia and high-light-adapted R. arboreum. However, shade-acclimated R. arboreum individuals on north-facing slopes displayed idiosyncratic physiological signatures, including positive dark respiration rates (Rd) and negative light compensation points (LCP) — magnitudes theoretically implausible under standard C3 photosynthetic models.

These anomalies suggest either (i) physiological re-fixation of respired CO2 under low light, (ii) non-linear error propagation in light response curve (LRC) fitting at extremely low PPFD, or (iii) extreme photoprotective plasticity unique to shade-adapted subcanopy species. Unlike Q. semecarpifolia and light-acclimated R. arboreum on south-facing slopes, these north-facing subcanopy individuals maintained high NPQ under minimal photon flux, indicative of disproportionate energy dissipation mechanisms.

Our findings highlight how fine-scale microclimatic heterogeneity, especially in shaded montane niches, can generate unexpected and complex trait responses that deviate from established photosynthetic theory. These results necessitate refined methodological protocols and physiological models to interpret trait dynamics in low-light, high-humidity microclimates, particularly in the context of rising canopy temperatures and climate extremes. The study offers critical insights into species-specific limitations and compensations under montane microclimatic stress, with implications for predicting forest carbon cycling and resilience under future climate scenarios. 


How to cite: Mishra, A., Gupta, R., Joshi, R. K., and Garkoti, S. C.: Idiosyncratic Photosynthetic Traits in a Montane Subcanopy Tree Species Under Low-Light Microclimates Reveal Microclimatic Acclimation Trade-Offs, EGU General Assembly 2026, Vienna, Austria, 3–8 May 2026, EGU26-859, https://doi.org/10.5194/egusphere-egu26-859, 2026.

EGU26-2140 | Orals | BG3.41

Aerodynamic control of stomatal optimality: Exploring thermal cooling returns under varying leaf-to-air coupling 

Dolores Asensio, Ayesha Yousaf, Massimo Tagliavini, and Georg Wohlfahrt

Recent advances in stomatal optimization theory propose that under extreme heat, plants may prioritize thermal regulation over instantaneous carbon gain, leading to a decoupling of stomatal conductance (gs) from photosynthesis (A). In this framework, transpiration (E) is maintained to facilitate evaporative cooling even as A declines. However, the thermal benefit of transpiration is physically constrained by the leaf boundary layer and its sensitivity to wind speed, a factor often overlooked in standard leaf gas exchange measurements.

We explore how leaf cooling capacity is modulated by the boundary layer conductance in irrigated grapevines exposed to a temperature gradient (20°C to 40°C). Using a commercial portable gas exchange system with adjustable fan speeds, we investigate a range of aerodynamic coupling conditions. Parallel measurements with filter-paper replicas were used to independently quantify the boundary-layer conductance, and to establish a reference temperature (Tref) across fan speeds. These measurements allow us to estimate the thermal return on investment (ROI) of transpiration, defined as the reduction in leaf temperature per unit water loss (Tref-Tleaf)/E, and examine its relationship with boundary layer conductance.

By applying a unified stomatal model, we assess whether the model parameter g1, proportional to the marginal water cost of carbon gain (λ), remains constant across treatments. Finally, we propose the hypothesis that the efficacy of evaporative cooling is aerodynamically regulated, such that the thermal ROI is maximized under low-wind conditions where thick boundary layers enhance the relative contribution of latent heat. Conversely, we aim to demonstrate how high-wind conditions, typical of standard gas-exchange cuvettes, may decrease the thermal ROI by allowing convective heat exchange to dominate. We discuss how these mechanisms might mask the adaptive significance of "wasteful" water-use strategies in decoupled canopy environments.

How to cite: Asensio, D., Yousaf, A., Tagliavini, M., and Wohlfahrt, G.: Aerodynamic control of stomatal optimality: Exploring thermal cooling returns under varying leaf-to-air coupling, EGU General Assembly 2026, Vienna, Austria, 3–8 May 2026, EGU26-2140, https://doi.org/10.5194/egusphere-egu26-2140, 2026.

EGU26-2569 | ECS | Orals | BG3.41

Plant hydraulics explain distinct stomatal responses to hot versus dry vapor pressure deficit 

Aaron Potkay, Brandon Sloan, Aviad Perry, Or Sperling, Uri Hochberg, Rong Li, Xiangtao Xu, Mazen Nakad, Richard Peters, and Xue Feng

Vapor pressure deficit (VPD) is rising exponentially as the globe warms, while relative humidity (RH) is comparatively stable. Stomatal responses to VPD are typically studied by manipulating RH, not air temperature, creating uncertainties for future plant productivity. We tested how air temperature and RH impact the stomatal slope parameter (g1), a proxy for water-use efficiency, and whether three stomatal conductance models capture the observed effects of temperature and RH on g1, which were often positive. Only the hydraulics-based Generalized Stomatal Optimization (GSO) model correctly predicted the observed positive RH-g1 trend. Although all models predicted the observed positive temperature-g1 trends, only the GSO model captured its large magnitude as well as its interspecific variation due to differences in hydraulic traits. Our results show that dry VPD (driven by low RH) leads to hydraulic stress that increases water-use efficiency and closes stomata quickly. In contrast, hot VPD (driven by high air temperature) can lead to decreased water-use efficiency if efficient soil-to-leaf hydraulic transport is maintained and thus slower stomatal closure.

How to cite: Potkay, A., Sloan, B., Perry, A., Sperling, O., Hochberg, U., Li, R., Xu, X., Nakad, M., Peters, R., and Feng, X.: Plant hydraulics explain distinct stomatal responses to hot versus dry vapor pressure deficit, EGU General Assembly 2026, Vienna, Austria, 3–8 May 2026, EGU26-2569, https://doi.org/10.5194/egusphere-egu26-2569, 2026.

EGU26-4226 | ECS | Orals | BG3.41

3D plant modeling to better assess heat impacts on vegetation in heterogeneous microclimates. 

Joseph Vernier, Sylvain Edouard, Eric Dupont, Vincent Trotin, Didier Combes, and Patrick Massin

To address climate change and the growing frequency of heatwaves and droughts, several dual-land solutions have been proposed - including agroforestry, agrivoltaics, and downstream hedgerow systems - which integrate trees, photovoltaic panels, or hedgerows with agricultural crops. At a short time scale, such configurations protect crops from excessive sunlight and strong winds, while at a longer time scale, they improve water conservation, thus enhancing crop thermoregulation during heatwaves and droughts (Barron-Gafford, et al., 2019). To accurately predict the level of protection provided, two key challenges arise: (1) modeling the impact of hedgerows, trees, or panels on the microclimate; and (2) assessing how the modified microclimate influences vegetation energy and water balances.

To this end, the considered approach leverages the Computational Fluid Dynamics software code_saturne, which enables three-dimensional simulations of how obstacles alter the microclimate quantities. Vegetation effect on airflow is represented using source and sink terms following (Katul, et al., 2004, and Vernier, et al., 2026b), while the soil–plant–atmosphere continuum model developed by A. Tuzet is used to estimate plant energy and water balances, together with photosynthesis, and water stress (Tuzet, et al., 2003, and Vernier, et al., 2026a) (see Figure below). More recently, three-dimensional energy, water, and radiation balances at the leaf-agglomerate scale have been implemented into code_saturne to better simulate the influence of trees on the microclimate, and improve the accuracy and details of tree temperature estimations. 

The key drivers of plant temperature are simulated: incident radiation, convective exchange coefficient, stomatal conductance, together with air temperature and humidity. As illustrated in the Figure below, two heterogeneity scales are observed: a large one at the canopy level, and a small one at the tree level. On the one hand, trees attenuate wind speed by a factor of three between the inflow and the canopy flow, increasing convection resistance from approximately 15 s/m at the first trees with respect to the inflow to approximately 30 s/m for a tree at the center of the canopy. Alongside an approximate 1°C increase in air temperature, the first trees with respect to the inflow are about 2°C cooler than those located at the center of the canopy. On the other hand, part of each tree absorbs radiation while another one remains shaded, either by its own structure or by neighboring trees. This results in heterogeneous stomatal conductance at the tree scale, and, consequently, differences in plant temperature of more than 5°C. 

The next step consists in evaluating how combining trees, crops, hedgerows, and photovoltaic panels can help mitigate the impacts of heatwaves and droughts on agricultural production. Simulations of such systems are compared to measurements conducted at experimental agrivoltaic power plants, integrating photovoltaic panels above grapevines and apple trees, or obtained from agricultural fields located downstream of hedgerows. The ultimate goal is to optimize the geometry of panels, hedgerows, and trees to maximize their protective benefits, thereby boosting agricultural productivity and strengthening resilience to climate change.

How to cite: Vernier, J., Edouard, S., Dupont, E., Trotin, V., Combes, D., and Massin, P.: 3D plant modeling to better assess heat impacts on vegetation in heterogeneous microclimates., EGU General Assembly 2026, Vienna, Austria, 3–8 May 2026, EGU26-4226, https://doi.org/10.5194/egusphere-egu26-4226, 2026.

EGU26-5738 | ECS | Posters on site | BG3.41

Canopy thermoregulation of Quercus ilex under long-term soil moisture reduction across a Mediterranean climate gradient 

Alyssa Kullberg, Cross Heintzelman, Arianna Milano, Helena Vallicrosa, Jean-Marc Limousin, Romà Ogaya, Josep Peñuelas, Christoph Bachofen, and Charlotte Grossiord

Mediterranean forests are increasingly exposed to hotter and drier summers, yet the mechanisms by which mature trees regulate canopy temperature under chronic soil moisture limitation remain poorly constrained. We investigate ecosystem-scale drivers of canopy thermoregulation and consequences for leaf thermal safety margins and function in Quercus ilex in southern France (Puéchabon) and northeastern Spain (Prades), where throughfall exclusion has reduced soil moisture by ~30% for over two decades. Combining continuous micrometeorological measurements with seasonal observations of canopy temperature, gas exchange, sap flow, and thermal tolerance, we ask whether long-term drought acclimation alters canopy-level physiological responses in ways that modify or maintain leaf thermal safety margins. We test the hypothesis that chronic soil moisture reduction leads to reduced transpiration, resulting in warmer canopies during the growing season, but that drought-acclimated trees exhibit altered stomatal sensitivity that mitigates leaf overheating during heat waves. We further assess whether recovery of transpiration following hot periods differs between control and drought-treated trees and whether responses vary between cooler and warmer sites. This work leverages long-term field experiments to improve mechanistic understanding of tree thermoregulation under future Mediterranean climate extremes.

How to cite: Kullberg, A., Heintzelman, C., Milano, A., Vallicrosa, H., Limousin, J.-M., Ogaya, R., Peñuelas, J., Bachofen, C., and Grossiord, C.: Canopy thermoregulation of Quercus ilex under long-term soil moisture reduction across a Mediterranean climate gradient, EGU General Assembly 2026, Vienna, Austria, 3–8 May 2026, EGU26-5738, https://doi.org/10.5194/egusphere-egu26-5738, 2026.

EGU26-9216 | ECS | Orals | BG3.41

Machine learning reveals that leaf temperature extremes drive shifts in plant photosystem heat thresholds across marked microclimatic variation 

Catherine Pottinger, Pieter Arnold, Lisa Danzey, Adrienne Nicotra, Andrei Herdean, Andy Leigh, and Michelle Bird

Understanding relationships between plant heat tolerance thresholds and the environment currently is hampered by significant variation around the means, which masks potentially important information. Rather than relating to broad-scale climate measures, local adaptation of heat thresholds might occur at finer microclimatic scales, which are particularly variable in thermally extreme, heterogeneous environments, found in many alpine systems. Further, air temperatures frequently over or underestimate leaf temperatures, which are known to influence heat thresholds. Yet, a clear relationship between microclimatic conditions and heat tolerance thresholds has yet to be established. We aimed to determine the influence of prior leaf heat load on leaf photosystem heat tolerance thresholds (Tcrit) for two co-occurring alpine plant species in Kosciusko National Park, Australia: Grevillea australis and Dracophyllum continentis. Measurements were taken on five consecutive days across eight paired sites contrasting in aspect (NW, SE) at Schlink Pass (ridge line) and Mt Stilwell (cold air drainage valley). We found that Tcrit and its relationship with leaf temperature parameters, did not differ between species, locations or aspects. Traditional statistical models found that Tleaf parameters explained some variation in Tcrit; however, when pooling across sites and species, machine learning identified that 85% of the variation in Tcrit was explained by not only maximum, but also minimum leaf temperatures in the four days prior to measurement. This finding suggests that exposure to cold extremes could be conferring cross-tolerance, promoting heat tolerance acclimation. Microclimatic variation is complicated, potentially obscuring patterns that maybe present. To uncover these complex relationships between environmental conditions and plant acclimatory responses, we recommend integrating machine learning techniques with traditional statistical methods.

How to cite: Pottinger, C., Arnold, P., Danzey, L., Nicotra, A., Herdean, A., Leigh, A., and Bird, M.: Machine learning reveals that leaf temperature extremes drive shifts in plant photosystem heat thresholds across marked microclimatic variation, EGU General Assembly 2026, Vienna, Austria, 3–8 May 2026, EGU26-9216, https://doi.org/10.5194/egusphere-egu26-9216, 2026.

EGU26-9835 | ECS | Posters on site | BG3.41

How within-canopy microclimatic buffering shapes forest structure and function 

Raphael Garisoain, Isabelle Maréchaux, Jérôme Ogée, and Jérôme Chave

Accurately representing within-canopy microclimatic processes remains a major challenge for vegetation and climate models. Most Land Surface Models (LSMs) and Earth System Models (ESMs) rely on simplified canopy representations that fail to resolve the effects of vertical gradients of temperature and vapor pressure deficit (VPD), despite their critical role in regulating plant physiology, forest dynamics, and biosphere–atmosphere exchanges. While multilayer canopy models improve the representation of these gradients, they often lack the structural and demographic realism needed to link microclimate to long-term forest dynamics.

Here, we use the individual-based forest model TROLL to compare simulations that include or neglect within-canopy microclimatic buffering, and to assess its influence on physiological fluxes, forest structure, and long-term carbon storage. TROLL explicitly represents individual tree growth, mortality, three-dimensional structure, and competitive interactions, allowing environmental conditions to vary vertically and to be experienced by trees according to their position within the canopy. To disentangle short-term and long-term effects, we decompose ecosystem fluxes over the last decade of the simulations, isolating physiological and structural responses from emergent centennial-scale patterns.

Preliminary analyses suggest that microclimatic buffering affects gross primary productivity (GPP) and transpiration  in contrasting ways. These metrics do not always respond in the same direction, with distinct, and sometimes decoupled, responses across vegetation layers, reflecting differences in exposure, hydraulic constraints, and trait-mediated regulation. Aboveground biomass also shows non-intuitive responses to microclimatic buffering, highlighting the limits of interpreting forest functioning from fluxes alone.

Over centennial timescales, simulations including microclimatic buffering lead to forests characterized by lower atmospheric demand, reduced hydraulic stress, and ultimately higher aboveground biomass, despite lower photosynthetic fluxes. These long-term differences emerge from the cumulative effects of short-term physiological regulation and size-dependent mortality, which selectively favors individuals less exposed to thermal and hydric stress.

By explicitly linking microclimatic buffering, ecosystem fluxes, and demographic processes, this study provides a mechanistic explanation for how within-canopy microclimatic heterogeneity can enhance forest carbon storage while dampening ecosystem-level fluxes. Our results highlight the importance of representing microclimatic buffering and individual-level processes to improve predictions of forest resilience under ongoing climate warming.

How to cite: Garisoain, R., Maréchaux, I., Ogée, J., and Chave, J.: How within-canopy microclimatic buffering shapes forest structure and function, EGU General Assembly 2026, Vienna, Austria, 3–8 May 2026, EGU26-9835, https://doi.org/10.5194/egusphere-egu26-9835, 2026.

EGU26-10230 | ECS | Posters on site | BG3.41

Drone-based LiDAR reveals dynamic links between forest structure and microclimate during phenological transitions 

Alexia Favaro, Jean-François Bastin, and Pieter De Frenne

Forest microclimates play a critical role in shaping biodiversity, ecosystem functioning, and species responses to climate variability. Within forested environments, near-surface air temperatures often deviate substantially from macroclimatic conditions as a result of canopy structure and seasonal vegetation dynamics. Despite growing interest in forest microclimate buffering, the fine-scale and seasonal links between forest structure and temperature regulation remain poorly quantified, particularly during phenological transitions such as spring leaf onset.

Here we show that high-resolution LiDAR-derived forest structural metrics capture rapid canopy development during leaf emergence and robustly explain spatial and temporal variability in forest temperature offsets relative to macroclimatic conditions. We combined repeated UAV-based LiDAR acquisitions conducted throughout spring 2025 with in situ microclimate measurements across four temperate forests in Wallonia (Belgium). Metrics describing canopy density and structural complexity, such as plant area index, rumple index, and canopy height skewness, characterize complementary aspects of structural development during leaf onset.

Together, these structural indicators explain a substantial fraction of the variability in forest temperature offsets and reveal seasonally evolving relationships between canopy structure and microclimate buffering. These results indicate that microclimate buffering is primarily driven by short-term structural dynamics during leaf onset rather than by static canopy properties.

Our findings advance the mechanistic understanding of how phenological dynamics modulate forest microclimates and emphasize the importance of accounting for seasonal structural variability when assessing forest resilience to climate extremes. Given the strong sensitivity of forest species and ecosystem processes to small microclimatic variations, incorporating temporally explicit canopy structure is essential for improving predictions of ecosystem responses under ongoing climate change.

How to cite: Favaro, A., Bastin, J.-F., and De Frenne, P.: Drone-based LiDAR reveals dynamic links between forest structure and microclimate during phenological transitions, EGU General Assembly 2026, Vienna, Austria, 3–8 May 2026, EGU26-10230, https://doi.org/10.5194/egusphere-egu26-10230, 2026.

EGU26-12431 | ECS | Posters on site | BG3.41

LED-induced chlorophyll fluorescence during heat and drought stress in microcosm experiments on sunflower and wheat 

Islam Guettala, Ádám Mészáros, János Balogh, and Szilvia Fóti

Chlorophyll fluorescence, emitted mainly in the red and far-red spectral ranges (about 650–850 nm), provides direct information on photosynthetic functioning and plant stress responses. Solar-induced chlorophyll fluorescence (SIF) offers information on photosynthetic activity at the canopy scale under natural light conditions, but its interpretation is strongly influenced by variable illumination and canopy structure. Actively induced fluorescence using LED light sources offers a controlled alternative for fluorescence spectra measurements. LED-induced chlorophyll fluorescence (LEDIF) enables observations under standardized conditions, independent of ambient light variability, and allows more direct access to baseline fluorescence properties linked to plant physiological status. LEDIF is therefore well-suited for studying stress responses in controlled experiments.

In this study, controlled microcosm experiments were conducted on sunflower and wheat following the same experimental protocol to investigate plant responses to drought and heat stress using LEDIF. Plants were subjected to four treatments: well-watered – no heat stressed, well-watered – heat stressed, water-stressed – no heat stressed, and water-stressed - heat stressed. All experiments lasted approximately two months in 2024-2025, with stress applied gradually. Chlorophyll fluorescence was induced using an actively controlled 11-channel multispectral LED illumination system. Broadband fluorescence (650–850 nm) and reflectance spectra (350–850 nm) were recorded above the canopy using a downward-facing VIS–NIR spectrometer positioned between the LED panels, while canopy architecture and leaf area development were monitored using side- and top-view RGB images. LEDIF increased during canopy development of the sunflower plants, after which clear treatment-dependent responses emerged. Sudden heat stress applied to well-watered plants caused a decline in fluorescence comparable to that in gradually drought-stressed sunflower plants. While plants exhibited similar growth during the initial phase, drought induced strong divergence in canopy development, with well-watered plants maintaining healthy canopies and drought-stressed plants showing severe canopy loss. Wheat plants consistently exhibited lower fluorescence intensity than sunflower plants and a stronger temporal decline in LEDIF, reflecting greater loss of green leaf area. Leaf angle changes supported these responses, with water-stressed plants displaying shifts toward flaccid, senescing leaves.

How to cite: Guettala, I., Mészáros, Á., Balogh, J., and Fóti, S.: LED-induced chlorophyll fluorescence during heat and drought stress in microcosm experiments on sunflower and wheat, EGU General Assembly 2026, Vienna, Austria, 3–8 May 2026, EGU26-12431, https://doi.org/10.5194/egusphere-egu26-12431, 2026.

Due to anthropogenic climate change, temperatures are increasing, placing tropical forests, including mangroves, at increased risk of heat stress. The red mangrove (Rhizophora mangle) is a salt-tolerant tree species, with ecological and social importance in the coastal regions of Panama and many other parts of the Americas. It remains unclear how heat stress interacts with seawater salinity in this species. We hypothesize that elevated temperatures reduces overall biomass accumulation and photosynthetic performance, but increases photosystem II heat tolerance through short-term acclimation, whereas increased salinity reduces these traits.

To address this question, an experimental study is currently being conducted in glasshouses exposed to full solar radiation in Panama, where red mangrove seedlings are grown under two temperature settings: ambient temperature and elevated temperature (+5 °C above ambient). Within each glasshouse, eight seedlings are grown per salinity treatment at four salinity concentrations (<0.5 ppt, 5 ppt, 20 ppt, and 35 ppt) in hydroponic systems. This study will provide insight into how the combined effects of salinity and heat influence biomass accumulation and allocation, photosystem II heat tolerance, photosynthetic gas exchange and ionic content of red mangrove seedlings.

How to cite: Krüger, C. and Winter, K.: Salt and heat: The effects of elevated temperature at different salinities on seedlings of the red mangrove (Rhizophora mangle L.), EGU General Assembly 2026, Vienna, Austria, 3–8 May 2026, EGU26-13440, https://doi.org/10.5194/egusphere-egu26-13440, 2026.

Multilayer canopy models, based on energy balance principles, are appropriate modeling tools for understanding and predicting the effects of hot droughts on forest productivity and leaf damage caused by extreme leaf temperatures. Leaves within canopy vertical layers are exposed to different levels of radiation and momentum flux, resulting in different leaf temperatures and leaf water potentials in the upper, middle and lower canopy. Explicit consideration of these vertical gradients enables more mechanistic predictions without reliance on empiricism and formal model calibration. Here we use two broadleaf forest sites affected by the 2012 American Midwest drought to study the CanVeg2 model’s ability to reproduce the forest canopy responses as measured from eddy covariance towers. This study relies on 3D radiative transfer simulations based on canopy structure information derived from a ground lidar instrument to characterize the radiative forcing on leaves. At both sites the forest productivity was significantly affected by the 2012 drought, as evidenced by the eddy covariance flux tower records. Images from the PhenoCam network show that at one site (Missouri Ozark) there was significant leaf die off, while the other site (Morgan Monroe, Indiana) showed no visual evidence of leaf damage, even though the air temperatures reached were higher at the Morgan Monroe site, why could that be? We will present evidence of the reasons from a modeling perspective, and discuss the conditions under which the canopy microclimate leads to leaf temperatures above critical damage thresholds, as well as where in the canopy leaves reached their highest temperatures for this specific case, and for how long. Using leaf level data on the temperature response of the maximum quantum yield of photosystem II for the species present at both sites, we also present a novel modeling approach to estimate leaf damage levels and its effect on canopy productivity for the rest of the growing season once rains return and the hot drought subsides.

How to cite: Beland, M., Bonan, G., and Baldocchi, D.: Estimating leaf damage from hot drought events and predicting the effects on forest productivity from multilayer canopy models, EGU General Assembly 2026, Vienna, Austria, 3–8 May 2026, EGU26-14569, https://doi.org/10.5194/egusphere-egu26-14569, 2026.

EGU26-14586 | ECS | Orals | BG3.41

Response of canopy temperature and leaf heat tolerance to a heatwave: a study on Quercus robur under ambient (aCO2) and elevated (eCO2) conditions 

William Hagan Brown, Emanuel Gloor, Ralph Fyfe, Rob J. MacKenzie, Giulio Curioni, Scott J. Davidson, Susan Quick, Jen L. Diehl, and Sophie Fauset

Experimental and modelling studies indicate that elevated CO2 (eCO2) can alter leaf thermal dynamics through reduced stomatal conductance and leaf structural trait modifications. These changes weaken evaporative cooling and shift the leaf energy balance toward higher leaf temperatures. However, empirical evidence from mature natural forest ecosystems remains limited. Thermal infrared (TIR) imaging provides a robust approach for continuous, non-contact monitoring of surface temperature in natural ecosystems. Here, we used TIR imagery to quantify canopy temperature in mature Quercus robur at the Birmingham Institute of Forest Research Free-Air CO2 Enrichment (BIFoR-FACE) facility in Staffordshire, central England, during the summers of 2021 to 2023, which included a heatwave in 2022. Elevated CO2 induced structural and physiological shifts in oak leaves, including higher leaf mass per area and lower stomatal conductance, with implications for leaf energy balance and canopy heat dissipation. Across summers, canopies in eCO2 plots were on approximately 1 °C warmer than those in ambient CO2 (aCO2) plots, with the largest differences occurring during high-temperature periods and an increased frequency of exceedance during heatwaves. We additionally assessed photosystem II heat tolerance before and during the 2022 heatwave using chlorophyll fluorescence (maximum quantum yield of photosystem II Fv/Fm). Following the July 2022 heatwave, leaves showed evidence of increased heat tolerance overall, but heat tolerance was reduced in eCO2 compared with aCO2. Together, these findings indicate that eCO2 can elevate canopy temperatures in mature temperate forest canopies and may also alter physiological heat tolerance responses during extreme heat events.

How to cite: Hagan Brown, W., Gloor, E., Fyfe, R., MacKenzie, R. J., Curioni, G., Davidson, S. J., Quick, S., Diehl, J. L., and Fauset, S.: Response of canopy temperature and leaf heat tolerance to a heatwave: a study on Quercus robur under ambient (aCO2) and elevated (eCO2) conditions, EGU General Assembly 2026, Vienna, Austria, 3–8 May 2026, EGU26-14586, https://doi.org/10.5194/egusphere-egu26-14586, 2026.

EGU26-18686 | Orals | BG3.41

Co-variation of leaf traits and microclimate across canopies: does it matter for forest function? 

Neill Prohaska, Leonardo Ziccardi, Yujie Wang, Kleber Silva Campos, Natalia Restrepo-Coupe, Scott Stark, and Scott Saleska

The ecological importance of variation in both leaf microclimates and leaf energy balance traits in determining leaf temperatures and transpiration rates has been recognized for over fifty years. However, although leaf temperature emerges at the leaf or branch scale, most studies rely on either macro- (regional) or meso- (plot) scale estimates of air temperature, which may meaningfully differ from leaf temperatures. Critically, feedbacks between microclimate and energy balance leaf traits (e.g. leaf width, stomatal regulation, leaf absorptance of shortwave radiation) on forest temperature responses are generally ignored. Here we investigate whether such feedbacks might be important by testing for covariance between leaf energy balance traits and microclimate in a tropical forest in central eastern Amazonia. We use a unique dataset of leaf traits (400+ leaves from 39 individual trees of 10 most abundant species) accessed via climbing techniques across height and light gradients from the bottom to the top of the canopy. We ask: (1) is there covariance of leaf traits with microclimate (e.g. are leaves in light gaps narrower, with smaller boundary layers, and hence more tightly coupled to air temperature, than shaded leaves)?; and (2) if so, what impact may this covariance have on the distribution of leaf temperatures in the forest canopy? Using generalized linear mixed models, we found substantial covariance of leaf widths with both height and light (proxies for microclimate variation), with height and light strongly interacting to affect leaf width (and so leaf temperature via boundary layer conductance). We then used energy balance modeling to compare simulated leaf temperatures with and without covariance of leaf width and microclimate. This work shows that leaf-environment interactions have significant effects on leaf temperatures with important implications for forest temperature sensitivity and function.

How to cite: Prohaska, N., Ziccardi, L., Wang, Y., Silva Campos, K., Restrepo-Coupe, N., Stark, S., and Saleska, S.: Co-variation of leaf traits and microclimate across canopies: does it matter for forest function?, EGU General Assembly 2026, Vienna, Austria, 3–8 May 2026, EGU26-18686, https://doi.org/10.5194/egusphere-egu26-18686, 2026.

EGU26-18728 | Orals | BG3.41

Buffering of microclimate extremes in the understory and its consequences for tree seedling survival 

Jerome Ogee and the The ANR project MaCCMic Team

Forest canopies provide shade and generally buffer summer extremes in the understory. However, the wind attenuation and water consumption of large trees can sometimes make the understory hotter and drier than an open field. To maintain forest regeneration and biodiversity, it is crucial to identify the factors that cause forest canopies to transition from buffering to amplifying climate extremes. Structural factors such as leaf area index, crown aggregation, and canopy height are important and well-known factors that influence canopy density and understory microclimate. However, other local factors, such as the species composition and vertical complexity of the canopy, topographic convergence and water availability also influence the ability of forest canopies to attenuate summer climate extremes. In this talk, I will present an overview of how these factors influence the buffering or amplification of climate extremes individually and collectively using examples from experimental and physics-based modelling studies. I will also discuss how this influence translates to heat and water stress for understory species and tree seedlings.

How to cite: Ogee, J. and the The ANR project MaCCMic Team: Buffering of microclimate extremes in the understory and its consequences for tree seedling survival, EGU General Assembly 2026, Vienna, Austria, 3–8 May 2026, EGU26-18728, https://doi.org/10.5194/egusphere-egu26-18728, 2026.

EGU26-21039 | Posters on site | BG3.41

The impact of heating on leaf energy balance of Rwandan forest trees: results from an elevation gradient experiment 

Sophie Fauset, William Hagan Brown, Sebastian Gonzalez-Caro, Iain Hartley, Karin Johannson, Patrick Meir, Esther Niyigena, Zorayda Restrepo, Valentina Rivera, Tyeen Taylor, Johan Uddling, Goran Wallin, and Lina Mercado

Variation in leaf structure and morphology impacts leaf temperature, leading to differences in leaf and canopy temperatures between species. This is a growing research area, and while the biophysical mechanisms are well described, datasets on leaf temperatures and understanding of the impact of warming on leaf thermal physiology are still developing, especially for African tropical forests. Here we present results from the Trop-heat and Rwanda-TREE projects which looked at leaf energy balance of saplings of eight species growing in common gardens at two elevations in the Nyungwe National Park. We compare leaf-to-air temperature differences for these species growing at mid and high elevation sites with mean temperatures of 22.5 °C and 17.5 °C, respectively. We then quantify how key energy-balance traits (leaf size, absorptance, stomatal conductance) change with warming, and evaluate the extent to which these traits and their temperature acclimation explain the observed leaf temperatures under higher growth temperatures. Together, this improves our understanding of the variation in leaf thermoregulation between Rwandan tree species and how leaf temperature regimes may alter under climate warming.

How to cite: Fauset, S., Hagan Brown, W., Gonzalez-Caro, S., Hartley, I., Johannson, K., Meir, P., Niyigena, E., Restrepo, Z., Rivera, V., Taylor, T., Uddling, J., Wallin, G., and Mercado, L.: The impact of heating on leaf energy balance of Rwandan forest trees: results from an elevation gradient experiment, EGU General Assembly 2026, Vienna, Austria, 3–8 May 2026, EGU26-21039, https://doi.org/10.5194/egusphere-egu26-21039, 2026.

EGU26-22804 | ECS | Orals | BG3.41

Drought-induced shifts toward photoprotection reduce Amazon photosynthesis 

Leonardo Ziccardi, David Kramer, Nathan Gonçalves, Natalia Restrepo-Coupe, Tyeen Taylor, Bruce Nelson, Kleber Campos, Adviano Siqueira-Silva, Neill Prohaska, Loren Albert, Shuli Chen, Scott Saleska, and Scott Stark

Amazonian forests have experienced increasingly frequent and intense droughts in recent decades, often associated with El Niño–Southern Oscillation (ENSO). These droughts have triggered complex forest responses—from increased tree mortality, reduced carbon uptake, and structural changes to increased canopy productivity—that cannot be explained by climate variability alone. While drought-related changes in light availability and physiological responses are likely to vary along the canopy profile, a key question is how drought-driven changes in canopy conditions, especially across vertical gradients, impact canopy production. To investigate this, we combined tree climbing techniques and pulse amplitude modulated (PAM) fluorometry to quantify how leaves partition absorbed photon energy across seasons and canopy strata in central Amazonian forests during typical wet and dry seasons, and throughout the 2023–2024 ENSO drought. By conducting extensive in‑canopy sampling , we show that photosynthetic efficiency and photoprotective responses differ significantly across canopy strata during drought. We found that the typical seasonal dry period had little impact on the fates of photons absorbed by leaf light-harvesting centers for a given microenvironment, consistent with multi-scale observations of sustained or high dry season canopy function in the central Amazon. In contrast, during the ENSO drought we found reduced photochemical yield in all canopy strata, with increased photoprotective heat dissipation. We also observed nonlinear relationships between photosynthetic linear electron flow between photosystems II and I and leaf fluorescence, mainly driven by the joint dynamics of PSII open reaction centers (qL) and non-photochemical quenching (NPQ). Finally, we found in situ leaf-level evidence that, in contrast to dry season resilience, drought reduces photosynthesis of large trees, driving shifts in energy partitioning from photosynthesis to photoprotective dissipation. However, yields to leaf fluorescence remained stable during drought, suggesting that extreme drought systematically alters the linkage between fluorescence and carbon assimilation. These results show that drought‐resilience mechanisms strongly modulate photosynthesis and suggest that productivity estimates based on remotely sensed sun‑induced fluorescence (SIF) alone are likely to underestimate drought responses in Amazonian forests.

How to cite: Ziccardi, L., Kramer, D., Gonçalves, N., Restrepo-Coupe, N., Taylor, T., Nelson, B., Campos, K., Siqueira-Silva, A., Prohaska, N., Albert, L., Chen, S., Saleska, S., and Stark, S.: Drought-induced shifts toward photoprotection reduce Amazon photosynthesis, EGU General Assembly 2026, Vienna, Austria, 3–8 May 2026, EGU26-22804, https://doi.org/10.5194/egusphere-egu26-22804, 2026.

EGU26-1194 | ECS | Orals | BG3.42

Evaluating LPJ-GUESS for Simulating Drought Responses in Swedish Forest 

Filipe Gomes de Almeida, Rose Brinkhoff, Cecilia Akselsson, Natascha Kljun, and Thomas Pugh

Forests provide critical ecosystem services, including timber production and climate and water regulation, but these are increasingly threatened by climate-driven disturbances such as drought. The 2018 Swedish drought exemplified this risk, causing extensive wildfires, a severe spruce bark beetle outbreak, and reduced forest productivity. Projections for Nordic countries indicate warmer conditions and more frequent and intense droughts, highlighting the need for tools that can accurately predict such impacts to support adaptive forest management. We evaluated recent LPJ-GUESS developments for simulating drought impacts in Scots pine (Pinus sylvestris) and Norway spruce (Picea abies) in Sweden. We evaluated two LPJ-GUESS versions: a European-optimized version with updated trait and structural parameters for major European tree species, and a second version that adds a mechanistic plant hydraulic scheme to this same parameterization, enabling representation of contrasting isohydric and anisohydric stomatal strategies. Model outputs were evaluated against high-resolution carbon and water flux data from three Swedish ICOS sites and against National Forest Inventory growth records. Preliminary results show that the combined version better captures the 2018 drought signal observed in carbon flux data but does not necessary yield improvements in annual fluxes of gross primary production and evapotranspiration. We conclude with an outlook for steps to improve simulations of drought stress in Nordic forests.

How to cite: Gomes de Almeida, F., Brinkhoff, R., Akselsson, C., Kljun, N., and Pugh, T.: Evaluating LPJ-GUESS for Simulating Drought Responses in Swedish Forest, EGU General Assembly 2026, Vienna, Austria, 3–8 May 2026, EGU26-1194, https://doi.org/10.5194/egusphere-egu26-1194, 2026.

EGU26-1648 | Posters on site | BG3.42

Atmospheric dryness drives boreal aboveground biomass dynamics through cascading effects on tree growth and fire 

Martin Girardin, Yan Boulanger, Raquel Alfaro-Sánchez, and Xiuzhi Chen

Atmospheric dryness, quantified as vapor pressure deficit (VPD), is rising with climate warming, yet its joint impacts on tree growth, fire activity, and biomass dynamics remain understudied at broad spatial scales. Here, we investigate how interannual variability in VPD relates jointly to tree growth, fire activity, and aboveground biomass dynamics across the western North American boreal–arctic transition encompassed by NASA’s ABoVE study domain. We assembled long-term time series of spring and summer daytime VPD (1951–2022), tree-ring based basal area increments (846 trees across 199 national forest inventory plots; 1950–2009), annual area burned (1950–2020), and Landsat-derived aboveground biomass increments (1985–2014). Pairwise relationships were quantified with Pearson correlations accounting for serial persistence; a structural-equation-model diagram summarizes significant linkages. Rising VPD promoted basal area increment reductions and increased annual area burned, whereas aboveground biomass increased with higher basal area increments and declined with increasing annual area burned. Structural equation modeling revealed that VPD does not act directly on biomass stocks; instead, it influences biomass accumulation through cascading effects—by suppressing tree growth and amplifying fire activity, which together govern long-term carbon storage. Our findings caution that remote sensing alone may fail to capture the sensitivity of biomass accumulation to atmospheric dryness, as physiological stress and disturbance interactions often leave subtle or lagged signatures in satellite-derived metrics. The results illustrate the need to move beyond isolated treatment of fire and growth in ecosystem models. Incorporating these dual pathways into fire behavior and carbon budget models is essential for anticipating boreal forest trajectories under continuing warming.

How to cite: Girardin, M., Boulanger, Y., Alfaro-Sánchez, R., and Chen, X.: Atmospheric dryness drives boreal aboveground biomass dynamics through cascading effects on tree growth and fire, EGU General Assembly 2026, Vienna, Austria, 3–8 May 2026, EGU26-1648, https://doi.org/10.5194/egusphere-egu26-1648, 2026.

EGU26-2323 | ECS | Posters on site | BG3.42

Increased Spread of Global Flash Droughts Threatens Vegetation Productivity Resilience 

Renjie Guo, Xiuchen Wu, Pei Wang, Tiexi Chen, Xin Chen, Jiangtao Cai, Xiaona Wang, Zifan Zhang, Zekai Meng, and Yiran Liu

Flash drought (faster-developing drought) has been pervasively intensified, posing detrimental constraints on vegetation productivity. However, the divergence in the underlying drivers governing vegetation productivity responses to flash and slow droughts (slower-developing droughts) remains unknown. We quantified the dominant drivers underlying vegetation productivity resilience (the departure of post-drought productivity anomalies to the long-term mean) to both flash and slow droughts. There exhibited significantly lower productivity resilience to flash drought at flash drought hotspots than non-hotspots. Carbon dioxide fertilization effect exerted the greatest positive effect on productivity resilience to both flash and slow droughts, although that effect was smaller under flash droughts. The productivity resilience to flash drought was more sensitive to reduction in productivity anomaly and intensified climate stress than slow drought at flash drought hotspots. This study highlights the increasing risk of flash drought spread on global ecosystem productivity resilience.

How to cite: Guo, R., Wu, X., Wang, P., Chen, T., Chen, X., Cai, J., Wang, X., Zhang, Z., Meng, Z., and Liu, Y.: Increased Spread of Global Flash Droughts Threatens Vegetation Productivity Resilience, EGU General Assembly 2026, Vienna, Austria, 3–8 May 2026, EGU26-2323, https://doi.org/10.5194/egusphere-egu26-2323, 2026.

EGU26-3834 | ECS | Posters on site | BG3.42

Understanding the interaction of plant water status and vegetation optical depth from passive microwave satellite observations in Central African Forests 

Ulisse Gomarasca, Oliver Binks, María Piles, and Gregory Duveiller

Vegetation attenuates microwave radiation that is emitted or reflected by the Earth surface. The degree of attenuation derived from passive and active microwave satellite observations is commonly referred to as vegetation optical depth (VOD). While high-frequency bands such as the Ku-, X- and C-band retrieve information from the upper-most fraction of the canopy, low frequency bands (e.g.: L-band) are thought to convey information about the entire forest profile. Thus, different frequencies could be complementary for the study of plant-water interactions along the vertical vegetation profile. However, the fraction of the canopy that is detected within a given band is itself a function of water content, which challenges the interpretation and practical use of multi-channel VOD products. Understanding the VOD signal in tropical forests and how water dynamics might affect it is crucial, as microwave observations are one of the only reliable methods that can consistently measure tropical areas frequently covered by clouds.

Hydraulic capacitance in plants – the ratio between water content and water potential – is approximately constant within a physiologically non-damaging range of water potentials. Thus, during periods of minimal flux while systems are close to hydraulic equilibrium (e.g., predawn, drought), a linear relationship between predawn water potential and the total amount of water contained in the above ground biomass is expected. The deviation from a constant ratio between VOD bands under equilibrium conditions could thus be an indicator of 1) variation in penetration depth caused by the change in water content, 2) changes in surface moisture/interception, or 3) the transition over a physiological threshold, when hydraulic capacitance changes.

Here, we aim to exploit changes in ratios between VOD bands to understand the seasonality of the vegetation water status in Central African tropical forests within the framework of the CoForFunc international project. Specifically, we hypothesize that different forest structures might lead to varying seasonal responses to water availability and distinct plant phenologies detectable from satellite measurements of passive microwave radiation. To do so, we obtained night-time monthly VOD observations from the Ku-, X-, C-, and L-band from VODCA products between 2012 and 2018, and calculated the ratios between each pair of bands. Over forested pixels in Central Africa, we explored the variability of the VOD ratios in relation to precipitation and interception estimates and other potential climatic predictors to tease out the seasonality of water availability and other confounding factors. We further tested the contribution of within-pixel land cover fractions and heterogeneity metrics on the variability of the VOD ratios.

Our results link physiological and biophysical understanding at the tissue-scale to the scale at which satellite observations provide information on water and biomass relations for land surface models. This will become particularly relevant as future missions such as the CIMR Copernicus Expansion Mission will ensure global daily multi-channel VOD products for continuous vegetation water monitoring. Understanding water-vegetation dynamics in tropical forests will further help the investigation and monitoring of such crucial but understudied areas.

How to cite: Gomarasca, U., Binks, O., Piles, M., and Duveiller, G.: Understanding the interaction of plant water status and vegetation optical depth from passive microwave satellite observations in Central African Forests, EGU General Assembly 2026, Vienna, Austria, 3–8 May 2026, EGU26-3834, https://doi.org/10.5194/egusphere-egu26-3834, 2026.

EGU26-4972 | ECS | Orals | BG3.42

Global ecosystem water limitation under warming driven by energy constraints and physiological CO2 effects 

Jiameng Xu, Yuanchao Fan, Kaighin A. McColl, Alexis Berg, Yu Liang, and Jian Yang

Energy and water availability are essential controls on terrestrial ecosystem functions. Recent studies suggest widespread shifts from energy- to water-limited conditions under global warming. We demonstrate that incorporating a thermodynamically appropriate energy indicator fundamentally changes this projection. Surface energy availability for evapotranspiration is primarily determined by net radiation rather than downwelling shortwave radiation or air temperature, as supported by both theory and observations. Using this improved framework, we find no projected net increase in terrestrial ecosystem water limitation under greenhouse warming. Instead, projected bidirectional transitions between water- and energy-limited conditions exhibit comparable magnitudes, with a slight net reduction in the water-limited regime in 1.4% to 2.9% of global warm land areas. These findings are consistent with patterns reported in other ecohydrologically based studies and are supported by empirical evidence of reduced vegetation sensitivity to dry conditions under elevated CO2. Our study bridges ecological and physical theories to improve ecosystem water-energy limitation analysis and provide a clear mechanistic understanding of future ecosystem dynamics.

How to cite: Xu, J., Fan, Y., McColl, K. A., Berg, A., Liang, Y., and Yang, J.: Global ecosystem water limitation under warming driven by energy constraints and physiological CO2 effects, EGU General Assembly 2026, Vienna, Austria, 3–8 May 2026, EGU26-4972, https://doi.org/10.5194/egusphere-egu26-4972, 2026.

EGU26-5074 | ECS | Posters on site | BG3.42

Effects of Plant Age and Wood Formation on Drought Tolerance in Tomato 

Anai Pereira Zaldivar, Giovanni Bortolami, Jan Van den Bulcke, Toon Gheyle, Iván Josipovic, Louis Verschuren, Ellora Basu, Marian Bemer, Kailash Pandey, Gabrielle de Jong, Salma Balazadeh, and Frederic Lens

As the human population grows and droughts become more frequent and intense, identifying drought-responsive anatomical and ecophysiological traits in crops is critical to safeguard food production in a world that is becoming more demanding for plant growth. Solanum lycopersicum (tomato) is a major herbaceous crop species in which stem woodiness increases with age, especially in the basal stem regions, providing an opportunity to investigate how developmental changes in stem structure influence plant–water relations under drought. In this study, we investigated a 2-month and a 4-month old batch of two woody knockout mutant genotypes (double SOC1-like, quadruple FUL SOC1-like), as well as the wild type Solanum lycopersicum var. Moneyberg, to assess how differences in stem woodiness from genetic modification and plant age influence total plant drought tolerance. Therefore, we quantified a suite of drought-responsive anatomical traits and monitored ecophysiological traits from stems and/or leaves under well-watered and/or drought conditions. These traits included stem lignification, intervessel pit membrane thickness, stomatal traits, plant water potential dynamics, and resistance to drought-induced embolism. Overall, our results show that drought tolerance increases with plant age, primarily through enhanced resistance to drought-induced embolism in the stem, which correlates with increasing stem lignification at the basal stem. Stomata control plays a minor role, as resistance to drought-induced embolism drives major differences in the stomatal safety margin. When comparing developmental stages, variation in embolism resistance and woodiness in stems explains drought tolerance differences within genotypes, whereas intervessel pit membrane thickness is the primary driver of drought tolerance differences among genotypes. These findings demonstrate the dynamic role of drought-associated plant traits at the species level, highlighting once again the remarkable ability of plants to adapt to their environmental conditions.

How to cite: Pereira Zaldivar, A., Bortolami, G., Van den Bulcke, J., Gheyle, T., Josipovic, I., Verschuren, L., Basu, E., Bemer, M., Pandey, K., de Jong, G., Balazadeh, S., and Lens, F.: Effects of Plant Age and Wood Formation on Drought Tolerance in Tomato, EGU General Assembly 2026, Vienna, Austria, 3–8 May 2026, EGU26-5074, https://doi.org/10.5194/egusphere-egu26-5074, 2026.

The TreePulser project investigates how short-term environmental variability and species-specific physiological strategies interact to shape intra-annual tree growth dynamics in temperate forests. It relies on an extensive monitoring network of 300 dominant trees clustered within study sites distributed across Belgium, where a coordinated, multi-layer measurement set-up captures both environmental conditions and tree functioning.

A first, growth-centred approach integrates dendrometer-derived time series with a broad suite of exogenous drivers to characterise species- and site-specific growth phenology. Environmental monitoring includes atmospheric conditions (air temperature, relative humidity, precipitation, radiation), soil conditions (soil moisture and temperature), and physical soil characterisation aimed at capturing spatial variation in soil water availability. Stand structure and local competitive environment are incorporated through neighbourhood surveys quantifying the size, distance, and spatial arrangement of surrounding trees. Together, these variables are used to analyse growth onset and cessation, seasonal growth rates, and short-term variability, as well as to quantify the relative contributions of climatic, edaphic, and competitive drivers and the temporal lags between environmental variation and growth responses.

A complementary, mechanism-centred approach focuses on identifying the physiological and functional traits underlying observed growth patterns and drought sensitivity. Repeated canopy sampling provides measurements of predawn and midday leaf water potential, capturing seasonal dynamics in tree water status and nighttime rehydration capacity. Stomatal strategies are investigated through anatomical traits, including stomatal density and size. Hydraulic functioning is characterised using pressure–volume curves and xylem vulnerability measurements to quantify drought-relevant properties related to tissue water relations and resistance to embolism. Additional traits associated with leaf and wood economics, including specific leaf area, leaf nitrogen content, and wood density, provide a broader functional context by describing contrasting resource-use strategies.

By integrating high-frequency growth monitoring with multi-dimensional site characterisation and ecophysiological measurements on dominant trees, the project aims to better represent the interconnected processes governing tree performance in natural stands, where atmosphere, soil conditions, local competition, and endogenous regulation interact across multiple temporal scales. This integrative design supports the identification of trait-based predictors of growth sensitivity to atmospheric demand and soil water availability, thereby improving the capacity to anticipate species performance under increasingly variable climatic conditions.

How to cite: Hauzeur, H.: TreePulser : Growth Phenology and Physiological Responses of Temperate Tree Species Under Environmental Drivers, EGU General Assembly 2026, Vienna, Austria, 3–8 May 2026, EGU26-5828, https://doi.org/10.5194/egusphere-egu26-5828, 2026.

EGU26-6862 | Posters on site | BG3.42

When trees run on savings: Stem water storage and rehydration as a missing link in drought responses 

Richard L. Peters, Allan Buras, Simon Armand Grichting, Marcus Schaub, Charlotte Grossiord, Giovanni Bortolami, Jonas Gisler, Volodymyr Trotsiuk, Arthur Gessler, Katrin Meusburger, Stefan Hunziker, Ansgar Kahmen, Andreas Rigling, Lorenz Walthert, Stefan Klesse, and Roman Zweifel

Hotter droughts in European forests increasingly combine declining soil moisture with rising atmospheric demand, raising fundamental questions about how trees sustain transpiration while avoiding embolism-induced mortality under drought stress. While stomatal regulation and transpiration responses are well documented, the role of upstream, within-tree water fluxes, particularly the use and replenishment of internal stem water storage, represent an emerging research frontier.

Here, we present high-temporal resolution observations of stem water storage use and rehydration dynamics in mature Pinus sylvestris, combining sap-flow and dendrometer measurements from the VPDrought experiment at the Pfynwald research platform in the dry inner-Alpine Rhône valley of Switzerland. By independently manipulating soil moisture and vapour pressure deficit (VPD), this experiment allows us to disentangle atmospheric and soil controls on internal tree water fluxes.

We show that under drought, trees increasingly “run on savings”: the contribution of stem water storage to daily transpiration rises sharply from approximately ~5% under well-watered soil conditions to up to ~40% under dry soil conditions, when transpiration declines but storage water use persists. In parallel, the replenishment of stem storage-water reserves through water flow into the stem declines with decreasing soil water potential. Notably, even under mild soil drought, elevated VPD substantially constrains nighttime rehydration of stem storage-water reserves.

The findings we present emphasize stem water storage as a dynamic and drought-responsive component of tree-water use. Accounting for both the mobilization and rehydration of internal water reserves is essential for understanding how trees buffer hydraulic stress during drought and enhance model representations of plant-water interactions under increasingly frequent hotter droughts.

How to cite: Peters, R. L., Buras, A., Grichting, S. A., Schaub, M., Grossiord, C., Bortolami, G., Gisler, J., Trotsiuk, V., Gessler, A., Meusburger, K., Hunziker, S., Kahmen, A., Rigling, A., Walthert, L., Klesse, S., and Zweifel, R.: When trees run on savings: Stem water storage and rehydration as a missing link in drought responses, EGU General Assembly 2026, Vienna, Austria, 3–8 May 2026, EGU26-6862, https://doi.org/10.5194/egusphere-egu26-6862, 2026.

EGU26-6941 | ECS | Posters on site | BG3.42

Quantification of Total Available Water in French temperate and mediterranean forests by three different methods. 

Maïa Grasset, Jean-Marc Limousin, Jean Kempf, Emilie Joetzjer, Mathias Cuntz, Pascal Courtois, Alwin Naiken, Guillaume Simioni, Olivier Marloie, Daniel Bervillier, Charlotte Girardin, Alexandre Morfin, and Nicolas Delpierre

During drought periods, the survival of trees and forest ecosystems strongly depends on soil water reserves. Isotopic studies show that during droughts, trees can use deep soil water resources (Carrière et al, 2020). However, the quantification of accessible water reserves to trees has so far mostly considered surface layers. A quantification of deep water resources accessible to and used by trees is missing.

In this work, we considered the total amount of water trees can access and use, defined as “TAW” (Total Available Water). TAW includes both root access to water and the ability of trees to take up this water. Our objective was to quantify TAW and to analyse its variability across four French forest sites: two temperate sites (Barbeau and Hesse), dominated respectively by Sessile Oak with Hornbeam and by Beech, and two Mediterranean sites (Puéchabon and Font-Blanche), dominated respectively by Holm oak and Aleppo Pine.

We used complementary approaches to quantify TAW: (i) the application of pedotransfer functions (Szabó et al., 2021) on soil core analyses; (ii) the analysis of soil moisture profiles obtained from sensors installed at different depths (Maysonnave et al. 2022) ; and (iii) the calculation of cumulative water deficit based on evapotranspiration measurements from flux towers (Giardina et al., 2023).

Our results show that TAW is higher in temperate forests than in Mediterranean forests. This difference is strongly linked to soil depth and to the proportion of stones in the soil. Other factors also play a role, especially the leaf water potential at the wilting point, which is lower in Mediterranean forest species. This allows these species to absorb water more efficiently during drought and increases their effective water availability. A strong intra-site variability of TAW was also observed, with coefficient of variation ranging from 8% to 60% depending on the site (for method (iii)).

Each of the three methods used in this work has its own limitations for estimating TAW. By using a combination of these three methods, we obtained complementary information and a more robust estimation of TAW and deep water reserves accessible to trees at the study sites. These approaches can contribute to mapping soil water stocks in France and to modelling the future of forests under climate change.

How to cite: Grasset, M., Limousin, J.-M., Kempf, J., Joetzjer, E., Cuntz, M., Courtois, P., Naiken, A., Simioni, G., Marloie, O., Bervillier, D., Girardin, C., Morfin, A., and Delpierre, N.: Quantification of Total Available Water in French temperate and mediterranean forests by three different methods., EGU General Assembly 2026, Vienna, Austria, 3–8 May 2026, EGU26-6941, https://doi.org/10.5194/egusphere-egu26-6941, 2026.

EGU26-7149 | ECS | Posters on site | BG3.42

Multi-scale Responses of Tree Growth to Climate Change and Their Hydraulic Mechanisms in Semi-Arid to Semi-Humid Regions of Northern China 

Yiran Liu, Xiuchen Wu, Pei Wang, Renjie Guo, Zifan Zhang, Wenyang Cao, Jiayin Liu, and Yuan Yuan

The semi-arid to semi-humid transition zone in northern China exhibits strong interannual climate variability and frequent drought events, making it a critical ecological transition zone where tree growth is highly sensitive to drought stress. Analysis of long-term climate records from multiple sites indicates that annual precipitation in the study area has shown a significant decline over recent decades, accompanied by a marked decrease in the regional average SPEI. As annual mean temperature and vapor pressure deficit (VPD) increase, the vessel diameter and hydraulically weighted diameter of non-porous wood species have significantly decreased. This indicates that under intensified atmospheric drought conditions, non-porous wood species become more sensitive to climatic stress through adjustments in their hydraulic structure. Tree growth exhibits the most pronounced response to medium-to-long-term drought signals. Notably, SPEI12 during the growing season shows a significant positive correlation with RWI, indicating that water deficit has become the dominant climatic factor limiting tree growth in the study area. Sliding correlation analysis further reveals that tree growth sensitivity to drought-related factors such as VPD, temperature, and solar radiation significantly increases within specific interannual time windows, highlighting the time-nonstationarity of the climate-growth relationship. At the regional scale, tree radial growth exhibited widespread negative anomalies during drought periods, with growth declines exceeding 10% in some years. This aligns with signals of reduced vegetation productivity, indicating that drought stress impacts on growth extend from the individual to the regional scale. Further analysis of growth variability revealed that the coefficient of variation in tree growth significantly decreased in the semi-humid zone, while no significant trend was observed in the semi-arid zone. This indicates that the modulating effect of inter-individual resource competition on growth heterogeneity under drought conditions exhibits significant regional differences. In summary, this study reveals the mechanisms by which climatic drought stress, hydraulic restructuring, and biological interactions jointly drive tree growth changes in the semi-arid-semi-humid transition zone, providing multi-scale evidence for understanding the responses of transitional forest ecosystems under intensifying drought conditions.

How to cite: Liu, Y., Wu, X., Wang, P., Guo, R., Zhang, Z., Cao, W., Liu, J., and Yuan, Y.: Multi-scale Responses of Tree Growth to Climate Change and Their Hydraulic Mechanisms in Semi-Arid to Semi-Humid Regions of Northern China, EGU General Assembly 2026, Vienna, Austria, 3–8 May 2026, EGU26-7149, https://doi.org/10.5194/egusphere-egu26-7149, 2026.

EGU26-8726 | ECS | Orals | BG3.42

Estimating the stomatal slope (g1) parameter from the Medlyn model across Australian vegetation using multiple observational datasets 

Riyadh Al-Naseri, Belinda Medlyn, Clare Stephens, Siyuan Tian, Laura Williams, and Valentina Marchionni

Stomatal conductance plays a key role in the exchange of carbon and water between vegetation and the atmosphere, by controlling photosynthesis and transpiration in plants. However, its representation in land surface models (LSMs) is still considered a major source of uncertainty. The Medlyn model is widely used in LSMs to describe how strongly stomata and the model parameter g1 respond to carbon uptake and atmospheric dryness. This parameter is often introduced as a fixed value in global LSMs for broad vegetation types despite evidence that stomatal behaviour varies with plant water availability, particularly in water limited ecosystems such as those found in large parts of Australia.

We estimated g1 for Australian vegetation using observational data obtained from three intrinsic water use efficiency techniques: leaf gas exchange, stable carbon isotope discrimination, and eddy covariance. These approaches together can provide a comprehensive knowledge on the estimation of g1 across a range of spatial and temporal scales, from leaf to ecosystem and from short to long term responses. To account for water stress, we relate g1 to soil moisture for both leaf-scale gas exchange and eddy covariance datasets, where direct plant water status measurements are rarely available. For the stable isotope dataset, water stress is represented using an aridity index that reflects longer-term water limitation experienced by plants over the period of carbon assimilation.

We compared g1 estimates from these datasets along with soil moisture data to observe the shifts in the sensitivity of stomata under dry conditions and to determine consistency between scales. We found that g1 varied systematically across Australian plant functional types (PFTs), with lower values in xeric shrubs and C4 grasses and higher values in savanna and rainforest trees. Relative differences among PFTs were consistent across methods, but isotope-derived g1 values were generally higher than leaf gas exchange estimates. Eddy covariance data from Australian flux-tower sites showed a clear increasing trend in g1 with increasing soil moisture, and isotope-derived g1 decreased with increasing aridity, indicating more conservative stomatal behaviour under dry conditions.

These findings will be used to generate representative values of g1 for Australian PFTs that can be implemented in land surface models (e.g., The Joint UK Land Environment Simulator JULES) for evaluation at flux-tower sites and the continental scale.

How to cite: Al-Naseri, R., Medlyn, B., Stephens, C., Tian, S., Williams, L., and Marchionni, V.: Estimating the stomatal slope (g1) parameter from the Medlyn model across Australian vegetation using multiple observational datasets, EGU General Assembly 2026, Vienna, Austria, 3–8 May 2026, EGU26-8726, https://doi.org/10.5194/egusphere-egu26-8726, 2026.

EGU26-9312 | ECS | Posters on site | BG3.42

Simulating Sub-daily Forest Backscatter to track Water, Carbon and Health in Forested Ecosystems 

Anna Selina Neyer, Nathan Van Der Borght, Emma Tronquo, Paulina Świątek, Arturo Villarroya Carpio, Leila Guerriero, and Susan Steele-Dunne

The resilience of terrestrial ecosystems to drought and environmental stress is critical for the future of the terrestrial carbon balance. Vegetation water dynamics play a central role in these ecosystems, as they are closely coupled to carbon assimilation at the plant stomata. Sub-daily variations in plant water status are expected to reflect both abiotic and biotic stress responses. Improving our understanding of these short-term dynamics could enable us to detect early signs of vegetation health decline and provide new metrics to quantify ecosystem resilience and tipping points.

However, sub-daily vegetation water content (VWC) dynamics remain poorly understood and are weakly represented in terrestrial biosphere models. This knowledge gap is largely driven by the scarcity of sub-daily observations, as VWC is difficult to measure both in-situ and via satellite remote sensing. To address this observation gap, the SLAINTE mission concept was proposed as one of ESA’s New Earth Observation Mission Ideas in response to the 12th Call for Earth Explorers. The goal of the mission was to capture sub-daily variations in vegetation water storage, including vegetation optical depth, VWC, plant water potential, and surface soil moisture.

A critical aspect of the continued development of this mission concept is consolidation of the observation and measurement requirements. Therefore, this study focuses on simulating sub-daily time series of forest radar backscatter using a radiative transfer (RT) model. The simulations are driven by continuous, non-destructive ground-based measurements of forest transmissivity collected at several forested sites across Europe. The resulting synthetic backscatter time series allows us to characterize and quantify the influence of sub-daily variations in plant water dynamics, vegetation structure, and biogeophysical properties on the radar backscattering coefficient.

We present initial results from simulations at two forest sites and discuss their implications for strengthening the science case of the SLAINTE mission. We also highlight key limitations encountered during the modeling effort. These include the high sensitivity of RT simulations to forest structural parameters and the limited availability of sub-daily validation data. Accurate model parameterization requires detailed information on forest geometry (such as foliage density), which is difficult to obtain even by field measurements. We attempt to quantify forest architecture using terrestrial laser scanning. Validation remains challenging due to limited availability of sub-daily observations of VWC, vegetation dielectric properties, and radar backscatter, particularly when interpreting short-term fluctuations. Additionally, separating the effects of internal vegetation water dynamics from surface canopy water associated with interception and precipitation remains a significant challenge at sub-daily timescales. Addressing these issues will require continued interdisciplinary collaboration combining field observations, modeling and remote sensing.

How to cite: Neyer, A. S., Van Der Borght, N., Tronquo, E., Świątek, P., Villarroya Carpio, A., Guerriero, L., and Steele-Dunne, S.: Simulating Sub-daily Forest Backscatter to track Water, Carbon and Health in Forested Ecosystems, EGU General Assembly 2026, Vienna, Austria, 3–8 May 2026, EGU26-9312, https://doi.org/10.5194/egusphere-egu26-9312, 2026.

EGU26-10913 | ECS | Orals | BG3.42

Contrasting belowground strategies between maize and sunflower to adapt to soil texture 

Mohanned Abdalla, Alexander Christmann, Michael Gigl, Corinna Dawid, and Mutez Ahmed

Plant adaptive traits that regulate water transport from soil to leaf are essential for maintaining gas exchange and productivity, especially under drought conditions. Yet, how such traits respond to contrasting soil textures remains unclear. Here we grow maize (Zea mays) and sunflower (Helianthus annuus) in contrasting soil textures, namely, sand and loam. We measured transpiration rate, soil-plant hydraulic conductance and abscisic acid (ABA) concentration during soil drying. At the end of the experiment, root systems were extracted, scanned and analyzed for morphological traits. We showed that, during soil drying, maize and sunflower adopt distinct root strategies to regulate root water influx under two contrasting soil textures (sand vs. loam). In sand, maize increased root diameter by 60% without altering root length, while sunflower increased root length by threefold compared to loam. These changes moderate the flux of water into root per unit surface area, buffering soil–plant hydraulics across soil textures. Interestingly, ABA concentration decreased with increasing root length in sunflower, with higher levels in loam (shorter roots) and lower levels in sand (longer roots), whereas maize showed no substantial variation in ABA levels between soil textures. Notably sunflower exhibited three times higher transpiration, highlighting the need to adapt to soil hydraulic limitations, particularly in sand, where hydraulic conductivity declines steeply upon drying. These observed species-specific patterns underscore that root trait plasticity might be complemented by hormonal regulation of stomatal conductance in maintaining water balance under soil drying. Taken together, our findings demonstrate that contrasting root morphological adjustments can achieve functional vantage maintaining plant water balance across soil textures, highlighting the importance of root plasticity for coping with edaphic drought.

How to cite: Abdalla, M., Christmann, A., Gigl, M., Dawid, C., and Ahmed, M.: Contrasting belowground strategies between maize and sunflower to adapt to soil texture, EGU General Assembly 2026, Vienna, Austria, 3–8 May 2026, EGU26-10913, https://doi.org/10.5194/egusphere-egu26-10913, 2026.

Soil water availability is a critical factor for plant transpiration and photosynthesis. As soils dry, their hydraulic conductivity declines, limiting water supply to the roots and ultimately constraining the whole water flow through the soil–plant-atmosphere continuum. To investigate where and when this limitation arises, we combined several experiments across scales and degrees of complexity.

Neutron radiography, a non-invasive technique that directly visualizes water distribution in soils, applied to young maize plants revealed sharp water potential gradients forming in the rhizosphere during drying, showing local depletion around roots. These rhizosphere-scale dynamics are tightly coupled to reductions in transpiration. The onset and severity of this hydraulic bottleneck depend strongly on soil texture: in sandy soils, weak capillary forces lead to early hydraulic breakdown at comparatively high water potentials (relatively wet conditions), whereas loamy soils sustain water supply over a wider drying range.

Plants can transiently buffer this process through the release of extracellular polymeric substances that enhance root–soil contact and displace depletion zones away from the root surface. However, this buffering delays rather than eliminates hydraulic disconnection. Analogous thresholds are observed in trees under field conditions, where individuals growing in sandy soils close stomata at higher soil and leaf water potentials than those in finer-textured soils.

Together, these converging observations point to universal, texture-dependent thresholds controlled by rhizosphere processes. By linking pore-scale hydraulics to whole-plant responses, this work positions the rhizosphere as a central regulator of plant water use and a key, yet often overlooked, determinant of ecosystem drought sensitivity.

How to cite: Di Bert, S.: Where Does Drought Begin? Linking Rhizosphere Processes and Forest Hydrology, EGU General Assembly 2026, Vienna, Austria, 3–8 May 2026, EGU26-12573, https://doi.org/10.5194/egusphere-egu26-12573, 2026.

The importance of water and its limitations for the functioning of plants and terrestrial ecosystems have long been studied. However, science sometimes hinders its own progress by the negligence of significant findings from earlier periods.

One example is the pioneering work of W.R. Gardner (1960+), who made significant contributions to our current knowledge on limitations to plant water use. Gardner’s early work focused on the dynamic (un)availability of soil water at the small scale, which is caused by the distinct decrease in soil hydraulic conductivity around the water-absorbing roots during transpiration.

Since then, however, this soil-specific dynamic limitation through soil hydraulic conductivity has often been neglected. While this is well justified at times, for example when focusing on seasonal rather than daily drought conditions, we argue that these Gardner-like limitations to plant water use at the small scale should not be ignored, even if observations are made at much larger scales (e.g. using Eddy-Covariance or remote sensing) than where plant roots take up water.

This is particularly relevant as drought research has become more interdisciplinary. While originally a challenge for agriculture-related soil physics (e.g., W.R. Gardner and D. Hillel), plant and ecosystem water limitations have increasingly been addressed by other disciplines, such as plant hydraulics and climate science, at larger scales. Our recent work reinforces the idea that small-scale soil hydraulic conductivity limitations can be important at larger scales in a soil- and plant-specific manner.

We believe that the field of water limitation research exemplifies not only the pitfalls of generating scientific knowledge, but above all the great potential of interdisciplinary research initiatives.

How to cite: Wankmüller, F.: From W.R. Gardner to the present day: How research on water (un)availability to plants sometimes hindered its own progress, EGU General Assembly 2026, Vienna, Austria, 3–8 May 2026, EGU26-14305, https://doi.org/10.5194/egusphere-egu26-14305, 2026.

EGU26-14357 | Posters on site | BG3.42

Impact of Drought on Forest Biosphere-Atmosphere Interactions 

Sebastian Wolf, Eugénie Paul-Limoges, Pascal Unverricht, and Andrea Carminati

Drought stress in forests has been increasing with climate warming, both through reduced soil water availability and increased atmospheric water demand (vapor pressure deficit). The consequences are enhancing (i.e. positive) temperature feedbacks, increased tree mortality and shifts in species composition. This is concerning because forests contribute to mitigate excessive surface temperatures and increases in atmospheric CO2 concentrations. While drought stress-related declines in photosynthesis are well established, important questions remain regarding (i) changes in respiration, (ii) compensating effects of understory vegetation, (iii) attenuating (i.e. negative) forest-atmosphere feedbacks, and (iv) small-scale processes (i.e. at soil, leaf or tree-level) that also emerge at the ecosystem scale (Wankmüller et al. 2024).

Here we present an overview on the current knowledge of drought impacts on forest biosphere-atmosphere interactions (Wolf & Paul-Limoges 2023), recent evidence for the potential of understory (i.e. below-canopy) eddy-covariance flux measurements (Wolf et al. 2024), and the results of an ongoing drought manipulation experiment using paired (i.e. drought-stressed and irrigated) eddy-covariance flux towers to measure understory biosphere-atmosphere interactions at the Pfynwald forest in Switzerland.  

Finally, we will discuss the challenges and perspectives for scaling fluxes of carbon, water and energy from tree to ecosystem scale using a combination of established and novel in situ measurements.


References

Wolf S & Paul-Limoges E (2023) Drought and heat reduce forest carbon uptake. Nature Communications 14: 6217 (https://doi.org/10.1038/s41467-023-41854-x)

Wolf S, Paul-Limoges E, Sayler D, Kirchner JW (2024) Dynamics of evapotranspiration from concurrent above- and below-canopy flux measurements in a montane Sierra Nevada forest. Agricultural and Forest Meteorology 346: 109864 (https://doi.org/10.1016/j.agrformet.2023.109864)

Wankmüller FJP, Delval L, Lehmann P, Baur MJ, Cecere A, Wolf S, Or D, Javaux M, Carminati A (2024) Global influence of soil texture on ecosystem water limitation. Nature 635(8039): 631–638 (https://doi.org/10.1038/s41586-024-08089-2)

How to cite: Wolf, S., Paul-Limoges, E., Unverricht, P., and Carminati, A.: Impact of Drought on Forest Biosphere-Atmosphere Interactions, EGU General Assembly 2026, Vienna, Austria, 3–8 May 2026, EGU26-14357, https://doi.org/10.5194/egusphere-egu26-14357, 2026.

EGU26-14888 | ECS | Posters on site | BG3.42

Limited evidence for provenancing in two co-occurring species with contrasting drought strategies 

Rhys Browning and Stefan Arndt

There is concern about an increase in drought induced dieback in forests as the climate becomes warmer and drier. In response, land holders are looking to new strategies in the restoration of forests. One such approach is provenancing; importing genotypes from seperate populations that may be adapted to different climates. However, in many cases, populations are facing similar pressures, and there may not be a population from a significantly ‘drier and hotter’ region. In these circumstances, provenancing may be reliant on disjunct populations that face similar climatic pressures having different adaptations to hot and dry climates. We tested drought responses, traits and strategies in provenances of two Eucalyptus species, E. melliodora and E. microcarpa, from the drier ranges of their respective distributions. The species co-occur in woodland communities in south eastern Australia, but E. microcarpa extends into regions that are drier and hotter. We measured a) chronic drought responses in a 17 week drought experiment of provenances planted in-ground in a rain exclusion shelter, b) transpiration responses to acute drought in a glasshouse experiment, and c) growth and seasonal water relations in a common garden field experiment. Both species had high within-provenance intraspecific variation in many drought traits, but similar adaptations to drought between provenances. The two species, despite co-occurring, had contrasting drought strategies. E. melliodora had a drought avoidant strategy, with much greater allocation of biomass to root growth and highly sensitive stomata. The comparatively greater root growth resulted in successfully avoiding drought and having comparatively better growth outcomes in the chronic drought experiment. In contrast, E. micropcarpa was much more drought tolerant and had greater hydraulic function at greater water deficits during acute drought. However, both species had almost identical growth outcomes over a five year period when planted in a provenance trial in the field. Despite the two species co-occurring and coming from the same section (Adnataria) within the Eucalyptus genus, they had significantly contrasting drought strategies. Therefore, understanding a species’ drought strategy may be important when considering which traits may confer an adaptive advantage to drought.

How to cite: Browning, R. and Arndt, S.: Limited evidence for provenancing in two co-occurring species with contrasting drought strategies, EGU General Assembly 2026, Vienna, Austria, 3–8 May 2026, EGU26-14888, https://doi.org/10.5194/egusphere-egu26-14888, 2026.

EGU26-17832 | ECS | Posters on site | BG3.42

Global spatial dependence of vegetation recovery from meteorological drought impacts 

Steye Verhoeve, Sandra Hauswirth, Steven de Jong, and Niko Wanders

In the 21st century droughts have become more frequent, have shown an increased duration, a greater spatial extent and are increasingly exacerbated by human water demands. Understanding the impacts of droughts on vegetation dynamics, the legacy effects and especially the recovery are essential aspects to understand the prolonged effects that meteorological droughts can have on ecosystems.

This research looks at the spatial dependence of vegetation recovery after a meteorological drought, i.e. the extent to which events co-occur at multiple locations simultaneously, explaining underlying mechanisms and patterns which could potentially support recovery forecasting in the future. To understand the spatial dependence of vegetation recovery we characterized spatiotemporal dynamics of vegetation recovery with the use event synchronization and complex networks and identified hydroclimatic and geophysical predictors of this behaviour using remote sensing and ERA5 reanalysis data.

We found that there are strong global patterns in vegetation drought synchronization, which was specicially high in Australia and southern Africa, and low in large parts of Africa and east Asia. Overall, the biggest drivers of differences in spatial dependence are temperature, aridity and precipitation variability. On a global scale high dependence is mainly occurring in regions experiencing large-scale spatially connected droughts, mostly related to strong climate signals like ENSO. Areas with a low spatial dependence are characterized by a high natural water availability, resulting in more local and vegetation type-specific resilience to drought.

Our work indicates a diverse set of features driving ecological drought occurrence, synchronization and recovery. These findings could be a useful tool to use in forecasting ecological drought response to ongoing meteorological droughts.

How to cite: Verhoeve, S., Hauswirth, S., de Jong, S., and Wanders, N.: Global spatial dependence of vegetation recovery from meteorological drought impacts, EGU General Assembly 2026, Vienna, Austria, 3–8 May 2026, EGU26-17832, https://doi.org/10.5194/egusphere-egu26-17832, 2026.

EGU26-18010 | Orals | BG3.42

Improving model robustness to drought stress by constraining plant hydraulics with complementary in situ measurements 

Phillip Papastefanou, Laura Donfack, Anne Klosterhalfen, Alexander Knohl, Ruth-Kristina Magh, Sharath Shyamappa Paligi, Manon Sabot, Konstantin Schellenberg, and Sönke Zaehle

Droughts threaten ecosystems worldwide and are projected to occur more frequently and with greater intensity in the future. Accurately projecting ecosystem responses to these climate extremes relies on vegetation models. While process-based models are evolving fast and many models now represent plant hydraulic processes, including these mechanisms often comes at the cost of an increase in the number of difficult-to-constraint model parameters. Concurrently, recent experimental advances open a new avenue for parameter constraining, by providing high-temporal resolution data on plant hydraulic variables, for example continuous in situ measurements of water potential and sap flux. However, much of this novel data has not yet been considered by vegetation models.

Here, we utilize a rare, comprehensive time-series of data obtained in the Hainich experimental forest, specifically high-temporal resolution datasets of (1) sap flux, (2) stem water potential, (3) Net Ecosystem Exchange (NEE), and (4) Evapotranspiration (ET). With this data spanning both the water and carbon axes of plant function, we constrain the terrestrial biosphere model QUINCY and the latest development of its plant hydraulic architecture. We find that integrating such complementary experimental data yields three key outcomes. First, it evaluates the physical representation of plant hydraulic theory within the model. Second, it results in tighter constraints on plant-hydraulic parameters. High-temporal resolution water potential and sap flow data are vital here, as they resolve the diurnal lags necessary to identify capacitance parameters that remain unidentifiable under daily or weekly sampling. By capturing these fast-response dynamics, the model not only narrows parameter uncertainty but also reveals critical functional interdependencies and correlations that define plant hydraulic strategy. Third, these constraints yield more robust projections by significantly reducing the variability in simulated stocks and fluxes under future climate scenarios. We conclude that the growing availability of continuous data from novel physiological sensors is essential to constrain and build trust in increasingly complex vegetation models, as demonstrated here for plant hydraulics.

How to cite: Papastefanou, P., Donfack, L., Klosterhalfen, A., Knohl, A., Magh, R.-K., Paligi, S. S., Sabot, M., Schellenberg, K., and Zaehle, S.: Improving model robustness to drought stress by constraining plant hydraulics with complementary in situ measurements, EGU General Assembly 2026, Vienna, Austria, 3–8 May 2026, EGU26-18010, https://doi.org/10.5194/egusphere-egu26-18010, 2026.

EGU26-18662 | Posters on site | BG3.42

Quantifying the limiting role of soil hydraulic conductance on plant water relations during drought 

Daan Carlo Piovano, Ibrahim Bourbia, Sara di Bert, Andrea Carminati, and Tim Brodribb

Soil hydraulic properties regulate water movement from the soil to the leaves and thus impact plant hydraulic functions. Water moves along a pressure gradient that allows the plant to take up water from the soil. As vapor pressure deficit increases and soil water becomes scarce, tension rises in the plant vascular system and leaves progressively lose turgidity. Although the decline in both soil and plant hydraulic conductance has been extensively studied, it is under debate the sequence of the declines in hydraulic conductance along the soil-plant continuum. Precisely it is not clear whether it is the soil that loses its capacity to transport water to plants fast enough, triggering stomatal closure before substantial decline in any plant tissue conductance. Here, we propose a method to quantify and compare the soil and plant hydraulic conductance in plants undergoing soil drying. We studied wheat (T. Aestivum) grown in two contrasting soil textures and subjected to a drought treatment. We targeted conditions when water started to be limiting but before excessive soil drying – i.e. when transpiration was about half of its maximum. Together with novel rehydration techniques and high temporal resolution water potential measurements, we quantified and isolated the various compartments within the soil-plant system. Our results show that the soil hydraulic conductance in the coarser soil limits the total hydraulic conductance of the whole system at less negative soil water potentials. Although less limiting to water movement when fully wet, a coarse soil proves to be much more limiting as soon as it starts drying. These results highlight the central role of understanding soil-specific properties when evaluating plant drought resilience.

How to cite: Piovano, D. C., Bourbia, I., di Bert, S., Carminati, A., and Brodribb, T.: Quantifying the limiting role of soil hydraulic conductance on plant water relations during drought, EGU General Assembly 2026, Vienna, Austria, 3–8 May 2026, EGU26-18662, https://doi.org/10.5194/egusphere-egu26-18662, 2026.

EGU26-19717 | ECS | Posters on site | BG3.42

Temporal dynamics of stress signal propagation across ecosystem scales during a hot and dry period: A multi-sensor analysis 

Luis Kremer, Simon Haberstroh, Markus Sulzer, Konstantin Schellenberg, Victoria Stanley, Benjamin Brede, Andreas Christen, Christiane Werner, and Teja Kattenborn

Stress signals propagate through ecosystems via interactions between atmospheric aridity and soil water depletion, resulting in physiological stress in plants, altered structural dynamics, and changes in carbon, energy, and water fluxes. Monitoring these impacts is possible using a growing suite of established and novel sensor systems. Available approaches span tree-level measurements such as stem water potential, stand-scale fluxes derived from eddy-covariance towers, and spatially continuous indicators from Earth observation satellites using optical and radar backscatter. Yet, the degree to which such measurements track complementary stress processes, and the extent to which their responses are temporally coupled, remain poorly quantified.

We address this gap through a multi-scale analysis of a distinct hot and dry period in August 2025 (August 7–19) at the temperate forest of the ICOS-associated Forest Research Site DE-Har (Hartheim, Germany), which is characterized by limited soil water storage and rapid soil drying. Using distributed sensors, we tracked the propagation of stress signals across five interacting levels. These include (1) atmospheric demand (vapour pressure deficit, air temperature), (2) soil water status (volumetric water content), (3) plant hydraulics (stem water potential, tree water deficit, sap flow), (4) canopy structure and leaf properties (leaf angle distribution via AngleCam, GNSS-T based vegetation optical depth, plant area index from permanent terrestrial laser scanning, leaf area index from hemispherical photographs, vegetation greenness, Sentinel-1 radar backscatter, Sentinel-2 optical indices), and (5) ecosystem fluxes (net ecosystem exchange, gross primary productivity, evapotranspiration).

Using cross-correlation and lag analysis at daily resolution from May to October 2025, we quantify the temporal sequence in which these measurements respond to the hot and dry period in August 2025. We determine whether certain variables act as leading indicators and to what extent time-lags emerge as stress signals propagate from the atmosphere to ecosystem fluxes. This integrated perspective can reveal which measurements track similar aspects of stress and which provide complementary information that would be missed by any single approach alone. Moreover, this analysis emphasises the potential of novel, scalable sensor techniques such as tracking leaf angle dynamics from video cameras (AngleCam) and GNSS-T-based vegetation optical depth.

Our outcomes provide a temporally resolved view of stress signal propagation in a drought-impacted temperate forest ecosystem, which can inform ecosystem modelling and the design of multi-sensor monitoring networks.

How to cite: Kremer, L., Haberstroh, S., Sulzer, M., Schellenberg, K., Stanley, V., Brede, B., Christen, A., Werner, C., and Kattenborn, T.: Temporal dynamics of stress signal propagation across ecosystem scales during a hot and dry period: A multi-sensor analysis, EGU General Assembly 2026, Vienna, Austria, 3–8 May 2026, EGU26-19717, https://doi.org/10.5194/egusphere-egu26-19717, 2026.

EGU26-20583 | ECS | Orals | BG3.42

Investigation of high resolution stem water potential in mature beech trees and relationships to water supply, demand and storage 

Jonas Humpert, Benjamin D. Hafner, Florian Wilms, Richard L. Peters, Thorsten E. E. Grams, and Mohsen Zare

Understanding of water transport within soil plant atmosphere continuum (SPAC) is essential for predicting tree functioning under changing environmental conditions. Xylem water potential (Ψxylem) reflects the energy state of water in plants, yet continuous monitoring has long been technically challenging, limiting insights into tree response to drivers such as vapor pressure deficit (VPD), soil water availability, and stem water storage. In a throughfall exclusion experiment (KROOF site, Germany) we continuously measured water fluxes and Ψxylem in mature beech trees along the entire SPAC. Our objectives were to quantify influence of soil water potential (Ψsoil), stem water storage and VPD on tree water uptake and Ψxylem over diurnal cycles, and to test whether stem water storage predicts the hysteresis relationship between Ψxylem and sapflow (J).  We installed soil water potential and water content sensors in four different soil depths and took soil samples for natural abundance δ2H and δ18O isotopes to assess water uptake depths. Xylem water potential was measured continuously with microtensiometers (FloraPulse) at breast height and at the lower end of the crown, where we also installed sapflow sensors and point-dendrometers. We used 24 XGBoost models, separated by hour and calculated SHAP values to provide information about the importance of soil water potential, stem water storage and VPD on Ψxylem generally and over a diurnal cycle. We determined stem water storage using detrended (daily centered) and scaled dendrometer data (SDV) and calculated a mixed model to investigate its relationship of min and max Ψxylem values combined with Ψsoil. Finally, we computed XGBoost models to predict Ψxylem hysteresis with J, J + SDV as well as J + SDV + Ψsoil. Our models show a strong impact of SDV and VPD on Ψxylem while the impact of Ψsoil was marginal.  Water uptake occurred mainly from upper soil layers (0-30 cm depth) but Ψsoil of depth 30 and 50 showed the largest impact on Ψxylem. Diurnally SDV and VPD had the biggest impact, while there was no shift in importance of different soil depths on Ψxylem. We observed a linear relationship between min and max Ψxylem and SDV. At breast height, we found a significant interaction with Ψsoil, while this was not observed in the lower crown. Sapflow as a single predictor for Ψxylem showed a direct relationship while SDV in addition was able to predict the daily hysteresis of Ψxylem. Water uptake was only weakly depended on Ψsoil, possibly because the observed trees were not limited by water supply. SDV, which can be seen as a proxy for stem water storage, seemed to be a main factor predicting Ψxylem. The influence of Ψsoil on SDV at breast height and its absence in the lower crown could show that storage status may vary within the tree. SDV, in addition to sapflow, is able to provide a second axis of information to also predict hysteresis curves between daily extremes.

How to cite: Humpert, J., Hafner, B. D., Wilms, F., Peters, R. L., Grams, T. E. E., and Zare, M.: Investigation of high resolution stem water potential in mature beech trees and relationships to water supply, demand and storage, EGU General Assembly 2026, Vienna, Austria, 3–8 May 2026, EGU26-20583, https://doi.org/10.5194/egusphere-egu26-20583, 2026.

EGU26-21061 | ECS | Orals | BG3.42

Characterizing plant hydraulic behaviour under drought stress using vegetation modelling  

Zeyu Duanmu, Phillip Papastefanou, Manon Sabot, Anke Hildebrandt, Ruth Magh, Simon Haberstroh, Christiane Werner, Jacob Nelson, and Sönke Zaehle

Droughts have emerged as the primary driver of forest disturbances across Europe in the 21st century, significantly impacting both tree growth dynamics and mortality rates. Tree species are differently affected under drought, and these differences are related to species-specific plant hydraulic traits that govern water storage, hydraulic conductivity, and stomatal regulation. However, quantifying variability in these hydraulic traits across sites, species, and time remains challenging, as site measurements have historically rarely been comprehensive enough to assess the evolution of plant hydraulic behavior under drought stress. New continuous, high temporal resolution observational plant hydraulic data paired with process-based plant hydraulic modelling opens an opportunity to address this gap, by providing a framework to test and quantify theories based on first principles across species and sites.

In this study, we apply the terrestrial biosphere model QUINCY, augmented by a recently developed plant hydraulic architecture module, across three eddy covariance sites in Germany covering broadleaved forest species (Aplern, Hainich, and Hartheim). The model is parameterized for three common temperate tree species present at the aforementioned sites. We constrain QUINCY across these species and sites using 30-minute resolution stem water potential measurements collected during the summer and autumn of 2023. Our results show that two groups of model parameters explain most of the simulated plant water potentials: parameters controlling plant water uptake from soil (plant ability to extract water from soil and the root distribution), and parameters regulating stomatal sensitivity to pre-dawn leaf water potential. Across species, we find ash to be more drought resistant than beech and hornbeam, as it closes its stomata earlier than other species under similar levels of drought stress, and it is characterised by a higher hydraulic capacitance per unit stem volume. Our study demonstrates how integrating the new generation of in situ plant hydraulic observations into vegetation models can facilitate the quantification of species-specific hydraulic parameters, effectively reducing uncertainty in, and providing robust constraints on, modelled responses to drought.

How to cite: Duanmu, Z., Papastefanou, P., Sabot, M., Hildebrandt, A., Magh, R., Haberstroh, S., Werner, C., Nelson, J., and Zaehle, S.: Characterizing plant hydraulic behaviour under drought stress using vegetation modelling , EGU General Assembly 2026, Vienna, Austria, 3–8 May 2026, EGU26-21061, https://doi.org/10.5194/egusphere-egu26-21061, 2026.

EGU26-22511 | ECS | Orals | BG3.42

Ground‑Truthing Remote Sensing of Peatland Vegetation Under Heat and Drought Stress 

Anna Geldbach Jones, Jessica Royles, and Johannes Kromdijk

Protecting and restoring peatlands requires quantitative measures of ecosystem health, function, and resilience, across vast, remote areas and long time periods. Peatlands are experiencing higher temperatures and more extreme patterns of rainfall, making monitoring their vegetation health increasingly urgent. Remote sensing provides a uniquely scalable tool for monitoring peatland health and restoration at national scales, but to unlock its full potential we must understand the biological processes behind the wealth of data.
We address this challenge through controlled ground-truthing experiments that investigate how heat and water stress affect the thermal, reflectance, and fluorescence signals of peatland vegetation over time. By integrating physiological measurements with optical remote sensing and emerging high‑resolution thermal imaging technologies, we aim to establish mechanistic links between peatland vegetation stress responses and remotely sensed signals.This project focuses on the Sphagnum genus, a keystone genus in peatland formation and persistence. Understanding how thermal and optical signals across different Sphagnum species respond under heat and drought stress is critical for developing operational methods of remotely sensing peatland health in a changing climate.
By linking physiological responses to stress with combined thermal and optical remote sensing signals, our research will enhance our ability to harness Earth observation and machine learning advances to monitor, protect, and restore peatlands as critical ecosystems for climate mitigation.

How to cite: Geldbach Jones, A., Royles, J., and Kromdijk, J.: Ground‑Truthing Remote Sensing of Peatland Vegetation Under Heat and Drought Stress, EGU General Assembly 2026, Vienna, Austria, 3–8 May 2026, EGU26-22511, https://doi.org/10.5194/egusphere-egu26-22511, 2026.

EGU26-22728 | ECS | Posters on site | BG3.42

Connecting plant-water interactions across scales and disciplines 

Francesco Giardina, Janisse Deluigi, Stefano Martinetti, and Andrea Carminati and the Monte Verità Team

The increase in severity, frequency, and global footprint of droughts highlights the urgent need to improve our understanding of plant responses to changes in water availability. This requires better integration and synergy of knowledge from different scientific communities in the field of plant-water interactions, primarily: land-climate modelers, ecophysiologists, and soil hydrologists. Each community describes the soil–plant–atmosphere continuum using different primary variables, focusing on different spatial and temporal scales, invoking different key assumptions, and using different concepts and model structures. A separation between disciplines hinders exchange and thus limits scientific progress. If, on the other hand, dialogue can be established at these interfaces, then this methodological diversity could allow key processes such as stomatal and hydraulic regulation of plants, water storage below the surface and in vegetation, and material flows in the ecosystem to be brought together and deciphered holistically. 

In this presentation, we synthesize evidence from different angles and scales including leaf water status, soil moisture and ecosystem-scale observations to identify missing links and consistent thresholds that can connect plant-water relations across disciplines. 

How to cite: Giardina, F., Deluigi, J., Martinetti, S., and Carminati, A. and the Monte Verità Team: Connecting plant-water interactions across scales and disciplines, EGU General Assembly 2026, Vienna, Austria, 3–8 May 2026, EGU26-22728, https://doi.org/10.5194/egusphere-egu26-22728, 2026.

EGU26-2200 | ECS | Orals | BG3.43

Water dynamics of short-statured vegetation inferred from field versus satellite-scale microwave remote sensing 

Andrew Feldman, William Smith, Alexandra Konings, and Shawn Serbin

Monitoring plant water stress requires plant hydraulic measurements, such as measurements of water potential. However, such measurements are challenging to make at scales beyond single plants and over extended time periods. Observing plant water conditions across broad spatiotemporal scales is now enabled by passive microwave remote sensing. Specifically, vegetation optical depth (VOD) retrieved from satellite radiometers (SMAP, AMSR) provides a measure of vegetation water volume in the canopy at tens of kilometers. While satellite-based VOD has been used for a range of applications, rigorous validations of satellite VOD have not been carried out due to a need for labor intensive, widespread in-situ biomass and plant water potential measurements. A new method has enabled direct measurements of in-situ VOD, from Global Navigation Satellite Systems (GNSS). However, they have been less commonly used to evaluate shorter statured vegetation, which dominates most ecosystems. Here, we explore how satellite-based VOD from SMAP and AMSR-2 compare with field-based microwave observations from 272 GNSS-based interferometric reflectometry (GNSS-IR) sites located throughout the Western U.S as a part of the Plate Boundary Observatory (PBO) H20 network. These sensors use GNSS signals to estimate a normalized microwave reflectance index (NMRI), a proxy for VOD at a scale of tens of meters. We find that satellite VOD generally positively correlates with GNSS NMRI with correlations between 0.2 to 0.6 across sites, which is encouraging considering the vast differences in spatial scale (10s of meters for field sensors versus 10s of kilometers for the satellites). These correlations increase to 0.3 to 0.7 when evaluating sites in regions with low spatial vegetation type heterogeneity, low tree cover, and large seasonal vegetation dynamics. The correlations are higher for X-band VOD, likely related to our finding that both X-band VOD and NMRI are both more sensitive to seasonal vegetation variations relative to daily-scale responses than C-band and L-band VOD products are. These findings suggest that satellite VOD is capturing field-based GNSS signals, and therefore that these sensors are a critical (and arguably the only feasible) resource for calibrating and validating satellite VOD across spatial scales. 

How to cite: Feldman, A., Smith, W., Konings, A., and Serbin, S.: Water dynamics of short-statured vegetation inferred from field versus satellite-scale microwave remote sensing, EGU General Assembly 2026, Vienna, Austria, 3–8 May 2026, EGU26-2200, https://doi.org/10.5194/egusphere-egu26-2200, 2026.

Plants modify their functional traits in response to changing environmental conditions under climate change. However, it remains unclear whether tree planting alters patterns and acclimation of hydraulic traits across spatial scales. Here, we compiled a site-level dataset of hydraulic traits in natural (NF) and planted forests (PF) to examine trait patterns and relationships, quantified environmental and ecological drivers on ecosystem-scale hydraulic traits of PF and NF across China, and computationally projected future trait acclimation using the space-for-time approach. We identified distinct differences in hydraulic traits between NF and PF, with PF exhibiting higher hydraulic safety but lower hydraulic efficiency than NF at the species level. NF demonstrated a negative trade-off between hydraulic efficiency and safety, whereas PF exhibited a contrasting positive correlation between these traits. We confirmed that both environmental and ecological factors influence ecosystem-scale hydraulic traits in NF and PF, although dominant drivers vary among specific traits. Projections under future climate scenarios suggest that, despite persistent differences in trait acclimation between NF and PF, both forest types tend to exhibit increased water-use efficiency and enhanced drought resistance in response to rising precipitation and air dryness. These findings provide a valuable benchmark for estimating potential changes in hydraulic traits under climate change, supporting improved simulations of carbon and water fluxes in response to climate and anthropogenic influences.

How to cite: Bai, Y. and Hu, Y.: Climate-Driven Hydraulic Traits Shift in Natural and Planted Forests: Patterns, Drivers, and Future Acclimation, EGU General Assembly 2026, Vienna, Austria, 3–8 May 2026, EGU26-2664, https://doi.org/10.5194/egusphere-egu26-2664, 2026.

EGU26-3615 | ECS | Orals | BG3.43

GNSS-VOD in conifer forests: Biogeophysical Drivers and Comparison with L-Band Radiometry 

Paul Vermunt, Yiwen Zhou, Roelof Rietbroek, Bérénice Guglielmi, Jonas Gisler, Mike Schwank, Arthur Gessler, and Matthias Drusch

Vegetation Optical Depth (VOD) has become an increasingly important biogeophysical variable, and has been used to estimate aboveground biomass (AGB) or vegetation water content (VWC). In recent years, GNSS transmissometry (GNSS-T) has been developed as a tool to estimate VOD continuously on plot-level (e.g. Humphrey & Frankenberg (2023)). Currently, observations of GNSS-VOD throughout the globe are being brought together within VODnet, aiming to, amongst others, serve the calibration/validation of satellite VOD products. (Brede et al. (2025)).

At the same time, we lack fundamental understanding of the drivers of temporal GNSS-VOD variability and their relative roles under different conditions, as well as the comparability with radiometry-based VOD. Here, we present (1) a detailed analysis of a 2.5-year record of low-cost (u-blox) GNSS-VOD observations from a dense Douglas fir forest in the Netherlands, including quantifying the biophysical drivers of temporal VOD dynamics (i.e. VWC, AGB, interception/dew, and temperature) and their relative importance, and (2) a cross-comparison of GNSS-VOD and L-band, upward-looking radiometer-based VOD measurements from a Scots pine forest in Switzerland.

References:

Humphrey, V. and Frankenberg, C.: Continuous ground monitoring of vegetation optical depth and water content with GPS signals, Biogeosciences, 20, 1789–1811, 2023.

Brede, B., Schellenberg, K., Camps, A., Chaparro Danon, D., Damm, A., Forkel, M., Frankenberg, C., Ghosh, A., Hartmann, H., Herold, M., Humphrey, V., Jagdhuber, T., Konings, A., Kurum, M., Niederberger, M., Schmullius, C., Stassin, T., Steele-Dunne, S., Van der Borght, N., Strube, M., Vermunt, P., Yao, Y., Monteith, A., Richards, E., Persson, H., Lecart, B., and Jonard, F.: VODnet: a virtual GNSS-T VOD network for monitoring of forest water budget and structure, Living Planet Symposium '25, Vienna, https://doi.org/10.13140/RG.2.2.17146.35522, 2025.


How to cite: Vermunt, P., Zhou, Y., Rietbroek, R., Guglielmi, B., Gisler, J., Schwank, M., Gessler, A., and Drusch, M.: GNSS-VOD in conifer forests: Biogeophysical Drivers and Comparison with L-Band Radiometry, EGU General Assembly 2026, Vienna, Austria, 3–8 May 2026, EGU26-3615, https://doi.org/10.5194/egusphere-egu26-3615, 2026.

EGU26-5061 | ECS | Orals | BG3.43

Characterising Uncertainty in Vegetation Optical Depth Retrievals Using the Land Parameter Retrieval Model 

Rasma Ormane, Harry Morris, Bernardo Mota, Ruxandra Zotta, and Nicolas Bader

Microwave radiometers have been used to monitor the Earth’s land and oceans since the late 1970s, beginning with sensors such as the Scanning Multichannel Microwave Radiometer (SMMR). Due to the physical properties of the atmosphere, specifically the high transmissivity of atmospheric windows in much of the microwave spectrum, microwave radiation propagates with minimal attenuation, enabling observations through clouds and light precipitation. Depending on the frequency of observation, these sensors are largely unaffected by atmospheric and illumination conditions and can acquire measurements both day and night. Therefore, missions such as NASA’s Advanced Microwave Scanning Radiometer 2 (AMSR2) and Soil Moisture Active Passive (SMAP) provide frequent global mapping (typically every 2–3 days), however, retrievals are not always consistent, as other factors such as frozen soils and radio‑frequency interference can influence the measurements. A fundamental measurement collected by passive microwave sensors (radiometers) is brightness temperature, which serves as the primary input for retrieving parameters related to soil and vegetation water content, yielding products such as soil moisture and Vegetation Optical Depth (VOD). Passive sensors rely on naturally emitted microwave radiation from the Earth system and do not illuminate the surface, in contrast to active sensors (radars). VOD is not a directly measurable physical property, but a model-based parameter primarily estimated using remotely sensed data. By quantifying canopy opacity, VOD offers a critical proxy for Vegetation Water Content (VWC) and above-ground biomass. While high-frequency bands (e.g., C-, X-, and Ku-bands) interact primarily with leaves and small branches to reflect upper canopy VWC, longer wavelengths (e.g., L-band) penetrate deeper to interact with trunks and woody structure. This multi-band capability allows for a comprehensive assessment of ecosystem hydraulic status, drought impact, and given sufficient spatio-temporal coverage ecosystem resilience. However, while soil moisture is an established Essential Climate Variable with defined GCOS measurement uncertainty target for surface soil moisture (<0.08 m3m-3, k=2) VOD lacks standardised guidance on uncertainty targets. This absence represents a critical gap in both product specifications and the scientific literature, limiting confidence in VOD interpretations and constraining its reliability as an indicator of vegetation water content in long‑term climate studies. Addressing this gap is therefore central to advancing the use of VOD in climate monitoring frameworks. This study explores the uncertainties associated with VOD retrievals within the Land Parameter Retrieval Model (LPRM), a widely used forward radiative transfer model. Utilising dual-polarised brightness temperature data from AMSR2 and performing Monte Carlo sensitivity analysis, we characterise how uncertainties in the model input parameters propagate through the VOD retrieval process. The research outlines a preliminary traceability diagram, identifying the sensitivity of the LPRM algorithm across different frequency bands and land cover types. By estimating uncertainty magnitudes under various scenarios, this work provides a framework for improving the reliability of VOD and VWC estimates, facilitating their integration into eco-hydrological models and early warning systems for vegetation stress.

How to cite: Ormane, R., Morris, H., Mota, B., Zotta, R., and Bader, N.: Characterising Uncertainty in Vegetation Optical Depth Retrievals Using the Land Parameter Retrieval Model, EGU General Assembly 2026, Vienna, Austria, 3–8 May 2026, EGU26-5061, https://doi.org/10.5194/egusphere-egu26-5061, 2026.

EGU26-7255 | ECS | Posters on site | BG3.43

Improving LPRM C-Band VOD Retrievals Using Stratified Temporal Optimization of the Single-Scattering Albedo 

Nils Voß, Ruxandra-Maria Zotta, Nicolas Bader, and Wouter Dorigo

Vegetation Optical Depth (VOD) characterizes the attenuation of soil-emitted microwave radiation as it propagates through the vegetation layer. VOD is retrieved in the microwave domain, making it less susceptible to saturation effects and atmospheric conditions. Hence, VOD is used in a wide range of applications, including drought monitoring, fire risk analyses, carbon-flux modelling, or studies on ecosystem resilience and tipping dynamics.

The Land Parameter Retrieval Model (LPRM) is based on a tau-omega radiative transfer model, which simultaneously retrieves soil moisture and VOD via a sequential, refining search, maximizing the agreement between modeled and observed brightness temperatures. The single scattering albedo ω expresses the fraction between scattered and absorbed radiation intercepted by vegetation and is treated in LPRM conventionally as a global (time-invariant) parameter. Recent studies, however, have shown that ω exhibits systematic temporal variability, suggesting that the assumption of global constancy may not be adequate in LPRM.

This study proposes an extension of LPRM in which C-band brightness temperature observations from the Advanced Microwave Scanning Radiometer 2 (AMSR2) mission are optimized in a two-level procedure for boreal deciduous forests (BDF). Local and global model parameters are solved separately by fixing corresponding parameters through large weights. In a first step, all global model parameters are optimized for the full time series while keeping the local parameter ω fixed. In a second stage, the time series is stratified into temporal windows, within each ωj is solved independently, keeping global parameters fixed, and allowing for seasonal alignment of ω.

This leads to the following hypothesis: Allowing the single-scattering albedo ω to vary temporally, via a stratified two-step optimization procedure, improves C-band VOD retrievals, specifically in terms of (a) correlations between LAI and C-band VOD; and (b) agreement between modeled and observed brightness temperatures, when being compared against retrieval scenarios in which ω is treated constant.

The findings of this study aim to provide insights into the seasonality of ω, and to assess whether the conventional assumption of constant ω is sufficient or if future studies should treat it as time-variant model parameter.

How to cite: Voß, N., Zotta, R.-M., Bader, N., and Dorigo, W.: Improving LPRM C-Band VOD Retrievals Using Stratified Temporal Optimization of the Single-Scattering Albedo, EGU General Assembly 2026, Vienna, Austria, 3–8 May 2026, EGU26-7255, https://doi.org/10.5194/egusphere-egu26-7255, 2026.

EGU26-7306 | ECS | Posters on site | BG3.43

Assessing daytime vegetation water content estimates derived through the land parameter retrieval model from AMSR2 X-band observations 

Felix Meixner, Ruxandra-Maria Zotta, Nicolas Bader, and Wouter Dorigo

Vegetation annotates the radiation emitted by the Earth’s surface. The degree of annotation can be quantified by space-
born passive microwave radiometers and is commonly known as Vegetation Optical Depth (VOD). VOD is directly connected
to and influenced by several factors, such as the water content, vegetation density, the wavelength used for observation and
the land cover type. One widley used algoritm is the Land Parameter Retrieval Model (LPRM). LPRM is a model that re-
trieves both soil moisture and VOD simultaneously from V and H polarized microwave observations. Nighttime LPRM VOD
has been extensively validated and used in many applications (e.g. Moesinger et al. [1], Zotta et al. [2]). LPRM assumes
nightime equilibrium of canopy and soil temperature [3]. This does hold for daytime observations which we aim at doing
here.


Here, we introduce an approach that separates the canopy and soil temperature using reanalysis data. We use it to
retrieve AMSR2 VOD at X-band. First, existing VOD retrievals, retrieved for daytime and nighttime observations under the
thermal equilibrium assumption, are compared to each other and to independent vegetation parameters such as the Leaf
Area Index (LAI) and the Fraction of Absorbed Photosynthetic Active Radiation (fAPAR). We also took Land cover classes
(CCI Land Cover) into account to see in which biomes daytime VOD and nighttime VOD already agree with each other and
analysed why. In a second step, we plug in the soil and vegetation temperature from reanalysis separately into the LPRM to
see how it affects daytime VOD. We evaluate where and by how much it improves, especially in biomes where nighttime and
daytime retrievals are assumed to differ significantly. Furthermore, we will transfer the approach to Ku-band observations.


First results indicate that our approach works best in dense vegetation (e.g. 60-Tree cover, broadleaved, deciduous,
closed to open (>15%)), except for tropical rainforest. This class shows the largest discrepancy between daytime and
nighttime retrievals due to an underestimation of daytime VOD caused by strong transpiration and large day-night temper-
ature contrast.


References
[1] L. Moesinger, W. Dorigo, R. de Jeu, et al. The global long-term microwave Vegetation Optical Depth Climate Archive
(VODCA). Earth System Science Data 12, 177–196 (2020).
[2] R.-M. Zotta, L. Moesinger, R. van der Schalie, et al. VODCA v2: multi-sensor, multi-frequency vegetation optical depth
data for long-term canopy dynamics and biomass monitoring. Earth System Science Data 16, 4573–4617 (2024).
[3] Manfred Owe, Richard de Jeu, and Thomas Holmes. Multisensor historical climatology of satellite-derived global
land surface moisture. Journal of Geophysical Research: Earth Surface 113 (2008). eprint: https : / / agupubs .
onlinelibrary.wiley.com/doi/pdf/10.1029/2007JF000769.

How to cite: Meixner, F., Zotta, R.-M., Bader, N., and Dorigo, W.: Assessing daytime vegetation water content estimates derived through the land parameter retrieval model from AMSR2 X-band observations, EGU General Assembly 2026, Vienna, Austria, 3–8 May 2026, EGU26-7306, https://doi.org/10.5194/egusphere-egu26-7306, 2026.

EGU26-7818 | ECS | Posters on site | BG3.43

An improved machine learning approach to estimate GPP using vegetation optical depth and other microwave remote sensing observations  

Ruxandra Zotta, Moritz Clemens Müller, Raul Lazameta, Sophia Walther, Matthias Forkel, and Wouter Dorigo

Long-term monitoring of gross primary production (GPP) is essential for quantifying terrestrial carbon uptake, understanding ecosystem responses to climate variability and extremes, and evaluating Earth system models. Yet, long-term global GPP estimates derived from optical remote sensing, eddy covariance upscaling, and process-based models still diverge in magnitude and trends, motivating the development of complementary products based on independent observations. Passive microwave vegetation optical depth (VOD) provides an all-weather, largely illumination-independent signal linked to vegetation water content and biomass and is used in the microwave-driven VODCA2GPP product. However, the current VODCA2GPP implementation uses reanalysis 2 m air temperature (T2M) and shows reduced performance in water-limited regions. 

Here, we assess a microwave-driven, model-independent GPP framework using random forest models trained on FLUXNET GPP and subsets of primarily microwave predictors. We replace T2M with daytime land-surface temperature (LSTday) retrieved from Ka-band brightness temperatures (AMSR-E, AMSR2, SSM/I). To better represent hydraulic and structural constraints, we additionally test land cover (LC), an L-band VOD biomass composite (LVOD), and surface and root-zone soil moisture (RZSM), alongside VOD (VODCA v2). 

Replacing T2M with LSTday preserves or slightly improves skill at FLUXNET sites and against independent GPP references, while producing near-identical global trend patterns, supporting LSTday as an observation-based thermal constraint consistent with large-scale controls on photosynthesis. Adding physiologically plausible predictors yields robust gains, with the most significant improvement from LC, which reduces cross-biome mixing and curbs unrealistically high GPP in open vegetation. The best performance is achieved when using VOD, LSTday, LC, LVOD, and RZSM together as predictors, highlighting the complementary constraints from plant-available water and biomass/long-term vegetation state. These results motivate an updated VODCA2GPP release, using LSTday instead of T2M and incorporating LC, LVOD, and RZSM, to better capture the structural and hydrologic limitations on carbon uptake. 

How to cite: Zotta, R., Müller, M. C., Lazameta, R., Walther, S., Forkel, M., and Dorigo, W.: An improved machine learning approach to estimate GPP using vegetation optical depth and other microwave remote sensing observations , EGU General Assembly 2026, Vienna, Austria, 3–8 May 2026, EGU26-7818, https://doi.org/10.5194/egusphere-egu26-7818, 2026.

EGU26-9965 | Posters on site | BG3.43

Tracking Canopy Water Content with GNSS-Derived VOD in a Highly Instrumented Multi-Sensor Forest Field Infrastructure 

Albin Hammerle, Nicolas Francois Bader, and Georg Wohlfahrt

Global Navigation Satellite System (GNSS) signal attenuation offers a novel approach to estimate Vegetation Optical Depth (VOD) and thereby monitor vegetation structure and vegetation water status at high temporal resolution. At the FAIR site in Mieming (Austria), a GNSS receiver system has recently been installed, opening new opportunities to explore the applicability and added value of GNSS-based VOD in a well-instrumented forest ecosystem. The exceptional strength of FAIR lies in its dense and diverse sensor infrastructure, including eddy covariance measurements above and below the canopy, dendrometer observations, stem water potential measurements, sapflow systems, cosmic-ray neutron sensing (CRNS), soil water content and soil water potential profiles, detailed observations of precipitation and throughfall, as well as periodic, manual measurements of leaf water content.

The co-location of these measurements enables a unique framework to investigate how GNSS-derived VOD relates to plant water status, biomass dynamics, and ecosystem-scale fluxes. Key research questions include the sensitivity of GNSS-VOD to short-term vegetation water dynamics, its coupling with transpiration and carbon exchange at ecosystem levels, and its response to soil moisture variability and atmospheric demand. The FAIR site thus provides an ideal testbed to assess the potential of GNSS-based VOD as an integrative indicator of vegetation–soil–atmosphere interactions and to evaluate its role in multi-sensor ecohydrological monitoring.

In addition, we present first GNSS-VOD time series from the newly installed system and present a first draft of a data processing routine, providing a basis for future analyses and for the integration of GNSS-derived VOD into the existing multi-sensor framework at FAIR.

How to cite: Hammerle, A., Bader, N. F., and Wohlfahrt, G.: Tracking Canopy Water Content with GNSS-Derived VOD in a Highly Instrumented Multi-Sensor Forest Field Infrastructure, EGU General Assembly 2026, Vienna, Austria, 3–8 May 2026, EGU26-9965, https://doi.org/10.5194/egusphere-egu26-9965, 2026.

EGU26-9976 | ECS | Posters on site | BG3.43

GNSS-T Monitoring of Canopy Water Dynamics in a European Beech Forest: Potentials and Caveats Across Diel to Seasonal Scales 

Nicolas Bader, Ruxandra-Maria Zotta, Eugenio Diaz-Pines, Gregor Möller, Walter Loderer, Thomas Kager, and Wouter Dorigo

European beech (Fagus sylvatica L.) is one of the most widespread and ecologically significant broadleaf tree species in Central Europe and is highly sensitive to drought and climatic extremes. Monitoring canopy water status is therefore critical for understanding plant hydraulic functioning, ecosystem resilience, and responses to environmental stress. Satellite-derived Vegetation Optical Depth (VOD) quantifies microwave signal attenuation by vegetation, serves as a proxy for vegetation water content, and provides valuable large-scale information for global vegetation monitoring and climate studies. However, well-characterized ground-based observations are required to resolve canopy-scale processes and hydraulic dynamics and to validate and improve satellite VOD retrievals.

To address this need, we employ Global Navigation Satellite System Transmissometry (GNSS-T) as an in situ remote sensing approach to observe canopy water content dynamics in a mature European beech forest in eastern Austria. GNSS-T exploits signals of opportunity from navigation satellites operating at L-band frequencies comparable to microwave radiometers by comparing simultaneous signal reception at paired open-sky reference and below-canopy receivers, with differences in received signal power attributable to vegetation. Using a stationary, multi-frequency, multi-constellation GNSS-T setup operated continuously for one and a half years, VOD was retrieved using a simplified tau–omega radiative transfer model as a function of GNSS system, frequency band, and ranging code type.

Retrieved VOD magnitudes are generally consistent across systems and frequency bands. GNSS-T-derived VOD resolves spatial canopy structure as well as pronounced diel and seasonal dynamics and shows sensitivity to meteorological drivers. Comparisons with camera-based vegetation proxies (in situ LAI- and NDVI-proxies) and satellite-derived vegetation indicators (AMSR2 X- and Ku-band VOD, MODIS LAI, Sentinel-1 cross-polarization ratio) support the physical interpretability of these observations. A systematic, azimuth-independent decrease of VOD toward the horizon might point to limitations of the implemented radiative transfer framework.

Overall, the results demonstrate the potential of GNSS-T to provide continuous, non-destructive in situ observations of canopy-scale hydraulic dynamics.

How to cite: Bader, N., Zotta, R.-M., Diaz-Pines, E., Möller, G., Loderer, W., Kager, T., and Dorigo, W.: GNSS-T Monitoring of Canopy Water Dynamics in a European Beech Forest: Potentials and Caveats Across Diel to Seasonal Scales, EGU General Assembly 2026, Vienna, Austria, 3–8 May 2026, EGU26-9976, https://doi.org/10.5194/egusphere-egu26-9976, 2026.

EGU26-11695 | ECS | Posters on site | BG3.43

Linking the Dynamic ASCAT Backscatter-Incidence Angle Relation to Vegetation Water Dynamics 

Paco Frantzen, Susan Steele-Dunne, Mariette Vreugdenhil, Sebastian Hahn, and Wolfgang Wagner

Through the water-uptake at their roots, and the transpiration at their leaves, vegetation plays a key role in the movement of water from the soil to the atmosphere. To improve our understanding of processes dictating the uptake and transpiration of water by vegetation at large scales, dynamics of vegetation water content are an important source of information. Active microwave instruments have been used for decades to estimate vegetation water content, owing to their high sensitivity to water at earth’s surface. Recent developments in the retrieval of normalised C-band backscatter and the associated  backscatter-incidence angle relation from the ASCAT scatterometer onboard the series of Metop satellites have enabled the use of the dynamic backscatter-incidence angle relation for monitoring of vegetation water content from sub-seasonal to multi-year time scale. The result is a global data record of daily estimates of the backscatter-incidence angle relation spanning 2007 to 2025. Additionaly, measurements from the scatterometer onboard the ERS and the future Metop-SG B satellite series, respectfully preceding and succeeding ASCAT, can be included to create a record spanning multiple decades. In this contribution, the spatial and temporal variation of the ASCAT backscatter-incidence angle relation are linked to dynamics of vegetation water content and biomass in different settings to demonstrate the potential of the dynamic C-band backscatter-incidence angle relation for monitoring of vegetation water dynamics.

How to cite: Frantzen, P., Steele-Dunne, S., Vreugdenhil, M., Hahn, S., and Wagner, W.: Linking the Dynamic ASCAT Backscatter-Incidence Angle Relation to Vegetation Water Dynamics, EGU General Assembly 2026, Vienna, Austria, 3–8 May 2026, EGU26-11695, https://doi.org/10.5194/egusphere-egu26-11695, 2026.

EGU26-12248 | Orals | BG3.43

Corner Reflectors for Direct Measurement of Forest Vegetation Optical Depth 

David Moravec and Matthias Forkel

Plant water content is the primary contributor to the Vegetation Optical Depth (VOD), a remote sensing parameter that describes signal attenuation by vegetation in the microwave domain. Short-term variations in VOD contain information about changes in canopy water content, while long-term changes reflect phenological dynamics and overall vegetation development. VOD is also used in several models to estimate biomass and vegetation water content.

Unfortunately, the validation of VOD remains challenging due to the lack of direct ground-truth data, making it common practice to evaluate its performance through spatiotemporal comparisons with relevant vegetation proxy variables. Corner reflectors are passive reflective surfaces that allow accurate characterisation of reflected microwave radiation. By placing them within forest vegetation, we can directly measure the attenuation of their signal caused by the canopy. This makes them a potentially practical tool for direct VOD measurements as well as water balance.

In our project, we developed an innovative corner reflector design specifically for forest microwave satellite observations. We verified the geometry using theoretical reflection simulations at several frequencies for future applications with the Sentinel-1 (5.405 GHz), TanDEM-X (9.65 GHz), and NISAR (L-band: 1.257 GHz / 3.2 GHz) missions. Based on these theoretical assumptions, we subsequently constructed four prototypes and deployed them in mature forest stands in Germany and the Czech Republic. To evaluate the maximum forest canopy density that can still be measured using our corner reflectors, we also conducted an artificial shading experiment. The results demonstrate the capability of corner reflectors to measure VOD, as well as the limitations of current prototypes and recommendations for future applications.

How to cite: Moravec, D. and Forkel, M.: Corner Reflectors for Direct Measurement of Forest Vegetation Optical Depth, EGU General Assembly 2026, Vienna, Austria, 3–8 May 2026, EGU26-12248, https://doi.org/10.5194/egusphere-egu26-12248, 2026.

EGU26-12846 | ECS | Orals | BG3.43

First insights from a Europe-wide GNSS transmissometry network: improved retrieval of sub-daily canopy water status 

Nathan Van der Borght, Susan Steele-Dunne, Emma Tronquo, Anna Selina Neyer, Rob Mackenzie, Hans van der Marel, and Paco Frantzen

The resilience of terrestrial ecosystems to drought and heat stress is a key control on the future terrestrial carbon sink. Plant hydraulic traits such as conductivity and capacitance provide useful indicators of this resilience. These traits can be inferred from sub-daily vegetation water dynamics, yet rapid changes in vegetation water content remain poorly observed and are therefore weakly represented in land-surface models due to the lack of suitable measurements at temporal and spatial scales.

 Microwave remote sensing is a promising tool to monitor diurnal variations in vegetation water content at scale, but no existing or planned satellite missions can currently resolve these dynamics at the sub-daily resolution. To address this critical observation and knowledge gap, SLAINTE has been proposed as an ESA New Earth Observation Mission Idea, comprising a constellation of identical, decametric, monostatic SAR instruments designed to capture sub-daily variations in vegetation water storage, plant water potential, and surface soil moisture (Steele-Dunne et al., 2024; Matar et al., 2024).

One of the challenges in mission development is the lack of sub-daily microwave data across ecosystems. To answer this need of characterizing variability, a GNSS transmissometry (GNSS-T) network has been set up across Europe. GNSS-T compares the signal to noise ratio (SNR) at two GNSS receivers, one above and one below the vegetation canopy, to estimate L-band attenuation, also known as vegetation optical depth (VOD) (Humphrey et al., 2023).

This GNSS-T network, consisting of 21 GNSS receivers across 9 different forest research sites in Europe, has been installed between 05/2025 and 09/2025, building on a pilot installation set up at our Dutch site one year earlier. Data are collected automatically, processed in near real-time, and prepared for dissemination through a central data server, which enables continuous monitoring for data gaps and basic quality checks.

We will discuss lessons learned and methodological advances from installation and operation of the network in sites with variable conditions. The insights gained from constructing an hourly VOD timeseries from high-frequency SNR signals will be presented. Building on the original methodology by Humphrey et al. (2023), we explore sensitivity to GNSS-related artefacts in order to yield robust diurnal signals across sites. These first results demonstrate the feasibility of GNSS-T for monitoring sub-daily vegetation water dynamics.

The established processing workflow, together with the extensive network, paves the way to linking GNSS-derived vegetation water content with plant hydraulic models to infer ecosystem-scale hydraulic traits from a microwave observable.


References:

Humphrey, V., & Frankenberg, C. (2023). Continuous ground monitoring of vegetation optical depth and water content with GPS signals. Biogeosciences, 20(1), 1789–1811. https://doi.org/10.5194/bg-20-1789-2023

Matar, J., Sanjuan-Ferrer, M. J., Rodriguez-Cassola M., Steele-Dunne, S. & De Zan, F. (2024). A Concept for an Interferometric SAR Mission with Sub-daily Revisit. EUSAR 2024; 15th European Conference on Synthetic Aperture Radar, pp. 18-22. IEEE, 2024.

Steele-Dunne, S., Basto, A., De Zan, F., Dorigo, W., Lhermitte, S., Massari, C., Matar J. et al. (2024) SLAINTE: A SAR mission concept for sub-daily microwave remote sensing of vegetation. EUSAR 2024; 15th European Conference on Synthetic Aperture Radar, pp. 870-872. VDE, 2024.

How to cite: Van der Borght, N., Steele-Dunne, S., Tronquo, E., Neyer, A. S., Mackenzie, R., van der Marel, H., and Frantzen, P.: First insights from a Europe-wide GNSS transmissometry network: improved retrieval of sub-daily canopy water status, EGU General Assembly 2026, Vienna, Austria, 3–8 May 2026, EGU26-12846, https://doi.org/10.5194/egusphere-egu26-12846, 2026.

EGU26-13532 | Orals | BG3.43

Global assessment of SMAP-derived vegetation water storage and estimation of the b-parameter using a trait-based VWS map 

David Chaparro, Laura Stewart, Maurizio Mencuccini, Thomas Jagdhuber, and Oliver Binks

Decreasing water availability due to climate change reduces the vegetation water pool. This affects the capacity of vegetation to mediate land-atmosphere feedbacks through photosynthesis and transpiration and impacts vegetation health worldwide [1]. Thus, it is paramount to model vegetation water storage (VWS; the mass of water per ground area) in order to monitor vegetation function. Passive microwave sensors on satellites like the Soil Moisture Active-Passive (SMAP) quantify the attenuation that vegetation exerts over land microwave emissions expressed as the vegetation optical depth (VOD). The VOD is linearly related to VWS via the b factor (VOD = b·VWS) and is a good proxy of VWS. Still, satellite-based VWS estimates have been scarcely validated and, importantly, values of b are purely empirical and are time-invariant, omitting relevant phenological changes in VWS [2]. The lack of accurate estimation of b values limits our capacity to better understand the VOD-VWS relationship, to accurately model VWS, or to further explore the transit time of water in vegetation [3]. Here, we bridge this gap by using newly generated, quasi-global benchmark maps of VWS for leaves (VWSleaf), wood (VWSwood) and their summation (VWStotal). These maps are based on ground information of plant traits (specific leaf area and wood density) from the TRY database [4] and their relationship with leaf and wood water storage [5]. Here, we first find that the linear relationship between SMAP L-band VOD and VWS holds when VWStotal is used. We extend this analysis to AMSR2 X- and Ku-VOD data and find linear relationships with VWSleaf (we test against leaves due to the shallow sensing depth of X- and Ku-VOD). Second, we assess the SMAP VWS datasets against VWStotal and find that spatial differences in VWS are biome-dependent. Third, we divide global maps of annual averages of VOD by VWStotal (for L-VOD) and by VWSleaf (for X- and Ku-VOD) to derive global, multi-frequency maps of b and to study its spatiotemporal variation. Results provide new insights on the accuracy of VOD-derived VWS estimates and open a new path towards estimating VWS for different canopy layers, which has wide implications for the remote sensing and the plant ecology research communities.

[1] Grossiord, C., et al. (2020). Plant responses to rising vapor pressure deficit. New Phytologist, 226, 1550–1566.

[2] Togliatti, K., et al. (2019). Satellite L-band vegetation optical depth is directly proportional to crop water in the US Corn Belt. Remote Sensing of Environment, 233, 111378.

[3] Felton, A. J., et al. (2025). Global estimates of the storage and transit time of water through vegetation. Nature Water, 3(1), 59-69.

[4] Kattge, J., et al. (2020). TRY plant trait database–enhanced coverage and open access. Global Change Biology, 26, 119-188.

[5] Stewart, L., et al. (submitted). Wood You Be-Leaf It? The First Trait-Based Map of Global Vegetation Water Storage. To be presented at EGU 2026.

How to cite: Chaparro, D., Stewart, L., Mencuccini, M., Jagdhuber, T., and Binks, O.: Global assessment of SMAP-derived vegetation water storage and estimation of the b-parameter using a trait-based VWS map, EGU General Assembly 2026, Vienna, Austria, 3–8 May 2026, EGU26-13532, https://doi.org/10.5194/egusphere-egu26-13532, 2026.

EGU26-14360 | ECS | Orals | BG3.43

Assessing dual-channel multi-year active microwave-based vegetation optical depth in temperate forest ecosystems 

Florian M. Hellwig, Anke Fluhrer, Konstantin Schellenberg, Paul Vermunt, Benjamin Lecart, François Jonard, Markus Zehner, Thomas Weiß, David Chaparro, Clémence Dubois, Moritz Link, Jan Bliefernicht, Harald Kunstmann, and Thomas Jagdhuber

Forest water dynamics can be assessed on large spatio-temporal scales using satellite-based remote sensing. Vegetation optical depth (VOD), which indicates the vegetation's attenuation of microwaves, contains mainly information on the dry biomass, structure, and water content of the vegetation. Water dynamics can be reflected in short-term variations in VOD. Currently, VOD is operationally retrieved using passive microwave sensors, such as AMSR-2, SMAP, and SMOS, or radar-based sensors, such as ASCAT, with a coarse spatial resolution (tens of kilometers), which hinders the understanding of complex landscapes and is a major obstacle for VOD validation using ground sensors. To overcome this shortcoming of spatial resolution, we utilize synthetic aperture radar (SAR) sensors, such as Copernicus Sentinel-1 (S1) C-band (5.504 GHz), which enables a much higher spatial resolution (tens of meters).

This study aims to estimate spatially high-resolution SAR-based VOD across different forest ecosystems, using both VH and VV polarizations, and ultimately assess forest water dynamics. We employ soil and vegetation physical scattering models (De Roo et al., 2001; Ulaby & Long, 2014) and constrain the effective scattering albedo (ω), which indicates the ratio of scattering to absorption of vegetation. In our dual-channel approach, we utilize in situ soil moisture from forest ecological observatories and co-polarized S1 backscatter as direct model inputs, and characterize the vegetation structure (ω) using cross-polarized S1 backscatter to estimate SAR-based VOD. We test our approach across two deciduous broadleaf and three evergreen needleleaf forest ecosystems in Central Europe for up to three years (2023-2025). In addition, we compare our SAR-based VOD with VOD estimates from Global Navigation Satellite System-Transmissometry (GNSS-T), derived from a pair of in situ receivers: one located at the top of the canopy and one on the ground for each test site (Brede et al., 2025). We validate our approach using in situ plant gravimetric moisture content (mg; [kgwater/kgwet biomass]) measurements of the tree canopy and remote sensing-based leaf area index. We will also transfer our dual-channel approach to the agricultural site of the Land-Atmosphere Feedback Initiative (LAFI) and other ecosystems in a later step. In the end, spatially high-resolution satellite-based SAR-based VOD enables not only analyses of forest water dynamics but also small-scale up to stand-based assessments of plant hydraulics.


References

Brede, B., Schellenberg, K., Camps, A., Chaparro, D., Damm, A., Forkel, M., Frankenberg, C., Ghosh, A., Hartmann, H., Herold, M., Humphrey, V., Jagdhuber, T., Konings, A., Kurum, M., Niederberger, M., Schmullius, C., Stassin, T., Steele-Dunne, S., Borght, N., …, Jonard, F. (2025). VODnet: a virtual GNSS-T VOD network for monitoring of forest water budget and structure. https://doi.org/10.13140/RG.2.2.17146.35522.

De Roo, R. D., Du, Y., Ulaby, F. T., Dobson, M. C. (2001). A semi-empirical backscattering model at L-band and C-band for a soybean canopy with soil moisture inversion. IEEE Transactions on Geoscience and Remote Sensing, 39(4), 864–872. https://doi.org/10.1109/36.917912.

Ulaby, F. T., Long, D. G. (2014). Microwave radar and radiometric remote sensing. University of Michigan Press.

How to cite: Hellwig, F. M., Fluhrer, A., Schellenberg, K., Vermunt, P., Lecart, B., Jonard, F., Zehner, M., Weiß, T., Chaparro, D., Dubois, C., Link, M., Bliefernicht, J., Kunstmann, H., and Jagdhuber, T.: Assessing dual-channel multi-year active microwave-based vegetation optical depth in temperate forest ecosystems, EGU General Assembly 2026, Vienna, Austria, 3–8 May 2026, EGU26-14360, https://doi.org/10.5194/egusphere-egu26-14360, 2026.

EGU26-14608 | ECS | Orals | BG3.43

Stomata close to maximize transpiration 

Concetta D'Amato and Riccardo Rigon

Current modeling of plant hydraulics under water stress often relies on complex, high-order differential equations that describe the catastrophic failure of the xylem. While these models capture the physics of cavitation, they frequently struggle with numerical stability and upscaling in coupled soil-vegetation-atmosphere simulations, and their high parameterization demands complicate data assimilation from emerging hydraulic observations.

In this study, we propose that plant stomatal regulation effectively acts as a "system damper" that trades a linear loss in transpiration flux for the avoidance of exponential hydraulic collapse. This regulatory strategy can be captured with simplified models that are more amenable to integration with diverse hydraulic observations, from in situ water potential measurements to satellite-derived vegetation water content (VWC).

We investigate the transition from a plant-limited hydraulic regime to a soil-limited one, demonstrating that the "Hydraulic Cliff", the point where the loss of soil and xylem conductivity (K) outpaces the pressure gradient, is not a static property but a dynamic bottleneck that shifts as the soil dries. By applying elementary mathematics to the energy and mass balance, we show that stomatal closure follows a regulatory logic that prevents the leaf water potential (Ψl) from entering the "runaway" zone where demand exponentially exceeds supply.

Our "Dynamic Hydraulic Cliff" framework reveals that the plant's strategy is to decouple the leaf's energy budget (and its associated exponential temperature-driven demand) from the supply decay of the rhizosphere. This approach maintains system stability while being directly linkable to observable quantities: stomatal conductance controls transpiration linearly, while Ψl remains within measurable bounds that can be monitored via sap flow, pressure chambers, or inferred from microwave-based VWC retrievals.

We demonstrate that this parsimonious formulation provides a robust pathway for assimilating multi-scale hydraulic observations into land surface and ecohydrological models without the computational burden and parameter uncertainty of solving complex hydraulic PDEs. The framework enables improved representation of plant responses to drought while facilitating the integration of emerging observational products (VWC, water potential proxies) into operational monitoring systems.

We conclude that "linear" stomatal regulation is an evolutionarily optimal response to the multi-exponential risks inherent in the soil-plant-atmosphere continuum, and that recognizing this principle can bridge the gap between detailed hydraulic theory and practical large-scale prediction of transpiration under future climate extremes.

How to cite: D'Amato, C. and Rigon, R.: Stomata close to maximize transpiration, EGU General Assembly 2026, Vienna, Austria, 3–8 May 2026, EGU26-14608, https://doi.org/10.5194/egusphere-egu26-14608, 2026.

EGU26-14924 | ECS | Posters on site | BG3.43

Tracking Water Status and Drought Response with GNSS-T VOD Across Tropical to Temperate Forest Ecosystems 

Konstantin Schellenberg, David Chaparro, Benjamin Brede, Victoria Stanley, Andrew Feldman, Alexandra G. Konings, Gregory Duveiller, Sinikka J. Paulus, Timothee Stassin, Henrik Hartmann, Christiane Schmullius, and Thomas Jagdhuber

Monitoring vegetation water status is key to understanding forest canopy hydraulics, stomatal regulation, and ultimately the biosphere's drought response under a changing climate. Yet direct, in situ measurements of hydraulic state are labor-intensive and rarely sustained long enough to produce the multi-year time series needed for model development and drought-impact forecasting. Continuous proxies such as sap flow or stem water potential provide vital information about fluxes, but their representativeness for entire trees and stand-scale canopy water status remains very limited.

Here, we highlight the potential of Global Navigation Satellite Systems Transmissometry (GNSS-T) to bridge this observation gap. GNSS-T retrieves vegetation optical depth (VOD), the effective canopy opacity at L-band (1-2 GHz), by measuring one-way attenuation of GNSS microwave signals along their path from the transmitting satellite to a receiver located below the canopy. GNSS-T VOD integrates information on canopy biomass and water content of the canopy (plant and interception storage) and has demonstrated sensitivity to stand-scale vegetation water dynamics. However, its sensitivity to changes in vegetation water dynamics is expected to vary with stand biomass and canopy cover, species hydraulic strategies, and climatic conditions. These dependencies remain poorly quantified. To date, progress has been limited due to the novelty of this emerging technique as existing GNSS-T records are rather short in time and largely confined to individual sites.

In this contribution, we present the first data from VODnet, a community-driven network that builds, maintains, and advances GNSS-T for ecological research. The emerging dataset spans 10 forest stations across diverse biomes, including temperate, Mediterranean, savanna, and tropical ecosystems in South America, and Southern and Central Europe, enabling cross-site analyses of GNSS-T VOD sensitivity under contrasting climate conditions and vegetation properties.

The goal of this study is to understand the sensitivity of GNSS-T VOD to changes in vegetation water status across climate gradients, plant traits, and forest structural conditions. We do this by calculating partial correlations of VOD with hydrological drivers such as soil moisture deficit, sap flow and water potential anomalies while accounting for structural properties such as LAI, total biomass and canopy cover, and measure the degree to which site factors drive this correlation. Beyond in situ applications, VODnet provides a unique opportunity to study uncertainty in widely used spaceborne VOD data sets (e.g., SMAP, AMSR-2) through validation across forest ecosystems. Based on our results, we can now provide a first assessment of whether GNSS-T can serve as a validation reference for satellite-derived VOD.

How to cite: Schellenberg, K., Chaparro, D., Brede, B., Stanley, V., Feldman, A., Konings, A. G., Duveiller, G., Paulus, S. J., Stassin, T., Hartmann, H., Schmullius, C., and Jagdhuber, T.: Tracking Water Status and Drought Response with GNSS-T VOD Across Tropical to Temperate Forest Ecosystems, EGU General Assembly 2026, Vienna, Austria, 3–8 May 2026, EGU26-14924, https://doi.org/10.5194/egusphere-egu26-14924, 2026.

Vegetation phenology and productivity in water-limited ecosystems are tightly coupled to plant hydraulic functioning, particularly the capacity to access and store water across seasonal dry periods. Across the African dry tropics, many woodland ecosystems initiate leaf green-up prior to the onset of seasonal rainfall, suggesting complex water-use mechanisms that are not directly observable through precipitation or surface soil moisture data alone. Understanding the hydraulic basis of these phenological strategies is critical for interpreting remotely sensed vegetation water signals and for predicting ecosystem responses to shifting rainfall regimes.

Here, we integrate satellite observations and reanalysis data to investigate how vegetation phenology and ecosystem productivity are mediated by plant water status across Africa. We identify three water-stress regimes based on the sensitivity of gross primary productivity (GPP) to rainfall frequency, intensity, and rainy season length, and assess the extent to which these regimes explain the widespread decoupling between rainfall onset and vegetation green-up across dry tropical woodlands. Furthermore, using observations of vegetation optical depth (VOD) as an integrative proxy for vegetation water content, we evaluate the role of plant-stored water in facilitating pre-rain leaf-out. We find that 64% of Africa's terrestrial ecosystems are subject to chronic water stress, and another 22% experience acute water stress. These acutely water-stressed regions initiate green-up when soil moisture is lower relative to chronically water-stressed regions, indicating decoupling between onset of rainfall and leaf-out. Notably, seasonal trajectories of LAI and VOD are asynchronous in regions with pre-rain green-up, consistent with the mobilization of plant-stored water to support early leaf-out. 

Our results demonstrate how satellite-derived vegetation water content metrics can reveal hydraulic strategies that decouple vegetation dynamics from surface moisture forcing. This work highlights the value of microwave-based observations for diagnosing plant hydraulic functioning at ecosystem scales and underscores vulnerabilities of water-limited ecosystems to shifts in rainfall timing and seasonality under climate change.

How to cite: Morgan, B. and Entekhabi, D.: Vegetation water content mediates decoupling between leaf-out and rainfall onset in the African dry tropics, EGU General Assembly 2026, Vienna, Austria, 3–8 May 2026, EGU26-14952, https://doi.org/10.5194/egusphere-egu26-14952, 2026.

EGU26-18484 | Orals | BG3.43 | Highlight

Towards a global perspective on plant hydraulics: Challenges and opportunities extending microwave remote sensing to sub-daily scales 

Susan Steele-Dunne, Nathan van der Borght, Anna Neyer, Emma Tronquo, Paulina Swiatek, Paco Frantzen, and Arturo Villaroya Carpio

The aim of this presentation is to highlight the confluence of developments in plant physiology, biogeosciences and microwave remote sensing and a potential route to a global perspective on plant hydraulics. The context is the continued development of a satellite mission concept based on a Low Earth Orbit (LEO) constellation of Synthetic Aperture Radars (SAR) that would provide sub-daily observations including vegetation water content and vegetation wet/dry state (Steele-Dunne et al., 2023, Matar et al., 2023). A recurring challenge in mission concept development has been the scarcity sub-daily microwave data, specifically radar data. These are critical to consolidate measurement and observation requirements, and to demonstrate the science case.
Here, we will highlight research activities centred on our installation of a network of GNSS transmissivity (GNSS-T) sensors at existing forest monitoring sites across Europe. GNSS-T is an emerging measurement technique that provide crucial insight into sub-daily changes in the vegetation as a dielectric medium. Because GNSS-T is relatively inexpensive, it enables data collection across a wide range of biomes, complementing sparser tower-based sensors and providing critical observations to support mission development. 
We will outline how we are using GNSS-T observations with radiative transfer modeling to consolidate observation and measurement requirements. We will illustrate how we using GNSS-T observations to investigate the link between microwave observations and biogeophysical variables at the heart of plant water relations and the surface water and energy balances. We will also discuss how the exploitation of GNSS-T for these purposes is not trivial, highlighting some of the theoretical considerations we have encountered and our attempts to handle them. 
Finally, we will put our activities in the wider context of developments in plant physiology and biogeosciences to discuss opportunities to bring these fields closer together. This is essential to reach the global perspective needed to address urgent scientific and societal challenges. 


How to cite: Steele-Dunne, S., van der Borght, N., Neyer, A., Tronquo, E., Swiatek, P., Frantzen, P., and Villaroya Carpio, A.: Towards a global perspective on plant hydraulics: Challenges and opportunities extending microwave remote sensing to sub-daily scales, EGU General Assembly 2026, Vienna, Austria, 3–8 May 2026, EGU26-18484, https://doi.org/10.5194/egusphere-egu26-18484, 2026.

EGU26-21068 | ECS | Posters on site | BG3.43

Sensitivity of C- and L-band SAR observations to water and carbon cycle variables in Mediterranean forests 

Martina Natali, Gabriëlle De Lannoy, Alessia Flammini, Susan Steele-Dunne, and Christian Massari

Synthetic Aperture Radar (SAR) satellites provide all-weather, day-night global Earth surface coverage, enabling continuous monitoring of ecosystems across multiple microwave bands. Over forested areas, SAR backscatter carries information on canopy water content, vegetation structure, and soil moisture. Microwave signals with shorter wavelengths interact with leaves and upper canopy layers, while longer wavelengths penetrate deeper and investigate branches, trunks, and soil. This makes SAR backscatter a proxy for retrieving ecosystem variables related to water and carbon cycles, such as soil moisture and biomass, which are critical inputs in data assimilation schemes for Earth system models. 

However, SAR applications over forests are limited by backscatter saturation over dense canopies and by the limited penetration depth of shorter wavelengths through vegetation. Understanding how these constraints vary across different microwave bands, SAR variables, and forest types is thus essential before implementing data assimilation experiments. 

This study explores the sensitivity of Sentinel-1 C-band (5.405 GHz, l ~ 5.55 cm) and SAOCOM L-band (1.275 GHz, l ~ 23.5 cm) SAR observations to soil moisture (SM), evaporation (ET), gross primary productivity (GPP), and Leaf Area Index (LAI), over Mediterranean forest sites. We analyze the sigma nought (σ0) backscattering coefficient in different polarizations (dual-pol for Sentinel-1, quad-pol for SAOCOM), along with its cross-ratio (σ0VH/ σ0VV), backscatter-incidence angle slope, and polarimetric decomposition parameters. We calculate the sensitivity of each parameter by computing linear regression against in-situ measurements of ecosystem variables. We also assess sensitivity changes across different acquisition geometries and timing (morning and evening overpasses), seasonality, and forest types. 

We consider three study sites in central and northern Italy, namely IT-BFt, IT-Cp2, and IT-SR2, which belong to the ICOS/FLUXNET network and are equipped with soil moisture probes and eddy covariance towers for water and carbon fluxes measurements. The three sites comprise both deciduous (Carpinus betulusQuercus robur) and evergreen (Pinus pinea l., Quercus ilex) forests with diverse structural characteristics.

C-band backscatter from Sentinel-1 exhibits saturation at two out of three study sites, particularly where canopies are the densest. Conversely, L-band backscatter shows higher sensitivity to soil moisture and vegetation growth. By characterizing the sensitivity of SAR parameters to geophysical variables, this study contributes to a better understanding of the potential of SAR retrievals in data assimilation experiments to improve predictions of hydrological and carbon fluxes over forested regions.

How to cite: Natali, M., De Lannoy, G., Flammini, A., Steele-Dunne, S., and Massari, C.: Sensitivity of C- and L-band SAR observations to water and carbon cycle variables in Mediterranean forests, EGU General Assembly 2026, Vienna, Austria, 3–8 May 2026, EGU26-21068, https://doi.org/10.5194/egusphere-egu26-21068, 2026.

Alien tree species are key to improving and enhancing the sustainability of urban green spaces and forest management, but they also pose a threat to global biodiversity in the context of climate change and urbanisation. Using data on the occurrence of the alien tree species Acer negundo L. from the Gbif database, we modelled the availability of potential ecological niches using the MaxEnt method, 19 bioclimatic variables and two additional variables (altitude as an indicator of distribution dependence on relief, human population density) for current conditions, the periods 2041–2060 and 2081–2100 for the territory of Europe. We used two climate scenarios: ssp 126 and ssp 585. We assessed the risks of range expansion for 51 European countries and provided a red list of countries most at risk of invasion by 2100.

Acer negundo is widespread in 31 European countries, with the highest infestation rates in Estonia, Latvia, Slovenia, Serbia, Belarus, the Åland Islands, Romania, Denmark, Georgia, Bosnia and Herzegovina, Bulgaria, Sweden, and France. The Czech Republic and Slovakia have a 16% spread of ssp 585 (2081–2100).

All other countries out of 31 have a forecast of 1-10% of their territory being infected by 2100. In Estonia, Latvia, Slovenia, Serbia, and Belarus, the predicted invasion is 14-75% of the territory in all scenarios and analysed periods, with the most significant expansion of the range in the 15 countries mentioned occurring according to the ssp_126 (2081–100), in which climate change is significantly milder than in ssp_585. Thus, the assessment of invasion risks under the projected climate change scenarios showed that 15 countries have a high risk of invasion. Two countries (Estonia and Latvia) have a 40-75% risk of invasion, with the most significant spread predicted in both scenarios by 2060.

In the Netherlands, Norway, Moldova, Montenegro, Liechtenstein, Andorra, Armenia, Vatican City, the United Kingdom, Greece, Spain, and San Marino, there will be virtually no spread of the species.

How to cite: Miroshnyk, N.: Assessing the potential risk of spreading the invasive tree species Acer negundo L. with climate change in Europe, EGU General Assembly 2026, Vienna, Austria, 3–8 May 2026, EGU26-876, https://doi.org/10.5194/egusphere-egu26-876, 2026.

EGU26-1144 | ECS | PICO | BG3.44

Impact of Invasive Species and Tree Diversity on the Dom palm: Community Perception and Human-Induced Changes, Dryland, Sudan 

Hashim Abdelkarim, Adrienn Horváth, and Dafa-Alla Mohamed Dafa-Alla

We conducted this research in Aldammar locality, River Nile State, Sudan. Research aimed to 1) assess tree diversity and composition, 2) examine community perceptions toward the Dom palm. A stratified conventional inventory was used. Regarding climate change, a total of 36, 12, and 11 sample plots (each 0.10 ha, radius 17.8 m) were established in Geli, Elhelgi, and Umbasheem forests, respectively. In each sample plot, we identified all trees to the species level, recorded their frequencies, and computed species diversity and importance value indices (IVI). Socio-economic data were collected using a structured household survey administered to 146 respondents distributed across seven randomly selected villages, complemented by 20 key informant interviews. Data was analyzed using Microsoft Excel and SPSS. The results revealed that 8, 7, and 6 tree species belonging to six families were recorded in three sites. The mean tree density was 254.33 trees/ha, 1611.33 trees/ha, and 337 trees/ha for the respective sites. The dominant species were H. thebaica in Umbasheem, which exhibited richness (R=11), Dominance (D' = 0.55), Simpson’s Diversity (D = 0.45), Shannon Index (H' = 1.12), and Evenness (E 0.47). Additionally, Prosopis sppis dominant in Elhelgi and Geli sites as well. The study noted present (59) individuals of the Dom regeneration in Umbashem and absent in the others. H. thebiaca. Regarding community perceptions, respondents indicated that the status of the Doum palm stands is degraded, and that the invasive Prosopis spp. exerts major negative impacts on Doum forests. The study concludes that the massive expansion of invasive Prosopis spp. is most likely to lead to the degradation and potential destruction of Dom palm (H. thebaica) resources, especially under the current management practices, and observed a significant absence of Dom regeneration. the study recommended adopting new approaches and prospective to Dom palm management.

How to cite: Abdelkarim, H., Horváth, A., and Mohamed Dafa-Alla, D.-A.: Impact of Invasive Species and Tree Diversity on the Dom palm: Community Perception and Human-Induced Changes, Dryland, Sudan, EGU General Assembly 2026, Vienna, Austria, 3–8 May 2026, EGU26-1144, https://doi.org/10.5194/egusphere-egu26-1144, 2026.

EGU26-1239 | ECS | PICO | BG3.44

Deciphering the Water-Forest-Climate nexus through long-term hydro-climatic trends in watersheds of Narmada River 

Manisha Singh, Rishabh Srikar, Bhaskar Sinha, Jigyasa Bisaria, and Thomas Thomas

Water availability and quality is essential for natural ecosystems and sustainable societies, due to its central position in all living and natural interactions, which is ultimately linked to the socio-economic-ecological health of a region. Water and forests are intertwined as their interactions along with climatic, topographical, ecological and edaphic factors play an essential part in water regulation between land and atmosphere. Rising deforestation and degradation have diminished the climate and water regulatory functions of forests threatening the water quality and quantity in forested watersheds. Given the growing global concerns over water security and climate change, understanding these interlinkages have become imperative for sustainable water management. Therefore, exploring water dynamics in conjunction with vegetation and climatic indicators is crucial for a comprehensive assessment of the forest-water-climate nexus. Forest-fed streams and rivers predominantly spanning the southern and central parts of India are dependent on the rainfall and groundwater flows but changing climate and forest patterns have negative connotations for perennial water flows. The largest west-flowing Central Indian River, the Narmada has high ecological, economic, social, religious, cultural importance and dependence. With more than 30% of the basin being forested, the basin comprises 150 watersheds in different agro-ecological zones with varied climatology and hydrology. Other dominant land use is agriculture covering almost 57% of the basin, closely tied to the economy of 17,493 villages and the livelihood of residents. This necessitates a deeper understanding of long-term patterns of eco-hydro-meteorological variables in differently forested watersheds for planning holistic forest-water-climate adaptation and management strategies. Therefore, varying trends in stream discharge, climate and vegetation were assessed for two distinctly forested watersheds of Narmada River. This study examines the forest-water linkages and the changing climate patterns of Dindori (Tropical Moist Deciduous-Sal dominant) and Barwani (Tropical Dry Deciduous-Teak dominant) watersheds with different forest types and cover. Long-term trend analysis (2001-2020) was conducted at annual, monthly and seasonal time scale for selected climate, forest, soil and water variables through appropriate indicators (minimum and maximum temperature, rainfall, evapotranspiration, Normalized Difference Vegetation Index, Enhanced Vegetation Index, Modified Soil Adjusted Vegetation Index, forest cover, soil moisture, and water discharge). The study followed an integrated approach combining station data supplemented by remotely sensed proxy indicators, secondary literature and trend analysis using Mann-Kendall statistical test. The results indicate shifting rainfall patterns, increasing minimum and maximum temperature with expanding agriculture area and reduction in forest cover in both watersheds. Declining patterns of stream discharge, increased drought frequency and evapotranspiration losses were also observed. These findings reiterate the need for integrated forest-water management for a climate resilient future of the Narmada basin. A comprehensive perspective for water variations should involve associated parameters which can inform integrated water management for developing countries like India.

How to cite: Singh, M., Srikar, R., Sinha, B., Bisaria, J., and Thomas, T.: Deciphering the Water-Forest-Climate nexus through long-term hydro-climatic trends in watersheds of Narmada River, EGU General Assembly 2026, Vienna, Austria, 3–8 May 2026, EGU26-1239, https://doi.org/10.5194/egusphere-egu26-1239, 2026.

EGU26-4825 | ECS | PICO | BG3.44 | Highlight

Catchment-Scale Soil Erosion Response to Long-Term Land Use Change in the Myjava Basin, Slovakia 

Aditya Nugraha Putra, Roman Výleta, Michaela Danáčová, Kamila Hlavčová, and Silvia Kohnová

Soil erosion continues to pose a major global challenge, yet long-term catchment-scale analyses that explicitly connect historical land-use change with erosion responses remain scarce. This study examines the influence of approximately +240 years of historical and projected land-use change on soil erosion in the Myjava Basin by incorporating parcel-level land-use reconstructions spanning 1787–2030 into a distributed USLE-2D modelling framework. The R, K, and parcel-based C and P factors were temporally harmonized, while the LS factor was derived using an ensemble of four widely used algorithms. Principal component analysis was employed to assess the relative contribution of RUSLE factors through time, and all analyses were conducted within a reproducible geospatial modelling workflow. The results reveal a long-term reduction in total soil erosion of approximately 78% at the landscape scale and 60% within arable land from the nineteenth century to the present, primarily driven by a substantial decrease in arable land cover from 62% to 37% and the expansion of forest and shrub vegetation. Despite this overall decline, persistent erosion hotspots remain concentrated on steep upland slopes with high LS values (>10%), while agricultural parcels consistently exhibit erosion rates 10–20 times higher than the basin-wide mean across all periods. The PCA indicates that LS and rainfall erosivity are the dominant controls on erosion variability, with principal component loadings ranging from 0.78 to 0.84, whereas the influence of C and P factors increases in recent and projected periods, accounting for up to 40% of the total explained variance. Overall, these results demonstrate that long-term land-use transitions have markedly reduced basin-scale soil erosion risk. 


Acknowledgments: This work was supported by the Slovak Research and Development Agency under contract no. APVV 23-0332, VV-MVP-24-0208 and VEGA Grant Agency no. 1/0657/25. The authors are grateful for the support.

How to cite: Putra, A. N., Výleta, R., Danáčová, M., Hlavčová, K., and Kohnová, S.: Catchment-Scale Soil Erosion Response to Long-Term Land Use Change in the Myjava Basin, Slovakia, EGU General Assembly 2026, Vienna, Austria, 3–8 May 2026, EGU26-4825, https://doi.org/10.5194/egusphere-egu26-4825, 2026.

EGU26-4859 | PICO | BG3.44

Regionalised urban climate-risk mapping for Trnava (Slovakia): integrating Euro-CORDEX-scale projections with local evidence (TRACAP) 

Martin Kubáň, Milica Choleva, Silvia Kohnová, Roman Výleta, and Zuzana Štefunková

Urban areas in Central Europe face rapidly increasing risks from extreme heat and drought, with cascading impacts on health, critical services, and peri-urban food production. Within the TRACAP project, we develop a municipal-scale climate-risk evidence base for Trnava (Slovakia) by combining regional climate projections with local observations and spatial layers describing exposure and vulnerability. Heat hazard is characterised using scenario-based indicators of hot conditions (frequency and severity of hot days/heatwave episodes) and complemented by remote-sensing land-surface temperature to identify persistent urban hot spots and overheating risk for sensitive facilities and populations. Agricultural drought risk is assessed using climate-driven indicators describing water-stress conditions relevant to crop production (precipitation deficit, atmospheric evaporative demand, and drought persistence), and linked to local land use and crop distributions to quantify potential impacts on yields and revenue. Risk is derived by overlaying heat and drought hazards with exposure (critical services, vulnerable buildings, transport assets, and agricultural areas) and vulnerability proxies, producing prioritised hotspots and decision-ready metrics for adaptation planning. The approach demonstrates how workflow-based risk assessment can be operationalised for cities with limited internal capacity, enabling transparent prioritisation of cooling strategies, nature-based solutions, water-retention measures, and drought-resilient agricultural practices.

How to cite: Kubáň, M., Choleva, M., Kohnová, S., Výleta, R., and Štefunková, Z.: Regionalised urban climate-risk mapping for Trnava (Slovakia): integrating Euro-CORDEX-scale projections with local evidence (TRACAP), EGU General Assembly 2026, Vienna, Austria, 3–8 May 2026, EGU26-4859, https://doi.org/10.5194/egusphere-egu26-4859, 2026.

Long-distance relationships between climate phenomena, known as teleconnections, provide a useful framework for linking pressure anomalies over the North Atlantic and the Arctic to regional variability of hydroclimatic series. Among these, the North Atlantic Oscillation (NAO) and the Arctic Oscillation (AO) are widely recognized as dominant modes influencing winter climate in Europe, yet their impacts on hydrological variables are known to be temporally non-stationary. We examined the influence of the NAO and AO on the intra-annual variability of monthly specific runoff, snow depth, precipitation, and air temperature. The analysis draws on long-term observations from 26 small to medium-sized catchments spanning the western Carpathians and the adjacent Pannonian Plain, covering a wide range of hydroclimatic and physiographic conditions.

To capture scale-dependent relationships, the Continuous Wavelet Transform (CWT) with a Morlet basis was applied to the hydroclimatic time series and the AO/NAO indices. Wavelet coherence was used to identify statistically significant time-frequency regions of co-variability, which are subsequently employed as spectral filters to reconstruct the oscillation-related components of the hydroclimatic signals. The relative contribution of each climate mode is quantified using a signal-to-noise ratio (SNR), defined as the ratio b between the variance of the coherent, climate-related component and the residual background variability.

The results reveal pronounced temporal intermittency in the influence of both NAO and AO, with the strongest impacts occurring during winter and spring high-flow periods. The NAO generally exhibits a stronger and more spatially coherent imprint, particularly during winter and early spring, whereas the AO contribution is weaker and more episodic. The identified non-stationary fingerprints of NAO and AO highlight the scale-dependent and time-varying nature of teleconnection controls on runoff generation and snow accumulation and may have direct implications for runoff predictability, water-resources management, and the interpretation of long-term hydroclimatic variability in Central Europe under a changing climate.

Acknowledgements

This work was supported by the Slovak Research and Development Agency, under the contract No. APVV-23-0332; VV-MVP-24-0208, and the VEGA grant agency under contract No. VEGA 2/0115/25, VEGA 1/0657/25.

How to cite: Výleta, R., Onderka, M., Kohnová, S., and Szolgay, J.: Tracing the Effects of NAO and AO Signals on Specific Runoff, Snow Depth, Precipitation and Air Temperature in the western Carpathians, EGU General Assembly 2026, Vienna, Austria, 3–8 May 2026, EGU26-5237, https://doi.org/10.5194/egusphere-egu26-5237, 2026.

EGU26-6907 | PICO | BG3.44

Limitations of LiDAR Data for Aquatic Habitat Modelling under Low-Flow Conditions 

Zuzana Štefunková and Peter Ivan

Accurate representation of river channel geometry is a key prerequisite for reliable hydraulic and aquatic habitat modelling. Traditionally, detailed field surveys combining topographic and bathymetric measurements have been used for this purpose. However, such data are time-consuming, costly, and logistically demanding, and are often unavailable for long-term or spatially extensive applications. An alternative is publicly available airborne laser scanning (LiDAR) data, which provide topographic information with high spatial resolution and full areal coverage, but do not directly capture the submerged morphology of the river channel.

Minimum flows represent critical hydrological conditions during which aquatic habitat availability and quality are strongly constrained by channel hydraulic and morphological controls. Under low-flow conditions, the spatial distribution of aquatic biota is primarily governed by water depth and flow velocity, together with the availability of morphological refugia that enable organism persistence during hydrological stress. Inadequate representation of the channel bed may therefore result in distorted hydraulic conditions and, consequently, in unreliable assessments of aquatic habitat suitability.

For this reason, the present study compares river channel geometry derived from detailed field surveys with geometry based on publicly available LiDAR-derived topographic data, with the aim of quantifying geometric distortions arising from the omission of bathymetry and evaluating their potential effects on aquatic habitat modelling under minimum-flow conditions.

The analysis was conducted on a selected reach of the Nitrica River in Slovakia, representing a small sub-mountain stream with pronounced morphological variability. Two sets of geometric inputs were compared: (i) reference geometry derived from a detailed topographic and bathymetric field survey conducted in 2019, and (ii) geometry based on LiDAR-derived topographic data from the national digital terrain model (DTM 5.0, spatial resolution 1 m, updated in 2025).

The results indicate that, for small mountain and sub-mountain streams, the exclusive use of LiDAR-based topographic data leads to substantial underestimation of flow depth and distorted representation of key habitat features. Consequently, LiDAR data cannot replace detailed bathymetric surveys for accurate aquatic habitat assessment under minimum-flow conditions, when habitat quality is primarily determined by riverbed morphology.

However, the question remains open as to the channel width and flow conditions at which water depth ceases to be the dominant factor influencing habitat suitability, even within mountain and sub-mountain streams. Identifying this threshold represents an important direction for future research, which would allow refinement of methodological guidelines regarding the applicability and limitations of publicly available LiDAR data for aquatic habitat assessment under varying hydromorphological conditions.

Acknowledgement:

This work was supported by the Slovak Research and Development Agency, under the contract No. VV-MVP-24-0208 and the VEGA grant agency under contract No. VEGA 1/0067/23.

How to cite: Štefunková, Z. and Ivan, P.: Limitations of LiDAR Data for Aquatic Habitat Modelling under Low-Flow Conditions, EGU General Assembly 2026, Vienna, Austria, 3–8 May 2026, EGU26-6907, https://doi.org/10.5194/egusphere-egu26-6907, 2026.

EGU26-8140 | PICO | BG3.44

Validation of a Sentinel-1 soil moisture product in a mountain catchment 

Patrik Sleziak, Samuel Massart, Carina VillegasLituma, Michal Danko, Martin Jančo, Juraj Parajka, Mariette Vreugdenhil, Mitra Tanhapour, and Maria-Theresia Dvorak

The European Space Agency’s Sentinel-1 mission provides observations at spatial resolutions of up to 10 m, making it more relevant not only for continental but also for regional hydrological applications. While previous studies have shown that remotely sensed soil moisture can improve runoff simulations in lowlands, the use of satellite-derived soil moisture products in mountainous environments remains limited due to challenging topography, varying climate conditions, and the lack of reference measurements. This study presents in situ soil moisture measurements collected in the Western Tatra Mountains and their comparison with a newly developed Sentinel-1 surface soil moisture product. The study was conducted in the Jalovecký Creek catchment (Western Tatras, Slovakia), which represents the typical hydrological conditions of the headwater catchments in the highest part of the Carpathian Mountains. Field campaigns were carried out at multiple open and forested sites, focusing on elevation gradients, land cover types, and aspect under different wetness conditions to capture soil moisture variability. Results from the field measurements and the validation of the satellite-derived soil moisture product will be presented.


This work was supported by the Slovak Research and Development Agency under Contracts No. APVV-23-0332 and VV-MVP-24-0208, the VEGA Grant Agency No. 2/0019/23, and the Danube Region Programme: DRP0200156 Danube Water Balance. The financial support by the Action Austria - Slovakia, Cooperation in Science and Education (project No. 2025-03-15-005) is also gratefully acknowledged.


How to cite: Sleziak, P., Massart, S., VillegasLituma, C., Danko, M., Jančo, M., Parajka, J., Vreugdenhil, M., Tanhapour, M., and Dvorak, M.-T.: Validation of a Sentinel-1 soil moisture product in a mountain catchment, EGU General Assembly 2026, Vienna, Austria, 3–8 May 2026, EGU26-8140, https://doi.org/10.5194/egusphere-egu26-8140, 2026.

EGU26-9466 | ECS | PICO | BG3.44

Micro- and mesoclimatic trends in Sopron region 

Lili Megyer-Muraközy, Péter Kalicz, Zoltán Gribovszki, Kamila Hlavčová, and Jan Szolgay Szolgay

Local meteorological measurements are essential because they provide accurate information for regions with unique climatic and geographical characteristics. In this study, data from Sopron’s Botanical Garden and Hermes meteorological stations were digitized and quality controlled. Due to its location, the Hermes station offers valuable insight into sub-montane forest climate conditions, while the Botanical Garden represents a peri-urban, forested park microclimate.  Based on data availability, different periods were compared (Botanical Garden: 1930–1960, 1989–2019; Hermes: 2014–2023) with Sopron’s official reference station (Kuruc hill) using basic statistical methods, including time-series analysis and precipitation frequency analysis. In addition, SPI (Standardized Precipitation Index) applied to the datasets.

The results indicate microclimatic differences among the stations. Hermes proved to be the coolest and wettest site, with a higher frequency and magnitude of daily precipitation events compared to the urban park station. Over the past 30 years (1989–2019), mean air temperature increased significantly relative to the reference period of 1930–1960 The SPI analyses of the Botanical and Kuruc Hill show a very high similarity, but the Botanical Garden has less extreme negative (drought-related) values. There are larger differences between the Kuruc Hill and Hermes SPI. Hermes SPI shows a more stable, drought-resistant picture, with fewer negative values ​​than the Kuruc Hill, which has a drying tendency. SPI analysis reveals that urban environments experience more frequent and persistent drought conditions than forested areas. These datasets effectively capture micro- and mesoclimatic trends in the Sopron region and can provide a robust basis for validating climate models or other climate related analyses.

This research was supported by the Hungarian Ministry of Agriculture. This study was financially supported by the Slovak Research and Development Agency under Contract No. APVV 23-0332 and VEGA Grant under Contact No. 1/0577/23. This study was financially supported by The Programme for Motivation and Support for Increasing the Quality and Efficiency of Scientific Research Activities of Young Researchers, Contract No. 1636.The research was supported by the OTKA grant 143972SNN, the Slovenian Research and Innovation Agency grant N2-0313 and the associated project TKP2021-NKTA-43. The project TKP2021-NKTA-43 was implemented with the support of the Ministry of Innovation and Technology through the National Fund for Research Development and Innovation, funded by the TKP2021-NKTA call for proposals.

How to cite: Megyer-Muraközy, L., Kalicz, P., Gribovszki, Z., Hlavčová, K., and Szolgay, J. S.: Micro- and mesoclimatic trends in Sopron region, EGU General Assembly 2026, Vienna, Austria, 3–8 May 2026, EGU26-9466, https://doi.org/10.5194/egusphere-egu26-9466, 2026.

Urban areas are increasingly exposed to compound hydrometeorological extremes, particularly combinations of heat waves and moisture anomalies, which strongly affect vegetation vitality and urban microclimate. Urban green infrastructure represents a key adaptation measure; however, its performance under compound stress conditions requires systematic evaluation at the local scale.

This study assesses the response of urban vegetation and surface thermal patterns to compound heat-related stress in selected public spaces within the city of Trnava (Slovakia) using satellite-derived indicators. Multispectral satellite imagery from Sentinel-2 and Landsat missions was used to derive the Normalized Difference Vegetation Index (NDVI) and Land Surface Temperature (LST), serving as proxies for vegetation condition and surface heat load. The data were subjected to spatially explicit processing and comparative analysis to identify patterns of vegetation vitality and cooling effects across different urban surface types.

The analysis focuses on periods characterized by elevated temperatures combined with limited moisture availability, representing typical compound stress conditions in urban environments. The results reveal pronounced spatial variability in vegetation resilience and cooling efficiency, highlighting the importance of vegetation structure, coverage, and spatial configuration in mitigating urban heat. The findings demonstrate the applicability of satellite-based approaches for evaluating nature-based solutions and provide practical implications for urban climate adaptation, green infrastructure planning, and the design of climate-resilient public spaces in medium-sized cities.

Acknowledgements

This work was supported by the Slovak Research and Development Agency, under the contract No. APVV-23-0332; VV-MVP-24-0208, and the VEGA grant agency under contract No. VEGA 1/0577/23 and VEGA 2/0115/25 and Programme for Motivation and Support for Increasing the Quality and Efficiency of Scientific Research Activities of Young Scientific Researchers (project name: COMPLANT)

How to cite: Bohumelová, L. and Výleta, R.: Satellite-Based Assessment of Urban Green Infrastructure under Compound Heat Stress in the City of Trnava, Slovakia, EGU General Assembly 2026, Vienna, Austria, 3–8 May 2026, EGU26-9546, https://doi.org/10.5194/egusphere-egu26-9546, 2026.

EGU26-16745 | PICO | BG3.44

Carbon stock of the Austrian-Hungarian border region 

Pál Balázs, Adrienn Horváth, András Polgár, and András Bidló

Due to the changing climate, there has been a growing interest in solutions to reduce the carbon dioxide content of the atmosphere in recent decades. The utilization of the natural potential and the applied land uses in a given area directly affect the sequestration of carbon dioxide from the atmosphere. Within the framework of our research, we aim to estimate the carbon sequestration and carbon storage capacity of the Austrian-Hungarian border region based on land use.

We utilized the land cover categories of the CORINE database, which is available for a significant portion of Europe. Based on the literature sources and our own measurement results for the border region, we assigned potential carbon storage values ​​to the land cover categories, which allows us to estimate the amount of stored carbon for the entire region. In addition to determining the current carbon storage capacity value, the database also allows us to track past changes in the region's carbon storage using the CORINE land cover maps, which are updated every six years.

The research was carried out within the framework of the CS4Region project, identification number ATHU-0100046, with the support of the INTERREG AT-HU 2021-2027 program.

How to cite: Balázs, P., Horváth, A., Polgár, A., and Bidló, A.: Carbon stock of the Austrian-Hungarian border region, EGU General Assembly 2026, Vienna, Austria, 3–8 May 2026, EGU26-16745, https://doi.org/10.5194/egusphere-egu26-16745, 2026.

EGU26-16844 | PICO | BG3.44

Organic carbon stocks in the soils of western Hungarian forests 

András Bidló, Pál Balázs, Péter Végh, and Adrienn Horváth
One of the most important causes of global climate change is the increased CO2 content of the atmosphere. The most important CO2 sinks on Earth are terrestrial ecosystems, particularly forests, whose organic carbon reserves are stored approximately half in the soil in temperate zones. By changing land use, we have the opportunity to increase carbon dioxide and carbon sequestration. In our research, we investigated the possibility of increasing carbon sequestration in the Austrian-Hungarian border region, primarily through geoinformatics data processing. To validate the geoinformatics data, we measured the amount of organic carbon stored in the soil in 40 forest stands in the area.
 
In the selected forest stands, we took samples every 10 cm from the top 40 cm layer of soil to determine the organic carbon content. During sampling, we took both undisturbed and disturbed samples. In addition to soil samples, we also took litter samples and recorded forest stands. The samples were examined in the soil science laboratory of the University of Sopron.   
 
The pH of the examined soils ranged from 3.9 to 8.1 pH(H2O). The average pH of the individual layers, from top to bottom, was 4.93, 4.78, 4.84, and 4.97 pH(H2O).As the results show, the top layer of soil was affected by leaching. We also examined the physical properties of the soil by the proportion of silt+clay particles that ranged from 11 to 65%, with an average of 43.55, 44.95, 46.78, and 48.45% from top to bottom. Loam was the main physical texture, and due to clay migration, the clay content increased downward, but there were also layers with coarse sand physical texture. The physical composition of the soils depended largely on the bedrock. The organic matter content (SOM) of the soil layers examined ranged from 0.54 to 2.16%. Naturally, the higher values were found in the top 10 cm layer, while the lower values were found between 30 and 40 cm. The amount of organic carbon stored in the top 40 cm layer of soil varied between 16 and 81 C t/ha, with an average of 44 C t/ha. The bedrock, soil quality, and forest composition greatly influenced the amount. Our data can contribute to the refinement of carbon stock estimates obtained using geoinformatics methods.
 
This research was funded by the Interreg CS4Region (ATHU-0100046) project "Analysis and utilization of natural and technical carbon sinks in the Hungarian-Austrian border region." Some of the tools used in the research were acquired as part of the project "Investigation of the conditions for woody biomass production - GINOP-2.3.3-15-2016-00039".


How to cite: Bidló, A., Balázs, P., Végh, P., and Horváth, A.: Organic carbon stocks in the soils of western Hungarian forests, EGU General Assembly 2026, Vienna, Austria, 3–8 May 2026, EGU26-16844, https://doi.org/10.5194/egusphere-egu26-16844, 2026.

Climate change impact assessments frequently rely on synthetic or downscaled meteorological datasets that may lack essential climatic variables such as humidity, radiation, and wind speed. This deficiency restricts the applicability of classical reference evapotranspiration (ETo) models, particularly the FAO-56 Penman-Monteith approach, which requires multiple climatic inputs and thus introduces additional uncertainty. This study aims to develop a data-efficient methodology for estimating ETo and irrigation water requirements using only temperature and precipitation, variables that are more readily available and less uncertain in climate generators. Two modelling approaches for ETo are evaluated: machine learning and optimised empirical equations. Machine learning models were trained on CarpatClim database. Although this database only contains data up to 2010, the authors of the study show the advantages of using such products for training models that can be used for future periods and for prospective studies of the impact of climate change. Daily ground-based meteorological records from the case study region also support calibration and validation. Model performance is assessed using a range of statistical measures.

Results indicate that machine learning models can accurately estimate ETo with minimal input data, outperforming empirical equations in both accuracy and predictive robustness. The estimated ETo values are incorporated into a water balance framework to determine irrigation water abstractions, accounting for soil moisture conditions, precipitation deficits, and plant water demand. For this purpose, a custom model based on the FAO CROPWAT model was created in the R language. These findings demonstrate the potential of a hybrid machine learning and water balance approach for assessing evapotranspiration and irrigation requirements under limited data conditions.

The proposed methodology offers significant benefits for climate change impact studies, agricultural water planning, and regions with incomplete meteorological observations. It also advances the practical implementation of data-light irrigation modelling, supporting broader applications in hydrological and environmental management.


Keywords: reference evapotranspiration, machine learning, CarpatClim database

How to cite: Cisty, M.: Robust Evapotranspiration Estimation Under Limited Data Conditions, EGU General Assembly 2026, Vienna, Austria, 3–8 May 2026, EGU26-17774, https://doi.org/10.5194/egusphere-egu26-17774, 2026.

EGU26-18660 | ECS | PICO | BG3.44

Combating climate change through the use of biochar - Preliminary results on the effects of biochar application on different forest soils 

Adrienn Horváth, Pál Balázs, Péter Felvidéki, and András Bidló
The application of biochar (a stable carbon-rich material produced by pyrolysis under oxygen-limited conditions) in forests can simultaneously contribute to improving soil water-retention capacity and mitigating climate change. In forest soils, biochar’s fine pore structure and large specific surface area may have beneficial effects on soil structure: it can increase porosity, enhance the aggregation of soil particles, and provide more “micro-storage” sites for water. This may be particularly important in coarser-textured soils that dry out rapidly, where biochar can help a portion of precipitation remain longer in the root zone, thereby reducing drought stress and improving the survival prospects of natural regeneration and seedlings. Beyond water, biochar may also support nutrient retention: in certain cases, it can reduce nutrient leaching and create more favorable microhabitats for soil biota, which can indirectly enhance the stability of the soil water–nutrient balance.
From a climate-mitigation perspective, the key benefit of biochar is that it can “lock” part of the plant-derived carbon into a more persistent form in the soil: instead of quickly returning to the atmosphere as carbon dioxide, it can contribute to increasing soil carbon stocks over longer time scales. In addition, if biochar is produced from local biomass residues and applied in a well-considered manner, it can become part of a circular economy approach and support forest climate adaptation (for example, by improving resilience during drier periods). In our studies, the optimal dose determined in laboratory germination-inhibition tests and pot experiments is being applied to three forest sites with different soil types. Even from our measurements so far, it has become evident that the effect strongly depends on the biochar feedstock and production conditions, the soil type, and the application method and rate. Therefore, in forest settings, small-scale pilot trials and monitoring are especially justified to ensure that water-management benefits are actually realized.
The research was supported by the INTERREG AT-HU 2021-2027 CS4Region "A green and resilient border region" project.

How to cite: Horváth, A., Balázs, P., Felvidéki, P., and Bidló, A.: Combating climate change through the use of biochar - Preliminary results on the effects of biochar application on different forest soils, EGU General Assembly 2026, Vienna, Austria, 3–8 May 2026, EGU26-18660, https://doi.org/10.5194/egusphere-egu26-18660, 2026.

EGU26-19373 | PICO | BG3.44

September 2024 floods in the Slovak part of the Morava and Danube River basins 

Katarina Kotrikova, Zuzana Danacova, Tomas Boraros, Daniel Dzurik, and Robert Zlatinsky

Slovakia, like many other countries, has experienced an increase in extreme weather conditions caused by climate change. At the beginning of September 2024, following an extremely warm and dry period, a significant shift to cold autumn weather occurred, particularly in western Slovakia, accompanied by heavy precipitation and strong winds. According to forecasts, continuous heavy rainfall was expected over five days, which was expected to alleviate the dry conditions across the entire region. The rainfall was also anticipated to cause a significant rise in water levels, potentially reaching flood stages and increasing the risk of flooding.

The discharge rates of surface water during the summer months reached very low values. In some cases, they were close to reaching absolute minima at water gauging stations. August was evaluated as the driest month in 2024, after the aforementioned extraordinary precipitation totals on 11.9. – 16.9.2024, with a recurrence period of up to 200 years, there was a significant change in the hydrological situation, especially in the Slovak part of the Morava and Danube River basins. Significant increases in the water levels were recorded. During this time, 64 direct discharge measurements were carried out on fourteen rivers in the Morava River basin, and another 34 direct measurements on 4 rivers in the Danube River basin. To assess the impact of the extreme situation, the obtained data were analyzed, and the hydrological situation was evaluated.


Keywords: September 2024, floods, Morava River basin, Danube River basin


Acknowledgment: This work was supported by the Slovak Research and Development Agency under the Contract no. APVV-23-0332 and as part of project „Udržitelné hospodaření s podzemními vodami v česko-slovenském příhraničí“, ITMS21+:403201DNJ4, an Interreg Slovensko-Česko 2021-2027 Programme project co-funded by the European Union.

How to cite: Kotrikova, K., Danacova, Z., Boraros, T., Dzurik, D., and Zlatinsky, R.: September 2024 floods in the Slovak part of the Morava and Danube River basins, EGU General Assembly 2026, Vienna, Austria, 3–8 May 2026, EGU26-19373, https://doi.org/10.5194/egusphere-egu26-19373, 2026.

EGU26-20985 | ECS | PICO | BG3.44

Field-based identification of near-surface lateral flow in a forested hillslope catchment 

Dániel Koch, Fruzsina Kata Majer, Miklós Pap, Enikő Anna Tamás, Gábor Keve, Gergely Ámon, and Zsombor Illés

Climate change is expected to increase the frequency and volume of short-duration, high-intensity rainfall events in many regions. These changes can strongly affect runoff generation processes in hilly catchments, where rapid subsurface flow responses may play a key role during extreme precipitation events. However, direct field-based evidence of near-surface lateral flow (interflow) at the hillslope scale remains limited.

This study presents field-based evidence of near-surface lateral flow in a small forested hillslope catchment in southern Hungary. The investigation combines multi-depth soil moisture monitoring with a plot-scale controlled infiltration experiment to analyse subsurface water movement under intense water input conditions. Volumetric soil water content was measured at depths between 10 and 100 cm using frequency domain reflectometry (FDR) sensors, providing high temporal resolution data during infiltration events. In parallel, an artificial rainfall experiment was carried out on a bordered hillslope plot to enable event-based water balance estimation.

Soil profile observations revealed a vertically heterogeneous soil with a shallow humic layer, an underlying permeable horizon, and a clay-enriched subsoil showing signs of temporary saturation. This vertical structure creates a hydraulic contrast that restricts vertical percolation during intense infiltration. As expected, soil moisture measurements showed rapid wetting in the upper soil layers, while deeper layers responded more slowly. Water balance calculations indicated that a considerable part of the water applied to the surface could not be detected in the change of the vertical soil water storage, suggesting a subsurface lateral flow distribution within the near-surface soil layers.

The timing and depth distribution of soil moisture responses, together with the water balance results, provide consistent evidence for the activation of near-surface lateral flow along soil horizon boundaries with contrasting hydraulic properties. The findings highlight the importance of subsurface flow processes in forested hillslope hydrology and underline the need to consider near-surface lateral flow when assessing runoff generation under increasingly extreme rainfall conditions.

How to cite: Koch, D., Majer, F. K., Pap, M., Tamás, E. A., Keve, G., Ámon, G., and Illés, Z.: Field-based identification of near-surface lateral flow in a forested hillslope catchment, EGU General Assembly 2026, Vienna, Austria, 3–8 May 2026, EGU26-20985, https://doi.org/10.5194/egusphere-egu26-20985, 2026.

With the Agreement on the Conservation and Sustainable Use of Marine Biological Diversity of Areas beyond National Jurisdiction (BBNJ Agreement) entering into force on January 17, 2026, the governance landscape for the global ocean has fundamentally shifted. However, current Integrated Assessment Models remain largely “dematerialized,” effectively modeling the carbon mitigation but failing to account for the plastic cycle—an anthropogenic flux that explicitly threatens the “carbon cycling services” the BBNJ Agreement is now legally mandated to protect. Consequently, current scenarios could underestimate the complex chemical reactions resulted by the production, accumulation, and degradation of synthetic polymers.

We propose an AI-Enhanced Material Flow Analysis (AI-MFA). Rather than building a computationally expensive process-based module from scratch, we leverage Ensemble Machine Learning (specifically Random Forest and Gradient Boosting Regressors)—methods identified as robust and accessible in the state-of-the-art sustainability AI literature. Firstly, we train the ML ensemble on historical industrial ecology datasets (OECD Global Plastics Outlook, World Bank “What a Waste 2.0”) to learn the non-linear correlations between socio-economic drivers (GDP, urbanization, industrial structure) and plastic flows. Secondly, we apply these trained models to the deterministic socio-economic drivers of the Shared Socioeconomic Pathways (SSPs) used in CMIP6 and proposed for CMIP7. This allows us to “project” the plastic reality into the future for scenarios ranging from SSPs to emission-driven pathways in ScenarioMIP-CMIP7. Thirdly, we estimate three critical fluxes: (a) the production material wedge, (b) the accumulated environmental stock, and (c) the degradation impact potential.

We anticipate establishing a “Plastic Intensity Baseline” for current CMIP7 pathways. Preliminary hypothesis testing suggests that regional rivaly scenarios (e.g., SSP3) contain a “material blind spot” equivalent to substantial unmodeled material pollution. By quantifying the “Plastic Biogeochemial Wedge”—the divergence between the baseline and the circular economy. This metric will serve as a proxy for evaluating whether specific climate pathways risk violating the BBNJ Agreement's mandate to maintain ecosystem integrity in areas beyond national jurisdiction.

How to cite: Park, H., Song, C., and Lee, W.-K.: An AI-Driven Quantification of the Plastic Biogeochemical Wedge in CMIP6/CMIP7 Scenario Pathways, EGU General Assembly 2026, Vienna, Austria, 3–8 May 2026, EGU26-21570, https://doi.org/10.5194/egusphere-egu26-21570, 2026.

EGU26-353 | ECS | Orals | CL4.4

A westward shift of heatwave hotspotscaused by warming-enhanced land–aircoupling 

Kaiwen Zhang, Zhiyan Zuo, Wei Mei, Renhe Zhang, and Aiguo Dai

Heatwaves pose serious risks to human health and lives, but how their occurrence patterns may change under global warming remains unclear. Here we reveal a systematic westward shift of heatwave hotspots across the northern mid-latitudes around the late 1990s. Both observational analysis and numerical simulation show that this shift is caused by intensified soil moisture–atmosphere coupling (SAC) in eastern Europe, Northeast Asia and western North America under recent background warming. The strengthened SAC shifted the atmospheric high-amplitude Rossby wavenumber-5 pattern westwards to a preferred phase position, which increased the probability of the occurrence of high-pressure ridges over these 3 hotspots by a factor of up to 39. Our results highlight the importance of SAC in shaping heatwave patterns and large-scale atmospheric circulation and challenge the conventional view that the land surface only passively responds to atmospheric forcing.

How to cite: Zhang, K., Zuo, Z., Mei, W., Zhang, R., and Dai, A.: A westward shift of heatwave hotspotscaused by warming-enhanced land–aircoupling, EGU General Assembly 2026, Vienna, Austria, 3–8 May 2026, EGU26-353, https://doi.org/10.5194/egusphere-egu26-353, 2026.

EGU26-700 | ECS | Orals | CL4.4

Fluxes, Feedbacks, and Memory: Untangling Chamoli’s Seasonal Land–Atmosphere Coupling 

Rahul Jaiswal, Manish Kumar Pandey, and Sunita Verma

Chamoli district, located in the Garhwal Himalaya of Uttarakhand, functions as a critical ecological buffer connecting mountain environments with downstream river systems. Its complex terrain, diverse biota, and glacier-fed rivers play an essential role in sustaining regional water resources and enhancing climate resilience. Despite its importance, studies exploring the land–atmosphere coupling processes in this climate-resilient region remain scarce.

In this work, we employ an information-theoretic approach to examine seasonal land–atmosphere interaction networks using key variables: precipitation (P), temperature (T), latent heat flux (LH), sensible heat flux (SH), wind speed (WS), incoming shortwave radiation (SWL), and relative humidity (Q). The analysis is conducted for four seasons: pre-monsoon (MAM), monsoon (JJAS), post-monsoon (ON), and winter (DJF). The derived networks distinguish between two types of links: instantaneous (real-time) and lagged (memory-controlled). Entropy-based diagnostics indicate that MAM and JJAS exhibit the highest dynamical variability, DJF represents the most quiescent period, and ON behaves as a transitional regime for Chamoli. Wind speed exerts a dominant real-time control on precipitation and also shows delayed influences at higher altitudes. In general, real-time coupling is strongest during the monsoon season, whereas comparatively enhanced memory-driven relationships mark winter.

The pre-COVID and post-COVID periods are compared to assess changes in information flow; we find that entropy deviation decreased around 2019, then increased after 2021. These findings refine our understanding of land–atmosphere dynamics over Chamoli and provide a reference state for evaluating future changes arising from natural climate variability and anthropogenic forcing.

Keywords—Land-atmospheric interaction; information-centric method; real-time interaction; entropy.

How to cite: Jaiswal, R., Pandey, M. K., and Verma, S.: Fluxes, Feedbacks, and Memory: Untangling Chamoli’s Seasonal Land–Atmosphere Coupling, EGU General Assembly 2026, Vienna, Austria, 3–8 May 2026, EGU26-700, https://doi.org/10.5194/egusphere-egu26-700, 2026.

Vegetation plays a crucial role during heatwaves by altering surface energy partitioning and influencing local to regional climate. In addition to the thermodynamic response of vegetation, the differential heating caused by sensible heat gradients across adjacent regions of vegetation and dry, bare soil can generate a mesoscale circulation akin to sea breeze-like circulation, known as a ‘vegetation breeze’1, which redistributes heat and moisture and affects downwind regions. While the impacts of large‑scale heterogeneities such as land-sea contrasts and topography are well established, the influence of finer‑scale vegetation heterogeneity remains uncertain. This gap is critical because semi‑arid forests, covering nearly 18% of Earth’s land surface, are highly sensitive to heat extremes. Differences in their Bowen ratios can substantially alter surface energy budgets, producing varying levels of hydroclimatic stress under similar atmospheric forcing. Yet, their potential to amplify or mitigate the impacts of extreme heat events is still poorly understood.

This study focuses on the semi-arid deciduous forests of the Eastern Ghats in Peninsular India, which are part of the Nagarjulam Srisilam Tiger Reserve and neighbouring protected areas  located along the ecotone between the dry Deccan Plateau and the Eastern coast.  It is spread over 5 districts in Andhra Pradesh and Telangana which are known to experience extreme heatwaves. Our previous observational analyses show that these transitional forests are highly sensitive to climatic stressors, particularly through their land surface temperature (LST) and evapotranspiration responses. During heatwave events, we observed pronounced LST gradients between forested and adjacent non-forested areas, indicating strong surface thermal contrasts arising from vegetation-atmosphere interactions. Given the heightened climate sensitivity of these transitional ecosystems, it is essential to understand not only how these ecosystems respond to extreme heat but also how they may influence local atmospheric dynamics.

To address this, we investigate how vegetation driven circulations such as the ‘vegetation breeze’ and the canopy convector effect2 emerge from land surface heterogeneity, and how these processes affect boundary layer processes and downwind thermal anomalies during heatwaves. Our approach combines atmospheric reanalysis data for large‑scale boundary conditions, satellite observations to characterize land surface and vegetation, and high‑resolution WRF simulations to resolve fine‑scale forest-atmosphere feedbacks. Through a series of forest‑configuration experiments, we assess the capacity of semi‑arid forests to alter boundary layer processes and explore the implications for local and regional modification of extreme events as well as downwind impacts. By isolating the role of semi‑arid forests during heatwaves, these experiments contribute to the mechanistic understanding of semi-arid forest-atmosphere interactions and their role in shaping hydroclimatic extremes under a changing climate.


References

[1] McPherson, R. A. (2007). A review of vegetation—atmosphere interactions and their influences on mesoscale phenomena. Progress in Physical Geography, 31(3), 261-285.

[2] Banerjee, T., De Roo, F., and Mauder, M.: Explaining the convector effect in canopy turbulence by means of large-eddy simulation, Hydrol. Earth Syst. Sci., 21, 2987–3000, https://doi.org/10.5194/hess-21-2987-2017, 2017. 


How to cite: Sen, D. and Monteiro, J.: Vegetation-Driven Circulations and Their Modification During Heatwaves: Insights into the Downwind Impacts of Semi-Arid Forests in Peninsular India, EGU General Assembly 2026, Vienna, Austria, 3–8 May 2026, EGU26-945, https://doi.org/10.5194/egusphere-egu26-945, 2026.

EGU26-1052 | ECS | Posters on site | CL4.4

Analysis of the Relationship Between Soil Moisture and Precipitation Across Heat Stress Categories 

Manali Saha, Vishal Dixit, and Karthikeyan Lanka

Extreme heat stress events are marked by significant deviations in surface air temperature that surpass the typical climatological range, coupled with increased atmospheric humidity. These events are characterised by their intensity, duration, and spatial extent, often crossing thresholds critical for both human and terrestrial ecosystem functioning. At the local scale, land-atmosphere interactions during these heat extremes modulate stress on soil and vegetation by altering energy partitioning, boundary layer feedbacks, and soil moisture memory. During these episodes, evapotranspiration is constrained due to low soil moisture (SM) conditions, leading to increased sensible heat and temperatures, which serve as the primary thermodynamic pathway for heat amplification. In conditions characterized by high soil moisture (SM), light precipitation (P) occurs, with an increase in latent heat flux may elevate atmospheric humidity and exacerbate heat stress, underscoring the nonlinear and stress-dependent nature of SM–P interactions. Despite the centrality of these processes, the relationship between SM and P across diverse heat stress regimes in South Asia remains insufficiently explored.

In this study, the Weather Research and Forecasting (WRF) model is employed to simulate an extreme heat stress event that occurred in May 2015 in the Indo-Gangetic Plains of India, utilizing initial and boundary conditions from the ERA5 dataset. To examine the SM-P feedback relationship, the initial SM is perturbed by 25% and 50% to represent a full spectrum of heat stress conditions (no stress, caution, danger, and extreme danger). Under no-stress conditions, the SM-P feedback exhibits a typical convex-concave relationship on the E[PSM] curve. However, as the heat stress intensifies, this relationship is broken. Extremely hot and deeply mixed boundary layers inhibit the development of moist convection, raising the lifting condensation level (LCL). Although cloud formation may still occur, the environmental conditions are insufficient to trigger heavy precipitation. The presence of upper-level anticyclones during this time period further suppresses vertical motion, reinforcing atmospheric stability and preventing convective initiation. Overall, the analysis highlights that an intermediate soil moisture range of approximately 0.25–0.35 m³/m³ maximizes land–atmosphere coupling strength in the IGP during extreme heat events. Within this range, the surface is sufficiently moist to sustain strong evapotranspiration yet dry enough to produce high surface temperatures, creating a feedback loop that exacerbates heat stress. These findings underscore the importance of accurately representing soil moisture dynamics in regional climate models to improve predictions of heat extremes in South Asia.

How to cite: Saha, M., Dixit, V., and Lanka, K.: Analysis of the Relationship Between Soil Moisture and Precipitation Across Heat Stress Categories, EGU General Assembly 2026, Vienna, Austria, 3–8 May 2026, EGU26-1052, https://doi.org/10.5194/egusphere-egu26-1052, 2026.

EGU26-1932 | Orals | CL4.4

Oceanic-versus-terrestrial influences on land humidity: simulations and theory 

Michael Byrne, Andrew Chingos, Joshua Duffield, Marysa Laguë, and Paul O'Gorman

Humidity over land is a key climate variable that is strongly coupled to mean and extreme temperatures, to precipitation and evapotranspiration, and to wildfires. Understanding the processes controlling the climatology of land humidity and its response to a changing climate is a fundamental scientific question with important societal implications. Here we use a global climate model with tagged water tracers to directly diagnose the sources of land specific humidity over a range of climate states. The simulations isolate the contributions to land humidity from water evaporated: (i) from the land surface ("terrestrial source"); and (ii) from the ocean surface ("oceanic source"). The control simulation reveals that land humidity in most regions and for most months of the year is dominated by the oceanic source, i.e. water evaporated from the ocean and advected over land. The terrestrial source is important in some inland regions, for example Eurasia, and during Jun-Jul-Aug, when advection is weaker in the northern hemisphere. Under climate change, the oceanic source dominates changes in land humidity at all latitudes but with a non-negligible contribution from the terrestrial source. The results are interpreted using a conceptual box model which predicts that the terrestrial and oceanic moisture sources scale equally with warming, implying equal fractional changes in land and ocean humidity. Implications of these new results for understanding the large biases in observed versus simulated land humidity trends over the historical period are discussed.

How to cite: Byrne, M., Chingos, A., Duffield, J., Laguë, M., and O'Gorman, P.: Oceanic-versus-terrestrial influences on land humidity: simulations and theory, EGU General Assembly 2026, Vienna, Austria, 3–8 May 2026, EGU26-1932, https://doi.org/10.5194/egusphere-egu26-1932, 2026.

The El Niño event exerts a profound influence on the global carbon cycle by perturbing terrestrial photosynthesis through environmental stress. Plant isoprene emissions respond rapidly to such environmental stress, yet it remains unclear whether isoprene can capture the spatiotemporal evolution of El Niño. Here, we used satellite-derived global isoprene emissions for the first time to assess their dynamical response to the 2015–2016 El Niño. We observed that isoprene emissions increase by up to ~30% relative to the climatological mean, with pronounced anomalies emerging across tropical ecosystems. The spatiotemporal evolution of these anomalies closely aligns with the El Niño progression, as indicated by sea surface temperature anomalies in the equatorial Pacific. In contrast, commonly used satellite vegetation products, including leaf area index (LAI) and solar-induced chlorophyll fluorescence (SIF), exhibit weaker and spatially incoherent responses. These results demonstrate that satellite-derived isoprene provides a sensitive and mechanistically grounded tracer of ecosystem stress, offering a complementary perspective for monitoring the impacts and propagation of extreme climate events on terrestrial ecosystems.

How to cite: Liu, H., Prentice, I. C., and Morfopoulos, C.: Satellite‐derived isoprene emissions trace the spatiotemporal evolution of the 2015-2016 El Niño across terrestrial ecosystems, EGU General Assembly 2026, Vienna, Austria, 3–8 May 2026, EGU26-2949, https://doi.org/10.5194/egusphere-egu26-2949, 2026.

EGU26-3005 | Orals | CL4.4 | Highlight

Climate extremes and ecosystem disturbance feedbacks 

Ana Bastos, Francisco José Cuesta-Valero, Albert Jornet Puig, Nora Linscheid, Yimian Ma, Laura Mayer, João Martins Basso, and Johannes Quaas


Climate extremes have direct impacts on ecosystems, for example reduced productivity during heat-drought events, but often their impact is amplified by compounding ecosystem disturbances, such as wildfires or insect outbreaks.  Through their impact on ecosystem functioning and structure, compound climate extremes and ecosystem disturbances modulate land-atmosphere exchanges of water, energy, and greenhouse-gases, which in turn influence atmospheric properties from local to global scales, thus feeding-back to climate change.  Recent observations indicate that such feedbacks are, however, non-negligible and might result in a much weaker role of the biosphere in climate change mitigation, especially under high emission scenarios.

Currently, ecosystem disturbances are not appropriately represented in most Earth System Models, which implies that extreme-event induced climate-biosphere feedbacks are likely overlooked in future climate simulations. Here, we will examine observation-based evidence for extreme-event induced climate-biosphere feedbacks through CO2 and land-atmosphere water and energy exchanges at different scales. We will then showcase recent developments in simulating some of these feedbacks in a global land-surface model and discuss the resulting implications for climate change adaptation and mitigation.  

How to cite: Bastos, A., Cuesta-Valero, F. J., Jornet Puig, A., Linscheid, N., Ma, Y., Mayer, L., Martins Basso, J., and Quaas, J.: Climate extremes and ecosystem disturbance feedbacks, EGU General Assembly 2026, Vienna, Austria, 3–8 May 2026, EGU26-3005, https://doi.org/10.5194/egusphere-egu26-3005, 2026.

EGU26-4152 | ECS | Orals | CL4.4

Tropical Forest Canopy Thermoregulation Observed from Space 

Akash Verma and Iain Colin Prentice

Canopy temperature (Tc) is a key regulator of plant physiological processes, growth, and productivity, and serves as an indicator of surface energy partitioning and plant water status. Despite its importance, many dynamic vegetation models implicitly assume Tc to be equal to air temperature (Tair); while land surface models calculate an effective surface temperature based on energy balance, but typically have not evaluated this calculation against data. Using satellite-derived land surface temperature as a proxy for Tc, in combination with ERA5-Land Tair, we assessed whether tropical rainforests actively thermoregulate Tc relative to Tair. We find that ΔT (Tc – Tair) follows a consistent diurnal cycle, which is primarily controlled by diurnal variations in net radiation. Forest canopies are cooler than air at night, warm early in the morning and cool again below Tair in late afternoon. During the hottest part of the day, the slope (β) of the canopy-air relationship indicates strong megathermy in dry forests, while humid forests show responses ranging from limited homeothermy to megathermy depending on their capacity to dissipate heat. Humid forests with sufficient water availability show buffering of Tc against Tair variability through evaporative cooling, whereas dry forests frequently experience canopy warming as aridity constrains evaporative cooling. In humid forests, this evaporative cooling persists through the wet season but weakens—or reverses to canopy warming—during the dry season as water stress intensifies. Together, these findings provide an observational benchmark for improving the representation of canopy temperature, evaporative cooling, and vegetation–atmosphere energy and water exchanges in land-surface models.

How to cite: Verma, A. and Prentice, I. C.: Tropical Forest Canopy Thermoregulation Observed from Space, EGU General Assembly 2026, Vienna, Austria, 3–8 May 2026, EGU26-4152, https://doi.org/10.5194/egusphere-egu26-4152, 2026.

EGU26-4364 | ECS | Posters on site | CL4.4

Urban irrigation reduces moist heat stress in Beijing, China 

Shuai Sun, Chunxiang Shi, Qiang Zhang, Tao Zhang, and Junxia Gu

Although urban irrigation can modulate local hydrothermal conditions and mitigate urban heat island effects, its impact on moist heat stress (MHS) is poorly understood. Employing the Weather Research and Forecasting Single-Layer Urban Canopy Model (WRF-SLUCM), we evaluated the effect of urban irrigation on the MHS in Beijing, China Using the CMA-RA V1.5 reanalysis dataset and CLDAS-V3.0 soil moisture as boundary conditions. Taking the hot and humid weather events that occurred in Beijing in May and August 2022 as examples,we found that the updated initial soil moisture (SM) field improved the simulation of temperature, relative humidity, and wind speed. Besides, urban irrigation reduced urban and rural MHS, and particularly reduced afternoon and evening MHS by up to 1.2 °C but increased morning MHS by up to 0.4 °C. In addition, the effect of different irrigation times on MHS showed that irrigation at 02 and 20 h increased urban and rural MHS, with the best cooling effect at 00 and 13 h, which reduced the MHS by up to 2.65 °C in urban areas and 0.71 °C in rural areas. The findings highlighted mechanistically the effect of urban irrigation on MHS and shed light on how to mitigate urban heat island effects on urban sustainable development.

How to cite: Sun, S., Shi, C., Zhang, Q., Zhang, T., and Gu, J.: Urban irrigation reduces moist heat stress in Beijing, China, EGU General Assembly 2026, Vienna, Austria, 3–8 May 2026, EGU26-4364, https://doi.org/10.5194/egusphere-egu26-4364, 2026.

The impacts of deforestation over the Maritime Continent (MC) have increasingly raised concerns due to its potential influence on extreme rainfall during the early summer monsoon. This study investigates how MC deforestation modifies extreme rainfall characteristics and associated large-scale circulation responses during May–June (MJ) using 100-year simulations from the Community Earth System Model (CESM1). A control simulation is compared with a deforestation experiment in which MC forests are replaced by grassland, and rainfall changes are quantified using indices defined by the Expert Team on Climate Change Detection and Indices (ETCCDI). Results show that deforestation substantially enhances extreme rainfall over the MC and induces a pronounced rainfall regime shift from weakened light rainfall toward strengthened heavy rainfall, driven by increased atmospheric instability and intensified deep convection. In contrast, rainfall over South China-Taiwan (SCTW) decreases significantly, with both light and extreme rainfall being suppressed. Mechanism analyses indicate that enhanced MC convection induces a meridional circulation response, characterized by anomalous ascent over the tropics and subsidence over SCTW. This subsidence causes tropospheric stabilization, reduced cloud cover, and weakened southwesterly monsoon moisture transport, creating unfavorable conditions for rainfall development over SCTW. Overall, MC deforestation drives a coherent redistribution of early summer monsoon rainfall, featuring an extreme rainfall-dominated regime shift over the MC and circulation-induced rainfall suppression over subtropical East Asia, highlighting the role of tropical land-use change in modulating extreme rainfall and monsoon circulation during the early summer monsoon.

How to cite: Chen, Y.-C. and Huang, W.-R.: Maritime Continent Deforestation-Induced Extreme Rainfall Regime Shifts During the Early Summer Monsoon Season, EGU General Assembly 2026, Vienna, Austria, 3–8 May 2026, EGU26-4627, https://doi.org/10.5194/egusphere-egu26-4627, 2026.

EGU26-4802 | ECS | Orals | CL4.4

Mesoscale soil moisture heterogeneity can locally amplify humid heat 

Guillaume Chagnaud, Chris M Taylor, Lawrence S Jackson, Anne Barber, Helen L Burns, John Marsham, and Cathryn E Birch

Soil moisture is a key ingredient of humid heat through supplying moisture and modifying boundary layer properties. Soil moisture heterogeneity due to for example, antecedent rainfall, can strongly influence weather patterns; yet, its effect on humid heat is poorly understood. Idealized numerical simulations are performed with a cloud-resolving (Δx = 500 m), coupled land-atmosphere model wherein circular wet patches with diameter λ ∈ 25-150 km are prescribed. Compared to experiments with uniform soil moisture, humid heat is locally amplified by 1 to 4°C in experiments with heterogeneous soil moisture, with maximum amplification for the critical soil moisture length-scale λc = 50 km. Subsidence associated with a soil moisture-induced mesoscale circulation concentrates warm, humid air in a shallower boundary layer. Additional pairs of uniform-heterogeneous soil moisture simulations are performed to assess the influence of the background wind, the strength of the soil moisture contrast, and the vertical structure of the atmosphere, on the relationship between soil moisture length-scales and humid heat amplification. This study provides process-based insights into the effects of soil moisture heterogeneity on humid heat in various environments at fine time and space scales, challenging extreme humid heat outputs from coarser-resolution weather and climate models. Furthermore, these results will help to predict extreme humid heat at city and county scales across the Tropics based on observed soil moisture patterns.

How to cite: Chagnaud, G., M Taylor, C., S Jackson, L., Barber, A., L Burns, H., Marsham, J., and E Birch, C.: Mesoscale soil moisture heterogeneity can locally amplify humid heat, EGU General Assembly 2026, Vienna, Austria, 3–8 May 2026, EGU26-4802, https://doi.org/10.5194/egusphere-egu26-4802, 2026.

EGU26-4968 | Orals | CL4.4

How basic physical constraints shape land-atmosphere interactions 

Axel Kleidon, Sarosh Alam Ghausi, and Tejasvi Ashish Chauhan

Climate over land is strongly shaped by the conditions at the land surface, particularly regarding the partitioning of energy, the availability of water, and the presence of vegetation. What we show here is that a number of key climatological fluxes and variables can be estimated quite accurately simply by applying basic physical constraints. First, heat fluxes are associated mostly with convective motion, which requires work to be done in the form of buoyancy. The generation of this work is subject to a first, physical constraint, the thermodynamic limit of a heat engine. Second, on land, the large differences in solar heating over the course of the day are buffered within the lower atmosphere, and not below the surface as is the case over open water surfaces.  This sets a second constraint. Third, when hydrological aspects are involved, saturation, that is, the thermodynamic equilibrium state, sets another constraint to evaporation and the humidity of air.  We focus on diurnal variations of the surface energy balance, temperature, and humidity over land and compare these to observations to show that these three constraints dominantly shape climatological variations across regions.  What this implies is that physical constraints dominate the functioning of climate over land, and much of this is shaped by the prevalent radiative conditions, with secondary effects relating to soil water availability and advection.  This, in turn, should help us to better distinguish between the important drivers from mere responses in shaping land-atmosphere interactions.

How to cite: Kleidon, A., Ghausi, S. A., and Chauhan, T. A.: How basic physical constraints shape land-atmosphere interactions, EGU General Assembly 2026, Vienna, Austria, 3–8 May 2026, EGU26-4968, https://doi.org/10.5194/egusphere-egu26-4968, 2026.

EGU26-5957 | ECS | Orals | CL4.4

Amplified future drying of tropical land constrained by physical theory 

Andrew Chingos, Graeme MacGilchrist, and Michael Byrne

Near-surface relative humidity (RH) over land is a key mediator of land-atmosphere interactions, influencing surface energy partitioning, evapotranspiration, wildfire risk, and both temperature and precipitation extremes. Despite its central role in regulating land climate, the response of land RH to climate change remains highly uncertain, with climate models projecting a wide range of historical and future trends. Notably, many models struggle to reproduce the observed decline in land RH over the recent warming period, raising concerns about their representation of land climate processes and future projections. 

Here we develop a simple physical theory to constrain changes in land RH, grounded in an ocean-influence perspective on boundary layer moisture over land. The theory links fractional changes in tropical land RH to the land–ocean warming contrast. As land warms more rapidly than the ocean, the increase in the water-holding capacity of land air outpaces the supply of moisture imported from oceanic regions, leading to a systematic decline in land RH. This mechanism highlights how large-scale land-atmosphere interactions can be regulated by ocean-driven constraints on land boundary layer moisture. 

The theory explains much of the inter-model spread in historical tropical land RH trends, as well as the drying evident in reanalysis data. Combining the theory with observational estimates of the radiatively forced land–ocean warming contrast, we obtain constrained projections of future tropical land RH change (-6.4 %/K and -4.4 %/K) which indicate substantially stronger drying compared to the unconstrained projections (-1.5 %/K). This emergent constraint highlights a systematic underestimation of future land drying by climate models and its physical basis, with important implications for land-climate impacts in a warming world. 

How to cite: Chingos, A., MacGilchrist, G., and Byrne, M.: Amplified future drying of tropical land constrained by physical theory, EGU General Assembly 2026, Vienna, Austria, 3–8 May 2026, EGU26-5957, https://doi.org/10.5194/egusphere-egu26-5957, 2026.

EGU26-5979 | Posters on site | CL4.4

Impacts of Rural-Urban Surface Heterogeneity on Precipitation Events in the Central Great Plains 

Liang Chen, Ifeanyi Achugbu, and Rezaul Mahmood

In the U.S. Central Great Plains, intensive agriculture is not the only human activity that has modified the natural landscape and subsequently influenced the atmosphere. With rapid urban population growth, major cities in this region have undergone significant expansion over the past few decades. Urban surfaces interact with the lower atmosphere by altering radiative and turbulent fluxes due to their unique thermal and radiative properties, thereby affecting the urban boundary layer and precipitation processes. However, the collective influence of urbanization and surrounding irrigation on regional weather and climate remains poorly understood. In this study, we investigate the impacts of irrigation and urbanization on precipitation processes over the Central Great Plains, focusing on selected precipitation events near Omaha, Nebraska, which is the largest city in the state and one that lies adjacent to extensively irrigated agricultural regions to the west. The Weather Research and Forecasting (WRF) model is used to conduct sensitivity experiments for more than 20 summer precipitation events, when irrigation is most active, and land-atmosphere coupling is strongest. Results show that upwind irrigation significantly enhances precipitation intensity, while urbanization primarily affects the spatial distribution of precipitation. The magnitude of these impacts varies with synoptic conditions across events. Additionally, land-surface influences on the thermodynamic environment before and during storms highlight the role of rural-urban heterogeneity in shaping precipitation extremes in this region.

How to cite: Chen, L., Achugbu, I., and Mahmood, R.: Impacts of Rural-Urban Surface Heterogeneity on Precipitation Events in the Central Great Plains, EGU General Assembly 2026, Vienna, Austria, 3–8 May 2026, EGU26-5979, https://doi.org/10.5194/egusphere-egu26-5979, 2026.

Heatwaves are becoming more frequent and intense worldwide under ongoing climate warming, posing substantial risks to the terrestrial ecosystem carbon sink. Although heatwave impacts on gross primary productivity (GPP) and ecosystem respiration (ER) have been widely investigated, their causal interactions remain poorly understood, particularly the physiological and biochemical mechanisms underlying these responses. Here, we combine near-surface air temperature from the ERA5-Land reanalysis with long-term carbon flux estimates from FLUXCOM-X to investigate ecosystem carbon responses to heatwaves across biome-diverse sites globally. We identify bidirectional causal relationships between GPP and ER using convergent cross mapping and apply multivariate causal inference to quantify heatwave-induced changes in ecosystem physiological and biochemical traits. Results suggest that the bidirectional causal coupling between GPP and ER is significantly strengthened during heatwaves but weakens during the post-heatwave recovery, indicating a transient reorganization of ecosystem carbon dynamics as a legacy effect of heatwaves. Correspondingly, net ecosystem productivity (NEP) typically declines during heatwaves, reflecting a widespread transient loss of carbon sink strength, driven by a disproportionately stronger increase in ER relative to GPP. Our findings illustrate the vulnerability of the land carbon sink to heatwaves consistent with previous studies, while explicitly unravelling the causal processes that govern ecosystem carbon responses and recovery. These results provide important insights for the management of the global carbon budget and for advancing the representation of terrestrial processes in land surface models.

How to cite: Ping, J., Lee, S.-C., and Li, W.: Asymmetric causal coupling between ecosystem photosynthesis and respiration underlies ecosystem carbon sink losses during heatwaves, EGU General Assembly 2026, Vienna, Austria, 3–8 May 2026, EGU26-6000, https://doi.org/10.5194/egusphere-egu26-6000, 2026.

EGU26-7376 | Orals | CL4.4

The underestimated thirst: detectability of atmospheric water vapor uptake in ecosystem measurements and global models 

Sinikka J. Paulus, Mirco Migliavacca, Anke Hildebrandt, Rene Orth, Sung-Ching Lee, Arnaud Carrara, Markus Reichstein, Yijian Zeng, and Jacob A. Nelson

In this contribution, we aim at assessing the detectability of atmospheric water vapor uptake by dry soils at a variety of spatial scales and methodologies, from the ecosystem scale via eddy covariance, through larger scales via earth system models, and gridded products. 

Water vapor fluxes in the soil and at the soil-atmosphere interface are driven by vapor concentration gradients. Until today, it is mostly assumed that the soil pore air is roughly at 100% relative humidity (RH), resulting in vapor fluxes that are almost always towards the atmosphere. However, the vapor state in soil pore air is linked to the soil water (matric) potential. As the water potential becomes more negative, the equilibrium RH within the soil decreases substantially. Under these conditions, the soil behaves like a ‘thirsty material’: when the atmospheric vapor pressure exceeds that of the soil pores, vapor is adsorbed onto the solid soil particle surfaces, and the net vapor flux is directed towards the soil. 

Using subdaily measurement data from a globally distributed network of eddy covariance stations, we show an emergent functional relationship between volumetric water content (VWC), RH, and latent heat (λE) flux direction at the ecosystem scale. Vapor fluxes towards the soil under dry conditions can be explained by the soil's sorptive forces inducing very low water potentials. Based on eddy covariance data, we find that soil vapor adsorption most frequently occurred in arid and semi-arid regions, particularly in ecosystems with sparse vegetation such as savannas and dry shrublands. On average, soil vapor adsorption occurs for 4 ± 1.1 hours per night, and may last up to 7 hours and on more than 150 nights per year in some drylands.

Furthermore, we demonstrate that the relationship between VWC, RH, and the vapor flux direction is evident in a wide range of in situ measurements in drylands, including lysimeter and humidity profile data. However, this relationship is absent in site-level runs of gridded observation-based data products and land surface models.

We demonstrate for the first time that the effect of adsorptive forces can be detected at the ecosystem scale, several meters above the ground. Our findings at the operating scale of flux towers can be used to evaluate and improve model representation of land-atmosphere exchange in dry conditions. Additionally, the results highlight the influence of sorptive forces on sub-daily soil-atmosphere interactions, particularly in sparsely vegetated drylands.

How to cite: Paulus, S. J., Migliavacca, M., Hildebrandt, A., Orth, R., Lee, S.-C., Carrara, A., Reichstein, M., Zeng, Y., and Nelson, J. A.: The underestimated thirst: detectability of atmospheric water vapor uptake in ecosystem measurements and global models, EGU General Assembly 2026, Vienna, Austria, 3–8 May 2026, EGU26-7376, https://doi.org/10.5194/egusphere-egu26-7376, 2026.

EGU26-7512 | ECS | Posters on site | CL4.4

Climate Warming Favors the Early Emergence of Rapid Flash Drought 

Phynodocle Vecchia Ravinandrasana, Christian Franzke, and Christoph Raible

Global warming is expected to increase the likelihood of the rapid onset of drought development. Yet the timescale and region of the emergence and disappearance of the anthropogenic flash drought remain poorly constrained. Here, we assess the time of emergence and disappearance of soil-moisture-based flash drought across five onset timescales using a large ensemble of climate simulations. Anthropogenic influence is quantified through the Signal-to-Noise Ratio, defined as the forced response relative to internal climate variability. Rapid-onset FDs of 1 and 2 pentads onset timescale emerge earliest, in the mid-20th century, and expand over increasing land areas by the late century under SSP3-7.0. In contrast, moderate- to slow-onset FD, 3 to 5 pentads onset timescale emerge later in more spatially confined regions and disappear by 2100. The Time of disappearance patterns show broader regional variability, especially for slow-onset flash drought. Globally, median ToE occurs in the 2020s for rapid-onset flash drought and in later decades for longer-onset events, while disappearance occurs between the 2000s and 2050s, depending on onset timescales. Both emergence and disappearance exhibit strong regional variability and occur earlier under higher forcing. Mechanistically, Flash drought onset is governed by region-specific land–atmosphere processes, driven either by short-term precipitation deficits or rapid increases in evaporative demand. These results indicate an increasing tendency toward rapid, climate-driven flash drought emergence, emphasizing the need for region-specific early-warning strategies.

How to cite: Ravinandrasana, P. V., Franzke, C., and Raible, C.: Climate Warming Favors the Early Emergence of Rapid Flash Drought, EGU General Assembly 2026, Vienna, Austria, 3–8 May 2026, EGU26-7512, https://doi.org/10.5194/egusphere-egu26-7512, 2026.

EGU26-8187 | ECS | Posters on site | CL4.4

How stomatal function shapes evapotranspiration in a rising CO2 world 

Amy X. Liu, Abigail L.S. Swann, and Gabriel J. Kooperman

Evapotranspiration (ET) is a key process in the land water cycle, with plant transpiration accounting for ~60% of land ET. Transpiration is regulated through both stomatal functioning and total leaf area. Stomata control the diffusion of water vapor from leaves to the atmosphere, while leaf area determines the total surface over which transpiration occurs. Both processes are expected to change under elevated CO2 (eCO2), with increased CO2 availability allowing plants to optimize carbon gain to water loss by closing their stomata and decreasing transpiration per leaf. At the same time, CO2 fertilization increases leaf area, which can contribute to increasing total transpiration, as well as increasing rain water interception and reevaporation. The combined influence of these opposite physiological responses creates uncertainty in the total plant-driven ET response to eCO2. Observations also reveal a range of stomatal function across and within plant types in varying environments, much of which is not represented in Earth system models, contributing to uncertainty in the magnitude of stomatal closure under eCO2 and its impact on future ET. We quantify how uncertainty in stomatal functioning propagates into ET responses under eCO2 using Community Earth System Model (CESM2) simulations, where we perturb stomatal function across the observed range for each plant type at preindustrial and doubled preindustrial CO2. We also compare ET responses driven by stomatal uncertainty with those from leaf area growth and identify regions where ET is most sensitive to stomatal function assumptions. The total plant-driven ET response to eCO2 is a combination of the opposing contributions from stomatal closure and leaf area growth. Of the two contributors, leaf area growth tends to have a larger ET response to eCO2 compared with stomatal closure in CESM2. However, we find that stomatal uncertainty drives ET changes of comparable magnitude to the total combined plant-driven ET response to eCO2. Further, about 32% of land has greater ET sensitivity to stomatal uncertainty than the ET response to eCO2 driven leaf area growth. This occurs particularly in wet regions where stomata can strongly regulate transpiration yet remain sensitive to water availability. These results improve understanding of how uncertainty in plant physiological processes propagates into future water cycle responses and climate projections, and identify where uncertainties may be most influential.

How to cite: Liu, A. X., Swann, A. L. S., and Kooperman, G. J.: How stomatal function shapes evapotranspiration in a rising CO2 world, EGU General Assembly 2026, Vienna, Austria, 3–8 May 2026, EGU26-8187, https://doi.org/10.5194/egusphere-egu26-8187, 2026.

EGU26-8398 | ECS | Orals | CL4.4

Land-atmosphere Teleconnections Between Spring Soil Moisture and Summertime Climate 

Lily Zhang and David Battisti

Year-to-year variability in summertime temperature has a large impact on drought, wildfire, and extreme heat across the Western United States. A recent study showed that warmer-than-average summertime temperatures in the Western US are often preceded by drier-than-average springtime soil moisture over the Southwest US. To examine the possibility that land-atmosphere coupling modulates summertime temperature variability over this region, we perform an ensemble of soil moisture depletion experiments within the Community Earth System Model (CESM2) and find that reducing March surface soil moisture over the Southwest US causes positive May-June temperature anomalies throughout the Western US and precipitation anomalies in the Northwest that are consistent with observations. In our experiments, daytime diabatic heating over anomalously dry land surfaces in early spring excites circulation anomalies that evolve into a hemispheric-scale pattern similar to that observed following anomalously dry springtime in the Southwest US. We show that the subsequent late spring and early summer circulation anomalies are associated with large-scale reductions in atmospheric moisture and cloudiness that contribute to the near-surface warming. Our results suggest that spring soil moisture variations are a source of seasonal predictability for summertime climate extremes, through their non-local impact on summertime temperature variability over the Western US.

How to cite: Zhang, L. and Battisti, D.: Land-atmosphere Teleconnections Between Spring Soil Moisture and Summertime Climate, EGU General Assembly 2026, Vienna, Austria, 3–8 May 2026, EGU26-8398, https://doi.org/10.5194/egusphere-egu26-8398, 2026.

EGU26-8485 | ECS | Orals | CL4.4

Has agricultural irrigation masked intense warming in the central United States? 

Sofia Menemenlis, Gabriel Vecchi, Stephan Fueglistaler, Wenchang Yang, and Qinlan Yang

Since the 1980s, the central United States and southern-central Canada have experienced a notable lack of high temperature extremes, with many temperature record highs from the 1930s Dust Bowl period still standing. By contrast, atmospheric general circulation models (AGCMs) forced with observed sea surface temperatures consistently simulate exceptional warming over the central US during this period. What accounts for this discrepancy between observed and simulated temperature trends? We use ensembles of coupled and atmosphere-only climate model experiments to disentangle the influences of remote sea surface temperatures and local land-atmosphere interactions on historical temperature change in the central United States. Tropical Pacific teleconnections strongly impact central US temperatures: coupled general circulation models, which cannot reproduce observed trends in the tropical Pacific SST gradient, produce a moderate central US warming trend that is closer to observations than AGCMs prescribed with observed SSTs. Comparing seasonal latent and sensible heat fluxes in these experiments, we describe the central role of turbulent exchanges at the land surface on temperature trends. In a heavily irrigated area whose climate is known to be sensitive to changes in soil moisture, our results point to a possible role for agricultural irrigation in alleviating historical heat extremes, and in explaining the large difference between models and observations. We highlight the importance of understanding model-data discrepancies in tropical SST patterns and local land temperatures for predicting future climate extremes in the central US. 

How to cite: Menemenlis, S., Vecchi, G., Fueglistaler, S., Yang, W., and Yang, Q.: Has agricultural irrigation masked intense warming in the central United States?, EGU General Assembly 2026, Vienna, Austria, 3–8 May 2026, EGU26-8485, https://doi.org/10.5194/egusphere-egu26-8485, 2026.

EGU26-8630 | ECS | Posters on site | CL4.4

Identifying the Restructuring of Forced Responses and Internal Variability in Soil Moisture–Precipitation Coupling Mechanisms 

Mengxue Zhang, Feini Huang, Andrei Gavrilov, Nathan Mankovich, Miguel-Ángel Fernández-Torres, and Gustau Camps-Valls

The spatiotemporal coupling between soil moisture and precipitation is a fundamental pillar of the global hydrological cycle. With the escalating risk of severe droughts and pluvial extremes, a critical question arises: whether observed variations in soil moisture and precipitation coupling are the result of anthropogenic Forced Response (FR) or Internal Variability (IV). While recent benchmarks, such as the Forced Component Estimation Statistical Method Intercomparison Project, have advanced the estimation of forced components from observational data, a significant gap remains: how to leverage these diagnostic tools to elucidate the non-stationary and non-linear interactions across the full moisture spectrum.

This study introduces a statistical attribution framework that reconciles stationary and non-stationary coupling regimes, allowing for a more robust characterization of shifting climate dynamics. We extend the analysis of direct impacts—where FR and IV drivers linearly alter coupled variables—to the assessment of indirect impacts, where drivers exert non-linear influence on mediating variables, which modulate the dynamic sensitivity and strength of the coupling mechanisms. By decoupling these pathways, we move beyond the simple attribution of trends in moisture states; instead, we identify how anthropogenic forcing and internal variability are fundamentally restructuring the feedback mechanisms of the hydrological cycle.

How to cite: Zhang, M., Huang, F., Gavrilov, A., Mankovich, N., Fernández-Torres, M.-Á., and Camps-Valls, G.: Identifying the Restructuring of Forced Responses and Internal Variability in Soil Moisture–Precipitation Coupling Mechanisms, EGU General Assembly 2026, Vienna, Austria, 3–8 May 2026, EGU26-8630, https://doi.org/10.5194/egusphere-egu26-8630, 2026.

EGU26-8794 | ECS | Posters on site | CL4.4

Hydro-thermal heterogeneity contributes to the asymmetry of vegetation sensitivity to precipitation across northern mid-latitudes 

Taohui Li, Peng Zi, Wenxiang Zhang, and Ruowen Yang

A notable ecological phenomenon in northern terrestrial ecosystems, known as "the asymmetric response of vegetation to precipitation", has emerged over the past 20-plus years. However, it remains uncertain whether the response of northern terrestrial ecosystems to driving factors are temporally synchronous or has exhibit heterogeneity, and whether these impacts have been quantitatively evaluated. Here, we analyze the spatio-temporal patterns of vegetation sensitivity to precipitation (Sppt) across the NTML from 2001 to 2023, using two independent proxies of vegetation productivity–gross primary productivity (GPP) and solar-induced chlorophyll fluorescence (SIF). We confirm a pronounced asymmetry in Sppt trends between Eurasia and North America. Sppt increased significantly across Eurasia (GPP: +3.2×10⁻³ g·C·m-2·mm-1·yr-1) but decreased in North America (GPP: -3.8×10⁻³ g·C·m-2·mm-1·yr-1). Moisture budget diagnostics reveal asymmetric roles of zonal moisture transport in shaping precipitation trends over the two regions. This asymmetry is primarily driven by changes in hydro-thermal heterogeneity, which collectively modulate moisture availability and plant physiological processes. Crucially, further results from machine learning attribution analysis indicate that diurnal temperature range dominates Sppt changes across more than 23.5% of Eurasia, while precipitation is the key driver over 22.5% of North America. Our findings highlight the critical role of hydro-thermal heterogeneity in regulating vegetation–climate feedback and underscore the necessity of incorporate regional asymmetries into future Earth system models.

How to cite: Li, T., Zi, P., Zhang, W., and Yang, R.: Hydro-thermal heterogeneity contributes to the asymmetry of vegetation sensitivity to precipitation across northern mid-latitudes, EGU General Assembly 2026, Vienna, Austria, 3–8 May 2026, EGU26-8794, https://doi.org/10.5194/egusphere-egu26-8794, 2026.

Irrigation represents one of the most critical human interventions on the coupled water and energy cycles, driving substantial climate impacts via modifying surface energy balance and biogeochemical process. As irrigated farmland continues to expand, understanding the climate impact of extensive irrigation becomes increasingly important. Yet, the effect of irrigation on rainfall patterns, particularly extreme rainfall, at global scale remains poorly unclear. Here, using the “space-for-time” approach and global satellite precipitation datasets, we show that extreme rainfall events occur more often over irrigated lands than in surrounding rainfed areas. This signal is more pronounced in regions with more extensive irrigation, warmer temperatures, and higher precipitation. Our results improve mechanistic understanding of irrigation-precipitation interactions, which remain uncertain in climate and weather forecasting models.

How to cite: Liu, Y. and Li, Y.: Observational evidence of increased extreme rainfall due to irrigation practice, EGU General Assembly 2026, Vienna, Austria, 3–8 May 2026, EGU26-8906, https://doi.org/10.5194/egusphere-egu26-8906, 2026.

EGU26-10059 | Posters on site | CL4.4

Impacts of insect-driven tree mortality on land-surface water and energy exchanges 

João Luiz Martins Basso, Francisco José Cuesta-Valero, Johannes Quaas, and Ana Bastos

Insect-driven forest disturbances are important contributors to tree mortality and biomass losses in temperate and boreal regions. With the rising temperatures and shifting precipitation patterns, insect induced tree mortality is expected to increase in many regions. Insect outbreaks not only influence tree cover and carbon stocks, but , through their impact on tree functioning, also influence land-atmosphere exchanges of water and energy, which in turn can impact atmospheric properties. While insect outbreaks can impact very large regions, most observational studies focus on small regions and individual events.


Here, we aim to provide an observation-based regional synthesis of the impact of insect-driven tree mortality on land-atmosphere water and energy exchanges, focusing on western USA. For this, we analyse satellite-based data (MODIS) on evapotranspiration (ET), albedo, land-surface temperature (LST) and snow cover for insect-affected regions between 2001-2022. Preliminary results indicate an increase in summer LST in areas affected by more severe insect-driven tree mortality, along with a decrease in ET, compared to the years before the mortality events. These differences can be partly explained by reduced snow cover in winter, which contributes to decreased winter albedo in insect-affected areas. These effects are not only limited to the outbreak event, but also show persistent trends in the subsequent years.

How to cite: Martins Basso, J. L., Cuesta-Valero, F. J., Quaas, J., and Bastos, A.: Impacts of insect-driven tree mortality on land-surface water and energy exchanges, EGU General Assembly 2026, Vienna, Austria, 3–8 May 2026, EGU26-10059, https://doi.org/10.5194/egusphere-egu26-10059, 2026.

EGU26-10354 | ECS | Orals | CL4.4

Inter-annually varying vegetation improves seasonal forecasts of near-surface temperature in East Africa 

Daria Gangardt, Bethan Harris, Joshua Talib, Christopher Taylor, and Sonja Folwell

  Interactions between vegetation and the overlying atmosphere, mediated by changes in surface moisture availability and energy flux partitioning, exert significant influence on near-surface temperature and other atmospheric variables. At seasonal timescales, these vegetation-atmosphere interactions have the potential to enhance forecast predictability. However, current operational seasonal forecast systems, such as ECMWF’s SEAS5, prescribe vegetation to a fixed climatological state. This does not fully capture vegetation-atmosphere interactions and thus the potential predictability is not fully exploited. In this presentation, we investigate the atmospheric response to prescribing inter-annually varying Leaf Area Index (LAI) in seasonal hindcasts and assess its effect on seasonal forecast skill.  This work focuses on Africa, where seasonal forecasts are crucial for agricultural planning and extreme weather preparedness.

  A series of seasonal hindcasts run for the period 1993-2019 using ECMWF’s coupled Integrated Forecasting System are used. We compare two experiments – a control experiment, which uses climatological LAI and a non-varying land cover map, and an experiment which implements a dataset of inter-annually varying LAI and land cover maps produced by merging multiple satellite products. In general, prescribing inter-annually varying LAI increases African near-surface air temperatures by up to 0.2K compared to a fixed climatological LAI across Africa. To evaluate temperature changes associated with LAI variations, we perform a Seasonal-reliant Empirical Orthogonal Function analysis (see Wang and An, 2005) on the driving LAI dataset. We find a mode of variation that is correlated with the Indian Ocean Dipole (IOD) index for the September-November-December season (correlation coefficient of ~0.75); thus, we view this mode of LAI variation as the vegetation response to increased East African rainfall during active IOD events. Results show a consistent near-surface temperature response across East Africa when inter-annually varying LAI is prescribed. The temperature response is shown to be consistent with simulated changes in the surface energy balance. Forecast skill of temperature, measured as bias compared to ERA5 values, is shown to be improved when vegetation varies inter-annually. Improvements in bias are largest following extreme IOD events and for areas where the control hindcasts’ bias is largest, with a maximum in temperature bias reduction of 0.6K and an average bias reduction of 0.2K. Thus, we find that increased complexity in vegetation representation in seasonal forecasts leads to improvements in forecasted temperature through better representation of land-atmosphere interactions influenced by the IOD.

How to cite: Gangardt, D., Harris, B., Talib, J., Taylor, C., and Folwell, S.: Inter-annually varying vegetation improves seasonal forecasts of near-surface temperature in East Africa, EGU General Assembly 2026, Vienna, Austria, 3–8 May 2026, EGU26-10354, https://doi.org/10.5194/egusphere-egu26-10354, 2026.

Land surface conditions are known to strongly influence the intensity and frequency of heatwaves; however, their role in governing the temporal evolution and spatial propagation of heatwaves remains insufficiently explored. This study investigates the impact of land surface conditions on the temporal evolution and spatial propagation of pre-monsoon heatwaves in northwest and central India. Analysis of surface energy budget components during heatwave events reveals two dominant patterns of land surface flux evolution. In northwest India, the development of heatwaves is typically associated with weak near-surface winds that promote localized heat buildup. This phase is often followed by a strengthening of winds, which enhances sensible heat fluxes and facilitates horizontal heat transport. The resulting advection of warm air from the upwind northwest region plays a crucial role in triggering heatwave conditions over downwind areas of northern and central India. We further find that the downwind propagation of heatwaves is strongly dependent on the initial land surface temperature in the upwind region. Elevated land surface temperatures in northwest India induce anomalously low surface pressures, resulting in intensified wind speeds that enhance heat transport. As a result, heatwaves having high initial land surface conditions propagate more rapidly and are more likely to extend into central India. These results highlight the predictive potential of upwind land surface temperatures for the occurrence of heatwaves in downwind regions.

How to cite: Dar, J. A. and Apurv, T.: Understanding the influence of land surface conditions on the temporal evolution and spatial propagation of heatwaves in India, EGU General Assembly 2026, Vienna, Austria, 3–8 May 2026, EGU26-10671, https://doi.org/10.5194/egusphere-egu26-10671, 2026.

EGU26-10824 | Posters on site | CL4.4

Enhanced Representation of Landscape Heterogeneities in ICON-LAND: Implications for Hydrology and Carbon Processes 

Tobias Stacke, Philipp de Vrese, Veronika Gayler, Helena Bergstedt, Clemens von Baeckmann, Thomas Kleinen, and Victor Brovkin

Carbon fluxes play an important role in the Earth System, influencing climate, vegetation dynamics, and biogeochemical cycles. Accurately simulating these fluxes using Earth System Models is essential to understand and predict future climate change. However, these simulations depend on often poorly represented characteristics like small-scale landscape heterogeneities as well as small-scale variations in surface hydrology and temperature, which can impact carbon processes.

In this study, we analyze simulations performed with the ICON climate model, focusing on recent enhancements to its land surface component, ICON-Land. The modifications aim for a better represention of  small-scale heterogeneities by introducing distinct tiles within each grid cell that represent local states of moisture and temperature and can exchange water and heat fluxes between each other. The characteristics of these tiles are derived from high resolution topographical data. These improvements are expected to capture soil moisture and temperature dynamics - which are key drivers of carbon processes - in a more realistic way.

Our preliminary results, which are derived from simulations with prescribed atmospheric forcing, indicate that the improved representation of landscape heterogeneities in ICON-Land affects its hydrology and carbon processes. Specifically, we see an increase in soil moisture and evapotranspiration as well as Gross Primary Productivity and soil respiration in our simulations. These changes demonstrate that the improved model has a significant effect on interactions between the land surface and the atmosphere, and thereby might affect the global carbon cycle.

This study highlights the importance of representing small-scale landscape features in climate models and demonstrates the potential of the enhanced ICON-Land model to improve the simulation of carbon processes. Further analysis is underway to comprehensively assess the impacts of these modifications on the global carbon budget and fully-coupled climate projections.

How to cite: Stacke, T., de Vrese, P., Gayler, V., Bergstedt, H., von Baeckmann, C., Kleinen, T., and Brovkin, V.: Enhanced Representation of Landscape Heterogeneities in ICON-LAND: Implications for Hydrology and Carbon Processes, EGU General Assembly 2026, Vienna, Austria, 3–8 May 2026, EGU26-10824, https://doi.org/10.5194/egusphere-egu26-10824, 2026.

EGU26-12254 | ECS | Posters on site | CL4.4

Regional perspective of terrestrial carbon dioxide removal on land-atmosphere coupling and heat extremes 

Shraddha Gupta, Yiannis Moustakis, Felix Havermann, and Julia Pongratz

Terrestrial carbon dioxide removal (CDR), including afforestation and reforestation (A/R) and other land-based approaches, is a key element of climate mitigation pathways consistent with the Paris Agreement. While the mitigation potential and Earth system responses to terrestrial CDR deployment have been increasingly explored, its influence on land–atmosphere coupling and temperature extremes remains underexplored, particularly at regional scales. Understanding these processes is essential for evaluating both synergies and trade-offs associated with land-based mitigation strategies, including potential implications for biogeophysical co-benefits, resilience, and permanence.

Here, we present a spatio-temporal explicit analysis of how terrestrial CDR pathways modify land–atmosphere coupling and associated hot extremes across regions and seasons. The analysis is based on emission-driven simulations from the fully coupled MPI Earth System Model and considers a range of future scenarios that include both stylized large-scale terrestrial CDR deployment and more realistic mitigation pathways developed within CDRSynTra, LAMACLIMA, and RESCUE projects. This scenario diversity allows us to explore the robustness, plausibility, and potential non-linearities of land–atmosphere responses to terrestrial CDR. The scenarios considered include large-scale A/R aligned with national pledges, transformation pathways characterized by global sustainability and global inequality, and climate stabilization pathways with and without temperature overshoot that rely on portfolios of multiple CDR approaches. 

We apply various land–atmosphere coupling diagnostics, such as measures of soil-moisture control on latent and sensible heat fluxes, and relate these to hot-day and heatwave metrics over land to assess the processes linking surface fluxes, moisture availability, and temperature extremes. By explicitly focusing on regional responses, the analysis captures spatial heterogeneity in land–atmosphere feedbacks that is not apparent in global-mean assessments. Seasonal variability (e.g., during spring and summer) and different future time horizons (near-, mid-, and late-century; before and after overshoot), are considered to assess the sensitivity of land–atmosphere coupling processes to the timing and magnitude of the application of terrestrial CDR. 

Identifying regions where terrestrial CDR strongly modifies land–atmosphere coupling and heat extremes can help highlight hotspots for targeted monitoring and evaluation by indicating where observations and diagnostics are most relevant for tracking biophysical responses and emerging risks. Analyses indicate that regions such as Scandinavia, West Asia, and Northeast China exhibit contrasting responses, where changes in heat extremes coincide with shifts in soil-moisture control and evaporative cooling, and where observational coverage of surface fluxes remains limited. Such regional insights can also inform the assessment of where terrestrial CDR deployment may be associated with co-benefits, and where land–atmosphere feedbacks could pose challenges or limitations, including adaptation-relevant impacts on heat stress and labor productivity. Overall, this work helps fill a key gap in current assessments by explicitly linking terrestrial CDR deployment to land–atmosphere coupling and heat extremes at regional scales, and by providing a process-based assessment framework that can support risk-aware evaluation of land-based CDR strategies and be extended to other terrestrial CDR approaches.

How to cite: Gupta, S., Moustakis, Y., Havermann, F., and Pongratz, J.: Regional perspective of terrestrial carbon dioxide removal on land-atmosphere coupling and heat extremes, EGU General Assembly 2026, Vienna, Austria, 3–8 May 2026, EGU26-12254, https://doi.org/10.5194/egusphere-egu26-12254, 2026.

EGU26-12361 | ECS | Orals | CL4.4

Causal disentangling of soil moisture and temperature feedbacks on surface climate extremes under vegetation change 

Feini Huang, Gustau Camps-Valls, Alexander Winkler, Christian Reimers, Nuno Carvalhais, and Andrei Gavrilov

Land-atmosphere interactions are key drivers of climate extremes, mediating the influence of soil moisture, vegetation, and surface energy exchanges on droughts, heatwaves, and compound events. Observed vegetation changes such as climate-induced tree mortality, phenological shifts, and large-scale deforestation can substantially alter these interactions by modifying surface energy and water fluxes. A critical challenge is to understand how soil water-energy feedbacks propagate through the atmosphere, which is essential for both predicting extremes and evaluating Earth System Models (ESMs).

To address this, we propose a unified causal and explainable framework to disentangle soil water-energy feedbacks from observational data, creating a benchmark for ESM evaluation. First, we construct machine learning emulators to represent the dynamical responses of land and atmosphere modules to external forcings, consistent with a structural causal model (SCM). These emulators act as efficient, process-aware surrogates, enabling the reconstruction of causal pathways (e.g., soil moisture/temperature → near-surface states) in a computationally tractable way. Using do-calculus combined with explainable AI (XAI), we then estimate the causal coupling strengths of water-energy feedbacks, isolating the direct effects of soil states from confounding atmospheric influences. By comparing these causal estimates against observational constraints, we can evaluate and benchmark ESM representations, revealing structural biases, deficiencies, and uncertainties in simulated pathways.

Bridging causal inference, machine learning, and observations, our framework provides a robust tool for process-level diagnosis, model benchmarking, and ultimately improving the physical fidelity of complex ESMs. It advances the mechanistic understanding of how land states drive atmospheric extremes, offering actionable insights for predicting droughts and heatwaves under current and future climates.

How to cite: Huang, F., Camps-Valls, G., Winkler, A., Reimers, C., Carvalhais, N., and Gavrilov, A.: Causal disentangling of soil moisture and temperature feedbacks on surface climate extremes under vegetation change, EGU General Assembly 2026, Vienna, Austria, 3–8 May 2026, EGU26-12361, https://doi.org/10.5194/egusphere-egu26-12361, 2026.

EGU26-12389 | ECS | Orals | CL4.4

Revisiting Land-Atmosphere Coupling Across Spatial Scales: From Coarse to Kilometer-Scale Simulations 

Shuping Li, Daisuke Tokuda, Hsin Hsu, Ching-Hung Shih, Jie Hsu, Min-Hui Lo, and Kei Yoshimura

Soil moisture–precipitation (SM–P) coupling is a key component of land–atmosphere interactions, but its strength and sign remain highly uncertain in large-scale models. While high-resolution models that explicitly resolve convection offer a way to reduce these uncertainties, their impact on SM–P coupling is not yet fully understood. Here, we investigate global SM–P coupling across different spatial resolutions using the Nonhydrostatic Icosahedral Atmospheric Model (NICAM). We find that SM–P coupling strongly depends on model resolution. As resolution increases, precipitation becomes more localized, leading to a smaller rainy area and a more heterogeneous spatial structure of the coupling. These changes involve significant regional variations in both coupling strength and sign. At high resolution, coupling is strengthened in major land–atmosphere hotspots, driven by enhanced convection that produces higher precipitation and more active moisture exchange. Meanwhile, high-resolution simulations exhibit widespread sign reversals in SM–P coupling. These reversals are caused by the convection-driven redistribution of precipitation, where localized moisture convergence and divergence reshape the coupling relationships. Compared to FLUXNET and ERA5 data, increasing model resolution systematically reduces negative biases in SM–P coupling, bringing the simulation closer to observations. Our results show that high-resolution modeling helps reconcile simulations with observations and emphasize the importance of using high-resolution frameworks to represent land–atmosphere interactions accurately.

How to cite: Li, S., Tokuda, D., Hsu, H., Shih, C.-H., Hsu, J., Lo, M.-H., and Yoshimura, K.: Revisiting Land-Atmosphere Coupling Across Spatial Scales: From Coarse to Kilometer-Scale Simulations, EGU General Assembly 2026, Vienna, Austria, 3–8 May 2026, EGU26-12389, https://doi.org/10.5194/egusphere-egu26-12389, 2026.

EGU26-13031 | ECS | Orals | CL4.4

Amplification of soil moisture seasonality and compound warm–dry conditions over the Mediterranean under future climate scenarios 

Daniela C.A. Lima, Virgílio A. Bento, Ana Russo, and Pedro M.M. Soares

The Mediterranean region is widely recognized as a climate-change hotspot, where rising temperatures and declining precipitation are expected to intensify hydroclimatic stress. Most Mediterranean countries already experience increasing drought frequency and persistent soil moisture deficits leading to changes in terrestrial water storage. However, projected changes in the seasonal structure of soil moisture and its joint behaviour with temperature and precipitation remain insufficiently quantified.

Here, we assess future projections of soil moisture dynamics and compound warm–dry conditions across the Mediterranean using a multi-model ensemble of EURO-CORDEX regional climate simulations. We analyse daily total soil moisture, precipitation, 2-m temperature, and potential evapotranspiration for a historical baseline period (1971–2000), and three future periods (2011–2040, 2041–2070, 2071–2100) under three emission scenarios (RCP2.6, 4.5 and 8.5). Seasonal amplitude and phase changes in soil moisture are examined, and joint probability density functions are used to quantify compound warm–dry conditions and their drivers.

The projections show a clear reduction of soil moisture throughout the entire annual cycle, in response to a significant decrease in precipitation and an increase in temperature, leading to a substantial rise in potential evapotranspiration. The overall total soil moisture decreases ranges from -5% for the RCP2.6 to -20% (-10%) for the RCP8.5 (RCP4.5), with relation to the present climate. Projections reveal that for the RCP4.5 (RCP8.5) for the mid-century soil moisture deficits up to 5x (6x) are projected to occur, and for the end-of-century even 7x for the RCP8.5. Our results show a robust amplification of soil moisture seasonal amplitude across all Mediterranean sub-regions, increasing with higher greenhouse gas emissions and toward the end of the century. The largest increases are projected over the eastern Mediterranean, reflecting enhanced seasonal contrasts driven by intensified summer drying. Despite these amplitude changes, the phase of the soil moisture annual cycle remains stable across scenarios, indicating that climate change primarily intensifies existing seasonal dynamics rather than shifting their timing. Joint probability analyses show a substantial increase in the likelihood of compound warm–dry conditions, particularly under RCP4.5 and, more pronounced under RCP8.5, during mid- and late-century periods.

Overall, our findings highlight that future Mediterranean hydroclimatic risk is driven not only by mean drying but also by a pronounced intensification of soil moisture variability and compound extremes. These projections have important implications for ecosystem, water resources, and climate adaptation strategies.


This work is supported by FCT, I.P./MCTES through national funds (PIDDAC): LA/P/0068/2020 - https://doi.org/10.54499/LA/P/0068/2020, UID/50019/2025, https://doi.org /10.54499/UID/PRR/50019/2025, UID/PRR2/50019/2025. The authors would like also to acknowledge the project “Elaboração do Plano Municipal de Ação Climática de Barcelos (PMACB). This work was performed under the scope of project https://doi.org/10.54499/2022.09185.PTDC (DHEFEUS). DCAL acknowledge FCT I.P./MCTES (Fundação para a Ciência e a Tecnologia) for the FCT https://doi.org/10.54499/2022.03183.CEECIND/CP1715/CT0004.

How to cite: Lima, D. C. A., Bento, V. A., Russo, A., and Soares, P. M. M.: Amplification of soil moisture seasonality and compound warm–dry conditions over the Mediterranean under future climate scenarios, EGU General Assembly 2026, Vienna, Austria, 3–8 May 2026, EGU26-13031, https://doi.org/10.5194/egusphere-egu26-13031, 2026.

EGU26-13692 | Orals | CL4.4

An insufficient subsurface depth biases the long-term surface energy balance in Land Surface Models 

Fidel González-Rouco, Félix García-Pereira, Nagore Meabe-Yanguas, Johann Jungclaus, Stephan Lorenz, Stefan Hagemann, Carlos Yagüe, Francisco José Cuesta-Valero, Almudena García-García, and Hugo Beltrami

The land subsurface stored around 6% of the Earth’s energy imbalance in the last five decades (of around 0.5 Wm-2, equivalent to 380 ZJ), being the second contributor to the energy partitioning after the ocean (90%). Previous studies have shown that state-of-the-art Earth System Models (ESMs) remarkably underestimate the observational land heat uptake values. This underestimation stems from Land Surface Models (LSMs) within ESMs imposing too shallow zero-flux bottom boundary conditions to correctly represent the conductive propagation and land heat uptake with depth. When realistically deep boundary conditions are prescribed, land heat uptake increases by a factor of five. However, changes in ground surface temperature are negligible. The reasons for this lack of impact of the LSM depth on surface temperatures are assessed herein.

An ensemble of eight historical and RCP8.5 land-only simulations with different subsurface depths was conducted with the LSM of the Max Planck Institute for Meteorology ESM (MPI-ESM), JSBACH. Simulation-derived latent (LHF), sensible (SHF), and ground heat fluxes (GHF) were compared across simulations, and GHF was additionally evaluated against estimates from a one-dimensional heat conduction forward model. Results show that, for a global warming of 1.5 ºC with respect to 1850-1900, GHF increases from 0.04 to 0.07 Wm-2 when deepening the LSM from 10 to 22 m, saturating at around 0.12 Wm-2 when the boundary condition is placed at approximately 100 m. The increase in the incoming GHF is mainly compensated by a global decrease in the outgoing SHF, a small decrease of the LHF in wet regions, and a decrease in the surface net radiation in arid and semi-arid regions. These quantities, yet small, evidence that an insufficient LSM depth induces to an inaccurate resolution of the long-term surface energy balance, which may have implications for land-atmosphere interaction. Their accumulation over time also produces biases in the terrestrial energy partitioning.

How to cite: González-Rouco, F., García-Pereira, F., Meabe-Yanguas, N., Jungclaus, J., Lorenz, S., Hagemann, S., Yagüe, C., Cuesta-Valero, F. J., García-García, A., and Beltrami, H.: An insufficient subsurface depth biases the long-term surface energy balance in Land Surface Models, EGU General Assembly 2026, Vienna, Austria, 3–8 May 2026, EGU26-13692, https://doi.org/10.5194/egusphere-egu26-13692, 2026.

EGU26-13807 | ECS | Posters on site | CL4.4

Contribution of evaporative sources and atmospheric circulation to the spatiotemporal variability of moisture transport 

Vittorio Giordano, Arie Staal, Marta Tuninetti, Francesco Laio, and Luca Ridolfi
The coupling between land evaporation and precipitation is central to land-atmosphere interactions, yet remains one of the most poorly understood processes in the hydrological cycle. While evaporation is often viewed as having a predominantly local effect, growing evidence suggests that the land surface can significantly influence remote precipitation through atmospheric circulation and moisture transport. However, the sensitivity of precipitation to the interannual variability of its evaporative sources and atmospheric transport pathways remains largely unexplored.
 
Here, we employ the UTrack Lagrangian model driven by ERA5 reanalysis to perform a multi-annual moisture tracking analysis, identifying evaporative sources of precipitation and characterizing their variability over time. We develop statistical relationships to quantify the sensitivity of precipitation patterns to anomalies in both evaporative source strength and atmospheric moisture transport. Additionally, we investigate the correlation structure connecting evaporated moisture at the source, its transport through the atmosphere, and its contribution to precipitation at target locations.
 
Understanding the dominant factors driving moisture transport variability is crucial, as fluctuations in these pathways play a key role in the onset of droughts and extreme events and can be influenced by land uses and human activities. Furthermore, this work provides critical insights into the limitations of using climatological mean transport patterns compared to year-to-year analyses.

How to cite: Giordano, V., Staal, A., Tuninetti, M., Laio, F., and Ridolfi, L.: Contribution of evaporative sources and atmospheric circulation to the spatiotemporal variability of moisture transport, EGU General Assembly 2026, Vienna, Austria, 3–8 May 2026, EGU26-13807, https://doi.org/10.5194/egusphere-egu26-13807, 2026.

EGU26-13817 | ECS | Orals | CL4.4

Simulating Indian Monsoon Rainfall over irrigation intensive regions using updated LULC and irrigation representation in WRF model 

Prachi Khobragade, Kirthiga Murugesan, and Balaji Narasimhan

Accurate representation of land surface characteristics plays a crucial role in improving regional monsoon simulations. Recent studies demonstrate that irrigation in croplands positively influences rainfall; therefore, explicitly representing irrigated regions can lead to more accurate rainfall simulations. In this study, we employ the Weather Research and Forecasting (WRF v4.5) model to evaluate the performance of two land surface models (LSMs), Noah and Noah-MP, in simulating Southwest (SW) and Northeast (NE) monsoon rainfall over an irrigation-intensive region of India. Here, three simulations were conducted Noah, Noah-MP without irrigation, and Noah-MP with irrigation, using the National Remote Sensing Centre (NRSC) land use land cover (LULC) dataset for 2018-2019, which provides an updated representation of land cover over India. We implement the FAO irrigated fraction map, which serves as the default irrigation dataset in WRF v4.5. The model outputs were compared with the high-resolution regional reanalysis from the Indian Monsoon Data Assimilation and Analysis (IMDAA) of 12km resolution using statistical metrics such as root mean square error (RMSE) and mean bias. The results indicate that both LSMs reasonably capture the broad spatial and temporal characteristics of monsoon rainfall, albeit with varying levels of accuracy. These findings underscore the strong sensitivity of WRF rainfall simulations to both the land surface parameterization and the underlying land use representation, highlighting the importance of accurate region specific high resolution LULC data and LSMs for accurate monsoon rainfall modeling. The results demonstrate that irrigation alters land atmospheric interactions by inducing surface cooling and atmospheric moistening, which modify upper-level humidity, geopotential height, and wind patterns. These changes regulate convective activity differently across space and seasons, leading to regionally and temporally complex rainfall responses. This study provides guidance on selecting appropriate modeling schemes for irrigation-intensive, monsoon-focused simulations over the Indian region.

How to cite: Khobragade, P., Murugesan, K., and Narasimhan, B.: Simulating Indian Monsoon Rainfall over irrigation intensive regions using updated LULC and irrigation representation in WRF model, EGU General Assembly 2026, Vienna, Austria, 3–8 May 2026, EGU26-13817, https://doi.org/10.5194/egusphere-egu26-13817, 2026.

EGU26-15125 | ECS | Posters on site | CL4.4

How do land-use changes shape future extreme temperatures across Europe? 

Luana C. Santos, Rita M. Cardoso, Jorge Navarro Montesinos, Elena García Bustamante, J. Fidel González Rouco, Carlos DaCamara, and Pedro M. M. Soares

In recent decades, Europe has experienced a clear increase in the frequency and intensity of heatwaves, a trend projected to intensify under future climate change. Understanding the processes that modulate extreme heat is therefore critical. While land-use and land-cover changes (LULC) strongly affect surface energy and water exchanges, their role in shaping extreme temperatures at regional scales remains insufficiently explored, particularly under future climate scenarios.

Here, we investigate how LUC modulates extreme temperatures and heatwaves over Europe under the SSP3-7.0 scenario using high-resolution regional climate simulations performed with the Weather Research and Forecasting (WRF v4.5.1.4) model. The simulations analyzed contribute to both the EURO-CORDEX framework and the Flagship Pilot Study LUCAS (Land Use and Climate Across Scales). A standard EURO-CORDEX future experiment with fixed LULC is compared with a corresponding simulation following LUCAS Phase 2, in which LULC evolves annually, allowing the assessment of transient LULC effects under future climate conditions.

Extreme temperature days are identified using percentile-based thresholds of daily maximum temperature, and heatwaves are defined as periods of consecutive exceedances with varying durations. To enable a consistent comparison of event intensity across experiments, temperature and land-surface variables are normalized using seasonal interquartile ranges. Changes in the frequency, duration, and magnitude of extreme heat events are analyzed over Europe and across sub-regional domains.

This analysis aims to quantify the sensitivity of future extreme temperatures to LULC change and to assess the role of land-atmosphere interactions in modulating heat extremes under climate change conditions. The results will contribute to a better understanding of how land management choices may influence future extreme heat risk across Europe.


Acknowledgements

The authors wish to acknowledge the financial support from the Portuguese Fundação para a Ciência e Tecnologia (FCT, I.P./MCTES) through national funds (PIDDAC): LA/P/0068/2020 - https://doi.org/10.54499/LA/P/0068/2020, UID/50019/2025, https://doi.org/10.54499/UID/PRR/50019/2025, UID/PRR2/50019/2025.

L.C.S. and R.M.C. also acknowledge individual funding from FCT, I.P./MCTES grants https://doi.org/10.54499/UI/BD/154675/2023, and https://doi.org/10.54499/2021.01280.CEECIND/CP1650/CT0006.

How to cite: Santos, L. C., Cardoso, R. M., Navarro Montesinos, J., García Bustamante, E., González Rouco, J. F., DaCamara, C., and Soares, P. M. M.: How do land-use changes shape future extreme temperatures across Europe?, EGU General Assembly 2026, Vienna, Austria, 3–8 May 2026, EGU26-15125, https://doi.org/10.5194/egusphere-egu26-15125, 2026.

EGU26-16256 | ECS | Posters on site | CL4.4

Evaluating land-atmosphere interactions controlling precipitation over Central Africa in CESM 

Margo Cabuy, Jessica Ruijsch, Steven De Hertog, Diego Miralles, and Wim Thiery

Tropical precipitation is closely linked to the land surface through the exchange of water and energy between the surface and atmosphere, regulating boundary layer moistening and convective instability. In Central Africa, particularly the Congo Basin, the extensive rainforest contributes a substantial amount of moisture to the atmosphere through evaporation, enhancing convective activity and shaping the region’s seasonal and daily rainfall. In this study, we evaluate the ability of the Community Earth System Model (CESM) can represent these coupled land-atmosphere-convection processes and their control on precipitation across Central Africa.


CESM estimates of rainfall over the past 30 years are compared with multiple observational products (including IMERG, CHIRPS, and MSWEP) to assess whether the model reproduces the magnitude, variability, and spatial distribution of rainfall at daily and seasonal timescales. The same evaluation framework is applied to evaporation, with CESM estimates assessed against L-SAF, CERES, X-base, and GLEAM across consistent spatial and temporal scales. Beyond surface rainfall and evaporation, we analyse CESM’s column-integrated atmospheric moisture budget over the Congo Basin, including diagnostics of convective mass flux, against ERA5, to quantify the contributions of local evaporation, large-scale moisture convergence, and convective transport to precipitation. This approach allows us to identify whether CESM rainfall biases originate from misrepresented land surface fluxes, deficiencies in hydrometeorological parameterisation, or errors in large-scale moisture transport.


The analysis is conducted on both daily and seasonal timescales, to separate fast land-atmosphere coupling from slower circulation-driven controls. By combining evaluations of precipitation and evaporation with a process-oriented decomposition of moisture supply and convective response, this work assesses whether CESM can reliably represent land-driven rainfall variability, moisture recycling, and the emergence of hydroclimatic extremes in Central Africa.

How to cite: Cabuy, M., Ruijsch, J., De Hertog, S., Miralles, D., and Thiery, W.: Evaluating land-atmosphere interactions controlling precipitation over Central Africa in CESM, EGU General Assembly 2026, Vienna, Austria, 3–8 May 2026, EGU26-16256, https://doi.org/10.5194/egusphere-egu26-16256, 2026.

EGU26-17132 | ECS | Orals | CL4.4

Quantifying Land-Surface Effects on Cloud Occurrence Using Neural Networks 

Eva Pauli, Hendrik Andersen, Peer Nowack, and Jan Cermak

The aim of this study is to investigate the effect of land surface conditions on cloud occurrence by quantifying how they modulate the influence of large-scale meteorological conditions.
The land surface can modulate clouds through its influence on surface heat fluxes, local moisture availability, and surface roughness. However, quantifying these effects from observations remains challenging, as the temporal and spatial variability of cloud occurrence is large and influencing factors covary.
Here, we employ a convolutional neural network (CNN) to predict satellite-observed cloud fraction over Europe for the period 1983–2020. Cloud fraction is taken from the CM SAF Cloud Fractional Cover dataset based on Meteosat First and Second Generation observations (COMET). Predictors are derived from the ERA5 reanalysis, including ERA5-Land as well as ERA5 fields on single and pressure levels. To delineate the land surface impact on cloud occurrence predictability, we develop two model configurations: one driven solely by large-scale meteorological conditions, and a second one that additionally incorporates land surface variables. Both models achieve high predictive skill (R² > 0.8), with a slight increase in performance when land surface conditions are included. Sensitivity analyses using permutation feature importance and partial dependency indicates that cloud occurrence is primarily controlled by large-scale meteorological drivers, while soil moisture and surface sensible heat flux emerge as the most influential land surface variables.
Future work will use this framework to quantify the impact of land cover change on cloud occurrence and extend the framework beyond Europe.

How to cite: Pauli, E., Andersen, H., Nowack, P., and Cermak, J.: Quantifying Land-Surface Effects on Cloud Occurrence Using Neural Networks, EGU General Assembly 2026, Vienna, Austria, 3–8 May 2026, EGU26-17132, https://doi.org/10.5194/egusphere-egu26-17132, 2026.

EGU26-17634 | Posters on site | CL4.4

Vegetation–atmosphere feedback in the Mediterranean region from Regional Climate Model simulations: the Apulia case study 

Roberta D'Agostino, Roberto Ingrosso, Francesco Cozzoli, Gregorio Sgrigna, Enrica Nestola, Francesco Pausata, Piero Lionello, and Simona Bordoni

Over the past three decades, the Mediterranean region has experienced an increasing frequency and duration of drought events, a trend that is projected to intensify as anthropogenic emissions continue to rise. Available evidence indicates that drought conditions can trigger extensive tree mortality, amplify wildfire risk, and drive a progressive shift from Mediterranean ecosystems toward vegetation characteristic of semi-arid regions. The role of vegetation and land-use change in climate modelling is fundamental for estimating surface energy fluxes and carbon budgets. Land-use and land-cover changes (LULCCs) can alter surface energy and water fluxes, potentially leading to different responses in mean and extreme temperature and precipitation based on different representation of the vegetationApulia, in southeastern Italy, is an ideal case study, having experienced massive olive tree die-off due to Xylella fastidiosa, an invasive pathogen detected in 2008. This vegetation loss is compounded by increasing drought impacts. This case offers a unique case study to assess the consequences of extensive olive trees die-off after the spread of the pathogen/bacteria Xylella fastidiosa. In order to assess potential impacts of significant change in vegetation covers, winvestigated the effect of die-off and of massive replanting on the regional climate. The study involves two vegetation scenarios (deforestation and reforestation) performed with four sensitivity experiments at 12 km horizontal resolution with two different regional models: RegCM5 and CRCM/GEM4.8. Two experiments will serve as references for present-day (PD, 1990-2019) and future (2071-2100), while other two future experiments will be performed under both vegetation change scenarios. The percentage of plant functional types in the land component (CLM4.5) of RegCM was replaced with that used in the CRCM/GEM4.8 simulations. Preliminary results show that while temperature extremes can be exhacerbated by rewilding, increasing tree cover can help to keep soil moisturised, acting against the progressive aridification of the area. On the other hand, the deforested case leads to a decrease in daily maximum temperature, particularly in Fall and Winter and an increase in daily minimum temperature in Summer. These changes are driven by albedo feedback related to the land-use modification.

How to cite: D'Agostino, R., Ingrosso, R., Cozzoli, F., Sgrigna, G., Nestola, E., Pausata, F., Lionello, P., and Bordoni, S.: Vegetation–atmosphere feedback in the Mediterranean region from Regional Climate Model simulations: the Apulia case study, EGU General Assembly 2026, Vienna, Austria, 3–8 May 2026, EGU26-17634, https://doi.org/10.5194/egusphere-egu26-17634, 2026.

EGU26-17817 | ECS | Orals | CL4.4

Summer Land-Atmosphere Coupling over Europe: A Comparative Evaluation of Observation-based Datasets 

Monalisa Sahoo, Stefano Materia, and Markus Donat

Land–atmosphere coupling has long been recognized to modulate the surface fluxes partition in transitional evaporative regimes, where soil moisture anomalies control evapotranspiration. However, globally available in-situ observations for these variables remain limited. This study provides, for the first time, a comprehensive assessment of the similarities, dissimilarities, and limitations among observation-based datasets of surface soil moisture, evapotranspiration, potential evapotranspiration, and 2-meter mean air temperature across Europe. The analysis focuses on the IPCC-defined regions of Northern Europe, Eastern Europe, Western-Central Europe, and the Mediterranean during summer (June–August) for the recent 20-year period (2003–2022). In addition, the study evaluates and compares the representation of land–atmosphere coupling across the different datasets. The results show that most datasets exhibit strong agreement across most regions and effectively capture land–atmosphere interactions. The coupling analysis further reveals a clear north–south contrast: Northern Europe is energy-limited, where atmospheric coupling dominates, whereas the Mediterranean is water-limited, with stronger terrestrial coupling. Central and Eastern Europe show more variability within the season and across years. Overall, the findings highlight reasonable consistency among datasets in representing land–atmosphere processes, despite existing uncertainties.

Keywords: surface soil moisture, evapotranspiration, land-atmosphere coupling, summer

How to cite: Sahoo, M., Materia, S., and Donat, M.: Summer Land-Atmosphere Coupling over Europe: A Comparative Evaluation of Observation-based Datasets, EGU General Assembly 2026, Vienna, Austria, 3–8 May 2026, EGU26-17817, https://doi.org/10.5194/egusphere-egu26-17817, 2026.

EGU26-17995 | Posters on site | CL4.4

Impacts of high temperatures with varied hit timing on soil moisture drought 

Ye Zhu, Xinyu Zhang, Yi Liu, Bingwei Xu, and Linqi Zhang

High temepratures can impose different effects on soil mositure drought development depending on their hit timing. Based on the reanalysis soil moisture data, we identified the duration of soil moisture drought onset (defined as the time period for moisture to transition from a normal state to below-average condition), and designed a random forest based experimental framework to measure how rapidly soil mositure drought develops under varied high temeprature conditions in China. Results show that the duration of soil mositure drought onset would be shorten by 10-50 days under high temperatures in relative to that of annual mean temperature scenarios. With regard to the timing of high temepratures, the associated impacts were the greatest for high temperatures  of 1 month prior to soil moisture drought occurrence. In densely vegetated areas, pre-drought high temperatures played positively in accelerating the formation of soil moisture drought. In sparse vegetated areas by contrast, post-drought high temperatures contributed to the ongoing development of soil drought. The findings show the asymmetrical impacts of pre-drought and post-drought high temperatures on soil drought development, which may provide some references for improving the understanding of soil moisture drought mechanism in a warming future.

How to cite: Zhu, Y., Zhang, X., Liu, Y., Xu, B., and Zhang, L.: Impacts of high temperatures with varied hit timing on soil moisture drought, EGU General Assembly 2026, Vienna, Austria, 3–8 May 2026, EGU26-17995, https://doi.org/10.5194/egusphere-egu26-17995, 2026.

EGU26-19185 | ECS | Posters on site | CL4.4

Multivariate Climate Extremes and Their Impacts on Arctic Land–Atmosphere Carbon Exchange under Future Climate Change 

Lukas Fiedler, Armineh Barkhordarian, Victor Brovkin, and Johanna Baehr

Rapid warming of the Arctic is increasingly being linked to climate extremes such as heat waves, droughts, and wildfires, which are fundamentally altering the functioning of ecosystems, the dynamics of the carbon cycle, and the interactions between land and atmosphere in the Arctic. Increasing evidence suggests that high-latitude extreme events rarely occur in isolation but are frequently embedded within compound climate extremes. These multivariate events can strongly modify land surface states, through changes in soil moisture, vegetation structure, surface energy balance, and fire disturbance, and thereby influence carbon exchanges between the land and atmosphere. However, the extent to which compound climate extremes amplify or modulate Arctic carbon-cycle extremes in the future remains poorly constrained.

In this study, we investigate how compound climate extreme events shape the evolution of Arctic carbon-cycle extremes under future Arctic warming. Using large ensemble simulations with the Community Earth System Model version 2 (CESM2), which has demonstrated skill in representing Arctic climate processes, fire dynamics, and fire-weather interactions, we assess the evolution of extreme events in gross primary productivity, ecosystem respiration, and net ecosystem carbon balance throughout the 21st century. A multivariate statistical framework is applied to explicitly characterise compound extremes involving fire activity, heat waves, and droughts, and to qualify and quantify their combined impacts on land-atmosphere carbon flux variability in the Arctic. By linking compound climate drivers to ecosystem carbon responses, this work advances our understanding of how land surface conditions regulate extreme carbon-cycle behaviour in a rapidly changing Arctic.

How to cite: Fiedler, L., Barkhordarian, A., Brovkin, V., and Baehr, J.: Multivariate Climate Extremes and Their Impacts on Arctic Land–Atmosphere Carbon Exchange under Future Climate Change, EGU General Assembly 2026, Vienna, Austria, 3–8 May 2026, EGU26-19185, https://doi.org/10.5194/egusphere-egu26-19185, 2026.

EGU26-19261 | ECS | Orals | CL4.4

Uncertainties in land-atmosphere coupling still a big obstacle for accurate climate projections 

Almudena García-García, Francisco José Cuesta-Valero, Ana Bastos, René Orth, and Jian Peng

Terrestrial energy, water and carbon exchanges are regulated by the strength and sign of the coupling between the land surface and the atmosphere. Simulating this land-atmosphere coupling is crucial for realistic weather and climate projections and, especially, to anticipate the evolution of extreme events. After an exploration of the metrics and datasets available for studying land-atmosphere coupling at different temporal and spatial scales, we demonstrate that uncertainties in data products based on in-situ measurements, remote sensing data, and Earth System Model simulations remain large. The evaluation of model simulations according to a variety of land-atmosphere coupling metrics reveals large structural uncertainties in comparison with the small effect of internal variability on land-atmosphere coupling. We show that reducing uncertainties in available Earth Observations (EO) products for studying land-atmosphere coupling is also necessary. This could be done by collecting long-term measurements at the land surface and implementing more observational and physical constraints in the algorithms used to derive EO products. The availability of more accurate, physically consistent EO products with an accurate representation of land-atmosphere coupling will in turn help to develop the future generation of Earth System Models.

How to cite: García-García, A., Cuesta-Valero, F. J., Bastos, A., Orth, R., and Peng, J.: Uncertainties in land-atmosphere coupling still a big obstacle for accurate climate projections, EGU General Assembly 2026, Vienna, Austria, 3–8 May 2026, EGU26-19261, https://doi.org/10.5194/egusphere-egu26-19261, 2026.

EGU26-19934 | Orals | CL4.4

The Role of Land-Surface Dynamics in Climate Persistence and Convective Extremes 

Elizabeth Cultra, J s Nanditha, Jun Yin, Mark S Bartlett Jr, and Amilcare Porporato
The properties governing atmospheric convection, which can produce heavy rainfall and severe weather events, depend on both land-surface characteristics and atmospheric conditions. This work develops a stochastic, coupled plant–soil–atmosphere model that treats atmospheric drivers of moist convection, such as convective available potential energy (CAPE), as functions of the soil–vegetation surface. Further, we link trajectories of these atmospheric and surface variables, including rainfall intensity, to changes in functional plant type (i.e., response to drought stress) and soil type. This enables the realization of steady-state probability distributions of relevant ecohydrological quantities, including soil moisture, plant water potential, and CAPE. From this dynamical systems perspective, the probability of rainfall is conditioned on the terrestrial surface state. Therefore, the wet–dry switching that influences climatic persistence in convection-dominated regions can be directly related to soil moisture. This formulation provides a framework for understanding how very large CAPE and intense rainfall can emerge under specific combinations of antecedent soil moisture, land-surface fluxes, and free-atmospheric conditions.

How to cite: Cultra, E., Nanditha, J. S., Yin, J., Bartlett Jr, M. S., and Porporato, A.: The Role of Land-Surface Dynamics in Climate Persistence and Convective Extremes, EGU General Assembly 2026, Vienna, Austria, 3–8 May 2026, EGU26-19934, https://doi.org/10.5194/egusphere-egu26-19934, 2026.

Energy fluxes between the surface and the atmosphere are known contributors to the genesis and the amplification of temperature extremes: a classic example is the enhancement of land-to-atmosphere sensible heat fluxes during heatwaves over dry soils, boosting the already high surface temperatures to extreme values. Recent work on the Lagrangian analysis of temperature extremes has pinpointed that, in some specific continental regions, diabatic processes do not just act as amplifiers, but play a dominant role in the genesis of positive and negative extreme temperature anomalies. This observation suggests a distinction between world regions where extremely warm or cold air masses are locally generated by non-adiabatic processes, acting as warm or cold air "reservoirs", and other neighboring regions where such extreme air masses are exported adiabatically by the large-scale circulation.

In this work we propose a methodology to identify, in the ERA5 reanalysis data set, the surface energy balance regimes that correspond to the local generation of hot and cold air during summer and winter, respectively, and to separate them from cold/warm air advection regimes. The generation of cold air during winter is favored during clear, calm nights over continental or ice-covered regions, that leads to sustained radiative cooling. The regions where such conditions are most frequent are Siberia and the Canadian Arctic, which can be depicted as the two "boreal cold air reservoirs" of the northern hemisphere. Hot air generation during summer is more geographically spread than cold air, but occurs more frequently in subtropical areas including regions surrounding the Mediterranean Sea.

The framework is illustrated in detail through two case studies. The first is a cold air outbreak that affected eastern Asia during January 2023, which led to the new absolute negative temperature record for China. This event was preceded by particularly favorable conditions for cold air generation over northern Siberia. The second is the July 2022 heatwave, that led to temperatures exceeding 40°C over central England. In this case, a Lagrangian analysis suggests that the extremely high temperatures were related to strong diabatic heating not over the British Isles, but over the Iberian Peninsula in the days preceding the event.

How to cite: Riboldi, J. and Schnyder, F.: A framework to characterize the contribution of upstream land-atmosphere interactions to cold spells and heatwaves, EGU General Assembly 2026, Vienna, Austria, 3–8 May 2026, EGU26-20181, https://doi.org/10.5194/egusphere-egu26-20181, 2026.

EGU26-20768 | Orals | CL4.4

How do future land-use changes jointly influence summer land–atmosphere coupling and fire danger across Europe? 

Rita M. Cardoso, Luana C. Santos, Jorge Navarro, Elena García Bustamante, J. Fidel González Rouco, Carlos C. Camara, and Pedro M M Soares

Land use/land cover changes (LUC) modify local land surface properties that control the land-atmosphere mass, energy, and momentum exchanges. Through soil moisture and vegetation exchanges, land-atmosphere coupling contributes significantly to the evolution of extreme events like heat waves and forest fires. However, these interactions are still unsatisfactorily explored at regional scales under future climate scenarios.

Here, we investigate these processes using newly performed Weather Research and Forecasting (WRF v4.5.1.4) simulations under the SSP3-7.0 scenario, conducted within the EURO-CORDEX and LUCAS Phase 2 regional climate simulation ensembles. Both simulations use the LANDMATE Plant Functional Type (PFT) land cover dataset for Europe, in the first the landcover is kept constant using the 2015 map, while in the second, the land-use evolves annually according to the Land Use Harmonization dataset protocol for SSP3-7.0 scenario.

The impact of temperature–evapotranspiration coupling is assessed using a coupling metric defined as the product of normalised variables, allowing differences across regions and simulations to be examined consistently. The analysis focuses on the coupling between extreme heat (TX90p) or heat waves (defined as TX90p persisting for at least five consecutive days) and evapotranspiration (LH) or soil moisture (SMOIS), expressed through the metrics TX90p×LH and TX90p×SMOIS. Values lower than −1 indicate concurrent deficits in LH (or SMOIS), corresponding to a decoupled land–atmosphere regime. Conversely, values greater than 1 indicate strong land–atmosphere coupling.

The compound effects of extreme coupled and uncoupled events on future meteorological fire danger indices (FWI and FWIe) are analysed for both simulations, enabling a quantitative assessment of the sensitivity of future fire danger to combined climate and land-use changes.

Acknowledgements

The authors wish to acknowledge the financial support from the Portuguese Fundação para a Ciência e Tecnologia (FCT, I.P./MCTES) through national funds (PIDDAC): LA/P/0068/2020 - https://doi.org/10.54499/LA/P/0068/2020, UID/50019/2025, https://doi.org/10.54499/UID/PRR/50019/2025, UID/PRR2/50019/2025.

L.C.S. and R.M.C. also acknowledge individual funding from FCT, I.P./MCTES grants https://doi.org/10.54499/UI/BD/154675/2023, and https://doi.org/10.54499/2021.01280.CEECIND/CP1650/CT0006.

How to cite: Cardoso, R. M., Santos, L. C., Navarro, J., Bustamante, E. G., González Rouco, J. F., Camara, C. C., and Soares, P. M. M.: How do future land-use changes jointly influence summer land–atmosphere coupling and fire danger across Europe?, EGU General Assembly 2026, Vienna, Austria, 3–8 May 2026, EGU26-20768, https://doi.org/10.5194/egusphere-egu26-20768, 2026.

EGU26-20958 | Orals | CL4.4

Revisiting irrigation impacts on the North China Plain: Accounting for water resource limitations 

Hongbin Liang, Shulei Zhang, and Yongjiu Dai

Agricultural irrigation can strongly modify land–atmosphere interactions and regional climate, especially in densely irrigated areas. The North China Plain, the largest irrigated region in China, has experienced significant irrigation-driven changes in local temperature, precipitation, and extreme events. Previous studies often oversimplify irrigation by assuming constant application rates or neglecting water resource limitations, which can lead to biased estimates of irrigation-induced climate effects. To address this, we developed an enhanced irrigation module within a land surface model (Common Land Model, CoLM), coupled with the Community Regional Earth System Model (CRESM), explicitly representing irrigation demand, water availability constraints, and application methods. Using this framework, we successfully reproduced observed surface temperature, precipitation, irrigation amounts, and crop yields across the North China Plain. Our results show that accounting for water-limited irrigation reduces the overestimation of the intensity and frequency of extreme events found in simulations that ignore resource constraints. Furthermore, considering irrigation water limitations alters the simulated regional temperature and precipitation patterns, which in turn affects projections of future agricultural water demand. This study demonstrates that explicitly accounting for water–agriculture interactions is essential for accurately simulating irrigation impacts, supporting more informed strategies for sustainable water and agricultural management under climate change.

How to cite: Liang, H., Zhang, S., and Dai, Y.: Revisiting irrigation impacts on the North China Plain: Accounting for water resource limitations, EGU General Assembly 2026, Vienna, Austria, 3–8 May 2026, EGU26-20958, https://doi.org/10.5194/egusphere-egu26-20958, 2026.

Potential evapotranspiration (ETp) is a variable driven by many factors and one which is heavily affected by climate change. In many cases, the observed increase in ETp is attributed to rising air temperatures in the past and temperature is used as the main prediction variable for future developments of ETp in climate change projections.

The climate station at the lysimeter station Brandis (Saxony, Germany) has been recording a wide range of climate variables since 1980.  From the observations it is evident that, in addition to the increase in air temperature at the site, there has also been a significant increase of sunshine duration (average increase of 0,29h d⁻¹ decade⁻¹) and global radiation (average increase of 47,45 J cm⁻2 d⁻¹ decade⁻¹). This combination of higher temperature levels and increased energy availability leads to significant increases in ETP (average increase of 0,11 mm d⁻¹ decade⁻¹), which is a mayor driver of the local water balance and an important variable in describing the atmospheric demand in modeling studies. Based on the observed trend in sunshine durations we provide an analysis of the individual contributions of increases in global radiation and air temperature, to assess:

  • the individual contributions to the overall increase in potential evapotranspiration (according to Turc-Wendling)
  • the influence of global radiation and air temperature on the intra-annual course?

The individual contributions of increases in radiation and air temperature on the ETP was calculated using trend analysis over the period from 1980 to 2025. It shows that, according to the Turc-Wendling approach, 69% of the ETP increase at the site is radiation-driven, while air temperature only has an influence of 28%. Additionally, clear seasonal patterns are found in the individual contributions.  Overall, the results show that global radiation increases are a mayor driver for the increase in potential evapotranspiration at the site and future developments of potential trends in global radiation should be considered in projections of potential evapotranspiration.

How to cite: Tiedke, A. and Werisch, S.: The influence of increasing radiation (sunshine duration and global radiation) on the increase in potential evapotranspiration, EGU General Assembly 2026, Vienna, Austria, 3–8 May 2026, EGU26-21187, https://doi.org/10.5194/egusphere-egu26-21187, 2026.

EGU26-903 | ECS | PICO | HS10.5

Temporal changes in Ecosystem Resistance and Resilience to Compound Drought and Heat Extremes 

Amitesh Gupta and Karthikeyan Lanka

In recent decades, compound drought and heat-extreme (CDHE) events have garnered attention due to their amplified impacts on the food-energy-water nexus. In comparison to individual extremes, these short-duration compound events severely impede the terrestrial ecosystem, leading to perpetual damage, yield loss, and mortalities. During these events, plants experience xylem embolism, resulting in a reduced water transport capacity. Alongside, elevated heating intensifies the hydric stress resulting from soil dryness through cascading land-atmosphere interactions. This results in rising leaf-level evaporative demand and canopy temperature, driving stomatal closure, which in turn reduces carbon uptake and increases desiccation. However, the impact of these extreme events varies across plant-functional-types (PFTs), primarily due to differences in hydraulic and carbon-economy traits. On the other hand, plants can adjust their thermal tolerance, structure, and stomatal sensitivity by experiencing frequent perturbances; such acclimation alters their later responses. Therefore, there is not only a need to understand how terrestrial ecosystems varyingly respond to CDHE events, but it is also essential to investigate whether there are any temporal changes in their response.

In this study, we use rootzone soil moisture from GLEAM and near-surface air temperature from ERA-5 to identify CDHE events that persist for at least 5 consecutive days during the growing season during 2001-2021 globally. Then, we estimate the resistance and resilience of four distinct PFTs in the context of CDHE. These are: forests (woody), shrublands (non-forest-woody), grasslands (non-woody and natural), and croplands (non-woody and managed). We estimated resistance as the ratio between normalised loss (maximum perturbation in vegetation) and tolerance period (the time taken to reach maximum perturbation from its onset). Resilience is articulated as the recovery rate up to the pre-drought level following the tolerance period. For this purpose, we have acquired daily gridded datasets of gross primary productivity (GPP) and evapotranspiration (ET) from X-BASE and estimated the ecosystem water-use efficiency (WUE). It represents the coupled carbon-water exchange of vegetation at ecosystem-level. Since it is a flux ratio rather than a structural or radiometric index, it captures changes in plant function under environmental stress in ways that greenness metrics cannot. Under drought or heatwaves, ET declines faster than GPP in water-limited regions, resulting in momentary increases in WUE, followed by sharp decline as stress continues to increase. This bidirectional sensitivity is beneficial for analysing stomatal behaviour. Earlier studies have reported that WUE spontaneously responds to stomatal regulation and is also able to capture stress signals across woody and non-woody vegetation.

Outcomes of this study exhibit significant changes in ecosystem resistance and resilience during the last two decades; however, the magnitude of alterations varies across PFTs. During the period of tolerance and recovery, changes in WUE can result from physiological adjustments that alter photosynthesis per unit water loss, and changes in surface partitioning that alter the fraction of ET attributable to plants. Thus, we also evaluate the contribution of physiological coupling and hydrological partitioning (between vegetation and non-vegetative evaporation) in WUE alterations during tolerance and recovery periods, and found that these contributions also exhibit significant temporal changes.

How to cite: Gupta, A. and Lanka, K.: Temporal changes in Ecosystem Resistance and Resilience to Compound Drought and Heat Extremes, EGU General Assembly 2026, Vienna, Austria, 3–8 May 2026, EGU26-903, https://doi.org/10.5194/egusphere-egu26-903, 2026.

EGU26-3487 | ECS | PICO | HS10.5

Thermodynamic controls on vapor pressure deficit during droughts 

Sarosh Ghausi, Tejasvi Chauhan, and Axel Kleidon


Vapor pressure deficit (VPD) is widely used as a measure of atmospheric dryness and evaporative demand in drought studies, yet its interpretation as an independent drought driver remains unclear because of its close coupling to soil-moisture and radiation. Disentangling the atmospheric forcing from land-surface controls on VPD is essential for correctly diagnosing the drought responses, attributing ecohydrological impacts, and interpreting land–atmosphere feedbacks under water-limited conditions. Here, we present an analytical thermodynamic framework that mechanistically describes VPD as a function of observed radiative and surface-evaporative conditions, requiring no additional parameters. This formulation links VPD to variations in lower-atmospheric heat storage reflected in diurnal air temperature range (DTR) and  saturation vapor pressure. The resulting analytical expression is decomposable and helps to disentangle the atmospheric and land-surface drivers of VPD. When applied over global land, the approach reproduces observed spatial and temporal variability in VPD with R2 of 0.9 and 0.8 respectively. It captures observed responses of VPD to solar radiation, clouds, and evapotranspiration across diverse climate and moisture regimes. Our results demonstrate that much of the variability in VPD during dry periods emerges as a thermodynamic response to surface water limitation rather than purely atmospheric forcing. This coupling provides a mechanistic basis for interpreting VPD as both a driver and an indicator of ecohydrological drought responses, with important implications for diagnosing drought stress, understanding land–atmosphere feedbacks, and improving projections of ecosystem vulnerability under climate change.

How to cite: Ghausi, S., Chauhan, T., and Kleidon, A.: Thermodynamic controls on vapor pressure deficit during droughts, EGU General Assembly 2026, Vienna, Austria, 3–8 May 2026, EGU26-3487, https://doi.org/10.5194/egusphere-egu26-3487, 2026.

EGU26-4388 | PICO | HS10.5

Quantifying Eco-hydrological risks in the Yellow River Basin, China 

Yue-Ping Xu, Lu wang, Xiwei Chen, and Changmin Du

The Yellow River Basin (YRB) is an important ecological corridor in northern China, which has undergone substantial changes in multiple eco-hydrological processes. Such changes may decouple carbon, water and energy within ecosystem and cause substantial eco-hydrological risks. In this study, changes in key eco-hydrological variables are investigated and general associtions of evolution trends are revealed by correlation-based networks. Causal networks are then used with physical constraints, to quantitatively portray the directions and magnitudes of eco-hydrological feedbacks. A new index called the Standardized Compound Drought-Vegetation Loss Index (SCDVI) is proposed and used to quantify EHS risk based on stability (derived from resistance and resilience). The results show that the upper reaches of the basin, particularly the source and nearby subregion, show synergistic evolutions between ecological and hydrological subsystems while in the middle and lower reaches eco- and hydro-subsystems show poor synergistic changes. EHS stability was relatively low in the southeastern YRB, where the risk of experiencing compound drought and vegetation loss event (CDVE) was high. The study also found that regions with high vegetation productivity were more prone to a high resistance–low resilience trade-off, while areas with low vegetation productivity exhibited the opposite trade-off. 

How to cite: Xu, Y.-P., wang, L., Chen, X., and Du, C.: Quantifying Eco-hydrological risks in the Yellow River Basin, China, EGU General Assembly 2026, Vienna, Austria, 3–8 May 2026, EGU26-4388, https://doi.org/10.5194/egusphere-egu26-4388, 2026.

EGU26-4391 | ECS | PICO | HS10.5

Dissecting reverse sap flow in desert shrubs: effects of event timing, rainfall thresholds and species 

Zi'xuan Yuan, Yiben Cheng, and Lixia Chu

In arid regions, precipitation is scarce and predominantly occurs as pulsed rainfall events. These events alter both atmospheric and soil moisture conditions, thereby obscuring the dominant controls on plant water transport and making their role in replenishing vegetation water use unclear. We isolated the direct atmospheric pathway by excluding infiltration beneath canopies and quantified organ-level sap flow responses of Haloxylon ammodendron and Tamarix ramosissima to controlled rainfall applied in the morning, afternoon and at night (2, 6 and 10 mm) in the Ulan Buh Desert (June–August). Sap flow of primary branches, main trunks and root system was measured with heat-balance sensors and analysed against meteorological drivers using partial correlations and random-forest models. Responses were strongly time dependent: nighttime rainfall events most readily induced reverse flow, with larger magnitudes in H. ammodendron (e.g. −29.7 g·h-1 in stems; −5.2 g·h-1 in roots). Optimum rainfall amount differed by species: by day, reversals required ≈6 mm in H. ammodendron but ≈10 mm in T. ramosissima; at night, ≈2 mm versus ≈6 mm, respectively. Aboveground organs of T. ramosissima responded sooner (trunk 19 min; branch 21 min) than those of H. ammodendron (≈23 min), whereas root system of H. ammodendron responded earlier (38 min vs. 43 min). Photosynthetically active radiation was the dominant meteorological driver of sap flow in both species and exerted a stronger overall effect in T. ramosissima. Our results demonstrate that small, well-timed nighttime pulses can transiently reverse xylem flow via the atmospheric pathway, with species-specific optimum rainfall amount. This insight carries practical implications for the scheduling of restoration efforts in desert oases, particularly when incorporating considerations of water resource carrying capacity and planting density.

How to cite: Yuan, Z., Cheng, Y., and Chu, L.: Dissecting reverse sap flow in desert shrubs: effects of event timing, rainfall thresholds and species, EGU General Assembly 2026, Vienna, Austria, 3–8 May 2026, EGU26-4391, https://doi.org/10.5194/egusphere-egu26-4391, 2026.

Assessing water conservation functions is critical for sustainable water resource utilization under the changing climate. Spatiotemporal variations of water conservation capacity, driven by climate change and human activities, cause regional socio-economic disparities, yet existing methods fail to accurately characterize factor interactions and are limited to single underlying surfaces, reducing global applicability. To address this, this study integrates the Water Conservation Index (WCI) and geographic detector to evaluate 1985–2022 long-term dynamic changes of water conservation capacity and its driving factors in China's Yellow River Water Conservation Area with complex underlying surface and severe climate change, improving large-scale research reliability. Results show an abrupt 2000 shift in capacity, decline then rise, consistent with climate change; it displays a south-high-north-low pattern, consistent with soil water content (SWC). SWC dominates spatial distribution, followed by ET, LST, and LAI yet precipitation drives SWC. Two-factor interactions between SWC and ET exceed single-factor effects. Post-2000, land use change, urban expansion, and GDP growth boosted FVC and thereafter capacity. These findings provide a theoretical and methodological foundation for water conservation protection under complex conditions, and scientific support for water resource allocation and climate change adaptation policies, facilitating global sustainable development.

How to cite: Zhao, C.: Spatiotemporal Dynamics and Driving Factors of Water Conservation Capacity in China's Yellow River Water Conservation Area, EGU General Assembly 2026, Vienna, Austria, 3–8 May 2026, EGU26-4719, https://doi.org/10.5194/egusphere-egu26-4719, 2026.

EGU26-4805 | PICO | HS10.5

Vegetation Response to Meteorological and Agricultural Drought and Drought Propagation Characteristics in the Sub-Humid and Semi-Arid Regions of Northern China 

Jiayin Liu, Pei Wang, Renjie Guo, Zifan Zhang, Wenyang Cao, Yiran Liu, and Yuan Yuan

The response mechanisms of vegetation to drought vary significantly depending on both drought and vegetation types. Clarifying the propagation process from meteorological drought (MD) to agricultural drought (AD) and its impact on vegetation is of great significance for ecological barrier protection in China. Focusing on the sub-humid and semi-arid regions of Northern China, this study analyzes the time effect and driving factors of vegetation response to MD and AD, while quantifying the drought propagation time (DPT) during 1982–2020. The results indicate that: (1) Across the study area, MD response follows a "short lag-short cum" pattern, while AD exhibits "long lag-short cum" pattern. Compared to sub-humid regions, all vegetation types and forest sub-types in semi-arid regions show a "high sensitivity-high tolerance" pattern toward MD, while exhibiting a "delayed response-low tolerance" pattern toward AD. (2) Regarding MD, shrubland is the most sensitive, while grassland exhibits the highest tolerance; additionally, the drought tolerance of needleleaf forests exceeds that of broadleaf forests. Regarding AD, forests show the highest sensitivity and the strongest tolerance, with broadleaf forests responding more rapidly than needleleaf forests. (3) Significant soil hydrological buffering exists, with 51.8% of vegetation and 53.4% of forest regions exhibiting an 8–9 month DPT. Semi-arid response patterns align with the whole study area (grassland < forest < cropland < shrubland). Broadleaf is consistently shorter than needleleaf across the entire study area, as well as in sub-humid and semi-arid regions. (4) Among the driving factors of vegetation response to drought, temperature (TMP), precipitation (PRE), potential evapotranspiration (PET), and vapor pressure deficit (VPD) rank as the top three in importance. TMP dominates the lagged effects of vegetation response to both MD and AD, whereas PRE determines the cumulative effects for both drought types.

How to cite: Liu, J., Wang, P., Guo, R., Zhang, Z., Cao, W., Liu, Y., and Yuan, Y.: Vegetation Response to Meteorological and Agricultural Drought and Drought Propagation Characteristics in the Sub-Humid and Semi-Arid Regions of Northern China, EGU General Assembly 2026, Vienna, Austria, 3–8 May 2026, EGU26-4805, https://doi.org/10.5194/egusphere-egu26-4805, 2026.

EGU26-5253 | ECS | PICO | HS10.5

Linking Drought Stress to Vegetation Stability and Recovery at the Global River-Basin Scale 

Faisal Baig and Muhammad Abrar Faiz

Vegetation responses to drought play a central role in regulating land–atmosphere interactions, carbon cycling, and ecosystem stability, yet large-scale differences in vegetation resilience across river basins and climate regimes remain insufficiently characterized. This study examines drought-driven changes in vegetation stability and recovery at the global river-basin scale, combining historical observations from 2000–2023 with future projections for 2024–2099 under two climate scenarios (SSP245 and SSP585). Vegetation dynamics are assessed using satellite-derived leaf area index as an indicator of ecosystem condition, while meteorological drought, irrigation, and environmental controls are evaluated within a regression-based attribution framework. Results indicate that many major river basins exhibit weak precipitation control on vegetation dynamics, increasing exposure to drought stress, particularly in arid and semi-arid regions. Irrigation emerges as a key buffering mechanism, contributing between roughly one-fifth and one-half of vegetation resilience during pre-drought and drought phases. Short-term drought projections using machine-learning regression highlight pronounced sensitivity in evergreen and deciduous needleleaf forests, with wetlands and grasslands also showing elevated vulnerability under increasing water limitations. Differences in vegetation response are strongly ecosystem-dependent, reflecting contrasting elasticities to both climatic forcing and human water management.  The findings reveal substantial spatial heterogeneity in vegetation resilience across global river basins and emphasize the growing importance of irrigation in moderating drought impacts under future climate conditions. These results offer new insights into ecosystem-specific drought responses and provide a basin-scale perspective relevant for climate adaptation, water management, and ecosystem sustainability assessments.

How to cite: Baig, F. and Faiz, M. A.: Linking Drought Stress to Vegetation Stability and Recovery at the Global River-Basin Scale, EGU General Assembly 2026, Vienna, Austria, 3–8 May 2026, EGU26-5253, https://doi.org/10.5194/egusphere-egu26-5253, 2026.

EGU26-6872 | ECS | PICO | HS10.5

Quantify the impact of hydrological droughts on carbon dioxide emission from the Yangtze River networks 

Zhendan Wang, Dunxian She, and Shaoda Liu

Rivers, as an important source of CO2 emissions, release substantial amounts of CO2 into the atmosphere through gas exchange at the water-air interface, profoundly influencing the global carbon cycle. In recent years, frequent drought events driven by global climate change have markedly impacted aquatic ecosystems. Hydrological drought, identified by prolonged low river discharge, can disrupt the transport and decomposition of organic matter, leading to pronounced effects on riverine CO2 emissions. Nonetheless, the magnitude of this drought-induced alteration in CO2 emission fluxes is still not fully understood. In this study, we investigated riverine CO2 emissions in the Yangtze River networks, China, from 1979 to 2019 using the boundary layer method. We quantified the impact of hydrological droughts on riverine CO2 emissions from the perspective of river classification. Results showed that hydrological droughts reduced CO2 evasion by approximately 33% compared to non-drought periods. Specifically, CO2 emission flux declined by 18.91%, 25.06%, 31.43%, and 43.22% under mild, moderate, severe, and extreme drought, respectively. River width contraction was identified as the dominant mechanism driving drought-induced reductions in CO2 emissions. Our results showed that lower-order rivers exhibited larger CO2 emission declines, while higher-order rivers showed smaller reductions. This study contributes to a more comprehensive understanding of the impact of hydrological droughts on riverine CO2 emissions, while also providing useful insights for riverine carbon flux dynamics.

How to cite: Wang, Z., She, D., and Liu, S.: Quantify the impact of hydrological droughts on carbon dioxide emission from the Yangtze River networks, EGU General Assembly 2026, Vienna, Austria, 3–8 May 2026, EGU26-6872, https://doi.org/10.5194/egusphere-egu26-6872, 2026.

Compound heat and drought events pose severe challenges to crop growth and development through antagonistic and additive effects. In the Huang-Huai-Hai Plain, summer maize specifically encounters "dual water-heat stress" as its growing season overlaps with peak hazard periods. However, while the spatial patterns of compound events are evolving, existing studies predominantly adopt a static perspective and rely on meteorological indices, thereby overlooking direct root-zone water constraints and lacking the analysis of dynamic migration trajectories over long-term sequences. To address this, our study focuses on the core summer maize production region of China—the Huang-Huai-Hai Plain. Based on daily root-zone soil moisture and air temperature data during the growing seasons from 1980 to 2020, we constructed a Compound Heat and Drought Event (CHDE) index by substituting traditional meteorological indices with the Soil Moisture Deficit Index (SMDI)—which better reflects root-zone water stress—combined with the Temperature Condition Index (TCI).  This study targets daily-scale compound events and analyzes their spatiotemporal characteristics. Building upon static analysis, we introduced a Barycenter Migration to establish a dynamic spatiotemporal analysis framework, tracking evolutionary trajectories across three dimensions: Frequency, Duration, and Severity. Results indicate that the negative correlation between root-zone soil moisture and high temperature follows a "weak-strong-weak" evolution throughout the growing season; the jointing-tasseling (V6-VT) stage exhibits the strongest negative correlation, highest hazard severity, and most frequent occurrence, thus being identified as the critical phenological stage. Spatially, hazard hotspots demonstrate a distinct "central-to-south" migration during crop development, shifting from the central plains during the vegetative growth stage to the southern regions during the reproductive growth stage, with the timing of occurrence expanding toward earlier growth stages. The exposure to compound events experienced a trough in the 1990s, reversed from a decreasing to an increasing trend around 2000, and underwent a abrupt change in 2011–2012. Notably, approximately 60% of the region showed an increase in frequency over the last two decades, exhibiting a distinct spatial asymmetry: increases were primarily concentrated in the southern plains (e.g., Henan, northern Anhui), whereas the northern regions (e.g., Hebei, northern Shandong) were characterized mainly by decreases or stability .Through the spatiotemporal analysis of compound events, this study reveals the evolutionary patterns and regional heterogeneity of compound stress during the summer maize growing stage in the Huang-Huai-Hai Plain, providing a scientific basis for formulating maize irrigation strategies.

How to cite: Mi, L., Zhang, C., and Huo, Z.: Spatiotemporal Evolution and Migration of Compound Heat and Drought Events during the Summer Maize Growing Season in the Huang-Huai-Hai Plain, EGU General Assembly 2026, Vienna, Austria, 3–8 May 2026, EGU26-8633, https://doi.org/10.5194/egusphere-egu26-8633, 2026.

Drought is one of the most widespread and complex natural hazards, with the potential to inflict significant socioeconomic damage. However, current research still falls short in addressing catastrophic droughts, particularly in predicting the socioeconomic consequences of extreme drought scenarios. This study developed a socioeconomic drought classification model based on drought-affected population during extreme drought events, integrating both natural climatic factors and human activity factors to systematically evaluate the spatial patterns and driving mechanisms of socioeconomic drought. The results demonstrate the model exhibits excellent predictive performance (0.85±0.015) for different levels of socioeconomic disaster events. Additionally, SHAP-based feature importance analysis revealed that precipitation, spatial distribution of water sources, and human water consumption constitute the three key driving factors of socioeconomic drought, with the first two factors showing particularly prominent contributions. Notably, the impact of human water consumption on socioeconomic drought exhibits a significant time-lag effect (approximately 4-9months), indicating that longer temporal scales should be considered when assessing anthropogenic influences on drought. These findings highlight the necessity of incorporating both climatic variability and anthropogenic factors in future drought impact assessments, offering new insights for adaptive water resource management under changing environments.

How to cite: Cao, Y.: Understanding Driving Mechanisms and Socioeconomic Impacts during Extreme Drought Events, EGU General Assembly 2026, Vienna, Austria, 3–8 May 2026, EGU26-8970, https://doi.org/10.5194/egusphere-egu26-8970, 2026.

 Saline lakes on the Qinghai–Tibet Plateau (QTP) affect the regional climate and water cycle through water loss (E, evaporation under ice–free and sublimation under ice–covered conditions). Due to the observation difficulty over lakes, E and its underlying driving forces are seldom studied targeting saline lakes on the QTP, particularly during the ice–covered periods (ICP). In this study, The E of Qinghai Lake (QHL) and its influencing factors during the ice–free periods (IFP) and ICP were first quantified based on six years of observations. Subsequently, three models were calibrated and compared in simulating E during the IFP and ICP from 2003 to 2017. The annual E sum of QHL is 768.58 ± 28.73 mm, and the E sum during the ICP reaches 175.22 ± 45.98 mm, accounting for 23% of the annual E sum. E is mainly controlled by the wind speed, vapor pressure difference, and air pressure during the IFP, but is driven by the net radiation, the difference between the air and lake surface temperatures, wind speed, and ice coverage during the ICP. The mass transfer model simulates lake E well during the IFP, and the model based on energy achieves a good simulation during the ICP. Moreover, wind speed weakening resulted in an 7.56% decrease in E during the ICP of 2003~2017. Our results highlight the importance of E in ICP, provide new insights into saline lake E in alpine regions, and can be used as a reference to further improve hydrological models of alpine lakes. 

How to cite: Shi, F.: Evaporation and sublimation measurement and modelling of an alpine saline lake influenced by freeze–thaw on the Qinghai–Tibet Plateau, EGU General Assembly 2026, Vienna, Austria, 3–8 May 2026, EGU26-10423, https://doi.org/10.5194/egusphere-egu26-10423, 2026.

The central Chilean Andes present a unique and precious habitat for vegetation and animal species. However, that habitat is perceived to be under threat from both pastoral grazing and climate change. High-altitude summer grazing is a common pastoral management practice in the region. At the same time Central Chile has experienced a prolonged drought since 2010, with winter precipitation down by approximately 40% over the preceding decade, while average monthly temperatures have increased by about 1°C over the last 20 years.

This study investigates the temporal evolution of vegetation cover, over the period 2003-2022, in three neighbouring Andean catchments in Central Chile. The three catchments have experienced different pastoral grazing regimes during this period, which allows an assessment of the impact of pastoral grazing. Vegetation cover is analysed through a sequence of annual NDVI snapshots (MODIS imagery) over the period 2003-2022, taken towards the end of the grazing period in late summer. Data is represented as annual spatial maps, and as time-series of catchment vegetation cover.

Results indicate that all three study sites experienced a continual long-term decline in vegetation cover. Since the decline is similar in all three catchments, it cannot be unequivocally attributed to the pastoral grazing. Instead, the results suggest a strong correlation between temporal trends in key climate indicators (temperature, rainfall, evaporation soil moisture) and the declining NDVI, especially for seasonally-averaged temperature (R = - 0.75) and soil moisture (R = 0.76). The projected continuation of recent climatic trends suggests that the region’s high-altitude vegetation cover will continue to deteriorate in the coming years.

How to cite: Van De Wiel, M. and Larraín, R.: Impacts of pastoral grazing and climate change on vegetation cover in the central Chilean Andes, EGU General Assembly 2026, Vienna, Austria, 3–8 May 2026, EGU26-12072, https://doi.org/10.5194/egusphere-egu26-12072, 2026.

EGU26-12460 | ECS | PICO | HS10.5

Drivers of propagation and impacts of meteorological and agricultural droughts across Europe 

Christian Poppe Terán, Bibi S. Naz, Alexandre Belleflamme, Pallav K. Shrestha, Mehdi Rahmati, Harry Vereecken, and Harrie-Jan Hendricks-Franssen

Droughts are Europe’s costliest natural disasters, with damages estimated at 621 million Euros per event. Changing precipitation patterns and rising atmospheric water demand are increasingly affecting terrestrial ecosystem functioning in Europe, with profound implications for sustainable water resources management and ecosystem carbon uptake. However, responses are driven not only by drought type and severity but also by diverse land surface properties, including soil texture and vegetation functional traits. A clear understanding of how water deficits propagate to inhibit ecosystem functioning is needed to assess drought risk for specific ecosystems under a warming climate. This study uses Community Land Model v5 (CLM5) simulations over Europe from 1960 to 2024 to identify drought events as spatiotemporal clusters and to systematically determine their propagation across hydrological compartments (e.g., from precipitation to root-zone soil moisture) and their impacts on gross primary production (GPP) and transpiration (T). We find that precipitation droughts often propagate into soil moisture droughts, especially during large-scale droughts, such as in the years 1995, 2003, and 2018. However, soil moisture droughts can also emerge even when precipitation deficits are not typically classified as drought events, for example, when vapor pressure droughts increase evaporation over a prolonged period. Further, we compare trends of drought characteristics and show increasing dynamics in the propagation of vapor pressure droughts and increasing severity of soil moisture droughts. These anomalies interact across multiple time scales to drive a wide, though predominantly negative, range of GPP and T responses: Short-term anomalies can already cause significant impacts on dry ecosystems and grasslands, while having only minor effects in humid ecosystems. These results are essential for understanding ecosystem-specific impacts during discrete drought events and for identifying ecosystems whose functioning is under increased risk as drought frequency and severity increase under climate change in Europe, essentially supporting EU Adaptation Strategy and the Water Framework Directive.

How to cite: Poppe Terán, C., Naz, B. S., Belleflamme, A., Shrestha, P. K., Rahmati, M., Vereecken, H., and Hendricks-Franssen, H.-J.: Drivers of propagation and impacts of meteorological and agricultural droughts across Europe, EGU General Assembly 2026, Vienna, Austria, 3–8 May 2026, EGU26-12460, https://doi.org/10.5194/egusphere-egu26-12460, 2026.

EGU26-15686 | ECS | PICO | HS10.5

Vegetation change impact on the actual Evapotranspiration in China 

Congcong Li and Yongqiang Zhang

Evapotranspiration (ET) is a key variable in both the global carbon and water cycles, and its response to land use and land cover change (LUCC) remains a critical issue for climate modeling and sustainable water resource management. Existing studies have largely focused on the combined impacts of vegetation parameters—such as leaf area index (LAI), land cover type, reflectance, and emissivity—on ET, while the independent contributions of individual vegetation structural and physiological parameters have received limited attention. In this study, we employed a scenario-controlled experiment using the coupled carbon–water process model PML-V2 to disentangle and quantify the effects of different vegetation parameters on interannual ET variability across China from 2001 to 2020. Results demonstrate that PML-V2 effectively captures the independent driving effects of vegetation parameters on ET dynamics. Among these, LAI emerged as the dominant biophysical driver, increasing ET at a national average rate of 0.68 mm yr⁻¹, whereas land cover type changes exerted a minor negative effect (-0.04 mm yr⁻¹). Spatially, LAI-driven increases in ET were pronounced in northern China but slightly declined in the south. Other vegetation parameters exhibited negligible effects. In terms of contributions to ET variability, LAI explained the largest fraction (36%), followed by climate forcing (35%) and atmospheric CO₂ concentration (26%). These findings underscore the importance of accounting for the differentiated roles of vegetation parameters in future LUCC and ecological restoration strategies, particularly in water-limited northern China, to achieve a balance between ecological restoration and long-term water sustainability.

How to cite: Li, C. and Zhang, Y.: Vegetation change impact on the actual Evapotranspiration in China, EGU General Assembly 2026, Vienna, Austria, 3–8 May 2026, EGU26-15686, https://doi.org/10.5194/egusphere-egu26-15686, 2026.

EGU26-15920 | ECS | PICO | HS10.5 | Highlight

Flash droughts threaten global managed forests 

Hang Xu, Zhiqiang Zhang, Yang Xu, and Jianzhuang Pang

Flash droughts, characterized by rapid onset and increasing frequency, pose significant threats to ecosystem stability and function. However, there remains no global consensus regarding forest responses to flash droughts. Here, using a reconstructed global high spatiotemporal resolution Standardized Precipitation-Evapotranspiration Index dataset and an interpretable machine learning framework, we find that global forests have experienced increasingly rapid, intense, and prolonged flash droughts over the past four decades. Managed forests are more prone to browning from flash droughts than intact forests due to their limited capacity to acclimate to rapid drought stress driven by extreme heat. Notably, our meta-analysis confirms that current forest management practices, designed to maximize ecosystem services, exacerbate the vulnerability of managed forests to flash droughts globally. Our findings highlight the escalating risks posed by increasingly frequent and prolonged flash droughts to managed forests, underscoring the urgent need to integrate resistance and resilience to extreme climatic events into forest management strategies.

How to cite: Xu, H., Zhang, Z., Xu, Y., and Pang, J.: Flash droughts threaten global managed forests, EGU General Assembly 2026, Vienna, Austria, 3–8 May 2026, EGU26-15920, https://doi.org/10.5194/egusphere-egu26-15920, 2026.

EGU26-15928 | ECS | PICO | HS10.5

Impact of Time-Varying Soil and Vegetation Parameters on Passive Microwave Soil Moisture Retrieval 

Zhiguo Pang, Xiangdong Qin, Wei Jiang, and Jingxuan Lu

Soil moisture is a key variable in land surface water and energy cycles, and passive microwave remote sensing inversion is one of the primary approaches for large-scale soil moisture monitoring. Although physically based models for passive microwave soil moisture retrieval have been well established, the inversion process still faces challenges due to the large number of model parameters, some of which are difficult to obtain. In particular, soil surface roughness and vegetation single-scattering albedo, which characterize soil and vegetation effects, cannot be directly measured. As a result, most existing retrieval methods adopt empirically fixed parameter values, neglecting their temporal variability. In this study, a simulated brightness temperature dataset combined with a probability density approach is used to estimate monthly soil roughness and vegetation single-scattering albedo over the Shandian River Basin based on multi-temporal brightness temperature observations. These time-varying parameters are then incorporated into passive microwave soil moisture retrieval and evaluated against in situ soil moisture measurements and the MCCA soil moisture product. The results indicate that (1) soil roughness and vegetation single-scattering albedo exhibit pronounced intra-annual variability; (2) when the temporal variability of these parameters is considered, the overall accuracy of the retrieved soil moisture is comparable to that of the MCCA product, with good agreement in summer and improved stability in winter, and the temporal variations are more consistent with ground-based observations; and (3) introducing time-varying parameters reduces the intra-annual differences in monthly mean soil moisture, primarily because part of the brightness temperature variability is explained by parameter changes rather than being entirely attributed to soil moisture variations. Overall, incorporating the time-varying characteristics of soil and vegetation parameters enhances the temporal performance of passive microwave soil moisture retrieval, and furnishes new insights for the refinement of associated inversion methods.

How to cite: Pang, Z., Qin, X., Jiang, W., and Lu, J.: Impact of Time-Varying Soil and Vegetation Parameters on Passive Microwave Soil Moisture Retrieval, EGU General Assembly 2026, Vienna, Austria, 3–8 May 2026, EGU26-15928, https://doi.org/10.5194/egusphere-egu26-15928, 2026.

EGU26-15961 | ECS | PICO | HS10.5

Hydroclimate-driven soil moisture declines during the North American megadrought 

Jie Hu, Mallory Barnes, Rubaya Pervin, and Steven Kannenberg

The recent megadrought in the southwestern U.S. is the most severe in over a millennium, intensifying pressure on water resources and compromising ecosystem function. However, this megadrought is often diagnosed using indirect methods such as tree-ring reconstructions, which can be spatially biased and imperfect proxies of climatic conditions.  Direct measurements of soil moisture provide quantitative records of soil water storage in the land surfacebut it is only recently that the spatial and temporal scopes of these measurements have become large enough to diagnose the megadrought. By leveraging a dense network of in situ soil moisture measurements across depths, we quantified the trends in soil moisture during the megadrought and assessed its underlying drivers. The southwestern U.S. exhibited a pervasive drying trend of soil moisture during the megadrought, though there was significant spatial heterogeneity across basins. Reductions in mid-to-late season precipitation, along with widespread increases in VPD – vapor pressure deficit, were associated with long-term declines in soil moisture across all depths. Hydroclimate teleconnections were associated with soil moisture trends at larger spatiotemporal scales. Observed declines in soil moisture were not captured by a common microwave-based product but were better captured by gravimetry-based measurements. Our study highlights the importance of cool-season water inputs in the southwestern U.S., along with the future risks to water resources caused by rising VPD.

How to cite: Hu, J., Barnes, M., Pervin, R., and Kannenberg, S.: Hydroclimate-driven soil moisture declines during the North American megadrought, EGU General Assembly 2026, Vienna, Austria, 3–8 May 2026, EGU26-15961, https://doi.org/10.5194/egusphere-egu26-15961, 2026.

EGU26-16585 | ECS | PICO | HS10.5

Opposite shifts in drought-season evapotranspiration controls across hydroclimatic regimes in China 

Chen Zhang, Zhou Shi, Sheng Wang, and Zhonghua Zheng

Drought depletes water resources and can trigger substantial productivity losses and plant mortality. However, predicting drought impacts on water resources and ecosystem functioning remains difficult because evapotranspiration (ET) responses are highly uncertain. The sign and magnitude of drought-induced ET anomalies affect not only the water balance, but also land-atmosphere interactions and drought progression. Atmospheric drying (high vapor pressure deficit, VPD) can enhance ET, whereas soil moisture (SM) depletion suppresses soil evaporation and plant transpiration via stomatal regulation. Therefore, drought ET responses emerge from competing constraints imposed by atmospheric demand and moisture supply. Here we quantify how VPD and SM jointly control growing-season drought ET anomalies across hydroclimatic regimes in China using satellite remote sensing, physics-constrained machine learning ET estimations, and hydro-meteorological reanalysis data. ET is derived by coupling the Penman–Monteith framework with machine learning, yielding estimates that have been extensively validated and shown to perform robustly under data-limited conditions and during drought events. We then characterize the sign and magnitude of ET anomalies during drought by jointly considering meteorological, hydrological, and ecological drought metrics. Then, we disentangle the contribution of atmospheric demand and moisture supply constraints on ET anomalies based on the percentile binning method (assuming weak VPD and SM dependence in their short intervals), thereby distinguishing water demand-limited from water supply-limited regimes. The enhancement driven by atmospheric drying dominates in water demand-limited regions, while the suppression driven by soil moisture deficit prevails in water supply-limited regions, and both vary along dry-wet gradients. Finally, using an explainable machine learning approach (SHAP), we diagnose multiyear changes in these controls. We find regime-dependent trends with opposite signs: the positive VPD effect on drought ET anomalies declines in demand-limited regions, whereas the negative SM effect becomes less negative in supply-limited regions. These opposite-sign trends are primarily associated with evolving air-temperature and soil-moisture anomaly patterns, highlighting non-stationary drought controls on ET across China’s hydroclimatic regimes.

How to cite: Zhang, C., Shi, Z., Wang, S., and Zheng, Z.: Opposite shifts in drought-season evapotranspiration controls across hydroclimatic regimes in China, EGU General Assembly 2026, Vienna, Austria, 3–8 May 2026, EGU26-16585, https://doi.org/10.5194/egusphere-egu26-16585, 2026.

Soil-atmosphere compound drought, characterized by concurrent low soil moisture (SM) and high vapor pressure deficit (VPD), poses an increasingly severe threat to terrestrial carbon sinks. Although vegetation can tolerate mild drought through physiological responses, extreme drought could still cause irreversible damage, leading to significant declines in ecological functions. However, the critical tipping points triggering ecosystem transitions from resistance to vulnerability remain poorly quantified. Here, we developed a data-driven framework to identify nonlinear response thresholds of vegetation to compound drought across China and assessed associated impacts on gross primary production (GPP) under CMIP6 scenarios. Using observations from 2001 to 2020, we found that vegetation response was not linearly related to drought occurrence; instead, a distinct drought threshold exists (mean compound drought index percentile of approximately 14.1%). Dropping below this threshold triggers a transition from resistance to vulnerability (termed ecological drought), causing a precipitous collapse in photosynthetic function where average GPP anomalies plummeted from -0.84 to -4.57 gC m⁻² mon⁻¹. Future projections (2081–2100) confirm that this threshold-driven vulnerability persists, with ecological droughts projected to occur more frequently across over 56% and 61% of vegetated areas under the two respective emission scenarios. Critically, our cross-scenario comparison reveals that the magnitude of GPP losses is governed by drought intensity rather than frequency alone. Under the high-emission SSP5-8.5 scenario, drought intensity dominates in 55.9% of the vegetated area, accelerating at a relative rate 2.32 times that of frequency. This rapid intensification drives greater average GPP losses (-28.17 ± 23.48 gC m⁻² mon⁻¹) compared to the lower-emission path (-24.59 ± 18.23 gC m⁻² mon⁻¹), resulting in higher total GPP losses (-236.53 ± 198.56 versus -199.05 ± 162.59 gC m⁻²). These findings demonstrate that drought intensity overrides frequency as the primary driver constraining terrestrial carbon uptake.

How to cite: Cheng, Y. and Liu, L.: Soil-atmosphere compound drought intensity overrides frequency in constraining future carbon uptake across China, EGU General Assembly 2026, Vienna, Austria, 3–8 May 2026, EGU26-17713, https://doi.org/10.5194/egusphere-egu26-17713, 2026.

EGU26-18809 | ECS | PICO | HS10.5

Seasonal Sap Flow Dynamics Under Variable Water Stress in a Himalayan Chir Pine (Pinus roxburghii) Forest 

Kriti Bohra, Priyanka Lohani, and Sandipan Mukherjee

The Himalayan region is experiencing rapid hydroclimatic shifts, yet the physiological resilience of its dominant forest species remains poorly understood. Although Pinus roxburghii (Chir pine), one of the dominant species of the central Himalaya, covers 16% of the forest area, our understanding of its water-use strategies under compounding stress conditions such as low soil moisture (SM) and high vapor pressure deficit (VPD) is limited. Here, we investigated the hydro-physiological response of a Chir pine-dominated forest in the Kumaun Himalayas (Almora, India) using continuous Thermal Dissipation Probe (TDP) measurements over 304 days. By integrating sap-flux-derived transpiration with daily environmental data, we quantified tree water regulation across dormant and growing seasons. Efforts are also made to enhance our knowledge of the behavior of Chir-pine under water stress conditions, which was quantified by isolating 50th percentile thresholds (SM < 0.13 m³ m⁻³; VPD > 0.76 kPa) of the stress conditions. Our analysis reveals a significant seasonal variation in hydraulic sensitivity. During the growing season, mean sap flow (812.4 cm³ h⁻¹) was notably higher than during the dormant season (513.9 cm³ h⁻¹) driven by peak photosynthetic demand. We also found that SM emerged as the key determinant of Himalayan Chir-pine transpiration, while VPD did not have any such signatures. However, trees maintained high flux under isolated atmospheric drought (high VPD, high SM); the transition to combined stress triggered a sharp, non-linear decline in sap flow. This indicates an isohydric strategy of Chir-pine, where strong stomatal regulation prioritizes the prevention of xylem embolism over carbon gain during the environmental stress. This study provides the first mechanistic baseline for scaling tree-level hydraulics to forest-stand water balances in the Central Himalayas, offering critical insights for predicting regional forest water security under a changing climate.

How to cite: Bohra, K., Lohani, P., and Mukherjee, S.: Seasonal Sap Flow Dynamics Under Variable Water Stress in a Himalayan Chir Pine (Pinus roxburghii) Forest, EGU General Assembly 2026, Vienna, Austria, 3–8 May 2026, EGU26-18809, https://doi.org/10.5194/egusphere-egu26-18809, 2026.

BG4 – Marine and Freshwater Biogeosciences

Climate-induced permafrost thaw unlocks large organic carbon stores. Permafrost rivers receive substantial terrestrial inputs of thawing organic carbon (OC) that is mostly degraded to photochemical and microbial respiratory carbon dioxide (CO2). Yet, there is little information on how photochemical and microbial processes combine to alter fluvial carbon dynamics, and ultimately, carbon budget in permafrost areas. Our results from permafrost rivers on the Qinghai-Tibet Plateau mechanistically describe that photodegradation, as a rate limiting and priming step, initiates ring cleavage reactions, rapidly reducing dissolved OC (DOC) molecular weight from aromatic to aliphatic compounds. This in turn resulted in alteration of riverine microbial communities, further converting photo-altered DOC to CO2. Strikingly, the combination of photochemical and microbial processes forms a synergistic interplay, expediting CO2 delivery to the atmosphere, of which 33 ± 10% is derived from millennial-aged permafrost carbon. Our findings highlight that strong solar radiation at high-altitude accelerates microbial CO2 production, and emission, from photo-altered permafrost DOC, contributing to the permafrost carbon feedback that intensifies warming.

How to cite: Zhang, L., Battin, T., and Karlsson, J.: Synergistic photochemical and microbial degradation of DOC enhance CO2 emissions from permafrost river on the Qinghai-Tibet Plateau, EGU General Assembly 2026, Vienna, Austria, 3–8 May 2026, EGU26-2275, https://doi.org/10.5194/egusphere-egu26-2275, 2026.

EGU26-3015 | ECS | Orals | BG4.1

Reservoir operation regulates the dynamics of dissolved organic matter in sediments 

Yingju Wu, Hongwei Fang, Lei Huang, Chen He, Quan Shi, Yuanbi Yi, Ding He, and Kai Wang

Dissolved organic matter (DOM) in sediments is pivotal in biogeochemical processes of aquatic ecosystems. Given the influence of reservoir operation on riverine ecosystems, the dynamics of DOM in reservoir sediments remain unclear. In this study, focusing on the Three Gorges Reservoir (TGR), one of the world’s largest reservoirs, we investigated the mechanisms underlying variations in sedimentary DOM using radiocarbon(Δ14C), optical, and molecular techniques. Furthermore, a DOM molecule–based numerical model was developed to assess the monthly and annual variations in sedimentary DOM from 2011 to 2080. Laboratory analysis demonstrated that there was more autochthonous DOM in sediments with a declining pattern from upstream to downstream in the wet season, and more allochthonous DOM in sediments with no spatial trend in the dry season. The findings suggested that variations of primary productivity and hydrological conditions influenced by reservoir operation likely modulated the dynamics of DOM in sediments of TGR. Moreover, based on the numerical simulation, from 2011 to 2080, July, April, and September hold major (>50%) of the year’s accumulation of allochthonous and autochthonous DOM in sediments. By 2080, the quantities of allochthonous and autochthonous DOM in sediments in TGR would reach 1166×104t and 129×104t, respectively. This study provides detailed insights into the dynamics of organic matter pools in reservoirs and enhances our understanding of the ecological impacts of reservoir construction on aquatic ecosystems.

How to cite: Wu, Y., Fang, H., Huang, L., He, C., Shi, Q., Yi, Y., He, D., and Wang, K.: Reservoir operation regulates the dynamics of dissolved organic matter in sediments, EGU General Assembly 2026, Vienna, Austria, 3–8 May 2026, EGU26-3015, https://doi.org/10.5194/egusphere-egu26-3015, 2026.

EGU26-3776 | ECS | Posters on site | BG4.1

Phosphorus cycling and REE enrichment in pelagic clay: Insights from a coupled Nd–P mass-balance approach 

Ryosuke Matsunami, Kazutaka Yasukawa, Kentaro Nakamura, and Yasuhiro Kato

“REE-rich mud” has attracted attention as an unconventional resource for critical rare-earth elements (REE) used in green and high-tech industries [1]. It is a type of pelagic clay characterized by high REE (especially heavy REE) concentrations. In REE-rich mud, biogenic calcium phosphate (BCP; fish-bone apatite) plays a key role as a major host phase of REE, linking sedimentary REE enrichment to marine phosphorus (P) cycling and biological productivity [2]. Preliminary Nd–P one-box mass-balance analyses [3] suggested that fish-derived P burial may constitute an important component of total P burial in pelagic realms and that variability in P cycling may therefore be a major control on the conditions favorable for REE-rich mud formation. This motivates a reassessment that explicitly accounts for oceanographic processes which regulates nutrient supply and redistribution.

In this study, we develop a Nd–P mass-balance model that represents the ocean in a subdivided, coupled-reservoir framework to account for internal transport and redistribution. The framework tracks major P cycling and burial pathways, including burial associated with organic matter, authigenic phases (Ca-phosphate and Fe-bound P), and fish debris (BCP), together with neodymium (Nd) as a representative REE.

Using this framework, we aim to examine how redistribution of nutrients and Nd influences inferred BCP burial contributions and, by extension, the conditions favorable for REE-rich mud formation. We will conduct sensitivity and scenario experiments on internal transport and biological productivity within the ocean, and discuss implications for linking Earth-system processes to REE-rich mud genesis.

[1] Kato et al. (2011) Nat. Geosci. 4, 535–539. [2] Ohta et al. (2020) Sci. Rep. 10, 9896. [3] Matsunami et al. (2025) AGU Annual Meeting 2025, PP24B-08.

1: School of Engineering, Univ. of Tokyo, 2: ORCeNG, Chiba Institute of Technology

How to cite: Matsunami, R., Yasukawa, K., Nakamura, K., and Kato, Y.: Phosphorus cycling and REE enrichment in pelagic clay: Insights from a coupled Nd–P mass-balance approach, EGU General Assembly 2026, Vienna, Austria, 3–8 May 2026, EGU26-3776, https://doi.org/10.5194/egusphere-egu26-3776, 2026.

EGU26-4433 | Orals | BG4.1

Fe(II) Biogeochemistry in Coastal Waters 

J. Magdalena Santana-Casiano, Melchor González-Dávila, Aridane G. González, Adrián Bullón-Téllez, Victor Coussy, Irene Sánchez-Mendoza, and David González-Santana

Ocean acidification and warming modify iron (Fe) redox cycling by altering reaction kinetics, speciation, and complexation processes that control Fe bioavailability in coastal waters. These drivers arise from both anthropogenic CO₂ emissions and natural volcanic inputs, which coexist in the ocean and allow the investigation of Fe(II) oxidation under contrasting chemical regimes.

Within the FeRIA project (PID2021-123997NB-I00), Fe(II) oxidation dynamics were investigated at coastal sites influenced by volcanic CO₂ emissions (Fuencaliente and Tazacorte, La Palma) and at sites mainly affected by anthropogenic CO₂ (El Hierro and Gran Canaria). Although both systems experience reduced pH, volcanic environments introduce additional chemical species that influence Fe complexation and redox reactivity.

Fe(II) oxidation rates exhibited strong spatial variability and were controlled by the combined effects of physi-cochemical parameters (pH, temperature, salinity, dissolved oxygen) and organic ligands. Lower pH consistently decreased Fe(II) oxidation kinetics, favouring longer Fe(II) lifetimes, while increasing temperature enhanced oxidation rates. Dissolved and particulate organic matter exerted a key control through complexation, either stabilising Fe(II) and inhibiting oxidation or promoting electron transfer depending on ligand composition and functional groups.

These results highlight the kinetic balance between acidification, warming, and organic complexation in regulating Fe(II) persistence. They also assess whether volcanic CO₂–impacted marine systems capture the dominant kinetic and complexation processes controlling Fe(II) oxidation under future anthropogenic ocean acidification.

How to cite: Santana-Casiano, J. M., González-Dávila, M., González, A. G., Bullón-Téllez, A., Coussy, V., Sánchez-Mendoza, I., and González-Santana, D.: Fe(II) Biogeochemistry in Coastal Waters, EGU General Assembly 2026, Vienna, Austria, 3–8 May 2026, EGU26-4433, https://doi.org/10.5194/egusphere-egu26-4433, 2026.

EGU26-4469 | ECS | Posters on site | BG4.1

Iron-binding ligands in the coastal waters of La Palma affected by the Tajogaite volcanic eruption 

Victor Coussy, Aridane G. González, David González-Santana, Melchor Gonzalez-Davila, and J. Magdalena Santana-Casiano

The 2021 eruption of Tajogaite volcano (La Palma, Canary Island) significantly altered the nearby coastal environment and chemistry through the formation of lava delta. Despite the importance of metal speciation for the ecosystems, our knowledge of Fe-organic speciation and the input of lava associated with the lava deltas formation in its biogeochemical cycle remains limited. This study explores the impact of the Tajogaite eruption on the Fe speciation by measuring the labile Fe-binding ligands (LFe) and their conditional stability constants (log KcondFe’L).

Before, during and after the volcano eruption, 10 stations were monitored and analyzed by competitive ligand exchange-adsorptive cathodic stripping voltammetry (CLE-ACSV) method, using TAC as a competitive ligand. To determine the optimal experimental conditions for comparing the different environments along the sampling years, different detection windows were employed (2, 5 and 10 µM TAC). The LFe concentrations ranged between 2.32 and 12.38 nM, with a maximum recorded in February 2023 near the southern lava delta (station 5, 28.616ºN, 12.38 nM). Other high concentrations were found from April to September 2024 at northern stations near to the other lava delta (28.624ºN, 11.20 nM). The minimum LFe concentration was observed at offshore station (station 10, 17.932ºW, 28.599ºN, 2.32 nM).

The observed log KcondFe’L were between 9.33 and 10.73 under the studied conditions and correspond to weak ligands (L2-type) such as humic substances or polyphenols. The results show clear spatial and temporal variability, with significantly higher ligand concentration near lava deltas, suggesting a lasting volcanic influence on ligand production with a clear impact on the Fe speciation. Thus, the arriving of lava and the lava deltas formation act as a local source of Fe-biding ligands for several years after the eruption, keeping Fe in solution. However, the impact is locally limited, highlighting the importance of sampling site selection for accessing volcanic effects on coastal trace metal cycling.

How to cite: Coussy, V., G. González, A., González-Santana, D., Gonzalez-Davila, M., and Santana-Casiano, J. M.: Iron-binding ligands in the coastal waters of La Palma affected by the Tajogaite volcanic eruption, EGU General Assembly 2026, Vienna, Austria, 3–8 May 2026, EGU26-4469, https://doi.org/10.5194/egusphere-egu26-4469, 2026.

Rising water temperatures and increasingly frequent low-flow conditions are expected to intensify under climate change, yet their combined effects on internal nutrient loading in streams remain poorly understood. During summer, higher temperatures can enhance biological activity and organic matter mineralisation at the sediment–water interface, while reduced discharge limits oxygen supply, potentially stimulating nutrient release from sediments.

In this study, we investigate the mechanisms and drivers of nutrient remobilisation from stream sediments using controlled laboratory experiments under different temperature and low-flow scenarios. We specifically assess how temperature effects interact with sediment characteristics to determine the magnitude of internal nutrient release.

Our results show that nutrient remobilisation responds significantly to temperature changes; however, the response is non-linear and strongly dependent on the initial trophic state of the stream and sediment biomass. These findings suggest that stream warming may substantially enhance internal nutrient loading in some systems but not in others. This context-dependent response highlights the need to account for sediment legacy effects when assessing climate change impacts on stream water quality and when designing management strategies under prolonged low-flow conditions.

How to cite: Liao, Z.: Can stream warming trigger internal nutrient remobilisation from sediments?, EGU General Assembly 2026, Vienna, Austria, 3–8 May 2026, EGU26-5605, https://doi.org/10.5194/egusphere-egu26-5605, 2026.

EGU26-5627 | ECS | Orals | BG4.1

Carbon Sources, Transport and Sequestration in Tropical River Floodplains of Sabaki and Tana, Kenya 

Shawlet Cherono, Sudam Samarasinghe, Christian Schwarz, Fredrick Tamooh, Fred Omengo, Alberto V. Borges, Helena Adriaenssen, Johannes Drijvers, and Steven Bouillon

Rivers form a crucial component of the global carbon (C) cycle. They not only link terrestrial and oceanic pools, but their floodplains and channels also act as C sources and sinks, and areas of C biogeochemical processing. Quantification of C fluxes is often challenging because estimates can be biased if measurements do not adequately capture the high spatial (upstream vs downstream, channel vs floodplain) and temporal (day vs night, dry vs wet seasons, year to year) variability. This study focuses on closing existing knowledge gaps on the influence of river geomorphology on biogeochemical C processes and lateral C exchanges across river reaches and seasons in tropical river systems by quantifying C processes, sources and storage in two tropical river floodplain systems. Rivers Sabaki and Tana both originate from Kenya’s central highlands and drain into the Indian Ocean, but they differ strongly in their geomorphology and the degree of impact by agriculture, reservoirs, industries and nutrient inputs. We characterized C pools and sources (using C and N stable isotope ratios as proxies) in river water and floodplain sediments during different field campaigns in 2024 and 2025 during the dry season (September - October), as well as regular sampling of river biogeochemistry throughout the year. Additionally, we measured in situ benthic and pelagic respiration rates and concentrations of dissolved greenhouse gases (GHG: CO2, N2O, CH4). Sediment organic carbon (OC) appeared to be mainly derived from riverine suspended matter, with localized contributions of floodplain vegetation in particular along the Tana River floodplains and in overbank floodplains of the Sabaki River. In the case of Sabaki, the sources of OC transported shows extreme contrasts between wet and dry periods, which are dominated by terrestrial runoff (mix of C4 and C3-derived C) and autochthonous production, respectively. The average sediment OC content showed a clear decline with depth (0.492% at <10 cm, 0.495% at 10-50 cm, 0.362% at 50-100 cm, 0.193% at 100-320 cm). Lower OC levels and preaged OC deposits within the top layer also supports the hypothesis that the floodplain OC is largely deposition from riverine particulate organic carbon (POC) during wet season. A strong correlation was observed between OC and clay content (r = 0.60, p < 0.001), and between OC and distance from the channel (r = 0.669 , p < 0.001).  Clay provides reactive surface area for OC sorption, and lower flow energy and fine sediments settle furthest. During the dry season Sabaki system is strongly autotrophic, characterized by strong CO2 undersaturation and suspended matter dominated by photosynthetic biomass with a high OC content (on average 16.5%). Overall, our findings demonstrate that tropical river systems are highly dynamic component of the C cycle, in which geomorphology, seasonality, and land use strongly regulate C sources, storage and processing. Low land floodplains are primarily depositional sinks for in situ plant derived OC and allochthonous POC, with spatial patterns controlled by hydrodynamics and sediment texture, while temporal variability reflects shifts between terrestrial inputs during wet seasons and autochthonous production during dry periods.   

How to cite: Cherono, S., Samarasinghe, S., Schwarz, C., Tamooh, F., Omengo, F., V. Borges, A., Adriaenssen, H., Drijvers, J., and Bouillon, S.: Carbon Sources, Transport and Sequestration in Tropical River Floodplains of Sabaki and Tana, Kenya, EGU General Assembly 2026, Vienna, Austria, 3–8 May 2026, EGU26-5627, https://doi.org/10.5194/egusphere-egu26-5627, 2026.

EGU26-6208 | ECS | Orals | BG4.1

Intensive water management of dryland rivers drives fine-sediment accumulation, redox-sensitive internal loading, and flow-controlled oxygen dynamics 

Josh Guyat, Douglas Tait, Scott Johnson, Benjamin Stewart, Angus Ferguson, James Padilla-Montalvo, Christopher Ralph, Kathryn Taffs, Matt Balzer, Warwick Mawhinney, Rio Beresford, and Damien Maher

The Menindee Lakes, situated on the lower Darling–Baaka River in central Australia, form a major regulated water-storage complex that supplies water to major agricultural and urban areas. As a shallow dryland lake–river complex, the system typically experiences prolonged low-flow periods punctuated by short pulse floods. However, the construction of the Menindee Lakes Scheme in the 1960s transformed the system into an artificial, low-energy lotic storage and sediment trap, fundamentally altering benthic sediment fluxes, residence times, and redox dynamics. With unexplained repeated mass fish mortality events over the past decade, it is essential to understand the biogeochemical mechanisms driving changes in oxygen availability.

Here, we combined seasonal sediment core incubations, stable isotope measurements, and field data-driven dissolved-oxygen modelling to identify and quantify the transformations and fate of nutrients and redox-active elements. Intact sediment cores were incubated in the field at eight sites spanning hydrologically distinct regions, capturing a gradient from fine, organic-rich sediments upstream to sandier sediments downstream. A two-step sequential oxic-to-anoxic incubation design, applied to the same cores, quantified fluxes of nutrients and redox metals, as well as nitrate isotope dynamics (δ¹⁵N–NO₃⁻, δ¹⁸O–NO₃⁻), resolving key redox-driven transformations.

Nutrient fluxes exhibited strong spatial and seasonal contrasts that aligned with flow regulation and associated fine-sediment accumulation. Fine-grained, organic-rich sediments associated with Lake Wetherell and the upper weir pool showed substantially higher biogeochemical reactivity than sandier downstream sites. In summer, weir-pool sediment oxygen demand nearly doubled, and Lake Wetherell consistently emerged as a biogeochemical hotspot, with NH₄⁺ and PO₄³⁻ release rates more than twice those elsewhere and PO₄³⁻ release increasing >20-fold. Under anoxic conditions, δ¹⁵N–NO₃ followed Rayleigh-type enrichment consistent with denitrification. However, δ¹⁸O–NO₃ showed decoupling from expected fractionation, indicating alternate redox-sensitive nitrogen cycling pathways (likely DNRA) that can recycle and retain N.

Anoxic fluxes of reduced nitrogen and redox-active species from the weir pool were stoichiometrically converted to sediment oxygen demand (SOD), upscaled to the weir-pool scale, and incorporated into a dissolved-oxygen box model to quantify sediment-mediated oxygen demand under no-flow conditions and the flow required for recovery following re-oxygenation. This demonstrated that during no-flow drought conditions, SOD can accumulate rapidly, while recovery following re-oxygenation is sensitive to both the magnitude and duration of managed flow releases. By integrating field, laboratory, and modelling approaches, we demonstrate how flow regulation and management-driven fine-sediment accumulation control redox-sensitive sediment biogeochemistry and amplify seasonal oxygen stress in regulated dryland rivers.

How to cite: Guyat, J., Tait, D., Johnson, S., Stewart, B., Ferguson, A., Padilla-Montalvo, J., Ralph, C., Taffs, K., Balzer, M., Mawhinney, W., Beresford, R., and Maher, D.: Intensive water management of dryland rivers drives fine-sediment accumulation, redox-sensitive internal loading, and flow-controlled oxygen dynamics, EGU General Assembly 2026, Vienna, Austria, 3–8 May 2026, EGU26-6208, https://doi.org/10.5194/egusphere-egu26-6208, 2026.

EGU26-6786 | ECS | Posters on site | BG4.1

Temperature effects on optimality-based phytoplankton growth model 

David Moncayo, Markus Schartau, Alexey Ryabov, Stefanie Moorthi, and Markus Pahlow

Phytoplankton are a key driver of global marine biogeochemical cycles, but the response to ocean warming remains difficult to predict, partly because the temperature-dependence of physiological processes is not well understood. This study extends an optimality-based phytoplankton growth model to include metabolic responses to temperature. Using microcosm data, we identify two key parameters showing roughly consistent temperature responses: maximum uptake rate (V0) and chlorophyll synthesis cost (ζC). We assess the accuracy of temperature-dependent species-specific (SS) and non-species-specific (nSS) model configurations in reproducing microcosm experimental data, relative to a non-temperature-dependent, species-specific control model (noTemp). Our results demonstrate that explicitly accounting for temperature-dependence can significantly improve predictions of phytoplankton biomass production, nitrogen uptake, and stoichiometry. The SS configuration consistently outperforms other setups in predicting particulate organic carbon, chlorophyll-a, and nutrients (DIN, DIP), while the nSS configuration still performs substantially better than the (species-specific) noTemp configuration. These findings underscore the importance of accounting for temperature-dependence in ecological models for future projections of phytoplankton responses to environmental change.

How to cite: Moncayo, D., Schartau, M., Ryabov, A., Moorthi, S., and Pahlow, M.: Temperature effects on optimality-based phytoplankton growth model, EGU General Assembly 2026, Vienna, Austria, 3–8 May 2026, EGU26-6786, https://doi.org/10.5194/egusphere-egu26-6786, 2026.

Predicting the outcomes of redox processes in aquatic environments requires quantitative constraints on electron transfer reactions. Advances in electrochemical techniques have significantly improved our ability to quantify and constrain mineral-related biogeochemical redox processes that regulate carbon, nutrient, and contaminant cycling in aquatic environments. Manganese oxides are key redox-active minerals in these systems that influence organic matter transformation, nutrient availability, and contaminant fate. In particular, Mn(III)-oxides occupy a critical role due to their ability to act as both electron acceptors and donors in the redox landscape. However, their redox characteristics are poorly understood due to their intermediate and metastable nature. Here, we apply mediated electrochemical analysis (MEA) as an analytical laboratory technique to study the effect of changing redox conditions and solution chemistry on the redox-activity of two representative Mn(III)-oxides—manganite and hausmannite. We initially use MEA to benchmark the reactivity of these Mn(III)-oxides in “simple” pH-controlled aqueous solutions. To interpret the results from MEA, we use a process-based model that couples interfacial electron transfer kinetics with mass-transport dynamics to simulate how the current response changes as a function of electrochemical driving force. Using this approach, we extract redox parameters that dictate the reactivity of these Mn(III)-oxides as a function of shifting redox conditions. After benchmarking the redox behaviour in controlled conditions, we investigate the effect of solution chemistry by performing MEA experiments in aqueous matrices containing carbonate, organic matter, and environmentally relevant ligands to characterize their effects on mineral reactivity. By providing quantitative constraints on Mn redox reactivity, this work illustrates how advanced electrochemical techniques can potentially  improve predictive understanding of coupled biogeochemical processes and inform models of water quality and ecosystem response under changing environmental conditions.

How to cite: Pothanamkandathil, V. and Aeppli, M.: Quantification of Mn(III)-Oxide Redox Activity: Integrating Mediated Electrochemistry with Kinetic and Mass-Transport Modelling., EGU General Assembly 2026, Vienna, Austria, 3–8 May 2026, EGU26-7407, https://doi.org/10.5194/egusphere-egu26-7407, 2026.

EGU26-7488 | ECS | Orals | BG4.1

Source-driven variability in dissolved organic carbon across a proglacial floodplain as a space- for time analogues of future carbon dynamics  

Oriana Lucia Llanos-Paez, Nicola Deluigi, Giulia Grandi, Lukas Hallberg, Jingyi Hou, and Matteo Tolosano

Proglacial floodplains are highly heterogeneous braided river systems in which glacier melt, groundwater, and snowmelt-fed tributaries interact over meter-to-tens-of-meters scales. This pronounced physicochemical heterogeneity among water sources generates contrasting hydrological regimes, benthic microbial communities, and water chemistry, resulting in strong spatial variability in biogeochemical processes. Confluences within these networks connect channels with distinct source signatures and microbial assemblages and may function as biogeochemical hotspots that disproportionately influence organic matter processing at the network scale. As rapid glacier retreat alters the relative contributions of meltwater, groundwater, and subglacial flows, proglacial floodplains offer valuable space-for-time analogues to investigate future shifts in carbon dynamics in alpine catchments.

Here, we investigated dissolved organic carbon (DOC) dynamics in a proglacial floodplain dominated by three contrasting water sources: a clean-ice glacier, a talus/rock glacier, and a groundwater spring. We hypothesized a transition from conservative transport or DOC consumption in glacier-fed streams to DOC production in streams influenced by talus/rock glacier and groundwater inputs, driven by differences in physicochemical conditions (e.g., turbidity, nutrients, temperature) and associated biological activity. Additionally, we aimed to quantify the net carbon balance of the floodplain at the system scale.

We sampled the three main water sources and 14 nodes across the braided network, with particular emphasis on major confluences. End-member mixing analysis (both EMMA/EEMMA) was applied to quantify source contributions, and differences between observed and expected DOC concentrations were evaluated. We used the percent differences between measured and predicted values to determine whether a stream segment functions as a DOC sink or source. Daily DOC loads were calculated at the floodplain outlet to assess net system functioning.

Our results revealed pronounced spatial variability in carbon dynamics associated with dominant water sources. Clean-ice glacier-dominated nodes were characterized by high discharge, elevated turbidity, and turbulent flow, and generally acted as DOC sinks. In contrast, nodes influenced by talus/rock glacier and groundwater inputs exhibited hydrological stability and functioned as DOC sources. Temporally, sink-source behavior shifted between early and late melt season conditions. Despite pronounced spatial and temporal variability, seasonal net DOC load at the outlet was close to zero, indicating that carbon behaved conservatively at the floodplain scale and reflecting the offsetting contributions of coexisting sink and source streams within the floodplain. Taken together, our results suggest that continued glacier retreat will promote a transition toward more hydrologically stable channels with enhanced carbon production. Such a shift is expected to reduce the prevalence of DOC sink behavior and increase the role of proglacial river networks as net carbon sources, with important implications for downstream carbon exports in future alpine catchments.

How to cite: Llanos-Paez, O. L., Deluigi, N., Grandi, G., Hallberg, L., Hou, J., and Tolosano, M.: Source-driven variability in dissolved organic carbon across a proglacial floodplain as a space- for time analogues of future carbon dynamics , EGU General Assembly 2026, Vienna, Austria, 3–8 May 2026, EGU26-7488, https://doi.org/10.5194/egusphere-egu26-7488, 2026.

EGU26-7567 | ECS | Orals | BG4.1

Evolution of DOM molecular fingerprints from a river to ocean continuum: a comprehensive view of water columns, surface sediments, and chemically dark matter 

Zekun Zhang, Peng Yao, Bin Zhao, Yuanbi Yi, Zhao Chen, Ruanhong Cai, Wenzhao Liang, and Ding He

Dissolved organic matter in estuarine sediments (SDOM) mediates carbon transformation and exchange across the sediment–water interface, yet its controls and fate remain poorly constrained. Here, we characterized SDOM along the Changjiang Estuary–East China Sea continuum using ultrahigh-resolution mass spectrometry, integrating prior stable and radiocarbon constraints to track SDOM provenance and age and to evaluate sediment–water exchange with co-located bottom-water DOM. SDOM was more biologically labile than bottom-water DOM, enriched in aliphatic, low-molecular-weight, nitrogen-containing compounds. We further examined chemically unassigned mass peaks (“dark matter”), which accounted for a substantial fraction of molecular richness but contributed a smaller share of bulk signal intensity. A sizable subset of these peaks was shared between sediments and the water column, indicating transferable sedimentary molecular fingerprints across the sediment–water interface. Spatial patterns identify the inner-shelf mobile mud zone as a hotspot where hydrodynamic disturbance and resuspension promote particle-mediated adsorption–desorption and rapid exchange, coupling the redistribution of fresh marine DOM with nearshore attenuation of terrestrial-derived signals. These results position SDOM as a reactive carbon pool in river-dominated margins and show that incorporating chemically dark matter yields a more complete molecular view of sediment–water DOM exchange.

How to cite: Zhang, Z., Yao, P., Zhao, B., Yi, Y., Chen, Z., Cai, R., Liang, W., and He, D.: Evolution of DOM molecular fingerprints from a river to ocean continuum: a comprehensive view of water columns, surface sediments, and chemically dark matter, EGU General Assembly 2026, Vienna, Austria, 3–8 May 2026, EGU26-7567, https://doi.org/10.5194/egusphere-egu26-7567, 2026.

EGU26-7984 | Posters on site | BG4.1

An advanced data evaluation strategy for assessing temporal changes in dissolved organic matter quality during flood events based on ultrahigh-resolution mass spectrometry 

Peter Herzsprung, Norbert Kamjunke, Oliver J. Lechtenfeld, Michael Rode, Kurt Friese, Clarissa Glaser, Stephanie Spahr, and Wolf von Tümpling

Water chemistry can change dramatically during a flood event. While variations in the concentration of inorganic ions, nutrients and bulk DOC as function of discharge have been  intensively investigated, changes in dissolved organic matter (DOM) quality were considered less detailed with respect to high resolution techniques. DOM is a highly complex mixture consisting of thousands of different elemental compositions. Fourier transform ion cyclotron resonance mass spectrometry (FTICR-MS) is the analytical tool with the up to date highest DOM quality resolution. Here we present a novel data evaluation strategy for time series applied to a flood event in a small river catchment. As sampling area the Ammer River near Tübingen, southern Germany was selected. During a flood event with 900% MQ in 2021, six water samples were collected within five hours period at the Pfäffingen monitoring station while discharge changed by a factor of five. Water samples were filtered (Whatman GF/F), acidified and passed through PPL cartridges. Methanolic eluates were analyzed by FTICR-MS in negative ionization mode (ESI-). Molecular formulas (MFs) were calculated for the mass range between 150–1000 Da using in-house software, considering the elements: carbon 12C1–80, hydrogen 1H1–198, oxygen 16O0–40, nitrogen14N0–2, and sulphur 32S0–1. A total of 3500 formulas were shared among all six samples. Inter sample ranks were calculated for each molecular formula based on relative signal intensity, with rank 1 representing the highest and rank 6 the lowest abundance.  (1,2). From the inter sample ranks the rank sequences were derived (for example 3-6-1-5-4-2) and used as input tor hierarchical cluster analysis (HCH). Five superordinate clusters were selected for further evaluation. Rank distribution of formulas within each cluster were visualized via bar graph and molecular formulas were plotted in van Krevelen diagrams (H/C versus O/C). This visualization revealed flood-specific compositional dynamics in DOM. Sulfur-containing compounds (CHOS) exhibited their highest relative abundance at peak discharge (fourth sample), whereas aliphatic CHO compounds (H/C > 1.5) were most abundant at low discharge (first and last samples). In contrast, aliphatic CHO (H/C > 1.5) showed highest abundance at lowest discharge (first sample and last sample). Nitrogen-containing components (CHNO) showed different ranking distribution and revealed highest abundance in the second and third sample (before discharge peak).

In conclusion, DOM exhibits highly divers and dynamic behavior during flood events due to its complex composition and information received from bulk DOC concentrations alone seems to be insufficient to capture these compositional changes.

1) Herzsprung P. et al., Environ. Sci. Technol. (2012), 46, 5511-5518

2) Dadi. et al., Environ. Sci. Technol. (2017), 51, 13705-13713

How to cite: Herzsprung, P., Kamjunke, N., Lechtenfeld, O. J., Rode, M., Friese, K., Glaser, C., Spahr, S., and von Tümpling, W.: An advanced data evaluation strategy for assessing temporal changes in dissolved organic matter quality during flood events based on ultrahigh-resolution mass spectrometry, EGU General Assembly 2026, Vienna, Austria, 3–8 May 2026, EGU26-7984, https://doi.org/10.5194/egusphere-egu26-7984, 2026.

EGU26-8649 | ECS | Orals | BG4.1

Depth-dependent patterns of microbial carbon and nitrogen metabolism functions in deep East African Rift Valley Lakes 

Xiaolong Yao, Zhonghua Zhao, Ismael Aaron Kimirei, and Lu Zhang

East African Great Lakes are globally important waters that regulating carbon and nitrogen sources and sinks. Yet, microbial carbon and nitrogen cycling functions as well as their underlying environmental drivers in tropical deep lakes remain largely unexplored. Here, were collected vertical samples from typical large deep lakes in East African Rift Valley to assess environmental gradients and microbial metabolism functions of primary biogenic elements. We examined vertical distributions of nutrients, dissolved organic matter (DOM) properties, and quantified microbial carbon, nitrogen, and phosphorus cycling genes using high-throughput Quantitative Microbial Ecology Chip (QMEC) technique. Preliminary analyses indicate clear depth-dependent patterns in nutrient availability and microbial functional genes. Dissolved organic matter properties are likely important drivers of the depth patterns of these functional genes. The observed relationships between microbial functional genes and environmental variables provide insights into the vertical organization of microbial biogeochemical functions in deep tropical lakes.

How to cite: Yao, X., Zhao, Z., Kimirei, I. A., and Zhang, L.: Depth-dependent patterns of microbial carbon and nitrogen metabolism functions in deep East African Rift Valley Lakes, EGU General Assembly 2026, Vienna, Austria, 3–8 May 2026, EGU26-8649, https://doi.org/10.5194/egusphere-egu26-8649, 2026.

EGU26-8911 | ECS | Orals | BG4.1

Climate pattern–land use pathways shape dissolved organic matter dynamics in the Pearl River Basin 

Yu Pang, Zhe-Xuan Zhang, Hongkai Qi, Cheng Xing, Haoran Wang, Yi Liu, Ming Ye, Zekun Zhang, Jianping Gan, and Ding He

Static models relying solely on land use are increasingly insufficient for predicting riverine dissolved organic matter (DOM) dynamics. Here, we address this limitation by proposing the Climate Pattern–Land Use Pathways (CPLUP) framework to disentangle the synergistic interactions between climatic drivers and land use. We developed this framework using a synoptic dataset from the Pearl River Basin (PRB, n=228) and validated it globally via a machine learning ensemble. In the Pearl River Basin, we observed that terrestrial signatures dominated the entire river network, whereas autochthonous signals significantly increased in the downstream reaches. Attribution analysis revealed that this spatial divergence was driven by climatic forces that activate static land-use sources. Specifically, high discharge provided the kinetic energy to mobilize terrestrial organic matter from land into rivers, representing a process limited by transport capacity. Conversely, solar radiation and temperature provided thermodynamic energy to catalyze biochemical transformations within the water column, representing a process limited by reaction kinetics. Building on these mechanistic insights, we established the CPLUP framework to explicitly map how distinct climatic drivers regulate specific land-use signals. By decoding these complex dynamics, our study provides a robust predictive tool (CPLUP) for forecasting riverine DOM under intensifying climate change and urbanization.

How to cite: Pang, Y., Zhang, Z.-X., Qi, H., Xing, C., Wang, H., Liu, Y., Ye, M., Zhang, Z., Gan, J., and He, D.: Climate pattern–land use pathways shape dissolved organic matter dynamics in the Pearl River Basin, EGU General Assembly 2026, Vienna, Austria, 3–8 May 2026, EGU26-8911, https://doi.org/10.5194/egusphere-egu26-8911, 2026.

    Amaranth (AM) is a typical anionic azo dye, which has been applied in cosmetics, wood, paper, synthetic fiber, food additives, leather, and artificial dyeing, poses significant risks to both human health and the environment. Therefore, its removal from water is essential to safeguard public health and ensure a sustainable ecosystem. In this work, a novel magnetic Fe3O4@LPP was successfully synthesized via a co-precipitation method and applied for the removal of AM dye from an aqueous environment. Several characterization techniques, including point of zero charge (pHPZC), N2 adsorption/desorption, Energy dispersive X-ray spectroscopy (EDS), Field emission scanning electron microscopy (FE-SEM), Vibrating sample magnetometer (VSM), Fourier transform infrared spectroscopy (FTIR), Transmission electron microscopy (TEM) and X-ray diffractometer (XRD), were analyzed to reveal the functional and structural properties of the as-synthesized Fe3O4@LPP composite. AM dye adsorption performances were tested as a function of the operational conditions, such as stirring speed (50-300 rpm), temperature (25-55 oC), initial pH solution (2-10), Fe3O4@LPP dosage (0.01 to 0.08 g/30 mL), contact duration (0-180 minutes), and initial AM dye concentration (50-500 mg/L) in a batch mode of operation. Kinetic analysis revealed that the sorption process followed the pseudo-1st-order kinetic model across all initial concentrations, showing strong correlation between the experimental data and the model predications. Furthermore, the equilibrium sorption data were best fitted by the Langmuir isotherm model, suggesting monolayer sorption on a homogeneous surface, with a maximal adsorption uptake of 445.5±19.6 mg g-1. The thermodynamic analysis of AM dye adsorption indicated that the process was endothermic, feasible, and spontaneous. Various eluting agents were evaluated in the desorption studies, and 0.1 M NaOH exhibited the greater desorption efficiency of 89.4%. Overall, the outcomes of this study confirm that Fe3O4@LPP composite is a promising and effective adsorbent for the remove of dyestuff from wastewater.    

Keywords: Removal, Amaranth, Iron oxide, Lychee peel, Desorption.

How to cite: Hsu, J.-Y., Munagapati, V. S., and Wen, J.-C.: Adsorptive removal of an anionic Amaranth dye from aqueous solution using magnetic iron oxide-loaded lychee peel powder (Fe3O4@LPP): Isotherm, kinetic, thermodynamic and desorption studies, EGU General Assembly 2026, Vienna, Austria, 3–8 May 2026, EGU26-9232, https://doi.org/10.5194/egusphere-egu26-9232, 2026.

EGU26-11589 | ECS | Orals | BG4.1

Two-dimensional imaging of porewater chemistry to investigate the heterogeneity of diagenetic processes in Amazonian mangrove sediments 

Matheus Cavalcante-Silva, João Barreira, Cleuza Leatriz Trevisan, Christiene Matos, Christiane do Nascimento Monte, José Berredo, Wilson Machado, Gwenaël Abril, Aurelia Mouret, and Edouard Metzger

Quantifying biogeochemical processes in coastal sediments requires analytical approaches capable of resolving microscale variability in redox-sensitive solutes. Conventional porewater sampling techniques provide limited spatial resolution and often disturb in situ equilibria, obscuring fine-scale heterogeneity associated with bioturbation, root activity, and microbial processes. These limitations are particularly critical in mangrove sediments, where organic matter remineralization and redox dynamics are highly heterogeneous. In addition, small-scale geomorphological contrasts between erosional and depositional settings can influence sediment structure, permeability, and diagenetic pathways. Here, we applied two-dimensional Diffusive Equilibration in Thin Films (2D-DET) coupled with colorimetric detection to map porewater solutes associated with early diagenesis in mangrove sediments from two sites (MAR1 and MAR2) in the Marapanim River Estuary (Pará State, Brazil). The sites, sampled in winter 2025, represent erosional and depositional zones on opposite sides of a tidal channel. Two-dimensional distributions of dissolved Fe and Mn (Fed and Mnd), PO₄³⁻, H₂S, NO₂⁻, NO₃⁻, and NH₄⁺ were quantified. Hyperspectral imaging enabled the discrimination of Fed and PO₄³⁻ distributions within a single gel. In general, Fed was broadly distributed throughout the imaged porewaters (to ~17 cm depth) at both sites, with patchy concentrations reaching up to ~500 µmol L-1. Dissolved H₂S, measured at MAR1, was largely absent across most of the profile, allowing Fed to remain mobile. In contrast, PO₄³⁻ was preferentially enriched at greater depths, indicating partial Fe-P decoupling likely related to efficient phosphate retention in shallow sediments and accumulation under more reducing conditions at depth. Mnd distributions were comparatively more homogeneous than Fed, consistent with slower redox kinetics. Near-zero NO₂⁻ and NO₃⁻ concentrations combined with elevated NH₄⁺ indicate dominant ammonification and nitrification that is inhibited or masked by nitrate consumption processes. Clear contrasts emerged between geomorphological settings. At the erosional site (MAR1), Fed and Mnd concentrations were higher, more laterally variable, and NH₄⁺ maxima occurred deeper in the sediment, consistent with enhanced porewater flushing and advective transport. In contrast, the depositional site (MAR2) exhibited more persistent Fe-P decoupling and shallower NH₄⁺ accumulation. Such differences could be attributed to differences in grain size, permeability and mudflat slope and therefore porewater residence time. Two-dimensional imaging further revealed pronounced lateral heterogeneity associated with biogenic structures. At MAR1, a microzone showed elevated sulfide and Fed depletion, consistent with localized pyritization and associated phosphate release. In another Fed/PO₄³⁻ gel from MAR1, microzones linked to sediment coloration and young Rhizophora plants reflected alternating Fed release and removal under contrasting redox conditions. At MAR2, a near-surface zone exhibited Mnd enrichment coupled with Fed depletion beneath a Rhizophora seedling, consistent with a root-influenced redox microenvironment. Overall, results demonstrate the capacity of 2D-DET to resolve geomorphology and biota-driven microscale diagenetic organization in macrotidal Amazonian mangrove sediments that is not accessible using conventional porewater techniques.

How to cite: Cavalcante-Silva, M., Barreira, J., Trevisan, C. L., Matos, C., do Nascimento Monte, C., Berredo, J., Machado, W., Abril, G., Mouret, A., and Metzger, E.: Two-dimensional imaging of porewater chemistry to investigate the heterogeneity of diagenetic processes in Amazonian mangrove sediments, EGU General Assembly 2026, Vienna, Austria, 3–8 May 2026, EGU26-11589, https://doi.org/10.5194/egusphere-egu26-11589, 2026.

EGU26-12402 | ECS | Orals | BG4.1

Observation-based reconstruction of riverine organic carbon fluxes reveals hydroclimatic controls on lateral carbon export 

Shengyue Chen, Shijie Jiang, Georgios Blougouras, Haicheng Zhang, Chunlin Song, Sung-Ching Lee, Elisa Calamita, Taiqi Lian, Jinliang Huang, and Markus Reichstein

Lateral export of organic carbon by rivers links terrestrial and aquatic carbon cycling, yet its magnitude, drivers, and variability remain poorly quantified at large spatial and temporal scales. Here we develop a physics-constrained multi-task machine learning model and use long-term in situ riverine total and dissolved organic carbon (TOC/DOC) observations to reconstruct daily TOC concentrations and fluxes at 0.25° resolution across the contiguous United States (CONUS) for the past four decades (1984–2023). The multi-task learning approach leverages DOC-rich records to inform TOC dynamics through their observed covariation, improving TOC estimates in regions with sparse measurements, particularly in the arid western United States. The reconstructed data reveal a widespread decoupling between TOC concentrations and fluxes, with concentration trends increasing over 47% of the domain while fluxes decline over 73%, indicating a dominant role of hydroclimatic control on transport efficiency rather than changes in carbon source availability alone. Analysis across dry and wet years shows that wetter hydroclimatic conditions, particularly following drought periods, are associated with pronounced TOC export, during which lateral carbon export can exceed 10% of concurrent terrestrial carbon uptake. These results demonstrate how hydroclimatic variability modulates organic carbon transport in river networks, with implications for estimating land carbon storage and land-water coupling under ongoing hydroclimatic change. We emphasize the importance of integrating large-sample, in situ riverine observations in improving understanding of coupled hydrological and biogeochemical processes from site to continental scales.

How to cite: Chen, S., Jiang, S., Blougouras, G., Zhang, H., Song, C., Lee, S.-C., Calamita, E., Lian, T., Huang, J., and Reichstein, M.: Observation-based reconstruction of riverine organic carbon fluxes reveals hydroclimatic controls on lateral carbon export, EGU General Assembly 2026, Vienna, Austria, 3–8 May 2026, EGU26-12402, https://doi.org/10.5194/egusphere-egu26-12402, 2026.

EGU26-13871 | ECS | Orals | BG4.1

Microbial taxonomic and functional diversity across the Drake Passage and the west Antarctic Peninsula 

Gabriella Gallo, Jacopo Brusca, Lorenza Maria Campoli, Luciano Di Iorio, Francesco Bolinesi, James A. Bradley, Olga Mangoni, Angelina Cordone, and Donato Giovannelli

Antarctica and the Southern Ocean are central to the Earth’s climate and oceanic circulation systems. Microbial communities inhabiting the Southern Ocean drive biogeochemical cycles, underpin trophodynamics, and  affect atmospheric chemistry. The ongoing climate crisis is affecting these processes, with possible cascading effects on the structure and functioning of phytoplankton communities in the surface waters of the Southern Ocean. The CLAW hypothesis, which describes a feedback mechanism between phytoplankton, the dimethylsulphide (DMS) production, the cloud condensation nuclei (CCN) formation, and albedo, represents a prominent link between the changing marine microbial dynamics and climate. Additionally, marine DMS production appears to be influenced by the availability of microbially-derived vitamin B12, involved in the methionine biosynthesis, and is already regarded as a limiting factor for the phytoplankton growth, thus playing a role in shaping microbial community structure. Understanding the role of the ocean microbiome in these processes is therefore essential to evaluate how marine microbial communities impact climate regulation, and vice versa.

Previous studies on the surface waters of the west Antarctic Peninsula and in the Southern Ocean have described taxonomic profiles of marine microorganisms and identified metabolic functions related to degradation of phytoplankton-derived organic matter. However, the role of the functional diversity in the interplay between climate change, microbial communities, and DMS-cycling pathway remains poorly understood. Here, we present an integrated analysis of the microbial functional diversity of surface waters along the Drake Passage and the west Antarctic Peninsula, sampled during the 2023/24 Austral Summer. Shotgun metagenomic sequencing and 16S rRNA amplicon analysis were performed, and enabled the description of spatial distribution of genes involved in DMS and cobalamin biosynthesis pathways along the transect. We coupled this data with chlorophyll chemotaxonomy and geochemical analyses. This integrated approach holds the potential to advance our understanding of microbial responses to the impacts of climate change, and the identification of specific microbial pathways that could enhance climate change in the Southern Ocean, ultimately helping to fill gaps in climate change modeling.

How to cite: Gallo, G., Brusca, J., Campoli, L. M., Di Iorio, L., Bolinesi, F., Bradley, J. A., Mangoni, O., Cordone, A., and Giovannelli, D.: Microbial taxonomic and functional diversity across the Drake Passage and the west Antarctic Peninsula, EGU General Assembly 2026, Vienna, Austria, 3–8 May 2026, EGU26-13871, https://doi.org/10.5194/egusphere-egu26-13871, 2026.

Stream microbial communities play a vital role in ecosystem functioning, contributing to nutrient cycling, organic matter decomposition, and overall ecological health. Despite this, biogeochemical cycling is typically investigated independently to microbial communities, reducing our understanding of the drivers of microbially-mediated biogeochemical reactions, including those which produce and/or consume greenhouse gases. Given the connectivity of stream ecosystems, microbial communities and chemical substrates (e.g. DOM, nutrients) are also susceptible to influences from land-use changes that occur in the wider watershed. While many studies have examined stream microbial community structure and function along a land-use gradient, few have considered their connectivity with nearby riparian zones, nor conducted microbial diversity surveys in conjunction with biogeochemical measurements. Additionally, recent advancements in high-resolution organic matter characterisation have enabled investigation of the importance of organic matter quality and key metabolites in driving ecosystem function. Here, we examined microbial communities, DOM chemodiversity, and nutrient and DOC concentrations in the water column, streambed sediments, and adjacent riparian zone sediments in 16 headwater streams across a land-use gradient (categorised by percent agriculture, residential, industrial, and human development). We performed incubations with paired streambed and riparian sediments to quantify potential greenhouse gas production (carbon dioxide, methane, and nitrous oxide) and assess the relationship between microbial community structure, potential functional capacity, and greenhouse gas fluxes. We subsequently used high-resolution organic matter characterisation techniques (FTICR-MS and LC-MS) to investigate organic matter quality and key metabolites and how these changed with land-use to also affect microbial communities and greenhouse gas emissions. This work underscores the importance of combining microbial and biogeochemical measurements and how organic matter quality drives ecosystem function, especially in highly connected and complex systems that experience human-driven impacts across scales.

How to cite: Comer-Warner, S., Wolheim, W., and Bulseco, A.: Unravelling drivers of stream microbial-biogeochemical cycling along a land-use gradient: Effects of organic matter quality and chemodiversity on greenhouse gas fluxes, EGU General Assembly 2026, Vienna, Austria, 3–8 May 2026, EGU26-14219, https://doi.org/10.5194/egusphere-egu26-14219, 2026.

EGU26-14283 | ECS | Posters on site | BG4.1

The origin of sediment organic carbon influences hydrophobic organic pollutant dynamics in Arctic shelf sediments 

Xiaodi Shi, Laurent Oziel, Jonathan P. Benskin, Örjan Gustafsson, and Anna Sobek

The fate of hydrophobic organic pollutants in the marine environment is largely controlled by organic carbon (OC) cycling processes. The Arctic is warming three times as fast as the global average, resulting in a profound alteration in OC fluxes to the Arctic Ocean. Consequently, remote Arctic shelf sediments serve as an ideal receptor for assessments of the impact of OC quantity and quality on pollutant fate.

Here, we compiled a database of congener-specific polychlorinated biphenyl (PCB) concentrations (510 entries, 84 sites) in surface sediment of four Eurasian Arctic shelves via integration of new measurements and literature data. Total organic carbon content and isotopic data were retrevied from CASCADE (The Circum-Arctic Sediment CArbon DatabasE) to examine the PCB storage in sediment as a function of OC source (marine versus terrestrial). In order to reduce the impact of variability in water-phase concentrations caused by region, latitude and depositional year, we controlled for these factors. The adjusted concentrations (in ng-PCB/g-OC) in sediment with high fractions of marine OC are 0.82-1.22 log units higher in Barents and Kara Seas and 0.092-1.49 log units higher in Laptev and East Siberian Seas, compared to those with high fractions of terrestrial OC. Albeit uncertainties in current estimations due to wide geographical coverage and correction assumptions, these values are comparable to previously reported differences of partition coefficients between marine and terrestrial OC in other regions (e.g., 0.2-1 log units higher in marine OC sites in Baltic Sea, compared to terrestral OC sites).

Based on these results, PCB accumulation in Arctic shelf sediment was predicted for future climate change scenarios using an observational dataset of terrestrial inputs and marine OC fluxes derived from the global state-of-the-art ocean- and sea ice biogeochemistry model FESOM2.1-REcoM3. The accumulated amount of PCBs in  marine OC in Arctic shelf sediments from 2000-2100 is estimated to be about 26 tonnes, which is more than 8 times higher than the accumulated amount in terrestral OC from both coastal erosion and riverine inputs. These results demonstrate that shifts in OC fluxes as a consequence of climate change can impact storage capacity of hydrophobic organic pollutants in aquatic systems.

How to cite: Shi, X., Oziel, L., Benskin, J. P., Gustafsson, Ö., and Sobek, A.: The origin of sediment organic carbon influences hydrophobic organic pollutant dynamics in Arctic shelf sediments, EGU General Assembly 2026, Vienna, Austria, 3–8 May 2026, EGU26-14283, https://doi.org/10.5194/egusphere-egu26-14283, 2026.

Biofilms (structured microbial communities), ubiquitous in a variety of aquatic and terrestrial ecosystems, strongly regulate arsenic (As) cycle. Dissolved organic matter (DOM), prevalent in natural environments, can stimulate the development and activity of microbial communities, thus enhancing microbially mediated arsenic biogeochemical processes. However how DOM regulate groundwater biofilms to drive the fate of As migration and transformation remains unclear. In this study, laboratory incubation experiments were integrated with extensive biofilm characterizations, 16S rRNA, qPCR, Scanning electron microscopy (SEM) and Fourier transform infrared spectroscopy (FTIR) to explore the behaviors and potential mechanisms of As under the mediation of biofilm and fluvic acid (FA), a representative of DOM in groundwater. The results showed that the regulation of FA induced more As incorporation and subsequent reduction of As(V) after the As(III) oxidation potentially mediated by aoxA/B. The interaction of protein and polysaccharide on the biofilms with As was the dominant adsorption mechanism. FA modification resulted in the secretion of more abundant EPS and provided more binding sites for the organic functional groups, which intensified the adsorption of protein and polysaccharide for As. In parallel, the addition of FA led to the secretion of larger amounts of α-configuration polysaccharide that produced greater steric hindrance promoting the As adsorption. The formation of FA-Ca-As ternary complexes still remained an important way for arsenic sequestration after biofilm-FA modification. The ultimately higher diversity and abundance of N and S cycling associated bacteria (e.g., Desulfitobacterium, Acinetobacter, Sphingobacterium), yielded by the addition of FA, likely contributed to the reduction of As(V) by enhancing arrA. Additionally, the electron shuttle effect of FA accelerated the electron transfer between As(V) and As (III), serving as another mechanism for As transformation. To the best of our knowledge, this study for the first time reveals the importance of DOM on the migration and transformation of As by biofilms. This study enriches the theoretical understanding of biosorption and biotransformation of As and provides new insight into environmental arsenic cycles.

How to cite: Li, H., Li, C., and Cavalca, L.: Biofilm Mediated Arsenic Migration and Transformation in Groundwater under the Influence of Dissolved Organic Matter, EGU General Assembly 2026, Vienna, Austria, 3–8 May 2026, EGU26-14816, https://doi.org/10.5194/egusphere-egu26-14816, 2026.

EGU26-14997 | ECS | Orals | BG4.1

Development of an Innovative Multiparameter Fluorometer to Sense the Impact of Organic Pollution on River Health  

Rosie Perrett, Matthew Coombs, Constance Tulloch, Robin Thorn, John Attridge, and Darren Reynolds

River systems in the UK are in poor condition, with sewage discharges and agricultural runoff identified as major contributors to declining river health. Effective assessment and management of river health requires real-time monitoring solutions; however, existing in-situ sensors are largely limited to physiochemical parameters and provide little information on organic pollution input or microbial contamination. This research demonstrates the implementation and deployment of novel multiparameter fluorescence-based sensors capable of measuring bacterial/algal contamination and organic pollution whilst simultaneously correcting for environmental optical interferences in real time. These portable multiparameter fluorometers were deployed as part of a sensing network along the River Dart catchment (UK) in October 2025.  We present a dataset collected continuously in real-time over a 3-month period. As part of a managed water quality monitoring programme, continuous data on microbial contamination and organic pollution in the River Dart catchment collected using deployed novel multiparameter fluorescence-based sensors were compared alongside regular field spot sampling and standard laboratory water quality analysis. For the latter, biological oxygen demand, microbial counts and nutrient analysis were performed to contextualise and verify (ground truth) sensing data. Sensing system performance for the detection of organic pollution events and their subsequent impacts on river ecology was evaluated. 

Our results demonstrate a strong correlation between tryptophan-like-fluorescence and biological oxygen demand, highlighting the ability of the sensor to monitor oxygen demand in real time. Using machine learning and artificial intelligence, we aim to produce a tool capable of detecting pollution events from sensor data and evaluating subsequent impacts on oxygen demand and phytoplankton growth. Our ultimate aim is to deliver a novel validated multiparameter fluorescence-based sensor, integrated within a real-time monitoring network, alongside a tool for interpreting water quality data regarding river health and pollution pressures. We anticipate these outputs combined will enhance potential for early detection of pollution events, facilitate agile decision making and river management and enhance understanding of biogeochemical processing in rivers.  

How to cite: Perrett, R., Coombs, M., Tulloch, C., Thorn, R., Attridge, J., and Reynolds, D.: Development of an Innovative Multiparameter Fluorometer to Sense the Impact of Organic Pollution on River Health , EGU General Assembly 2026, Vienna, Austria, 3–8 May 2026, EGU26-14997, https://doi.org/10.5194/egusphere-egu26-14997, 2026.

EGU26-15334 | Posters on site | BG4.1

Land use change effects on carbon yield in lowland streams of the Congo Basin 

Merveille Bondongwe Wombe, Travis Drake William, Dries Landuyt, Matti Barthel, Corneille Ewango, Pascal Boeckx, and Marijn Bauters

The expansion of land-use activities severely threatens primary forests in the Congo Basin. As the dominant mode of deforestation in this region, it is expected to affect soil nutrient stocks and availability and, consequently, forest productivity. To assess how shifting cultivation affects carbon species transformation and export to rivers, four catchments, of which two draining forested landscapes and two draining agricultural landscapes were selected in the Yangambi region, Democratic Republic of the Congo. The catchments were equipped with sensors to continuously quantify discharge, water temperature, oxygen concentrations and sediment loads, amongst other parameters, while periodic water sampling was conducted to quantify chemical water composition. Based on these samples, concentrations and yields of the full spectrum of carbon species (DOC, DIC, CO₂, CH₄) were calculated. We found that baseflow dissolved organic carbon (DOC) concentrations were nearly identical in both groups of streams. However, significantly higher carbon dioxide(CO₂) and methane(CH₄) concentrations were observed in streams draining agricultural landscapes compared to forested streams. This apparent paradox can be explained by much higher carbon turnover rates in agricultural streams, driven by enhanced microbial metabolism resulting from environmental changes such as increased light and temperature, greater erosion, and higher nutrient availability (N and P). Thus, agricultural streams rapidly mineralize organic carbon to CO₂ and CH₄, preventing its persistence in the dissolved organic pool.

How to cite: Bondongwe Wombe, M., Drake William, T., Landuyt, D., Barthel, M., Ewango, C., Boeckx, P., and Bauters, M.: Land use change effects on carbon yield in lowland streams of the Congo Basin, EGU General Assembly 2026, Vienna, Austria, 3–8 May 2026, EGU26-15334, https://doi.org/10.5194/egusphere-egu26-15334, 2026.

EGU26-16798 | ECS | Orals | BG4.1

Demand of carbon prevails over nutrients in proglacial streams subjected to glacier retreat: a nutrient manipulation bioassay 

Lukas Hallberg, Nicola Deluigi, Giulia Grandi, Jingyi Hou, Oriana Llanos-Paez, and Matteo Tolosano

Glacier-fed streams across the world’s major mountain ranges are consistently energy limited, contributing low concentrations of bio-reactive organic carbon (C) to downstream recipients. Yet, climate-driven glacial retreat is expected to alter both C and nutrient supply in glacial-fed streams with consequences for downstream elemental fluxes and ecosystem functioning. As sources shift from glacier melt to groundwater and snowmelt, reductions in stream power and turbidity promote primary production, giving rise to a “greening effect” that favours autochthonous supply of organic C. In conjunction, lower flow turbulence may also reduce phosphorus (P) inputs from erosion-driven rock weathering. Yet, the impacts of altered energy and nutrient stoichiometry on microbial energetics and C cycling remain unknown across high-mountain catchments.


In this study, we established chamber bioassays to measure metabolic rates and changes in dissolved organic carbon (DOC), nitrate, and phosphate concentrations over 24 h in, using sediments and stream water from clean ice glacier, rock glacier, and groundwater-fed headwaters, as well as from downstream recipients. Bioassays included three nutrient treatments (C+N, P+N, and C+N+P) together with an ambient stream water control, incubated at 8 °C under dark (12 h) and light (12 h) conditions. Gross primary production and ecosystem respiration metabolism rates were quantified with high resolution optical oxygen monitoring.


We found that both microbial degradation and production of DOC increased in headwaters without clean ice glacier inputs, with the highest metabolic rates and greatest reductions in DOC concentrations observed in sediments receiving rock glacier inputs. The sediments from rock glacier and groundwater-fed headwaters were also C limited, whereas the clean ice glacier showed no response to C additions. Interestingly, we found no evidence for microbial P limitation in any site, despite low ambient P concentrations.


These results demonstrate that microbial C cycling and energy demand in proglacial headwaters can be expected to increase with glacial retreat, imposed by a switch in the microbial communities from chemolithotrophic to heterotrophic and photoautotrophic dominance. Although microbial biomass growth increased and stream water stoichiometry predicted C and P co-limitation, the unexpected absence of P limitation in bioassays suggests flexibility in stoichiometric strategies, allowing for a wide range in C:P ratios of microbial biomass present in proglacial streams. To resolve the impacts of glacial retreat on stream ecosystem functioning, we thus stress the need for complementing indirectly inferred nutrient limitation with direct nutrient manipulation experiments.

How to cite: Hallberg, L., Deluigi, N., Grandi, G., Hou, J., Llanos-Paez, O., and Tolosano, M.: Demand of carbon prevails over nutrients in proglacial streams subjected to glacier retreat: a nutrient manipulation bioassay, EGU General Assembly 2026, Vienna, Austria, 3–8 May 2026, EGU26-16798, https://doi.org/10.5194/egusphere-egu26-16798, 2026.

EGU26-17944 | Posters on site | BG4.1

Lateral transport as a major control for old organic carbon ages in the SW Iberian margin  

Blanca Ausin, Celia Merchán Gómez, Prabodha Lakrani Hewage, Negar Haghipour, Clayton R. Magill, Anna Sanchez-Vidal, Timothy Eglinton, Gesine Mollenhauer, Hendrik Grotheer, Eric Achterberg, Mariem Saavedra-Pellitero, Joseph Dunlop, Minkyoung Kim, Álvaro Fernández Bremer, David Hodell, and Francisco J. Sierro

On continental margins, the vertical flux of particulate organic carbon (POC) attenuates rapidly. However, the role of lateral transport in redistributing and preserving older carbon is a major unresolved question. To quantify these carbon pathways, we integrate data from three complementary sources in the SW Iberian margin, a key mid-latitude region for (paleo)climate studies: a year-long (December 2023-November 2024) sediment trap time-series (four traps intercepting subsurface and deep layers on the mid- and lower slope), discrete-depth in-situ pump sampling (>1000 L per depth) at six stations, and surface sediment samples.

Complementary CTD and hydrographic data revealed distinct water masses: the Eastern North Atlantic Central Water (ENACW; ~50–500 m), underlain by the warm, saline Mediterranean Outflow Water (MOW; 500–1600 m), characterized by elevated turbidity, and the Northeast Atlantic Deep Water (NEADW; >1700 m).

The annual sediment trap record reveals subsurface Δ¹⁴C-POC ranges between -20 and -75‰ (i.e., 100-550 14C yr BP), while deep-water POC shows highly variable, older signatures, varying between -50 and -130‰ (i.e., 350-1070 14C yr BP). A pronounced Δ¹⁴C depletion in May at both moorings, coincident with MOW intensification onshore, signals a major lateral injection of aged carbon.

Along the water column during the oligotrophic season, discrete-depth samples show that POC concentrations peak at the fluorescence maximum (above 100 m depth) before declining sharply. Δ¹⁴C values above 100 m indicate POC that has incorporated bomb-¹⁴C. Below ~100 m, Δ¹⁴C decreases markedly, especially within local turbidity maxima across all water masses. Notably, Δ¹⁴C depletion within the MOW-intermediate nepheloid layer (INL) was not distinct from other INLs, suggesting that lateral transport operates broadly along the margin. Preliminary data indicate higher aluminum (Al) at depth at all stations, suggesting the lateral supply of resuspended sediments. Ongoing Al and δ¹³C-POC analyses will clarify the origin of this and sediment trap material.

In surface sediments, Δ¹⁴C and δ¹³C of sedimentary OC indicate the increase of more recalcitrant (older, potentially terrestrial) OC offshore. Critically, sedimentary OC (¹⁴C age: 875-4800 14C yr BP) is consistently older than coeval, bomb-¹⁴C–bearing planktic foraminifera. This decoupling demonstrates that laterally advected, mineral-protected organic matter is preferentially sequestered, while vertically exported labile carbon is degraded.

Our findings establish lateral transport as a major control on the age and redistribution of OC in this dynamic margin. We conclude that accurate carbon cycling models must explicitly account for lateral supply (particularly via nepheloid layers) as a key mechanism for delivering and preserving aged carbon in deep-sea sediments, challenging the traditional paradigm of vertical export as the principal sequestration pathway.

How to cite: Ausin, B., Merchán Gómez, C., Lakrani Hewage, P., Haghipour, N., Magill, C. R., Sanchez-Vidal, A., Eglinton, T., Mollenhauer, G., Grotheer, H., Achterberg, E., Saavedra-Pellitero, M., Dunlop, J., Kim, M., Fernández Bremer, Á., Hodell, D., and Sierro, F. J.: Lateral transport as a major control for old organic carbon ages in the SW Iberian margin , EGU General Assembly 2026, Vienna, Austria, 3–8 May 2026, EGU26-17944, https://doi.org/10.5194/egusphere-egu26-17944, 2026.

EGU26-17969 | Posters on site | BG4.1

Controls of inputs of reactive nitrogen into the German Bight in the main Estuaries: No two are alike 

Tina Sanders, Gesa Schulz, Louise Rewrie, Andreas Neumann, Vlad-Alexandru Macovei, Yoana Voynova, and Kirstin Dähnke

Estuaries act as biogeochemical filters for organic matter and nutrients transported from rivers into coastal waters, with the balance of turnover processes such as remineralization and nitrification determining whether these are retained, transformed or exported into the coastal ocean. In the German Bight, three main river systems (Ems, Weser and Elbe) provide water and matter inputs. These rivers and their estuaries are heavily impacted by human activities, including dredging, damming and intensive nutrient inputs causing eutrophication, which may substantially alter their biogeochemical filter function. We aim to assess how differing anthropogenic pressures may influence nitrogen transformation processes and, consequently, the efficiency of estuaries as biogeochemical filters.

During an early autumn 2024 cruise on the RV Heincke (HE647), we measured parameters such as salinity, turbidity, oxygen and chlorophyll-a-fluorescence in all three estuaries and sampled nutrients focusing on dissolved inorganic nitrogen (ammonium, nitrite and nitrate) and dual stable isotopes of nitrate. Additionally, nitrification and ammonium uptake rates were determined in the Elbe and Ems estuaries.

All three estuaries were characterized by high nitrate input to coastal waters. However, ammonium uptake and nitrification rates differed substantially among the systems, with the highest uptake observed during a phytoplankton bloom in the coastal outer waters of the Ems Estuary. Our results indicate that suspended matter concentration, oxygen availability and chlorophyll-a-fluorescence are the main factors driving the remineralization and retention of reactive nitrogen in estuarine and coastal waters.

How to cite: Sanders, T., Schulz, G., Rewrie, L., Neumann, A., Macovei, V.-A., Voynova, Y., and Dähnke, K.: Controls of inputs of reactive nitrogen into the German Bight in the main Estuaries: No two are alike, EGU General Assembly 2026, Vienna, Austria, 3–8 May 2026, EGU26-17969, https://doi.org/10.5194/egusphere-egu26-17969, 2026.

EGU26-18525 | Orals | BG4.1

Disentangling multiple stressors in rivers using multivariate biogeochemical spaces 

Tobias Goldhammer and Paula Torre Zaffaroni

Multiple stressors in aquatic systems interact across temporal and spatial scales, which complicates the evaluation of their individual and conjoint effects on water quality and ecosystem functioning. This is particularly complex when gradual changes (e.g. from multi-year droughts to decadal warming) add to the impact of short-termed extreme events (e.g. a heatwave or the sudden disruption of flow). At the same time, focusing on the individual dynamics of water quality/composition indicators as proxies of ecosystem functioning may lead to the underestimation of system-wide sensitivities. Here, we define the ‘biogeochemical space’ of a river system as the realized, two-dimensional configuration of water composition dynamics as captured by non-metric multidimensional scaling of spatially discrete and temporally-resolved monitoring data.

We applied this concept to explore the combined expression of hydrological, meteorological, and anthropic stress in the Lower Oder River, which flows along the German-Polish border, and where an unprecedented harmful algal bloom caused a major environmental disaster in the summer of 2022. Using 20 years of monthly physicochemical data over a 200-km river reach, and in combination with long-term temperature and discharge records, we reconstructed a progressive shift toward increasingly concentrated (ion-enriched) water composition states. This displacement was, on one side, strongly associated with multi-year anomalies in water temperature and in discharge (> 2°C and –40%) caused by drier conditions in the catchment since 2016. On another side, conservative ions showed monotonic increases that could not be explained by short- nor medium-term changes in discharge alone, which confirmed the increased pressure from industry and mining-related salt inputs that are significant in this region. Finally, we further illustrate how the biogeochemical space framework can be used to diagnose diverse responses in other river systems at regional and global scales, and characterize their sensitivities to multiple impacts.

How to cite: Goldhammer, T. and Torre Zaffaroni, P.: Disentangling multiple stressors in rivers using multivariate biogeochemical spaces, EGU General Assembly 2026, Vienna, Austria, 3–8 May 2026, EGU26-18525, https://doi.org/10.5194/egusphere-egu26-18525, 2026.

EGU26-20720 | Posters on site | BG4.1

Methanogenesis from the antidiabetic drug metformin 

Tetyana Gilevska, Stefano Bonaglia, and Amelia-Elena Rotaru

Pharmaceutical compounds are widespread in anoxic environments, yet their direct utilization by methanogens has not been demonstrated. We show that the antidiabetic drug metformin can serve as a substrate for methane production by the obligate methylotroph Methermicoccus shengliensis, representing the first reported case of methanogenesis from pharmaceuticals. Long-term incubations revealed methane production concomitant with 30% metformin consumption over 71 days, accompanied by 7% incorporation of ¹³C-labeled CO₂ into methane, which is lower than the ~30% reported for M. shengliensis during growth on methoxylated coal compounds (1). No methane production or degradation was observed for naproxen, an anti-inflammatory drug, despite its O-methoxy group being structurally similar to methoxylated coal compounds.

Proteomic analyses revealed substrate-specific differences between metformin- and methanol-grown cultures (reference substrate), including overexpression of dimethylamine-methyltransferases and changes in the expression of energy metabolism proteins. A strong stress response was observed, characterized by overexpression of proteins involved in metabolic maintenance and stress mitigation. Several upregulated proteins, along with those associated with potential substrate degradation or transport, were located within predicted horizontally transferred genomic regions.

This study expands the known substrate range of methylotrophic methanogens and identifies pharmaceuticals as a previously unrecognized contributor to anaerobic methane production, with potential implications for subsurface carbon cycling in contaminated environments.


(1) D. Mayumi et al., Methane production from coal by a single methanogen. Science 354, 222-225 (2016).

How to cite: Gilevska, T., Bonaglia, S., and Rotaru, A.-E.: Methanogenesis from the antidiabetic drug metformin, EGU General Assembly 2026, Vienna, Austria, 3–8 May 2026, EGU26-20720, https://doi.org/10.5194/egusphere-egu26-20720, 2026.

EGU26-20745 | ECS | Orals | BG4.1

Spatial and seasonal variability of nutrient export from a subarctic glacial river to the ocean 

Marco Ajmar, Jeffrey P. H. Perez, Helen K. Feord, Anne Eberle, Chiara Bahl, Runa Antony, Anirban Majumder, Sigurdur R. Gislason, Cassidy O'Flaherty, Alex Beaton, Gunnar Sigurðsson, Martyn Tranter, and Liane G. Benning

Glacial rivers play an important role in transporting dissolved and particulate nutrients from glaciers to downstream ecosystems where they influence ocean primary productivity. Abiotic and biotic processes in glacial environments enrich meltwaters with various nutrients. These may undergo changes in concentration and speciation along the river catchments due to lateral inputs or in-channel processes. However, the temporal and spatial variabilities of such nutrient fluxes are poorly constrained.
We monitored diurnal and seasonal changes in nutrient concentrations along a ~120-km long glacier river in Western Iceland. We combined time-resolved in situ chemical analysis using microfluidic sensors for dissolved nitrate (NO3aq) and phosphate (PO43-aq) with in situ temperature, pH, conductivity, and turbidity measurements. We also carried out seasonal sampling along glacier-to-ocean transects of the river catchment and characterized both aqueous and particulate fractions of macro- and micronutrients, dissolved organic matter composition, and DNA.
The in situ sensor data revealed diurnal fluctuations in NO3aq concentrations of up to 1 µM, with a decrease during the day and an increase at night. These diurnal trends were consistent across seasons. In contrast, PO43-aq exhibited seasonal variability, with significant changes related to glacial discharge.  
The glacier-to-ocean transect showed enrichment in dissolved organic carbon (DOC) and iron (Feaq) with increasing distance from the glacier, likely reflecting soil-derived lateral inputs and a variation in DSiaq due to geothermal inputs. Downstream, a link between decreasing PO43-aq and increasing Feaq concentrations may suggest adsorption or coprecipitation processes. Changes in dissolved inorganic nitrogen (DIN) hint at a potential increase in channel microbial uptake along the river path.
Overall, our findings highlight the spatial and temporal variability in nutrient export from glacial rivers to the ocean, showing relative contributions of different nutrient sources across seasons and distance from the glacier.

How to cite: Ajmar, M., Perez, J. P. H., Feord, H. K., Eberle, A., Bahl, C., Antony, R., Majumder, A., Gislason, S. R., O'Flaherty, C., Beaton, A., Sigurðsson, G., Tranter, M., and Benning, L. G.: Spatial and seasonal variability of nutrient export from a subarctic glacial river to the ocean, EGU General Assembly 2026, Vienna, Austria, 3–8 May 2026, EGU26-20745, https://doi.org/10.5194/egusphere-egu26-20745, 2026.

The relative supply of carbon (C), nitrogen (N), and phosphorus (P) to aquatic ecosystems is a key regulator of productivity, nutrient cycling, and food-web dynamics. Several environmental changes in high-altitude regions can directly or indirectly influence carbon (C), nitrogen (N), and phosphorus (P) cycling, retention, and availability through terrestrial, atmospheric, and in-situ aquatic processes, thereby regulating their export to lakes, rivers, and headwater streams.

While increasing concentrations of dissolved organic carbon (DOC) have been widely documented in high-latitude surface waters and increasingly reported for many high-elevation lakes and streams, concurrent long-term trends in nitrogen (N) and phosphorus (P) availability—and associated shifts in elemental stoichiometry—remain poorly constrained, particularly across heterogeneous high-mountain aquatic ecosystems. In these regions, declining atmospheric deposition can directly reduce external nutrient inputs but also indirectly alter soil chemistry and biogeochemical processes, for example by enhancing microbial mineralization of soil organic matter following reductions in soil acidity. At the same time, rapid climate warming and elevated atmospheric CO₂ are promoting increased alpine and subalpine plant productivity and upslope vegetation expansion, potentially enhancing nutrient sequestration in biomass and soils while increasing soil DOC production. Climate-driven shifts in seasonality, including earlier snowmelt, longer growing seasons, and warmer autumns and winters, further influence the timing and magnitude of nutrient uptake, transformation, and mobilization along terrestrial–aquatic flow paths. Finally, fundamental differences in hydrological residence times, internal processing, and network connectivity between lakes and rivers may drive divergent long-term trends in carbon and nutrient stoichiometry, but such cross-ecosystem assessments within high-mountain river networks remain scarce.

Here, we analyzed decadal-scale changes (from 2005 to 2025) in dissolved organic carbon (DOC), dissolved inorganic nitrogen (DIN), and soluble reactive phosphorus (SRP) across 35 sites spanning lakes (n = 14) and rivers and streams (n = 21) within the Pyrenees mountain range. Dissolved organic carbon (DOC) increased consistently across sites, while dissolved inorganic nitrogen (DIN) and soluble reactive phosphorus (SRP) showed widespread declines, largely independent of catchment type or aquatic system. Declines in dissolved inorganic nitrogen (DIN) were most pronounced during the growing season and, together with increasing dissolved organic carbon (DOC) at several sites, suggest enhanced retention of nitrogen by alpine vegetation and soil microbial communities, potentially reinforced by long-term reductions in atmospheric nitrogen deposition. In contrast, declines in soluble reactive phosphorus (SRP) occurred primarily during late autumn and winter, indicating that key biogeochemical controls operate during the non-growing season, potentially linked to reduced physical weathering inputs, altered hydrological pathways, increased sediment retention, and changes in atmospheric deposition

Linking nutrient trends with rising DOC concentrations revealed a consistent shift in elemental ratios across the majority of sites, characterized by increasing carbon availability relative to limiting nutrients. Collectively, these patterns indicate a co-ocurrance of increased DOC (or browning) and oligotrophication of high-mountain lakes and running waters, with likely consequences for primary production, microbial metabolism, and food-web structure in alpine and subalpine aquatic ecosystems under continued climate change.

How to cite: Gómez-Gener, L., Palacín, C., and Camarero, L.: Multi-decadal ecosystem stoichiometric changes across high-mountain Pyrenean aquatic ecosystems driven by reduced acid deposition and climate change, EGU General Assembly 2026, Vienna, Austria, 3–8 May 2026, EGU26-21235, https://doi.org/10.5194/egusphere-egu26-21235, 2026.

EGU26-21516 | ECS | Posters on site | BG4.1

 High Hydrostatic Pressure Activates Microbes to Accelerate Deep-Sea Carbon Recalcitrance 

Huaying Lin and Yu Zhang

The recalcitrant dissolved organic carbon (RDOC) pool in the deep ocean is crucial for long-term carbon sequestration, yet the mechanisms sustaining its stability below 1,000 m remain unclear. While high hydrostatic pressure (HHP) is traditionally viewed as inhibiting microbial activity, its role in regulating DOC transformation is poorly resolved. Here, we isolated the effect of pressure by incubating natural deep-sea DOC with a hadal microbial consortium across a gradient of 20–115 MPa at 4 °C, simulating depths from 2,000 to 11,000 m.

Over 25-day incubations, bulk DOC concentrations remained stable, yet microbial biomass exhibited a non-linear pressure response, peaking at intermediate pressures (20–60 MPa) and declining under higher pressures. Molecular-level analysis via FT-ICR MS revealed that increasing pressure systematically shifted the DOC pool toward higher oxidation states and O/C ratios, lower H/C ratios, and enrichment of carboxyl-rich, heteroatom-poor compounds. These changes were potentially driven by pressure-stimulated formation and persistence of thermodynamically stable DOC, rather than preferential removal of labile substrates. Metagenomic and metatranscriptomic analyses further indicated that HHP enhances oxidative stress responses and upregulates high-energy carbon oxidation pathways, suggesting microbial metabolic reprogramming toward energy maximization under extreme conditions.

Our findings demonstrate that HHP actively reprograms deep-sea microbial metabolism to accelerate DOC recalcitrance, transforming the deep biosphere into an active driver of long-term carbon storage. This challenges the paradigm of the deep sea as a passive carbon reservoir and underscores the need to incorporate pressure-dependent microbial metabolic flexibility into carbon cycle models to better predict oceanic carbon responses under global change.

How to cite: Lin, H. and Zhang, Y.:  High Hydrostatic Pressure Activates Microbes to Accelerate Deep-Sea Carbon Recalcitrance, EGU General Assembly 2026, Vienna, Austria, 3–8 May 2026, EGU26-21516, https://doi.org/10.5194/egusphere-egu26-21516, 2026.

EGU26-21744 | Posters on site | BG4.1

Exploring Metabolic Signals of Mixotrophy in Marine Protists Using Compound-Specific Hydrogen Isotopes 

Marc-Andre Cormier, Jean-Baptiste Berard, Mohammad Ali Salik, Kevin Flynn, and Gael Bougaran

Despite its central role in marine food webs, nutrient cycling, and carbon export, mixotrophy remains difficult to quantify, largely because robust tools for resolving the relative contributions of autotrophic and heterotrophic metabolism in plankton are still lacking. Mixotrophic strategies blur traditional functional classifications and could hypothetically confer ecological advantages under variable environmental regimes. Yet current approaches often rely on bulk physiological rates or grazing experiments that provide only partial or indirect insights into trophic behaviour. As highlighted by Millette et al.(2024), these methodological limitations hinder the integration of mixotrophy into ecosystem and biogeochemical models, underscoring the need for novel, process-based tracers capable of resolving trophic behaviour at the level of cellular metabolism.

Hydrogen isotope ratios (δ²H) in lipids and carbohydrates from aquatic and terrestrial organisms, as well as from sedimentary archives, are widely employed to reconstruct past hydroclimatic conditions. Emerging evidence, however, indicates that δ²H values in these biomolecules also encode metabolic signals in addition to climatic ones (Holloway-Phillips et al., 2025). Such influences complicate straightforward climatic reconstructions and highlight the need to better identify the processes that determine δ²H variability in organic matter. Yet, once these contributions are disentangled, the metabolic information embedded in δ²H values may itself become a valuable tracer for unresolved ecophysiological processes—among them, marine mixotrophy

Previous experimental work has revealed that lipid δ²H values in bacteria (Zhang et al., 2009) and green algae (Cormier et al., 2022) respond specifically to their trophic metabolism. Building on these findings, we present initial experiments with protists designed to test whether δ²H & δ13C values of different biomolecules (including fatty acids, phytols and sterols) similarly reflect shifts in central metabolic pathways. Two complementary experimental systems are compared: continuous cultures of Chlorella under osmo-heterotrophic conditions, and batch cultures of mixoplankton feeding on prey.

These new compound-specific isotope measurements were obtained using gas chromatography–isotope ratio mass spectrometry on the aforementioned compounds from these systems alongside RNA-sec, pigment and physiological data. Our data suggest that lipid δ²H values are indeed sensitive to the degree of heterotrophic growth in diverse protist lineages, pointing to their potential as indicators of metabolic flexibility.

If these relationships can be confirmed and quantitatively calibrated, compound-specific hydrogen isotope analysis could provide a powerful new tool for investigating the prevalence and dynamics of mixotrophy.

References:

Zhang, X. et al. (2009). PNAS. doi:10.1073/pnas.0903030106

Cormier, M.-A. et al. (2022). New Phytologist. doi:10.1111/nph.18023

Millette, N. C. et al. (2024). Journal of Plankton Research. doi:10.1093/plankt/fbad020

Holloway-Phillips, M. et al. (2026). New Phytologist. doi:10.1111/nph.70845

How to cite: Cormier, M.-A., Berard, J.-B., Salik, M. A., Flynn, K., and Bougaran, G.: Exploring Metabolic Signals of Mixotrophy in Marine Protists Using Compound-Specific Hydrogen Isotopes, EGU General Assembly 2026, Vienna, Austria, 3–8 May 2026, EGU26-21744, https://doi.org/10.5194/egusphere-egu26-21744, 2026.

EGU26-665 | ECS | Orals | BG4.3

Assessing the Impact of Amazon Floodplain Dynamics on CO2 Emissions: A Satellite-Model Synthesis 

Annegret Roessler, Yanzi Yan, Minna Ma, and Pierre Regnier

The CO2 emissions from inland waters in Amazon Basin constitute a critical, yet often underrepresented, component of the global carbon budget. While the region is widely recognized as a vital carbon sink due to its vast forests, its extensive aquatic networks, particularly floodplains, act as significant natural sources of atmospheric CO2. However, current process-based biogeochemical models usually fail to capture the temporal extent of floodplains. This limitation propagates into substantial uncertainties in the estimated CO2 emissions from Amazonian inland waters, particularly from floodplains. In this work, we are using the satellite-observations-based product GIEMS-D3 to take a deep dive into Amazon floodplain dynamics. Through comparison with the process-based model ORCHILEAK, we aim to explore which and to what extent biotic and abiotic factors have impacts on the floodplain dynamics and associated CO2 emissions. The findings from this study will provide key constraints for refining biogeochemical models, leading to more accurate representations of inland water CO2 emissions and a better-constrained global carbon budget.

How to cite: Roessler, A., Yan, Y., Ma, M., and Regnier, P.: Assessing the Impact of Amazon Floodplain Dynamics on CO2 Emissions: A Satellite-Model Synthesis, EGU General Assembly 2026, Vienna, Austria, 3–8 May 2026, EGU26-665, https://doi.org/10.5194/egusphere-egu26-665, 2026.

EGU26-1604 | Posters on site | BG4.3

Regional-scale comparisons of greenhouse gas emissions from ditches and cropland soils  

Zhifeng Yan and Zhengkui Ge

Drainage and irrigation ditches are hotlines of greenhouse gas (GHG, including CH4, CO2, and N2O) emissions. These emissions are particularly high from agricultural ditches, due to inputs of organic and inorganic nutrients from land management. However, the total GHG emissions from agricultural ditches and their contribution to regional and national budgets remains largely unknown, due to a twin data gap of measured GHG fluxes and mapped ditch areas. Here, we estimated diffusive GHG emissions from agricultural ditches across the North China Plain (~141,000 km2), one of the most intensive agricultural regions worldwide, based on three regional-scale field campaigns on 36 ditch-river systems, each of which included collector ditches (CD), branch ditches (BD), main ditches (MD), and a connected river, in 2023. The results found that ditches emitted diffusive greenhouse gas emissions five times larger than their area share over the North China Plain.

How to cite: Yan, Z. and Ge, Z.: Regional-scale comparisons of greenhouse gas emissions from ditches and cropland soils , EGU General Assembly 2026, Vienna, Austria, 3–8 May 2026, EGU26-1604, https://doi.org/10.5194/egusphere-egu26-1604, 2026.

EGU26-2104 | ECS | Posters on site | BG4.3

Mechanisms of Groundwater–Surface Water Interactions on Ecosystem Greenhouse Gas Emissions 

Chang Qian, Qianqian Wang, Benjamin S. Gilfedder, Sven Frei, Jieyu Yu, and Zhi-Guo Yu

Greenhouse gas (GHG) emissions from inland waters exhibit pronounced spatial and seasonal variability, yet the role of groundwater discharge in regulating these dynamics remains insufficiently constrained. In reservoirs located in topographically complex regions, strong hydraulic gradients can induce substantial groundwater–surface water exchange, potentially altering carbon and nitrogen inputs as well as biogeochemical conditions that govern GHG production and emission.
Here, we investigate the seasonal influence of groundwater discharge on CH4, CO2, and N2O emissions in a subtropical reservoir using an integrated approach combining multi-season field observations and controlled microcosm experiments. Groundwater discharge rates were quantified using a radon-222(222Rn) mass balance framework, revealing marked seasonal variability, with enhanced discharge during winter and moderate but persistent inputs during spring and autumn. Dissolved GHG concentrations in groundwater were consistently elevated relative to surface water, indicating groundwater as a direct source of atmospheric GHGs.
Across seasons, groundwater discharge contributed substantially to reservoir-scale emissions, accounting for approximately one-third of CH4 and CO2 fluxes and a smaller but non-negligible fraction of N₂O emissions. However, the relationship between discharge intensity and GHG fluxes was non-linear. Field observations and incubation experiments demonstrate that moderate groundwater inputs during transitional seasons enhanced CH4 and CO2 production by increasing carbon availability, modifying dissolved organic matter composition, and reducing oxygen availability at the water–sediment interface. In contrast, higher discharge rates in winter altered C/N ratios and microbial activity in ways that partially constrained GHG production despite increased groundwater inflow.
Our results highlight groundwater discharge as a dynamic regulator of aquatic GHG emissions rather than a simple source term. By linking seasonal hydrological exchange to biogeochemical responses, this study provides process-based constraints on groundwater-driven GHG emissions from reservoirs and underscores the importance of incorporating groundwater–surface water interactions into regional and global assessments of inland-water GHG budgets.

How to cite: Qian, C., Wang, Q., Gilfedder, B. S., Frei, S., Yu, J., and Yu, Z.-G.: Mechanisms of Groundwater–Surface Water Interactions on Ecosystem Greenhouse Gas Emissions, EGU General Assembly 2026, Vienna, Austria, 3–8 May 2026, EGU26-2104, https://doi.org/10.5194/egusphere-egu26-2104, 2026.

Benthic bioturbation in coastal wetlands may substantially alter greenhouse gas (GHG) emissions by reshaping scalar transport and redox conditions, yet its net effect and mechanistic pathways remain poorly constrained. We develop a three-dimensional LES--Darcy reactive-transport framework that couples overlying flow, burrow-driven ventilation, and porewater biogeochemical reactions to quantify CO2, CH4, and N2O exchange from crab-burrowed sediments. We designed an ensemble of simulations spanning a broad range of hydrodynamic forcing, surface topography, and bioirrigation conditions, including contrasts in burrow depth and ventilation strength. Time-series results show a consistent response sequence: CO2 fluxes are elevated at the onset of ventilation and relax toward a quasi-steady level that remains above the flat-sediment baseline; CH4 fluxes are generally enhanced, with the strongest amplification early in the simulations when flushing can export reduced gases faster than they are oxidized; and N2O exhibits a pronounced transient pulse as the oxic--anoxic structure reorganizes around the burrow. At quasi-steady state, CO2 and CH4 fluxes are enhanced by up to ~12-fold and ~3-fold relative to undisturbed sediments. Across scenarios, burrow depth and bioirrigation intensity emerge as the dominant, synergistic controls on multi-gas fluxes, whereas external hydrodynamic forcing and mound-scale relief exert secondary, context-dependent effects. These results provide a process-based foundation for incorporating fauna-driven ventilation into blue-carbon budgets and wetland restoration planning by linking burrow-scale transport--reaction dynamics to ecosystem-scale GHG emissions.

How to cite: Huang, Y. and Liu, Y.: Bioturbation Amplifies Greenhouse Gas Emissions from Coastal Wetlands: Insights from a 3D Reactive Transport Model, EGU General Assembly 2026, Vienna, Austria, 3–8 May 2026, EGU26-3554, https://doi.org/10.5194/egusphere-egu26-3554, 2026.

CH4 is the one of the most important greenhouse gases (GHGs) with a higher global warming potential than carbon dioxide. Increasing evidence suggests that riverine networks surrounding urban landscapes are considered important hotspots for CH4 emissions. However, the factors influencing the spatial pattern of riverine CH4 emissions in heavily urbanised areas remains unclear. Here, we investigated the spatial variability of diffusive CH4 fluxes across the water-air interface (fCH4) and dissolved CH4 concentrations in the water column (dCH4) in river reaches that drain multiple land covers (i.e., urban, agricultural and mixed landscapes) in a major urban river in the Yangtze River Delta, eastern China. fCH4 were measured using a portable infrared gas analyser combined with a floating chamber, dCH4 were determined by the headspace equilibration technique, and various water quality parameters were analysed in the laboratory. Our results showed that almost all sampling sites in the river were oversaturated with dissolved CH4. Rivers in urbanised areas were identified as CH4 emission hotspots, with mean fluxes of 3.76±4.58 mmol·m-2·d-1 and mean concentrations 6.91±6.95 μmol·L-1, corresponding to 6.4 and 3.2 times of those from river reaches in non-urban areas, respectively. Factors related to the high CH4 emissions in urban rivers included nutrient supply (e.g., NO3-N, NH3-N, TP), carbon input and hypoxia. Overall, these findings highlight the need for greater awareness regarding the role of urban river networks in contributing to global warming, especially given ongoing urban expansion.

How to cite: Zhou, J., Peacock, M., and Zhao, P.: Spatial patterns and drivers of riverine methane (CH4) emissions in highly urbanised areas: A case study in Yangtze River Delta, EGU General Assembly 2026, Vienna, Austria, 3–8 May 2026, EGU26-3762, https://doi.org/10.5194/egusphere-egu26-3762, 2026.

EGU26-4928 | ECS | Posters on site | BG4.3

Statistical characterization of non-thermal open ocean pCO2 variability 

Kévin Robache and François G. Schmitt

The dynamics of the oceanic partial pressure of CO2 (pCO2) are governed by the combined influence of thermal effects, driven by temperature variability, and non-thermal processes related to several processes such as biology, and air–sea gas exchange. The relative contribution of these components can be quantified using the decomposition framework proposed by Takahashi et al. (1993, 2002, 2009). Here, this methodology is applied to high-frequency in situ pCO2 observations from 17 fixed-position open-ocean moorings (Sutton et al., 2019), providing an Eulerian view of surface ocean carbon variability across a range of oceanic regions. This approach allows us to isolate the non-thermal component of pCO2 variability and to investigate its statistical properties beyond mean or seasonal signals. The impact of non-thermal processes is examined using probability density function (PDF) analyses and PDF-quotient diagnostics (Xu et al., 2007). These analyses reveal that non-thermal forcing plays a key role in shaping the distribution of pCO2 variability, with a particularly strong influence on extreme values relative to the core of the distribution. Such extremes are often underestimated when variability is characterized using low-frequency or climatological approaches. Despite the generally lower variability of open-ocean environments compared to coastal regions, our results demonstrate that non-thermal processes significantly contribute in these environments to short-term pCO2 fluctuations and extremes. This highlights the importance of sustained, high-frequency pCO2 observations for improving air–sea CO2 flux estimates and for reducing uncertainties in regional and global ocean carbon budgets.


References:

Takahashi et al. (1993), Seasonal variation of CO2 and nutrients in the high-latitude surface oceans: A comparative study. Global Biogeochemical Cycles, 7 (4), 843–878. doi: 10.1029/93GB02263

Takahashi et al. (2002), Global sea–air CO2 flux based on climatological surface ocean pCO2, and seasonal biological and temperature effects. Deep Sea Research Part II: Topical Studies in Oceanography, 49 (9), 1601–1622. doi: 10.1016/S0967-0645(02)00003-6308

Takahashi et al. (2009), Climatological mean and decadal change in surface ocean pCO2, and net sea–air CO2 flux over the global oceans. Deep Sea Research Part II: Topical Studies in Oceanography, 56 (8), 554–577. doi: 10.1016/j.dsr2.2008.12.009313

Sutton et al. (2019), Autonomous seawater pCO2 and pH time series from 40 surface buoys and the emergence of anthropogenic trends. Earth System Science Data, 11 (1), 421–439. doi: 10.5194/essd-11-421-2019295

Xu et al. (2007), Curvature of Lagrangian Trajectories in Turbulence. Physical Review Letters, 98 (5), 050201. doi: 10.1103/PhysRevLett.98.050201324

How to cite: Robache, K. and Schmitt, F. G.: Statistical characterization of non-thermal open ocean pCO2 variability, EGU General Assembly 2026, Vienna, Austria, 3–8 May 2026, EGU26-4928, https://doi.org/10.5194/egusphere-egu26-4928, 2026.

EGU26-6522 | ECS | Posters on site | BG4.3

Methane emission responses to drainage ditch cleaning in forested peatlands 

Joosep Truupõld, Jürgen Sarjas, Ilona Tamm, Mihkel Pindus, Kadir Yıldız, and Kuno Kasak

Long-term anoxic conditions enable natural peatlands to accumulate carbon in peat soils over millennia and are generally described as CO2 sinks and CH4 sources. Drainage of these ecosystems is known to reduce CH4 emissions from soils. However, drainage ditches can partly offset this reduction by acting as hotspots for CH4 emission. Many of these ditches are periodically cleaned to maintain their drainage efficiency. The effect of this procedure on ditch CH4 fluxes is unclear.

To address this knowledge gap, we measured CH4 fluxes from forestry drainage ditches before and after ditch cleaning between April and October 2025 at 58 measuring points across four drainage system catchments in western Estonia. The peat layer at the study sites was approximately 2 meters thick and underlain by clay, resulting in multiple locations where clay was exposed in the ditch bottom after cleaning. The clay-bottom ditches were filled with sediment prior to cleaning. No significant change in CH4 emissions was observed within the full dataset. However, when separating the data by ditch bottom substrate, peat-bottom ditches showed a nearly fivefold increase in CH4 fluxes (from 9.01 to 45.07 nmol m-2 s-1), while fluxes from clay-bottom ditches remained similar (12.95 to 11.37 nmol m-2 s-1). Prior to ditch cleaning, CH4 emissions did not differ significantly between peat- and clay-bottom ditches.

The mechanisms for this separation post-cleaning are unclear. Firstly, ditch water parameters (depth, pH, dissolved oxygen, redox potential, electrical conductivity, temperature) measured alongside fluxes showed no significant differences between uncleaned and cleaned ditches. Furthermore, a multiple linear regression model based on measured water parameters explained nearly 40% of the variability in peat-bottom ditch CH4 fluxes prior to cleaning. This explanatory power was lost following ditch cleaning, indicating a change in mechanism. Increased lateral inflow of dissolved CH4 may contribute to post-cleaning fluxes. Although neither CH4 fluxes nor dissolved concentrations increased further downstream with greater catchment size, the contribution of lateral transport cannot be excluded. In clay-bottom ditches, where most organic substrate was removed during cleaning, a substantial proportion of CH4 emissions may originate from lateral inputs rather than in situ methanogenesis. The removal of vegetation and sediment during cleaning may have disrupted a long-established stability in the system, enhancing methanogenesis in peat-bottom ditches while suppressing in situ methanogenesis in clay-bottom ditches due to substrate limitations.

How to cite: Truupõld, J., Sarjas, J., Tamm, I., Pindus, M., Yıldız, K., and Kasak, K.: Methane emission responses to drainage ditch cleaning in forested peatlands, EGU General Assembly 2026, Vienna, Austria, 3–8 May 2026, EGU26-6522, https://doi.org/10.5194/egusphere-egu26-6522, 2026.

EGU26-6848 | Orals | BG4.3 | Highlight

Greenhouse gas emissions from human-impacted lakes and rivers globally: Implications for carbon mitigation 

Xinghui Xia, Zhuangzhuang Zhang, and Junfeng Wang

Global lakes and rivers are significant sources of greenhouse gases (GHGs) to the atmosphere. Rapid socioeconomic development has increased nutrient loadings from various anthropogenic activities, such as agricultural practices, reclaimed water containing nutrients, and other point and non-point source pollution, into these water bodies, resulting in significant variations in GHG fluxes. However, the extent to which these human-impacted lakes and rivers contribute to GHG emissions relative to their respective global totals remains unknown, hindering the estimation of GHG emission reduction potential and the development of effective mitigation strategies. Here, we addressed this gap using meta-analyses combined with multiple models. For lakes, human-impacted lakes cover one-fifth of the total lake area yet contribute over one-third of total lake emissions, with disproportionately high emissions of CH4 and N2O. Within human-impacted lakes, those larger than 0.1 km2 are the major contributors to GHG emissions. We speculate that global lake GHG emissions could be reduced by over one-fifth, if fluxes of human-impacted lakes are decreased to levels comparable to those of natural non-permafrost lakes through sustainable lake water quality management. For rivers draining human-impacted regions, CH4 fluxes are significantly elevated by nutrient enrichment. Quantitative modeling accounting for nutrient effects estimates that human-impacted rivers contribute over one-third of total riverine CH4 emissions. More than half of these emissions are attributable to anthropogenic nutrient enrichment. We speculate a one-third to half reduction potential for global human-impacted rivers under scenarios where nutrient levels are halved or reduced to natural/ semi-natural conditions. Our study highlights the critical role of anthropogenic activities in amplifying GHG emissions from global lakes and rivers, and emphasizes a “win-win” strategy: achieving both nutrient control and GHG mitigation through sustainable water quality management.

How to cite: Xia, X., Zhang, Z., and Wang, J.: Greenhouse gas emissions from human-impacted lakes and rivers globally: Implications for carbon mitigation, EGU General Assembly 2026, Vienna, Austria, 3–8 May 2026, EGU26-6848, https://doi.org/10.5194/egusphere-egu26-6848, 2026.

Our efforts to reduce anthropogenic pressures on aquatic ecosystems and their catchments are still unsatisfactory as aquatic nutrient and pollutant exports remain constant or continue to increase. Geomorphologic modifications and diffuse pollution from agricultural land use are the two dominant pressures responsible for aquatic degradation and water pollution. In recent years the main focus has been on mitigating these pressures through various measures implemented at the catchment level, including rewetting/constructing wetlands and channel restoration and remediation. In this study we looked at the environmental effects of channel remediation for over 30 Swedish agricultural headwater streams and  ditches. Our aim was two-fold: 1) to evaluate the effects of channel remediation on chemical and ecological conditions in streams and ditches; and 2) to evaluate the linkages between stream and ditch exports of N and C and catchment and in-stream properties. The aquatic sites analysed in our study all shared high levels of anthropogenic disturbance, with high levels of nutrients and suspended sediments. Despite these common pressures, we found large variations in N and C exports through the stream network (as nitrate nitrogen NO3-N and dissolved organic carbon DOC) and gaseous losses (as CO2, CH4 and N2O). Using our extensive dataset, we were able to link these differences to catchment and in-stream properties describing N and C transport (e.g., flow discharge, contributing area) and processing (e.g., channel area, channel substrate, macrophyte stands) and carbon quality measured as fluorescent dissolved organic matter. Together, our results indicate that both intrinsic and extrinsic factors control catchment N and C losses to water and air, leading to a large variation in observed fluxes and the effects of remediation.  


How to cite: Bieroza, M. and Livsey, J.: Nitrogen and carbon fluxes from degraded aquatic ecosystems - the interplay between catchment and in-channel factors and remediation, EGU General Assembly 2026, Vienna, Austria, 3–8 May 2026, EGU26-6890, https://doi.org/10.5194/egusphere-egu26-6890, 2026.

EGU26-7138 | ECS | Posters on site | BG4.3

The critical role of lake classification in refining global lake greenhouse gas emission estimates 

Zhuangzhuang Zhang and Xinghui Xia

Lakes play a critical role in estimating global greenhouse gas (GHG) emission budgets. Various human activities, such as agricultural practices, reclaimed water containing nutrients, and other point and non-point pollution, have led to significant nutrient loading and consequently elevated GHG emissions. As a result, research has increasingly focused on GHG flux patterns from these human-impacted lakes. However, this poses a challenge for global estimates: a significant mismatch may exist between the number of lakes with GHG flux measurements and the total number and area of lakes across lake types. Due to the contrasting lake formation processes and varying degrees of human disturbance, lakes can be classified into distinct types, such as human-impacted urban and non-urban lakes and natural permafrost and non-permafrost lakes. These types exhibit distinct characteristics in size and nutrient concentrations. Therefore, accounting for lake type is as essential as lake area for accurate global estimates. Yet, the extent to which lake classification influences global lake GHG emission estimates remains poorly understood. Here, we addressed this gap through a meta-analysis. We observed distinctive patterns in physicochemical properties and GHG measurements across lake types, and identified varied relationships between GHG fluxes and lake area among the four lake types. We classified global lakes into the four types described above based on the population-lake volume ratio or cropland-lake volume ratio, urban coverage, and permafrost coverage within 3 km of the lake. We then estimated GHG emissions from global lakes based on both lake type and size, demonstrating that global lakes emitted 813.0 (Q1–Q3: 575.7–1235.9) teragram CO2-equivalents year-1, which is one-third of the latest estimate without considering lake type. Human-impacted lakes contribute significantly to global lake GHG emissions, with disproportionately high emissions relative to their surface area. Our results provide new insights for improving the accuracy of global lake GHG emission estimates.

How to cite: Zhang, Z. and Xia, X.: The critical role of lake classification in refining global lake greenhouse gas emission estimates, EGU General Assembly 2026, Vienna, Austria, 3–8 May 2026, EGU26-7138, https://doi.org/10.5194/egusphere-egu26-7138, 2026.

EGU26-9294 | ECS | Posters on site | BG4.3

Temperature has an enhanced role in sediment N2O and N2 fluxes in wider rivers 

Sibo Zhang and Xinghui Xia

Riverine N2O and N2 fluxes, key components of the global nitrogen budget, are known to be influenced by river size (often represented by average river width), yet the specific mechanisms behind these effects remain unclear. This study examined how environmental and microbial factors influence sediment N2O and N2 fluxes across rivers with varying widths (2.8 to 2,000 meters) in China. Sediment acted as sources of both N2O and N2 emissions, with both N2 fluxes (0.2 to 20.8 mmol m-2 d-1) and N2O fluxes (0.7-54.2 μmol m-2 d-1) decreasing significantly as river width increased. N2 fluxes were positively correlated with denitrifying bacterial abundance, whereas N2O fluxes, when normalized by the abundance of denitrifying bacteria, were negatively correlated with N2O-reducing microbes. Water physicochemical factors, particularly temperature and nitrate, were more important drivers of these fluxes than sediment factors. Nitrate significantly increased denitrifying bacterial abundance, whereas higher temperatures enhanced cell-specific activity. Lower N2O and N2 emissions in wider rivers were attributed to decreased denitrifying microbial abundance and lower denitrification rates, in addition to the commonly assumed reduction in exogenous N2O and N2 inputs. Rolling regression analysis showed that nitrate concentration had a stronger effect on sediment N2O and N2 fluxes in narrower rivers, whereas temperature was more influential in wider rivers. This difference is attributed to more stable nitrate concentrations and decreased nitrogen removal efficiency in wider rivers, while temperature variation remained consistent across all river widths. Beyond sediments, temperature had a greater effect on excess N2O concentrations than nitrate in the overlying water of wider rivers (>165 meters), highlighting its broader impact. This study provides new biogeochemical insights into how river width influences sediment N2O and N2 fluxes and highlights the importance of incorporating temperature into flux predictions, particularly for wider rivers.

How to cite: Zhang, S. and Xia, X.: Temperature has an enhanced role in sediment N2O and N2 fluxes in wider rivers, EGU General Assembly 2026, Vienna, Austria, 3–8 May 2026, EGU26-9294, https://doi.org/10.5194/egusphere-egu26-9294, 2026.

EGU26-10552 | ECS | Posters on site | BG4.3

Future climate warming prolongs spring mixing and increases annual greenhouse gas emissions in a boreal lake 

Marta Fregona, Joachim Jansen, Xuefei Li, and Ivan Mammarella

Seasonally ice-covered lakes are significant sources of methane (CH₄) and carbon dioxide (CO₂), with substantial emissions during spring and autumn turnover. During these events, gases accumulated in the hypolimnion are released to the atmosphere, with turnover accounting for 26–59% of CH₄ and 15–30% of CO₂ in some lakes. Climate change is altering ice cover duration and mixing regimes, affecting greenhouse gas (GHG) dynamics: reduced ice cover prolongs the ice-free period, increasing opportunities for GHG production and release, while shifts in turnover timing and duration can modify both the magnitude and seasonality of emissions, potentially generating climate feedbacks. Although the effects of climate change on ice cover and mixing are increasingly studied, the combined impacts on greenhouse gas production and release under future warming scenarios are still not well quantified.
We simulated projected changes in ice cover, turnover periods, and GHG dynamics in Lake Kuivajärvi, a small boreal lake in Finland, under future warming scenarios using outputs from five general circulation models and the LAKE model. LAKE reproduces temperature, horizontal velocities, O₂, CO₂, and CH₄ using a horizontally averaged transport equation, including sediment interactions and a snow-ice module.
Our results show substantial inter-model differences in ice cover length, and turnover timing and duration. Trends in ice cover duration and spring turnover are generally consistent—ice cover is decreasing (-14 ± 6 days per decade) and spring turnover is starting earlier and lasting longer (~3.6 days per decade)—whereas changes in autumn turnover are highly uncertain, with low model agreement and high variability. Lake Kuivajärvi is projected to experience occasional years with a monomictic regime by the late 21st century. Alongside changes in ice cover and turnover timing, CH₄ and CO₂ emissions are increasing during extended ice-free periods and altered mixing events.

How to cite: Fregona, M., Jansen, J., Li, X., and Mammarella, I.: Future climate warming prolongs spring mixing and increases annual greenhouse gas emissions in a boreal lake, EGU General Assembly 2026, Vienna, Austria, 3–8 May 2026, EGU26-10552, https://doi.org/10.5194/egusphere-egu26-10552, 2026.

EGU26-11484 | ECS | Orals | BG4.3

Groundwater Discharge Dominates CO2 and CH4 Fluxes through a Glacier-Fed Stream on the Qinghai-Tibet Plateau 

Chuan Wang, Wei Zhi, Sen Xu, Xin Dai, and Chunhui Lu

Glacier-fed streams are pivotal yet poorly constrained components of cryospheric carbon cycling. While widespread CO2 and CH4 oversaturation suggests their potential as atmospheric sources, it remains unclear whether these fluxes are driven by in-stream biogeochemical processing or by the physical supply of terrestrially derived carbon via groundwater discharge. Here, we traced carbon transport using a suite of dissolved gases (222Rn, 4He, 40Ar, 84Kr, O2, CO2, CH4) across a proglacial groundwater–stream–atmosphere continuum on the Qinghai-Tibet Plateau. Elevated 222Rn activities (up to 2.33 Bq L-1), together with concomitant increases in streamflow, identified substantial groundwater discharge. Based on these observations, we established a 222Rn mass balance model to quantitatively constrain gas exchange velocities across both the groundwater–stream and stream–atmosphere interfaces. The stream remained persistently oversaturated with CO2, whereas CH4 remained near saturation. Paired 40Ar and O2 data indicated that O2 dynamics were physically dominated, pointing to a limited in-stream metabolic contribution to CO2. Flux results revealed that groundwater discharge supplied major CO2 inputs (12–2144 mmol m-2 d-1), sustaining its oversaturation and driving rapid emission to the atmosphere (26–888 mmol m-2 d-1). Together, these results demonstrate that carbon emissions from the proglacial system was dominated by physical exchange across the groundwater–stream–atmosphere continuum, rather than by in-stream biological turnover. Our findings underscore that groundwater discharge as a critical yet underrepresented pathway is essential to be integrated into models of cryospheric carbon cycling to accurately project biogeochemical feedbacks under ongoing warming climate.

How to cite: Wang, C., Zhi, W., Xu, S., Dai, X., and Lu, C.: Groundwater Discharge Dominates CO2 and CH4 Fluxes through a Glacier-Fed Stream on the Qinghai-Tibet Plateau, EGU General Assembly 2026, Vienna, Austria, 3–8 May 2026, EGU26-11484, https://doi.org/10.5194/egusphere-egu26-11484, 2026.

EGU26-12177 | ECS | Posters on site | BG4.3

Glacial streams in Iceland as CO2 sinks and CH4 sources 

Ann-Kathrin Wild, Christina Fasching, Kyle Boodoo, and Peter Chifflard

Glacial streams export organic matter (OM) derived from various sources, including atmospheric deposition, overridden soils, and in situ microbial production. In most inland freshwater systems, this OM is mineralised by microbial respiration, resulting in net CO2 evasion to the atmosphere.
Here, we show that the glacier-fed stream Virkisá (Iceland) deviates from this paradigm and acts as a net carbon sink, sequestering atmospheric CO2.

Using self-constructed, low-cost CO2 chambers, we quantified CO2 fluxes between the stream and the atmosphere at six sites along a 3 km transect downstream from the glacier terminus. Over four seasons (154 measurements conducted between March 2023 and August 2025), CO2 uptake fluxes ranged from an average of -18.76 ± 13.87 mg m-2 h-1 at the glacier outlet to -4.48 ± 3.53 mg m-2 h-1 further downstream. CO2 uptake was strongest in spring, weaker during summer and autumn, and decreased with distance from the glacier. Measurements from four additional glacial streams (Skaftafellsá, Svínafellsá, Kvíárjökull, and Fjallsá) consistently identified glacial streams as CO2 sinks.

A strong correlation between CO2 fluxes and pH indicates that negative CO2 fluxes were primarily driven by enhanced chemical carbonate and silicate weathering, with electrical conductivity serving as a proxy for weathering intensity. Freshly eroded, highly reactive basaltic sediments originating from beneath the glacier may promote rapid weathering reactions, increasing pH and thereby consuming CO2, overriding the biological and abiotic processes that typically dominate in non-glacierized catchments.

In contrast, chamber measurements using the same methodological principle reveal that these glacial streams act as sources of CH4.

Overall, our findings highlight the role of glacial streams as significant carbon sinks and underscore the need for further investigation, particularly in the context of ongoing glacier retreat and the increasing exposure of reactive glacial sediments.

How to cite: Wild, A.-K., Fasching, C., Boodoo, K., and Chifflard, P.: Glacial streams in Iceland as CO2 sinks and CH4 sources, EGU General Assembly 2026, Vienna, Austria, 3–8 May 2026, EGU26-12177, https://doi.org/10.5194/egusphere-egu26-12177, 2026.

EGU26-13182 | Orals | BG4.3

Climate sensitive methane release from sediment-laden channels in Arctic rivers  

Robert Hilton, Sanjeev Dasari, Joshua Dean, Mark Garnett, Sabina Sulikova, Leonardo Mena-Rivera, Catherine Baldwin, Andrew Smith, Christopher Day, Ove Meisel, Suzanne Tank, and Greg Elias

Arctic rivers can act as a route for methane (CH4) to enter the atmosphere from landscapes impacted by ongoing permafrost thaw and climate warming. Thermokarst erosion and thaw induced mass-wasting are underway across the Arctic, increasing organic matter supply to river systems that could act as substrates for methanogenesis. In addition, warming of air and water temperatures could increase methanogenesis in analogy with responses seen in other aquatic, non-fluvial settings. Despite this recognition, the source, drivers and sensitivity of Arctic river CH4 emissions to geomorphic and climate change remain obscured.

Here, we apply novel sampling methods and use radiocarbon and a multi-stable isotope approach to quantify CH4 emissions, age and source in Arctic rivers of the Mackenzie River Basin across two field campaigns in winter 2023 and summer 2024. Despite evidence for CH4 oxidation, we find that sediment-laden Arctic Rivers are hotspots of CH4 release, both downstream of sites of increased thaw-driven mass wasting and within large channels of the river delta. We find that river CH4 emissions increase by three times in the summer season compared to the winter, sustained by an aged, but higher quality organic matter substrate. A detailed reach-scale CH4 budget reveals a high apparent temperature sensitivity of river CH4 emissions that has not been recognized before, suggesting that ongoing warming, permafrost thaw and increased erosion will increase river CH4 emissions in the Arctic.

How to cite: Hilton, R., Dasari, S., Dean, J., Garnett, M., Sulikova, S., Mena-Rivera, L., Baldwin, C., Smith, A., Day, C., Meisel, O., Tank, S., and Elias, G.: Climate sensitive methane release from sediment-laden channels in Arctic rivers , EGU General Assembly 2026, Vienna, Austria, 3–8 May 2026, EGU26-13182, https://doi.org/10.5194/egusphere-egu26-13182, 2026.

EGU26-13432 | ECS | Orals | BG4.3

Large-scale survey of aquatic greenhouse gas dynamics in rewetted and restored peatlands across the UK and Sweden. 

Laura Baugh, Dan Aberg, Richard Chiverrall, Martyn Futter, Gustaf Granath, Rachel Harvey, Amelie Lindgren, Teresa Silverthorn, Jennifer Williamson, and Michael Peacock

Globally peatlands have a history of being drained for agriculture, forestry and grazing, leading to large emissions of carbon dioxide (CO2) to the atmosphere. In recent years there has been a positive shift towards peatland rewetting. However, there is concern that this might sometimes lead to large emissions of methane (CH4). Many rewetting studies focus only on terrestrial emissions and fail to account for aquatic emissions from bog pools and remnant ditches. This is particularly the case of rewetting projects in both the UK and Sweden, where these waterbodies are frequently unaccounted for and poorly understood. Here, we report the results of a synoptic survey of measured greenhouse gas (GHG) emissions from 42 rewetted peatlands over two consecutive summers (May-August 2024 and 2025); 22 UK sites and 20 Swedish sites. Sites were spread over a gradient from 50.7°N to 60.4°N, from temperate-oceanic to hemi-boreal climate zones and were under different land uses (conservation-managed, arable, grassland, forestry). At each site, we measured water chemistry, dissolved GHGs (CO2, CH4 and nitrous oxide (N2O)) and ebullitive CH4 emissions, which are frequently not measured. Our findings will help quantify the magnitudes and drivers of aquatic emissions following rewetting, with implications for management and improved GHG accounting. During this presentation we present the full analysis of results and discuss their implications for peatland rewetting and aquatic GHG emission accounting.

How to cite: Baugh, L., Aberg, D., Chiverrall, R., Futter, M., Granath, G., Harvey, R., Lindgren, A., Silverthorn, T., Williamson, J., and Peacock, M.: Large-scale survey of aquatic greenhouse gas dynamics in rewetted and restored peatlands across the UK and Sweden., EGU General Assembly 2026, Vienna, Austria, 3–8 May 2026, EGU26-13432, https://doi.org/10.5194/egusphere-egu26-13432, 2026.

EGU26-14359 | ECS | Posters on site | BG4.3

Complex hydroclimatic drivers of peatland stream CO2 and CH4 emissions revealed from a multi-catchment temporal study 

Catherine Baldwin, Joshua Dean, Mark Garnett, Hilde Cronwright, Andrew Smith, Leonardo Mena-Rivera, Christopher Day, Sanjeev Dasari, Sabina Sulikova, and Robert Hilton

Peatlands represent a dominant global soil carbon pool, but their role here is vulnerable to climate change and land use pressures. Peatland streams are known conduits of terrestrial carbon loss, rapidly transferring CO2 and CH4 from peat soils to the atmosphere. Despite their recognised contribution to global river greenhouse gas emissions, the hydroclimatic drivers here remain obscured across spatiotemporal gradients.

To address these research needs, we applied a novel isotopic framework (radiocarbon, δ13C, δD, δ18O), to constrain age and sources of peatland stream CO2 and CH4, alongside constraints on hydrological flow paths and CH4 oxidation mechanisms. Over four seasonal visits, we sampled eight catchments on the Isle of Lewis, Scotland, spanning gradients of catchment areas, geomorphology, and land use. The Lewis Peatlands represent one of Europe’s largest continuous blanket bogs, and our catchments capture 30% of their surface area. All sites were subject to the same climate and underlying geology, enabling us to isolate spatiotemporal drivers across catchments.

Chamber-based emissions (flux) measurements reveal high variability of both CO2 (–4.17 ± 2.35 to 106.73 ± 11.26 mmol m-2 d-1) and CH4 (0 to 2.44 ± 0.34 mmol m-2 d-1), with inconsistent coupling in the magnitude of CO2 and CH4 emissions, suggesting independent supply controls. We explore these catchment-specific patterns considering their geomorphological attributes. We find that both CO2 and CH4 fluxes decrease exponentially with catchment area. Surface moisture indices derived using remote sensing show stronger CH4 emissions in wetter catchments, while the magnitude of CO2 emissions was more strongly linked to temperature. Preliminary radiocarbon data hint that CO2 tends to become younger in drier catchments associated with summer sampling, validating the observed seasonal controls of CO2 dynamics. While stronger CO2 and CH4 fluxes generally aligned with younger carbon turnover, these pathways also act as a significant export mechanism for older carbon, with some of the highest fluxes formed of older carbon.

Preliminary stable isotope data indicate greater inter-catchment variability in stream CH4 sources than CO2. Pending isotopic data will enable us to track these patterns over one year of sampling. Globally, only six published datasets report coupled river 14C-CO2 and 14C-CH4, making this one of the first studies to track these paired data over time. Combined with geochemical context and geospatial analyses, this framework will enable us to better constrain what are clearly highly dynamic and variable processes and avoid missing hotspots and key drivers of these peatland carbon loss mechanisms.

How to cite: Baldwin, C., Dean, J., Garnett, M., Cronwright, H., Smith, A., Mena-Rivera, L., Day, C., Dasari, S., Sulikova, S., and Hilton, R.: Complex hydroclimatic drivers of peatland stream CO2 and CH4 emissions revealed from a multi-catchment temporal study, EGU General Assembly 2026, Vienna, Austria, 3–8 May 2026, EGU26-14359, https://doi.org/10.5194/egusphere-egu26-14359, 2026.

EGU26-14398 | ECS | Posters on site | BG4.3

Hydroclimatic Drivers of Modeled Methane Emissions over Volta Lake 

Prince Junior Asilevi, Amy E. Pickard, Ezra Kitson, Emmanuel Quansah, and Bryan M. Spears

Methane (CH₄) emissions from tropical reservoirs are sensitive to hydroclimatic and biogeochemical pressures, yet the dominant controls remain poorly quantified. Here, we combine satellite-derived chlorophyll-a (Chl-a) with a Bayesian upscaling model trained on a global CH₄–Chl-a dataset to estimate long-term (2012–2024) diffusive and ebullitive CH₄ emissions from Volta Lake in Ghana, the world’s largest artificial reservoir by surface area. Modeled emissions show substantial interannual variability and a pronounced post-2016 decline. Annual diffusive emissions ranged from 30.2 - 72.8 Gg CH₄-C yr⁻¹, ebullitive emissions from 109.1 - 211.9 Gg CH₄-C yr⁻¹, yielding combined emissions of 139.2 - 284.7 Gg CH₄-C yr⁻¹. Interannual CH₄ variability closely followed changes in lake-mean Chl-a, consistent with productivity-linked organic matter supply as a key constraint on methanogenesis. In contrast, annual associations between Chl-a (and modeled CH₄) and rainfall, evapotranspiration, or radiation were weak and not statistically significant, suggesting that hydroclimatic influence may operate primarily through seasonal watershed–lake biogeochemical coupling rather than year-to-year mean climate anomalies. These results highlight the sensitivity of Volta Lake methane emissions to long-term shifts in productivity, with implications for reservoir greenhouse gas budgets under changing hydroclimate.

How to cite: Asilevi, P. J., Pickard, A. E., Kitson, E., Quansah, E., and Spears, B. M.: Hydroclimatic Drivers of Modeled Methane Emissions over Volta Lake, EGU General Assembly 2026, Vienna, Austria, 3–8 May 2026, EGU26-14398, https://doi.org/10.5194/egusphere-egu26-14398, 2026.

EGU26-16631 | ECS | Posters on site | BG4.3

Effect of vegetation reestablishment on greenhouse gas emissions from a small headwater stream, Eifel/Lower Rhine Valley (TERENO Network, Germany) 

Maia Batsatsashvili, Roland Bol, Gretchen Gettel, Karsten Kalbitz, and Thomas Pütz

Headwater streams are increasingly recognized as hotspots of greenhouse gas (GHG) emissions within river networks, driven by strong land–water interactions, high biological activity, turbulence, and groundwater inputs. Despite their disproportionate contribution to atmospheric fluxes of CO₂, CH₄, and N₂O, the processes linking GHG emissions to dissolved organic matter (DOM) dynamics along the soil–water continuum remain insufficiently understood, particularly under varying hydrological conditions and land-use change.

This study investigates the interactions between stream GHG emissions and DOM quantity and quality in a forested headwater catchment. The research is conducted in the Wüstebach catchment, located in the Eifel National Park (Germany) and part of the TERENO long-term environmental observation network. Here, we present preliminary results focusing on how hydrology and land cover influence the coupling between GHG dynamics and DOM characteristics.

Water chemistry and GHG samples are collected bi-weekly over one year along about 500 m stream reach, from the source to the gauging station, at ten locations along the main stem and three locations along a nearby control stream. Sampling points are spaced approximately every 100 m and positioned upstream and downstream of tributaries, allowing assessment of spatial variability, tributary inputs, and land-use effects on GHG concentrations and fluxes.

Preliminary results reveal pronounced seasonal and hydrological controls on GHG emissions. Mean CO₂ and N₂O fluxes are higher during winter and autumn, whereas CH₄ fluxes peak during summer. Increasing discharge is associated with enhanced CO₂ and N₂O fluxes in both streams, while CH₄ fluxes show no consistent relationship with discharge. Both dissolved concentrations and atmospheric fluxes of CO₂, CH₄, and N₂O are consistently higher in the clearcut stream compared to the reference stream. In the clearcut area, elevated dissolved organic carbon (DOC) concentrations correlate positively with increased CO₂ concentrations in stream water. In contrast, CO₂ emissions show the expected negative relationship with DOM aromaticity (SUVA₂₅₄) in the reference stream, but this relationship is absent in the clearcut stream, indicating altered DOM processing and carbon turnover following land-use change.

How to cite: Batsatsashvili, M., Bol, R., Gettel, G., Kalbitz, K., and Pütz, T.: Effect of vegetation reestablishment on greenhouse gas emissions from a small headwater stream, Eifel/Lower Rhine Valley (TERENO Network, Germany), EGU General Assembly 2026, Vienna, Austria, 3–8 May 2026, EGU26-16631, https://doi.org/10.5194/egusphere-egu26-16631, 2026.

EGU26-16881 | Posters on site | BG4.3

Eddy covariance measurement of carbon dioxide and methane fluxes from UK inland waters 

Amy Pickard, Carole Helfter, Christopher Barry, Anna Belcher, Eleanor Mackay, Tehri Riutta, Merit van den Berg, Karen Yeung, and Christopher Evans

It is now recognised that freshwater ecosystems are active components of the global carbon cycle, and that human activities have greatly modified natural aquatic biogeochemical processes. In some inland waters, this has led to large greenhouse gas (GHG) emissions to the atmosphere. However, these emissions are highly variable in time and space and are consequently hard to measure at scales required to inform GHG budgets. High-frequency, field-scale monitoring techniques such as eddy covariance offer the potential to capture these important but poorly understood emissions. A network of eddy covariance towers has been established across four UK inland waters, encompassing a Scottish loch, a Northern Irish lough, an English lake and a Welsh reservoir. High temporal resolution methane and carbon dioxide flux data from the respective water bodies have been generated from 2022 onwards.  Fluxes of carbon dioxide exhibited strong seasonality, with uptake occurring in the summer and release to the atmosphere in the winter. Seasonality was less clear for methane fluxes, though highest emissions to the atmosphere generally occurred in the spring and summer. Methane fluxes were positively correlated with chlorophyll-a at sites where supporting water quality data were available, with a statistically significant correlation evident at one site, indicating productivity as a key control on emissions. All sites were net sinks for carbon dioxide and net sources of methane over the monitoring period. This network of eddy covariance flux towers is generating new scientific understanding concerning the processes that drive aquatic fluxes of carbon dioxide and methane, and the contribution of inland waters to national GHG budgets.

How to cite: Pickard, A., Helfter, C., Barry, C., Belcher, A., Mackay, E., Riutta, T., van den Berg, M., Yeung, K., and Evans, C.: Eddy covariance measurement of carbon dioxide and methane fluxes from UK inland waters, EGU General Assembly 2026, Vienna, Austria, 3–8 May 2026, EGU26-16881, https://doi.org/10.5194/egusphere-egu26-16881, 2026.

EGU26-17038 | ECS | Posters on site | BG4.3

Year-long real-time monitoring of methane emissions from a sub-tropical reservoir show the persistence of ebullition 

Brendon Duncan, Nathaniel Deering, Katrin Fluggen, and Alistair Grinham

Methane emissions from reservoirs are dominated by ebullition, which accounts for up to 88 % of global methane emissions from reservoirs. Due to the sporadic nature of ebullition, it is difficult to measure its persistence through an annual cycle. Short-term manual sampling approaches, often consisting of 24-hour floating chamber deployments, cannot adequately capture the long-term patterns and variability in these emissions rates. This induces higher uncertainty when scaled to system-wide total emissions estimates. To address this, three low-cost automated real-time floating chambers, the Monitub system, were deployed in the Borumba Creek inflow arm of Lake Borumba, a sub-tropical reservoir in Queensland, Australia, to monitor emissions over an annual cycle. Monitoring of chlorophyll, temperature and bed pressure was also conducted to explore links to flux rates.

This long-term high temporal resolution data has revealed the presence of ebullition year-round, rather than it being dependent on seasonality. Statistical analysis of the hourly and daily averages shows rates follow a log-normal distribution. Preliminary results show the fit stabilises 6 – 8 months after deployment. This finding provides insight into minimum deployment timelines required for more accurate characterisation of temporal emission patterns.

These insights would not be attainable through traditional manual sampling techniques, but rather a long-term automated monitoring system is required. These systems can capture sporadic events, reduce required labour, and provide higher statistical understanding of methane emissions. These advances can improve total emissions estimates and inform future monitoring programs, which will lead to higher understanding of the contribution of ebullitive rates.

How to cite: Duncan, B., Deering, N., Fluggen, K., and Grinham, A.: Year-long real-time monitoring of methane emissions from a sub-tropical reservoir show the persistence of ebullition, EGU General Assembly 2026, Vienna, Austria, 3–8 May 2026, EGU26-17038, https://doi.org/10.5194/egusphere-egu26-17038, 2026.

EGU26-17284 | Posters on site | BG4.3

CO2 and CH4 emissions from subtropical aquaculture ponds under different management practices 

Qianqian Yang, Yuxin Li, Jiao Liu, and Lishan Ran

Aquaculture ponds, among the fastest-growing inland water bodies, are hotspots of carbon emissions. However, the carbon emissions from aquaculture ponds exhibit significant variability under different management practices, complicating carbon flux quantification. By conducting year-round monthly observations in a fishpond (P1) and a shrimp pond (P2) in subtropical Hong Kong, this study examined their carbon emissions and influencing factors under different management practices. Our results showed that under different management practices, the main drivers of carbon emissions were different. For P1 with low artificial disturbance and increased ecosystem stability, increasing temperature has indirectly reduced CO2 emissions by enhancing photosynthetic intensity while directly promoting CH4 emissions. In comparison, adjustment of water depth and fertilizer application have largely regulated carbon emissions from P2. Consequently, P1 exhibited high primary productivity and functioned as a net CO₂ sink ( -42.33 ± 18.91 mmol m−2 d−1). However, the absence of draining-drying and the presence of a thicker sediment layer in P1 led to stronger CH4 emissions (29.41 ± 27.53 mmol m−2 d−1). Conversely, intensive artificial management practices in P2, including draining, drying, and refilling, have significantly disrupted its primary productivity and shifted it to a CO2 source (62.89 ± 106.61 mmol m−2 d−1) while substantially reducing its CH₄ emissions, especially CH4 ebullition. The total CO2-eq emission flux for P2 was approximately 62% lower than that for P1. This study underscores the substantial impact of human disturbance, especially the draining-drying-refilling practice, on carbon cycle in aquaculture ponds, which should be fully incorporated into future carbon flux estimations.

How to cite: Yang, Q., Li, Y., Liu, J., and Ran, L.: CO2 and CH4 emissions from subtropical aquaculture ponds under different management practices, EGU General Assembly 2026, Vienna, Austria, 3–8 May 2026, EGU26-17284, https://doi.org/10.5194/egusphere-egu26-17284, 2026.

EGU26-17625 | Posters on site | BG4.3

Export, not evasion: the fate of groundwater-derived CO2 in a boreal stream 

Carolina Olid, Demian Hauptmann, Jan Karlsson, and Marcus Klaus

Groundwater is increasingly recognised as a significant source of carbon dioxide (CO2) to streams. However, the fate of this terrestrial CO2, whether it is released locally to the atmosphere or transported downstream, remains unclear. This uncertainty stems from the difficulty of quantifying groundwater inflows on a fine spatial and temporal scale. In this study, we examine the fate of groundwater-derived CO2 along a 400 m reach of a boreal headwater stream by combining high-resolution measurements of groundwater CO2 inputs, CO2 evasion, and downstream CO2 export during the ice-free period (April to September). Groundwater CO2 inputs exhibited strong spatial heterogeneity, spanning more than two orders of magnitude across gaining stream segments (median: 13 g C m-2 d-1, interquartile range (IR): 0.00 – 50 g C m-2 d-1). This variability was primarily driven by differences in groundwater inflow rates associated with local catchment characteristics, such as stream slope. Over time, groundwater CO2 inputs varied by more than one order of magnitude, with pronounced peaks in late April (108 g C m-2 d-1, IQR: 58 – 126 g C m-2 d-1) and late July (136 g C m-2 d-1, IQR: 46 – 175 g C m-2 d-1). In contrast, groundwater CO₂ inputs remained consistently low during baseflow conditions in mid-July (10 g C m-2 d-1, IQR: 7.1 – 18 g C m-2 d-1) and late August (16 g C m-2 d-1, IQR: 6.6 – 31 g C m-2 d-1). The seasonal variability in groundwater CO2 inputs was driven by two contrasting mechanisms: a spring peak mainly caused by increased groundwater discharge during snowmelt, despite relatively low CO2 concentrations in the groundwater, and summer and autumn peaks linked to rainfall events and higher CO2 concentrations in the groundwater, likely reflecting increased soil respiration. Throughout the study period, the median value of groundwater CO2 inputs exceeded the median value of CO2 evasion (3.0 g C m-2 d-1, IQR: 1.9 – 3.0 g C m-2 d-1) by a factor of 20 and was of the same order of magnitude as downstream CO2 export (76 g C m-2 d-1, IQR: 46 – 300 g C m-2 d-1). These results demonstrate that a substantial proportion of the CO2 derived from groundwater in headwater streams is not immediately emitted, but instead redistributed along the stream network, where it can contribute to downstream emissions or biogeochemical processing. Our findings highlight the need for integrative assessments of CO2 fluxes, which explicitly account for groundwater inflows, atmospheric emissions, and downstream export, particularly in the context of climate-driven changes to hydrology and terrestrial carbon cycling.

How to cite: Olid, C., Hauptmann, D., Karlsson, J., and Klaus, M.: Export, not evasion: the fate of groundwater-derived CO2 in a boreal stream, EGU General Assembly 2026, Vienna, Austria, 3–8 May 2026, EGU26-17625, https://doi.org/10.5194/egusphere-egu26-17625, 2026.

EGU26-17923 | ECS | Orals | BG4.3

Spatial heterogeneity of water surface carbon dioxide and methane fluxes in a subarctic catchment 

Judith Vogt, Elliot Pratt, Nicholas Eves, Chiara Gruber, Lara Oxley, Kseniia Ivanova, Sanjid Backer Kanakkassery, Elias Wahl, Theresia Yazbeck, Abdullah Bolek, Nathalie Ylenia Triches, Mark Schlutow, Martin Heimann, and Mathias Göckede

Water surface fluxes of carbon dioxide (CO2) and methane (CH4) show significant variation in space and time. Spatial variability in flux rates can, for example, be introduced by gradients in bathymetry, coverage by vegetation with different community structure, or lateral influx from connected groundwater bodies. The resulting variability in carbon cycle processes makes it difficult to estimate net lake flux budgets based on a low number of small scale sampling points, while integrated signals from coarser resolution observations are difficult to interpret as they combine multiple source and sink types. Due to a lack of observational data, especially at high spatial resolution, uncertainties of water-air fluxes of CO2 and CH4 in freshwater ecosystems are therefore large. This is problematic, especially in regions of high northern latitudes, where the density of inland waterbodies is very high.

To better capture spatially heterogeneous flux patterns, we measured the surface carbon fluxes accompanied by meteorological, hydrochemical and bathymetric measurements with the BlueMinerva, an autonomous floating platform,across a network of lakes during the StordalenX25 campaign in northern Sweden.

We obtained more than 1,000 spatially distributed flux estimates over a measurement period of two weeks. In comparison to terrestrial fluxes in the mire, CO2 and CH4 fluxes from freshwater were low. For CO2 fluxes, fluorescent dissolved organic matter and pH were the strongest drivers overall, while the specific conductivity at the water surface explained most of the CH4 flux variability across the network according to a random forest model. Furthermore, flux patterns may also be influenced by the fraction of each lake’s area covered by macrophytes, as derived from satellite imagery. For both gases, differences of flux estimates between the studied lakes were significant, which is particularly interesting for four of the lakes which are interconnected by small channels. 

Overall, this study demonstrates the importance of resolving heterogeneous carbon fluxes at small spatial scales for accurately estimating associated carbon budgets.

How to cite: Vogt, J., Pratt, E., Eves, N., Gruber, C., Oxley, L., Ivanova, K., Backer Kanakkassery, S., Wahl, E., Yazbeck, T., Bolek, A., Triches, N. Y., Schlutow, M., Heimann, M., and Göckede, M.: Spatial heterogeneity of water surface carbon dioxide and methane fluxes in a subarctic catchment, EGU General Assembly 2026, Vienna, Austria, 3–8 May 2026, EGU26-17923, https://doi.org/10.5194/egusphere-egu26-17923, 2026.

EGU26-18186 | ECS | Posters on site | BG4.3

N2O dynamics in surface sediments of a seasonally euxinic coastal basin 

Marit R. van Erk, Isabel M. L. Rigutto, Pedro Leão, Caroline P. Slomp, and Mike S. M. Jetten

The eutrophication and deoxygenation of coastal systems can severely impact the biogeochemistry of surface sediments, and can lead to oxygen limitation and sulfide accumulation. Changes in oxygen and sulfide availability may have large effects on the sedimentary dynamics of the potent greenhouse gas nitrous oxide (N2O), and thus on N2O fluxes between sediments and the overlying water column. Here, we used a combination of porewater and microsensor measurements, batch incubations, and metagenome and metatranscriptome analyses to assess the effect of oxygen and sulfide on N2O production and consumption processes in surface sediments of a seasonally euxinic coastal system. In spring, our study system (Lake Grevelingen, The Netherlands) is characterized by oxygenated bottom waters and surface sediments, while water column stratification in summer leads to euxinic bottom waters and highly sulfidic surface sediments (mM concentrations). An absence of net N2O production in spring sediment was consistent with an in situ limitation of oxygen and NOx. Batch incubations showed that despite this in situ limitation, the microbial community maintained the potential for nitrification and N2O production through denitrification. The nosZ gene, which is responsible for N2O consumption, was present and expressed by a diverse microbial community dominated by clade II nosZ-possessing Flavobacteriia. Sulfidic summer conditions were simulated in batch incubations via sulfide additions. At low mM sulfide concentrations N2O consumption was enhanced, while higher sulfide concentrations halted most of the studied nitrogen cycling processes. Hence, restoration of coastal systems by re-oxygenation could affect N2O dynamics by changing oxygen, NOx and sulfide availability, which would have implications for the role these sediments play in N2O exchange with overlying waters.

How to cite: van Erk, M. R., Rigutto, I. M. L., Leão, P., Slomp, C. P., and Jetten, M. S. M.: N2O dynamics in surface sediments of a seasonally euxinic coastal basin, EGU General Assembly 2026, Vienna, Austria, 3–8 May 2026, EGU26-18186, https://doi.org/10.5194/egusphere-egu26-18186, 2026.

EGU26-19847 | Posters on site | BG4.3

Coupled CH4, CO2, and N2O cycling in a subsurface serpentinising system 

Yueyue Si, Michael Stocker, Joanna Shannon, Juerg Matter, and Phyllis Lam

Serpentinising systems are among the most plausible environments for life’s emergence, where reactions between water and ultramafic rocks generate hydrogen, methane, and simple organics that could have fuelled early metabolisms. These reactions create highly alkaline fluids and steep pH–redox gradients that persist today, sustaining diverse microbial processes that regulate greenhouse gas fluxes. Here, we examined subsurface fluids from the Samail Ophiolite (Oman), the world’s largest and best-exposed terrestrial serpentinising system, to characterise greenhouse gas dynamics and their interconnections across contrasting geochemical conditions. CH4 concentrations increased markedly with pH and were highly supersaturated (up to 48,000× atmospheric equilibrium) in reduced, hyperalkaline fluids (pH > 11), indicating strong net production. In contrast, CO2 concentrations decreased with pH, consistent with substantial CO2 consumption and carbonate precipitation under hyperalkaline conditions, whereas CO2 remained elevated in pH-neutral, oxidised fluids. N2O concentrations were low (0.001–1.5 μM) and showed strong net consumption under hyperalkaline, reducing conditions. However, addition of CH4 alongside 15N-nitrite stimulated N2O production — up to 72-fold higher in hyperalkaline fluids, revealing a mechanistic link between CH4 and N2O cycling. Isotopic data (45N2O, 46N2O) further indicated depth- and pH-dependent shifts in dominant N2O pathways. Our findings show that interactions between geological and microbial processes control the balance of greenhouse gas production and consumption in serpentinising systems. These insights illuminate how life and geochemistry interact under extreme conditions, with implications for modern CO2 storage strategies and ancient Earth environments.

How to cite: Si, Y., Stocker, M., Shannon, J., Matter, J., and Lam, P.: Coupled CH4, CO2, and N2O cycling in a subsurface serpentinising system, EGU General Assembly 2026, Vienna, Austria, 3–8 May 2026, EGU26-19847, https://doi.org/10.5194/egusphere-egu26-19847, 2026.

EGU26-19877 | ECS | Orals | BG4.3

Headwater streams as major interfaces for greenhouse gas emissions in agricultural landscapes 

Camille Vautier, Doralou Béraud, Pratik Gokhale, Barbara Yvard, Eliot Chatton, Rock S Bagagnan, and Anniet M Laverman

Accurate estimates of greenhouse gas (GHG) emissions from agricultural landscapes are essential to guide effective climate mitigation measures. While CO₂ dominates riverine GHG fluxes in terms of mass, N₂O is of particular concern due to its high global warming potential and its role as the most important ozone-depleting substance currently emitted. Although agricultural soils are recognized as major sources of both gases, the contribution of small streams draining agricultural landscapes remains poorly constrained. Indeed, headwater streams are still insufficiently characterized in terms of their biogeochemical functioning, leading some authors to describe them as an “Aqua Incognita”. Experimental studies indicate that gas exchange rates between headwater streams and the atmosphere are often underestimated, suggesting that GHG emissions from small agricultural catchments may be overlooked. Because headwater streams drain approximately 70% of the terrestrial surface, underestimating their contribution may lead to substantial biases in global assessments of GHG emissions from terrestrial and freshwater ecosystems.

This study investigates the role of agricultural headwater streams in CO₂ and N₂O emissions. Dissolved CO₂ and N₂O concentrations were measured along multiple streams and across multiple spatial scales in Brittany (France), using gas chromatography with electron capture detection (GC-ECD). Measurements were combined with groundwater tracers such as radon (222Rn) and dissolved silica (DSi) to identify the origin of CO2 and N2O. In addition, in situ gas tracer experiments were conducted to quantify gas exchange rates with the atmosphere using a continuous-flow membrane inlet mass spectrometer (CF-MIMS) deployed in a mobile field laboratory.

Results show that agricultural headwater streams are consistently supersaturated with both CO₂ and N₂O, with concentrations largely controlled by local groundwater discharge. Emissions of CO₂ and N₂O occur almost entirely within the first few hundred meters of the stream network due to rapid gas exchange, suggesting that downstream measurements tend to underestimate riverine GHG fluxes. By combining high-resolution field observations with regional scaling and a first-order global extrapolation, we estimate that headwater streams contribute a substantial fraction of lotic N₂O emissions. These findings identify the upper reaches of streams as critical interfaces between groundwater GHG and the atmosphere, and thus as overlooked hotspots of GHG release.

How to cite: Vautier, C., Béraud, D., Gokhale, P., Yvard, B., Chatton, E., Bagagnan, R. S., and Laverman, A. M.: Headwater streams as major interfaces for greenhouse gas emissions in agricultural landscapes, EGU General Assembly 2026, Vienna, Austria, 3–8 May 2026, EGU26-19877, https://doi.org/10.5194/egusphere-egu26-19877, 2026.

EGU26-20599 | ECS | Posters on site | BG4.3

Triple-isotopic source fingerprinting of dissolved and bubble-held methane across the East Siberian Arctic Shelf Seas 

Marenka Brussee, Henry Holmstrand, Birgit Wild, Denis Kosmach, Denis Chernykh, Arkadiy Kurilenko, Natalia Shakhova, Igor Semiletov, and Örjan Gustafsson

The shallow East Siberian Arctic Shelf (ESAS) is the World’s largest shelf sea system and overlies a complex sedimentary drape that includes thawing subsea permafrost, methane hydrates, and gas and oil reservoirs. Uncertain estimates suggest that the ESAS releases as much methane to the atmosphere as the rest of the World Ocean; yet the relative contributions from different sources are poorly constrained—a prerequisite for anticipating future release trajectories. Here, multi-year source-diagnostic triple-isotopic compositions (δ¹³C, δ²H, and Δ¹⁴C) of seawater-dissolved and ebullitive methane show that methane contributions vary greatly across the ESAS, with the subsea permafrost-associated biogenic methane pools only standing for one-tenth (Outer Laptev Sea), three-tenths (East Siberian Sea), and six-tenths (Inner Laptev Sea) of the total methane releases. For the East Siberian Sea and the Outer Laptev Sea, distinct fossil gas seeps of different origins were identified. Multi-year constancy in each regime’s isotopic fingerprints of ebullitive and dissolved methane and concentration patterns suggests that bubble dissolution is the primary source of elevated methane levels below and above the pycnocline. Furthermore, the high methane concentrations in bubbles reaching the sea surface (80±22%) indicate direct release of methane from the seabed into the atmosphere via ebullition, thereby going past potential microbial degradation. While it is complicated to include both ebullition and the diversity of methane sources in methane budgets, it appears critical for predicting methane release trajectories in the ESAS region and, consequently, their contribution to the increasing atmospheric methane pool.

How to cite: Brussee, M., Holmstrand, H., Wild, B., Kosmach, D., Chernykh, D., Kurilenko, A., Shakhova, N., Semiletov, I., and Gustafsson, Ö.: Triple-isotopic source fingerprinting of dissolved and bubble-held methane across the East Siberian Arctic Shelf Seas, EGU General Assembly 2026, Vienna, Austria, 3–8 May 2026, EGU26-20599, https://doi.org/10.5194/egusphere-egu26-20599, 2026.

EGU26-20871 | ECS | Posters on site | BG4.3

Advancement in Smart Monitoring of Greenhouse Gases: An IoT Approach for Inland Waterbodies 

Ankit Bara, Shishir Gaur, and Shyam Bihari Dwivedi

Inland aquatic ecosystems, including rivers, lakes, and reservoirs, play an active but still poorly constrained role in the global carbon cycle by acting as both sources and sinks of greenhouse gases such as CO₂, CH₄, and N₂O. Quantifying these emissions remains difficult because aquatic biogeochemical processes vary strongly over short spatial and temporal scales, while commonly used monitoring approaches—such as infrequent manual sampling or costly stationary installations—often fail to resolve rapid changes associated with diel cycles, hydrological events, or transient mixing conditions that can contribute disproportionately to annual fluxes. To overcome these limitations, we developed a scalable, open-architecture Internet of Things (IoT) monitoring system for continuous, high-resolution observation of aquatic greenhouse gas dynamics, built around a Raspberry Pi–based edge-computing unit coupled with calibrated gas sensors (NDIR for CO₂ and a semiconductor-based sensor for CH₄) and supporting environmental sensors for temperature, pressure, and relative humidity. Data are transmitted in near real time to a cloud-based dashboard, enabling remote system diagnostics, immediate visualization, and rapid identification of anomalous events, rather than relying on delayed, site-based data retrieval. Initial field deployments show that this high-frequency approach captures short-term variability in gas concentrations that is largely missed by discrete sampling, highlighting the importance of temporal resolution for inland water GHG assessments. By providing a flexible and cost-effective alternative to conventional reference stations, this system offers a practical route toward denser observation networks, improved model validation, and more reliable carbon budget estimates in heterogeneous freshwater environments.

How to cite: Bara, A., Gaur, S., and Dwivedi, S. B.: Advancement in Smart Monitoring of Greenhouse Gases: An IoT Approach for Inland Waterbodies, EGU General Assembly 2026, Vienna, Austria, 3–8 May 2026, EGU26-20871, https://doi.org/10.5194/egusphere-egu26-20871, 2026.

EGU26-20955 | ECS | Orals | BG4.3

Vegetation marginally offsets the CO2 emissions from dry inland waters 

Krati Sharma, Soren Brothers, Susana Bernal, Núria Catalán, Philipp Keller, Matthias Koschorreck, Sarian Kosten, Catherine Leigh, Daniel von Schiller, and Rafael Marcé

Exposed sediments from dry inland waters are an important component of the global carbon cycle, and their extent is increasing worldwide due to climate change and intensified human water use. These dry sediments often become colonized by terrestrial vegetation, which can counterbalance the mineralization of exposed organic matter through photosynthesis, thereby reducing overall CO2 emissions. However, current CO2 flux estimates from dry sediments are largely derived from bare sediments, meaning that the potential role of vegetation has been overlooked. To assess the role of vegetation in modulating CO2 fluxes from dry sediments, we conducted a global study across 164 dry inland waterbodies (including lakes, ponds, reservoirs, streams, and wetlands) spanning a wide range of climatic regions from arid to polar. At each site, we measured CO2 fluxes from vegetated and bare dry sediments using a standardized chamber-based method under two conditions: dark (capturing respiration only) and light (capturing both respiration and photosynthesis). On average, within vegetated zones, vegetation occupied 47 ± 35% in measured biomass quadrants.

Our results showed that under light conditions, instantaneous CO2 fluxes were lower in vegetated sediments (mean ± SD = – 3.7 ± 12.9 mmol CO2 m⁻² h⁻¹) compared to bare sediments (5.4 ± 12.7 mmol CO2 m⁻² h⁻¹), suggesting that photosynthesis contributed to decrease CO2 emissions to the atmosphere. In contrast, under dark conditions, vegetated sediments exhibited larger positive CO2 fluxes (14.7 ± 20.1 mmol CO2 m-2 h-1) than bare sediments (5.4 ± 8.2 mmol CO2 m-2 h-1), likely due to plant respiration. Across ecosystem types and climatic zones, average net CO2 emissions over a full diel cycle were 25% (± 358) lower from vegetated than from bare sediments, indicating that vegetation can partially offset sediment respiration.

Upscaling these fluxes to the ecosystem level considering vegetation cover, revealed that all waterbody types still function as net carbon sources. When exploring the potential effect of vegetation on previously published estimates only based on bare sediments, we found that global CO2 fluxes from dry sediments could be suppressed by 10% (± 111%) due to the effect of vegetation.

How to cite: Sharma, K., Brothers, S., Bernal, S., Catalán, N., Keller, P., Koschorreck, M., Kosten, S., Leigh, C., von Schiller, D., and Marcé, R.: Vegetation marginally offsets the CO2 emissions from dry inland waters, EGU General Assembly 2026, Vienna, Austria, 3–8 May 2026, EGU26-20955, https://doi.org/10.5194/egusphere-egu26-20955, 2026.

EGU26-21670 | ECS | Posters on site | BG4.3

Carbon dynamics in tropical blackwater rivers: Contrasting CO₂ drivers between coastal Southeast Asia and inland Amazonia 

Alexandra Klemme, Thorsten Warneke, Tim Rixen, Carla Estefani Batista, Jonismar Souza da Silva, Luciana Rizzo, Rafael Lopes e Oliveira, Sergio Duvoisin Junior, Bruce Forsberg, Susan Trumbore, and Hella van Asperen

Blackwater rivers have a characteristic dark water color and contain high concentrations of dissolved organic carbon (DOC), while exhibiting low pH and nutrient levels. They typically act as sources of carbon dioxide (CO₂) to the atmosphere. Although blackwater rivers occur throughout the tropics, their carbon dynamics vary geographically. In this study, we compare rivers in Southeast Asia (Sumatra and Borneo) and the Amazon (Rio Negro basin), covering a range of wetland and peat influence. Using in situ measurements of CO₂ concentrations alongside associated water chemistry, we investigate riverine carbon dynamics and the key drivers of CO₂ in these two regions. In Southeast Asia, blackwater rivers show elevated CO₂ concentrations and fluxes, driven by labile DOC from thick coastal peat deposits, with levels generally increasing with wetland coverage. In contrast, the Rio Negro exhibits more moderate CO₂ concentrations despite similar levels of soil-derived organic carbon. Measurements in 2023 reveal no positive correlation between wetland extent and CO₂, indicating a weaker dependence on peatland-derived DOC. Comparative analyses of DOC, pH, and O₂ suggest that wetland influences on water chemistry are broadly similar across the regions, yet CO₂ concentrations in the Rio Negro remain substantially lower than in Southeast Asian rivers with comparable wetland coverage. These intercontinental contrasts highlight the role of peatland origin and biogeochemistry in regulating tropical river CO₂ emissions and are essential for improving global estimates of carbon fluxes and their sensitivity to environmental change.

How to cite: Klemme, A., Warneke, T., Rixen, T., Estefani Batista, C., Souza da Silva, J., Rizzo, L., Lopes e Oliveira, R., Duvoisin Junior, S., Forsberg, B., Trumbore, S., and van Asperen, H.: Carbon dynamics in tropical blackwater rivers: Contrasting CO₂ drivers between coastal Southeast Asia and inland Amazonia, EGU General Assembly 2026, Vienna, Austria, 3–8 May 2026, EGU26-21670, https://doi.org/10.5194/egusphere-egu26-21670, 2026.

EGU26-745 | ECS | Posters on site | BG4.4

Transgression and Transformation: Methane Cycling in Thawing Arctic Coastal Landscapes 

Joshua Hellmann, André Pellerin, Dustin Whalen, Lisa Bröder, Inda Brinkmann, Peter Heintzman, and Julie Lattaud

About one-third of the world’s coastline is classified as permafrost. Increased erosion promotes abrupt thaw along these shorelines, leading to remobilization and enhanced microbial degradation of previously stored organic matter. With rising sea levels, coastal thermokarst lakes may be inundated by seawater, causing a gradual transformation into marine-influenced lagoons. Depending on the connectivity of the lagoon to the open sea, methanogenic communities are exposed to high concentrations of ions, especially sulfate, which promotes the establishment of competitive anaerobic methanotrophic archaea and sulfate-reducing bacteria consortia and thus leads to shifts in the composition and activity of the microbial community (Yang et al., 2023). Previous research focusing on surface sediments from lagoon systems in the Canadian Arctic found the highest total greenhouse gas production in the initial stage of the transition (Jenrich et al., 2025) while surface soil samples from a land-sea transect showed highest methane production rates in the active layer of the intertidal zone (Roy-Lafontaine et al., 2025). However, questions remain regarding the effects of marine inundation on the microbial community and the associated carbon dynamics of erosion-affected coastal environments. Here, we use vertical sediment profile incubations from thermokarst lakes, the coastal ocean, and soils from an intertidal zone near the community of Tuktoyaktuk, located in the Inuvialuit Settlement Region (NWT, Canada). We performed anoxic long-term incubation experiments under in situ (freshwater) and marine conditions to simulate saltwater intrusion. Corresponding methane and carbon dioxide production rates were monitored by monthly measurements. In addition, we analyzed sedimentary pore-water nutrient and metal concentrations, along with bulk organic matter characteristics (TOC, δ13C, lability), to examine potential relationships between initial redox conditions, organic matter quantity and quality, and greenhouse gas production. Additionally, we investigated potential shifts in the microbial community during the incubation by 16S rRNA sequencing. Preliminary results of the first months of incubation indicate that freshwater lakes located further away from the coastline show higher production rates under in situ compared to marine conditions. In contrast, negligible production rates were found for a marine-influenced lagoon. This pattern suggests a shift in the microbial community from a dominance of methanogens in freshwater lakes to the establishment of methanotrophs as a consequence of increased marine influence. As a result, rising sea levels may decrease methane emission rates from coastal lakes.

References:

Jenrich, M., et al. (2025). Biogeosciences, 22, 2069–2086.

Roy-Lafontaine, A., et al. (2025) EGUsphere [preprint], https://doi.org/10.5194/egusphere-2025-2570.

Yang, S., A et al. (2023). Global Change Biology, 29, 2714–2731.

How to cite: Hellmann, J., Pellerin, A., Whalen, D., Bröder, L., Brinkmann, I., Heintzman, P., and Lattaud, J.: Transgression and Transformation: Methane Cycling in Thawing Arctic Coastal Landscapes, EGU General Assembly 2026, Vienna, Austria, 3–8 May 2026, EGU26-745, https://doi.org/10.5194/egusphere-egu26-745, 2026.

EGU26-2756 | ECS | Orals | BG4.4

How Resilient is the Seagrass Nitrogen Cycle to Moderate Nutrient Enrichment? 

Tijs Joling, Mona A. Andskog, Naomi S. Wells, Jack J. Middelburg, and Joanne M. Oakes

Seagrass meadows are highly productive systems that act as important nitrogen (N) sinks in the coastal zone. However, this service can be impacted by anthropogenic nutrient enrichment, which can increase the release of the greenhouse gas nitrous oxide. Anthropogenic climate change and coastal development will make moderate nutrient enrichment more commonplace in the future. Unlike high nutrient enrichment, our understanding of the impact of this moderate nutrient enrichment on N pathways in seagrass meadows is limited. In this study the water column above Australian seagrass patches (Cymodocea serrulata) was experimentally enriched in situ with N-P-K fertilizer, delivering 0.12 g N m-2 day-1 for 75 days. From days 35 to 75 of nutrient enrichment, an in situ 15N pulse-chase experiment was conducted to compare N uptake and capture by seagrass, epiphytes, and sediment within nutrient-enriched and ambient patches. Simultaneously, the effect of nutrient enrichment on dissimilatory N pathways was measured using three incubation methods: sediment slurries, intact sediment cores, and in situ benthic chambers. 15N-labelling indicated that moderate nutrient enrichment enhanced N uptake by epiphytes (median increased from 9.9 ± 1.5% to 19.9 ± 5.2% of 15N label) and lowered N storage in belowground tissue (median decreased from 5.9 ± 0.5% to 3.9 ± 1.9% of 15N at experiment end). Slurry incubations revealed that the potential denitrification rate in sediment was enhanced by nutrient enrichment. However, the more representative, intact sediment core and in situ incubations showed no change in denitrification rate due to nutrient-enrichment. Furthermore, denitrification was of minor importance in both the core and in situ incubations, while dissimilatory reduction of nitrate to ammonium (DNRA) was the dominant NO3- consuming pathway regardless of nutrient treatment. Moderate nutrient enrichment did not alter the rate of nitrous oxide production in the sediment, nor did it increase nitrous oxide flux from the sediment to the water. Our findings support the idea that seagrass functions as a buffer against nutrient enrichment, preventing drastic changes to dissimilatory N pathways. While moderate nutrient enrichment does not induce additional nitrous oxide release, it does decrease the long-term N storage efficiency of seagrass meadows.

How to cite: Joling, T., Andskog, M. A., Wells, N. S., Middelburg, J. J., and Oakes, J. M.: How Resilient is the Seagrass Nitrogen Cycle to Moderate Nutrient Enrichment?, EGU General Assembly 2026, Vienna, Austria, 3–8 May 2026, EGU26-2756, https://doi.org/10.5194/egusphere-egu26-2756, 2026.

EGU26-4073 | Orals | BG4.4

Microbial and Geochemical Architecture of an Active Scotian Slope Cold Seep 

G Todd Ventura, Elish Redshaw, Gamra Oueslati, Unyime Umoh, Natasha MacAdam, Patricia Granados, Jeremy Bentley, Narges Ahangarian, Robbie Bennett, Venus Baghalabadi, Martin Fowler, and Adam MacDonald

Deep marine cold seeps occurring along the seabed of continental margins are identified by the oasis-like ecosystems that are largely fueled by the chemical energy of the venting fluids.  Seep site 2A-1, situated at ~2500 m water depth on the Scotian Slope of the North Atlantic was discovered in 2021. The seep hosts a large mussel encrusted, carbonate mound with biogenic methane bubbling up from a single vent. The emitted biogenic methane is primarily sourced from ~1 km below the seafloor within the basin bedrock that resides directly above the crest of an underlying salt diapir. A 600-m long transect composed of six push cores was collected across the seep structure. Downcore porewater ions and lipidomic profiles of twenty-four predominantly archaeal in origin lipid classes were tentatively identified and quantified across the transect. The resolved lipidomes comprised of intact polar lipids, core lipids, core lipid degradation products, and photosynthetic pigments.  These data were compiled as two-dimensional heatmaps to spatially examine vertical and lateral changes in the subsurface geochemical and microbiological architecture of the seep. Microbially mediated metabolic zones of elevated heterotrophy, denitrification, microbial sulfate reduction, and anaerobic methane oxidation were then mapped across the seep structure based on an integrated analysis of porewater geochemistry, bulk organic matter and its carbon isotope compositions, lipidomic diversity and biomarker proxy patterns. Increased lipidomic diversity is shown to exist within the seep particularly at boundaries of high lateral geochemical gradients.  Biomarker lipid proxies indicate a microbial community dominated by ANME-1 and -2/-3 archaea and high level of sulfate driven anaerobic oxidation of methane that is mixed with, but also surrounded by, an envelope of microbial sulfate reduction. Spatial changes in the stratified system highlight the complex interplay of micro- and macro-seepage and provide insights into the seep’s evolution and impact on microbial dynamics across the carbonate structure.

How to cite: Ventura, G. T., Redshaw, E., Oueslati, G., Umoh, U., MacAdam, N., Granados, P., Bentley, J., Ahangarian, N., Bennett, R., Baghalabadi, V., Fowler, M., and MacDonald, A.: Microbial and Geochemical Architecture of an Active Scotian Slope Cold Seep, EGU General Assembly 2026, Vienna, Austria, 3–8 May 2026, EGU26-4073, https://doi.org/10.5194/egusphere-egu26-4073, 2026.

EGU26-4659 | ECS | Posters on site | BG4.4

Lake size shapes the temperature dependence of methane emissions in cryosphere lakes 

Chunlin Song, Genxu Wang, Cristian Gudasz, R. Iestyn Woolway, Hongyang Chen, Yang Li, and Jan Karlsson

Lakes in cryospheric regions are increasingly recognized as important but uncertain contributors to global methane (CH4) budgets. Because CH4 production and release are highly temperature sensitive, rapid warming in cryospheric regions is expected to amplify lake emissions and play a substantial role in climate feedback mechanisms. However, the response of CH4 emissions in cryosphere lakes to warming across lake sizes remains underexplored. Using a large, standardized dataset spanning a broad range of lake sizes, we show that diffusive and ebullitive CH4 fluxes display higher apparent temperature dependences in larger and deeper lakes compared to smaller and shallower systems. These results demonstrate that lake surface area and depth amplify the temperature dependence of CH4 emissions. Our findings highlight the importance of accounting for lake-size structure when assessing future CH4 dynamics under accelerated cryosphere warming and shifting lake extent.

How to cite: Song, C., Wang, G., Gudasz, C., Woolway, R. I., Chen, H., Li, Y., and Karlsson, J.: Lake size shapes the temperature dependence of methane emissions in cryosphere lakes, EGU General Assembly 2026, Vienna, Austria, 3–8 May 2026, EGU26-4659, https://doi.org/10.5194/egusphere-egu26-4659, 2026.

EGU26-6346 | ECS | Orals | BG4.4

Circum-Arctic Patterns of Proxy-Derived Methane Release from Shelf Sediments 

Albin Eriksson, Birgit Wild, Wei-Li Hong, and Örjan Gustafsson

Enhanced methane cycling has been observed in various regions of the Arctic Ocean. Particularly, hotspots of high seawater methane concentrations in the surface waters of the Laptev and East Siberian seas highlight the risk of this methane to serve as an atmospheric source and further exacerbate climate warming. While seawater methane observations display the general distribution patterns within this region, the measurements are often compromised by the timing of expeditions and the frequent storm ventilation of the water column in these remote and shallow regions. Consequently, there is a need for an assessment of “long-term” methane cycling to better assess the geospatial patterns of methane cycling in the Arctic Ocean. Complementary tools such as compound-specific isotope analysis (CSIA) of hopanoid biomarkers has been suggested as a proxy to trace such regions of enhanced methane cycling. To investigate the long-term methane cycling over recent years in these areas, we quantified tracers of aerobic methane oxidation (C30 hopanoids; n=154) in surface sediments and, in a subset, their stable isotope compositions across the circum-Arctic shelf seas. The highest hopanoid concentrations were observed in the Laptev, East Siberian Seas and the Kara Sea together with methane indicating isotope compositions. Additionally, high hopanoid concentrations were widely accompanied by elevated concentrations of methane in the overlying seawater. However, local hotspots of elevated methane concentrations were also present in the Herald Canyon, Beaufort Sea, and in south-western Svalbard, yet C30 hopanoids in these regions did not corroborate the abundance of long-term enhanced methane cycling. Taken together, we display the first circum-Arctic assessment of seawater methane cycling through time-integrated measurements, highlighting regions and hotspots of enhanced methane cycling.

How to cite: Eriksson, A., Wild, B., Hong, W.-L., and Gustafsson, Ö.: Circum-Arctic Patterns of Proxy-Derived Methane Release from Shelf Sediments, EGU General Assembly 2026, Vienna, Austria, 3–8 May 2026, EGU26-6346, https://doi.org/10.5194/egusphere-egu26-6346, 2026.

Pure whisky condenses from wash heated in a still as a clear liquid, the same translucency of pore waters that typically emerge from marine sediment pressed through a squeezer. How then to share and to understand the commonality of golden fluids from Celtic lands and methane-charged sediment sequences on continental margins? Ocean Drilling Program (ODP) Leg 164 investigated gas hydrates at Sites 994, 995 and 997 on Blake Ridge. These sites hold considerable methane as dissolved gas, free gas and gas hydrate in a "diffusion-dominated system", one characterized by carbon and methane cycling within sediment over millions of years. Notes from this expedition indicate that pore waters squeezed from samples collected tens to hundreds of meters below the seafloor and passed through a <45 mm filter exhibit a "whisky-colour", but no further examination occurred. Site 1230 (ODP Leg 201) and Site 1244 (ODP Leg 204) targeted gas hydrates in diffusion-dominated systems on the Peru Margin and Hydrate Ridge. For these locations, "yellowness" was determined on a Cary-100 UV-VIS spectrophotometer at 325 nm relative to a well-known standard: Johnnie Walker Black Label (JWBL). The standard was selected because of its carefully crafted blend of reproducible colour and wide availability. Colour profiles of filtered pore water from sites 1230 and 1244 display maximum yellowness several tens of metres below the seafloor and smooth curvature, consistent with addition and removal of dissolved constituents at depth combined with diffusion. The yellowness profiles have similar shapes to each other and to those of alkalinity, but the depths and values of the subsurface maxima vary. At Site 1230, yellowness and alkalinity increase from 0 JWBL and ~2 mM to peaks of ~0.7 JWBL and ~160 mM at 70 mbsf; at Site 1244, values grow downwards to ~0.2 JWBL and 50 mM at 40 mbsf. Similar results were determined across nine IODP Expedition 346 locations in the marginal sea between Japan and Korea. This work, however, measured intensity at multiple wavelengths, each which generate a slightly different profile. Pore water "yellowness" apparently derives from multiple molecules released at different burial depth and time. Presumably, somewhat like whisky and seawater, continental margin pore waters can contain significant amounts of coloured dissolved organic matter (CDOM), which is generated, along with methane and alkalinity, through microbial decomposition of solid organic carbon and intermediary compounds. Moreover, the specific composition and amount of CDOM changes with depth across locations. Colour, alkalinity and methane concentrations in pore space are related, but complexly, because processes can separate dissolved constituents over space and time. For diffusion dominated systems that evolve over millions of years without advective loss and seepage, methane and alkalinity can reach extreme concentrations, and the colour can become remarkably close to that of JWBL, as determined at 325 nm wavelength. In any case, water colour should be determined routinely on pore waters, as it  helps to constrain the cycling of carbon (including methane) in continental margin sediment sequences.

How to cite: Dickens, G. R.: Golden Fluids: On the Colour and Origin of Liquids from Celtic Lands and in Methane Charged Sediment Sequences, EGU General Assembly 2026, Vienna, Austria, 3–8 May 2026, EGU26-6373, https://doi.org/10.5194/egusphere-egu26-6373, 2026.

EGU26-6836 | ECS | Posters on site | BG4.4

Component-specific oyster-mediated modular nitrous oxide turnover 

Rongxin Liu and Qixing Ji

As an important and rapidly developing agricultural industry worldwide, oyster aquaculture helps mitigate the coastal eutrophication by denitrification, a process which produces nitrous oxide (N2O). Yet it is not presently possible to quantify the N2O flux associated with oyster farming in transitional water bodies. Incubations using nitrate and nitrite as the substrates complemented with functional gene screening confirm net anaerobic N2O production in oyster digestive tract. The N2O production rate could be positively regulated by nitrate and nitrite availabilities and temperature. Surprisingly, oyster’s digestive tract is an unexpected N2O source due to the inability of N2O reduction to N2. In comparison, the oyster shell-associated biofilm and attached particulate matter (APM) can perform complete denitrification, thus offsetting net N2O production by digestive tract. Such a net N2O consumption is more effective under lower oxygen condition. However, high availabilities of nitrite and nitrate in the water column may lower the N2O sink capacity, even ceasing N2O consumption. This study elucidates a modular N2O turnover that is specific to the compartments inside and outside of oysters, providing insights into the environmental controls about dynamic N2O source or sink associated with shellfish-microbe interactions.

How to cite: Liu, R. and Ji, Q.: Component-specific oyster-mediated modular nitrous oxide turnover, EGU General Assembly 2026, Vienna, Austria, 3–8 May 2026, EGU26-6836, https://doi.org/10.5194/egusphere-egu26-6836, 2026.

EGU26-8152 | Posters on site | BG4.4

Successional stages of methane seep systems off central Chile: from active sediment-hosted seepage to fossil carbonate chemoherms 

Tina Treude, Peter Linke, Volker Liebetrau, Florian Scholz, Philip Steeb, Jacob Geersen, Mark Schmidt, Stefan Sommer, Lorenzo Rovelli, Lee Bryant, and Jan Scholten

Methane seeps along active continental margins record the interaction between fluid flow, biogeochemical processes, benthic ecosystems, and tectonic forcing. Here we present an integrated analysis of methane seep environments from the Concepción Methane Seep Area (CMSA) on the central Chile margin (~36°S), combining seafloor imagery, multibeam bathymetry, sediment biogeochemistry, authigenic carbonate geochemistry, and U–Th chronology from the R/V Sonne 210 expedition in 2010. High-definition ROV surveys reveal a mosaic of seep habitats ranging from soft-sediment sites with active seepage and chemosynthetic fauna to extensive carbonate chemoherms representing older, largely inactive seep stages, dominated by background deep-sea fauna that utilize the carbonates as hard substrate and refuge.

Carbonates from multiple sites show strongly depleted δ¹³C values (down to ~–50‰ VPDB), confirming methane-derived carbon sources. U–Th ages span from very young (<5 ka) carbonates associated with active seepage to late Pleistocene and older structures (>100 ka), documenting long-lived and multi-phase seep activity. In contrast, some massive carbonate blocks exhibit complex internal architectures and anomalous U–Th systematics, indicating open-system behavior and requiring cautious age interpretation. Sediment biogeochemical data reveal high rates of benthic methane oxidation at active seep sites, characterized by shallow sulfate depletion and elevated sulfide concentrations. In contrast, carbonate-dominated sites lack comparable sedimentary biogeochemical signatures, primarily due to the limited presence of soft sediments, although methane oxidation may still partially occur within the carbonate framework. Water-column methane measurements indicate active methane release from the seafloor, with highest concentrations near the bottom and a pronounced decrease within the first 100–200 m above the seafloor.

By comparing multiple subregions within the CMSA, we identify distinct successional stages of seepage, progressing from sediment-hosted sites through mixed sediment–carbonate settings to predominantly fossil chemoherms. We discuss how these stages reflect temporal variability in methane flux, carbonate precipitation, and biological colonization, potentially modulated by episodic tectonic activity along the Chilean margin. Our results highlight the value of combining geomorphological, geochemical, and ecological data to reconstruct the life cycle of methane seep systems on active margins.

How to cite: Treude, T., Linke, P., Liebetrau, V., Scholz, F., Steeb, P., Geersen, J., Schmidt, M., Sommer, S., Rovelli, L., Bryant, L., and Scholten, J.: Successional stages of methane seep systems off central Chile: from active sediment-hosted seepage to fossil carbonate chemoherms, EGU General Assembly 2026, Vienna, Austria, 3–8 May 2026, EGU26-8152, https://doi.org/10.5194/egusphere-egu26-8152, 2026.

EGU26-9526 | Posters on site | BG4.4

Tracing the geogenic and biogenic genesis and age of CH4 and CO2 in gas seeps across an Arctic permafrost landscape 

Christian Juncher Jørgensen, Getachew Agmuas Adnew, Moritz Schroll, Kajsa Roslund, Henrik Peter Eckhardt, Thomas Röckmann, Sönke Szidat, Carine van der Veen, Frank Keppler, and Jesper Riis Christiansen

The Arctic is warming leading to rapid environmental changes including permafrost thaw, glacier retreat, and altered hydrology. These changes can lead to disintegration of cryospheric caps and mobilize previously stored greenhouse gases (GHGs) of both geogenic and biogenic origin, that represent a little known climatic feedback of permafrost melting. This release mechanism of CH4 and CO2 have been detected along glacier margins of the Greenland Ice Sheet and in Svalbard. Here the partitioning of CH4 and CO2 is strongly dependent on oxidation processes and hydrological connectivity1,2. However, the presence and relative contributions of geogenic and biogenic CH4 and CO2 emissions from ice-free Arctic permafrost landscapes located on top of known geological oil and gas resources remains understudied.

To study this, we apply an integrated isotopic approach combining bulk stable isotopes (δ13C(CH4), δ2H(CH4), δ13C(CO2)), clumped isotopes of CH4, and radiocarbon (¹⁴C) analyses of CH4 and CO2, including concentrations of C2/C3 gases, to disentangle gas sources, formation pathways, and cycling processes in an Arctic permafrost. Over a 10-day period gas samples were collected from in situ gas seeps in lakes on top of geological fault zones, natural springs, and permafrost thaw ponds to capture the variation in CH4 and CO2 concentration and isotopic compositions in areas with different geogenic impacts. The field work was carried out on the western tip of the Nuussuaq peninsula in West Greenland (70°29′57.16″ N, 54°10′35.91″ W). Here the landscape is characterized by active permafrost with known geogenic gas and oil seeps.

We will present the full isotopic composition of CH4 and CO2 from these gas seeps to show that the combined use of clumped isotopes and radiocarbon enables a clear distinction between microbial, thermogenic and geogenic gas sources, as well as oxidation and mixing processes. Results provide insight on the origin, turnover and fate of CH4 and CO2 in Arctic landscapes to help understand the role of subsurface geology to GHG emissions.

References

1: Adnew GA, Röckmann T, Blunier T, et al (2025) Clumped isotope measurements reveal aerobic oxidation of methane below the Greenland ice sheet. Geochim Cosmochim Acta 389:249–264. https://doi.org/10.1016/J.GCA.2024.11.009

2: Adnew GA, Schroll M, Röckmann T, et al (2025) Radiocarbon and bulk isotope composition of subglacial methane and carbon dioxide emitted at the western margin of the Greenland ice sheet. Geochim Cosmochim Acta

How to cite: Jørgensen, C. J., Adnew, G. A., Schroll, M., Roslund, K., Eckhardt, H. P., Röckmann, T., Szidat, S., van der Veen, C., Keppler, F., and Christiansen, J. R.: Tracing the geogenic and biogenic genesis and age of CH4 and CO2 in gas seeps across an Arctic permafrost landscape, EGU General Assembly 2026, Vienna, Austria, 3–8 May 2026, EGU26-9526, https://doi.org/10.5194/egusphere-egu26-9526, 2026.

EGU26-9633 | ECS | Posters on site | BG4.4

Dual-stable isotope constraints on aerobic methane oxidation in the water column of the outer Laptev Sea 

Fangping Yan, Marenka Brussee, Henry Holmstrand, Birgit Wild, Igor Semiletov, Natalia Shakhova, Shichang Kang, and Örjan Gustafsson

Methane (CH4) oxidation in Arctic shelf waters plays a critical role in regulating subsea CH4 emissions, yet remains difficult to quantify due to strong spatial heterogeneity and complex transport processes. Here, we investigate CH4 oxidation in the outer Laptev Sea using vertical and lateral profiles of CH4 concentration together with dual-stable isotopic compositions (δ13C–CH4 and δD–CH4). Across the study area, dissolved CH4 exhibits large concentration gradients accompanied by pronounced enrichment in the heavy isotopes. The observed δ13C–CH4 and δD–CH4 values increase synchronously, yielding dual-isotope slopes (Λ=7.9–13.7) that fall within the characteristic range of aerobic CH4 oxidation. Isotopic enrichment is most clearly expressed below the pycnocline, indicating substantial oxidation of sediment-derived CH4 during its residence in sub-pycnocline waters. For samples that show Rayleigh-type isotope–concentration relationships, we quantify the fraction of CH4 oxidized (fox) using site-specific isotopic source signatures and incubation-derived fractionation factors. Station-integrated results yield regional median fox values of 22% (interquartile range, IQR: 11–32%) based on δ13C–CH4 and 36% (IQR: 17–42%) based on δD–CH4. These estimates likely represent conservative lower bounds as it is difficult to measure CH4 addition by bubble dissolution and to capture the complete trajectory of CH4 through the sub-pycnocline waters. The exceptionally high δ13C–CH4 (up to +21‰) and δD–CH4 values (up to +573‰) occur at relatively low CH4 concentrations (~80 nM) at stations located between active seep hotspots (~3000 nM), suggesting advanced oxidation under open-system conditions during continued transport. Comparison of isotope systems shows that δD–CH4 provides a more robust constraint on oxidation than δ13C–CH4 in heterogeneous shelf environments. Overall, our results demonstrate that water-column structure and CH4 residence time primarily control the extent of CH4 oxidation in the outer Laptev Sea. This study provides new quantitative and process-based constraints on water-column CH4 oxidation in Arctic shelf seas and demonstrates the utility of dual-stable isotope approaches for resolving CH4 cycling in complex marine systems.

How to cite: Yan, F., Brussee, M., Holmstrand, H., Wild, B., Semiletov, I., Shakhova, N., Kang, S., and Gustafsson, Ö.: Dual-stable isotope constraints on aerobic methane oxidation in the water column of the outer Laptev Sea, EGU General Assembly 2026, Vienna, Austria, 3–8 May 2026, EGU26-9633, https://doi.org/10.5194/egusphere-egu26-9633, 2026.

Aquaculture ponds are significant hotspots of methane (CH4) emissions, yet the mechanisms regulating CH4 production and emissions across diverse pond types remain poorly understood. By investigating 20 aquaculture ponds with diverse culture systems in (sub)tropical southern China, we examined CH4 emissions (FCH4) and their underlying drivers. Our preliminary results reveal substantial CH4 emissions from (sub)tropical aquaculture ponds, with significant variations among pond types. Fish ponds exhibited the highest FCH4 (226 ± 441 mg m–2 d–1), followed by shrimp ponds (68 ± 159 mg m–2 d–1) and crab ponds (49 ± 112 mg m–2 d–1). Ebullition was the dominant pathway of CH4 emissions, accounting for over 70% of the total CH4 flux. CH4 emissions were collectively regulated by management practices, environmental variables, and methane-cycling microbial communities. Salinity suppressed FCH4 by inhibiting methanogen metabolism and restructuring methanogenic community, while elevated organic substrates could offset the salinity-driven inhibitory effect. Furthermore, rising temperature could substantially stimulate CH4 emissions, especially ebullition, with an 11% increase in FCH4 per 1 °C rise in water temperature. This thermal sensitivity of FCH4 was further amplified in ponds with higher organic substrates, revealing a synergistic effect between temperature and substrate availability in promoting CH4 production. Notably, low-latitude aquaculture ponds exhibited greater temperature sensitivity. Our study highlights the considerable CH4 emission potential of (sub)tropical aquaculture ponds and identifies salinity, organic matter, and temperature as key regulators of FCH4. These findings provide a framework for scaling the contribution of aquaculture ponds to the global CH4 budgets.

How to cite: Ran, L. and Yang, Q.: Biogeochemical and microbial controls on methane emissions from (sub)tropical aquaculture ponds, EGU General Assembly 2026, Vienna, Austria, 3–8 May 2026, EGU26-9879, https://doi.org/10.5194/egusphere-egu26-9879, 2026.

EGU26-11561 | Orals | BG4.4

The discovery of a new ebullition field in the deep Baltic Sea 

Christian Stranne, Vicent Doñate, Yoann Ladroit, Yvonne Y. Y. Yau, Changxun Yu, Christoph Humborg, Martin Jakobsson, Cheng Chang, and Marcelo Ketzer

A previously unknown gas ebullition field has been identified at ~400 m water depth in the Landsort Deep, the deepest part of the Baltic Sea. Hydroacoustic mapping reveals persistent seabed gas release over an area of approximately 17 km2. Although no direct gas samples were collected, elevated methane concentrations in sediment pore waters and bottom waters suggest that the bubbles are methane-dominated. Stable carbon isotope signatures of dissolved methane indicate a predominantly microbial origin, consistent with in situ production from the degradation of organic matter rather than migration from deeper thermogenic reservoirs.

The seep field is spatially associated with a drift deposit characterized by enhanced sedimentation rates, pointing to a tight coupling between organic matter accumulation and methane production. Acoustic flux estimates indicate an average seabed methane release on the order of ~10 mol m-2 yr-1, comparable to fluxes reported from the well-studied Tommeliten seep area in the North Sea. However, the Landsort Deep seep field is roughly two orders of magnitude larger in areal extent, implying substantially higher integrated methane emissions.

These findings highlight the potential for deep, hypoxic basins in eutrophied marginal seas to host large, previously unrecognized methane sources. The Landsort Deep provides a natural laboratory for investigating how sedimentation, redox conditions, and water-column stratification regulate methane production, oxidation, and escape from the seabed in coastal and semi-enclosed marine systems.

How to cite: Stranne, C., Doñate, V., Ladroit, Y., Y. Y. Yau, Y., Yu, C., Humborg, C., Jakobsson, M., Chang, C., and Ketzer, M.: The discovery of a new ebullition field in the deep Baltic Sea, EGU General Assembly 2026, Vienna, Austria, 3–8 May 2026, EGU26-11561, https://doi.org/10.5194/egusphere-egu26-11561, 2026.

EGU26-11896 | ECS | Orals | BG4.4

“Hot moments” dominate nitrous oxide emissions in the Elbe estuary 

Youssef Saadaoui, Johannes Pein, Nina Preußler, Gesa Schulz, Kirstin Dähnke, Tina Sanders, and Carsten Lemmen

Estuaries convert organic carbon and total nitrogen inputs from land to emissions of greenhouse gases such as carbon dioxide (CO₂) and nitrous oxide (N₂O). Many estuarine air-water flux budgets report CO₂ but omit N₂O, which has a much higher global warming potential. N₂O may have more elusive spatial and temporal emission patterns and exhibit short-lived high-emission events. A tide-resolving biogeochemical model for the tidal Elbe estuary, which flows through the German city of Hamburg, shows that CO₂ fluxes vary strongly through the year and often change sign between net uptake and net release. N₂O is always a net source, is highest in the tidal freshwater reach near Hamburg, and remains relevant in the outer estuary where CO₂ fluxes are small. The annual N₂O budget is driven by short events: within each estuary section, the top 10% of emission days contribute 27–38% of the annual flux. Similar N₂O maxima have been reported for other nutrient-rich and urban estuaries like the Scheldt and Humber.  To observe and manage greenhouse gas emissions better, it is essential to identify the spatial and temporal pattern (the “hotspots” and "hot moments") of episodic nitrous oxide emission events, as has been done in our model study. This enables mitigation measures, such as temporary load reduction or artificial water oxygenation be effective. 

How to cite: Saadaoui, Y., Pein, J., Preußler, N., Schulz, G., Dähnke, K., Sanders, T., and Lemmen, C.: “Hot moments” dominate nitrous oxide emissions in the Elbe estuary, EGU General Assembly 2026, Vienna, Austria, 3–8 May 2026, EGU26-11896, https://doi.org/10.5194/egusphere-egu26-11896, 2026.

EGU26-12057 | Posters on site | BG4.4

Methane emissions from three European temperate estuaries 

Louise Rewrie, Ingeborg Bußmann, Nicola Camillini, Kirstin Dähnke, Vlad Macovei, Tina Sanders, Gesa Schulz, and Yoana Voynova Voynova

Methane (CH4) is a potent greenhouse gas with a global warming potential by mass 25 times greater compared to carbon dioxide. Its atmospheric concentration has tripled since the industrial revolution, and half of the global CH4 emissions can be attributed to aquatic ecosystems. However, there is a large spatiotemporal heterogeneity in river and estuary CH4 emissions leading to challenges in precise quantification. 

This study presents CH4 diffusive fluxes from three temperate estuaries discharging into the German Bight of the southern North Sea: the Ems, Weser and Elbe, which are all subject to anthropogenic perturbations. During a campaign in autumn 2024 on the RV Heincke, continuous measurements of CH4 were obtained using cavity ring-down spectroscopy (Picarro G2508 coupled with an equilibrator system). For quality control purposes, discrete water samples were collected, preserved and later measured with gas chromatography analysis. Ancillary biogeochemical variables were measured continuously using a FerryBox system installed on board.

Preliminary results show varied CH4 diffusive fluxes across all three estuaries ranging between 6 µmol d-1 m2 and 763 µmol d-1 m2. In the Weser and Elbe, the CH4 fluxes were elevated (701 µmol d-1 m2 and 499 µmol d-1 m2, respectively) in the lower estuaries with salinities of > 17. Concentrations decreased in the mid-regions and then increased in the upper freshwater region to 763 µmol d-1 m2 and 360 µmol d-1 m2 with salinities 0.2 – 0.5. In the Ems, the highest CH4 flux up to 627 µmol d-1 m2 was observed in the lower estuary with salinity of 28. We postulate that site specific characteristics, such as organic matter degradation and CH4 production in the actively dredged Hamburg Harbour (upper Elbe Estuary), as well as stronger winds at 16 m s-1 in the lower Elbe Estuary promoted elevated CH4 fluxes. We aim to further disentangle the impacts of human alterations to coastal environments on CH4 production and emissions, by incorporating and assessing the accompanying FerryBox biogeochemical variables along with discrete nutrient samples in these temperate estuaries.

How to cite: Rewrie, L., Bußmann, I., Camillini, N., Dähnke, K., Macovei, V., Sanders, T., Schulz, G., and Voynova, Y. V.: Methane emissions from three European temperate estuaries, EGU General Assembly 2026, Vienna, Austria, 3–8 May 2026, EGU26-12057, https://doi.org/10.5194/egusphere-egu26-12057, 2026.

EGU26-13180 | ECS | Orals | BG4.4

Submarine groundwater discharge as a major driver of coastal carbon fluxes 

Alex Cabral, Maxime Savatier, and Carlos Rocha

Submarine groundwater discharge (SGD) is a major yet often overlooked driver of coastal carbon cycling. We examined two contrasting coastal basins: a bay dominated by karstic groundwater discharge and a fjord influenced by riverine inputs in the west coast of Ireland. Radioisotope-based (Ra and Rn) models and seasonal measurements were used to quantify water and carbon fluxes. We hypothesize that high-alkalinity groundwater from karstic aquifers delivers elevated dissolved carbon (DIC and DOC) and modulates air-sea CO2 exchange and carbon outwelling to the ocean. We further assess whether groundwater inputs act to buffer or intensify coastal acidification along the land–ocean continuum, providing new insights into how groundwater chemistry regulates carbonate equilibria and CO2 dynamics in contrasting coastal environments. Groundwater discharge was about 30% lower than river discharge yet contributed ~34 times more DIC (899 ± 453 vs 26 ± 22 mmol m2 d-1) and similar DOC fluxes (62 ± 31 vs 65 ± 51 mmol m2 d-1, respectively) to the coastal basins. Rivers (TA/DIC = 0.5 ± 0.2) showed a stronger acidifying effect than groundwater (TA/DIC = 0.9 ± 0.1) due to the strong buffering capacity of karst aquifers derived from carbonate dissolution. Bicarbonate outwelling from the coastal basins to the ocean and CO2 emissions to the atmosphere from the SGD influenced bay (155 ± 63 and 155 ± 121 mmol m2 d-1, respectively) exceeded those from the river fed fjord (87 ± 109 and 67 ± 33 mmol m2 d-1), highlighting the disproportionate role of groundwater-derived alkalinity in regulating carbon fluxes across the land-ocean interface.

How to cite: Cabral, A., Savatier, M., and Rocha, C.: Submarine groundwater discharge as a major driver of coastal carbon fluxes, EGU General Assembly 2026, Vienna, Austria, 3–8 May 2026, EGU26-13180, https://doi.org/10.5194/egusphere-egu26-13180, 2026.

EGU26-14247 | Orals | BG4.4

The Evolution of Methane Emissions in Thermokarst Lakes   

Orit Sivan, Andre Pellerin, Yarden Gerera, Efrat Eilani Russak, and Katey Walter Anthony

Thermokarst lakes, formed by permafrost thaw in the Arctic, are ubiquitous with abrupt permafrost thaw and large atmospheric source "hotspots" of methane (CH4) and carbon dioxide (CO2) emissions, which are expected to double permafrost carbon emissions by the end of the century. While the implications of ongoing permafrost thaw on CH4 dynamics within these lakes have been modeled, here we provide empirical data on CH4 production dynamics as lakes evolve from young recently formed lakes to older lakes that have been present for hundreds of years. Sediment cores were collected from the centers and thermokarst margins of a new thermokarst lake and from an older thermokarst lake from the same interior Alaskan watershed. The highest CH4 production rates were observed in the uppermost sediments near the sediment-water interface at the thermokarst margins of both lakes, with a steep decrease with sediment depth into the talik. The young lake exhibited elevated CH4 production rates, correlated with higher carbon lability. The integrated sediment-column CH4 production rates were similar, primarily due to the thinner talik at the young lake. Our data support the predictions that formation and expansion of thermokarst lakes over the next centuries will increase CH4 production in newly thawed Yedoma permafrost sediments, while CH4 production will decrease as taliks mature and labile organic carbon is used up. Our results also suggest important controls of methane production and oxidation in the sediments.

How to cite: Sivan, O., Pellerin, A., Gerera, Y., Eilani Russak, E., and Walter Anthony, K.: The Evolution of Methane Emissions in Thermokarst Lakes  , EGU General Assembly 2026, Vienna, Austria, 3–8 May 2026, EGU26-14247, https://doi.org/10.5194/egusphere-egu26-14247, 2026.

Microbial methane oxidation in freshwater sediments can substantially reduce methane emissions to the atmosphere, yet the processes regulating this activity in the methanogenic zone have remained poorly constrained. In iron-rich sediments, methane cycling may overlap with microbial iron reduction, suggesting potential coupling between these processes. Lake Kinneret sediments exhibit such conditions at depth, where methanogenesis dominates in the presence of high concentrations of reactive iron and limited availability of alternative electron acceptors. Previous studies from Lake Kinneret methanogenic sediments pointed to the coupling between methane oxidation and iron reduction, as well as to the unexpected presence of aerobic methane-oxidizing bacteria within; however, the microbial interactions are not clear.

Here we explored whether interactions between methane-oxidizing and iron-reducing bacteria can stimulate iron reduction under the methanogenic conditions. Controlled laboratory experiments were conducted using an aerobic methane-oxidizing bacterium and an anaerobic iron-reducing bacterium incubated with porewater from the methanogenic sediment zone of Lake Kinneret, amended with ¹³C-labeled methane and amorphous ferric iron, under 1% O₂ conditions. Our findings demonstrate that methane-oxidizing bacteria are linked to microbial iron reduction through indirect interactions, likely mediated by soluble metabolites or electron-shuttling compounds. The results highlight the role of microbial interactions in regulating sedimentary redox processes and methane cycling under low-oxygen conditions.

How to cite: Rosenblatt, A., Sivan, O., and Rubin-Blum, M.: Microbial interactions between iron reducing and methane oxidizing bacteria in methanogenic sediments of freshwater lake, EGU General Assembly 2026, Vienna, Austria, 3–8 May 2026, EGU26-14290, https://doi.org/10.5194/egusphere-egu26-14290, 2026.

EGU26-14448 | Orals | BG4.4

Seasonal variation and controls of nitrous oxide and methane concentrations at the entrance to the Elbe Estuary 

Kirstin Dähnke, Irmak Gök, Gesa Schulz, Tina Sanders, Louise Rewrie, and Ingeborg Bussmann

Inland water bodies and rivers can be important sources of the greenhouse gases (GHG) nitrous oxide and methane, which are particularly high in managed water bodies receiving high nutrient loads. GHG emissions derived from such input are an important subset to national greenhouse gas inventories, but are difficult to parameterize. Within the national monitoring network ITMS, we thus investigated the seasonal variability of GHG concentration in the Elbe River. To support the parametrization of GHG fluxes and emissions, we measured nitrous oxide and methane concentrations along with key biogeochemical properties in the water column at a sampling station at the entrance to the Elbe Estuary in Geesthacht, Germany, in 2024.

Methane and nitrous oxide concentrations appear to be governed by surface water input and organic matter decomposition. Nitrous oxide remains close the equilibrium for most of the study period, with little autochthonous production in the river, and only increases during a flood event driven by elevated discharge and soil water inflow. In contrast, the limnic Elbe shows intense methane production, with strongly increasing concentrations over the course of the vegetation period, fuelled by organic matter turnover in the riverine water column and sediments. High chlorophyll and high methane concentrations with low nutrient concentrations and long residence times at high temperatures suggest intense internal recycling in the water column over the summer. Especially in summer, we also see a strong inverse correlation of water discharge and methane concentration in the river.

Our data show the interplay of water sources, discharge patterns and biological productivity in river and catchment on GHG concentration and underscore the complex interplay of processes that make the eutrophic Elbe River an important source of GHG under global change.

How to cite: Dähnke, K., Gök, I., Schulz, G., Sanders, T., Rewrie, L., and Bussmann, I.: Seasonal variation and controls of nitrous oxide and methane concentrations at the entrance to the Elbe Estuary, EGU General Assembly 2026, Vienna, Austria, 3–8 May 2026, EGU26-14448, https://doi.org/10.5194/egusphere-egu26-14448, 2026.

EGU26-15463 | ECS | Posters on site | BG4.4

Database of offshore non-producing oil and gas wells for quantifying methane emissions potential   

Paola Prado, Jade Boutot, James France, Margaret Coleman, Adam Peltz, Natalya Gomez, Monia Procesi, Giuseppe Etiope, Eric van Oort, Pierre-Edouard Vincent, Tomas de Oliveira Bredariol, Casey Hubert, Geert de Bruin, Jasper Griffioen, Ira Leifer, Gert-Jan Reichart, Scott Socolofsky, Scott Socolofsky, Martin Wilpshaar, and Mary Kang and the Database of offshore non-producing oil and gas wells for quantifying methane emissions potential  

Methane emissions from offshore non-producing oil and gas wells (OGWs) at the global scale remain poorly understood. Most published studies on offshore non-producing OGWs have focused on the North Sea, and there are questions as to whether these findings can be extrapolated at the global scale. One important consideration for offshore OGW methane emissions into the atmosphere is the extent to which methane biodegrades in seawater above OGWs, for which the vertical extent of the water column is viewed as a key factor. Additionally, there is a lack of consensus on whether the knowledge from onshore wells is transferable to offshore wells, as well as how best to quantify emissions to the atmosphere, including practical limitations of current technologies. Therefore, we are developing a database of offshore wells globally, including water depth data, to facilitate analysis of potential for methane emissions and its mitigation. An accompanying literature review will identify knowledge gaps related to methane emissions from offshore non-producing wells, their role in national emissions estimates, and quantification approaches. Our results will be helpful in the understanding of potential contributions of offshore non-producing OGWs to methane emissions to the atmosphere, thereby informing methane mitigation strategies and policies.

How to cite: Prado, P., Boutot, J., France, J., Coleman, M., Peltz, A., Gomez, N., Procesi, M., Etiope, G., van Oort, E., Vincent, P.-E., de Oliveira Bredariol, T., Hubert, C., de Bruin, G., Griffioen, J., Leifer, I., Reichart, G.-J., Socolofsky, S., Socolofsky, S., Wilpshaar, M., and Kang, M. and the Database of offshore non-producing oil and gas wells for quantifying methane emissions potential  : Database of offshore non-producing oil and gas wells for quantifying methane emissions potential  , EGU General Assembly 2026, Vienna, Austria, 3–8 May 2026, EGU26-15463, https://doi.org/10.5194/egusphere-egu26-15463, 2026.

EGU26-15572 | ECS | Orals | BG4.4

Sediment-water CH4 fluxes across Baltic Sea bottom water oxygen gradients  

Yvonne Yu Yan Yau, Henry Lok Shan Cheung, Isaac Rodrigues Santos, Per Hall, Stefano Bonaglia, Mikhail Kononets, Linnea Henriksson, Tobia Politi, Erik Gustafsson, Bo Gustafsson, and Christian Stranne

Methane (CH4) is produced mostly in anoxic sediments through anaerobic degradation of organic matter. Here, we used both ex-situ sediment core and in-situ chamber lander incubations to quantify sediment-water CH4 fluxes under anoxic to oxic bottom water conditions in the Baltic Sea. Sediments acted as a source of CH4 into the water column with fluxes up to 13 mmol m-2 d-1. Strong spatial variability in sediment-water CH4 fluxes was observed with highest fluxes in the anoxic Western Gotland basin, followed by the Gulf of Finland and Gulf of Riga, and near-zero fluxes in the oxic Bothnian Bay. Sediment-water CH4 fluxes were negatively correlated with bottom water oxygen concentration, and positively correlated with sediment organic carbon content.

We incorporated observational data into a physical-biogeochemical model (BALTSEM-CH4 v1.0) to perform extrapolations. Sediments release 5 - 60 Gg CH4 yr-1 to the water column of the Baltic Sea. These large benthic CH4fluxes are largely counteracted by efficient CH4 oxidation in the water column (3 - 50 Gg CH4 yr-1). Both observations and model results indicate that water column oxidation prevents the high sediment-water CH4 fluxes from reaching the atmosphere.

How to cite: Yau, Y. Y. Y., Cheung, H. L. S., Santos, I. R., Hall, P., Bonaglia, S., Kononets, M., Henriksson, L., Politi, T., Gustafsson, E., Gustafsson, B., and Stranne, C.: Sediment-water CH4 fluxes across Baltic Sea bottom water oxygen gradients , EGU General Assembly 2026, Vienna, Austria, 3–8 May 2026, EGU26-15572, https://doi.org/10.5194/egusphere-egu26-15572, 2026.

EGU26-16438 | Orals | BG4.4

Spatial heterogeneity of GHG dynamics across an estuarine ecosystem 

Nicolas-Xavier Geilfus, Bruno Delille, Anna Villnäs, and Alf Norkko

Coastal ecosystems are critical components of the global carbon cycle, exerting a disproportionate influence on the carbon budget despite their limited spatial extent. Shallow coastal ecosystems exhibit strong gradients in physical, biogeochemical, and biological processes. Yet, their effects on carbon cycling and greenhouse gas (GHG) dynamics, including carbon dioxide (CO2), methane (CH4), and nitrous oxide (N2O), remain inadequately understood. This knowledge gap is compounded by substantial heterogeneity in marine biodiversity, further complicating the issue.

Surface seawater partial pressure of CO2 (pCO2), CH4, and N2O concentrations, along with seawater physical and biogeochemical properties, and air-sea gas exchange, were measured at 21 sites in southwest Finland (Baltic Sea). Sampling progressed from estuarine inner bays to the outer archipelago, covering diverse soft-sediment habitats, from sheltered to exposed areas, across a salinity gradient. Seawater pCO2 and N2O concentrations ranged from undersaturated (160 ppm and 9 nmol L-1, respectively) to supersaturated (2521 ppm and 25 nmol L-1, respectively), compared to the atmosphere, resulting in an uptake of -36 and -0.0021 mmol m-2 d-1, and a release up to 220 and 0.0383 mmol m-2 d-1, respectively. CH4 concentrations were consistently supersaturated (19 to 469 nmol L–1) compared to the atmosphere, resulting in a net source to the atmosphere from 0.014 to 1.39 mmol m–2 d–1.

Freshwater input and its mixing with seawater shaped the overall spatial patterns of GHGs. However, deviations from this salinity-driven control were seen in sheltered sites within the archipelago, where elevated pCO2 and CH4 concentrations likely reflected biological processes, including enhanced organic matter respiration and methanogenesis in warm, late-summer shallow waters, where limited oxidation favored CH4 accumulation. At exposed and semi-sheltered sites, mixing processes exerted greater control, resulting in lower GHG concentrations. Our results show that both physical mixing and biological processes influence coastal GHG dynamics, with benthic ecosystems potentially playing a key but still poorly constrained role. The overall budget of air–sea GHG exchanges was dominated by CO2 fluxes, with CH4 consistently acting as a source, and N2O alternating between source and sink. High environmental variability in shallow coastal systems leads to strong fluctuations in the balance between GHG production and consumption, which needs to be considered when evaluating their role in the global carbon budget.

How to cite: Geilfus, N.-X., Delille, B., Villnäs, A., and Norkko, A.: Spatial heterogeneity of GHG dynamics across an estuarine ecosystem, EGU General Assembly 2026, Vienna, Austria, 3–8 May 2026, EGU26-16438, https://doi.org/10.5194/egusphere-egu26-16438, 2026.

EGU26-16780 | ECS | Orals | BG4.4

Natural methane seepage in the Danish offshore area – spatial distribution and morphology of methane-derived authigenic carbonates (MDACs) 

Carlette N. Blok, Zyad Al-Hamdani, Mikkel S. Andersen, Lars Ø. Hansen, Isak R. Larsen, and Verner B. Ernstsen

Natural, cold seeps are important processes affecting seafloor geochemistry, ecosystems and greenhouse gas cycling. However, spatial and temporal constraints on offshore seepage remains limited. Methane seeps can form a variety of structures at the seabed, including pockmarks (depressions), or carbonate crusts in the form of methane-derived authigenic carbonates (MDACs), which can therefore be indicators of methane pathways through the seabed sediments.

MDACs form through microbial mediated anaerobic oxidation of methane and provide a unique record of both relict and active seep-related carbonated formation. Here, we investigate the spatial distribution of MDACs, their morphology, relation to the subsurface geology, and whether they are still forming in the Danish offshore areas of Kattegat and Skagerrak. Their exposure at the seafloor is linked to cementation of unconsolidated sediment, combined with glacio-isostatic uplift and erosion, resulting in various morphologies such as pillars, mushroom-like structures or slabs. As the hard substrates occur at a predominantly sandy sea floor, MDACs can act as local ‘oases’ and provide a foundation for benthic ecosystems.

Occurrences and morphologies of MDACs are identified by a combination of side-scan sonar, multibeam echosounder and sub-bottom profiler data, and confirmed with videos by remotely operated vehicles (ROVs) or divers. The majority of the MDACs align with the Sorgenfrei–Tornquist Zone, suggesting a tectonic control on fluid migration pathways. Previously published data indicated a stable carbon isotope signature (δ¹³C) of predominantly microbial methane source, likely derived from Late Quaternary organic-rich marine sediments (Jørgensen et al., 1990).

How to cite: Blok, C. N., Al-Hamdani, Z., S. Andersen, M., Ø. Hansen, L., R. Larsen, I., and B. Ernstsen, V.: Natural methane seepage in the Danish offshore area – spatial distribution and morphology of methane-derived authigenic carbonates (MDACs), EGU General Assembly 2026, Vienna, Austria, 3–8 May 2026, EGU26-16780, https://doi.org/10.5194/egusphere-egu26-16780, 2026.

EGU26-17724 | ECS | Posters on site | BG4.4

Influence of an episodic flood event on methane and nitrous oxide dynamics in the Elbe estuary 

Nicola Camillini, Irmak Gök, Louise Rewrie, Gesa Schulz, Yoana Voynova, Holger Brix, and Tina Sanders

Ongoing anthropogenic-driven climate change patterns prompt for better constraining drivers of coastal methane (CH4) and nitrous oxide (N2O) emissions, potent greenhouse gases (GHG) with greater warming potential than carbon dioxide. The temperate Elbe Estuary (Germany) is heavily influenced by anthropogenic activities including high agricultural nitrogen loads and intense dredging in the Hamburg Port, overall contributing to this ecosystem acting as a net source of CH4 and N2O. However, interactions between local microbial activity and transport processes translate into pronounced spatial and temporal variability in estuarine CH4 and N2O dynamics, thus challenging assessments at time-scales relevant to episodic events. This study presents spatio-temporal CH4 and N2O dynamics in the Elbe estuary based on discrete samples collected during three campaigns (in 08/2024, 09/2024 and 08/2025) that captured the effects of an episodic flood event in autumn following dry summer.

During low river flow conditions (08/2024 and 08/2025), CH4 and N2O concentrations showed distinct spatial gradients along the estuary, indicative of riverine input and CH4 production in the mid-estuary (salinities <20), while N2O production was mainly restricted to the upper and hypoxic estuary. During a river flood event (09/2024), the Elbe discharge rate rapidly increased 4-fold up to 1240 m3 s-1 within 10 days, which lowered CH4 and N2O concentration along the estuary. Consequently, the CH4 and N2O dilution during the flood event decreased estuarine diffusive water-air flux rates, while increasing export to the German Bight. While these preliminary findings need to be further evaluated against ancillary environmental data, capturing the effects of episodic flood events across different seasons has the potential to influence estuarine CH4 and N2O emission budgets.

How to cite: Camillini, N., Gök, I., Rewrie, L., Schulz, G., Voynova, Y., Brix, H., and Sanders, T.: Influence of an episodic flood event on methane and nitrous oxide dynamics in the Elbe estuary, EGU General Assembly 2026, Vienna, Austria, 3–8 May 2026, EGU26-17724, https://doi.org/10.5194/egusphere-egu26-17724, 2026.

EGU26-17754 | ECS | Orals | BG4.4

Seasonal variability in changes in greenhouse gas dynamics in shallow coastal ecosystems  

Aurora Menéndez García, Anna Villnäs, Alf Norkko, and Nicolas-Xavier Geilfus

Coastal shallow ecosystems vary widely in physical conditions, habitat structure, and biodiversity, resulting in differences in biogeochemical processes and greenhouse gas (GHG) emissions. Benthic and pelagic processes, together with their interactions, regulate the production and consumption of carbon dioxide (CO2) and methane (CH4) across coastal ecosystems, potentially giving rise to intense, localized episodes of production or emission known as “hot moments” at specific sites, or “hot spots”. However, despite their importance for regional and global carbon cycles, these processes remain poorly characterized in many coastal environments due to their strong spatial and temporal heterogeneity.

We measured surface and bottom seawater biogeochemical properties using a state-of-the-art flow-through system equipped with a cavity ring-down system Picarro G2201-i, to measure CO2 and CH4 concentrations and stable carbon isotope composition, coupled with sensors for physical (temperature and salinity) and biogeochemical (chlorophyll-a (Chl-a), turbidity, colored dissolved organic matter (cDOM), dissolved oxygen (DO)) parameters. Sampling took place from June 2024 to May 2025, with 21 sites sampled in SW Finland, covering diverse soft-sediment habitats from sheltered to exposed areas along a salinity gradient.

Surface water partial pressure of CO2 (pCO2) and CH4 concentration ranged from 73.61 µatm to 3078.49 µatm, and from 4.48 nmol/L to 1104.77 nmol/L, respectively, with lower values observed for both parameters during spring, while higher values were observed during the summer months. Bottom water pCO2 ranged 89.09 µatm to 1969.67 µatm and the CH4 ranged from 4.68 nmol/L to 5145.44 nmol/L. For bottom waters, both minima appeared in spring, while the maxima appeared in summer months for the pCO2 and during autumn for CH4.

The lowest surface pCO2 values were associated with elevated Chl-a concentrations (57.94 µg/L), indicating a relation between low pCO2 and periods of high phytoplankton biomass and enhanced autotrophic activity. This pattern was observed during the spring bloom and persisted to a lesser extent during the summer, when Chl-a concentrations remained relatively high. In contrast, surface pCO2 and CH4 concentrations increased later in the season, with elevated values during summer and maxima generally occurring in autumn. This seasonal increase coincided with declining surface DO concentrations (minimum 215.92 µM) and increasing cDOM concentrations (up to 26.02 µg/L), reflecting pronounced seasonal changes in biogeochemical conditions.

In addition to seasonal variability, there was strong spatial heterogeneity across sites with different exposures. Sheltered locations consistently showed higher and more variable concentrations of pCO2 and CH4, especially during summer and autumn. In contrast, exposed sites had lower GHG levels and less seasonal fluctuation, while semi-exposed sites generally showed intermediate values. These spatial patterns were visible in both surface and bottom waters, with the largest contrasts observed in bottom-water CH4 concentrations, suggesting a key role of seafloor habitats.

All in all, these findings demonstrate that seasonal ecosystem changes significantly influence coastal GHG variability, highlighting the role of spatial-temporal heterogeneity as a key factor for improving the understanding of coastal GHG dynamics.

How to cite: Menéndez García, A., Villnäs, A., Norkko, A., and Geilfus, N.-X.: Seasonal variability in changes in greenhouse gas dynamics in shallow coastal ecosystems , EGU General Assembly 2026, Vienna, Austria, 3–8 May 2026, EGU26-17754, https://doi.org/10.5194/egusphere-egu26-17754, 2026.

EGU26-17867 | ECS | Orals | BG4.4

Anaerobic oxidation of methane mediated by iron and graphene oxides in coastal sediments 

Evalien Baas, Peter ter Horst, Robin Klomp, Wytze Lenstra, Mike Jetten, and Caroline Slomp

Methane (CH4) is a potent greenhouse gas. Coastal systems account for a large fraction of marine CH4 emissions. This emphasizes the need to understand coastal sources and sinks of CH4. Most of the CH4 in coastal systems is produced in sediments during organic matter degradation and consumed through anaerobic oxidation of CH4 (AOM), a process predominantly mediated by anaerobic methanotrophic archaea (ANME). Typically, AOM coupled to sulfate reduction is considered the dominant CH4 sink. However, in iron (Fe)-rich sediments, CH4 can also be oxidized either directly via coupling to Fe(III) reduction or indirectly via an Fe-driven cryptic sulfur cycle that sustains sulfate-dependent AOM. Additionally, natural organic matter (NOM) may also act as an electron acceptor in AOM.

While Fe-dependent AOM has been demonstrated in surface sediments, experimental evidence for such processes in deeper sediment layers (>1 m) remains limited and is largely inferred from model studies. Furthermore, experimental evidence for NOM-dependent AOM in coastal sediments remains scarce. The Bothnian Sea is a brackish basin in the northern Baltic Sea that receives high inputs of reactive Fe oxides and organic matter, creating conditions that may favor Fe- and NOM-coupled AOM in its deep sediments.

In this study we assess whether there is potential for AOM coupled to Fe and NOM reduction in deep sediments (>1 m) of the Bothnian Sea. We present results from long-term incubation experiments using sediments retrieved from the Bothnian Sea, site US5B which we amend with Fe oxide and graphene oxide, a NOM analogue, to evaluate their effect on CH4 oxidation. Our incubations, using 13CH4, show that Fe oxide and graphene oxide both stimulate AOM. In the case of Fe oxide, this could potentially involve a cryptic sulfur cycle. Based on metagenomic sequencing, ANME-2a/b archaea and potential metal-oxide reducing bacteria were enriched over time in both treatments. These findings provide new experimental constraints on the occurrence and relevance of Fe oxide and natural organic matter as electron acceptors in AOM in Fe-oxide and organic rich coastal sediments.

How to cite: Baas, E., ter Horst, P., Klomp, R., Lenstra, W., Jetten, M., and Slomp, C.: Anaerobic oxidation of methane mediated by iron and graphene oxides in coastal sediments, EGU General Assembly 2026, Vienna, Austria, 3–8 May 2026, EGU26-17867, https://doi.org/10.5194/egusphere-egu26-17867, 2026.

EGU26-17939 | ECS | Orals | BG4.4

Biogeochemical and micropaleontological constraints on methane in the Amazon Fan gas hydrate province 

Monique Aparecida Marchese Rizzi, Jochen Brocks, Tais Freitas Silva, Joice Cagliari, Sandro Monticelli Petró, Renata Medina-Silva, Tiago Jonatan Girelli, Adolpho Herbert Augustin, Luiz Frederico Rodrigues, Alessandra da Silva Santos, Lilian Maia Leandro, Mauro Daniel Rodrigues Bruno, Rodrigo do Monte Guerra, Natalia Sêneda Martarello, Gerson Fauth, Dennis James Miller, José Antonio Cupertino, and Farid Chemale Jr

Gas hydrate provinces along continental margins are major reservoirs of methane and play a key role in regulating carbon fluxes between the geosphere, hydrosphere, and biosphere. The Amazon Deep-Sea Fan, one of the largest sedimentary systems on Earth, hosts extensive gas-hydrate accumulations and widespread fluid-expulsion structures, yet the spatial and temporal dynamics of methane within this system remain poorly constrained. Here, we integrate organic geochemical biomarkers with micropaleontological and biostratigraphic data to assess methane occurrence and microbial processing within shallow sediments of the hydrate stability field. Seven piston cores recovered during the 2023 AMARYLLIS–AMAGAS expedition penetrated up to ~30 m below the seafloor across hydrate-rich areas of the Amazon Fan. Twenty sediment samples were selected based on total organic carbon content and stratigraphic position and were analyzed using solvent extraction, liquid chromatography, and GC–MS. In parallel, 367 samples from 17 piston and gravity cores were studied for planktonic foraminifera, supplemented by analyses of calcareous nannofossils and palynofacies, thereby providing a robust Quaternary stratigraphic framework. Biomarker distributions indicate a dominance of terrestrial organic matter, with long-chain odd-numbered n-alkanes (n-C27–n-C35) and immature hopane and sterane assemblages, reflecting rapid burial in a clay-rich, low-maturity depositional environment. Despite this strong terrigenous imprint, all analyzed samples contain 3-methylhopanoids, diagnostic lipids of aerobic methanotrophic or methylotrophic bacteria. Their ubiquitous occurrence demonstrates that methane is present and bioavailable throughout the shallow subsurface of the hydrate stability zone. Meanwhile, the absence of 2-methylhopanoids suggests that cyanobacterial or phototrophic inputs are negligible in this zone, emphasizing a subsurface microbial signal. In selected cores, pentamethylcosenes further indicate localized zones of elevated microbial lipid production, suggesting spatially heterogeneous methane oxidation associated with focused fluid flow. Micropaleontological data indicate that the upper tens of meters of sediment are entirely Quaternary but are strongly affected by sediment remobilization associated with mass-transport deposits and mud volcanism driven by gas hydrate dissociation. Biozonation based on the presence and absence of Globorotalia menardii reveals alternations between glacial and interglacial intervals, reflecting climatic control on sedimentation, productivity, and bottom-water properties. The frequent occurrence of reworked Cenozoic and even Cretaceous microfossils within Holocene and late Pleistocene strata provides independent evidence for upward sediment transport driven by methane-rich fluids. Together, these datasets reveal a tightly coupled system in which methane stored in hydrates is episodically mobilized, transported, and consumed by microbial communities within shallow Amazon Fan sediments. Biomarkers provide direct evidence for active methane cycling, while microfossils document the stratigraphic and depositional framework that modulates hydrate stability and fluid migration. This integrated approach highlights the Amazon Deep-Sea Fan as a dynamic methane system, sensitive to both climatic forcing and sedimentary processes, with implications for carbon cycling along tropical continental margins.

How to cite: Rizzi, M. A. M., Brocks, J., Silva, T. F., Cagliari, J., Petró, S. M., Medina-Silva, R., Girelli, T. J., Augustin, A. H., Rodrigues, L. F., Santos, A. D. S., Leandro, L. M., Bruno, M. D. R., Guerra, R. D. M., Martarello, N. S., Fauth, G., Miller, D. J., Cupertino, J. A., and Chemale Jr, F.: Biogeochemical and micropaleontological constraints on methane in the Amazon Fan gas hydrate province, EGU General Assembly 2026, Vienna, Austria, 3–8 May 2026, EGU26-17939, https://doi.org/10.5194/egusphere-egu26-17939, 2026.

EGU26-18215 | ECS | Posters on site | BG4.4

Is There Methane Reflux from Bottom Waters into Sediments on the East Siberian Arctic Shelf?  

Lexa Lundqvist, Fangping Yan, and Örjan Gustafsson

Large fractions of the global subsea permafrost are located on the shallow East Siberian Arctic Shelf (ESAS), characterized by high methane ebullition and concentrations found over extensive scales, with atmospheric methane release estimated to be of the same scale as emissions from the rest of the World Oceans. Current research generally focuses on pinpointing the sources of subsea methane and understanding the release processes, by which methane migrates from the sediments, through the shallow water column and in part escapes to the atmosphere. A potentially neglected, yet critical question regarding the fate of the methane released from the subsea permafrost system is: can dissolved methane in the water column diffuse back down into sediment porewater with lower dissolved methane concentration?

Here, we investigate methane concentration gradients and estimate diffusive fluxes across the sediment–water interface on the ESAS. We compiled an extensive dataset of CH4 in sediments and overlying bottom water (n>100 stations), including both unpublished and published measurements collected during multiple expeditions between 2012 and 2020. Approximately 25% of the stations exhibit reversed concentration gradients, with higher CH4 concentrations in bottom waters than in surface sediments, indicating the potential for downward CH4 diffusion.

We propose that a substantial fraction of methane is released from the sediments to the seawater as bubbles, which then dissolves in the bottom water. A fraction of this methane diffuses back down into the surface sediment, where it may possibly be degraded by microbes – a process that mitigates how much of the total initial sediment release of methane that escapes to the atmosphere. We asses the magnitude of diffusive CH4 fluxes across the sediment water interface using Fick’s law. Aside from gradient strength, flux magnitude also depends on site specific conditions and properties such as sediment porosity, temperature, salinity, and bottom shear stress which controls the diffusive boundary layer thickness. The flux calculations indicate that the observed reversed gradients can result in a net diffusive flux of methane from the water column into the sediments, with the highest reflux estimated to be 11 mmol m-2 day-1

Our results suggest that ESAS sediments can alternately function as both a source and a sink for methane, challenging the prevailing view of a one-directional sediment-to-water flux. These findings highlight the need to further explore the potential of Arctic Shelf sediments acting as both a sink and source of methane as part of the dynamic sediment–water methane exchange processes.

How to cite: Lundqvist, L., Yan, F., and Gustafsson, Ö.: Is There Methane Reflux from Bottom Waters into Sediments on the East Siberian Arctic Shelf? , EGU General Assembly 2026, Vienna, Austria, 3–8 May 2026, EGU26-18215, https://doi.org/10.5194/egusphere-egu26-18215, 2026.

EGU26-18682 | ECS | Orals | BG4.4

Seasonal Dissolved Inorganic Carbon Dynamics in the East Frisian Wadden Sea: From Net Sink to Episodic Source 

Julia Meyer, Andrea Luebben, Helmuth Thomas, Yoana G. Voynova, and Bryce Van Dam

The intertidal system of the back-barrier area of Spiekeroog in the East Frisian Wadden Sea is biogeochemically dynamic and essential for understanding regional dissolved inorganic carbon (DIC) budgets. However, DIC fluxes in this region remain poorly quantified compared to total alkalinity (TA), limiting our understanding of coastal carbon cycling. From October 2021 to December 2022, a range of discrete and in-situ measurements were conducted. Using these data, a seasonal linear regression model was developed to estimate lateral DIC fluxes continuously and to investigate seasonal DIC source–sink dynamics.

Results indicate that the Wadden Sea acted as a net DIC sink to the adjacent North Sea, with an import of 0.711 ± 1.48 mol m⁻² d⁻¹ (equivalent to 3.58 Gmol yr⁻¹) in 2022. The strongest import rates occurred in winter 2021 and spring 2022, likely driven by sediment–water exchange, remineralization, and biological uptake. During summer, import rates were lower, although intensified photosynthetic activity and elevated TA continued to modulate DIC dynamics, promoting CO₂ uptake. In contrast, during autumn, the Wadden Sea episodically exported DIC to the North Sea, driven by enhanced remineralization of organic matter following the summer production peak, intensified sediment–water exchange, and physical processes such as wind-induced mixing and storm events.

Air-sea CO₂ exchange and submarine groundwater discharge (SGD) were integrated into the seasonal carbon budget, revealing significant internal retention and transformation of DIC within the system. The findings highlight the function of the Wadden Sea as a coastal carbon sink and demonstrate substantial seasonal variability. SGD also represents a major knowledge gap, emphasizing the need for integrated, high-resolution measurements and modelling to constrain regional carbon budgets and inform climate change mitigation strategies.

How to cite: Meyer, J., Luebben, A., Thomas, H., Voynova, Y. G., and Van Dam, B.: Seasonal Dissolved Inorganic Carbon Dynamics in the East Frisian Wadden Sea: From Net Sink to Episodic Source, EGU General Assembly 2026, Vienna, Austria, 3–8 May 2026, EGU26-18682, https://doi.org/10.5194/egusphere-egu26-18682, 2026.

EGU26-19027 | ECS | Orals | BG4.4

Spatial and Tidal Controls on Greenhouse Gas Dynamics in Temperate Coastal Bays of Northern New Zealand 

Julika Zinke, Nicolas-Xavier Geilfus, Simon Thrush, Anna Villnäs, Alf Norkko, and Christoph Humborg

Coastal bays are dynamic environments where both natural processes and human activities influence greenhouse gas (GHG) cycling. We investigated spatial and temporal variability of surface water CO₂, CH₄, and N₂O across coastal systems in northern New Zealand, spanning a gradient of ecological condition. Spatial surveys in Mahurangi Harbour, the Firth of Thames, the Hauraki Gulf and Auckland Harbour revealed pronounced heterogeneity in GHG distributions. Elevated CO₂ and CH₄ concentrations were consistently observed in upper bay reaches, particularly near mangrove-dominated areas, underscoring the role of tidal wetlands in coastal carbon dynamics. Distinct local hotspots of CH₄ and N₂O were detected in the Firth of Thames, associated with mussel aquaculture, suggesting aquaculture operations may enhance localized emissions. Complementary tidal investigations in Mahurangi and Whangateau Harbours highlighted higher CO₂ and CH₄ concentrations during low tide, linked to mangrove export, tidal pumping, and water-column processing. Notably, the persistence of elevated CO₂ at low tide under fully marine conditions highlights the strong influence of tidal wetlands and benthic processes, even in the absence of a salinity gradient. These measurements also demonstrated significant export of dissolved inorganic carbon (DIC) and alkalinity under fully marine conditions, indicating strong coupling between carbon cycling and exchange with the coastal ocean. To quantify these dynamics, a box-model approach incorporating DIC, total alkalinity, air–sea exchange, and export fluxes was applied to estimate carbon production and transformation. Together, these findings demonstrate how natural habitats and aquaculture activities jointly shape GHG fluxes and provide new insights into the spatial and tidal controls governing emissions in temperate coastal environments.

How to cite: Zinke, J., Geilfus, N.-X., Thrush, S., Villnäs, A., Norkko, A., and Humborg, C.: Spatial and Tidal Controls on Greenhouse Gas Dynamics in Temperate Coastal Bays of Northern New Zealand, EGU General Assembly 2026, Vienna, Austria, 3–8 May 2026, EGU26-19027, https://doi.org/10.5194/egusphere-egu26-19027, 2026.

EGU26-21243 | ECS | Orals | BG4.4

Salinity-driven controls on carbon cycling along the Gambia River (West Africa) 

Elsa Bisbal Regidor, Annemiek Stegehuis, Daniel von Schiller, Camille Minaudo, Momoudou (Jasseh) Faal, Amuzo Nkamnebe, Pablo Rodríguez-Lozano, and Núria Catalán García

The salinization of inland waters, driven by sea-level rise and anthropogenic activities, poses increasing threats to aquatic ecosystems and the human communities that depend on them. This process can alter the functioning of tidal rivers, particularly their biogeochemical cycles and their role as sources or sinks of carbon. The Gambia River, in West Africa, represents a key system for study: first, because the contribution of inland waters in this region—and in equatorial dry climates more broadly—to the global carbon cycle remains poorly quantified; second, due to its relatively intact hydrogeomorphology; and third, because its integrity is increasingly threatened by salinization linked to sea-level rise (~4 mm yr⁻¹ in the region), climate-driven changes in precipitation patterns, and upstream dam construction.

Within this context, we investigated how salinity influences key parameters of aquatic carbon cycling by combining seasonal and spatial sampling along the river–estuary continuum. We tested whether increasing salinity affects the concentrations, sources (δ¹³C isotopic signatures), and atmospheric emissions of dissolved greenhouse gases (CO₂ and CH₄), and how salinity gradients influence the availability and partitioning of carbon pools, including dissolved organic carbon (DOC), particulate organic carbon (POC), dissolved inorganic carbon (DIC), and alkalinity.

To measure these variables, along with ancillary parameters such as chlorophyll-a, total suspended solids, and nutrients, we conducted three sampling campaigns between 2024 and 2025 under dry, wet, and transitional seasonal conditions, covering 12 sites from freshwater reaches (~400 km inland) through the estuary to the coastal ocean. Each campaign also included intensive spatial sampling across salinity transition zones (67, 16, and 15 additional sites, respectively).

Preliminary analyses indicate that nutrients and ions exhibit relatively stable concentrations in freshwater reaches, increase at the onset of salinity intrusion, and stabilize again under fully saline conditions, with overall higher values in saline sections compared to freshwater. In contrast, CO₂ concentrations increase downstream in the river but decrease again across the salinity transition zone, remaining slightly higher in saline sections than in freshwater reaches, which can occasionally be undersaturated relative to the atmosphere, resulting in negative CO₂ fluxes. CO₂ patterns appear to be primarily associated with organic matter availability, closely following DOC distributions rather than salinity gradients, and showing an inverse relationship with chlorophyll-a, suggesting an important role of biological uptake in the upper river.

CH₄ dynamics, in contrast, show a stronger sensitivity to salinity, likely reflecting enhanced microbial competition with sulfate under saline conditions, which may reduce CH₄ production and emissions. Isotopic signatures indicate shifts in dominant methanogenic pathways, highlighting the role of organic matter composition and availability in controlling methane production pathways rather than absolute production rates.

Alkalinity was generally higher than DIC along the river–estuary continuum, and both variables deviated from conservative mixing at intermediate salinities (10–20), indicating the presence of in situ DIC production within the estuary. Together with the observed patterns in other carbon pools, these results demonstrate that salinity gradients exert differential controls on carbon species and associated biogeochemical processes along the Gambia River.

How to cite: Bisbal Regidor, E., Stegehuis, A., von Schiller, D., Minaudo, C., Faal, M. (., Nkamnebe, A., Rodríguez-Lozano, P., and Catalán García, N.: Salinity-driven controls on carbon cycling along the Gambia River (West Africa), EGU General Assembly 2026, Vienna, Austria, 3–8 May 2026, EGU26-21243, https://doi.org/10.5194/egusphere-egu26-21243, 2026.

EGU26-22346 | Posters on site | BG4.4

The control of physical and biological drivers on pelagic methane fluxes in a Patagonian fjord (Golfo Almirante Montt, Chile) 

Klaus Jürgens, Oliver Schmale, Volker Mohrholz, Svenja Papenmeier, Martin Blumenberg, Peter Feldens, Sebastian Jordan, Paula Ruiz-Fernández, Christian Meeske, Jenny Fabian, Sören Iwe, and Lars Umlauf

The methane flux from coastal water areas such as fjords and the underlying control mechanisms have been little studied to date. Fjords are characterized by a complex hydrography that is shaped by marine and limnic interactions and leads to a pronounced stratification of the water column. The resulting low ventilation of the deep water together with high primary production rates in the surface water and the subsequent transport of the organic material to the seabed often lead to high methane releases from the seabed. In our study, we analyzed a fjord system in the Chilean part of Patagonia, the Golfo Almirante Montt. The investigation is based on studies of water column methane concentration and stable carbon isotopes, the distribution and activity of methane-oxidizing bacteria, and oceanographic and geological observations. Our results indicate that methane is of biogenic origin is released from gas-rich sediments at the entrance of the main fjord basin, which is characterized by pockmarks and gas flares. Tidal currents and turbulent mixing at the sill cause a methane plume near the surface to spread into the main fjord basin and mix with the methane- and oxygen-depleted deep water. The wind-induced mixing at the sea surface controls the methane flux from the methane plume into the atmosphere. The methane plume is consumed mainly by methanotrophic bacteria. An enrichment of the signature gene particulate methane monooxygenase (pmoA) in the methane-poor deep water, and a conspicuously high δ13C-CH4 signature of the methane suggest that methane-rich intrusions are periodically introduced into the deep water, which are subsequently converted microbially. Our interdisciplinary study offers a comprehensive insight into the complex physical and biological processes that modulate methane dynamics in fjords and thus help to better assess how methane emissions from these systems will change under anthropogenic influence.

How to cite: Jürgens, K., Schmale, O., Mohrholz, V., Papenmeier, S., Blumenberg, M., Feldens, P., Jordan, S., Ruiz-Fernández, P., Meeske, C., Fabian, J., Iwe, S., and Umlauf, L.: The control of physical and biological drivers on pelagic methane fluxes in a Patagonian fjord (Golfo Almirante Montt, Chile), EGU General Assembly 2026, Vienna, Austria, 3–8 May 2026, EGU26-22346, https://doi.org/10.5194/egusphere-egu26-22346, 2026.

EGU26-22802 | Posters on site | BG4.4

Carbon cycling and CO₂ emissions from French Atlantic estuaries: a regional modeling approach using a generic estuarine model 

Goulven G. Laruelle, Arthur Capet, Antoine Casquin, Vincent Thieu, Marie Silvestre, and Pierre Regnier

The Land–Ocean Aquatic Continuum (LOAC) is a critical and complex component of the global carbon cycle, regulating the transfer, transformation, and evasion of carbon from terrestrial ecosystems to the coastal ocean. Last layer of this continuum before the coastal ocean, estuaries play a dual role: 1) as reactors that process organic and inorganic carbon and 2) as sometimes significant sources of CO₂ emissions to the atmosphere compared to their modest surface areas. These processes are tightly controlled by a wide array of external factors including upstream land-based emissions (influenced by lithological context, land use, etc.), riverine transport and in-stream biogeochemical transformations, as well as internal estuarine morphology, hydrodynamics and metabolism. With over 50 000 estuaries worldwide and a wide heterogeneity between systems, performing an exhaustive carbon budget analysis, even regionally is a major but necessary challenge to better constrain the carbon land-ocean exchange and the contribution of estuaries to CO2 budgets.

To investigate the coupling between lateral carbon fluxes and atmospheric CO₂ exchanges over a continuous stretch of coast, batch simulations of the 1D depth integrated generic estuarine hydrological/biogeochemistry C-GEM has emerged as a suitable solution because of its design build on limited data and computing demand. In an application on the Atlantic French coast, estuarine dynamics were explicitly represented in time and space for 35 selected macro-tidal estuaries. This regional application quantifies the cascading fluxes of Organic Carbon (OC), Dissolved Inorganic Carbon (DIC), from the upstream influence of tides to the estuarine outlets, while simulating air–water CO₂ exchanges within estuaries. This exercise is based on a structured database that compile an exhaustive inventory of all aquatic measurements at the upstream boundary of the estuarine modelling domain (for all watersheds larger than 300 km²), as well as along the estuarine longitudinal profiles themselves for model validation.

Our integrated approach allows the establishment of a consistent regional carbon budgets that account for terrestrial inputs and estuarine processing, coastal exports, and CO₂ evasion to the atmosphere. Our simulations indicate that estuaries along the French Atlantic coast act predominantly as net sources of CO₂, with strong spatial variability driven by size, watershed characteristics, riverine carbon loads, and estuarine residence times. The fraction of riverine carbon loads that is outgassed towards the atmosphere as CO2 within the estuary ranges from a few percents to 20% from the smaller systems to the largest. By detailing the nature and intensity of carbon fluxes in the LOAC estuarine compartment, this work highlights the importance of proposing integrated land-sea modelling approaches that explicitly include estuarine interfaces in order to constrain regional carbon budgets and national and continental greenhouse gas inventories. Moreover, it opens to door to longer time scale simulations to disentangle the natural component of the global estuarine carbon budget from its anthropic perturbation, partitioning that is currently virtually unknown.

How to cite: Laruelle, G. G., Capet, A., Casquin, A., Thieu, V., Silvestre, M., and Regnier, P.: Carbon cycling and CO₂ emissions from French Atlantic estuaries: a regional modeling approach using a generic estuarine model, EGU General Assembly 2026, Vienna, Austria, 3–8 May 2026, EGU26-22802, https://doi.org/10.5194/egusphere-egu26-22802, 2026.

EGU26-165 | ECS | Orals | BG4.5

Ambition Disparity Reveals Unlocked Mitigation Potential for Blue Carbon in the Paris Agreement  

Radhika Bhargava, Anabel Kadri, Maria Fernanda Adame, Natasha Bhatia, Peter Ian Macreadie, Michiel van Breugel, Sai Qu, Jacob Bukoski, Stacy Baez, Miguel Cifuentes-Jara, Hao Tang, and Daniel A Friess

The Paris Agreement aims to keep the global temperature rise under 2°C, which is implemented through National Greenhouse Gas Inventory Reports (NIRs) and Nationally Determined Contributions (NDCs). Blue carbon ecosystems, despite substantive climate change mitigation potential, remain underutilised in the Paris Agreement. We analysed over 1700 NDCs and NIRs submitted since 2015 to identify inclusion and quantify mitigation gaps in the utilisation of blue carbon ecosystems (mangroves, seagrasses, tidal marshes, and tidal flats) in the context of the Paris Agreement. 33% of the blue carbon-holding countries have incorporated them into NIRs, and 19% have set quantifiable NDC targets, with Non-Annex I Parties making much of this contribution. Only 13.4 Gt CO₂ eq of blue-carbon mitigation is currently pledged, yet Non-Annex I Parties hold nearly twice the untapped potential (68.7 Gt CO₂ eq) compared to Annex I Parties (35.5 Gt CO₂ eq), highlighting both the opportunity and the imbalance. Full protection and restoration of blue-carbon ecosystems could sequester 122.3 Gt CO₂ eq by 2050—roughly 2.5 years of global emissions from all sectors. Closing this gap would elevate blue carbon from a marginal opportunity to a core component of global mitigation, while enhancing the resilience and improving the livelihoods of coastal communities. 

How to cite: Bhargava, R., Kadri, A., Adame, M. F., Bhatia, N., Macreadie, P. I., van Breugel, M., Qu, S., Bukoski, J., Baez, S., Cifuentes-Jara, M., Tang, H., and Friess, D. A.: Ambition Disparity Reveals Unlocked Mitigation Potential for Blue Carbon in the Paris Agreement , EGU General Assembly 2026, Vienna, Austria, 3–8 May 2026, EGU26-165, https://doi.org/10.5194/egusphere-egu26-165, 2026.

EGU26-344 | ECS | Posters on site | BG4.5

Filamentous epiphyte diversity and abundance on the leaves of Oceana serrulata in Kayankerni Marine Sanctuary of Sri Lanka 

Charuka Sandaruwan, Hiranya Kelum Wijenayake, Sevvandi Jayakody, Sujeewa De Silva, Mike Van Keulen, and Susantha Udagedara

email-charukasadanruwan@gmail.com

Abstract

Seagrass leaves provide microhabitat for epiphytic organisms but knowledge on epiphytic fauna and associated bionts in seagrass are limited. In addition, seasonal changes in population structure of epiphytic communities have not been studied widely under Sri Lankan context. This abstract presents the diversity and abundance of filamentous epiphytic algal communities on the leaves of Oceana serrulata in Kayankerni Marine Sanctuary in Eastern coast of Sri Lanka. Leaves of Oceana serrulata were collected once a month from August 2024 to January 2025 and preserved with 5% formaldehyde. Leaves were measured and divided into three similar sections and labelled as tip, middle, basal parts. Ten randomly selected leaves per month were subjected to identify the filamentous epiphytes and their abundance. Epiphyte species were identified up to genus level using guide, key and published literature. Percentage epiphytic cover of each section of leaves was estimated using the microscopic field as the sample unit under 10*10 magnification. Shanon-Wiener diversity index, Pielou’s evenness index and Dominance index for each month calculated. Arcsine converted data of epiphytic cover on entire leaf-blades among different months were compared using ANOVA to identify the temporal variations. In addition, the percentage epiphytic cover of each species among sampling occasions were compared using ANOVA. Six genera of filamentous epiphytes were reported from leaf blades and were Ulva, Gayliella, Hydrolithon, Myrionema, Herposiphonia and Calaconema. Genus Ulva reported three (03) distinct species while others reporting single species each accounting the species richness of filamentous algae up to eight (08). Percentage epiphytic cover on the leaf blades was ranged from 11.25% to 1.18% reporting the highest epiphytic cover in August and lowest in January. Contribution of different genera to total epiphytic cover was reported as follows: Ulva spp. (27.87%), Gayliella sp. (26.63%), Hydrolithon sp. (22.04%), Myrionema sp. (12.03%), Herposiphonia sp. (11.04%), and Calaconema sp. (0.38%). The abundance of Gayliella sp., Herposiphonia sp., Ulva sp.1, and Ulva sp.2 have been reducing gradually from August to January, while Myrionema sp. and Ulva sp.3 were reported throughout the sampling period in low abundance. Calaconema sp.was reported varying levels in low abundance during the sampling period. Abundance of Gayliella sp. and Herposiphonia sp. was significantly higher (p<0.05) in November compared to other months. Ulva sp.1 was significantly higher in September and November (p<0.05) than other months. Hydrolithon sp. was significantly higher (p<0.05) in  November than other months. Abundance of Ulva sp.2, Calaconema sp., Myrionema sp., and Ulva sp.3 have no significant differences (p<0.05) among the months. Shanon-Wiener diversity index has been gradually reduced from August (1.66) to January (0.48). Shanon-Wiener diversity index change in different parts with following pattern tip<middle<base in each month respectively. Pielou’s evenness index was reported 0.80,0.81,0.69,0.77,0.91 from August to December and significant reduction in January (0.35). The dominance index was highest in January (0.76) and ranged from 0.23 to 0.32 from August to November respectively. These results indicate the changes of epiphytic diversity on Oceana serrulata during the Sampling period and their abundances.

Keywords: Seagrass, Filamentous marine algae, Diversity indices, Temporal changes in marine epiphytes

How to cite: Sandaruwan, C., Kelum Wijenayake, H., Jayakody, S., De Silva, S., Van Keulen, M., and Udagedara, S.: Filamentous epiphyte diversity and abundance on the leaves of Oceana serrulata in Kayankerni Marine Sanctuary of Sri Lanka, EGU General Assembly 2026, Vienna, Austria, 3–8 May 2026, EGU26-344, https://doi.org/10.5194/egusphere-egu26-344, 2026.

EGU26-1285 | ECS | Posters on site | BG4.5

Temperature Modulates Recalcitrant Dissolved Organic Carbon Production by Coastal Macrophytes: An Underestimated Blue Carbon Pathway 

Alba Yamuza Magdaleno, Tomás Azcárate-García, Luis G. Egea, Xosé Antón Álvarez-Salgado, Hauke Reuter, Fernando G. Brun, and Pedro Beca-Carretero

Marine macrophytes play a significant role in the marine carbon cycle by releasing dissolved organic carbon (DOC), including a recalcitrant fraction with potential for long-term carbon sequestration. Here, we investigated how warming and the presence of an invasive species affect DOC dynamics in different native temperate macrophyte communities (Zostera noltei, Cymodocea nodosa and Caulerpa prolifera) from the south of the Iberian Peninsula, a transitional habitat between Atlantic and Mediterranean marine regimes. Additionally, we introduced a standardized framework to link DOC release to internal carbon content, facilitating comparisons of blue carbon pathways among macrophyte communities across diverse ecosystems. Controlled mesocosm experiments across three temperatures (24, 26 and 28 °C) revealed that the presence of the invasive seagrass Halophila stipulacea did not significantly alter the carbon metabolism or DOC fluxes of native macrophytes. However, temperature significantly affected both the quantity and composition of the released DOC. In particular, recalcitrant DOC decreased by 28%, while labile DOC increased by a similar proportion as temperature rose, and bioavailable DOC decay rates also declined significantly at higher incubation temperatures of the tested macrophytes. These results suggest that warming may enhance both net and labile DOC production, while the remaining DOC is less bioavailable than that produced at lower temperatures. This clearly indicates that warming restructures DOC composition, potentially reducing coastal carbon storage capacity and the role of recalcitrant DOC. By applying our proposed standardization, we estimate that the recalcitrant fraction produced in the tested macrophyte communities was comparable in magnitude, although 1.41 higher, to the carbon burial rates in the sediment measured in the same communities, which underscores the potential contribution of recalcitrant DOC produced by macrophyte communities to the long-term carbon storage. This standardized approach positions recalcitrant DOC as a crucial climate-sensitive blue carbon pathway that should be integrated into global carbon budget estimates. 

How to cite: Yamuza Magdaleno, A., Azcárate-García, T., Egea, L. G., Álvarez-Salgado, X. A., Reuter, H., Brun, F. G., and Beca-Carretero, P.: Temperature Modulates Recalcitrant Dissolved Organic Carbon Production by Coastal Macrophytes: An Underestimated Blue Carbon Pathway, EGU General Assembly 2026, Vienna, Austria, 3–8 May 2026, EGU26-1285, https://doi.org/10.5194/egusphere-egu26-1285, 2026.

EGU26-1734 | ECS | Posters on site | BG4.5

Rainfall deficit reduces biodiversity and destabilizes a non-tidal coastal wetland 

Xueke Wang, Liming Yan, Ming Jiang, Zhenyu Wang, Baoyu Sun, Huizhu Li, Jiamin Shi, Wei Liu, Guangxuan Han, and Jianyang Xia

Rainfall deficits are reshaping plant communities worldwide, yet their impacts on non-tidal coastal wetlands remain unclear. In non-tidal systems, rainfall is essential for flushing soil salts and sustaining biodiversity. Here, we tested the hypothesis that rainfall deficit undermines ecosystem stability by eroding biodiversity in such systems. We conducted a seven-year experiment in the Yellow River Delta, simulating summer-autumn rainfall loss under both ambient and elevated winter-spring temperatures. Rainfall loss increased soil salinity (+43.3% under ambient; +25.2% under warming), promoted stress-tolerant species dominance (+36.9%; +8.76%), and reduced species richness (-26.6%; -14.7%). These shifts led to a consistent decline in community stability. Analytical partitioning demonstrated that this destabilization was primarily driven by biodiversity loss rather than by dominance or compensatory effects. Structural equation modeling further confirmed the rainfall-biodiversity-stability pathway. Our findings show that rainfall deficit destabilizes non-tidal coastal wetlands by weakening biodiversity-based buffering, revealing an overlooked vulnerability to intensifying climate extremes.

How to cite: Wang, X., Yan, L., Jiang, M., Wang, Z., Sun, B., Li, H., Shi, J., Liu, W., Han, G., and Xia, J.: Rainfall deficit reduces biodiversity and destabilizes a non-tidal coastal wetland, EGU General Assembly 2026, Vienna, Austria, 3–8 May 2026, EGU26-1734, https://doi.org/10.5194/egusphere-egu26-1734, 2026.

The mangrove wetlands are recognized as very important in the process of carbon sequestration, but the fluctuation in salinity, the development of the aquaculture, and deforestation pose a threat to the ecological balance and the welfare of the local society. Our long term study at the Indian Sundarbans on restoration model of mangrove ecosystems revealed interconnectivity of community participation and multispecies mangrove restoration on blue carbon pool. In this study, five mangrove species (Avicennia marina, Bruguiera sexangula, Ceriops tagal, Rhizophora mucronata and Xylocarpus moluccensis) were investigated in a degraded mudflats area of 102 hectares located on Satjelia Island on how they can be restored. The analysis of geochemical indicators of soil, including organic carbon (SOC) and organic carbon density (OCD), humic and fulvic acids, and the evaluation of community participation contribute to creating a comprehensive picture of what the ecosystem recovery process is all about.

It can be seen that introduction of Avicennia marina as a propagule, using a dibbling technique has been a notably successful one, as there is low cost per survivor and a notable growth rate in OCD of more than 90 per cent over a five-year time. An analysis of chronosequence suggests that the mangrove plantations have significantly increased the sequestration of carbon in the uppermost soils layers which provides a stark difference to the insignificant increases in the natural Proteresia coarctata mudflats. Local communities involvement through forest committees has also played a big role in the survival of saplings, reduction of grazing pressures as well as the overall success of the restoration efforts. Study indicates a better blue carbon pool and survival rate of species (R. mucronata, S. caseolaris and A. marina) for community managed restoration site. This research highlights the need to integrate the ecological and community level interventions by means of a multisided approach for an effective mangrove restoration. The findings show that the recovery of the mangrove ecosystems can result in desirable modifications on the soil geochemistry, as indicates by geochemical carbon indicators such as humic acid, fulvic acid and blue carbon pool, which can contribute to the increase of the coastal resilience. Furthermore, the combination of these activities with participatory governance models is a scalable and powerful approach to a contribution to the global climate change mitigation agenda including REDD+ and SDG14 targets. The example of the Indian Sundarbans is the way in which mangrove can be restored as a two-fold solution to serve dual objectives, both environmental and community development, and be a precursor to community-based climate action projects.

How to cite: Chowdhury, A., Naz, A., and Bhattacharyya, S.: Geochemistry Meets Community: Multispecies Mangrove Restoration Driving Blue Carbon Sequestration in the Indian Sundarbans, EGU General Assembly 2026, Vienna, Austria, 3–8 May 2026, EGU26-1867, https://doi.org/10.5194/egusphere-egu26-1867, 2026.

EGU26-2336 | ECS | Orals | BG4.5

Accounting for winter: freeze-thaw controls on salt marsh-creek water and carbon exchange 

Julia Guimond, Elisabeth Boles, Talia Cartafalsa, Meagan Eagle, and Joseph Tamborski

Salt marshes are among the most carbon-dense ecosystems on Earth, yet their net climate benefit depends on carbon exchanges across the atmosphere-soil-water continuum, including lateral export to adjacent coastal waters. Most mechanistic understanding of lateral exchanges is derived from warm-season observations, leaving uncertainties about how cold-season conditions regulate soil-water connectivity and associated solute and carbon transport. We address this gap using year-round, high-frequency measurements of soil temperature, groundwater and surface-water elevations, and tidal creek discharge across multiple New England salt marshes (Gouldsboro, northern Maine; Wells, southern Maine; and Chatham, Cape Cod, Massachusetts). Soil temperatures decreased with latitude, and sustained freezing occurred at both Maine sites from December through mid-March. Within marshes, freezing was strongly elevation-dependent: creek beds remained unfrozen due to persistent exposure to relatively warm, saline seawater, whereas higher-elevation platforms that were inundated less frequently froze to depths of 25-30 cm. Despite frozen ground, we observed minimal seasonal changes in water-table fluctuations. However, reduced hydraulic conductivity during winter suggests diminished but ongoing water and solute exchange between marsh sediments and tidal creeks. Together, these observations indicate that cold-season freeze-thaw alters marsh-creek exchange but does not eliminate lateral water and solute export to tidal channels. Incorporating cold-season controls on marsh-creek exchange and lateral export into marsh carbon assessments is essential for closing year-round carbon budgets and evaluating blue carbon under changing winter conditions and inundation regimes.

How to cite: Guimond, J., Boles, E., Cartafalsa, T., Eagle, M., and Tamborski, J.: Accounting for winter: freeze-thaw controls on salt marsh-creek water and carbon exchange, EGU General Assembly 2026, Vienna, Austria, 3–8 May 2026, EGU26-2336, https://doi.org/10.5194/egusphere-egu26-2336, 2026.

EGU26-3244 | Orals | BG4.5

Blue carbon dynamics following widespread seagrass loss across tropical coastal sediments in Thailand 

Milica Stankovic, Lutfee Hayeewachi, Muhammad Halim, and Anchana Prathep

Seagrass ecosystems are major sinks of sedimentary organic carbon (Corg), but the temporal changes of the Corg following the seagrass loss remains limited, particularly across different gradients of disturbance severity. In this study, the temporal changes of the sedimentary Corg across nine intertidal seagrass meadows along Andaman coast and Gulf of Thailand were estimated, by combining historical data sets (2015-2021) with the field re-sapling in 2025 following the same protocols. Sediment properties and Corg stocks were analyzed for the surface sediments (0-20 cm) and whole sediment cores using mixed effect models.

Sites that were affected by the long-term or complete seagrass loss had substantial decline in sedimentary Corg stocks, with annual losses up to 17 Mg C ha⁻¹ yr⁻¹ and associated potential CO2 emissions over 60 Mg CO₂ ha⁻¹ yr⁻¹. These Corg losses are accompanied by decreases in dry bulk density and Corg content, indicating sediment softening and destabilization and reduced organic inputs. On the other hand, sites with partial loss and intact seagrass meadows showed different trajectories: some meadows retained long term Corg stocks with some surface losses, while others exhibited net declines in both surface and long term Corg stocks despite low changes of Corg content. This indicates that Corg enrichment does not ensure long-term carbon retention where physical sediment reorganization and lateral redistribution dominate.

Our results demonstrate that seagrass loss severity and sediment physical dynamics jointly regulate sedimentary carbon stability and CO₂ release. Distinguishing between surface reworking and whole-core carbon loss is therefore essential for accurately assessing blue carbon vulnerability and for integrating seagrass degradation into coastal carbon budgets, greenhouse-gas inventories, and climate mitigation strategies.

How to cite: Stankovic, M., Hayeewachi, L., Halim, M., and Prathep, A.: Blue carbon dynamics following widespread seagrass loss across tropical coastal sediments in Thailand, EGU General Assembly 2026, Vienna, Austria, 3–8 May 2026, EGU26-3244, https://doi.org/10.5194/egusphere-egu26-3244, 2026.

EGU26-5773 | ECS | Orals | BG4.5

Sources, Sinks and Subsidies of Organic Carbon in Saltmarsh Habitats  

Alex Houston, Mark H Garnett, and William E N Austin

Saltmarshes accumulate and store organic carbon through the drawdown of atmospheric CO2 by photosynthesising vegetation (autochthonous carbon), and the deposition of externally derived carbon (allochthonous) during tidal inundation. These organic carbon sources can be different ages and remain stored in the soil for variable lengths of time, from minutes to millennia. International policy frameworks recognise that the management of saltmarshes can provide a climate mitigation service, yet uncertainties remain regarding the inclusion of allochthonous organic carbon in saltmarsh projects.

We employed a novel methodology to compare the radiocarbon (14C) contents of saltmarsh soils and CO2 evolved from aerobic laboratory incubations to show that young (14C-enriched) organic carbon is preferentially respired over old (14C-depleted) organic carbon. The 14C contents of the respired CO2 were compared to the 14C content of carbon pools defined by their thermal reactivity, measured by ramped oxidation. In most cases, the 14C content of the most thermally labile carbon pool was closest to the 14C content of the CO2 evolved from aerobic incubations of the same soils, suggesting the thermal and biological lability of saltmarsh soil carbon in oxic conditions is closely related. These results highlight the role of saltmarshes as stores of both old, thermally recalcitrant organic carbon, as well as younger, thermally labile organic carbon. Management interventions, such as restoration, may help mitigate CO2 emissions by limiting oxygen exposure and preserving these stores of thermally labile carbon.

We also highlight inconsistencies in the treatment of allochthonous carbon across blue carbon (saltmarsh, seagrass and mangrove) accounting methodologies. A review of these frameworks and their scientific basis reveals a lack of standardized, evidence-based approaches for determining the proportion of allochthonous carbon that should be discounted in additionality calculations. This research provides crucial evidence towards addressing these gaps and improving the robustness of blue carbon policy and accounting.

How to cite: Houston, A., Garnett, M. H., and Austin, W. E. N.: Sources, Sinks and Subsidies of Organic Carbon in Saltmarsh Habitats , EGU General Assembly 2026, Vienna, Austria, 3–8 May 2026, EGU26-5773, https://doi.org/10.5194/egusphere-egu26-5773, 2026.

Mangroves are increasingly positioned at the centre of “blue carbon” strategies, yet carbon-centric planning can obscure the broader ecosystem service (ES) bundle that underpins coastal resilience, biodiversity outcomes, and social legitimacy. We synthesize how multiple mangrove ES are studied alongside carbon sequestration and discuss implications for regions that may become suitable for mangroves under climate change, with a brief connection to ongoing coastal forest research on Jeju Island, Republic of Korea.
We searched Web of Science using “mangrove*”, “blue carbon”, and “carbon”, screened 813 records, and analysed 423 site-based studies. Each study was coded by country, research approach (experiment, observation, modelling, remote sensing, secondary synthesis, survey/interview, and policy analysis), and ES classes using the Common International Classification of Ecosystem Services (CICES v4.3). Research effort was geographically uneven across 59 countries (plus global multi-region studies), and study effort increased with national mangrove extent (Spearman ρ = 0.53, p < 0.0001), indicating that evidence is concentrated where mangroves already dominate coastal landscapes.
Multi-service integration was limited: only ~22% of studies investigated more than one ES, restricting insight into synergies and trade-offs required for robust management and safeguards. Regulating services dominated the co-assessments with carbon sequestration, most commonly nutrient cycling, soil formation, and coastal protection. Provisioning services (e.g., fishing and biomass) and cultural services (e.g., recreation) were studied less frequently. Critically, stakeholder engagement remained minimal, only ~5% of studies incorporated perspectives from local communities, policymakers, or other relevant groups, highlighting a gap between biophysical evidence and decision pathways that govern implementation, equity, and long-term maintenance.
These evidence gaps are increasingly consequential under climate-driven poleward expansion. Jeju Island is a subtropical - temperate transition zone where true mangroves are not yet established, but semi-mangrove species (e.g., *Hibiscus hamabo* and *Paliurus ramosissimus*) occur within coastal shrub, forest mosaics and provide regulating and habitat functions comparable to widely cited mangrove co-benefits. Current monitoring by the National Institute of Forest Science is structuring protocols that jointly quantify vegetation structure and composition, plant physiological performance, and carbon pools (aboveground biomass and soil carbon), while also documenting co-benefits relevant to coastal hazard buffering and biodiversity conservation.
We conclude that mangrove planning, especially in future-suitable regions, should shift from single-metric carbon optimisation to a multifunctional ES framework supported by harmonised monitoring and early stakeholder integration to anticipate trade-offs and maximise durable climate, biodiversity, and livelihood outcomes.
This research was conducted at the Warm-Temperate and Subtropical Forest Research Center, National Institute of Forest Science (Project No. FE-2022-04-2025).

How to cite: Lee, B., Lee, H., Kim, H., and Park, E.: Integrating Multiple Ecosystem Services into Mangrove Management: Evidence Synthesis and Insights from Emerging Habitats in Jeju Island (Korea), EGU General Assembly 2026, Vienna, Austria, 3–8 May 2026, EGU26-6286, https://doi.org/10.5194/egusphere-egu26-6286, 2026.

EGU26-8199 | ECS | Posters on site | BG4.5

Mangrove Degradation in a Megacity: Linking Tree-Ring δ¹⁵N with Local Ecological Perceptions in Mumbai 

Karin Uruma, Nobuhito Ohte, and Shilpi Srivastava

Mangrove forests provide critical ecosystem services, including carbon sequestration, coastal protection, and support for local livelihoods. Although global conservation efforts have slowed the rate of mangrove area loss, degradation remains a persistent challenge, particularly in rapidly urbanizing coastal regions.

In megacities such as Mumbai, India, mangrove conservation policies are in place. However, intense urban development, population growth, and pollution pressures continue to undermine ecosystem functioning. Nutrient influx from urban sewage has caused pronounced eutrophication, potentially constraining mangrove productivity and carbon storage capacity. At the same time, conservation policies have often been implemented with limited participatory engagement, restricting traditional access to mangrove resources by the indigenous fishing community known as the Kolis. As a result, the perceptions and knowledge of the Koli community remain weakly integrated into mangrove conservation in Mumbai.

This study aims to elucidate the temporal progression of mangrove degradation accompanying Mumbai’s urbanization and to examine how the life experiences and environmental perceptions of the Kolis have transformed over this period. We adopted an interdisciplinary approach integrating ecological and social data. Ecological assessments included water quality measurements and nitrogen stable isotope (δ¹⁵N) analysis of tree rings of Avicennia marina, used as a time-integrated indicator of anthropogenic nitrogen. These data were complemented by semi-structured and group interviews with the Kolis, focusing on changes in mangrove use, livelihoods, and environmental conditions.

The results show elevated δ¹⁵N values recorded in the tree rings of mangroves growing in close proximity to sewage sources, indicating sustained anthropogenic nitrogen inputs over time. Meanwhile, the Koli communities demonstrated a clear awareness of environmental changes in mangrove forests and reported that fisheries commercialization, urbanization, and environmental policies have substantially altered their relationships with mangrove ecosystems. Importantly, local perceptions of environmental change were found to be largely consistent with the ecological evidence. These results underscore that the local communities, such as the Kolis, play a frontline role in perceiving environmental change, and that their knowledge is essential for effective mangrove conservation in urban coastal areas.

This study demonstrates that mangrove degradation in urban coastal areas is reflected in both ecological indicators and local environmental perceptions, highlighting the importance of integrating local knowledge into mangrove degradation assessment and conservation strategies.

How to cite: Uruma, K., Ohte, N., and Srivastava, S.: Mangrove Degradation in a Megacity: Linking Tree-Ring δ¹⁵N with Local Ecological Perceptions in Mumbai, EGU General Assembly 2026, Vienna, Austria, 3–8 May 2026, EGU26-8199, https://doi.org/10.5194/egusphere-egu26-8199, 2026.

EGU26-8226 | Posters on site | BG4.5

Pan-European Assessment of Saltmarsh Soil Organic Matter Reactivity 

William Austin and Alexander Houston

Saltmarshes trap and store organic matter from different sources with different soil turnover times. Constraining drivers of variability in soil organic matter turnover are crucial for quantifying the potential climate mitigation achieved through targeted management interventions on saltmarsh habitats (e.g., restoration). Better constraining saltmarsh soil organic matter turnover on a continental scale would improve the scientific evidence base for the integration of these important carbon stores into policy frameworks and guide priority actions and decision making.

We undertook thermogravimetric analysis of newly collected and archived samples to measure the thermal reactivity of saltmarsh soil organic matter across Europe. Here, we present the first estimate of saltmarsh soil organic matter reactivity on a pan-European scale. We present preliminary evidence to suggest that saltmarsh soils which have larger stores of thermally labile organic matter generate higher greenhouse gas fluxes under exposure to aerobic conditions. We propose that measuring the thermal lability of soil organic matter could be useful when targeting management actions on saltmarsh habitats to achieve emissions reductions.

If you would be interested in contributing samples (these can be cold-stored or dried archival material, or potentially new collections) and being part of a collaborative effort to understand the reactivity of the organic matter stored in pan-European saltmarshes, please visit this poster.

How to cite: Austin, W. and Houston, A.: Pan-European Assessment of Saltmarsh Soil Organic Matter Reactivity, EGU General Assembly 2026, Vienna, Austria, 3–8 May 2026, EGU26-8226, https://doi.org/10.5194/egusphere-egu26-8226, 2026.

EGU26-8684 | ECS | Posters on site | BG4.5

High-Density Sampling Reveals Seasonal Spatiotemporal Variations in Partial Pressure of Carbon Dioxide in a Tropical Lagoon 

Fei-Ling Yuan, Wei-Jen Huang, Veran Weerathunga, Kai-Jung Kao, Chai-Yu Lai, Chun-Yuan Wang, Ting-Hsuan Lin, James T. Liu, Jain-Jhih Chen, and Wen-Chen Chou

Lagoons are recognized as net sources of carbon dioxide (CO2) to the atmosphere, with pronounced spatial and diurnal variability in partial pressure of CO2 (pCO2) and air–water CO2 fluxes. Furthermore, these spatiotemporal variabilities are affected by seasonal weather changes associated with the terrestrial inputs from nearby human activities on land. Such dynamic pCO2 variations rely on a high-density sampling strategy, with five to six lab-made CO2 buoys deployed for over 24 hours across Chiku Lagoon, Tainan, Taiwan, measuring water temperature, salinity, and pCO2 every minute. Four field campaigns were conducted during January 2022, April 2023, August 2020, and September 2021 to investigate the seasonal variability. This high-density sampling strategy has revealed pronounced pCO2 changes among four campaigns, with the highest average pCO2 value in August 2020 (1931±980 μatm) and the lowest average value in April 2023 (732±228 μatm). Across all sampling periods, the lagoon acted as a net source of atmospheric CO2 (1.3±1.4 mmol m–2 h–1), with the strongest average emission in August 2020 (1.9±3.2 mmol m–2 h–1), which was twice higher than the average emission in April 2023 (0.9±1.2 mmol m–2 h–1). Through analyzing pCO2 deviations from a two end-member mixing model, shifting between biological activity (photosynthesis and respiration) and tidal-induced mixing processes were revealed across seasons. In August 2020, biological activity was the dominant factor on pCO2 changes, while the mixing effect and biological activity both controlled pCO2 changes in January 2022 and April 2023. Additionally, Chiku Lagoon was found to act as a CO2 source while functioning as a net autotrophic system in August 2020. These findings underscore the necessity of high-density sampling to resolve rapid and dynamic carbon cycling in tropical lagoons across diurnal, spatial, and seasonal scales, thereby providing a foundation for regional environmental management and offering strategies to assess the carbon footprint and enhance carbon neutrality in local industries.

How to cite: Yuan, F.-L., Huang, W.-J., Weerathunga, V., Kao, K.-J., Lai, C.-Y., Wang, C.-Y., Lin, T.-H., Liu, J. T., Chen, J.-J., and Chou, W.-C.: High-Density Sampling Reveals Seasonal Spatiotemporal Variations in Partial Pressure of Carbon Dioxide in a Tropical Lagoon, EGU General Assembly 2026, Vienna, Austria, 3–8 May 2026, EGU26-8684, https://doi.org/10.5194/egusphere-egu26-8684, 2026.

EGU26-9677 | ECS | Posters on site | BG4.5

Root exudate analogues increase soil CO2 emission, iron concentration, and acidity in mangroves 

Marie Arnaud, Catherine E. Lovelock, Aurelia Mouret, Dang Thuong Huyen, Sarah Louise Robin, Samuel Abiven, Amrit Kumar Mishra, Syed Hilal Farooq, Tuhin Bhadra, Axel Felbacq, Cyril Marchand, Nicolas Bottinelli, Ahmad AlAldrie Amir, Johanna Pihlblad, Sami Ullah, and Cornelia Rumpel

Mangroves are carbon dense ecosystems. Their root exudates could remobilise buried soil organic matter in the form of CO2 emission, notably by stimulating organic matter decay indirectly via an exudate sugar-driven and microbially mediated pathway, or directly by the breakage of organo-mineral bonds. Here, we used a manipulative laboratory incubation to test the effect of root exudate type on CO2 emission in two contrasting mangrove soils: a peat soil with mostly particulate organic matter (Dumbea, New Caledonia, France) and a mineral soil dominated by organo-mineral associations (Can Gio, Vietnam). Using a custom-made 20 cm long needle with a side-port near the tip,we spiked two exudates types, oxalic acid and glucose, into the mineral and organic mangrove soils. The soil CO2 emission was quantified with a gas analyser over time. Iron and pH were mapped at high spatial resolution using two-dimensional Diffusive Equilibrium Thin-films (2D-DET) gels. The root exudate inputs significantly increased the CO2 emission in both mangroves (by an order of magnitude; p< 0.01). The organic rich and mineral mangrove soil CO2 emission responded similarly to both root exudate types. There was no difference in soil CO2 emission between glucose and oxalic acid treatment. Oxalic acid reduced the soil pH consistently across the vertical soil profile in the mineral mangrove soil, while in the peat soil there was a sharp pH decrease in the few top millimetres of soil. For both soil types, the iron concentration was multiplied by an order of magnitude under oxalic acid treatment with a peak in the soil surface, and was slightly increased under glucose treatment. Our results reveal that root exudation could be a major driver of carbon, pH, and iron dynamics in mangrove soils. These findings highlight the importance of understanding root-soil interaction to constrain mangrove carbon budgets.

How to cite: Arnaud, M., Lovelock, C. E., Mouret, A., Huyen, D. T., Robin, S. L., Abiven, S., Kumar Mishra, A., Hilal Farooq, S., Bhadra, T., Felbacq, A., Marchand, C., Bottinelli, N., AlAldrie Amir, A., Pihlblad, J., Ullah, S., and Rumpel, C.: Root exudate analogues increase soil CO2 emission, iron concentration, and acidity in mangroves, EGU General Assembly 2026, Vienna, Austria, 3–8 May 2026, EGU26-9677, https://doi.org/10.5194/egusphere-egu26-9677, 2026.

EGU26-10584 | Posters on site | BG4.5

Monitoring Mangrove Loss from Pond Aquaculture Expansion in Asia Using Satellite Earth Observation 

Marco Ottinger, Luis David Almeida Famada, Juliane Huth, and Felix Bachofer

Mangrove ecosystems are among the most productive and valuable environments on Earth, delivering essential ecological and socio-economic benefits including carbon sequestration, coastal protection, and habitat provision for diverse marine species. However, mangroves face increasing pressures from human activities, with rapid expansion of pond aquaculture emerging as a main driver of mangrove deforestation, especially in Asia, which hosts nearly 40% of the world’s mangroves.

This study presents a comprehensive continental-scale assessment of mangrove loss attributable to aquaculture pond expansion across Asia’s coastal zones, with a focus on Southeast Asia, where mangrove conversion is most severe. Utilizing satellite-based Earth observation data, including an object-based, single-feature inventory of aquaculture pond dynamics derived from Sentinel-1/-2 optical and radar time series and Landsat archive imagery, alongside the Global Mangrove Watch (GMW) dataset, we quantified spatial and temporal relationships between pond presence and mangrove forest decline.

By integrating these datasets within a harmonized time-indexing framework, we directly associate pond activation events with subsequent mangrove decline to attribute deforestation to aquaculture expansion. Our results reveal strong spatial-temporal correlations: aquaculture ponds predominantly cluster in coastal river deltas, overlapping with mangrove loss hotspots, while pond activation frequently coinciding with or directly following significant mangrove loss. Across Asia, mangrove cover declined by approximately 7.2 percent (2,284 km²) in Indonesia and up to 22.2 percent in Pakistan over the study period from 1996-2019. Key hotspots of aquaculture-driven mangrove degradation were identified primarily in Indonesia, Myanmar, and Vietnam, with Indonesia alone accounting for over 13,000 hectares of mangrove loss between 1996 and 2007 due to pond expansion.

Overall, this study underscores the substantial environmental footprint of pond aquaculture on Asia’s coastal ecosystems, demonstrating that aquaculture expansion is a principal driver of mangrove loss in critical regions. By leveraging advanced satellite Earth observation technologies, this research demonstrates the potential of remote sensing data to accurately quantify and monitor mangrove loss at large scales, providing timely, spatially detailed insights into ecosystem changes. Such capabilities are essential for deepening our understanding of the increasing pressures blue carbon ecosystems face from anthropogenic and climatic changes.

How to cite: Ottinger, M., Almeida Famada, L. D., Huth, J., and Bachofer, F.: Monitoring Mangrove Loss from Pond Aquaculture Expansion in Asia Using Satellite Earth Observation, EGU General Assembly 2026, Vienna, Austria, 3–8 May 2026, EGU26-10584, https://doi.org/10.5194/egusphere-egu26-10584, 2026.

EGU26-10656 | ECS | Orals | BG4.5

How the Current Blue Carbon Project Standards hinder Mangrove Conservation and Restoration 

Guilherme Abuchahla, Muhammad Nasution, Haditya Pradana, Fajar Ramadhana, and Daniel Saavedra-Hortua

The Voluntary Carbon Market (VCM) relies on a handful of validated standards, each one counting with a suite of methodologies, tools, and templates. In the past few years, Blue Carbon Ecosystems (BCEs), most prominently mangrove ecosystems, have gained a lot of attention due to their remarkable capacity to store much higher amounts of carbon than terrestrial forests. Nevertheless, mangroves may offer more complexities to conservation and restoration that range from sea-level rise to human-induced encroachment. Carbon standards have much improved their thoroughness so the attend to those complexities, especially regarding the contribution of and impact on communities and the hydrological and sedimentological requirements for a healthy ecosystem. The higher level of demands for a responsibly established project usually represents higher initial costs, e.g., feasibility study (FS) and project development document (PDD), and a longer period for revenue from the investor’s perspective. This is perceived as a negative scenario due to the market’s nature of rapid profit and revenue, thus, pushing blue carbon projects to a halt even before implementation. Here, we discuss what are the key-factors representing a conflict of interest between conservation, restoration, and VCM implementors, and make recommendations on how to overcome such dispute to achieve the promotion of BCEs around the globe.

How to cite: Abuchahla, G., Nasution, M., Pradana, H., Ramadhana, F., and Saavedra-Hortua, D.: How the Current Blue Carbon Project Standards hinder Mangrove Conservation and Restoration, EGU General Assembly 2026, Vienna, Austria, 3–8 May 2026, EGU26-10656, https://doi.org/10.5194/egusphere-egu26-10656, 2026.

EGU26-10706 | Orals | BG4.5

Impact of the spread of invasive alien species in saltmarshes sedimentary carbon sinks 

Inés Mazarrasa, Ariane Arias-Ortiz, Joeri Kaal, Sara Morán, José A. Juanes, and Bárbara Ondiviela

The proliferation of invasive alien species (IAS) is one of the main threats to the conservation of estuarine habitats, including saltmarshes. Differences between IAS and their native counterparts in structural traits (e.g. plant size, biomass allocation, shoot stiffness) and chemical composition (e.g. nutrient and lignin content) can affect the accumulation and long-term storage of organic carbon (OC) in saltmarsh sediments. However, the impact of IAS colonization on sedimentary carbon sinks in saltmarshes remain largely unexplored, particularly in Europe. Existing studies are scarce and focus primarily on the herbaceous species Spartina alterniflora, while no research has yet assessed the impact of the spread of woody shrub species such as Baccharis halimifolia, one of the main IAS in European estuaries. This study examines organic carbon (OC) stocks, 210Pb-derived accumulation rates and the molecular composition of the organic matter (i.e. through pyrolysis techniques) in 12 sediment cores sampled across native saltmarsh (i.e. Juncus maritimus and Spartina maritima) and invasive saltmarsh communities (i.e. Spartina alterniflora, Spartina anglica and Baccharis halimifolia) in the Gulf of Biscay. The results of this study serve as a basis for the implementation of conservation and restoration actions in saltmarsh environments that address both biodiversity and climate change mitigation goals.

How to cite: Mazarrasa, I., Arias-Ortiz, A., Kaal, J., Morán, S., Juanes, J. A., and Ondiviela, B.: Impact of the spread of invasive alien species in saltmarshes sedimentary carbon sinks, EGU General Assembly 2026, Vienna, Austria, 3–8 May 2026, EGU26-10706, https://doi.org/10.5194/egusphere-egu26-10706, 2026.

EGU26-11737 | ECS | Posters on site | BG4.5

Reviewing models of ecosystem services provided by Blue Carbon ecosystems 

Tania Maxwell, Paul Carnell, Nipuni Perera, and Micheli Duarte de Paula Costa

Over the past decade, rapid advances in modelling techniques—from process-based and empirical approaches to ecosystem service tools and risk frameworks—have greatly expanded the ability to quantify the benefits provided by blue carbon ecosystems (mangroves, tidal marshes, and seagrasses), including carbon sequestration, coastal protection, habitat provision, and water quality regulation. However, models vary widely in assumptions, data needs, scales, and documentation, leaving numerous actors (managers, researchers, policy makers) with a confusing number of tools but little guidance on how to choose among them. This gap has major consequences for climate policy and nature based solutions, leading to inconsistent assessments, limited uptake by practitioners, and underuse of robust existing models. 

Addressing these challenges, we are currently working on a novel project aiming to develop a guideline of the different modelling techniques available to support the quantification of ecosystem services provided by blue carbon ecosystems (e.g., mangroves, tidal marshes, seagrasses). More specifically, we are reviewing the modelling techniques and algorithms available in the scientific literature used to quantify ecosystem services (e.g., coastal protection, resilience, carbon, water quality, etc.) provided by blue carbon ecosystems. We plan to produce a guide to support a variety of actors (e.g., managers, researchers, policy makers, etc.) to apply these models in their work using different case studies. We will develop an online platform that supports coherent, comparable, and policy relevant blue carbon assessments worldwide.

How to cite: Maxwell, T., Carnell, P., Perera, N., and Duarte de Paula Costa, M.: Reviewing models of ecosystem services provided by Blue Carbon ecosystems, EGU General Assembly 2026, Vienna, Austria, 3–8 May 2026, EGU26-11737, https://doi.org/10.5194/egusphere-egu26-11737, 2026.

EGU26-11818 | ECS | Orals | BG4.5 | Highlight

Root exudation: meassuring a missing component of carbon flux estimates in mangroves 

Lea Hanemann, Lucie Maillard, Huyen Thuong Dang, Hermine Huot, Cornelia Rumpel, Yanni Gunnell, Farid Dahdouh-guebas, Tam Le, Nguyen The Kiet Bui, and Marie Arnaud

Mangroves are among Earth's most carbon-dense ecosystems, yet belowground carbon cycling remains poorly understood compared to aboveground processes. Root exudation, the release of labile organic compounds from live roots, represents a critical pathway for transferring plant-derived carbon to soils. However, exudation has never been quantified in situ in mangroves due to technical challenges. Here, we developed and applied a sealed-cuvette system to quantify root exudation across two dominant species (Avicennia alba and Rhizophora apiculata) and contrasting wet–dry seasons in a deltaic mangrove (Can Gio, Vietnam). Mean root exudation rates were 0.135 ± 0.035 mg C·g⁻¹·h⁻¹ for Avicennia and 0.078 ± 0.017 mg C·g⁻¹·h⁻¹ for Rhizophora, with seasonal rates (pooled across both species) of 0.060 ± 0.013 mg C·g⁻¹·h⁻¹ for the wet season and 0.103 ± 0.031 mg C·g⁻¹·h⁻¹ for the dry season. Gamma GLMs testing for effects of species and season revealed no statistically significant differences in exudation rates (species: p = 0.093; season: p = 0.16), though substantial individual-level variation was observed within each group. Mangrove root exudation rates were comparable to global averages reported across terrestrial ecosystems (~0.058 mg C g⁻¹ h⁻¹), indicating similar root-level carbon release despite contrasting environmental conditions. When multiplied by mangroves' extensive fine-root biomass, and scaled to hectare and annual timescales, preliminary estimates suggest the exudation flux may represent a non-negligible and previously unaccounted-for component of mangrove carbon budgets.   

How to cite: Hanemann, L., Maillard, L., Dang, H. T., Huot, H., Rumpel, C., Gunnell, Y., Dahdouh-guebas, F., Le, T., Bui, N. T. K., and Arnaud, M.: Root exudation: meassuring a missing component of carbon flux estimates in mangroves, EGU General Assembly 2026, Vienna, Austria, 3–8 May 2026, EGU26-11818, https://doi.org/10.5194/egusphere-egu26-11818, 2026.

EGU26-13763 | ECS | Posters on site | BG4.5

Molecular profile of labile and recalcitrant dissolved organic matter in coastal vegetated communities 

Isabel Casal Porras, Fernando G. Brun, José Lucas Pérez Lloréns, and Eva Zubía

Vegetated coastal communities are main sources of the marine dissolved organic matter (DOM), which may enter into the food chain (i.e. labile DOM) or remain stored in the ocean for longer periods (i.e. recalcitrant DOM), contributing to the blue carbon pool [1]. In particular, microbial utilization and processing of labile molecules of DOM is a key process that modifies the chemical composition and reactivity of DOM, ultimately resulting in the accumulation of resistant molecules [2]. In recent years, a growing number of studies have shown that the chemical characterization of DOM at molecular level using ultra-high resolution mass spectrometry (UHRMS) can provide key information on the sources, transformations, and fate of marine DOM [3]. This study was aimed to characterize at molecular level the labile, bacterial metabolism-derived, and recalcitrant fractions of DOM associated to three blue-carbon communities: the seagrasses Cymodocea nodosa and Zostera noltei, and the macroalga Caulerpa prolifera. For this purpose, a bioavailability experiment was conducted using seawater (free of microorganisms) from each community and a coastal bacterial inoculum. The viability of the cultures was confirmed by the decrease of dissolved organic carbon concentration and the increase of bacterial abundance observed in all communities at the end of the experiment. The solid-phase extraction of DOM followed by UHRMS analyses allowed the assignment of molecular formulas to compounds present in DOM at the beginning and at the end of experiment. The results showed that the percentage of molecular formulae that disappeared during bacterial cultivation (i.e., labile compounds) varied among communities, with the following trend: C. prolifera (55%) > C. nodosa (50%) > Z. noltei (38%). Representation of these molecular formulae in a van Krevelen diagram showed that a significant number of them were in the regions of compounds considered to be easily bioavailable, such as lipid-, peptide-, amino sugar- and carbohydrate-like compounds. On the other hand, the molecular formulae that were detected at the beginning and at the end of the culture (9-12%) were assigned to compounds resistant to degradation, and most of them fell in the diagram within the chemical classes expected for recalcitrant molecules (lignin- and tannin-like regions). These results provide insights into the molecular composition of DOM in blue carbon ecosystems, showing that the lability/recalcitrance of DOM, and hence the potential contribution to the blue carbon pool, seems to depend on the dominant species.


[1] Carlson, C. A. and Hansell, D. A. 2015. “DOM sources, sinks, reactivity, and budgets” In Biogeochemistry of marine dissolved organic matter (second edition), edited by D. A. Hansell and C. A. Carlson. Academic Press, Boston, MA, 65-126 pp.

[2] Li, H., Zhang Z., Xiong, T., Tang, K., He, C., Shi, Q., Jiao, N., Zhang, Y. 2022. Carbon sequestration on the form of recalcitrant dissolved organic carbon in a seaweed (kelp) farming environment. Environ. Sci. Technol. 56: 9112-9122.

[3] Qi, Y., Q. Xie, J. J. Wang, et al. 2022. “Deciphering dissolved organic matter by Fourier transform ion cyclotron resonance mass spectrometry (FT-ICR MS): from bulk to fractions and individuals.” Carbon Res. 1: 3.

How to cite: Casal Porras, I., Brun, F. G., Pérez Lloréns, J. L., and Zubía, E.: Molecular profile of labile and recalcitrant dissolved organic matter in coastal vegetated communities, EGU General Assembly 2026, Vienna, Austria, 3–8 May 2026, EGU26-13763, https://doi.org/10.5194/egusphere-egu26-13763, 2026.

EGU26-15877 | Orals | BG4.5

Restored coastal wetlands emit high levels of methane after a cyclone, but remain carbon sinks 

Fernanda Adame, Naima Iram, Alex Pearse, Jasmine Hall, Vicki Bennion, Catherine Lovelock, Ashley Rummell, Sonia Marshall, Graham Webb, Will Glamore, Gareth Chalmers, Andrew Olds, Heather Keith, and Jim Smart

Restoration of coastal wetlands provides climate adaptation and mitigation benefits.  However, there is still limited information on the effects of climate change-driven events on restoration projects. We assessed the changes in soil greenhouse gas fluxes (GHG; methane, CH4, carbon dioxide, CO2, and nitrous oxide, N2O) on a site previously used for sugarcane production currently undergoing tidal reinstatement in subtropical Australia. Simultaneously, we sampled two natural reference mangrove sites. Sampling was conducted over three years, encompassing summer and winter seasons, before and after tidal reinstatement, and after the landfall of a cyclone. Before tidal reinstatement, GHG emissions at the restoration site were low and similar to those from the reference sites.  After tidal reinstatement, soil conductivity increased from zero to 5.9 ± 2.3 dS m-1, and the soil organic carbon increased by 38%, while GHG emissions remained low. After the tropical storm, a large peak in CH4 was measured at the restoration site (3,661 ± 1,719 µg m-2 hr-1) and at one reference site (7,588 ± 2,193 µg m-2 hr-1); small  N2O uptakes were also recorded in the restoration (-2.2 ± 0.5 µg m-2 hr-1) and reference sites ( -0.7 ± 0.1 µg m-2 hr-1).   The fluxes were associated with prolonged freshwater flooding and reduced soil conditions (-0.3 ± 12 mV and -151 ± 96 mV, respectively) caused by extreme rainfall. Nevertheless, the emissions from this event did not undermine the carbon sink potential of the restoration project, whose annual emissions (0.8 Mg CO2eq ha-1 yr-1), even for years with cyclones (1.5 Mg CO2eq ha-1 yr-1), remained lower than those from the former agricultural land use (2.6 Mg CO2eq ha-1 yr-1).  Climate change will increase the likelihood of extreme rainfall events; however, mangrove restoration projects are likely to remain carbon sinks.    

How to cite: Adame, F., Iram, N., Pearse, A., Hall, J., Bennion, V., Lovelock, C., Rummell, A., Marshall, S., Webb, G., Glamore, W., Chalmers, G., Olds, A., Keith, H., and Smart, J.: Restored coastal wetlands emit high levels of methane after a cyclone, but remain carbon sinks, EGU General Assembly 2026, Vienna, Austria, 3–8 May 2026, EGU26-15877, https://doi.org/10.5194/egusphere-egu26-15877, 2026.

EGU26-16096 | ECS | Posters on site | BG4.5

Potential Site Selection for Seagrass Cultivation/ Restoration in the East Coast of India 

Amit Amit and Mihir Kumar Dash

Seagrass meadows are vital coastal ecosystems that provide significant ecological services, including shoreline stabilization, wave energy attenuation, carbon sequestration, and enhancement of marine biodiversity. However, their global decline due to natural and anthropogenic stressors necessitates systematic identification of suitable regions for sustainable seagrass cultivation and restoration. This study aims to assess the potential sites for seagrass cultivation and restoration along the east coast of India, encompassing the coastal regions of Tamil Nadu, Andhra Pradesh, Odisha, and West Bengal, by evaluating key physical and biogeochemical parameters within established seagrass tolerance thresholds.

The bathymetry, significant wave height, potential surface temperature, sea surface salinity, photosynthetically available radiation (PAR) and chlorophyll-a concentration data are used to identify potential sites along the east coast of India. Our analysis indicates a pronounced seasonal cycle across the study area, up to 30 m depth which is suitable for seagrass photosynthesis, driven primarily by monsoon dynamics and regional freshwater inputs. Certain coastal stretches exhibit persistently moderate wave energy, favorable thermal and salinity regimes, and sufficient primary productivity, suggesting high potential for sustainable seagrass establishment. This study provides a data-driven framework and a machine learning technique for identifying suitable potential seagrass restoration/ cultivation sites all along the east coast of India.

Keywords: Seagrass Restoration, Seagrass in east Indian coast, Seagrass Datasets

How to cite: Amit, A. and Dash, M. K.: Potential Site Selection for Seagrass Cultivation/ Restoration in the East Coast of India, EGU General Assembly 2026, Vienna, Austria, 3–8 May 2026, EGU26-16096, https://doi.org/10.5194/egusphere-egu26-16096, 2026.

EGU26-19001 | ECS | Posters on site | BG4.5

UAV-Mapping of Aboveground Biomass in Arid Mangrove Forests: A Crown-to-Grid Machine Learning Approach 

Mariana Elías-Lara, Omar Lopez Camargo, Jorge L. Rodríguez, Samer K. Al-Mashharawi, Víctor Angulo-Morales, Dario Scilla, Kasper Johansen, and Matthew F. McCabe

Mangrove forests are among the most carbon-rich coastal ecosystems, yet their aboveground biomass (AGB) remains poorly quantified in arid regions where structural complexity, closed canopies, and logistical constraints limit conventional field surveys. Improving AGB estimation in these understudied ecosystems is essential for advancing blue-carbon inventories, understanding ecological functioning under extreme environmental conditions, and supporting conservation and restoration initiatives. To address this gap, we present a UAV-based framework designed to generate high-resolution, non-destructive AGB estimates for Avicennia marina mangroves along the Saudi Arabian Red Sea coast, where data on AGB and carbon stocks remain scarce. The proposed approach implements a crown-to-grid framework that simulates quadrat-based AGB sampling at the site-scale using UAV-LiDAR and multispectral data. Field-measured trees are used exclusively to provide reference AGB values derived from an existing allometric relationship for Middle Eastern Avicennia marina. For model training, the crowns of these reference trees are manually delineated and partitioned into 1 m × 1 m grid cells; to augment the training dataset and reduce sensitivity to grid placement, each crown is sampled using 10 shifted grid configurations generated by systematically offsetting the grid origin. Tree-level AGB is then distributed across the cells using the canopy height model as a structural weighting function, generating a physically consistent, cell-level AGB reference while conserving total tree biomass. Spectral, structural, and index-based features extracted at the cell-level are used to train a Random Forest regression model. Model performance is evaluated using leave-one-tree-out cross-validation by aggregating predicted cell-level AGB back to the tree-scale and comparing it against field-derived AGB reference values. Once trained, the model is applied to a continuous 1 m × 1 m grid across the entire UAV-covered area, enabling spatially explicit AGB mapping without requiring individual-tree delineation. In addition to the methodological contributions, our results provide quantitative insights into AGB distribution in arid mangrove ecosystems. Mean site-level AGB densities ranged from ~25 to 31 Mg ha⁻¹, with localized hotspots associated with denser or taller vegetation. By resolving sub-canopy variability and integrating structural and spectral information, the framework improves our ability to characterize vegetation patterns that influence ecosystem function, productivity, and resilience, which are key components of blue-carbon dynamics in extreme environments. Finally, the approach establishes a pathway for upscaling UAV-derived AGB estimates to broader coastal regions, offering a critical bridge between field observations, high-resolution remote sensing, and satellite-based AGB products. Such scalable, non-destructive methods are essential for developing robust blue-carbon inventories, improving carbon accounting in regions where destructive sampling is limited, and supporting management and restoration strategies under accelerating climate and anthropogenic pressures.

How to cite: Elías-Lara, M., Lopez Camargo, O., Rodríguez, J. L., Al-Mashharawi, S. K., Angulo-Morales, V., Scilla, D., Johansen, K., and McCabe, M. F.: UAV-Mapping of Aboveground Biomass in Arid Mangrove Forests: A Crown-to-Grid Machine Learning Approach, EGU General Assembly 2026, Vienna, Austria, 3–8 May 2026, EGU26-19001, https://doi.org/10.5194/egusphere-egu26-19001, 2026.

EGU26-1019 | ECS | Posters on site | HS10.7

Tangential water transport facilitates crown water supply in mature Norway spruce 

Kyohsuke Hikino, Miriam Kreher, Bruno Hartwig, Ferdinand Renner, and Natalie Orlowski

Global forests are increasingly impacted by repeated and long-term drought events. The survival of trees under such conditions critically depends on their ability to regulate water use and maintain transpiration even when soil water availability is limited. Internal water storage and distribution within tree stems may hereby play a key role in supporting these processes. However, the mechanisms governing water transport and distribution within mature tree stems remain poorly understood.

To investigate internal water transport, we injected deuterated and dyed water as tracers into three mature Picea abies (Norway spruce) trees located in Tharandt (Germany) on one side of the stem at 50 cm height. Deuterated water movement was monitored by repeated daily sampling of xylem water vapor at 1 m and 3 m above the injection point, from the sapwood on the injection side, the opposite side, and the central heartwood. Water vapor samples were hereby collected by drilling a 10 cm deep, 1 cm diameter hole, which was fitted with inlet and outlet tubes. Dry air was pumped into the hole through the inlet, and the air equilibrated with xylem water was collected from the outlet into glass vials. Water vapor samples were subsequentially analyzed in the lab for their water isotopic composition (2H, 18O) via cavity ring-down spectroscopy (Picarro 2130-i). Two weeks after injection, the trees were harvested, and stem discs were collected every 2–4 m along the stem to visualize dyed water distribution using image analysis. Additional xylem water samples were extracted from increment cores taken from each disc in the four cardinal directions for isotope analysis. This experimental setup enabled the examination of water transport dynamics along axial, radial, and tangential pathways within the stem.

We found that injected water remained on the side of the injection within the lower 5 m of the stem (detected via water isotope tracing) but started circulating around the stem higher up, completing approximately 1-1.5 helical turns along the trunk (detected via dye-tracing), likely reflecting the spiral growth pattern of spruce wood. Below the crown base, water movement was predominantly axial, whereas above the crown base, tangential distribution became more pronounced, allowing all upper sun crown branches across the four cardinal directions to receive the tracer water.

These findings highlight that tangential water mixing within the stem plays a critical role in supplying water to the entire crown of mature spruce trees. This may become even more important under drought conditions.

How to cite: Hikino, K., Kreher, M., Hartwig, B., Renner, F., and Orlowski, N.: Tangential water transport facilitates crown water supply in mature Norway spruce, EGU General Assembly 2026, Vienna, Austria, 3–8 May 2026, EGU26-1019, https://doi.org/10.5194/egusphere-egu26-1019, 2026.

EGU26-4361 | ECS | Orals | HS10.7

Self-organization shapes divergent water use strategies among co-occurring shrubs for drought resilience in drylands 

Lei Wang, Guangyao Gao, Ying Ma, and Max Rietkerk

Differentiation in water use strategies is essential for the function and resilience of dryland ecosystems. Under prolonged drought, dominant shrubs self-organize into two spatial configurations: scattered and clumped. However, the mechanisms by which root–leaf trait coordination drives these divergent water use strategies remain poorly understood. In this study, the soil moisture, morphological and root traits, leaf-level physiological traits, and stable isotope (δ2H, δ18O, and δ13C) of scattered and clumped Vitex negundo were observed during the 2022–2024 growing seasons in the semi-arid Loess Plateau, to elucidate the water use strategies and physiological responses of self‑organized shrubs. Our findings indicate that scattered shrubs primarily utilized middle and deep soil water (69.4±7.8%), facilitated by isolated canopies that promote precipitation infiltration and recharge deeper soil layers. In contrast, clumped shrubs predominantly relied on shallow and middle soil water (82.0±6.5%), supported by their aggregated canopies and root systems. Scattered shrubs adopted a conservative strategy, exhibiting higher intrinsic water use efficiency (iWUE) and stable midday water potential during dry seasons, due to lower specific leaf area and moderate stomatal conductance. Conversely, clumped shrubs exhibited an opportunistic strategy, characterized by larger specific leaf area and higher stomatal conductance, enabling rapid photosynthetic accumulation and peak iWUE during rainy seasons. However, under drought, clumped shrubs accelerated the depletion of shallow soil water, leading to depressed midday water potential and constrained photosynthesis. These shrub types illustrate complementary mechanisms for drought adaptation: scattered shrubs enhance  resilience, while clumped shrubs improve precipitation capture efficiency, collectively promoting the stability of dryland ecosystems.

How to cite: Wang, L., Gao, G., Ma, Y., and Rietkerk, M.: Self-organization shapes divergent water use strategies among co-occurring shrubs for drought resilience in drylands, EGU General Assembly 2026, Vienna, Austria, 3–8 May 2026, EGU26-4361, https://doi.org/10.5194/egusphere-egu26-4361, 2026.

EGU26-5434 | ECS | Posters on site | HS10.7

PAUL: A Novel Autosampler for High-Resolution Isotopic Monitoring in Catchment Hydrology 

Jonas Pyschik and Markus Weiler

Understanding how streamflow is generated is essential for managing water quantity, quality, aquatic ecosystems and drinking water resources. Stable water isotopes are widely used to separate streamflow into event and pre-event water, offering valuable insights into catchment storage dynamics, water ages and transit times of water. Typically, precipitation or stream water for isotope analysis are sampled using autosamplers to reduce effort and ensure an adequate temporal resolution.

However, hydrograph separation using stable isotopes is often limited by reliance on single-point rainfall sampling, which therefore assumes that precipitation inputs are spatially uniform across the catchment. This can introduce substantial errors, as spatial variability in the isotopic composition of precipitation—even within small catchments—may lead to misestimations of event water endmember contributions. Also, the various transit time models may experience biases due to an incorrect precipitation input time series of stable isotopes. Furthermore, typical autosamplers are susceptible to evaporative losses from the stored water samples, resulting in isotopic fractionation and compromised data integrity.
To solve these difficulties, we have developed and deployed the low-cost, evaporation-proof Portable Autosampler for Liquids (PAUL). Nine PAUL units were distributed across the 1.5 km² Krummenbach sub-catchment of the Brugga watershed, a mountainous headwater catchment located in the Black Forest, Germany. Eight units measured precipitation and one sampled streamflow, with biweekly collection over the course of one month.

Our findings show that spatially distributed, evaporation-secure sampling significantly improves the characterization of event water inputs and reduces uncertainty in hydrograph separation. The PAUL system provides a robust and accessible solution for high-resolution, catchment-scale isotope monitoring, providing spatial and temporal coverage that was previously unfeasible with standard autosamplers. This approach advances process-based hydrology by increasing the accuracy and reliability of isotope-based precipitation and streamflow analyses.

How to cite: Pyschik, J. and Weiler, M.: PAUL: A Novel Autosampler for High-Resolution Isotopic Monitoring in Catchment Hydrology, EGU General Assembly 2026, Vienna, Austria, 3–8 May 2026, EGU26-5434, https://doi.org/10.5194/egusphere-egu26-5434, 2026.

EGU26-6149 | ECS | Posters on site | HS10.7

Stable isotopes as tracers of the effects of vineyard management practices 

Itxaso Ruiz, Luitgard Schwendenmann, Adrià Barbeta, Marco M. Lehmann, Roberto Pérez-Parmo, and Ana Aizpurua

Soil water management in Mediterranean vineyards is increasingly critical under increasing aridity. Soil management practices such as cover crops are promoted for improving soil structure, reducing erosion, and enhancing ecosystem services. However, grapevine production is often reduced under cover crops, and their effects on vine water use are still not fully understood. Here, we investigated the impact of soil management, i.e. conventional tillage vs. spontaneous cover crop, on the soil–plant–atmosphere continuum of a rainfed vineyard in Rioja Alavesa during veraison, with the aim of contributing to the ongoing discussion on soil management effects on vine water use.

Determining root water uptake depth using water isotopes (δ¹⁸O and δ²H) revealed contrasting uptake strategies between conventional tillage and spontaneous cover crop. Building on that, we focused on aboveground responses by combining measurements of vine water status (midday leaf water potential, Ψₘ) with stable isotopes of carbon, oxygen, and nitrogen (δ¹³C, δ¹⁸O, and δ¹⁵N) in leaves and berries. The Ψₘ values showed a clear management effect, with vines under cover crop exhibiting improved water status compared to vines under tillage (Ψₘ= -0.62 and -0.83 MPa respectively, p < 0.01). Leaf δ¹⁵N also differed between treatments, indicating changes in nitrogen availability or uptake associated with soil management (mean leaf δ¹⁵N under cover crop = 2.14‰ and tillage = 0.15‰, p < 0.01). In contrast, leaf δ¹⁸O and berry δ¹³C showed substantial plant-to-plant variability with no consistent treatment effect (p = 0.22 and 0.51, respectively).

Taken together, our results show that cover crops can enhance vine hydraulic status (Ψₘ) and modify nitrogen dynamics (δ¹⁵N), without altering long-term carbon assimilation efficiency (δ¹³C and δ¹⁸O). They also demonstrate that soil management effects are strongly dependent on the temporal scale of observation, as instantaneous indicators (Ψₘ) revealed treatment differences that were not captured by seasonally integrated isotopic signals (δ¹³C and δ¹⁸O). Overall, our study highlights the value of combining hydraulic measurements with multiple stable isotopes to improve the assessment of sustainable soil and water management strategies in vineyards.

How to cite: Ruiz, I., Schwendenmann, L., Barbeta, A., Lehmann, M. M., Pérez-Parmo, R., and Aizpurua, A.: Stable isotopes as tracers of the effects of vineyard management practices, EGU General Assembly 2026, Vienna, Austria, 3–8 May 2026, EGU26-6149, https://doi.org/10.5194/egusphere-egu26-6149, 2026.

EGU26-7698 | ECS | Orals | HS10.7

Rethinking isotope-based plant water uptake tracing in viticulture: alternative sampling approaches 

Mirco Peschiutta, Marco M. Lehmann, Gemma Bonet Caballol, Paolo Benettin, Daniele Penna, Mauro Masiol, Barbara Stenni, and Adrià Barbeta

Up to date, isotopic techniques in ecohydrology have been rarely applied in viticulture, despite their potential to identify plant water uptake sources and resolve their temporal dynamics, largely because traditional approaches for sampling grapevine xylem sap are destructive and often impractical in productive agroecosystems such as commercial vineyards, particularly when a high number of replicates is required. Moreover, recent evidence indicates that cryogenic vacuum distillation (CVD), commonly used to extract xylem water, can induce a methodological bias, yielding water that is artificially depleted in δ²H relative to the original xylem water.

These limitations have stimulated interest in alternative, non-destructive approaches. Recent studies have shown that transpired water can be collected by enclosing grapevine branches in plastic bags and sampling condensed water. Nevertheless, it remains unclear whether the isotopic composition of transpired water can be reliably used to infer plant water sources when the true isotopic signature of xylem water is unknown.

Here, we tested whether transpired water condensation can be used to retrieve the isotopic composition of plant water sources. We conducted a controlled experiment on potted grapevine plants irrigated with water of known isotopic composition, under contrasting water availability and different atmospheric conditions.

Multiple plant water sampling techniques were applied to detect isotopic changes along the soil–plant–atmosphere hydraulic continuum and to evaluate the validity of using transpired water to infer plant water uptake sources. In particular, we employed a vacuum pump–based sap extraction method designed to retrieve flowing xylem sap water and expected to closely reflect source water isotopic composition. Xylem bulk water, leaf bulk water, and bulk soil water were extracted using CVD.

The isotopic composition of vacuum-extracted sap water and of CVD-extracted waters were compared with transpired water and the original source of water (irrigation). Vacuum-extracted sap water closely reflected the isotopic composition of source water. Interestingly, transpired water collected in plastic bags also showed potential to be used as a proxy to infer the source water; however, its interpretation is less straightforward, requiring many replicates and explicit consideration of atmospheric conditions.

Overall, our results provide a methodological framework for evaluating non-destructive approaches to trace plant water sources and contribute to a better understanding of isotopic fractionation processes along the soil–plant–atmosphere continuum, with implications extending beyond viticulture to ecohydrological studies in managed and natural ecosystems.

How to cite: Peschiutta, M., Lehmann, M. M., Bonet Caballol, G., Benettin, P., Penna, D., Masiol, M., Stenni, B., and Barbeta, A.: Rethinking isotope-based plant water uptake tracing in viticulture: alternative sampling approaches, EGU General Assembly 2026, Vienna, Austria, 3–8 May 2026, EGU26-7698, https://doi.org/10.5194/egusphere-egu26-7698, 2026.

EGU26-8525 | ECS | Posters on site | HS10.7

Seasonal water uptake pattern in Agathis australis (kauri), a large and long-lived Southern Hemisphere conifer, using water stable isotopes  

Melanesia Boseren, Luitgard Schwendenmann, and Gretel Boswijk

Understanding seasonal water uptake depth (WUD) in trees is critical for assessing trees’ physiological responses to seasonal variability in microclimatic conditions and soil water availability. While broadleaf and conifer species in the Northern Hemisphere have been widely studied, studies of seasonal changes in WUD of large and long-lived evergreen conifers in the Southern Hemisphere are rare.

We investigated the effect of season and tree size on the water uptake pattern of Agathis australis (kauri), a large and long-lived endemic conifer, over an 18-month period. Our study site, a remnant kauri-dominated forest, is located in West Auckland, northern New Zealand. We collected stem cores from seven kauri trees (n = 3 < 50 cm diameter, n = 4 > 100 cm diameter) and soil samples underneath each of the seven trees (organic layer (OL), 0-10 cm, 10-20 cm, 20-30 cm, 30-50 cm, 50-70 cm, 70+ cm) across six seasons (austral spring 23,  austral summer 23-24, austral autumn 24, austral winter 24, austral spring 24, and austral summer 24-25). Water from soil and stem cores was extracted using cryogenic vacuum extraction. We measured δ2H and δ18O in all samples and used a Bayesian mixing model (MixSIAR) to determine WUD.

Our preliminary results show that across season and tree size, kauri obtained a larger proportion of water from the shallow layer (OL to 30 cm depth; ~ 60%) compared to ~ 40% sourced from layers below 30 cm. There was greater reliance on water from the shallow layer (up to 75%) during austral summer 23-24 and 24-25. We did not observe strong differences in WUD between small and large trees across our study seasons. These insights advance ecohydrological research on Southern Hemisphere evergreen conifers and highlight the importance of understanding species-specific response to microclimatic conditions and changing water availability.

How to cite: Boseren, M., Schwendenmann, L., and Boswijk, G.: Seasonal water uptake pattern in Agathis australis (kauri), a large and long-lived Southern Hemisphere conifer, using water stable isotopes , EGU General Assembly 2026, Vienna, Austria, 3–8 May 2026, EGU26-8525, https://doi.org/10.5194/egusphere-egu26-8525, 2026.

EGU26-10134 | Orals | HS10.7

Constraints of using in-situ water vapour stable isotope analysis for estimating groundwater recharge in a beech forest  

Megan Asanza-Grabenbauer, Christine Stumpp, and Michael Stockinger

As temperatures rise, heat waves, droughts, and intense rainfall are expected to become more common and severe, posing significant risks to forest ecosystems. More frequent droughts make forests progressively vulnerable, leading to increased tree mortality particularly among drought-sensitive species like European beech (Fagus sylvatica S.). Understanding the interactions between forests and the water cycle is crucial to predict how forest ecosystems will respond to climate change and to develop adapted management strategies accordingly. By analysing the stable isotopes of water (δ2H, δ18O) which act as a natural fingerprint, we elucidate how beech trees cope with climate extremes and quantify water fluxes across the soil-plant-atmosphere continuum. Among these fluxes, groundwater recharge is essential for replenishing groundwater storage and sustaining stream baseflow. Here, we focus on estimating groundwater recharge under natural rainfall conditions, drought, and after extreme rainfall using HYDRUS-1D.

This study is conducted in a mature beech stand in the Rosalia forest located in the alpine forelands of Austria. The elevation at the study site is 650 m with an average slope of 16°. The mean annual precipitation is 790 mm, 60% of which falls between May to October, and the mean annual temperature is 8.2 °C. The soil is predominantly Cambisol, exhibits strong heterogeneity, and consists of 41% sand, 46% silt and 13% clay.

Climate change scenarios are simulated with rain‑out shelters (6x6 m) that induce drought stress in two trees and the surrounding soil. Sprinklers simulate extreme rainfall (75 mm per event) at two‑month intervals during the growing season, while two other trees serve as references under natural rainfall conditions. Soil water isotope profiles are collected via two complementary approaches: first, 100 cm soil cores are subdivided into 10 cm increments and analysed in the laboratory using the direct liquid-vapour equilibration method every three weeks. Second, since July 2025, in-situ soil water vapour is sampled within the rooting zone of one drought-treated and one reference tree at 10, 20, 30 and 60 cm, and analysed with an isotope ratio spectrometer (Picarro L2130-i) for daily measurements. These isotope data are supported by meteorological data including isotopic composition of precipitation, soil moisture, and matric potential.

Results showed that the soil exhibits strong heterogeneity in both isotopic composition and physical properties, with three to four soil horizons identified within the top 100 cm. Following irrigation, the isotope profile was largely replaced by the irrigation water isotope ratio within 100 cm, indicating preferential flow and rapid infiltration. We found strong temporal heterogeneity in soil water isotope profiles, and the isotopic profiles from in-situ vapour sampling and soil cores were only partly comparable, likely reflecting differences in isotopic composition of bulk water (core samples) and mobile water fractions (in-situ analysis), soil heterogeneity, and possibly method-specific biases. These discrepancies currently prevent robust estimates of groundwater recharge estimation with different approaches, underscoring the difficulty in applying these methods in strongly heterogeneous environments. Ongoing work includes system refinements and experimental redesign, alongside evaluation of more suitable methods to enable groundwater recharge quantification.

How to cite: Asanza-Grabenbauer, M., Stumpp, C., and Stockinger, M.: Constraints of using in-situ water vapour stable isotope analysis for estimating groundwater recharge in a beech forest , EGU General Assembly 2026, Vienna, Austria, 3–8 May 2026, EGU26-10134, https://doi.org/10.5194/egusphere-egu26-10134, 2026.

Identifying and quantifying sources and cycling of nitrogen is important for understanding not only aquatic ecosystems but also planning water resource management, mitigating urban and agricultural pollution, and optimizing government policy. Stable isotopes of dissolved nitrate and nitrite (δ15N, δ18O and δ17O) have been useful in distinguishing between the diverse nitrogen sources and sinks and help understand large scale global ocean processes as well as revealing major changes in agricultural land use and urbanization.

Despite the strength of dissolved nitrate and nitrite stable isotope analysis, the strong barrier for uptake using the favored contemporary methods (bacterial denitrifier and Cd-azide reaction) due to the laborious multi-step methods, maintenance of anerobic bacterial cultures and use of highly toxic chemicals has limited the analysis to highly specialized laboratories. We evaluate the performance of the Elementar EnvirovisION using the new Titanium (III) reduction method (Altabet et al., 2019) for one step conversion of nitrate into N2O for IRMS analysis.

The EnvirovisION has been developed for high performance analysis of CO2, N2O and CH4 and dissolved nitrate. The system has the capacity to be rapidly customized for specific needs with options for dual GC columns supporting the Weigand ‘heart-cut’ N2O method (Weigand et al., 2016) and sequential N2 and N2O analysis from a single atmospheric sample.

How to cite: Barker, S., Preece, C., Seed, M., and Berstan, R.: Analysis of dissolved nitrate stable isotopes using the one-step Ti (III) reduction method and Elementar EnvirovisION System, EGU General Assembly 2026, Vienna, Austria, 3–8 May 2026, EGU26-11255, https://doi.org/10.5194/egusphere-egu26-11255, 2026.

EGU26-11615 | ECS | Posters on site | HS10.7

Partitioning of Evapotranspiration at hourly resolution in a temperate grassland using a mobile water isotope laboratory 

Daniel Schulz, Matthias Claß, Nicolas Brüggemann, and Youri Rothfuss

Quantifying and partitioning the evapotranspiration (ET) of agricultural ecosystems in various environmental settings allows the study of the determinants of field site-specific plant water use and water stress conditions. ET flux, as determined from eddy covariance measurements, was partitioned into its component fluxes, soil evaporation (E) and plant transpiration (T), with a range of independent methods, i.e. with water stable isotope analysis (δ2H and δ18O), using lysimeter data, by applying the water use efficiency concept, and from process-based numerical modelling with the Community Land Model (CLM) 5.0. Data was collected with a mobile water stable isotope laboratory (IsoMobile) in the vicinity of the ICOS DE-RuR climate station (Rollesbroich, Germany) in an intensively managed temperate grassland ecosystem between May 5 and September 24, 2025. Isotopic partitioning was calculated at sub-daily resolution from mass balance on basis of ET, E, and T isotopic compositions (δET, δE, and δT, respectively). δET was determined statistically with the Keeling-plot approach and non-destructive measurements of atmospheric water vapor inside and above the plant canopy. δE was calculated from the isotopic composition of the atmospheric water vapor and that of soil water, which was either determined destructively and a posteriori in the laboratory or non-destructively and in situ using gas-permeable tubing placed in the soil. Finally, δT was estimated destructively from stem water extracted from composite grass samples (Alopecurus pratensis, Lolium perenne, Poa trivialis, Rumex acetosa) and under the assumption of isotopic steady state transpiration. The collected standardized ICOS data was used additionally to set up both the water use efficiency partitioning approach and the CLM. All partitioning results were confronted with time series of environmental variables measured by the local weather station. Sub-daily T/ET responded to daily and seasonal changes of environmental conditions, as well as farming practices applied to the grassland. T/ET decreased significantly after the plants were cut, followed by an increase during the subsequent period of plant regrowth. T/ET estimates range between 21 to 98 % for δ18O over the course of the seasons, δ2H-based partitioning shows similar temporal developments as δ18O, while overestimating T/ET by ~13 %. Water stress was not detected during the campaign period, as ET did not decrease while T/ET remained high, even during the dryest and hottest period in summer. From a technical view, non-destructive soil water vapor sampling was found to be a good alternative to destructive soil water sampling for the purpose of ET partitioning. It provides similar δE estimations while reducing the need for fieldwork, laboratory time and resources. In conclusion the high-resolution partitioning results presented in this study provide an opportunity to investigate field scale water fluxes in a variety of environments and can aid in improving water flux estimations embedded in large-scale environmental models.

How to cite: Schulz, D., Claß, M., Brüggemann, N., and Rothfuss, Y.: Partitioning of Evapotranspiration at hourly resolution in a temperate grassland using a mobile water isotope laboratory, EGU General Assembly 2026, Vienna, Austria, 3–8 May 2026, EGU26-11615, https://doi.org/10.5194/egusphere-egu26-11615, 2026.

EGU26-13738 | ECS | Posters on site | HS10.7

Double buffering of transpiration: Soil and stem water storage regulate transpiration water ages in boreal forests 

Magali F. Nehemy and Julia L. A. Knapp

Transpiration dominates terrestrial water fluxes and plays a critical role in ecosystem productivity and climate regulation, yet the travel time of water within vegetation and the contribution of internal plant water storage to transpiration remain poorly constrained. While decades of tracer studies have revealed that streamflow is sustained by older subsurface storage and responds dynamically to wetness conditions, comparable insights for transpiration are lacking. Here we present the first integrated field-based assessment of transpiration water age in boreal forests, continuously tracking transit times from the onset to the end of the growing season. Using isotope sampling of xylem, soil water, and precipitation, combined with hydrometric measurements at boreal sites dominated by Picea mariana and Pinus banksiana, we quantified mean travel times and the contribution of new versus old water to transpiration. Our results reveal that transpiration is sustained primarily by water older than one week, with newer precipitation contributing only 20–40% to transpiration fluxes. Growing-season travel times were faster than spring-only estimates but consistent with peak-summer sap-flow measurements. These findings demonstrate a "double-buffering" effect: soil water storage dampens and delays isotopic signals from new precipitation, while stem water storage further attenuates the response, particularly in drier periods. This dual buffering mechanism regulates transpiration age dynamics in response to changing wetness conditions, with storage contributions varying throughout the growing season. Our study provides critical empirical constraints on vegetation water use and transit times, essential for improving ecohydrological models and predicting ecosystem responses to water availability under changing climates.

How to cite: Nehemy, M. F. and Knapp, J. L. A.: Double buffering of transpiration: Soil and stem water storage regulate transpiration water ages in boreal forests, EGU General Assembly 2026, Vienna, Austria, 3–8 May 2026, EGU26-13738, https://doi.org/10.5194/egusphere-egu26-13738, 2026.

EGU26-14267 | ECS | Orals | HS10.7

Spatiotemporal contribution of soil water sources to total tree water uptake in a Mediterranean Scots pine forest 

Paula Cara-Abad, Adrià Barbeta, Pilar Llorens, Jérôme Latron, J Ariel Castro-López, Han Fu, Emilia Gutiérrez, and Elisabet Martínez-Sancho

Shifts in tree water sources are important for understanding the spatiotemporal dynamics of ecosystem water fluxes. However, our understanding of tree water uptake remains limited, constraining reliable predictions of local and global hydrological processes under ongoing climate change. The isotopic composition of water (δ2H and δ18O) is a powerful tracer of the Earth’s water cycle, as isotopic differences among water reservoirs, together with mixing and fractionation processes, allow water movements to be traced across the hydraulic continuum.

This study aims to characterize the tree water sources of Scots pine (Pinus sylvestris L.) in a Mediterranean forest (Pyrenees, NE Spain) during the 2024 growing season. To do so, the isotopic composition of water in several ecohydrological compartments was measured. Precipitation, soil water pools at multiple depths (10, 20, 30, 40, and 60 cm), and xylem water from four individuals were sampled biweekly. Bulk soil water was extracted using cryogenic vacuum distillation, whereas xylem water was obtained using a flow-rotor centrifuge (cavitron). The cavitron enables access to mobile xylem water (e.g., sap) and is not affected by the well-known methodological artifacts associated with cryogenic extraction. Bayesian isotope mixing models were applied to quantify the relative contributions of distinct water pools to xylem water and their temporal evolution. Dynamics of total water uptake were estimated from transpiration data.

Our results show that Scots pine predominantly relied on shallow soil water (10 cm) during most of the growing season, with xylem water closely reflecting the isotopic signature of recent precipitation. A decoupling between the isotopic signature of precipitation and xylem water emerged as seasonal drying progressed. Under dry conditions, tree water uptake was low, and tree water sources shifted towards deeper soil layers (40-60 cm). Overall, these patterns indicate a strong coupling between rainfall inputs and tree water use during periods of high transpiration demand, suggesting that the contribution of deeper soil water reserves represent only a very small fraction of tree total water use during a growing season. These findings underscore the ecological importance of shallow soil water and recent precipitation in sustaining forest function and highlight the role of vegetation water use in regulating atmospheric water fluxes.

How to cite: Cara-Abad, P., Barbeta, A., Llorens, P., Latron, J., Castro-López, J. A., Fu, H., Gutiérrez, E., and Martínez-Sancho, E.: Spatiotemporal contribution of soil water sources to total tree water uptake in a Mediterranean Scots pine forest, EGU General Assembly 2026, Vienna, Austria, 3–8 May 2026, EGU26-14267, https://doi.org/10.5194/egusphere-egu26-14267, 2026.

Saltwater intrusion (SWI) alters water movement and redox-sensitive biogeochemical processes in tidal marshes.  It remains challenging to distinguish conservative freshwater–seawater mixing from process-driven effects such as evaporation, residence time, and redox reactions.  Electrical conductivity (EC) is commonly used to trace mixing but provides limited insight into how these processes modify porewater chemistry across space and time.  Here, we evaluate whether stable water isotopes and an Evaporative Enrichment Index (EEI) improve the interpretation of porewater mixing and redox-sensitive responses along a marsh transect experiencing SWI.  

Porewater was sampled along a forest–marsh transect at the St. Jones Reserve (Delaware, USA) across seasons, depths, and tidal settings. Mixing was quantified using stable water isotopes (δ²H, δ¹⁸O, δ¹⁷O), EC, and end-member mixing analysis (EMMA).  Results from isotope-only and isotope+EC EMMA were compared, and EEI was applied to isolate non-conservative isotopic modification associated with evaporation, transpiration, and prolonged residence time.  Mixing metrics were related to redox-sensitive variables, including redox potential, nitrate, iron, and manganese. 

Mixing fractions calculated from isotopes and EC both captured the freshwater–seawater gradient but diverged most strongly in the marsh transition zone.  Isotope-only EMMA preserved seasonal and tidal variability that was dampened when EC was included.  EEI exhibited strong seasonal structure and was negatively correlated with redox potential, indicating that isotopic enrichment coincides with more reducing conditions.  Near-channel sites showed conservative mixing and consistent nitrate decline with increasing seawater fraction, whereas the transition zone exhibited enhanced nitrate loss and

depth-dependent, nonlinear iron and manganese responses associated with extended inundation and residence time. 

These results demonstrate that isotope tracers, when combined with EEI, provide process-level insight beyond EC by resolving evaporative modification and hydrologic isolation.  EEI helps identify when and under what hydrologic conditions redox-sensitive nutrient and metal transformations occur during saltwater intrusion.

How to cite: Bradach, S., Lui, Y., and Jin, Y.: Stable Water Isotopes Reveal Non-Conservative Mixing and Redox Dynamics During Saltwater Intrusion in Tidal Marshes, EGU General Assembly 2026, Vienna, Austria, 3–8 May 2026, EGU26-14383, https://doi.org/10.5194/egusphere-egu26-14383, 2026.

EGU26-15061 | ECS | Orals | HS10.7

Tracing water and nitrogen uptake in mature forests using stable isotopes 

Christina A. Hackmann, Klara Mrak, Sharath S. Paligi, Ruth-Kristina Magh, John D. Marshall, Martina Mund, and Christian Ammer

Trees are powerful mediators within ecosystem water and nutrient cycles. Through their roots, they take up these essential resources from the soil, distributing them in the system and upward into the canopy to maintain transpiration and photosynthesis.

However, understanding and predicting real-world dynamics remains challenging: tree species identity, species mixture, site and soil conditions may shape tree water and nutrient uptake fundamentally, particularly in mature forests. Moreover, in the face of climate change, access to resources in deeper, less drought-prone soil layers is crucial for buffering drought impacts and maintaining forest functioning. Studies targeting tree resource uptake in mature forests are still scarce; but they are emerging, with stable isotopes as a central tool.

We investigated root water uptake depth and subsoil water and nitrogen uptake in mature temperate forests of north-western Germany, using 2H, 18O and 15N as tracers. Native European beech, non-native Douglas fir, and native but drought-sensitive Norway spruce were studied, revealing tree species-specific uptake strategies and influences of species mixture. Furthermore, we found consistent site effects: on well-drained, sandy soils, the trees integrated more resources from deeper layers than on loamy soils. Notably, transit times from soil to canopy were slower for nitrogen than for water, highlighting the biotic and abiotic interactions that decouple nitrogen from water.

We conclude that species-specific traits in interaction with soil characteristics are crucial for understanding and predicting water and nutrient fluxes in forests. Our findings underscore the importance of belowground processes when assessing forest functioning and resilience.

How to cite: Hackmann, C. A., Mrak, K., Paligi, S. S., Magh, R.-K., Marshall, J. D., Mund, M., and Ammer, C.: Tracing water and nitrogen uptake in mature forests using stable isotopes, EGU General Assembly 2026, Vienna, Austria, 3–8 May 2026, EGU26-15061, https://doi.org/10.5194/egusphere-egu26-15061, 2026.

EGU26-17355 | Posters on site | HS10.7

Role of summer precipitation in plant water uptake in a pre-Alpine catchment 

Giulia Zuecco, Diego Todini-Zicavo, Chiara Marchina, Stefano Brighenti, Daniele Penna, and Marco Borga

Understanding the spatial and temporal origins of water used by plants for transpiration is crucial for improving forest and water resource management under future drought conditions. However, the impact of local factors such as wetness conditions and topography on the temporal origin of soil and plant waters remains largely unexplored.

In this study, we utilized a 6-year isotopic dataset to investigate i) the seasonal origin of water sources in a small headwater catchment in the Italian pre-Alps, ii) the seasonal origin of soil and plant water under different wetness conditions (based on soil moisture data), iii) the influence of topography (riparian zone vs. hillslope) and wetness conditions on water uptake by beech and chestnut trees.

The sampling campaigns were carried out in the Ressi catchment, which has a 2.4-ha area, steep hillslopes and a narrow riparian zone. The climate is humid and temperate, and the catchment is mostly covered by a forest mainly composed of beech, chestnut, maple and hazel trees. Water samples for isotopic analysis (δ2H and δ18O) were taken from precipitation, stream water, shallow groundwater, soil, and twigs from beech and chestnut trees. Samples were taken approximately bi-weekly during the growing season, whereas precipitation, stream water and shallow groundwater were collected monthly from October to May. Bulk soil water and plant water were extracted by cryogenic vacuum distillation before the isotopic analysis.

Our results, based on the estimation of the seasonal origin index (SOI), showed distinct temporal variability for all water sources, except groundwater. The rapid turnover of water in the catchment indicates that precipitation quickly replenishes the soil, becomes available for plant water uptake, and contributes to stream runoff. Interestingly, we found that both beech and chestnut trees primarily use water derived from summer precipitation, with minimal differences in water uptake between riparian and hillslope trees. The seasonality of water fluxes (i.e., precipitation and evapotranspiration) and isotopes in precipitation have a more significant impact on SOI values of soil water and plant water compared to soil moisture.

These findings suggest that in the Ressi catchment, during the growing season, trees and the stream primarily utilize young waters, even during dry years. This research contributes to our understanding of plant water use strategies and their implications for forest and water resource management under changing climate conditions.

How to cite: Zuecco, G., Todini-Zicavo, D., Marchina, C., Brighenti, S., Penna, D., and Borga, M.: Role of summer precipitation in plant water uptake in a pre-Alpine catchment, EGU General Assembly 2026, Vienna, Austria, 3–8 May 2026, EGU26-17355, https://doi.org/10.5194/egusphere-egu26-17355, 2026.

EGU26-19865 | Posters on site | HS10.7

Tracer-aided ecohydrological modelling to quantify hydrologic partitioning and investigate partitioning processes 

Dillon Mungle, Marius Floriancic, Celia Rouvenaz, Peter Molnar, and Harsh Beria

Hydrological partitioning, the separation of precipitation into different hydrological fluxes, remains poorly constrained in forested prealpine catchments. Here, we apply EcH2O-iso, a distributed process-based tracer-aided ecohydrological model, to investigate hydrological partitioning in the WaldLab forest research site in Zurich, Switzerland. EcH2O-iso simulates water and energy fluxes while tracking stable water isotopes across all compartments of the critical zone. EcH2O-iso was calibrated and validated with five years of hydrometric measurements, along with high-frequency observations of stable water isotope ratios in precipitation, streams, groundwater, xylem, and bulk and mobile soil water. Our results highlight the importance of explicitly representing dual-porosity soil water storage dynamics in models, providing insights into how mobile and immobile soil water storages are partitioned differently. These results were compared with previous findings at the WaldLab, particularly the seasonal dynamics of interception, infiltration, and plant water uptake. Future work will use these results alongside simulations in other snow-dominated alpine and boreal catchments to contrast ecohydrological processes between snow- vs rain-dominated ecosystems.

How to cite: Mungle, D., Floriancic, M., Rouvenaz, C., Molnar, P., and Beria, H.: Tracer-aided ecohydrological modelling to quantify hydrologic partitioning and investigate partitioning processes, EGU General Assembly 2026, Vienna, Austria, 3–8 May 2026, EGU26-19865, https://doi.org/10.5194/egusphere-egu26-19865, 2026.

EGU26-21902 | Orals | HS10.7

Exploring root water uptake of beech and spruce trees across Europe 

Marco Lehmann, Josie Geris, Daniele Penna, Youri Rothfuss, Ilja van Meerveld, and Katrin Meusburger

Ecohydrological studies aiming to understand patterns in root water uptake by trees based on plant and soil water isotope data are often confined to one or a few nearby locations. In this study, we took advantage of a recently established pan-European hydrogen (δ2H) and oxygen (δ18O) isotope dataset (10.16904/envidat.542) to assess root water uptake depth for beech and spruce trees across Europe. For a subset of sites, δ17O data were available as well.

Our analysis revealed consistent isotopic enrichment in xylem water of spruce trees compared to beech trees across all mixed-species sites (N=13), suggesting that spruce predominantly used shallower soil water regardless of environmental conditions. Additionally, we observed isotopic enrichment in stem xylem water from spring to summer at most beech and spruce sites (N=32), suggesting both species relied on isotopically enriched summer precipitation. Interestingly, for a subset of sites (N=8), there was an inverse pattern, with isotopic depletion in summer, implying shifts to deeper soil water sources or uptake of shallow soil water that was isotopically depleted in summer compared to spring conditions.

To further explore these findings, we will visually and statistically examine them using isotope data from the soil (10–90 cm depth). We will analyze the role of climate (using gridded data), alongside site-, soil-, and tree-specific metadata to better understand the factors influencing the variation in root water uptake at the continental scale. Additionally, we will explore the potential of oxygen-17 excess to provide further insights into root water uptake dynamics.

Lehmann et al., 2025. Soil and stem xylem water isotope data from two pan-European sampling campaigns. Earth System Science Data, 17, 6129–6147, https://doi.org/10.5194/essd-17-6129-2025


How to cite: Lehmann, M., Geris, J., Penna, D., Rothfuss, Y., van Meerveld, I., and Meusburger, K.: Exploring root water uptake of beech and spruce trees across Europe, EGU General Assembly 2026, Vienna, Austria, 3–8 May 2026, EGU26-21902, https://doi.org/10.5194/egusphere-egu26-21902, 2026.

EGU26-22892 | ECS | Orals | HS10.7

In-situ measurements of dissolved gases in tree xylem sap as tracers for plant physiology 

Capucine Marion, Roman Zweifel, Nina Buchmann, Matthias Brennwald, and Rolf Kipfer

Common hydrogeological methods make use of natural gases as tracers to better understand the spatial and temporal evolution of groundwater flow, to constrain water residence time, and to reconstruct environmental conditions at recharge [1-3]. Noble gases can be used as complement of the stable water isotope tracers for understanding complex hydrological systems [4,5,6].

We adapted these methods to in-situ measurements of gases in tree xylem sap to better understand the plant-mediated water and gas flux between the hydrosphere, the biosphere, and the atmosphere.

Using a “miniRuedi” portable mass-spectrometer [7] and tailored semi-permeable membrane probes, the partial pressures of He, Ar, Kr, N2, O2, CO2, and CH4 were continuously monitored in-situ in the soil, the tree, and the atmosphere. Diurnal variations of CO2 and O2 were observed that reflected the tree physiological activities [8].

Since transpiration by plants is a major component of the hydrological cycle, such measurement techniques offer new opportunities to better understand plant water and CO₂ dynamics, within the soil-plant-atmosphere continuum.

[1] Kipfer et al. (2002), Reviews in Mineralogy and Geochemistry, 47, 615–700; [2] Brennwald et al. (2013), Advances in Isotope Geochemistry – The Noble Gases as Geochemical Tracers, 123-153; [3] Brennwald et al. (2022), Frontiers in Water, 4, 107-115; [4] Althaus et al. (2009), Journal of Hydrology, 370, 64-72. [5] Schilling et al. (2019), Reviews of Geophysics, 57, 146-182. [6] Xu et al. (2017). Hydrogeology Journal, 25(7), 2015–2029; [7] Brennwald et al. (2016), ES&T, 50, 13455-1346; [8] Marion et al. (2024), Tree Physiology, tpae062.


How to cite: Marion, C., Zweifel, R., Buchmann, N., Brennwald, M., and Kipfer, R.: In-situ measurements of dissolved gases in tree xylem sap as tracers for plant physiology, EGU General Assembly 2026, Vienna, Austria, 3–8 May 2026, EGU26-22892, https://doi.org/10.5194/egusphere-egu26-22892, 2026.

EGU26-23111 | Posters on site | HS10.7

Regulation of soil water consumption of Robinia pseudoacacia in different stand ages 

Yali Zhao, Yunqiang Wang, Li Zimin, and Marius G. Floriancic

Large-scale afforestation in China has resulted in widespread soil water deficits. Yet the effects of root water uptake on soil water decline, and how it differs between dry and wet seasons and across different stand ages remain largely unstudied. Using stable water isotopes (δ18O and δ2H), we investigated water uptake patterns across five Robinia pseudoacacia stand ages (~6, 16, 20, 35, and 45 years) and explored the interactions between soil drying and water-use strategies during the pre-rain and rainy season across two years.  R. pseudoacacia exhibited clear seasonal and age-related differences in water uptake, with contrasting water-use strategies under dry versus normal years. Overall, R. pseudoacacia predominantly relied on shallow soil water (0.67 ± 0.15) during the pre-rain season and shifted to deep soil water uptake (0.73 ± 0.14) in the rainy season. In the drier year of the 2-year observation period, all stands showed similar seasonal water uptake patterns, with a predominant reliance on deeper soil water, whereas in the typical year, water-use strategies differed markedly among stand ages. While middle-aged and old stands (16 to 45 years) accessed water from all soil layers, the younger individuals (6 years) primarily utilized soil water from intermediate and deep layers. Combining information from stable water isotopes and actual evapotranspiration we calculated soil water decline rates for all stands and found that soil water was declining between 14.0% to 24.7% in the 0–60 cm soil layer, 5.2% to 6.9% in the 60–200 cm soil layer, and 3.3% to 4.8% in the 200–500 cm soil layer. During the pre-rain season the deeper soil layers were substantially depleted, especially for young stands and in the drier year, and soil water decline rates were related to age-related differences in soil water content and soil drying patterns. This study presents the first isotope-based quantification of soil water decline across different R. pseudoacacia stand ages, highlighting the starkly different soil drying dynamics.

How to cite: Zhao, Y., Wang, Y., Zimin, L., and Floriancic, M. G.: Regulation of soil water consumption of Robinia pseudoacacia in different stand ages, EGU General Assembly 2026, Vienna, Austria, 3–8 May 2026, EGU26-23111, https://doi.org/10.5194/egusphere-egu26-23111, 2026.

EGU26-194 | Posters on site | HS10.12

Redox and carbon cycling in mine lakes of the Upper Harz Mountains (Germany) 

Elke Bozau, Tanja Schäfer, and Tobias Licha

The Harz Mountains, situated in the north of Germany, are about 120 km long and about 40 km wide. Their highest moun­tain is Mount Brocken (1,141 m a.s.l.). The mountain range is known for ancient silver and base metal mining. Today the Harz Mountains are an impor­tant drinking water supply region for north­ern Germany.

About 70 lakes are situated around the town of Clausthal-Zellerfeld in the Western Harz Mountains. These lakes were constructed to save a continuous water supply to the ore mines about 200 – 500 years ago. The water depths range from about 3 to 15 m, the storage volume from about 10,000 to 600,000 m3. The lakes are an important part of the UNESCO World Heritage Site "Oberharzer Wasserregal". Most of the lakes are oligotrophic with pH values of about 7 and SEC values below 200 µS/cm (Bozau et al., 2015). Some of the lakes are used for the drinking water supply of nearby communities and are still important for the protection of floods.

From 2023 – 2025, the water column of selected mine lakes was investigated. Samples of the water column were analysed for major ions, trace metals and stable isotopes. In summer, the formation of a deep anoxic layer (hypolimnion) was observed in some lakes. The intensity of anoxic conditions depends on the summer temperatures, precipitation rates and wind conditions. There is a typical chemical stratification of the water column for every single lake. Shallow lakes showed stronger redox reactions than deeper lakes. Colder weather periods with high precipitation rates during the summer time can minimise the extent of the hypolimnion. SEC, bicarbonate, Fe and Mn are enriched in the anoxic layer leading to problems in the traditional treatment of drinking water. Nitrate and sulphate are depleted due the chemical reactions under anoxic conditions. The ratio Mn/Fe proved to be a very sensitive indicator for the formation of the hypolimnion. The δ18O and δ2H values in the water column of mine lakes also reflect the seasonal stratification. Due to evaporation effects at the water surface the highest δ18O and δ2H changes are found in mine lakes during summer time. The δ13C values in the the water column range between -24 … -13 ‰. The lowest δ13C values are found in the anoxic hypolimnion during summer time. Due to warmer and longer spring, summer and autumn seasons the formation of hypolimnia increased in the last years and the treatment of drinking water was adapted.


Bozau E, Licha T, Stärk HJ, Strauch G, Voss I, Wiegand B, 2015. Hydrogeochemische Studien im Harzer Einzugsgebiet der Innerste. Clausthaler Geowissenschaften 10, 35-46.

How to cite: Bozau, E., Schäfer, T., and Licha, T.: Redox and carbon cycling in mine lakes of the Upper Harz Mountains (Germany), EGU General Assembly 2026, Vienna, Austria, 3–8 May 2026, EGU26-194, https://doi.org/10.5194/egusphere-egu26-194, 2026.

EGU26-1338 | Orals | HS10.12

The Ecohydrology of Coastal Ghost Forests 

Sergio Fagherazzi, Giovanna Nordio, Jacopo Boaga, Giorgio Cassiani, Holly Michael, Dannielle Pratt, Tyler Messerschmidt, Matthew Kirwan, and Stephanie Stotts

Sea level rise and storm surges affect coastal forests along low-lying shorelines. Salinization and flooding kill trees and favour the encroachment of salt-tolerant marsh vegetation. The hydrology of this ecological transition is complex and requires a multidisciplinary approach. Sea level rise (press) and storms (pulses) act on different timescales, affecting the forest vegetation in different ways. Salinization can occur either by vertical infiltration during flooding or from the aquifer driven by tides and sea level rise. Here, we detail the ecohydrological processes acting in the critical zone of retreating coastal forests. An increase in sea level has a three-pronged effect on flooding and salinization: It raises the maximum elevation of storm surges, shifts the freshwater-saltwater interface inland, and elevates the water table, leading to surface flooding from below. Trees can modify their root systems and local soil hydrology to better withstand salinization. Hydrological stress from intermittent storm surges inhibits tree
growth, as evidenced by tree ring analysis. Tree rings also reveal a lag between the time when tree growth significantly slows and when the tree ultimately dies. Tree dieback reduces transpiration, retaining more water in the soil and creating conditions more favourable for flooding. Sedimentation from storm waters combined to organic matter decomposition can change the landscape, affecting flooding and runoff. Our results indicate that only a multidisciplinary approach can fully capture the ecohydrology of retreating forests in a period of accelerated sea level rise.

How to cite: Fagherazzi, S., Nordio, G., Boaga, J., Cassiani, G., Michael, H., Pratt, D., Messerschmidt, T., Kirwan, M., and Stotts, S.: The Ecohydrology of Coastal Ghost Forests, EGU General Assembly 2026, Vienna, Austria, 3–8 May 2026, EGU26-1338, https://doi.org/10.5194/egusphere-egu26-1338, 2026.

EGU26-6023 | ECS | Posters on site | HS10.12

Tidal Wetlands and Environmental Drivers in Species Recovery: Suisun Marsh, CA (USA) 

Kimberly Evans and John Durand

Suisun Marsh is the largest tidal wetland on the west coast of North America, existing at the interface of the Sacramento-San Joaquin (SSJ) Delta and the San Francisco Bay in California. This dynamic landscape acts as a model system for observing the impacts of environmental changes; as a result, long-term monitoring efforts have been consistently deemed as a priority to evaluate the efficacy of restoration projects. We analyze the trends in fishes and water quality variables in Suisun Marsh from 1995-2024, specifically honing in on the recovery of an obligate floodplain-spawning fish (Sacramento Splittail) and contextualize what may have influenced its increases in abundance. We use the Normalized Difference Water Index as a proxy for floodplain availability compared to abundance data within Suisun Marsh, collected monthly at 25 sites. We additionally delve into distributions of fishes in Suisun Marsh and where they occur spatially, with respect to environmental conditions. Water quality samples were taken at each of the sites alongside biotic surveys once a month, including salinity, dissolved oxygen, turbidity, depth, and temperature, which were additionally compared to calculations of Delta Outflow (a metric representing the approximate quantity of freshwater entering the system). We hypothesize that the recovery of Sacramento Splittail population was ‘unintended’ as a result of nearby restoration efforts to wetland habitat targeting a different species. Once listed as a threatened species, the increases in floodplain availability then seem to represent a marked growth in abundances of Splittail. Larger implications of this project includes the evaluation of the single-species management approach common in the USA as well as the implications for nonnative species management.

How to cite: Evans, K. and Durand, J.: Tidal Wetlands and Environmental Drivers in Species Recovery: Suisun Marsh, CA (USA), EGU General Assembly 2026, Vienna, Austria, 3–8 May 2026, EGU26-6023, https://doi.org/10.5194/egusphere-egu26-6023, 2026.

EGU26-8176 | ECS | Orals | HS10.12

Effects of Land-Use Change and Hydrology on Soil Carbon Composition and Thermal Stability in a Tropical Freshwater Wetland: Insights from Yala, Kenya 

Christine Owino, Lucy Ngatia, Nzula Kitaka, Julius Kipkemboi, Risper Ondiek, Glynnis Bugna, and Sean Holmes

Wetlands are vital for mitigating climate change, but widespread conversion to agricultural land has disrupted their functioning in terms of soil carbon (C) and nitrogen (N) dynamics. This study examined the impact of land-use/cover change on soil N, C, their thermal stability, and C composition in Yala Wetland. Using a stratified random approach, soil samples were collected from permanently flooded, seasonally flooded, sugarcane, maize, and vegetable farms, across depths of 0-50 cm. Multi-Element Scanning Thermal Analysis (MESTA) was used to quantify C and N thermal stability, while solid-state 13C NMR spectroscopy characterized C composition. Results showed significant differences (P < 0.05) in SOC, nitrogen, and C:N ratios across land uses. Vegetable farms had highest SOC (117.83 ± 16.54 g kg-1) and N (7.34 ± 1.07 g kg-1), while sugarcane fields had the lowest (SOC: 13.58 ± 0.97 g kg-1; N: 1.07 ± 0.04 g kg-1). Seasonally flooded wetlands stored more SOC (98.51 ± 20.55 g kg-1) and N (5.31 ± 1.12 g kg-1) than permanently flooded wetlands, suggesting that alternate wet-dry cycles enhance humification and organic matter (OM) stabilization.  Data showed dominance of thermally labile C (C < 400 °C) over thermally stable C (C> 400 °C). This was highlighted by high R400 in all land uses, (0.73-0.82). Carbon composition results indicated dominance of O-alkyl C in all land-use types. This was consistent with dominance of low-thermally stable C and a High R400 index. Overall, findings show that both wetland conversion and hydrological conditions strongly influenced OM quality and stability in the Yala wetland.

How to cite: Owino, C., Ngatia, L., Kitaka, N., Kipkemboi, J., Ondiek, R., Bugna, G., and Holmes, S.: Effects of Land-Use Change and Hydrology on Soil Carbon Composition and Thermal Stability in a Tropical Freshwater Wetland: Insights from Yala, Kenya, EGU General Assembly 2026, Vienna, Austria, 3–8 May 2026, EGU26-8176, https://doi.org/10.5194/egusphere-egu26-8176, 2026.

EGU26-8655 | ECS | Posters on site | HS10.12

Chinese ice-lake line shifts under climate change 

Weijia Wang, Iestyn Woolway, Kun Shi, and Yunlin Zhang
Lake ice is a sensitive indicator of climate warming, yet a spatially explicit metric for where lakes freeze across China remains limited. Here we propose an ice lake line, defined as the lowest latitudinal connection of frozen lakes within each longitude band, to delineate the boundary below which lakes cease to freeze. We define the ice season as at least 10 consecutive days with lake surface water temperature below 1 °C and analyse 1,705 lakes that experienced ice cover during 1980 to 2021.
 
We found that the ice lake line for normally frozen lakes shifted north from 32.10° N in the 1980s to 32.42° N in the 2010s, equivalent to 0.32° or about 36 km over four decades. The boundary occurs at lower latitudes in western China and higher latitudes in the east, consistent with strong elevation control. Over the same period, ice on was delayed by 9.7 days, ice off advanced by 12.7 days, and ice duration shortened by 20.7 days as median changes, while about 39 lakes ceased to freeze by the 2010s. By 2090 to 2099, projections indicate 3, 77, 226 and 393 fewer winter freezing lakes than in the 2020s under SSP1-2.6, SSP2-4.5, SSP3-7.0 and SSP5-8.5, respectively, with the ice lake line moving to 33.97° N, 34.72° N, 35.30° N and 35.75° N. The faster northward shift for completely frozen lakes indicates a growing prevalence of partially frozen conditions. These results establish the ice lake line as an intuitive indicator of rapid warming and show that emissions mitigation can markedly slow the reorganization of China’s lake ice regime.

How to cite: Wang, W., Woolway, I., Shi, K., and Zhang, Y.: Chinese ice-lake line shifts under climate change, EGU General Assembly 2026, Vienna, Austria, 3–8 May 2026, EGU26-8655, https://doi.org/10.5194/egusphere-egu26-8655, 2026.

EGU26-8957 | ECS | Posters on site | HS10.12

Future winter shipping opportunities in the Great Lakes–St. Lawrence Seaway 

Haoran Shi, Pengfei Xue, Mingzhen Liu, Chenfu Huang, Miraj B. Kayastha, Sapna Sharma, Haodong Yang, Weijia Wang, Di Long, Lian Feng, Yuanzhe Liu, Christina W. Y. Wong, Kee-hung Lai, and R. Iestyn Woolway

The St Lawrence River and the Laurentian Great Lakes form one of the longest deep draft navigation systems in the world. However, this golden inland waterway is typically closed during winter due to ice cover on the river and lakes. As the Great Lakes basin is projected to become warmer and less ice-covered, climate warming is expected to stimulate new opportunities for winter shipping activities in this region.

This study analyses the projected ice data in the Great Lakes basin over the 21st century from a two-way coupled climate-lake model (GLARM-v2). We proposed a safe navigation criterion for winter shipping in the lakes based on projected ice conditions, saying ice coverage smaller than 0.7~0.8 and ice thickness smaller than 15 cm. With this criterion, we found that under the high-emissions Representative Concentration Pathway (RCP) 8.5 scenario, 68% of the Great Lakes region is projected to be navigable year-round by late-century (2080–2099).

Based on historical real-world shipping activity records, we identified 65 established navigation routes in this region. Under RCP 8.5, the annual ice-blocked duration for these navigation routes is projected to shorten by 78% by late-century (2080–2099) relative to the historical baseline (2000–2019), which means a two-month extension of annual shipping season. These changes have the potential to shift winter cargo transportation from land-based modes like railway and heavy truck to the shipping industry. Such a shift can potentially save billions in transportation costs and reduce substantial greenhouse gas emissions from the transport sector.

How to cite: Shi, H., Xue, P., Liu, M., Huang, C., Kayastha, M. B., Sharma, S., Yang, H., Wang, W., Long, D., Feng, L., Liu, Y., Wong, C. W. Y., Lai, K., and Woolway, R. I.: Future winter shipping opportunities in the Great Lakes–St. Lawrence Seaway, EGU General Assembly 2026, Vienna, Austria, 3–8 May 2026, EGU26-8957, https://doi.org/10.5194/egusphere-egu26-8957, 2026.

EGU26-11303 | Posters on site | HS10.12

Interaction of CO2 Fluxes in the Hydrological Dynamics of Mountain Basins in the Semiarid Andes – Central Chile 

Yohann Videla-Giering, Dany Novoa-Cortez, Patricia Ibaceta-Guerrero, Jacson Aravena-Perez, Tania Lucero-Salazar, Juan Pablo Rubilar-Donoso, Fernando Novoa-Cortez, and Manuel Contreras-Leiva

High Andean vegas constitute ecologically and functionally critical wetlands, representing some of the most fragile ecosystems within the mountainous environments of the Andes. These systems sustain high levels of biological diversity and endemism, providing habitat for numerous plant and animal species that exhibit strong sensitivity to hydrological and climatic variability. In addition, they fulfill essential ecosystem functions, including regulation of water balance, provision of ecosystem services, and freshwater supply—upon which approximately 12.4 million people in central Chile depend. 

A comprehensive understanding of the physical conditions that govern the synchronization of the snowpack in its solid and liquid phases—closely linked to the magnitude of seasonal water storage—and its interaction with periods of carbon sequestration is fundamental for interpreting the dominant processes that regulate the functioning of these ecosystems. To this end, we conducted extensive field measurements between 2023 and 2025, integrating data from automated weather stations (AWS) with gas exchange observations obtained through an IRGASON eddy covariance system. Furthermore, we calibrated and validated two physically based models, CRHM (Pomeroy et al., 2007) and LASSLOP (Lasslop et al., 2010), using unprecedented snow–hydrometeorological and gas exchange datasets from the Subtropical Andes of Chile. This approach enabled us to characterize CO fluxes, water vapor exchange, and the dynamics of surface energy balance with high resolution and reliability. 

The primary objective of this study is to elucidate the functioning of high Andean vegas, with particular emphasis on the energy fluxes that regulate carbon and water cycle mass balances and their linkages to biodiversity structure and dynamics. The results are intended to provide a robust scientific basis for evidencedriven management of these ecosystems and to inform the design of conservation and functional restoration strategies in the context of ongoing degradation and biodiversity loss. 

Our analyses demonstrate that, under favorable hydrological conditions—characterized by sustained snowmelt inputs, subsurface inflows, and prolonged soil saturation—high Andean vegas operate predominantly as carbon sinks, with an estimated annual sequestration rate of 1.28 × 10⁻⁴ Ton Eq CO2 m-2. In addition, they store subsurface water volumes of up to 250 L s-1, with extended residence times that maintain streamflow during the dry season. Conversely, perturbations to the hydrological regime—including persistent groundwater declines associated with prolonged drought, diminished snow–glacial contributions, and increasing air and soil temperatures—combined with anthropogenic pressures such as overgrazing, vehicular traffic, soil compaction, and channelization for agricultural purposes, can trigger severe and potentially irreversible losses of ecosystem functionality. These impacts manifest as sharp declines in biodiversity and a net release of CO2 to the atmosphere. 

This functional duality highlights the critical role of high Andean vegas in biodiversity conservation, climate change mitigation, and hydrological regulation within mountain basins. The balance between carbon sequestration and carbon emission is tightly coupled to hydrological status, vegetation condition, and the degree of ecosystem disturbance. In this context, timely, sciencebased management interventions are essential to mitigate biodiversity loss at local and regional scales, particularly given the role of these wetlands as strategic biological corridors across the Andes. 

How to cite: Videla-Giering, Y., Novoa-Cortez, D., Ibaceta-Guerrero, P., Aravena-Perez, J., Lucero-Salazar, T., Rubilar-Donoso, J. P., Novoa-Cortez, F., and Contreras-Leiva, M.: Interaction of CO2 Fluxes in the Hydrological Dynamics of Mountain Basins in the Semiarid Andes – Central Chile, EGU General Assembly 2026, Vienna, Austria, 3–8 May 2026, EGU26-11303, https://doi.org/10.5194/egusphere-egu26-11303, 2026.

EGU26-11830 | ECS | Orals | HS10.12

Wetland Classification and Revitalisation Monitoring by Using Drone Data 

Aneta Alexandra Ozvat, Maria Sibikova, Jozef Sibik, Jakub Sigmund, Juraj Papco, Michal Kollar, and Karol Mikula

Wetlands are essential ecosystems increasingly threatened by human activities and climate change. This study presents a method for classifying and monitoring wetland habitats in the Čiližská Radvaň protected area using RGB drone imagery and the Natural Numerical Network (NatNet), a mathematically based supervised deep learning approach. The primary aim was to evaluate the effectiveness of NatNet in identifying target habitat types and to assess the impact of ongoing revitalisation efforts. Habitat types were classified using RGB drone imagery and ground-truth training polygons representing the dominant vegetation communities in the Čiližská Radvaň wetland. The NatNet achieved a training classification success rate exceeding 97%, allowing the creation of relevancy maps that successfully identify spatial habitat distribution. Relevancy maps verified in the field achieved a classification accuracy of 0.88 and an F1 score of 0.90 across all habitats. Results showed observable shifts in habitat extent and structure after one year of restoration, confirming the method’s suitability for detecting ecological changes in wetland environments.

How to cite: Ozvat, A. A., Sibikova, M., Sibik, J., Sigmund, J., Papco, J., Kollar, M., and Mikula, K.: Wetland Classification and Revitalisation Monitoring by Using Drone Data, EGU General Assembly 2026, Vienna, Austria, 3–8 May 2026, EGU26-11830, https://doi.org/10.5194/egusphere-egu26-11830, 2026.

EGU26-12035 | ECS | Posters on site | HS10.12

Declining Predictions of Net Ecosystem Production in US Rivers and Streams Throughout the 21st Century 

Qi Guan, Kun Shi, R. Iestyn Woolway, Boqiang Qin, Yunlin Zhang, and Lishan Ran

Metabolism is an essential component of carbon cycling in river ecosystems, and understanding its response to climate change on a broad scale is imperative. Here we employ deep-learning models trained on an extensive data set to reconstruct daily metabolism in a total of 293 rivers and streams across the continental US from 1980 to 2020. Three key variables, gross primary production (GPP), ecosystem respiration (ER), and net ecosystem production (NEP), are examined to unveil longterm trends. Our analysis reveals that continental US rivers and streams experience an increase of 0.045 g O2 m−2 day−1 decade−1 in GPP from 1980 to 2020, largely driven by alterations in runoff and insolation, while ER declines more strongly at a rate of 0.078 g O2 m−2 day−1 decade−1 , primarily attributed to the combined effects of discharge, thermal conditions, and temperature changes. Such changes have caused a slight decrease in the NEP over the past four decades. Moreover, our well-trained models project that NEP continues to decline at a rate of 0.017 ± 0.008 g O2 m−2 day−1 decade−1 under future climate scenarios, resulting from asymmetric and converse trends between GPP and ER. Such persistent net heterotrophy shifts would threaten aquatic biodiversity and weaken ecological resilience of ffowing waters to climate change.

How to cite: Guan, Q., Shi, K., Woolway, R. I., Qin, B., Zhang, Y., and Ran, L.: Declining Predictions of Net Ecosystem Production in US Rivers and Streams Throughout the 21st Century, EGU General Assembly 2026, Vienna, Austria, 3–8 May 2026, EGU26-12035, https://doi.org/10.5194/egusphere-egu26-12035, 2026.

EGU26-12055 | ECS | Orals | HS10.12

Browning Lakes in a Greening Arctic: A Sediment- and Satellite-Based Circum-Arctic Synthesis 

Ludwig Strötz, Tarmo Virtanen, Kaarina Weckström, Maija Heikkilä, and Jan Weckström

Climate change is amplified in the Arctic, which is warming four times faster than the globe. Lakes are abundant across Arctic landscapes, integral to hydrological cycles and associated ecosystem functions and services, and act as sentinels of environmental change in the region. 
Across the terrestrial Arctic, widespread but spatially heterogeneous greening trends have been documented through remote sensing, linked to field-observed increases in vegetation growth, range expansion, and altered community composition. Concurrently, increases in terrestrial organic matter loading have been reported in some Arctic lakes, associated with browning, while other lakes are greening, linked to enhanced algal growth under shifting nutrient and thermal conditions.
While the theoretical basis for recent catchment vegetation and lake-water quality shifts is clear, circum-Arctic evidence linking the two phenomena remains scarce. 
Here, we assess coupled greening and browning trends of terrestrial vegetation and aquatic indicators (total organic carbon, TOC; chlorophyll-a, ChlA) in ~100 circum-Arctic lake-catchment systems across Alaska, Canada, Greenland, Fennoscandia, and Russia. TOC and ChlA are reconstructed from sediment records using visible–near infrared spectroscopy (VNIRS)-based inference. Catchment vegetation change is quantified based on annual peak greenness and growing-season length, using spectral vegetation indices (NDVI, EVI2, and NIRv) from Landsat, AVHRR, and MODIS satellites over 1984–2025. Patterns in vegetation trends are described and analyzed using a custom land-cover reclassification, aboveground biomass, and vegetation height datasets. 
Our remote-sensing results indicate widespread greening of catchments since the 1980s, at heterogeneous rates across Arctic regions and vegetation zones. Early sediment-based reconstructions indicate TOC increases in numerous lakes over the same period; ChlA is generally increasing but not consistently coupled to TOC. The greening-browning relationship will be evaluated through multivariate association analyses, accounting for physiographic and bioclimatic setting (e.g., latitude, topography, temperature/precipitation, vegetation type, hydrological connectivity). Our presentation will summarize catchment vegetation and lake-water TOC and ChlA trajectories across the Arctic, and identify the conditions under which they are linked most strongly.

How to cite: Strötz, L., Virtanen, T., Weckström, K., Heikkilä, M., and Weckström, J.: Browning Lakes in a Greening Arctic: A Sediment- and Satellite-Based Circum-Arctic Synthesis, EGU General Assembly 2026, Vienna, Austria, 3–8 May 2026, EGU26-12055, https://doi.org/10.5194/egusphere-egu26-12055, 2026.

EGU26-12214 | ECS | Orals | HS10.12

Reversible Bio-Sorption and Solute Transport in Floating Vegetated Wetlands 

Sourav Hossain and Christina W. Tsai

Floating vegetated wetlands play a vital role in improving water quality by filtering pollutants and mitigating eutrophication in lakes, rivers, and wastewater systems. Within these systems, solute transport is strongly influenced by the interaction between hydrodynamics, vegetation structure, and reactive processes such as biosorption; however, the mechanisms governing such interactions remain poorly understood. This study develops a novel mathematical model to elucidate the dispersion of reactive solutes in flows containing floating vegetation, incorporating reversible adsorption–desorption dynamics at the vegetation–water interface. The governing equations are upscaled using Mei’s homogenization technique to derive an effective dispersion coefficient that accounts for multiscale interactions between flow and reaction processes. Three key dimensionless parameters, namely the vegetation factor (α), partition coefficient (θ), and Damköhler number (Da), are identified as primary controls on the effective dispersion behavior. Results indicate that vegetation density modulates flow heterogeneity and mechanical dispersion, with sparse vegetation (α < 1) promoting molecular diffusion-dominated transport, while dense vegetation (α > 1) induces recirculation zones that suppress dispersion. Additionally, increasing Da enhances solute localization via faster reactions, whereas higher θ intensifies retention within the biofilm phase. The interplay among α, θ, and Da defines distinct transport regimes, revealing optimal combinations that balance mixing and reaction for efficient contaminant removal. These findings provide a mechanistic framework for designing and optimizing floating vegetated wetlands, enabling improved control of solute fate under varying hydrodynamic and biochemical conditions.

How to cite: Hossain, S. and W. Tsai, C.: Reversible Bio-Sorption and Solute Transport in Floating Vegetated Wetlands, EGU General Assembly 2026, Vienna, Austria, 3–8 May 2026, EGU26-12214, https://doi.org/10.5194/egusphere-egu26-12214, 2026.

EGU26-12221 | ECS | Orals | HS10.12

Beyond Expectations: Unusual Water and Salt Chemistry in the Okavango Delta (Botswana) 

Valentin Challier, Marc Jolivet, Nashaat Mazrui, Aline Dia, Mélanie Davranche, Olivier Dauteuil, Maxime Pattier, Patrice Petitjean, and Lionel Dutruch

Wetlands developing in semi-arid regions are increasingly affected by salinisation and trace element enrichment; processes that should increase in time with climate changes and anthropic activities. The Okavango Delta (Botswana) provides a rare example of a pristine wetland that nevertheless shows evidence of trace element contamination. This alluvial fan located in the SW termination of the East African Rift System is in the heart of an endoreic drainage network taking its source in Angola and having its outlet in the Makgadikgadi pans. Annual floods enter the Delta, creating permanent and seasonal swamps that isolate thousands of islands of various sizes and shapes. Subsurface (2 to 3 m deep) groundwaters in the Delta are known to be largely alkaline with pH values up to 9, dissolved inorganic carbon values up to 4400 ppm and elevated concentrations of dissolved metals and metalloids, some of which are toxic (arsenic up to 6 ppm, uranium up to 12 ppm, vanadium up to 4 ppm, etc.). A first model explained the formation of the saline groundwater through evapotranspiration of the fresh water brought by the annual flood followed by infiltration through the tree belts surrounding the many islands emerging from the wetlands. However, our recent trace-element geochemical studies of groundwater and sediment in the central part of the Delta, showed that groundwater composition could not result from a simple evapotranspiration of surface water, leading to the proposition of a two-aquifer model. In this model, the two aquifers are hydrologically and chemically separated by a clay-rich layer. The surface aquifer contains circumneutral pH fresh water while the subsurface aquifer is seal-capped by the clay layer and contains alkaline water. Following this initial result, the present study addresses the nature, composition and origin of salt deposits that have been described on several of these islands of the Delta, especially in its eastern, more humid region. For the first time, we provide a complete major and trace elements geochemical description of these salts and compare them to evaporites from the Makgadikgadi pans. We demonstrate that the composition of the Delta salts (essentially trona) is very different from that of the Makgadikgadi evaporites (mostly halite) but, in some points, similar to that of the alkaline groundwater previously described. Our main hypothesis is that surface water could represent a source for the salt deposits through a coupling of mechanisms involving evaporation and biotic/abiotic (bio)geochemical processes. Here alkaline groundwater could represent a testimony of past similar processes trapped under a clay-rich layer. The concentrations of trace elements in the Delta salts (As: up to 110 ppm, U: up to 12 ppm, V: up to 14 ppm) and potential toxicity to the environment and local populations will be discussed.

How to cite: Challier, V., Jolivet, M., Mazrui, N., Dia, A., Davranche, M., Dauteuil, O., Pattier, M., Petitjean, P., and Dutruch, L.: Beyond Expectations: Unusual Water and Salt Chemistry in the Okavango Delta (Botswana), EGU General Assembly 2026, Vienna, Austria, 3–8 May 2026, EGU26-12221, https://doi.org/10.5194/egusphere-egu26-12221, 2026.

EGU26-12530 | Orals | HS10.12

WISE-Wetland: A spatially-explicit carbon cycling model for wetland watersheds 

Junzhi Liu, Dawei Xiao, and Jiaojiao Liu

Wetlands play a critical role in the global carbon cycle, functioning as major carbon sinks while also serving as important sources of greenhouse gas emissions. Yet, in most watershed-scale carbon cycling models, wetlands are either highly simplified or omitted altogether, limiting our ability to represent wetland hydrological connectivity and associated carbon dynamics. To address this gap, we developed WISE-Wetland, a spatially explicit watershed-scale carbon cycling model.

We first proposed an improved discretization framework that explicitly represents wetlands as independent hydrological units within a watershed and constructs a wetland routing network. Using this wetland-unit routing network and delineated wetland catchments, we quantified and analyzed key wetland attributes, including area, hydrological connectivity, and routing characteristics. Building on this framework, we integrated a wetland carbon cycling module into WISE (Watershed-based Integrated Simulator for the Environment) that explicitly accounts for wetland routing processes—water retention, water-level dynamics, and wetland carbon transformation, transport, and emission.

WISE-Wetland has been implemented across diverse catchments. Simulations for the northern Krycklan watershed show that explicitly incorporating wetland routing networks substantially reconfigures organic carbon transport pathways and fluxes, leading to a marked improvement in model performance. We also simulated wetland carbon emissions in the Cottonwood watershed, demonstrating that the model can resolve spatial gradients and heterogeneity in wetland CH₄ fluxes, providing a more robust basis for quantifying wetland methane emissions and characterizing their spatial variability. Because watersheds are fundamental units of water and material redistribution, explicitly simulating wetland carbon cycling at the watershed scale offers critical insights into how future, climate-driven hydrological changes may regulate wetland carbon source–sink dynamics. Overall, WISE-Wetland provides a novel framework for advancing quantitative assessments of wetland contributions to regional and global carbon balances.

How to cite: Liu, J., Xiao, D., and Liu, J.: WISE-Wetland: A spatially-explicit carbon cycling model for wetland watersheds, EGU General Assembly 2026, Vienna, Austria, 3–8 May 2026, EGU26-12530, https://doi.org/10.5194/egusphere-egu26-12530, 2026.

EGU26-12751 | Posters on site | HS10.12

Land-water-atmosphere interaction over a deep large high-altitude lake: generation of mesoscale cyclones (limnocanes)  over Lake Hovsgol (Mongolia) 

Alexei V. Kouraev, Florian Pantillon, Nicolas Maury, Elena Zakharova, Andrey Kostianoy, Nicholas Hall, Patrick Marchesiello, and Andrey Suknev

Lake Hovsgol in Mongolia is a large deep mountainous lake. This lake is located in continental climate conditions and is ice-covered every year between December and June. In winter large water volume lead to significant heat inertia, late ice cover formation and strong temperature contrast between air over the lake and over land. 

We first discuss a mesoscale cyclone that has been formed over the lake in December 2023. There are extratropical mesoscale cyclones which take their energy from the large-scale baroclinic instability, such as most cyclones in the Mediterranean sea. However, some cyclones such as Medicanes (“Mediterranean hurricanes”) and polar lows develop from both baroclinic instability (like extratropical cyclones) and surface exchanges over the relatively warm sea (like tropical cyclones). There were also cases when cyclones were observed over lakes, such as Great Lakes, or Lake Victoria, but in most cases these cyclones developed elsewhere and their size was several hundreds of kilometers - much larger than the lakes themselves.

We analyse the generation, evolution and dissipation of a cyclone over lake Hovsgol in 2023 using various satellite imagery in the visible, thermal and microwave ranges, as well as meteorological data. Rapid decrease of air temperature from –8 to –30°C led to wind oriented from the coast to the lake, creation of several convergence lines and ultimately formation of a cyclone with outer radius of about 35 km. This cyclone has been generated over the lake itself (and not advected from some other regions) and its size was limited by the lake size which itself is 130x35 km. The cyclone was short lived (about 24 hours) but had a well-developed cloud-free eye with diameter of 3.5 km, comma head and outflow cirrus shield. Heavy snowfall was observed at that time by local populations. Two days after cyclone dissipation most of the lake was ice covered.

We present data on cyclone position and displacement, estimate speed and direction of wind-driven ice drift during the cyclone presence and based on this assess potential speed of surface wind. We also estimate height and temperature of cloud cover. We discuss the potential structure of the cyclone, its influence on surface water currents and ice formation.

We also present several other cases when such cyclones have been observed over lake Hovsgol in other years. These examples confirm that such events are a repeatable feature over deep and large lakes, and we propose to call them Limnocanes (by analogy with Medicanes).

This research was supported by the CNES TOSCA LAKEDDIES-II, TRISHNA and SWIRL projects. A.G. Kostianoy was supported in the framework of the Shirshov Institute of Oceanology RAS budgetary financing (Project N FMWE--2024-0016). 

How to cite: Kouraev, A. V., Pantillon, F., Maury, N., Zakharova, E., Kostianoy, A., Hall, N., Marchesiello, P., and Suknev, A.: Land-water-atmosphere interaction over a deep large high-altitude lake: generation of mesoscale cyclones (limnocanes)  over Lake Hovsgol (Mongolia), EGU General Assembly 2026, Vienna, Austria, 3–8 May 2026, EGU26-12751, https://doi.org/10.5194/egusphere-egu26-12751, 2026.

EGU26-13554 | Orals | HS10.12

PanLake: A Transferable Framework for Monitoring Trophic Dynamics in Shallow Lakes 

huan li, Boglárka Somogyi, Viktor R. Tóth, Hongtao Duan, Juhua Luo, and R. Iestyn Woolway

Shallow lakes (89% of global lakes) face escalating pressures from eutrophication and climate change, yet comprehensive monitoring of chlorophyll-a (Chl-a) spatiotemporal dynamics remains challenging due to high costs and logistical constraints of traditional sampling. Developing transferable satellite-based frameworks is essential for scaling lake management from individual systems to regional assessments, particularly as climate warming intensifies phytoplankton bloom dynamics globally.

We developed an integrated remote sensing framework using four decades (1984-2023) of Landsat observations (30 m Chl-a). The framework integrates: machine learning-validated retrieval algorithms, exponential modelling for nutrient-driven spatial patterns, statistical phenological analysis, and zone-specific (littoral vs. pelagic) dynamics quantification. Trend detection employs Mann-Kendall tests with Sen's slope and bootstrap uncertainty estimates. Analysis of Lake Balaton (Central Europe, 596 km², 3.7 m depth) revealed: (1) robust exponential Chl-a decay from the primary nutrient source (k=0.04-0.06 km⁻¹) consistent across four decades and varying trophic conditions; (2) pronounced spatial heterogeneity with littoral zones maintaining 1.3-2.8× higher Chl-a than pelagic zones due to integrated signals from phytoplankton, benthic algae, and macrophytes; (3) climate-driven phenological advancement of 20 days in peak timing and 10 days in growing season onset, coupled with 0.7°C/decade surface warming; (4) 68% algal biomass reduction following nutrient management, demonstrating effective restoration despite concurrent climate pressures. The methodology is currently being extending to Lake Taihu (China, 2,338 km², 1.9 m depth) through international collaboration, testing framework performance across contrasting geographic, climatic, and trophic contexts. We will present comparative results examining the generalizability of spatial decay parameters, littoral-pelagic ratios, phenological response patterns, and climate sensitivity across these systems.

The transferable principles enable scaling from intensive single-lake studies to regional assessments, supporting evidence-based management for thousands of shallow lakes globally facing dual pressures of eutrophication and climate change.

How to cite: li, H., Somogyi, B., Tóth, V. R., Duan, H., Luo, J., and Woolway, R. I.: PanLake: A Transferable Framework for Monitoring Trophic Dynamics in Shallow Lakes, EGU General Assembly 2026, Vienna, Austria, 3–8 May 2026, EGU26-13554, https://doi.org/10.5194/egusphere-egu26-13554, 2026.

EGU26-14595 | Orals | HS10.12

Understanding Cultural Ecosystem Services of Wetlandscapes: Insights from Central Italy 

Elena Bresci, Giulio Castelli, Luigi Piemontese, Niccolò Renzi, Enrico Lucca, Lorenzo Villani, Noemi Mannucci, Tommaso Pacetti, Enrica Caporali, Anna Scaini, and Fernando Jaramillo

Wetlandscapes are fundamental social-ecological systems that provide a wide range of provisioning, regulating, cultural, and supporting ecosystem services. While the ecosystem services of provisioning and regulation of hydrological and biological functions have been the main focus of scientific investigation, wetlandscape cultural ecosystem services (WCES) are comparatively underexplored, despite their central role in shaping human–wetland(scapes) relationships, collective memory, and long-term conservation commitment. Understanding how wetlandscapes are perceived and valued by local communities is essential to reveal the societal foundations of stewardship and sustainable socio-ecological relations.

This contribution presents a participatory approach to the assessment of WCES developed within the wetlandscape composed of the Padule di Fucecchio, the largest inland wetland in Italy, and Lake Sibolla, one of the southernmost peatlands in the world, both located in Tuscany, involving stakeholders from the municipality, recreational centers, farms, the private sector, etc.

We develop a framework to elicit a shared, community-based vision of the wetlandscape, integrating place-based values, narratives, and relational dimensions with more conventional eco-hydrological representations. We find that although hydrologically and ecologically connected, these wetlands are characterized by complex histories, functions, and cultural meanings. They demonstrate how connectivity and integration can support both ecological and social benefits, providing a unique opportunity to explore how diverse social perceptions and values coexist within a single wetlandscape. This approach allows us  to expand the conceptual boundaries of wetlandscapes beyond purely biophysical definitions, framing them as dynamic socio-ecological systems shaped by reciprocal interactions between water, ecosystems, and society with implications for wetland management and conservation.

Acknowledgements

The project DOWES has received funding from The Swedish Research Council for Environment, Agricultural Sciences and Spatial Planning (Sweden), the Agence Nationale de la Recherche (France), Engineering and Physical Sciences Research Council (United Kingdom), Ministero dell'Università e della Ricerca (Italy), Fundação de Amparo à Pesquisa do Estado do Amazonas (FAPEAM/Brazil), Secretaria de Estado de Desenvolvimento Econômico, Ciência, Tecnologia e Inovação (SEDECTI/Brazil) and the Amazonas State Government (Brazil)— call N. 026/2023 WATER4ALL 2023, and the European Union’s Horizon Europe Programme under the 2023 Joint Transnational Call of the European Partnership Water4All (Grant Agreement n°101060874).

How to cite: Bresci, E., Castelli, G., Piemontese, L., Renzi, N., Lucca, E., Villani, L., Mannucci, N., Pacetti, T., Caporali, E., Scaini, A., and Jaramillo, F.: Understanding Cultural Ecosystem Services of Wetlandscapes: Insights from Central Italy, EGU General Assembly 2026, Vienna, Austria, 3–8 May 2026, EGU26-14595, https://doi.org/10.5194/egusphere-egu26-14595, 2026.

EGU26-15390 | Orals | HS10.12

Reducing the structural uncertainty of global lake evaporation rate projection 

Wei Wang, Zhiwen Wen, Zhonghua Zheng, Taikan Oki, and Xuhui Lee

Evaporation is a key component of freshwater loss of lakes. Policy makers need reliable evaporation projection for adaptive allocation of water resources. However, large uncertainty exists in global lake evaporation rate (E) projection. When scenario is fixed, the uncertainty is mainly arisen from climate model uncertainty, that is the choice of Earth system model (ESM) outputs to drive lake model. However, the relative contribution of ESMs structural uncertainty is still unclear. Furthermore, there is no physics-informed method to reduce structural uncertainty. A primary reason is that multi-model ensemble projections of lake E in online mode are still absent. To address the shortcoming, we firstly combined Community Earth System Model 2 (CESM2), the only one with lake E projections under SSP370 in CMIP6, with automatic machine learning algorithm to establish a global lake E emulator. The emulator “solves” the lake E statistically with high efficiency instead of numerically. The dynamic interactions between lake and atmosphere are also preserved in the emulator by training with the CESM2 Large Ensemble (LENS2). The emulator can produce global online multi-model projections of lake E under SSP370 scenario with 30 ESM atmospheric forcing variables. Then, the structural uncertainty is calculated as standard deviation among multiple ESMs. At last, the emergent constraints for lake E structural uncertainty were established in different climate zones and at the global scale. The results show that structural uncertainty is the largest for tropical lakes. VPD is an optimal variable used for emergent constraints. After emergent constraints, Lake E in tropical climate will increase a little faster with reduced uncertainty (~23%). This study can provide theory support for enhancing credibility of future lake water storage projection, also show the direction for improving lake processes simulation in next generation of ESMs.

How to cite: Wang, W., Wen, Z., Zheng, Z., Oki, T., and Lee, X.: Reducing the structural uncertainty of global lake evaporation rate projection, EGU General Assembly 2026, Vienna, Austria, 3–8 May 2026, EGU26-15390, https://doi.org/10.5194/egusphere-egu26-15390, 2026.

EGU26-15652 | ECS | Orals | HS10.12

Emergent surface water dynamics across wetlandscapes in the NOAA GFDL Land Model 

Laura Torres-Rojas, Sergey Malyshev, Elena Shevliakova, and Nathaniel Chaney

Wetlands play a critical role in regulating hydrologic, energetic, and biogeochemical processes across landscapes. Yet Earth System Models (ESMs) remain unable to represent one of their defining physical features: shallow surface-water ponding. Because most land models describe wetness only through soil moisture or water-table depth, they cannot simulate the temporary storage, lateral redistribution, and seasonal expansion of surface water that can affect evapotranspiration, surface energy partitioning, and greenhouse-gas exchange. This limitation weakens our ability to represent how wetlands embedded within larger wetlandscapes regulate water, climate, and carbon fluxes.

We have recently developed a new Surface–Soil Exchange and Emergent Ponding (SEEP) scheme within the NOAA GFDL land model (LM4.1). SEEP introduces an explicit surface water column, two-way exchange between ponded water and soil, revised surface energy fluxes, and topography-based lateral overflow. Initial applications over the Everglades, evaluated against the Everglades Depth Estimation Network (EDEN), demonstrate that the framework can generate realistic seasonal inundation and associated shifts in latent and sensible heat fluxes. These experiments provide a proof-of-concept that surface ponding can be represented dynamically inside an ESM.

The next phase of this work will focus on refining, generalizing, and testing this new wetland hydrology framework across broader wetlandscapes. We will conduct a multi-site evaluation across the EDEN network to constrain key SEEP parameters controlling infiltration, overflow, and clogging-layer resistance, to improve peak water depths, short-term variability, and timing. In parallel, we will extend the surface-water column to allow for dynamically deeper surface-water formations and improve the representation of bathymetry to enhance topographic realism further.

These developments will be integrated into the full LM4.1–ESM4.1 modeling system to assess how improved ponding physics alters land–atmosphere coupling. Finally, the refined hydrologic framework will be coupled to the existing Global Integrated Microbial Interactions with Carbon in Soil (GIMICS) in LM4.1, enabling evaluation of how surface inundation and water-table dynamics regulate CO₂ and CH₄ fluxes across wetlandscapes.

By advancing the physical representation of surface water in ESMs and grounding it in field observations, this work provides a pathway to connect site-scale wetland processes with watershed-scale climate and carbon feedbacks, supporting more realistic assessments of wetland resilience and nature-based climate solutions.

How to cite: Torres-Rojas, L., Malyshev, S., Shevliakova, E., and Chaney, N.: Emergent surface water dynamics across wetlandscapes in the NOAA GFDL Land Model, EGU General Assembly 2026, Vienna, Austria, 3–8 May 2026, EGU26-15652, https://doi.org/10.5194/egusphere-egu26-15652, 2026.

Comprehensive long-term insights into lake thermal dynamics—spanning both historical evolution and future trajectories—are critical for assessing climate change impacts on freshwater ecosystems. Unlike gridded surface temperature products that average over land and water, lake-specific datasets like GLAST offer superior precision by resolving thermal dynamics for 92,245 individual lakes worldwide. However, the previous version (v1.0, https://zenodo.org/records/8322038) was constrained by a historical record ending in 2020 and reliance on older CMIP5-based forcing. Here, we introduce GLAST v2.0, which overcomes these limitations by extending the historical reconstruction and integrating latest-generation projections. Using the FLake model calibrated against satellite observations, we extended historical simulations (driven by ERA5-Land) to 1981–2025, thereby capturing recent extreme warming events. Future projections (2015–2100) were upgraded to the ISIMIP3b (CMIP6) protocol under SSP1-2.6, SSP3-7.0, and SSP5-8.5 scenarios. Acknowledging the inherent differences between reanalysis and ESM forcing, we intentionally retain the 2015–2025 overlap period to allow users to quantify discontinuities and apply tailored bias corrections. Extensive validation against independent observations confirms the dataset's robust performance in capturing interannual variability and recent warming trends. GLAST v2.0 provides a vital, high-resolution resource for assessing lake thermal evolution under the latest climate narratives.

How to cite: Tong, Y., Feng, L., and Woolway, R. I.: GLAST v2.0: A lake-specific daily surface water temperature dataset (1981–2100) integrating recent extremes and CMIP6 projections, EGU General Assembly 2026, Vienna, Austria, 3–8 May 2026, EGU26-16744, https://doi.org/10.5194/egusphere-egu26-16744, 2026.

EGU26-17179 | ECS | Orals | HS10.12

Hydrological thresholds govern methane flux variability across wetland-cropland transition landscapes 

Stella Nevermann, Esteban Jobbagy, Marcelo D. Nosetto, Javier Houspanossian, Francisco Diez, Juan I. Whitworth-Hulse, Marcos J. Niborski, Mariana Rufino, and Mohsen Zarebanadkouki

Hydrological variability is a key regulator of greenhouse gas (GHG) fluxes across wetland-cropland transitions in cultivated landscapes, acting directly through water table dynamics and indirectly via land-use change, yet the balance of these effects is poorly understood. In these landscapes, rapid shifts in soil moisture which may extend to fully saturated conditions, can trigger highly dynamic methane (CH₄) and carbon dioxide (CO₂) responses, particularly within transition zones. In very flat and highly cultivated regions such as the Argentinian Pampas, widespread flooding and land-use reversion to wetlands have been associated with hydrological changes linked to the historical expansion of croplands. The effects of this large-scale ecohydrological transformation on biogeochemical functioning are still unclear.

We measured CH₄ and CO₂ fluxes across wetland-cropland transitions spanning multiple land uses and moisture regimes using in situ GHG monitoring combined with a broad suite of soil physical and chemical parameters across multiple field campaigns. This approach captured a wide range of water table positions and trends and allowed assessment of hydrology-, soil-, and carbon-related drivers of flux variability.

Across the landscape, water table depth was the dominant control on CH4 fluxes, with wetlands exhibiting the highest values. CH₄ fluxes displayed a clear nonlinear response to hydrological conditions, with sharp increases once the water table approached the soil surface (-24 cm), indicating a strong threshold behaviour. While accounting for water table position reduced apparent differences among land uses, CH₄ fluxes remained systematically higher in wetlands and transitional zones than in croplands and pastures, demonstrating additional modulation by land-use–specific soil properties. Moreover, the sensitivity of CH₄ emissions to water table changes differed among land uses, with transitional zones and wetlands showing the strongest responses, highlighting their vulnerability to small hydrological shifts.

In contrast, CO₂ fluxes were primarily controlled by temperature and dissolved organic carbon availability and showed a comparatively weaker and more gradual response to moisture gradients, without clear threshold behaviour.

Overall, our results show that water table dynamics are the primary control on CH₄ flux variability at the landscape scale, while land use determines how strongly soils respond to hydrological change. These findings emphasize the importance of accounting for both hydrological variability and land-use transitions when assessing GHG emissions from ecosystems.

How to cite: Nevermann, S., Jobbagy, E., Nosetto, M. D., Houspanossian, J., Diez, F., Whitworth-Hulse, J. I., Niborski, M. J., Rufino, M., and Zarebanadkouki, M.: Hydrological thresholds govern methane flux variability across wetland-cropland transition landscapes, EGU General Assembly 2026, Vienna, Austria, 3–8 May 2026, EGU26-17179, https://doi.org/10.5194/egusphere-egu26-17179, 2026.

EGU26-17949 | ECS | Posters on site | HS10.12

Declining lake ice thickness and its implications for community travel in northern regions: a modeling study (1981–2025)  

Jipeng Shan, Yan Tong, R. Iestyn Woolway, Ishfaq Hussain Malik, and James D. Ford

Northern regions are experiencing warming rates that significantly exceed the global average, triggering rapid and profound changes in freshwater ice dynamics. These changes manifest as delayed freeze-up, earlier break-up, and, critically, a reduction in ice thickness that threatens the safety of traditional travel routes. Addressing the scarcity of lake-specific ice thickness data in northern communities, this study employs the FLake numerical model to estimate ice thickness variations from 1981 to 2025 for 161 lakes identified along community winter travel routes. By integrating these simulations with safety thresholds derived from local community surveys, we quantify the reduction in days of safe access. Results indicate a significant thinning trend, with annual mean and maximum ice thickness decreasing at rates of 1.42 cm/decade and 1.43 cm/decade, respectively. Consequently, the duration of safe access has declined by a cumulative total of 11.8 days over the 45-year period (a rate of 2.67 days/decade). This study elucidates how accelerated regional warming is compromising essential winter mobility, providing a scientific basis for developing adaptation strategies to mitigate risks for ice-dependent communities across northern latitudes.

How to cite: Shan, J., Tong, Y., Woolway, R. I., Malik, I. H., and Ford, J. D.: Declining lake ice thickness and its implications for community travel in northern regions: a modeling study (1981–2025) , EGU General Assembly 2026, Vienna, Austria, 3–8 May 2026, EGU26-17949, https://doi.org/10.5194/egusphere-egu26-17949, 2026.

EGU26-19072 | Posters on site | HS10.12

Climate-driven controls on greenhouse gas emissions from global reservoirs inferred from satellite observations and machine learning 

Manu Seth, Maria Ubierna Aparicio, Cristina Diez Santos, and Faye Outram

Reservoirs are increasingly recognised as dynamic components of the global carbon cycle. Yet, their greenhouse gas (GHG) emissions are still poorly understood due to strong spatiotemporal variations, seasonality and the scarcity of in-situ measurements. Climate-driven variability in thermal conditions, hydrodynamics and reservoir morphology is expected to control both the magnitude and temporal variability of carbon dioxide (CO₂) as well as methane (CH₄) emissions. However, these controls remain poorly understood at the global scale.

Here, we combine satellite observations and machine-learning models to examine climate-related patterns in reservoir GHG emissions across more than 21,000 reservoirs globally from 2020 to 2024. Average CO₂ and CH₄ emissions on a monthly scale are obtained by combining GHG concentration-based observation from the Greenhouse Gases Observing Satellite (GOSAT) with climate reanalysis data (ERA5) and relevant reservoir information such as surface area or catchment area. We employ tree-based ensembles of models to estimate monthly emissions and explore how emissions vary with season, location and reservoir characteristics among different hydroclimatic regions.

The resulting emission estimates exhibit clear global seasonal variations and show a strong seasonal phasing, with most emissions peaking during local seasonal extremes. Seasonal emissions show less variation in larger reservoirs while the smaller reservoirs show greater seasonal changes because they are strongly influenced by climate forcing and have less ability to moderate variability. Spatial aggregation reveals strong zonal differences and nonlinear relationships with thermal regimes, highlighting the complex interplay between climate variability and physical characteristics of the reservoir on GHG emissions regulation.

Together, these findings show that machine learning models using satellite-derived information can reveal physically consistent spatiotemporal patterns in reservoir GHG emissions at global scales. While comprehensive site-scale validation remains limited at the global scale, the observed consistency across temporal, spatial and physical characteristics reconfirms that satellite-enabled modelling could be useful to assess climate-driven variability in inland-water carbon emissions at larger scales and guide focused future observational efforts.


How to cite: Seth, M., Ubierna Aparicio, M., Diez Santos, C., and Outram, F.: Climate-driven controls on greenhouse gas emissions from global reservoirs inferred from satellite observations and machine learning, EGU General Assembly 2026, Vienna, Austria, 3–8 May 2026, EGU26-19072, https://doi.org/10.5194/egusphere-egu26-19072, 2026.

EGU26-19693 | ECS | Orals | HS10.12

Tidal branching wetlands morphology and its role on water-carbon budget cycles  

Filippo Miele, Benjamin Kargere, Meret Aeppli, and Sara Bonetti

Coastal wetlands represent invaluable “carbon banks”, as they naturally capture and store atmospheric carbon under water-logged conditions, where dead plant material decomposes very slowly, and organic layers build up in the soil. However, when drained or perturbed, wetlands can switch from carbon sinks to major sources, making monitoring and restoring degraded wetlands a worldwide environmental priority. Water table level plays a key role in regulating carbon exchange, but uncontrolled rewetting works do not suffice in restoring their optimal status. The reason is that forecasting beneficial effects of wetlands restoration is often challenged by the complexity of coupled water-soil-vegetation dynamics that both regulate soil respiration rate and shape micro-scale morphological features in the short and long terms. As a result, a significant number of studies have reported unexpected and significant failure outcomes in restoration works. Existing modeling frameworks generally neglect the spatial heterogeneity of wetland morphology and rely on heavy implementations of empirical functions, which limits model predictions to be site-specific. In this work, we adapt a landscape evolution model to explicitly simulate spatial wetlands morphology, accounting for coupled water, sediment, and vegetation dynamics. Carbon fluxes are then evaluated in a spatially explicit manner accounting for the high-resolution simulated heterogeneity of water table level, sediment elevation, and vegetation density. The modelled surface morphology is first compared, through standard river network metrics, with satellite images of tidal wetlands that exhibit different levels of river channeling. The simulated spatially-distributed carbon fluxes suggest that highly branched morphologies promote optimal water distribution and enhance carbon sequestration. These trends are confirmed by comparing simulated ecosystem fluxes with flux-tower eddy covariance measurements in several tidal wetlands.

How to cite: Miele, F., Kargere, B., Aeppli, M., and Bonetti, S.: Tidal branching wetlands morphology and its role on water-carbon budget cycles , EGU General Assembly 2026, Vienna, Austria, 3–8 May 2026, EGU26-19693, https://doi.org/10.5194/egusphere-egu26-19693, 2026.

Harmful algal blooms (HABs) increasingly threaten freshwater ecosystems under intensifying anthropogenic and climatic pressures. Accurate short-term forecasting of HABs remains challenging, particularly in shallow lakes where phytoplankton dynamics are strongly influenced by meteorological variability through its effects on mixing intensity, thermal structure, and light availability. These rapid, non-stationary processes play a critical role in the development and decay of algal blooms, yet they remain poorly resolved by conventional low-frequency monitoring and are often oversimplified in predictive models relying on temporal persistence alone.

In this study, we investigate seasonal algal dynamics in Lake Taihu, a large shallow lake in China, using high-frequency vertical profiling data acquired by an autonomous monitoring system, providing a high-resolution dataset comprising 3 to 5 readings per second, and moving 2–3 cm per dataset, including observations of water temperature, conductivity, dissolved oxygen, pH, colored dissolved organic matter, chlorophyll-a, phycocyanin, and underwater photosynthetically active radiation, together with concurrent meteorological forcing including wind, air temperature, atmospheric pressure, and precipitation. This unique combination enables the explicit characterization of diel to seasonal variability in vertical water-column structure under changing meteorological conditions.

To extract spatiotemporal patterns from these heterogeneous observations, we apply a hybrid deep learning framework that integrates convolutional, recurrent, and attention-based components to predict short-term vertical chlorophyll-a dynamics. Rather than relying purely on autoregressive persistence of biomass, the process-guided model (Phytoformer) is designed to learn the influence of physical drivers associated with wind-driven mixing, stratification, and light attenuation, thereby enhancing ecological interpretability and physical consistency. High short-term predictive skill based on biomass persistence does not necessarily imply an understanding of the environmental drivers that govern bloom intensification or decay. Feature relevance analyses further indicate that physical controls modulate phytoplankton dynamics beyond short-term state persistence, with distinct seasonal patterns.

Our work demonstrates the potential of integrating high-resolution vertical sensing with interpretable deep learning to improve short-term prediction and early warning of HABs across seasons. Ongoing work extends this hybrid modeling framework to deep stratified Wahnbach Reservoir in Germany, where HABs can bloom in specific depth layers under contrasting water quality regimes. This cross-system application aims to explore model generalizability and to identify how dominant physical drivers differ between shallow and deep lake environments.

How to cite: Wei, G. and Norra, S.: Short-term prediction of algal dynamics in freshwater under meteorological variability: insights from high-frequency vertical observations and hybrid modeling , EGU General Assembly 2026, Vienna, Austria, 3–8 May 2026, EGU26-20947, https://doi.org/10.5194/egusphere-egu26-20947, 2026.

EGU26-21681 | ECS | Orals | HS10.12

Climate and human-driven shifts in groundwater–lake interactions in a semi-arid maar lake 

Raúl Silva-Aguilera, Oscar Escolero, Javier Alcocer, Eric Morales-Casique, Selene Olea-Olea, Gloria Vilaclara, Socorro Lozano-García, and Alex Correa-Metrio

Inland waters in semi-arid regions respond rapidly to both climate variability and human pressure, but the mechanisms linking external forcing to groundwater–surface water connectivity are still poorly understood, particularly in tropical lakes. Maar lakes are specially well suited to explore these processes because they are directly embedded in regional groundwater flow systems. We examine these interactions in Lake Alchichica (central Mexico), a semi-arid maar lake that has undergone a persistent decline in water level over recent decades. We developed a conceptual model based on a multiproxy approach combining effective precipitation, regional hydrogeochemistry, isotopic and physicochemical lake data, and groundwater level dynamics. Hydrogeochemical and isotopic patterns indicate a tight coupling between regional groundwater flow and lake water, with progressive chemical evolution along the flow path and increasing ion concentrations driven by intense evaporation. Between 2017 and 2021, groundwater levels dropped by ~38 cm, pointing to a reduction in subsurface inflows and a direct impact on the lake water balance. This decline cannot be explained by meteorological variability alone and instead suggests system-scale changes, likely associated with regional groundwater exploitation and long-term climate variations. Although groundwater chemistry has remained relatively stable, reported shifts in lake temperature and composition indicate emerging pressures on ecosystem functioning. Together, these results show how climatic and anthropogenic forcing can reshape groundwater–lake connectivity threatening lake's habitat. 

How to cite: Silva-Aguilera, R., Escolero, O., Alcocer, J., Morales-Casique, E., Olea-Olea, S., Vilaclara, G., Lozano-García, S., and Correa-Metrio, A.: Climate and human-driven shifts in groundwater–lake interactions in a semi-arid maar lake, EGU General Assembly 2026, Vienna, Austria, 3–8 May 2026, EGU26-21681, https://doi.org/10.5194/egusphere-egu26-21681, 2026.

Traditional hydrologic models often treat wetlands as an aggregated unit, failing to capture dynamic wetlandscape processes, including seasonal expansion-contraction cycles and evolving connectivity patterns that fundamentally alter watershed flow generation. We hypothesized that the inclusion of wetlandscape patterns and behavior can improve prediction of watershed hydrology. Here, we link wetlandscape characteristics to hydrologic signatures across 200 gaged watersheds in the Prairie Pothole region in the US. Static and dynamic landscape metrics capturing wetland position, configuration and variability were determined using the Dynamic Surface Water eXtents from Harmonized Landsat Sentinel-2 (DSWx-HLS) product and the National Wetlands Inventory while hydrologic signatures were derived from daily discharge gages over twenty years of observation in watersheds with a range of wetland densities. Regression models explained hydrologic signature magnitude and variability using and wetlandscape metrics together with climate, topography, land cover, as predictors. The addition of wetlandscape configuration explained significant additional variance beyond traditional watershed characteristics for multiple signatures. Variable importance analysis revealed wetland spatial patterns ranked among top predictors for six of eight signatures examined. These findings demonstrate that incorporating spatially-explicit wetlandscape dynamics substantially improves hydrologic prediction capabilities across multiple temporal scale

How to cite: Cheng, F.: Wetlandscape Configuration and Structure as Predictors of Watershed Hydrologic Signatures, EGU General Assembly 2026, Vienna, Austria, 3–8 May 2026, EGU26-22855, https://doi.org/10.5194/egusphere-egu26-22855, 2026.

Wetlands play a crucial role in the global carbon cycle, both by sequestering large amounts of carbon in their soils and acting as a major natural source of atmospheric methane. Methane emissions depend strongly on soil temperature, substrate availability, and the depth of the water table relative to the soil surface, reflecting a balance between production, oxidation, and transport. Here we develop a simple mathematical model that captures how production and oxidation interact to control emissions. We condense these processes into a single ordinary differential equation, parameterised by water-table depth, soil temperature, and vegetation-derived carbon inputs, to mechanistically explore how these factors interact to control wetland methane emissions. Using emission data from six mid-latitude wetlands in the Prairie Pothole Region, we show that the model can reproduce seasonal and inter-annual variation in fluxes. Having established this agreement, we employ the model to investigate the conditions under which emissions are maximised. Peak fluxes consistently occur at or just above the soil surface and are strongly modulated by wetland-specific parameters, with oxidation acting as a significant sink in some systems. Importantly, we find that the temperature sensitivity of oxidation is a key determinant of both the magnitude and location of peak emissions. These results highlight how warming may shift emission dynamics, emphasising the need for site-specific and adaptive wetland management and restoration strategies.

How to cite: McNicol, G., Layton, A., and Basu, N.: Understanding the balance between methane production and oxidation from wetlands using a minimalistic emissions model, EGU General Assembly 2026, Vienna, Austria, 3–8 May 2026, EGU26-22857, https://doi.org/10.5194/egusphere-egu26-22857, 2026.

EGU26-23188 | ECS | Orals | HS10.12

The Critical Role of Wetland Conservation and Restoration in Mitigating Nitrogen Pollution Across European River Basins 

Leonardo Enrico Bertassello, Nandita Basu, Joachim Maes, Bruna Grizzetti, A La Notte, and Luc Feyen

Excessive nitrogen (N) inputs from agricultural intensification, wastewater, and atmospheric deposition pose a severe threat to European ecosystems and public health, with N levels in over 57% of freshwater monitoring stations exceeding thresholds for good ecological status. While traditional management practices focus on reducing inputs, nature-based solutions (NBSs) like wetlands offer powerful, cost-effective filtration by facilitating denitrification in their carbon-rich, anoxic soils. This study presents a novel, pan-European modeling framework that combines high-resolution N surplus data, historical wetland distribution, and projected land-use changes to quantify the current and potential N-removal capacity of wetlands across the EU27 and neighboring countries.

The analysis estimates that existing European wetlands currently remove approximately 1,000 kt of nitrogen per year, a service that prevents riverine N loads to the sea from being 25% higher than they are today. Despite this contribution, Europe remains a hotspot for wetland loss, having drained roughly 70% (~78 Mha) of its historical wetland area, primarily for agricultural expansion.

To address current pollution gaps, the study evaluates three restoration scenarios designed to meet water quality targets while balancing agricultural productivity. The most ambitious Restoration scenario - restoring 27% of wetlands historically drained for agriculture (3.2% of total land area) - could reduce N loads to the sea by 36%. However, the study identifies a more efficient strategy, which targets restoration on lands projected to be abandoned by 2040. This approach yields a 22% reduction in total N loads and enables major rivers like the Rhine, Elbe, and Vistula to meet water quality targets with minimal impact on agricultural output.

Cost-benefit analysis indicates that while restoration costs are significant - ranging from €55-358 billion per year for the full scenario - the co-benefits of ecosystem services, such as carbon sequestration and flood regulation, often outweigh these expenses. Ultimately, the findings highlight that spatially targeted wetland restoration is a vital, policy-relevant tool for achieving the European Green Deal’s goals for water quality, biodiversity, and climate sustainability. However, the study concludes that in the most heavily polluted basins, wetland restoration must be paired with continued reductions in diffuse N sources to reach good ecological status.

How to cite: Bertassello, L. E., Basu, N., Maes, J., Grizzetti, B., Notte, A. L., and Feyen, L.: The Critical Role of Wetland Conservation and Restoration in Mitigating Nitrogen Pollution Across European River Basins, EGU General Assembly 2026, Vienna, Austria, 3–8 May 2026, EGU26-23188, https://doi.org/10.5194/egusphere-egu26-23188, 2026.

EGU26-23248 | ECS | Posters on site | HS10.12

Assessing and projecting lake health in a changing world using a coupled physical–biogeochemical model: a case study of Windermere 

Yufei Xue, Eleanor Mackay, Xiangzhen Kong, Yiran Zhang, and Iestyn Woolway

Lake ecosystems are increasingly exposed to multiple stressors arising from the combined effects of climate change and human activities, leading to a range of lake health issues, including oxygen depletion, eutrophication, algal blooms, and even regime shifts. These interacting stressors complicate the diagnosis of lake health and underscore the need for integrative, process-based approaches that explicitly link physical and biogeochemical processes. In this study, we apply a process-based lake ecosystem model (GOTM-WET) to assess and project the ecosystem health of Windermere (South Basin) in the Lake District National Park, UK, a deep, dimictic lake with extensive long-term observations. The model integrates meteorological forcing with in situ measurements of water temperature and dissolved oxygen (DO) to explicitly resolve physical mixing, thermal stratification, and biogeochemical oxygen dynamics. Model calibration is conducted in a stepwise and hierarchical manner, first constraining physical processes and subsequently ecosystem processes, thereby ensuring a robust representation of the coupled physical–biogeochemical lake system. Using the well-calibrated model, we derive a suite of process-based lake health indicators that capture both physical and ecological dimensions of lake functioning. These include stratification characteristics, vertical mixing efficiency, and seasonal hypolimnetic DO depletion rates, which together reflect the capacity of the lake to sustain oxygenated habitats and maintain resilient biogeochemical cycles. Model results demonstrate that variations in physical mixing regimes exert a dominant control on deep-water oxygen dynamics, with important implications for ecosystem stability and habitat quality. By linking observable lake health indicators to underlying ecosystem processes, this study demonstrates the value of process-based modelling for comprehensive lake health assessment. Unlike purely empirical or index-based approaches, the GOTM–WET enables scenario-based simulations and mechanistic interpretation, providing a powerful tool for evaluating lake ecosystem responses under multiple stressors. The approach and evaluation framework developed here is transferable to other lake systems and offers a foundation for scaling lake health assessments from individual lakes to broader regional applications.

How to cite: Xue, Y., Mackay, E., Kong, X., Zhang, Y., and Woolway, I.: Assessing and projecting lake health in a changing world using a coupled physical–biogeochemical model: a case study of Windermere, EGU General Assembly 2026, Vienna, Austria, 3–8 May 2026, EGU26-23248, https://doi.org/10.5194/egusphere-egu26-23248, 2026.

The central west coast of India presents a dynamic coastal environment where geomorphic evolution is governed by a complex interplay of monsoonal forcing, sea-level fluctuations, and human interventions. This study unravels the morphodynamic behavior of embayed beaches across seasonal, decadal, and millennial timescales using an integrated approach that combines field observations, satellite-based shoreline analysis, and paleo-geomorphic reconstructions. Twenty-seven embayed beaches were systematically classified using an embayment morphometric parameter (γe) derived from the embayment area (Ae) and indentation (a), enabling their categorization into open, semi-exposed, and sheltered systems. Field measurements from sixteen representative beaches revealed a pronounced seasonal rhythm driven by the southwest monsoon. Between February 2023 and September 2024, beach profiles and sediment texture analyses indicated distinct monsoon-induced erosion–accretion cycles. Coarser and better-sorted sediments (mean 0.6–4.84 Φ) accompanied high-energy wave conditions and volumetric losses averaging –32.16 m³/m, while post-monsoon periods favoured the deposition of finer, poorly sorted sediments (0.8–4.1 Φ) and volumetric gains averaging +28.61 m³/m. These observations suggest that even morphodynamically semi-isolated embayments respond synchronously to regional wave energy fluctuations, reflecting a delicate balance between hydrodynamic forcing and sediment supply.Extending the temporal perspective, multi-decadal shoreline analyses (1990–2023) derived from remote sensing data revealed spatially variable responses to climatic and anthropogenic drivers. Correlation with rising sea levels, increasing cyclone frequency, and intensifying wave power suggests that regional climate change has accelerated erosion processes. Additionally, the construction of breakwaters and jetties has disrupted longshore sediment transport, intensifying localized shoreline instability.

To place these short-term observations within a broader evolutionary context, paleo-shoreline reconstruction was carried out using geomorphic proxies such as paleo beach ridges, wave-cut terraces, and topographic and hydrographic sinuosity indices derived from high-resolution SRTM DEMs. The reconstruction reveals that around ~12-10ka BP, when sea level stood 80 m below mean sea level, the shoreline coincided with the present-day ~80 m bathymetric flat, advancing ~+4m landward during mid-Holocene (~6-5 ka BP) transgressive phases. Exploring paleoshorelines is critical as it unveils the imprint of post-glacial sea-level rise and tectonic adjustments, providing the millennial-scale context necessary to interpret modern coastal behavior and anticipate future shoreline trajectories under accelerating climate change also these ancient shoreline and beach-ridge formations are important to society and the economy as they can host valuable heavy mineral deposits and serve as reservoirs for groundwater.

Together, these insights portray a continuous narrative of coastal evolution from monsoon-driven sediment oscillations to decadal shoreline shifts and millennial transgressions highlighting the dynamic and interconnected nature of embayed beach systems along the central west coast of India. This multi-temporal framework enhances our understanding of coastal resilience and supports informed management of monsoon-dominated, morphologically sensitive coasts.

How to cite: Mishra, P. K., Murali R, M., and Dwivedi, D.: Decadal to Millennial Evolution of coastline along the Central West Coast of India: Integrating Field Observations, Remote Sensing, and Paleo shoreline Proxies , EGU General Assembly 2026, Vienna, Austria, 3–8 May 2026, EGU26-463, https://doi.org/10.5194/egusphere-egu26-463, 2026.

EGU26-464 | ECS | Posters on site | OS2.3

Exploring Sediment–Morphodynamic Coupling in the Evolving Indian Sundarban Delta 

Deepika Dwivedi, Mani Murali R, Puneet Kumar Mishra, and Shincy Francis

The Indian Sundarban Delta (ISD), occupying the southern sector of the Ganga–Brahmaputra–Meghna (GBM) delta along India’s eastern coast, represents one of the world’s most dynamic yet environmentally fragile deltaic systems. Over the past three decades, the ISD has undergone a pronounced morphodynamic transformation driven by the interplay of reduced sediment supply, sea-level rise, and intensified coastal processes. This study investigates the long-term linkage between suspended sediment dynamics and shoreline evolution from 1990 to 2024, integrating multi-temporal satellite observations, Digital Shoreline Analysis System (DSAS)-based metrics, and satellite-derived suspended sediment concentration (SSC).

Multi-decadal Landsat imagery was used to extract shorelines under comparable tidal conditions and estimate SSC using established semi-empirical models. Shoreline change parameters, including Net Shoreline Movement (NSM) and End Point Rate (EPR), were computed at 50-m intervals along approximately 2,980 km of coast, covering eight geomorphic zones. Results reveal extensive shoreline retreat and land loss, with the highest erosion recorded along the ocean-facing margins of the Hooghly River, where EPR exceeded –60 m/yr. Areal analysis shows widespread island fragmentation and loss of tidal flats, indicating ongoing morphological degradation.

The SSC assessment indicates strong seasonal variation, characterized by higher concentrations during the wet season (May–October) and significantly reduced levels in the dry months. Spatially, SSC within the Ganges–Brahmaputra estuarine complex shows a distinct decline seaward, with the highest turbidity typically found near the river mouth or bay head, depending on discharge magnitude and monsoonal intensity. In these high-turbidity zones, concentrations often exceed 150 mg L⁻¹, reflecting the influence of strong fluvial inputs during peak discharge periods.

A marked long-term decline in SSC, particularly across the outer estuarine zones of the Hooghly and Meghna rivers, reflects significant sediment starvation since the 1990s. This decline is attributed to upstream sediment trapping, altered hydrological regimes, and enhanced marine reworking. The reduced sediment supply has intensified shoreline retreat and disrupted the sediment–morphology balance, shifting the delta towards a net erosional state.

Overall, the study underscores a strong sediment–morphodynamic coupling in the Sundarban region, where the combined effects of sediment starvation, sea-level rise, and intensified hydrodynamic forces are reshaping the deltaic landscape. These findings highlight the urgent need for integrated sediment and coastal management approaches to preserve the ecological stability and livelihood security of this globally significant delta.

How to cite: Dwivedi, D., Murali R, M., Mishra, P. K., and Francis, S.: Exploring Sediment–Morphodynamic Coupling in the Evolving Indian Sundarban Delta, EGU General Assembly 2026, Vienna, Austria, 3–8 May 2026, EGU26-464, https://doi.org/10.5194/egusphere-egu26-464, 2026.

EGU26-799 | ECS | Orals | OS2.3

Geospatial Intelligence for Modelling Shoreline Dynamics in a Mangrove-encompassed Bhitarkanika region, Odisha, India 

Sovana Mukherjee, Lokesh Tripathi, Vijay Veer, Pulakesh Das, and Subhankar Naskar

Serving as significant coastal ecosystems, mangroves and coastlines offer wide range of services and contribute majorly to the socio-economic persistence to the communities. Coastal zones of the Bhitarkanika region (encompasses Bhitarkanika mangrove), in the eastern coastal state of India, exhibit pronounced geomorphic instability driven by hydrodynamic forcing, sediment disequilibrium, and expanding anthropogenic activities. This study formulates an integrated geospatial framework combining Digital Shoreline Analysis System (DSAS), Coastal Vulnerability Index (CVI), and Binary Logistic Regression (BLR) to quantify shoreline dynamics and assess multi-hazard coastal vulnerability. Multi-temporal shorelines derived from Landsat-8 (2013) and Sentinel-2 (2016, 2019, 2022, and 2025) datasets, corrected for tidal variability and validated using Google Earth. The results revealed a predominantly erosional trend, with 87.80% of transect undergoing shoreline retreat and a mean erosion rate of –11.57 m yr⁻¹. Field observations corroborate approximately 174 m of sediment deposition in accretion zones and ~189 m of land loss across rapidly eroding around the mangrove tract. The CVI was developed using elevation, slope, land use land cover (LULC), proximity to shoreline, river, and road, wherein the parameter weights were computed through Principal Component Analysis (PCA), correlation, entropy weighting, and an Ensemble Weighted Model (EWM). The CVI-based outputs indicate that ~47% of the coastline falls within high to very high vulnerability zone, primarily influenced by low-lying terrain, fluvio-marine interactions, and intense human activities. The BLR-based model demonstrates strong predictive performance (accuracy> 85%) and statistically validates the CVI-based output (>75% spatial agreement). The BLR and ensemble-based approaches represents a robust, multi-criteria framework for coastal vulnerability assessment and critical high-risk zonation. The findings provide reliable spatial intelligence to support shoreline management, mangrove restoration strategies, and climate-resilience planning in the Bhitarkanika coastal system.

How to cite: Mukherjee, S., Tripathi, L., Veer, V., Das, P., and Naskar, S.: Geospatial Intelligence for Modelling Shoreline Dynamics in a Mangrove-encompassed Bhitarkanika region, Odisha, India, EGU General Assembly 2026, Vienna, Austria, 3–8 May 2026, EGU26-799, https://doi.org/10.5194/egusphere-egu26-799, 2026.

EGU26-1595 | ECS | Orals | OS2.3

Legacy pollution from historical mining in the Suances Estuary (N Spain): Challenges for ecological recovery 

Jon Gardoki, María Jesús Irabien, Alejandro Cearreta, José Gómez-Arozamena, Ane García-Artola, and Humberto Serrano-García

Estuaries and similar coastal areas are among the most vulnerable ecosystems worldwide, facing environmental degradation due to anthropogenic pressures that demand a comprehensive evaluation of their historical trajectories. The study integrates benthic foraminifera, trace metals (Zn, Pb, Cd, and Hg), and short-lived radionuclides (210Pb and 137Cs) to reconstruct the environmental evolution of the heavily polluted Suances Estuary (N Spain). The investigation focuses on the estuary’s response to the cessation in 2003 of historical mining activities of one of Europe’s largest carbonate-hosted Pb-Zn ore bodies, the Reocín metalliferous deposit. A total of twenty-two surface sediment samples and a short sediment core (47 cm in length) were analyzed. Core samples revealed elevated concentrations of Zn (>10,000 mg kg⁻¹), Pb (max. 2700 mg kg⁻¹), Cd (35.3 mg kg⁻¹), and Hg (41 mg kg⁻¹), exceeding both local baselines and sediment quality guidelines. While a downward trend in surface metal concentrations was observed between 2003 and 2022, the documented spatial heterogeneity suggests ongoing sediment redistribution. Foraminiferal standing crops remain extremely low (1–510 living individuals per 80 cm³), indicating continued ecological stress. Although the Reocín mine was closed more than two decades ago and industrial discharges have been reduced, pollution likely remains as a significant obstacle to environmental recovery. Additionally, the sedimentary record reveals the evidence of an accidental failure in waste storage facilities occurred in 1960, which released substantial volumes of mine tailings into the basin, including the estuary. These events, further comprising the reliability of sediment dating methods based on 210Pb, reinforce the importance of a multidisciplinary approach in studying historically contaminated estuaries.

How to cite: Gardoki, J., Irabien, M. J., Cearreta, A., Gómez-Arozamena, J., García-Artola, A., and Serrano-García, H.: Legacy pollution from historical mining in the Suances Estuary (N Spain): Challenges for ecological recovery, EGU General Assembly 2026, Vienna, Austria, 3–8 May 2026, EGU26-1595, https://doi.org/10.5194/egusphere-egu26-1595, 2026.

EGU26-2269 | ECS | Posters on site | OS2.3

Geomorphological dynamics at the coast: A sedimentary stratigraphy for Atlit-Yam, the earliest coastal village at the Eastern Mediterranean and its submerged landscape  

Vishal Kataria, Nicolas Waldmann, Isaac Ogloblin Ramirez, Gilad Shtienberg, Roni Zukerman-Cooper, Nimer Taha, Elle Grono, Marko Runjajić, Ehud Galili, and David E Friesem

During the early Holocene, rapid sea level rise led to the inundation of worldwide coastal areas, with the surrounding shallow landscapes being the most affected. The Carmel coast, located in the East Mediterranean, preserves a rich record of such a submerged landscape dotted by many archaeological sites, including the well-preserved Atlit-Yam village (Neolithic), which is currently buried and submerged at 8-11 m water depth. In order to reconstruct the geomorphological evolution of the submerged landscape, 23 sediment cores of variable length (ranging 60-240 cm) were drilled both inside and outside the known extent of the Atlit-Yam village. A detailed stratigraphy of the submerged landscape was generated based on the analysis of 18 out of 23 cores, framed by robust radiocarbon ages. The sedimentary sequences identified in the analyzed cores were defined by respective facies associations, and combined with physical (grain size, magnetic susceptibility), chemical (elemental geochemistry), and organic (total organic content) properties of the sediments. Our analysis reveals a non-uniform evolution of submerged coastal sediments, influenced by sediment supply, regional geomorphology, and human activity. Within a spatial stratigraphy, we found distinct anthropogenic units that underlines the intricate balance between humans and the Early Holocene changing environment (including sea level rise, depositional processes, and sediment dynamics). This study holds implications for future research in identifying and preserving potential archeological sites elsewhere and helps to shed light on the impact of climate change, sea level, and surface processes on coastal communities.

How to cite: Kataria, V., Waldmann, N., Ogloblin Ramirez, I., Shtienberg, G., Zukerman-Cooper, R., Taha, N., Grono, E., Runjajić, M., Galili, E., and Friesem, D. E.: Geomorphological dynamics at the coast: A sedimentary stratigraphy for Atlit-Yam, the earliest coastal village at the Eastern Mediterranean and its submerged landscape , EGU General Assembly 2026, Vienna, Austria, 3–8 May 2026, EGU26-2269, https://doi.org/10.5194/egusphere-egu26-2269, 2026.

EGU26-2410 | ECS | Posters on site | OS2.3

Impact of groyne lowering on tidal-flat morphodynamics in a tide-dominated estuary 

Yuhua Zheng, Xiaoyan Li, ming Gong, and Jiafa Shen

Tidal-flat reclamation and coastal stabilization projects are widely implemented in the tide-dominated estuaries of eastern China, where intensive human intervention has profoundly altered sediment dynamics and morphological evolution. The Nanbei Lake reclamation area, located on the northern coast of Hangzhou Bay and the transitional reach of the Qiantang Estuary, China. This zone experiences strong semidiurnal tides, rapid current variations, and frequent typhoon impacts that shape highly dynamic geomorphic patterns. To mitigate erosion and promote siltation, a main embankment and seven rockfill groynes were constructed in 2007. However, long-term monitoring indicates that high crest elevations of the groynes have suppressed cross-shore water exchange, weakened tidal flushing, and promoted excessive sedimentation—patterns likely exacerbated by increasing storm-tide levels and evolving tidal asymmetry under climate change. To address these issues, this study evaluates a groyne-lowering scheme designed to enhance hydrodynamic connectivity while maintaining shoreline protection. A two-dimensional hydro–morphodynamic model (MIKE 21 FM) was developed using high-resolution bathymetry, tidal observations, and sediment data. The computational domain (~4000 km²) employs an unstructured mesh (minimum grid size 5 m) with 20 s time steps. Model calibration achieves strong agreement with measured tidal levels and velocities. The proposed scheme lowers the groyne crests by 0.2–2.5 m, increasing overtopping frequency during spring tides and enabling reactivation of intertidal exchange pathways. Model results reveal that groyne lowering significantly modifies the nearshore flow structure: bottom velocities increase by 0.005–0.050m/s, residual circulation strengthens between groynes, and previously stagnant zones behind the structures become reconnected. Morphodynamic responses over a spring–neap cycle indicate 0.2–0.4 m reduction in sedimentation near groyne heads, accompanied by mild accretion on the inner tidal flat, leading to a smoother, more gradually sloping intertidal profile. These changes reflect a shift toward a more dynamic and resilient morphodynamic state capable of better accommodating extreme water levels. This study highlights groyne lowering as an adaptive and nature-based intervention to counteract human-induced hydrodynamic restriction and climate-driven pressures. The findings contribute to improved understanding of eco-morphodynamic adjustment processes and offer guidance for sustainable coastal management in tide-dominated estuaries such as the Qiantang River delta.

How to cite: Zheng, Y., Li, X., Gong, M., and Shen, J.: Impact of groyne lowering on tidal-flat morphodynamics in a tide-dominated estuary, EGU General Assembly 2026, Vienna, Austria, 3–8 May 2026, EGU26-2410, https://doi.org/10.5194/egusphere-egu26-2410, 2026.

EGU26-2518 | ECS | Orals | OS2.3

Beyond upwelling : frequent coastal downwelling events and their benthic impact in the southern coast of Finland (Baltic Sea) 

Marine Poizat, Joonas Virtasalo, Eero Asmala, Josephin Lemke, Kristian Spilling, Joonas Wasiljeff, Karl Michael Attard, and Karoliina Koho

Upwelling and downwelling are common phenomena in the Baltic Sea, significantly altering the thermal balance and water mass properties, with consequences on biological activity and biogeochemical cycling. While upwelling has been extensively studied using remote sensing and modelling, downwelling remains comparatively poorly documented, partly due to the challenges of direct measurements. Improving understanding of downwelling events is crucial for assessing their impact on biological processes and particle dynamics. This study presents novel in-situ observations of coastal downwelling events in the southern coast of Finland using two benthic landers, complemented by ocean reanalysis dataset. 

A 41-day deployment (August–September 2024) and 70-day deployment (August-October 2025) were conducted where a benthic lander recorded flow velocity and particle concentration throughout the bottom meter of the water column, along with salinity, temperature, and oxygen and chlorophyll concentrations. Data was collected at high temporal resolution, with instruments recording every 6 hours or more frequently.  

Under typical conditions, we measured a weak downward flow and low horizontal velocities (mean 2 cm s-1), with 20µL L-1particle concentrations. Chlorophyll concentrations were low (<0.08 RFU), and oxygen concentration remained stable at approximately 190 μmol L-1. In contrast, distinct downwelling events were observed in September 2024 and September 2025, which were characterized by increased downward flow velocities and particle concentrations, accompanied by concurrent increases in temperature, chlorophyll, and oxygen in the benthic layer. These signals indicate episodic advection of surface-influenced water masses to the seafloor.  

We identified 85 downwelling events in this region since 1993 using the Baltic Sea Physical Reanalysis product from CMEMS, with an apparent increase in event duration and maximum bottom temperature over time. During 2016-2020,  46% of these events meet criteria commonly used to define marine heatwaves. Although the area is typically classified as an upwelling region, our results demonstrate that downwelling events are also frequent and may play an important role in benthic environmental variability and the influx of warmer, nutrient-rich surface water to the seafloor may enhance oxygen consumption and greenhouse gas production. These findings highlight the need to account for downwelling processes when assessing future ecosystem responses in the context of climate change, where changes in wind forcing may modify upwelling and downwelling frequency and intensity, with cascading ecological consequences.

How to cite: Poizat, M., Virtasalo, J., Asmala, E., Lemke, J., Spilling, K., Wasiljeff, J., Attard, K. M., and Koho, K.: Beyond upwelling : frequent coastal downwelling events and their benthic impact in the southern coast of Finland (Baltic Sea), EGU General Assembly 2026, Vienna, Austria, 3–8 May 2026, EGU26-2518, https://doi.org/10.5194/egusphere-egu26-2518, 2026.

Coastal wetland ecosystems (CWEs), including mangroves, saltmarshes, and seagrasses, deliver vital ecosystem services at the land-ocean interface, where microbial communities act as key agents of biogeochemical cycles by mediating energy flow and material transformation. Yet, a comprehensive understanding of their global-scale diversity, distribution, and functional attributes remains elusive. To elucidate these aspects, we analyzed 1,384 high-throughput sequencing samples to examine microbial diversity and assembly processes across these global habitats. Our results revealed significant differences in microbial diversity and function among these ecosystems (p < 0.001), with mangroves exhibiting the highest richness and diversity. The habitat-specific keystone taxa were Rhodothermia, Anaerolineaceae, and SBR1031 in mangroves, Flavobacteriaceae, Burkholderiales, and Woeseiaceae in saltmarshes, and Desulfosarcinaceae, Pseudomonadaceae, Firmicutes, and Bacillales in seagrasses through LEfSe and Random Forest model analysis. Co-occurrence network analysis revealed a robust structure comprising 1521 nodes and 64,463 edges, dominated by Gammaproteobacteria, Desulfobacteria, Bacteroidia, and Desulfobulbia. KEGG-based functional profiling showed that mangroves were distinguished by a high abundance of microbial functions related to nitrogen cycling and sulfate metabolism. Seagrasses showed a higher abundance of taxa involved in the methane metabolism and saltmarsh communities were dominated by functions related to aromatic hydrocarbon metabolism. Using iCAMP, we found that deterministic selection governed community assembly in saltmarshes (44.42%), whereas ecological drift was the major contributor in seagrass (63.1%) and mangrove (43.17%) ecosystems. This underscores the dependence of dominant assembly processes on local environmental contexts. Our findings establish a basis for elucidating the structure and function of microbial communities in CWEs, offering insights for future hypothesis-driven research and enhancing predictive capacity amid growing anthropogenic and climatic pressures.

How to cite: Wang, L. and Engel, A.: Comparative Analysis Unveils Distinct Functional Profiles and Assembly Mechanisms of Microbiomes in Global Coastal Wetland Ecosystems, EGU General Assembly 2026, Vienna, Austria, 3–8 May 2026, EGU26-2542, https://doi.org/10.5194/egusphere-egu26-2542, 2026.

EGU26-2562 | ECS | Posters on site | OS2.3

Fluvial Connectivity Impacts Carbon Biogeochemistry in a Tropical Mangrove Delta, Sundarban, India. 

Adrian Bass, Wenguang Tang, Andrew Henderson, Virginia Panizzo, James Fielding, Abhra Chanda, Souvik Shil, Tuhin Ghosh, Charlotte Slaymark, and Andrew Large

Coastal estuaries are hotspots of biogeochemical cycling, biodiversity, and sediment cycling, yet the drivers of carbon cycle processes remain poorly constrained. This study elucidates how hydrological connectivity influences carbon biogeochemistry in the Indian Sundarban over two monsoonal cycles spanning pre-monsoon, monsoon, and post-monsoon seasons. A spatially extensive sampling strategy compared channels connected to perennial freshwater flow with channels isolated from feeding rivers. Linear mixed-effects modelling showed dissolved organic carbon (DOC) and particulate organic carbon (POC) varied significantly with both season and connectivity. DOC peaked pre-monsoon and POC during the monsoon, with higher concentrations in connected sites. Dissolved inorganic carbon (DIC) declined during the monsoon but showed no connectivity effect. Elevated DOC relative to conservative mixing was attributed to freshwater runoff or groundwater input. Isotope data indicated POC respiration dominated during pre- and post-monsoon, while DOC flocculation-controlled monsoon POC dynamics, particularly in connected sites. Carbonate dissolution regulated pre-monsoon DIC in general, while organic matter degradation dominated in the monsoon and post-monsoon periods. CO₂ efflux, measured across all sites (1.7–297.6 mmol C m⁻² d⁻¹), was consistently a source to the atmosphere and 2–4 times higher in connected channels, with higher turbulence driving maximum fluxes in upper reaches. Our findings demonstrate that hydrological connectivity fundamentally structures estuarine carbon cycling, lowering organic carbon concentrations and enhancing CO₂ fluxes. Thus, shifts in global coastal delta sediment dynamics and subsequent riverine impacts, may significantly change global deltaic carbon cycle processes.  

How to cite: Bass, A., Tang, W., Henderson, A., Panizzo, V., Fielding, J., Chanda, A., Shil, S., Ghosh, T., Slaymark, C., and Large, A.: Fluvial Connectivity Impacts Carbon Biogeochemistry in a Tropical Mangrove Delta, Sundarban, India., EGU General Assembly 2026, Vienna, Austria, 3–8 May 2026, EGU26-2562, https://doi.org/10.5194/egusphere-egu26-2562, 2026.

EGU26-2665 | ECS | Posters on site | OS2.3

Water-exchange Capacity Induced by River Discharge and Bay Mouth Archipelago in a Macro-tidal Embayment 

Yuhan Yan, Haifeng Gao, and Junbao Huang

As a critical interface between terrestrial and marine environments, bays experience significant land-sea interactions, with complex hydrodynamic processes playing a role in their water-exchange capacity. This study investigates how medium-sized rivers and the archipelago near the mouth of Yueqing Bay influence its water-exchange capacity. Half-exchange time, combined with a validated three-dimensional hydrodynamic model based on the Finite Volume Community Ocean Model, was used to assess the bay's water-exchange capacity. The results show that the half-exchange time in Yueqing Bay decreases from the bay head to the mouth, ranging from up to 30 days at the head to less than 1.5 days at the mouth, with an overall average of 8–9 days. Seasonal variations in river discharge, particularly from the Oujiang River, lead to changes in water-exchange capacity, with summer rates being 13.6% higher than those in winter. Additionally, a flood event increases water-exchange capacity near the mouth by 6.5%. The surrounding islands enhance tidal energy within the bay, resulting in an 11.6% increase in water-exchange capacity. This study provides valuable insights into the roles of river discharge and nearby islands in controlling water renewal processes, thereby enhancing understanding of the key mechanisms involved.

How to cite: Yan, Y., Gao, H., and Huang, J.: Water-exchange Capacity Induced by River Discharge and Bay Mouth Archipelago in a Macro-tidal Embayment, EGU General Assembly 2026, Vienna, Austria, 3–8 May 2026, EGU26-2665, https://doi.org/10.5194/egusphere-egu26-2665, 2026.

Tidal basins such as the Wadden Sea exhibit perpetual sediment dynamics and morphodynamics at scales ranging between that of bedforms and creeks to channels and tidal flats, to that of the entire basin and its transitions to neighbouring basins and the embankment on land. The Wadden Sea is the largest tidal wetland on the planet with globally important ecosystems. Tidal flats and salt marshes increase coastal flood safety by storm wave damping. The combination of accelerating sea-level rise, historic land loss and reclamation with ongoing economic activities, including mining, dredging and other disturbances, puts future ecosystem integrity and coastal flood defence at risk. The ability to adjust management in order to adapt to changes depends on scientific and societal understanding the dynamics of sediment (sand and mud) on a timescale of years to centuries. As such, a qualitative, comprehensive description is urgently needed of sediment dynamics and morphodynamics, around which all the needs and issues revolve and that experts/scientists in governmental institutions and consulting can use to inform policymakers and area managers.

Here we synthesize the available knowledge of patterns, dynamics and interactions between various forms on the basis of bathymetric data, aerial photography, background data and literature. This holistic systems synthesis is a co-creation with societal partners in the Netherlands, who also co-designed the project (https://wadsed.nl/) by specifying their knowledge questions, perspectives on long-term development and on governance of this system. As such, their intimate knowledge of the Dutch Wadden Sea is incorporated and seeming conflicts of perceived trends (drowning vs. infilling) were reframed as research questions by the academic scientists. We will present our new insights in sediment dynamics and morphodynamics, specifically focussing on sediment dynamics during storms, channel-bar interactions and tidal ‘divides’ which are conceptually bounding the individual tidal basins but turn out to be quite open for water and mud exchange. This culminates into a description of tidal basins as multi-scale complex open systems diagrams, with explicit recognition of what processes and boundary conditions are affected, and potentially manageable, by human interference.

How to cite: Kleinhans, M., Cleveringa, J., and van der Spek, A.: Shallow tidal system morphodynamics: a synthesis of forms and behaviours in the Wadden Sea for long-term management with understanding, EGU General Assembly 2026, Vienna, Austria, 3–8 May 2026, EGU26-3104, https://doi.org/10.5194/egusphere-egu26-3104, 2026.

 Recent studies indicate that typhoons can trigger intense organic matter degradation in coastal areas. Nevertheless, as coastal currents enhance primary production, the balance between organic matter addition and degradation remains unclear, which restricts a comprehensive understanding of the carbon cycle. This study investigated the biogeochemical processes of dissolved organic matter (DOM) in the northwestern South China Sea, which is affected by the coastal current along the western Guangdong coast, before and after the passage of Typhoon Wipha (2019), through measuring DOM-related parameters and applying the three-end-member mixing model. The results demonstrated that in the nearshore, DOM exhibited a significant net addition before the typhoon. This was mainly due to the strong coastal current that facilitated the primary productivity. After the typhoon, DOM levels in coastal waters increased significantly due to greater land-based input, stronger vertical mixing, and higher primary production. However, the net addition of DOM was lower than pre-typhoon, primarily because of enhanced DOM degradation. In the offshore area, the biological activities stimulated by the strong coastal current remained the primary cause of most DOM additions before the typhoon. Nevertheless, after the typhoon, DOM showed net removal, as degradation exceeded production supported by the coastal current, with removal rates of 7% to 17%. This indicates that typhoons accelerate the degradation of DOM in coastal regions, potentially reducing marine carbon storage enhanced by coastal currents, offering insights into how the coastal carbon cycle responds to environmental changes.

How to cite: Lu, X.: Biogeochemistry of Dissolved Organic Matter in the Northwestern South China Sea under the Combined Influence of Coastal Currents and Typhoon Wipha, EGU General Assembly 2026, Vienna, Austria, 3–8 May 2026, EGU26-3989, https://doi.org/10.5194/egusphere-egu26-3989, 2026.

EGU26-4969 | ECS | Orals | OS2.3

Above- and belowground biomass production in intertidal vegetated ecosystems of Cadiz Bay (Spain): implications for resilience to sea-level rise 

Concepción Natalia Rodríguez-Rojo, Gloria Peralta, Pedro Zarandona, and Andrea Celeste Curcio

Saltmarshes and seagrass meadows are highly productive coastal ecosystems that provide essential ecosystem services, such as carbon cycle regulation, sediment stabilization, and protection against extreme events. Unfortunately, these valuable systems are increasingly threatened by the effects of climate change, particularly due to the accelerating rise in sea level. Their resilience largely depends on their capacity to sustain positive substrate accretion through particulate matter retention and biomass production, especially within belowground compartments, thereby enabling compensation for sea-level rise. However, plant production remains poorly constrained, due to methodological challenges associated with its quantification and the heterogeneous environmental conditions that characterize them.

To help bridge this knowledge gap, this study estimated annual above- and belowground biomass production in two intertidal saltmarsh areas representative of Cadiz bay (Spain): Puerto Real (PT) and Santibañez (ST). Sampling locations were selected in homogeneous vegetation patches, with 14 sites established in PT and 11 in ST to encompass existing spatial variability. Aboveground production was assessed using circular exclusion structures of 25 cm in diameter, from which the initial aboveground vegetation was removed and biomass regrowth was quantified after 12 months. Belowground production was quantified using a modified ingrowth core method, which involved inserting partially open, mesh-wrapped cylinders, filled with root-free sediment. The cores were retrieved after 12 months under natural conditions to quantify root colonization. In the case of seagrass meadows, above- and belowground production was estimated exclusively from plant crowns, considered as the functional structural unit.

Results revealed clear differences between the studied vegetation types. In seagrass meadows, annual production averaged approximately 25 gPS·m⁻²·yr⁻¹ for aboveground biomass and 42 gPS·m⁻²·yr⁻¹ for belowground biomass. In contrast, saltmarsh communities showed markedly higher values, reaching 310 gDW·m⁻²·yr⁻¹ and 475 gDW·m⁻²·yr⁻¹, respectively. These findings highlight the predominant role of belowground compartments in the production balance of both ecosystems, where roots and rhizomes directly contribute to sediment stabilization. The spatial variability observed among sampling points suggests the influence of environmental and biological factors, such as dominant species or relative elevation, whose assessment will allow for a better understanding of the mechanisms driving resilience to sea-level rise.

Overall, the combined methodological approach provides a robust and transferable framework for quantifying productivity in intertidal ecosystems and constitutes a solid basis for upscaling biomass production from local measurements to larger spatial scales. By integrating field-derived production rates with spatial information on vegetation distribution, this approach enables ecosystem-scale assessments of productivity, carbon accumulation and sediment dynamics. The dominance of belowground production underscores its fundamental role in maintaining surface elevation and enhancing resilience to sea-level rise, offering key insights to support conservation and management strategies under climate change.

How to cite: Rodríguez-Rojo, C. N., Peralta, G., Zarandona, P., and Curcio, A. C.: Above- and belowground biomass production in intertidal vegetated ecosystems of Cadiz Bay (Spain): implications for resilience to sea-level rise, EGU General Assembly 2026, Vienna, Austria, 3–8 May 2026, EGU26-4969, https://doi.org/10.5194/egusphere-egu26-4969, 2026.

EGU26-5583 | ECS | Orals | OS2.3

Exploring climate change induced geomorphological tipping points on soft-cliffed coasts 

Matthew Appleton, Riccardo Briganti, and Nicholas Dodd

Coastal systems evolve through a wide variety of physical, ecological and human processes, operating over multiple timescales. One coastal type of interest is an unmanaged, soft-cliffed coast, where hydrodynamic, erosive and avalanching processes interact to create a dynamic and often rapidly receding coast. Anthropogenic sea level rise is expected to accelerate recession and cause cliff submergence, a transition in coastal typology, impacting local communities, habitats and infrastructure. 

In this presentation, we explore the long-term (centuries and longer) geomorphological behaviour of a soft-cliffed coast forced by relative sea level rise. We describe continuous erosive processes by a generalised set of time-averaged hydrodynamic and erosion governing equations, driving smooth deformation of coastal morphology. This description is general enough to encompass many existing hydrodynamic and erosion models, meaning that results derived in this work hold for a large family of model parameters and parametrisations. 

A key physical process on soft-cliffed coasts is collapsing of the cliff face. The timescale of collapsing is shorter than the time-averaged hydrodynamic and erosion timescales and can be treated as an instantaneous process. This jump in state means that the mathematical framework of non-smooth (or hybrid) dynamical systems must be used to explore the evolution of these coasts. 

We identify two geomorphological states toward which the system converges: a repeatedly collapsing receding cliff system, approached when sea level is static, and a transgressing rocky platform without a cliff, approached for high rates of sea level rise. Our analysis focuses on the transitions between these attracting states over anthropogenic sea level rise scenarios. We find that cliff submergence can be characterised as a “tipping point” behaviour, reframing changes in coastal type as potentially irreversible impacts of anthropogenic climate change. This is an underexplored geomorphological phenomenon and may help us interpret the history of the Earth’s coastal systems, as well as explore future scenarios. The description of time-averaged hydrodynamic and erosion processes is general, strengthening the statement that the tipping point behaviour discussed is a realistic phenomenon, rather than a mechanism only seen for specific model parametrisations.  

This work also impacts the modelling of human-coastal coupled systems, since some management decisions, e.g. beach nourishments and the erection of coastal defences may be treated as instantaneous processes, and the framework of non-smooth dynamical systems is one avenue towards understanding long-term system behaviour.

How to cite: Appleton, M., Briganti, R., and Dodd, N.: Exploring climate change induced geomorphological tipping points on soft-cliffed coasts, EGU General Assembly 2026, Vienna, Austria, 3–8 May 2026, EGU26-5583, https://doi.org/10.5194/egusphere-egu26-5583, 2026.

EGU26-6003 | Posters on site | OS2.3

Mechanisms of wetland deterioration in a sinking deltaic lagoon 

Sergio Fagherazzi, Carmine Donatelli, and Cedric Fichot

Coastal wetlands are vegetated landforms that offer a multitude of ecosystem services to society. The vulnerability of these ecosystems to relative sea-level rise (RSLR) is connected to the amount of suspended sediment available in the adjacent water bodies. Sediment is transported by numerous processes onto the wetland surface, where it can contribute to vertical accretion and counteract RSLR. Here, we used maps of total suspended solids (TSS) concentration from the NASA Airborne Visible InfraRed Imaging Spectrometer Next Generation (AVIRIS-NG), numerical modeling, aerial imagery, and field observations to infer the mechanisms controlling wetland dynamics within western Terrebonne Bay, a sinking lagoon in the Mississippi River Deltaic Plain. Specifically, we aimed to understand how wetlands respond when land sinks, using western Terrebonne Bay as a test case. This study revealed that subsidence can augment suspended sediment in the water column by increasing tidal prism and triggering channel erosion. Sediment resuspension can support accretion in the remaining wetland platforms, ultimately affecting their elevation. Understanding these feedback mechanisms has direct implications for forecasting and managing the impacts of RSLR on wetlands in lagoons and river deltas.

How to cite: Fagherazzi, S., Donatelli, C., and Fichot, C.: Mechanisms of wetland deterioration in a sinking deltaic lagoon, EGU General Assembly 2026, Vienna, Austria, 3–8 May 2026, EGU26-6003, https://doi.org/10.5194/egusphere-egu26-6003, 2026.

A large proportion of the world’s population lives near the coast; as a result, extensive anthropogenic modification, including historic coastal landfills, has affected large swathes of the global coastline. The acceleration of climate change is poised to increase erosion and inundation that already disturb these sites and mobilise stored solid waste into the marine environment. Before 1974, UK landfill operators had no legal requirement to keep records, and thus the composition and condition of the solid waste at risk of release is unknown. Field sampling campaigns of historic coastal landfills in the United Kingdom have identified hazardous heavy metals, asbestos and plastics, alongside inert geomaterials such as rubble, glass and ceramics being released into the marine environment

A gap remains in our understanding of this hazard, as it is unclear how geomorphological and hydrodynamic processes affect the spatial pattern of solid waste. This creates a need to map, classify and quantify the release of solid waste and its subsequent environmental impact. Three landfills in England have been selected for a mapping and monitoring campaign: East Tilbury, Essex; Shoebury East Beach, Essex; and Spittle Lane, Dorset. These sites are located near areas of high population density or on urban estuaries with a range of industrial developments.

Through the synthesis of existing sediment and grain-size mapping techniques, geomorphic mapping approaches and concepts from citizen science litter surveys, a new framework has been developed to characterise and quantify solid waste physical characteristics. This approach has been extended, using images taken via a phone and UAV, to develop a model to automate the detection and classification of solid waste in coastal settings. These different mapping approaches have been developed through repeat field visits, which have resulted in the creation of different solid waste datasets at different spatial scales with different levels of information.

Different spatial patterns of waste are explored, identifying hotspots of waste accumulation, their geomorphic behaviour and impact, as well as the effectiveness of the automated mapping approach. The refined anthropogenic geomaterial classification scheme will be able to be applied to a wider range of sites around the UK coast, alongside the development of automated mapping approaches, which will allow stakeholders to track the release of solid waste and their impacts.

How to cite: Newman, B., Grieve, S., and Spencer, K.: Automated and manual mapping of solid waste characteristics on the foreshore of historical coastal landfill sites., EGU General Assembly 2026, Vienna, Austria, 3–8 May 2026, EGU26-8211, https://doi.org/10.5194/egusphere-egu26-8211, 2026.

EGU26-8665 | Posters on site | OS2.3

Laboratory experiments on the near-bed hydrodynamics over regular and irregular ripples. 

Chuang Jin, Zheng Gong, Jorge San Juan, Tinoco Rafael, and Giovanni Coco

Sand ripples, the smallest and most ubiquitous bedforms in coastal and seabed environments, enhance turbulence and sediment resuspension within the bottom boundary layer. Under natural wave forcing, ripples often develop three-dimensional (3D) features—such as terminations, bifurcations, and secondary crests—that reflect their complex adaptation to varying hydrodynamic conditions. To investigate the hydrodynamics over different ripple types, we conducted laboratory experiments in a U-shaped oscillatory tunnel at the Ecohydraulics and Ecomorphodynamics Laboratory, University of Illinois at Urbana-Champaign (USA). Two fixed 3D-printed ripple morphologies were studied: uniform ripples and ripples with superimposed secondary crests. Results demonstrate that the addition of secondary crests substantially modifies flow dynamics, both locally and across neighboring ripples. Compared to uniform ripples, secondary crests produce a thicker boundary layer and induce a notably higher shear velocity at the crest, indicating a greater potential for sediment transport and bedform evolution. These findings provide valuable insights into ripple morphodynamics and contribute to a better understanding of sediment processes in coastal and marine environments.

How to cite: Jin, C., Gong, Z., San Juan, J., Rafael, T., and Coco, G.: Laboratory experiments on the near-bed hydrodynamics over regular and irregular ripples., EGU General Assembly 2026, Vienna, Austria, 3–8 May 2026, EGU26-8665, https://doi.org/10.5194/egusphere-egu26-8665, 2026.

EGU26-8708 | ECS | Posters on site | OS2.3

Unraveling the Multi-Decadal Morphological Regime Shift under Synergistic Drivers of Climate and Human Activity in a Hydro-Engineered Estuary 

Dezheng Liu, Eunji Byun, Yihyun Choe, Hyeryoung Kim, and Liangwen Jia

Global river estuaries are increasingly subjected to the compounding pressures of anthropogenic sediment starvation and climate-induced intensified marine hydrodynamics. While morphological degradation is widely reported, systematic and quantitative insights into the timing and mechanisms of non-linear transitions in estuarine evolution remain limited. The Nakdong River Estuary (NRE) in South Korea, an intensively engineered estuarine system controlled by cascading upstream dams and an estuarine barrage, serves as a paradigmatic case study to deconstruct this mechanism. Drawing on a 60-year (1965-2024) archive of high-resolution bathymetric data and Geomorphological Information Entropy (GIE) analysis, this study quantitatively reveals the regime shift of this mega-estuary from a sediment sink to an erosional source.

Our results indicate that the system maintained a state of metastable equilibrium for decades (1985-2017), masking the cumulative stress of artificial regulation. However, this fragile balance shifted post-2017, initiating an estuary-wide morphological transition. In the seven years from 2017 to 2024 alone, the system recorded a net erosion volume of over 100 million m3, with the annual erosion rate increasing to four times the historical average. We attribute this shift to the synergistic drive of the “Hungry Water” effect and extreme hydro-meteorological events: chronic sediment cutoff due to upstream damming, and channelization altered the morphodynamical impact of extreme floods (e.g., in 2020), transforming them from depositional events into high-energy erosive agents that scoured the riverbed and subaqueous delta. Concurrently, the degradation of barrier islands reduced the natural shelter effect, facilitating the intrusion of wave energy into the inner estuary.

This study demonstrates that anthropogenically transformed estuaries may exhibit apparent stability for decades before undergoing a rapid state transition, suggesting that such period may represent a lag phase preceding significant morphodynamical disorder. The observed transformation of the NRE provides a critical reference for understanding the trajectory of coastal systems worldwide, indicating that rigid engineering control may reduce system resilience against climate shocks. We suggest that under current climate trends, passive conservation strategies may be insufficient; a shift towards holistic source-to-sink sediment restoration, aimed at rebalancing sediment supply with hydrodynamic energy, is essential to mitigate long-term degradation in these vital coastal interfaces.

How to cite: Liu, D., Byun, E., Choe, Y., Kim, H., and Jia, L.: Unraveling the Multi-Decadal Morphological Regime Shift under Synergistic Drivers of Climate and Human Activity in a Hydro-Engineered Estuary, EGU General Assembly 2026, Vienna, Austria, 3–8 May 2026, EGU26-8708, https://doi.org/10.5194/egusphere-egu26-8708, 2026.

EGU26-9229 | ECS | Posters on site | OS2.3

Seasonal, annual, and decadal changes in morphology and sedimentation of a channelized, open-coast macrotidal flat 

Seolhui Bang, Joohee Jo, Dohyeong Kim, Seungyeon Sohn, and Kyungsik Choi

The topography and surface sediment distribution of open-coast tidal flats exhibit distinct spatiotemporal variability, commonly linked to seasonal changes in wave intensity. However, studies that consider factors beyond waves and tides, or that address long-term variability based on extended observations, remain scarce. To investigate the processes shaping this variability, an Empirical Orthogonal Function analysis was applied to surface sediment data collected from 2014 to 2025 from the intertidal flat on southwestern Ganghwa Island, west coast of Korea.

The results indicate that sediment distribution is primarily influenced by interannual, decadal, and seasonal variability associated with wave forcing, as well as by geomorphic and biophysical changes. Interannual variability is most pronounced in the middle to upper tidal flat, where years of stronger wave conditions are characterized by relative coarsening. This pattern suggests that wave influence is modulated by tidal stage at the time of wave occurrence. Decadal variability reflects longer-term morphological change of tidal channels and the expansion of oyster reefs, producing a coarsening and fining trend, respectively. Seasonal variability exhibits clear elevation-dependent behavior: the middle tidal flat tends to coarsen in winter and fine in summer, whereas the upper tidal flat shows the opposite tendency due to biofilm development and rainfall-induced sheet flow.

Overall, these findings indicate that sedimentary processes on channelized open-coast tidal flats are governed by geomorphic complexity that enables multiple forcings, such as waves, tides, biological processes, and rainfall-driven sediment transport to operate concurrently. Consequently, surface sediment grain size distributions exhibit complex spatiotemporal variability that cannot be adequately explained by wave forcing alone, underscoring the value of integrated, long-term observations for resolving sediment dynamics in such environments. 

How to cite: Bang, S., Jo, J., Kim, D., Sohn, S., and Choi, K.: Seasonal, annual, and decadal changes in morphology and sedimentation of a channelized, open-coast macrotidal flat, EGU General Assembly 2026, Vienna, Austria, 3–8 May 2026, EGU26-9229, https://doi.org/10.5194/egusphere-egu26-9229, 2026.

EGU26-9412 | ECS | Orals | OS2.3

Satellite-Based Analysis of Shoreline Evolution along Wave-Dominated Deltas of the Catalan Coast (1984–2025): From Annual to Monthly Temporal Scales 

Benjamí Calvillo, Eva Pavo-Fernández, Raquel Peñas-Torramilans, Vicente Gracia, and Manel Grifoll

Coastal areas are dynamic environments shaped by the interplay of waves, sediment supply, and human activities, making them highly sensitive to environmental change. One of the most vulnerable coastal systems are deltas, where dam construction along river courses has significantly reduced sediment delivery to delta fronts, and coastal infrastructures have altered natural dynamics. This study investigates the multi-decadal shoreline evolution of three large wave-dominated deltas along the Catalan coast (NW Mediterranean Sea) from 1984 to 2025: Tordera, Llobregat, and Ebro.

In this study, we used the CoastSat toolkit to analyze historical Landsat 5, 7, 8, and 9 (at 15 m resolution) together with Sentinel-2 imagery (at 10 m resolution) to extract shoreline positions. This multi-sensor approach enables the detection of long-term shoreline trends while also capturing seasonal and event-driven variations.

Our work highlights differential patterns of shoreline change across the  adjacent deltas beaches. The results  reveal the timing and magnitude of seasonal erosion and accretion processes, providing insight into short-term dynamics that are not evident in annual assessments. This integrated dataset demonstrates the value of combining multi-sensor satellite data with automated shoreline extraction tools for continuous monitoring of coastal evolution. Our findings contribute to the understanding of deltaic responses to wave climate, sediment supply, and human impacts, offering a robust framework for future coastal management and risk assessment strategies in Mediterranean wave-dominated delta systems.


This work has received funding from EBRO-CLIM research project PID2024-155310OB-I00 financed by MICIU/AEI/10.13039/501100011033/FEDER, UE.

How to cite: Calvillo, B., Pavo-Fernández, E., Peñas-Torramilans, R., Gracia, V., and Grifoll, M.: Satellite-Based Analysis of Shoreline Evolution along Wave-Dominated Deltas of the Catalan Coast (1984–2025): From Annual to Monthly Temporal Scales, EGU General Assembly 2026, Vienna, Austria, 3–8 May 2026, EGU26-9412, https://doi.org/10.5194/egusphere-egu26-9412, 2026.

EGU26-9635 | ECS | Orals | OS2.3

Bottom Trawling Effects on Air–Sea CO₂ Exchange: A Modeling Study of the North Sea 

Pooja Tiwari, Lucas Porz, Ute Daewel, Feifei Liu, Jan Kossack, Kubilay Demir, Wenyan Zhang, and Corinna Schrum

Understanding the dynamic drivers of the marine carbon cycle is essential for predicting how human activities shape ocean-atmosphere CO2 fluxes in a changing climate. Bottom trawling disturbs natural carbon flows through sediment resuspension. However, the impacts of bottom trawling-induced resuspension on air-sea CO2-exchange remain uncertain due to the complexity of the underlying processes involved. To address this, we used a 3D coupled physical-biogeochemical model SCHISM-ECOSMO-CO2, including a carbonate chemistry module, to investigate the impacts of bottom trawling-induced resuspension on the North Sea's carbon cycle. We estimate the impacts for the period 2000-2005 using two model simulations: one accounting only for natural resuspension and another incorporating a parameterization for bottom trawling-induced resuspension. For the latter, we integrate detailed fishing activity data, including vessel position, size, fishing gear type, and engine power to generate daily forcings for trawling-induced resuspension. The results show that bottom trawling causes small, spatio-temporally varying changes in particulate organic carbon (POC), dissolved inorganic carbon (DIC), and air–sea CO2 fluxes, driven by the interplay of remineralization, productivity, and material transport. In the North Sea, CO2 outgassing increases in shallow, mixed regions, while deeper, stratified areas experience enhanced CO2 uptake. At the basin scale, these opposing effects balance through carbon fixation and respiration, resulting in a small net increase (~0.0013 molCm-2yr-1) in oceanic CO2 uptake. These results indicate that shifts in biological carbon pathways, rather than physical disturbance alone, dominate the ecosystem response to bottom trawling.

Keywords: Carbonate, Air-sea flux, North Sea, bottom trawling, remineralization.


How to cite: Tiwari, P., Porz, L., Daewel, U., Liu, F., Kossack, J., Demir, K., Zhang, W., and Schrum, C.: Bottom Trawling Effects on Air–Sea CO₂ Exchange: A Modeling Study of the North Sea, EGU General Assembly 2026, Vienna, Austria, 3–8 May 2026, EGU26-9635, https://doi.org/10.5194/egusphere-egu26-9635, 2026.

EGU26-11464 | ECS | Posters on site | OS2.3

Can tidal energy extraction counteract sea-level rise impacts? 

Zoe Mackay, Jon Hill, Athanasios Angeloudis, and Bryce Stewart

The impacts of tidal energy development on the environment, ranging from species to habitats to oceanographic systems, remain uncertain, and gaps persist in current research. Most studies to date have focused on the impacts relating to collision, noise, displacement, and localised hydrodynamic changes that affect sedimentation transport and benthic species composition. There have been limited studies on the impacts of tidal energy on habitats, species distributions (especially mobile, pelagic species), and the wider ecosystem. There has also been no consideration of cumulative environmental impacts of energy extraction at multiple sites, and few studies have considered the comparative impacts of climate change.

Here, we simulate the tides in the Celtic Sea using the multi-scale unstructured mesh numerical model, Thetis.  Spatially varying sea-level rise is applied to these models for the first time, using data from the AR6 IPCC assessment, to examine the impact of sea-level rise on tidal dynamics. Shared Socioeconomic Pathways (SSPs) 1.19 through to 5.85 at the 50% confidence interval for years 2050, 2100, and 2150 are used to predict sea-level rise under different scenarios. 

Results show that tidal range (m) and maximum velocity (m/s) are likely to generally increase over time and with SSP scenario. Tidal range increases are particularly high in the Severn Estuary (up to 0.5 m increase) and, to a lesser extent, in the wider Celtic Sea (up to 0.1 m). Sea level-rise is expected to add between 0.28 and 2.01% to the maximum tidal range within the Celtic Sea. This is in addition to predicted sea-level rise.  Conversely, when adding tidal energy arrays into current tidal model conditions, tidal range tends to decrease across the south of the domain area, with a small increase in tidal range between Northern Ireland and North-west Scotland, followed by a mix of small increases and decreases off the Scottish coast. Overall, the installation of tidal arrays is expected to decrease the maximum tidal range by 10%. This keeps pace with increasing relative sea-level rise, demonstrating that possible sea-level rise and tidal array installation may complement each other to offset predicted changes to tidal dynamics.

Under SSP scenarios, maximum velocity is predicted to increase between some islands off the coast of North-west Scotland, and between Morecambe Bay and the River Dee. These predicted changes may affect the efficiency of tidal energy development over time, as well as affect species distributions in localised environments where high levels of change are predicted.

Unsurprisingly, with the presence of tidal arrays, maximum speed is predicted to generally decrease across the Celtic Sea, with some small increases expected between islands off the North-west Scottish coast. When incorporating predicted sea-level rise, the level change is minimal, demonstrating that tidal arrays are more likely to have an impact on tidal velocity and that sea-level changes are unlikely to affect velocities enough to significantly reduce tidal energy efficiency.  Further work is being considered on optimising tidal array installations to suitably offset predicted relative sea-level rise and maintain energy production levels.

How to cite: Mackay, Z., Hill, J., Angeloudis, A., and Stewart, B.: Can tidal energy extraction counteract sea-level rise impacts?, EGU General Assembly 2026, Vienna, Austria, 3–8 May 2026, EGU26-11464, https://doi.org/10.5194/egusphere-egu26-11464, 2026.

Tropical coastal shelf ecosystems are shaped by strong seasonal atmospheric forcing and intense human exploitation. However, the links between physical oceanographic variability and fisheries dynamics remain poorly understood, particularly in data-limited regions. In the Philippine seas, seasonal changes in wind forcing and upper-ocean conditions influence stratification, mixing, and productivity, with potential consequences for demersal fish communities exploited by bottom trawl fisheries. This study investigates how seasonal oceanographic variability relates to patterns in catch and catch per unit effort (CPUE) of an otter trawl fishery in the Visayan Sea, central Philippines. Fisheries-dependent observations, including depth-stratified CPUE and species composition are integrated with environmental parameters derived from atmospheric reanalysis and gridded ocean datasets. Seasonal atmospheric forcing is characterized using surface wind fields, while ocean surface and upper-layer conditions are described using sea surface temperature (SST), temperature anomalies, and productivity proxies. To match the temporal resolution of the fisheries data, analyses focus on contrasts between the wet and dry seasons. Seasonal differences in catch patterns and community composition are examined in relation to environmental variability. Life-history traits are used as an interpretative framework to explore whether seasonal environmental regimes and trawling pressure may differentially affect species with contrasting growth and reproductive strategies. By combining atmospheric forcing, shelf-scale oceanographic processes, and fisheries obervations, this study highlights the role of physical-biological coupling in mediating the impacts of climate variability and human activities on demersal fisheries. The findings aim to contribute to a process-based understanding of coastal fisheries dynamics in tropical shelf systems and demonstrate the value of interdisciplinary approaches for studying coupled ocean-human systems.

How to cite: Morales, C. J., Cruz, R., and Babaran, R.: Seasonal atmospheric forcing and shelf-scale oceanographic variability shapes demersal trawl fisheries in the Visayan Sea, Philippines, EGU General Assembly 2026, Vienna, Austria, 3–8 May 2026, EGU26-12131, https://doi.org/10.5194/egusphere-egu26-12131, 2026.

EGU26-12582 | Posters on site | OS2.3

Short-term impact of offshore wind farms on the regional ocean turbulence and stratification in the North Sea and Danish coastal waters 

Sonaljit Mukherjee, Jens Murawski, Jun She, and Vilnis Frisfelds

Sustainable multi-use offshore infrastructure has been installed in the North Sea and Baltic Sea coastal regions as part of the OLAMUR initiative. Large offshore wind farm aggregations are being combined with low-trophic aquaculture to enhance fish and shellfish production. A key requirement of this initiative is to assess the impact of these wind farms on local wind and waves, ocean currents and turbulence, and the variability of nutrient and carbon uptake. In this work, we use a hydrostatic HIROMB-BOOS Model (HBM) setup to investigate the short-term (20 days) impact of Danish and North Sea wind farms on the regional ocean turbulence and stratification. While previous modeling studies have used unstructured grids to resolve monopile geometry, our approach employs a structured, submesoscale-resolving grid, and the turbine impact is being represented through a subgrid frictional drag increment to the prognostic equations of the k-omega turbulence closure model used in the HBM. We conduct short-duration simulations, both with and without wind farm forcing, for the summer and winter seasons. This enables an assessment of seasonality and the spatial reach of wind-farm-induced anomalies over a 20-day window. Our analysis focuses on four regions: Helgoland, the Southern North Sea, Kriegers Flak, and Anholt. We examine changes in the vertical structure using potential energy anomaly (PEA) and compare them with kinetic energy differences in both resolved and subgrid space. The tidally active Southern North Sea exhibits a strong increase in stratification during summer, with PEA anomalies ranging between 4% and 6% over multi-day periods, whereas Helgoland shows a smaller response (on the order of 1%). In contrast, the Danish coastal regions (Kriegers Flak and Anholt) display PEA values one to two orders of magnitude smaller (0.2 %) and more intermittent behavior, consistent with weaker tidal signals and stronger eddy-induced turbulence. We interpret the North Sea response as wind farm drag extracting energy from a tidally dominant regime, thereby reducing shear-driven flow and allowing stratification to persist. Far-field regions in the Skagerrak and Kattegat channels show strong anomalies at later stages in the simulation, which is attributed primarily to the background submesoscale turbulence caused by cross-flow exchange between North Sea and Baltic Sea waters.

How to cite: Mukherjee, S., Murawski, J., She, J., and Frisfelds, V.: Short-term impact of offshore wind farms on the regional ocean turbulence and stratification in the North Sea and Danish coastal waters, EGU General Assembly 2026, Vienna, Austria, 3–8 May 2026, EGU26-12582, https://doi.org/10.5194/egusphere-egu26-12582, 2026.

EGU26-13027 | Posters on site | OS2.3

Response of saltmarsh recreation by managed realignment to climate and coastal community drivers 

Laurent Amoudry, Marta Payo Payo, Marta Meschini, Elina Apine, Amani Becker, Angus Garbutt, Jenny Brown, Richard Dunning, Claire Evans, Anil Graves, Simon Jude, Constantinos Matsoukis, Andy Plater, Leonie Robinson, and Indunee Welivita

Managed realignment is an effective solution in coastal management. This typically involves breaching existing coastal defences, allowing flooding of previously protected land and creation of intertidal habitat, and relocation of the line of actively maintained defences inland. In the UK, creation of intertidal habitat by managed realignment is recommended by strategic plans, yet the uptake of schemes is not keeping pace to meet self-selected targets. The underlying reasons for this slow uptake are complex, span multiple interacting disciplines and are not fully understood. A critical aspect relates to the long-term sustainability and success of the scheme. We explore here how the response of managed realignment to climate drivers leading to intended and unintended consequences intersect with community perceptions.

We focus on a case study in the UK (Hesketh Out Marsh in the Ribble Estuary) where we integrate community co-production with quantitative modelling and long-term environmental datasets. We bring together outcomes from co-creating a shared understanding of the managed realignment system with stakeholders and the local community, with results from downscaled hydrodynamic modelling of the Ribble estuary under present and future sea level, and with LiDAR and Sediment Erosion Table datasets for Hesketh Out Marsh.

Our results show that the managed realignment have both positive and negative influences on the overall social-ecological system. Hydrodynamic modelling results show significant spatial variability in the effect of the managed realignment scheme, which is amplified by sea level rise. In some areas, managed realignment is beneficial but in others it is not. The newly created saltmarsh is slowly accreting, which is beneficial against sea level rise and its long-term viability, but impairs drainage of its terrestrial hinterland. Workshops with local stakeholders revealed entrenched and conflictual perceptions of the process, goals, and effectiveness of the managed realignment scheme. Altogether, this demonstrates the complexity inherent to managed realignment social-ecological systems. Transdisciplinary approaches are critical to better incorporate this complexity into management approaches by enabling to bring together multiple voices and knowledges and to co-create a clearer, more complete shared understanding of the system.

How to cite: Amoudry, L., Payo Payo, M., Meschini, M., Apine, E., Becker, A., Garbutt, A., Brown, J., Dunning, R., Evans, C., Graves, A., Jude, S., Matsoukis, C., Plater, A., Robinson, L., and Welivita, I.: Response of saltmarsh recreation by managed realignment to climate and coastal community drivers, EGU General Assembly 2026, Vienna, Austria, 3–8 May 2026, EGU26-13027, https://doi.org/10.5194/egusphere-egu26-13027, 2026.

EGU26-13332 | ECS | Posters on site | OS2.3

Simulate the Beach: The Influence of Rock Properties and Mineral Composition on Ocean Alkalinity 

Greta Flinspach, Tim Hierlemann, Jonas Leonhardt, Ivo Neumann, Solveigh Marie Quoß, Lara Spano, and Caroline Suchau

The ocean plays an important role in regulating CO2 in the earth system by buffering it as bicarbonate. However, this mechanism is unable to keep up with the rapid increase in atmospheric CO2 concentrations. One proposed approach to mitigating this issue is to enhance the ocean’s alkalinity. This is induced by enhanced weathering of alkaline rock feedstock. Many strategies of atmospheric CO2 removal are now being researched. However, the role of enhanced weathering in the beach-ocean interface has received comparably little attention. Our focus on coastal processes is based on their greater potential feasibility and the interaction between weathered rock, seawater, and the atmosphere. This study aims to simulate ocean alkalinity enhancement in a beach setting on a laboratory scale. This will be achieved using a custom-built overhead shaker to induce constant motion in a mixture of seawater and rock material. Via frequent monitoring and measurement of key components, such as ionic composition, the effect of rock weathering on sea water alkalinity is assessed. If expectations are met, mineralogical composition as well as grain size will influence the alkalinity enhancement potential. To quantify this, samples of basalt, andesite and glacial sediments will be compared at two grain sizes. The expectation is to see a larger alkalinity enhancement for smaller grain sizes due to larger surface area, and for basalt due to faster weathering rate. This study will evaluate the proposed option to reduce a future peak in atmospheric CO2 concentration and aims to increase the understanding of beach-ocean interfaces.

How to cite: Flinspach, G., Hierlemann, T., Leonhardt, J., Neumann, I., Quoß, S. M., Spano, L., and Suchau, C.: Simulate the Beach: The Influence of Rock Properties and Mineral Composition on Ocean Alkalinity, EGU General Assembly 2026, Vienna, Austria, 3–8 May 2026, EGU26-13332, https://doi.org/10.5194/egusphere-egu26-13332, 2026.

EGU26-13439 | Posters on site | OS2.3

Storm-Driven Coastal Erosion and Shoreline Dynamics along the Southern Baltic Sea Coast: A LiDAR and Wave Hindcast Study 

Paweł Terefenko, Andrzej Giza, Jakub Śledziowski, Kamran Tanwari, Natalia Bugajny, Amelia Sicińska, and Krzysztof Wróblewski

Coastal erosion along the southern Baltic Sea was analysed using airborne LiDAR surveys from 2011, 2012 and 2022 combined with a 12-year wave hindcast based on SWAN/ECMWF reanalysis and data provided by the Finnish Meteorological Institute (FMI). A coastal strip approximately 200 km wide, including cliffs or dunes, beaches and the shallow nearshore zone, was investigated to quantify volumetric changes and their relationship to storm-wave conditions.

Storm events were identified using two thresholds: significant wave height Hs ≥ 2 m and Hs ≥ 4 m with a minimum duration of 12 hours. Three offshore points located along the Polish coast were analysed to assess spatial variability in storm frequency, wave height and wave direction. The results indicate strong contrasts in storm exposure, with the central–eastern sector being the most affected and the western sector strongly sheltered.

LiDAR-based differencing revealed a pronounced west–east erosion gradient. Cliffed sectors exhibit deep but spatially limited erosion (class 1, >10 m A.S.L.), whereas low-lying barrier and deltaic coasts are dominated by widespread abrasion in the 1-5 m A.S.L. The total abrasion volume between 2011 and 2022 reached  - 16.6 million m³.

To capture spatial variability, shoreline change rates were computed on a regular 1-km grid along the entire coastline, revealing alternating erosion and accumulation cells strongly controlled by coastal morphology and storm-wave exposure. In addition, erosion volumes were aggregated at the municipal level to estimate potential economic impacts related to the loss of land, tourist infrastructure, coastal protection assets and ecosystem services. The highest potential economic losses were identified in municipalities with cliffed coasts and densely developed tourist zones, whereas lower impacts characterize sparsely developed, low-lying barrier coasts.

The results demonstrate that storm-wave climate, coastal morphology and local socio-economic conditions jointly control the magnitude and spatial distribution of coastal erosion risk along the southern Baltic Sea.

How to cite: Terefenko, P., Giza, A., Śledziowski, J., Tanwari, K., Bugajny, N., Sicińska, A., and Wróblewski, K.: Storm-Driven Coastal Erosion and Shoreline Dynamics along the Southern Baltic Sea Coast: A LiDAR and Wave Hindcast Study, EGU General Assembly 2026, Vienna, Austria, 3–8 May 2026, EGU26-13439, https://doi.org/10.5194/egusphere-egu26-13439, 2026.

EGU26-13719 | Orals | OS2.3

Conceptual interactions through Canals between Aquaculture Ponds and a tropical lagoon 

Wei-Jen Huang, Fei-Ling Yuan, Veran Weerathunga, Kai-Jung Kao, Chia-Yu Lai, Ting-Hsuan Lin, and Jain-Jhih Chen

Lagoons and ponds are highly productive coastal regions with high economic value and are usually treated as independent systems in scientific studies. However, their tidal connections are often neglected. This study focuses on Chiku Lagoon (Tainan, Taiwan), a shallow, tidally driven tropical lagoon, and the surrounding aquaculture ponds, which cover approximately 36% (~39 km2) of the local land area. Here, we treat the ponds and the lagoon as a single watershed system. Tidal forcing drives water into the lagoon and its connecting aquaculture ponds, facilitating water exchange within the ponds and exporting nutrient-rich and CO2-rich waters back to the lagoon. Diel variations in temperature and biological activities are observed in both the ponds and the lagoon, while the canals and the lagoon are further influenced by tidal modulation. We propose a box-model framework to examine the complex interactions between these components under at least two scenarios: positive feedback interactions and offset interactions. We further discuss how treating ponds and lagoons as a connected system alters the interpretation of their physical and biogeochemical interactions.

How to cite: Huang, W.-J., Yuan, F.-L., Weerathunga, V., Kao, K.-J., Lai, C.-Y., Lin, T.-H., and Chen, J.-J.: Conceptual interactions through Canals between Aquaculture Ponds and a tropical lagoon, EGU General Assembly 2026, Vienna, Austria, 3–8 May 2026, EGU26-13719, https://doi.org/10.5194/egusphere-egu26-13719, 2026.

EGU26-14010 | ECS | Posters on site | OS2.3

High-frequency monitoring of ferry-induced sediment resuspension in coastal zones 

Viktoriia Pastukhova, Markus Johansson, Carlos Gonzales Inca, Eila Hietaharju, and Saija Saarni

Among various human activities in densely populated coastal areas, intense ferry traffic plays an essential role in coastal processes. Several studies of fast ferry traffic have shown that wake-induced mechanical sediment disturbance harms coastal environments in several ways. These include suppression of coastal vegetation, promotion of eutrophication through nutrient resuspension, sediment erosion, and enhanced coastal methane emissions. According to a recently published review on marine biodiversity loss, physical disturbance of the seabed is among the most common causes of biodiversity loss in Finnish coastal waters.

In our research, we aim to assess the rate of physical sediment disturbance caused by frequent ferry traffic near the Turku–Stockholm ferry lane in the Archipelago Sea, Finland. To capture evidence of nearshore disturbance, we use a prototype of an innovative online sediment trap. The online sediment trap is a prominent Finnish invention equipped with a computed tomography function. It performs tomographic scans of the trap tube interior, producing volumetric images of structures within it. This feature enables direct quantification of sediment flux induced by a single ferry passage, with measurements performed at an hourly timescale. These high-resolution monitoring data, combined with ferry passage data from the marine Automatic Identification System (AIS) and meteorological data, are analysed using statistical methods to uncover hidden patterns and drivers. The insights from our research are then interpreted in the context of sedimentological processes in the coastal environment to support sustainable maritime management and the protection of the fragile shallow and coastal environments of the Archipelago Sea.

How to cite: Pastukhova, V., Johansson, M., Gonzales Inca, C., Hietaharju, E., and Saarni, S.: High-frequency monitoring of ferry-induced sediment resuspension in coastal zones, EGU General Assembly 2026, Vienna, Austria, 3–8 May 2026, EGU26-14010, https://doi.org/10.5194/egusphere-egu26-14010, 2026.

EGU26-15212 | Orals | OS2.3

Subsurface flow-driven hydrology of semi-arid coastal lagoons 

Megan Williams, Lino Yovan, Rodolfo Gómez, Sarah Leray, and Sebastián Vicuña

Coastal water bodies—lagoons, estuaries, and associated wetlands are dependent on and thus vulnerable to changes in both ocean and watershed dynamics. In semi-arid and Mediterranean climates, estuaries and coastal lagoons persist despite ephemeral riverine discharge (on seasonal or interannual timescales) and intermittent connection via tidal inlets to the ocean. The persistence of coastal surface water bodies in the absence of riverine or tidal inflow suggests subsurface flow as the main driver of coastal hydrology in these systems.

This work explores the coastal water bodies of three watersheds in Central Chile. The Huaquén watershed is a 151 km² coastal basin with an ephemeral river but perennial coastal wetland and lagoon. Except for immediately after large storms, the lagoon does not have a tidal connection to the ocean.  The much larger Petorca (1989 km²) and La Ligua (1979 km²) watersheds drain into the Pacific Ocean through a shared estuary. The confluence of the two rivers is located 1 km upstream from the intermittently open inlet. These watersheds with origin in the Andean foothills, despite their large size, have very low riverine discharge due to climate, drought, and water-intensive agricultural development.

Here we present results spanning two years of in-situ measurements of water level in the Pichicuy lagoon at the outlet of the Huaquén watershed, and the Ligua–Petorca estuary and nearby groundwater wells, combined with satellite remote sensing of surface water bodies using 10m resolution Sentinel-2 data and longer-term monitoring of groundwater and surface water by the Chilean water agency.

Results highlight the dominance of groundwater exchange in the dynamics of coastal lagoons without an open tidal inlet. Measurements in the small Pichicuy lagoon show hydrology dominated by ocean-driven exchange via flow through the sandbar. This flow depends on the hydraulic gradient driven by wave setup and modulated by the tide, which is attenuated through the sandbar. In the much larger Ligua-Petorca watershed, little ocean influence is observed within the closed lagoon, but the surface area and water levels are shown to vary seasonally with watershed groundwater level fluctuations and on longer timescales with groundwater depletion by drought and water over-exploitation. This work highlights the importance in considering subsurface exchange flows between the ocean, coastal estuaries and lagoons, and the watershed, especially as climate change alters conditions in both the coastal ocean and in semi-arid and Mediterranean watersheds worldwide.

How to cite: Williams, M., Yovan, L., Gómez, R., Leray, S., and Vicuña, S.: Subsurface flow-driven hydrology of semi-arid coastal lagoons, EGU General Assembly 2026, Vienna, Austria, 3–8 May 2026, EGU26-15212, https://doi.org/10.5194/egusphere-egu26-15212, 2026.

EGU26-16377 | Orals | OS2.3

Morphodynamic evolution of depth-dependent sand mining pits and implications for sustainable sand mining 

Guan-hong Lee, Raheem Abdul-Kareem, Jongwi Chang, Courtney Harris, and Joonho Lee

The demand for marine aggregates, particularly sand, is rapidly increasing due to population growth and the need for climate change adaptation. While sand extraction supports many essential industries, it also generates substantial environmental impacts, including habitat degradation and coastal erosion, underscoring the need for effective regulatory frameworks. Previous studies suggest that nearshore sand mining can contribute to coastal erosion; however, the impacts of sand mining pits at different water depths remain poorly quantified and are often addressed only qualitatively.

This study investigates the influence of water depth on sand pit morphodynamics and the long-term evolution of mining pits. Bathymetric datasets acquired between 2017 and 2024 from the Korea Hydrographic and Oceanographic Agency (KHOA) were analyzed for multiple sand mining pits located within the 25–65 m isobaths. Results show that pit recovery rates varied following three years of intensive mining. Linear regression between water depth and mean depth change revealed a weak but consistent negative relationship (R² = 0.40), indicating reduced sediment deposition with increasing depth, likely due to decreasing bed shear stress and sediment mobility.

These findings suggest that sand mining at greater depths may reduce morphological impacts on surrounding seabed areas, highlighting water depth as a critical factor in site selection and pit design. Because wave-induced bed shear stress is stronger in shallower waters, this study provides quantitative evidence to support depth-based guidelines for sustainable sand mining and informs future policy development.

How to cite: Lee, G., Abdul-Kareem, R., Chang, J., Harris, C., and Lee, J.: Morphodynamic evolution of depth-dependent sand mining pits and implications for sustainable sand mining, EGU General Assembly 2026, Vienna, Austria, 3–8 May 2026, EGU26-16377, https://doi.org/10.5194/egusphere-egu26-16377, 2026.

EGU26-17412 | ECS | Orals | OS2.3

Experimental evidence of how extreme air temperatures influence microphytobenthos up and down migration 

Augustin Debly, Marika Mecca, Simon Oiry, Julien Deloffre, Sokratis Papaspyrou, Emilio Garcia-Robledo, Laurent Barillé, and Vona Méléder

Microphytobenthos (MPB) are microalgae that form biofilms on sediment surfaces and play a key role in coastal ecosystems by supporting food webs, regulating carbon (CO2) fluxes, and stabilizing mudflats.

Some species are known to migrate vertically within the sediment as a protective strategy. During daytime low tides, MPB migrates to the surface to perform photosynthesis (S), whereas during other periods, MPB moves deeper (“buried” state, B) for nutrients and protection from grazers. The transitional state of the biofilm between B and S depends on the migration speed, which is estimated to range between 0.11 and 0.45 µm.s-1 [1]. When in B, the biofilm cannot be detected through optical remote sensing methods, and has a reduced photosynthetic rate.

It is known that extreme air temperature events will become more frequent in the coming years due to climate change. The aim of this study is to demonstrate, under controlled conditions, that an extreme air temperature event affects the up and down migration of the biofilm, and therefore the services it provides and its detectability.

Sediment containing biofilm was collected from the Loire estuary in France during two different seasons (in fall and spring), homogenized, and placed in two experimental intertidal chambers for one week, with tide, light, and temperature controlled. A one-day acclimation period simulating field conditions was applied in both chambers, after which two scenarios were implemented. One chamber served as a control, with air temperature following a sinusoidal pattern between the mean daily minimum and mean daily maximum temperatures for the 2000–2024 period, whereas a sudden extreme air temperature event was applied in the other chamber. The experiment was repeated three times for each season, using extreme air temperature events corresponding to (1) the maximum air temperature observed from hourly data, at the site, for the season, for the 2000–2024 period (29.2°C for October and 37.5°C for June), (2) the maximum observed air temperature plus a delta corresponding to an RCP4.5 scenario at long-term horizon (29.2+2.25°C for October and 37.5+1.96°C for June), and (3) the maximum observed air temperature plus a delta corresponding to an RCP8.5 scenario at long-term horizon (29.2+3.82°C for October and 37.5+3.46°C for June). Biofilm concentration in state S was measured every 30 seconds, using a non-destructive hyperspectral reflectance method. The normalized difference vegetation index (NDVI) was used as a proxy for biomass.

An increase in NDVI was assumed to indicate upward migration, while a decrease in NDVI indicated downward migration. The data were interpolated allowing comparison between the control and the treatment. For each day, the mean signed difference (MSD) between control and treatment was calculated. A positive MSD indicated stimulation of the biofilm by the treatment, while a negative MSD indicated inhibition. The initial hypothesis was that the treatment would stimulate the biofilm at the beginning of the event, followed by a progressive inhibition over the week. Results are discussed to confirm, or not, the hypothesis.

[1] Serôdio et al. (2023). Light niche construction: Motility of sediment-inhabiting diatoms determines the experienced light environment.

How to cite: Debly, A., Mecca, M., Oiry, S., Deloffre, J., Papaspyrou, S., Garcia-Robledo, E., Barillé, L., and Méléder, V.: Experimental evidence of how extreme air temperatures influence microphytobenthos up and down migration, EGU General Assembly 2026, Vienna, Austria, 3–8 May 2026, EGU26-17412, https://doi.org/10.5194/egusphere-egu26-17412, 2026.

EGU26-17642 | Posters on site | OS2.3

21st Century Upwelling and Air-Sea CO2 Flux Trends in the EBUS in CMIP6 MPI-ESM Realisations 

Nele Tim, Eduardo Zorita, Birgit Hünicke, and Moritz Mathis

The Eastern Boundary Upwelling Systems (EBUS) in the subtropical Atlantic and Pacific Oceans are regions where wind-induced coastal upwelling results in cold, nutrient-rich surface waters, leading to high productivity. Changes in these regions are of significant interest due to their importance to fisheries, economies, biological productivity, diversity, and the CO2 cycle. Here, we examine future trends in upwelling and surface CO2 fluxes across the four EBUS, simulated with different versions of the Earth System model MPI-ESM driven by different carbon emissions scenarios. Our objectives are to test the hypothesis of a more substantial intensification of upwelling in the EBUS regions located polewards and to investigate the impact of upwelling changes on CO2 surface fluxes.
Using several realisations and high and low-resolution simulations enables us to analyse the internal climate variability and the effect of horizontal resolution on upwelling trends. Our study shows that upwelling does not intensify in the poleward subregions of all four EBUS but instead decreases in all the equatorward subregions. In these simulations, upwelling intensifies in the poleward subregions of the Humboldt and Canary upwelling systems, whereas it decreases in all subregions of the Benguela and California upwelling systems. The model resolution is not relevant for the directions of simulated change in upwelling. The poleward expansion of the Hadley Cell and, thus, the poleward displacement of the subtropical highs drive the change. This high-pressure cell moves offshore in the South Atlantic, which might lead to the negative trends in South Benguela. However, the realism of this westward shift might be questionable, as Earth System models struggle to simulate the South Atlantic high at its observed position. The decrease‚ in California upwelling may be due to the offshore shift of the subtropical high over the North Pacific or the summertime contraction of the Hadley Cell over the North Pacific.
The CO2 flux from the atmosphere into the ocean shows a general increase in the oceanic CO2 sink under the high-emission scenario, but a decrease under the low-emission scenario. These changes are not consistent with trends in upwelling but rather with atmospheric CO2 concentrations. An exception is the North Canary subregion, which remains a CO2 source in all scenarios, even though upwelling intensifies there.

How to cite: Tim, N., Zorita, E., Hünicke, B., and Mathis, M.: 21st Century Upwelling and Air-Sea CO2 Flux Trends in the EBUS in CMIP6 MPI-ESM Realisations, EGU General Assembly 2026, Vienna, Austria, 3–8 May 2026, EGU26-17642, https://doi.org/10.5194/egusphere-egu26-17642, 2026.

EGU26-17682 | ECS | Posters on site | OS2.3

Salt intrusion in the Mekong Delta and a systems perspective for climate adaptation in deltas worldwide 

Sepehr Eslami Arab, Gualbert Oude Essink, Robert J. Nicholls, and Vrinda Sharma

Deltas worldwide suffer from very similar hazards such as elevation loss, fluvial sediment decline, river bed, bank and coastal erosion, flooding or drought, salt intrusion, biodiversity decline, hydrological regime shifts, leading in return to various socio-economic impacts. Yet, they are extremely complex and fundamental to the livelihood of more than half a billion people. They also often host mega-cities, thanks to their access to open seas and fertile soil for food production. Mekong Delta is not an exception. Specifically, in the past two decades it has been largely impacted by increased trends of salt intrusion. When studying salt intrusion in the Mekong Delta, we could identify a very wide range of drivers from all the way upstream in the basin to the coastal seas. Some of them are driven by climate change, and some by human intervention. Looking at the past trends and future projection when combining all the drivers of change, we see that anthropogenic drivers dominate those dynamics in the first half of the century while in the second half of the century perhaps climate change becomes the dominant driver of change. 

The Mekong Delta is exemplar of the challenges many deltas face today worldwide. But, when studying them collectively, we can identify common drivers of biophysical change across a range of spatial and temporal scales. When mapping these drivers at various scales and linking them to their direct and indirect biophysical and societal impacts we can develop a more clear systems understanding as a very important step in the adaptation planning. Furthermore, this framework can help facilitating dialogue among various stakeholders, and simplify a more critical thinking for policy makers, public and technical sectors. This system understanding of a delta from its source to its sink, is a critical first step in effective and sustainable adaptation planning, while it often gets less resources associated than it deserves.

How to cite: Eslami Arab, S., Oude Essink, G., Nicholls, R. J., and Sharma, V.: Salt intrusion in the Mekong Delta and a systems perspective for climate adaptation in deltas worldwide, EGU General Assembly 2026, Vienna, Austria, 3–8 May 2026, EGU26-17682, https://doi.org/10.5194/egusphere-egu26-17682, 2026.

EGU26-19480 | Orals | OS2.3

Climate-driven changes in Venice Lagoon hydrography under global warming scenarios 

Fabio Bozzeda, Marco Sigovini, and Piero Lionello

Coastal lagoons are highly dynamic transitional systems whose hydrographic properties are strongly modulated by atmospheric forcing, freshwater inputs, and exchanges with the open sea, reflecting coupled land–sea–atmosphere processes across coastal interfaces. Accurately simulating their temperature and salinity variability remains challenging, particularly under climate change scenarios, due to the high computational cost of process-based hydrodynamic models and the limited availability of long observational time series. Here, we present a data-driven modelling framework to reproduce and project monthly surface water temperature and salinity in the Venice Lagoon, one of the most complex and vulnerable coastal systems in the Mediterranean region, using a Convolutional Neural Network (CNN). The model is trained using irregular monthly observations collected between 2001 and 2004 at three representative stations (marine, intermediate, and riverine), combined with a minimal set of physically interpretable atmospheric and oceanographic predictors, including 2 m air temperature, precipitation, mean sea level, and offshore sea surface salinity. Despite the short training period, the CNN accurately reproduces the observed seasonal and interannual variability, achieving high skill scores (R² > 0.96 for temperature and R² > 0.85 for salinity at most stations). A sensitivity analysis reveals distinct dominant drivers across the lagoon, with oceanic forcing prevailing near the inlets and atmospheric–terrestrial controls becoming increasingly important in river-influenced areas. The validated model is subsequently employed to explore synthetic climate change scenarios corresponding to 1.5, 2, and 3 °C global warming levels relative to pre-industrial conditions. Results indicate a pronounced amplification of the seasonal cycle, with summer surface water temperature increases exceeding 6 °C and salinity increases above 4 PSU at the riverine station under the 3 °C scenario. These changes suggest substantial future alterations of lagoon hydrography, with potential implications for ecosystem functioning and resilience. Overall, this study demonstrates the potential of CNN-based approaches as computationally efficient tools for climate impact assessment in complex coastal environments, complementing traditional hydrodynamic models and enabling rapid scenario exploration.

How to cite: Bozzeda, F., Sigovini, M., and Lionello, P.: Climate-driven changes in Venice Lagoon hydrography under global warming scenarios, EGU General Assembly 2026, Vienna, Austria, 3–8 May 2026, EGU26-19480, https://doi.org/10.5194/egusphere-egu26-19480, 2026.

EGU26-19678 * | ECS | Orals | OS2.3 | Highlight

Estuarine marine heatwaves in an upwelling system: coastal drivers, seasonal dynamics, and implications for ecosystem services 

Marisela Des, Adrian Castro-Olivares, Maite deCastro, and Moncho Gómez-Gesteira

Coastal zones are dynamic interfaces where land, ocean, and atmosphere interact across multiple spatial and temporal scales. These environments are increasingly exposed to climate-driven extremes that can disrupt physical processes and threaten ecosystem functioning and human activities. Among these extremes, marine heatwaves have emerged as a major stressor in coastal areas. Currently, their manifestation and drivers within estuarine systems, particularly those influenced by coastal upwelling, remain poorly understood. This study investigates the occurrence, characteristics, and drivers of estuarine marine heatwaves (EMHWs) in the Ría de Arousa (NW Iberian Peninsula), a highly productive estuary within the North Atlantic upwelling system and supporting intensive aquaculture and fisheries activities.

The analysis performed is based on high-frequency in situ water temperature observations within the estuary, combined with satellite-derived sea surface temperature, atmospheric reanalysis products, wind-based upwelling indicators spanning multiple years, and numerical modelling. EMHWs are identified using a percentile-based threshold methodology that accounts for strong seasonal variability, allowing a consistent comparison between thermal extremes within the estuary, the adjacent continental shelf, and the open ocean.

A total of 38 EMHW events are detected during the study period, exhibiting marked interannual and seasonal variability in frequency, duration, and intensity. EMHWs occur throughout the year but exhibit a marked seasonal signal, with the highest cumulative intensities recorded in autumn. October emerges as the month with the most intense events, coinciding with reduced upwelling activity, highlighting the role of coastal hydrodynamics in modulating estuarine thermal extremes. Elevated frequencies are also observed in December and February. The preferential occurrence of intense EMHWs during late autumn and winter has important ecological implications, as these periods coincide with key stages of the reproductive cycles of many species of ecological and commercial interest. Prolonged exposure to anomalously high temperatures during these sensitive phases may compromise reproductive success, population resilience, and the ecosystem services provided by estuarine systems.

Statistical analyses show that EMHW variability is primarily driven by sea surface temperature anomalies on the continental shelf and in the adjacent open ocean, explaining up to ~20 % of the observed variance. The influence of coastal upwelling on EMHW development is found to be weak. While upwelling-favourable winds can locally reduce thermal extremes, their buffering capacity appears limited under sustained oceanic warming.

In a context of climate change and given the socio-economic importance of shellfisheries in the region, numerical modelling is required to assess the future evolution and impacts of thermal extremes in estuarine systems. Downscaled regional climate projections under SSP2-4.5 and SSP5-8.5 scenarios project a substantial increase in the frequency and intensity of extreme thermal events and associated bottom water temperature anomalies. Thermal exposure analyses suggest species-specific vulnerability within the shellfishery sector, with Venerupis corrugata and Cerastoderma edule likely to experience critical thermal stress.

The results highlight growing climate risks for biodiversity, aquaculture, and fisheries, and emphasize the need to account for cross-scale coastal interactions when developing adaptation and management strategies in productive coastal zones.

How to cite: Des, M., Castro-Olivares, A., deCastro, M., and Gómez-Gesteira, M.: Estuarine marine heatwaves in an upwelling system: coastal drivers, seasonal dynamics, and implications for ecosystem services, EGU General Assembly 2026, Vienna, Austria, 3–8 May 2026, EGU26-19678, https://doi.org/10.5194/egusphere-egu26-19678, 2026.

EGU26-20030 | Posters on site | OS2.3

Forecasting pollutant mobility associated with coastal landfill sites under future climate change scenarios 

Joshua Ahmed, Haowen Wang, Louise O. V. Eldridge, Billy A. Newman, Kate L. Spencer, Stuart W. D. Grieve, and John M. MacDonald

There are >1,200 historic coastal landfill sites at risk from flooding or erosion in England. Many of these sites were created before detailed waste material logs were kept and prior to the introduction of impermeable liners, that prevent leachate and toxic gas release. Hydrological and hydrodynamic processes form critical pathways through which soluble and sediment-associated contaminants are released and dispersed in the environment, enhancing the risk they pose by increasing their distribution and biological uptake. Climate change will increase contaminant mobility and exposure as the frequency and magnitude of hydrological processes accelerates rates of host material erosion and mobility. This work contrasts contemporary contaminant profiles from three legacy coastal landfill sites in the UK and forecasts how these profiles might change under a range of future climate and intervention scenarios. The results will help decision-makers prioritise sites for protection, which is necessary given the estimated cost to defend or remove legacy landfills is projected to cost hundreds of millions to billions of euros.

How to cite: Ahmed, J., Wang, H., Eldridge, L. O. V., Newman, B. A., Spencer, K. L., Grieve, S. W. D., and MacDonald, J. M.: Forecasting pollutant mobility associated with coastal landfill sites under future climate change scenarios, EGU General Assembly 2026, Vienna, Austria, 3–8 May 2026, EGU26-20030, https://doi.org/10.5194/egusphere-egu26-20030, 2026.

EGU26-20198 | Orals | OS2.3

The fate of ice sheet-derived organic matter in an oligotrophic Greenland fjord 

Alina Mostovaya, Johnna Holding, and Maria Lund Paulsen

The Greenland Ice Sheet is melting rapidly, increasing freshwater runoff to the coastal ocean around Greenland. Through this pathway, allochthonous material, including nutrients, sediments, and organic carbon, is transported to coastal waters. The impacts of these inputs on coastal carbon cycling are poorly resolved, and accelerating climate change prompts closer examination of the character and fate of allochthonous material reaching Arctic coasts. In this study, we have taken a closer look at quantity, quality, and transformation of organic matter (OM) in surface waters of an oligotrophic high Arctic fjord influenced by glacial and proglacial runoff. We examined dissolved, suspended, and sinking OM by combining in situ observations along a river-to-sea gradient with experiments quantifying bioavailable carbon fractions, production of transparent exopolymer particles (TEPs), and OM flocculation. We found that dissolved organic carbon (DOC) concentrations in glacial and proglacial river waters were comparatively low (<30 µM), suggesting that these inputs should dilute DOC concentrations in the fjord. At the same time, riverine DOC was at least two times more bioavailable than marine DOC. Non-conservative DOC mixing along the river-to-sea gradients further indicated additional DOC supply, which we hypothesize is due to desorption from inorganic particles.

Much of the riverine particulate OM (POM) was observed to sediment out within the first few kilometers upon entering the fjord, with salt-induced flocculation and, to some extent, TEPs formation contributing to efficient aggregation and sinking. The sinking POM flux included a distinct contribution from chlorophyll-containing particles, indicating that freshwater inputs enhance downward export of phytoplankton biomass. The coexistence of this export with low but steady chlorophyll standing stocks in the water column implies concurrent primary production that persists even under turbid low-light conditions.

Overall, our results highlight the complexity of coastal carbon cycling in a changing Arctic and demonstrate that glacial river plumes act as reaction zones for rapid and multidirectional transformations of OM. By resolving interactions among freshwater inputs, particle dynamics, and multiple OM pools along river-to-sea gradients, this study advances understanding of how increasing land-ocean connectivity reshapes carbon cycling and ecosystem functioning in the coastal Arctic.

How to cite: Mostovaya, A., Holding, J., and Lund Paulsen, M.: The fate of ice sheet-derived organic matter in an oligotrophic Greenland fjord, EGU General Assembly 2026, Vienna, Austria, 3–8 May 2026, EGU26-20198, https://doi.org/10.5194/egusphere-egu26-20198, 2026.

EGU26-20593 | Orals | OS2.3

A principles-based framework to define coastal literacy 

Ana Matias, Lucas Dann, A. Rita Carrasco, Ap Van Dongeren, Gerd Masselink, Óscar Ferreira, Carlos Loureiro, and Ana Madiedo

Defining literacy is essential because it establishes a baseline for education, enables robust assessment and measurement of progress, supports policy and accountability, makes domain-specific differences explicit, and can improve equity by enabling better-designed interventions to promote learning. UNESCO notes that, beyond its conventional concept as a set of reading, writing and counting skills, literacy is now understood as a means of identification, understanding, interpretation, creation, and communication in an increasingly digital, text-mediated, information-rich and fast-changing world. Consequently, multiple domain literacies have emerged, including science, health, media, digital and financial literacy, and more recently AI literacy. While ocean literacy has gained significant traction in the last decade, for the coast an early coastal literacy framework was proposed in 2010 by CoastNet (UK charity that has since closed), but it was primarily oriented towards integrated coastal zone management. The objective of this work is thus to define coastal literacy and what it comprises.

To develop a definition tailored to coastal contexts, related literacy constructs were reviewed, particularly ocean literacy, climate literacy and risk literacy. Across frameworks, literacy is commonly articulated through dimensions (for example, knowledge, awareness and attitudes) and, in some cases, through explicit principles. The Ocean Literacy Framework is a prominent example, currently comprising seven principles and 45 concepts, and defines ocean literacy as understanding the ocean’s influence on humanity and humanity’s influence on the ocean. Although coasts form part of the broader ocean system, coastal environments have distinct characteristics: they concentrate human activities, involve frequent and direct human–environment interactions, and are often exposed to hazards. Coasts also exist at the interface of multiple Earth system spheres, linking the ocean, land and atmosphere. The framework of coastal literacy was developed building on the literature review and on a two-day focus group using structured brainstorming methodologies. The proposed framework comprises seven principles: (P1) Each coast is unique and has value on its own; (P2) Coasts consist of many different and connected parts; (P3) Coasts are dynamic, changing from seconds to millennia; (P4) Human activities impact the coast, and coasts continually affect humans; (P5) Coasts are inherently hazardous environments that can place people and infrastructure at risk; (P6) Climate change is affecting coastal ecosystems and challenging future coastal use; and (P7) We share responsibility for looking after the coasts for present and future generations. A key contribution of these principles is how they frame human–coast relationships. They recognise the intrinsic coastal value independent of human use or resource exploitation (P1), position humans as part of coastal systems (P2, P4), explicitly foreground coastal risk (P5), and treat shared responsibility as a component of literacy (P7). They also embed sustainability by emphasising the need to safeguard future generations, including in the context of climate change (P6). Further work is needed to elaborate the concepts underpinning each principle and to refine the framework through additional validation; however, the principles presented here provide a structured foundation for defining and operationalising coastal literacy.

How to cite: Matias, A., Dann, L., Carrasco, A. R., Van Dongeren, A., Masselink, G., Ferreira, Ó., Loureiro, C., and Madiedo, A.: A principles-based framework to define coastal literacy, EGU General Assembly 2026, Vienna, Austria, 3–8 May 2026, EGU26-20593, https://doi.org/10.5194/egusphere-egu26-20593, 2026.

EGU26-20697 | ECS | Posters on site | OS2.3

Socio-Economic Assessment of Co-Located Offshore Wind and Aquaculture Systems 

Matthias Daniel Berg, Johannes Pein, Joanna Staneva, and Ragnar Arnason

With the ongoing energy transition towards renewable energy and away from nuclear power, offshore wind energy has become increasingly important and now represents a central pillar of German energy policy. Consequently, a growing number of offshore wind farms are being constructed in the North Sea. This development renders large marine areas unavailable for traditional activities such as fisheries and other former economic uses, while the water column in the immediate vicinity of the monopile foundations remains largely unused by other sectors. Monopiles interact with the local hydrodynamic environment by modifying wave propagation and attenuating wave energy, yet they do not adversely affect water quality, making these areas potentially suitable for co-use applications, such as offshore aquaculture. For lower-trophic aquaculture, essential nutrients are naturally supplied by the marine environment, and the demand for mussels and macroalgae as food resources is steadily increasing. However, aquaculture production in Germany has so far been dominated by onshore and near-coastal facilities, with offshore cultivation still being limited.

In this study, the socio-economic system (SES) formed by the co-location of an offshore wind farm and aquaculture is analysed using the Ostrom–McGinnis framework. The analysis focuses on the existing offshore wind farm Meerwind, located northeast of Helgoland, which enables the assessment of OWF impacts on the SES based on historical and observational data. This framework allows for the systematic evaluation of how public benefits can be optimised, in particular by enhancing the ecosystem services and socio-economic value generated by offshore aquaculture. By varying and analysing key conditions, such as the precise spatial placement of aquaculture installations, optimal configurations of the SES can be identified. The drivers and feedbacks influencing the SES are quantified using numerical simulations. For this purpose, the hydrodynamic model SCHISM is coupled with the biogeochemical model ECOSMO to simulate environmental conditions relevant for aquaculture growth and to explicitly model mussel production. This integrated modelling approach enables the estimation of public benefits under different SES configurations, thereby providing a quantitative basis for advising industry and policymakers on sustainable co-use strategies within offshore wind farms.

How to cite: Berg, M. D., Pein, J., Staneva, J., and Arnason, R.: Socio-Economic Assessment of Co-Located Offshore Wind and Aquaculture Systems, EGU General Assembly 2026, Vienna, Austria, 3–8 May 2026, EGU26-20697, https://doi.org/10.5194/egusphere-egu26-20697, 2026.

EGU26-21554 | ECS | Posters on site | OS2.3

Enhanced Nearshore Wave Characterization Using Nonlinear Pressure Reconstruction: Applications to Wave Attenuation in Vegetated Coastal Zones 

Saeideh Baghanian, Pal Schmitt, Christian Wilson, and Adam Melor
 

Accurate nearshore wave measurements are essential for assessing coastal protection and the performance of nature-based solutions in vegetated environments. However, conventional approaches face major limitations in shallow and intertidal zones: wave buoys are ineffective where wave-seabed interactions dominate, while wave gauges require complex infrastructure and are vulnerable to damage. Although remote sensing techniques such as radar, cameras, and lidar have been explored, they remain costly and logistically demanding. Pressure sensors provide a robust and cost-effective alternative, but reconstructing surface wave elevation from bottom pressure measurements is challenging in shallow water due to pronounced nonlinear effects.

Linear pressure transfer methods systematically underestimate wave heights and fail to capture nonlinear extreme events, leading to errors in wave energy estimates and attenuation assessments. These limitations are particularly critical in vegetated coastal zones, where accurate wave characterization underpins evaluations of wave attenuation and coastal protection capacity.

This study implements and validates the nonlinear weakly dispersive pressure reconstruction method of Bonneton et al. (2018) for nearshore wave climate characterization. The method reconstructs surface elevation using first- and second-order time derivatives and frequency-domain filtering, providing improved performance under shallow-water conditions.

Pressure sensor arrays were deployed across seven coastal sites in Northern Ireland, spanning sheltered sea loughs to exposed embayments, with deployments capturing storm events with significant wave heights exceeding 0.5 m. Complementary wave tank experiments were conducted to validate hydrostatic, linear, and nonlinear reconstructions against wave gauge measurements over wave periods of 0.9-1.8 s and wave heights of 20-80 mm.

Results show that nonlinear reconstruction yields wave heights up to 56% higher than linear methods under energetic conditions and agrees within 8.4% of wave gauge measurements. Field observations indicate wave energy dissipation upto 18.5% across vegetated transects. The approach enables robust quantification of wave attenuation and supports the evaluation of coastal nature-based solutions across vegetated shorelines.

References

Bishop, C. T., & Donelan, M. A. (1987). Measuring waves with pressure transducers. Coastal Engineering, 11(4), 309–328.

Bonneton, P., Lannes, D., Martins, K., & Michallet, H. (2018). A nonlinear weakly dispersive method for recovering the elevation of irrotational surface waves from pressure measurements. Coastal Engineering, 138, 1–8.

How to cite: Baghanian, S., Schmitt, P., Wilson, C., and Melor, A.: Enhanced Nearshore Wave Characterization Using Nonlinear Pressure Reconstruction: Applications to Wave Attenuation in Vegetated Coastal Zones, EGU General Assembly 2026, Vienna, Austria, 3–8 May 2026, EGU26-21554, https://doi.org/10.5194/egusphere-egu26-21554, 2026.

Coastal landforms are continuously reshaped by natural forcings such as typhoons, waves, tides, and sea-level rise, as well as by human interventions including coastal protection structures. Rapid morphological changes can lead to shoreline erosion, retreat, and infrastructure damage, highlighting the need to quantitatively assess both the effectiveness and unintended consequences of submerged breakwaters.

This study investigates short- and long-term morphological responses at Songdo Beach (Busan, South Korea), where a semi-enclosed nearshore zone has been formed by an east–west oriented submerged breakwater system. We integrated Real Time Kinematic (RTK) drone-based surveys with in situ hydrodynamic observations. High-resolution aerial surveys were conducted on six occasions, before and after the landfall of Typhoon Khanun (7 and 10–12 August 2023) and approximately two years later (20 August and 29 September 2025), enabling assessment of event-scale changes and subsequent recovery. In addition, an Acoustic Wave and Current Profiler (AWAC) was deployed inside the breakwater system from November 2023 to August 2024 (~10 months) to continuously measure wave height, wave period, current velocity, and current direction.

The observations indicate that mean current velocities inside the breakwater system were higher than those offshore, likely due to flow acceleration through breakwater gaps and around breakwater heads. After the typhoon, sediment loss was pronounced near the lateral beach sections close to the breakwater ends, whereas the central section in the lee of the breakwater showed net deposition. This spatial heterogeneity suggests that, while the submerged breakwater attenuates wave energy, it also redistributes nearshore currents, enhancing localized erosion–deposition patterns.

By integrating hydrodynamic measurements with high-resolution remote sensing, this study provides a quantitative assessment of how submerged breakwaters influence coastal dynamics and morphological evolution. The results emphasize that coastal protection design should consider not only erosion mitigation but also the risk of secondary erosion and long-term instability. Under increasing extreme wave events and expanding coastal development, these findings support more sustainable and adaptive coastal management strategies.

How to cite: Jeon, G.-S., Ju, H. H., and Lim, H. S.: Assessing the impacts of submerged breakwaters on coastal erosion at Songdo Beach, South Korea, using hydrodynamic observations and remote sensing, EGU General Assembly 2026, Vienna, Austria, 3–8 May 2026, EGU26-22586, https://doi.org/10.5194/egusphere-egu26-22586, 2026.

EGU26-3044 | ECS | Orals | OS1.10

Impacts of ENSO and IOD on Mesoscale Eddy Activity in the Southeastern Tropical Indian Ocean 

Yifei Zhou, Xuhua Cheng, Wei Duan, Chengcheng Yang, and Jiajia Chen

Mesoscale eddies in the southeastern tropical Indian Ocean (SETIO) are crucial for regional circulation, heat transport, and ecosystem dynamics. Their interannual variability is closely associated with ENSO and IOD. Eddy activity is enhanced during pure La Niña and positive IOD years, but suppressed during pure El Niño and negative IOD years. When ENSO and IOD co-occur, their influences tend to counteract each other: the IOD dominates during the ENSO developing phase, whereas ENSO exerts a stronger influence during the decay phase. This variability is linked to changes in the Indonesian Throughflow and wind-driven upwelling associated with ENSO and IOD events. Numerical experiments further indicate that the interannual variability of SETIO eddies is primarily wind-driven, with winds over the equatorial Pacific, equatorial Indian Ocean, and SETIO all contributing significantly. Oceanic channel effects induced by equatorial Indo-Pacific winds are stronger than those arising from purely atmospheric processes.

How to cite: Zhou, Y., Cheng, X., Duan, W., Yang, C., and Chen, J.: Impacts of ENSO and IOD on Mesoscale Eddy Activity in the Southeastern Tropical Indian Ocean, EGU General Assembly 2026, Vienna, Austria, 3–8 May 2026, EGU26-3044, https://doi.org/10.5194/egusphere-egu26-3044, 2026.

EGU26-3220 | ECS | Posters on site | OS1.10

How the Vortex over the Arabian Sea Warm Pool Triggers an Early Indian Summer Monsoon 

Zhangzhe Zhao, Janet Sprintall, and Yan Du

The Indo-Pacific region is vulnerable to changes in the Indian summer monsoon and its onset. The associated monsoon rainfall strongly affects agriculture, water resources, and human security across the densely populated regions of South Asia. The Indian Ocean summer monsoon often develops in association with the southeast Arabian Sea warm pool and a monsoon onset air pressure vortex, giving rise to a complex air-sea coupled system, though their precise interactions and impacts remain unclear. In this study, our analysis covering 1992-2017 demonstrates that the vortex triggers an earlier onset due to vortex-induced rainfall when the monsoon system has not yet developed to its climatological intensity. The weaker monsoon at the onset time means the large-scale moisture transport is expected to be lower over the Indian subcontinent, and rainfall analysis confirms a drier central India, where agriculture is mostly rain-fed, at the monsoon onset time in the vortex years. These results help to understand the transition from localized synoptic activity to the large-scale monsoonal system, highlighting the crucial role of the vortex. More importantly, when a vortex is pre-observed, rainfall available for agricultural irrigation is expected to be lower, providing guidance for agricultural irrigation.

How to cite: Zhao, Z., Sprintall, J., and Du, Y.: How the Vortex over the Arabian Sea Warm Pool Triggers an Early Indian Summer Monsoon, EGU General Assembly 2026, Vienna, Austria, 3–8 May 2026, EGU26-3220, https://doi.org/10.5194/egusphere-egu26-3220, 2026.

The tropical Indian Ocean (TIO) has experienced pronounced warming trends in recent decades, with dynamical processes recognized as key drivers. However, the role of thermal processes remains uncertain due to discrepancies in surface wind-induced heat flux across existing datasets. The present study introduces a random forest machine learning algorithm that synergistically integrates the advantages of in situ observations and satellite data, yielding a monthly surface wind (MLAWind) dataset and corresponding air-sea heat flux from 1950–2022 with a horizontal resolution of 1°×1°. MLAWind exhibits high accuracy and robust generalization capability based on evaluations using both satellite and buoy observations. Besides, it is capable of effectively representing spatial and temporal characteristics of surface wind. In contrast to the majority of existing reanalysis datasets, MLAWind reveals a decline in surface wind over the TIO since 1950, which is further supported by the west-to-east asymmetrical variations in sea surface height and thermocline depth. The attenuation of surface wind is more significant in the eastern TIO as compared to the western TIO, leading to a remarkable reduction in evaporative cooling within the eastern TIO. The thermal processes associated with surface wind-induced heat flux serve as the essential drivers of the warming in the eastern TIO, with a contribution accounting for approximately 45% of that of dynamical processes. The findings of our study challenge existing reanalysis results but are aligned with state-of-the-art models, highlighting that the significance of thermal processes is substantially underestimated in most existing reanalysis datasets.

How to cite: Guo, W.: Unveiling the drivers of tropical Indian Ocean warming through machine learning-assisted surface wind, EGU General Assembly 2026, Vienna, Austria, 3–8 May 2026, EGU26-3733, https://doi.org/10.5194/egusphere-egu26-3733, 2026.

EGU26-4605 | ECS | Posters on site | OS1.10

Quantifying impacts of ENSO and internal variability on the Indian Ocean Dipole 

Lianyi Zhang, Yan Du, and Yuhong Zhang

The Indian Ocean Dipole (IOD) is an intrinsic climate mode in the Indian Ocean that typically peaks during boreal fall and influences weather and climate across surrounding regions. It is influenced by both the El Niño–Southern Oscillation (ENSO) and internal variability within the Indian Ocean. However, the relative contributions of the two ENSO types—namely, Eastern Pacific (EP) and Central Pacific (CP) ENSO—and internal variability to the IOD remain poorly quantified. Here, we employ a binary combined linear regression approach to isolate and quantify the contributions of these three factors. The results show that internal variability is the dominant driver of IOD-related sea surface temperature (SST) anomalies, explaining over 60% of the variance. ENSO accounts for approximately one-third of the variance, primarily through the CP type, whereas the EP type tends to influence the IOD mainly during extreme events. Their underlying mechanisms differ. ENSO primarily modulates the Indian Ocean wind field through the Walker circulation, whose effectiveness depends on the longitudinal position of the equatorial Pacific warming—eastern for EP events and central for CP events. In contrast, internal variability generates SST anomalies through local ocean–atmosphere feedbacks that sustain the IOD. Because El Niño tends to persist longer, co-occurring positive IOD events are more likely to evolve into basin-wide Indian Ocean warming in the following spring, a transition to which El Niño contributes more than 70%. Although internal variability shows no significant statistical association with this transition, a strong positive IOD alone still has the potential to trigger the basin-wide warming in the subsequent spring. These findings enhance our understanding of climate modes and inter-basin interactions.

How to cite: Zhang, L., Du, Y., and Zhang, Y.: Quantifying impacts of ENSO and internal variability on the Indian Ocean Dipole, EGU General Assembly 2026, Vienna, Austria, 3–8 May 2026, EGU26-4605, https://doi.org/10.5194/egusphere-egu26-4605, 2026.

EGU26-4649 | Posters on site | OS1.10

Extreme Rainfall over South China in April 2024 Associated with Early IPOC and MJO Events 

Yan Du, Lianyi Zhang, Yuhong Zhang, and Zesheng Chen

Climate conditions over East Asia are significantly affected by coupled ocean–atmosphere interaction in the tropical Indo-Pacific Ocean. In April 2024, South China suffered two rounds of extreme rainfall, occurring from 30 March to 6 April and from 19 to 30 April, resulting in the earliest flood over the Pearl River basin since 1998. This study finds that the early Indo–western Pacific Ocean capacitor (IPOC) effect and the Madden–Julian oscillation (MJO) jointly contributed to the extreme rainfall. Co-occurrence of El Niño and positive Indian Ocean dipole events in 2023–24 led to strong sea surface temperature (SST) warming in the western tropical Indian Ocean via wind forcings and oceanic waves. Such SST warming induced persistent easterly wind anomalies and maintained the anomalous anticyclonic circulation (AAC) over the western North Pacific. The IPOC effect was hence activated in April, approximately 2 months earlier than expected, inducing stronger northward water vapor transport. Moreover, two MJO events were observed in April. With the eastward propagation into the eastern Indian Ocean (phases 1–3), the MJO events facilitated the southwest flank of the AAC and enhanced the northward water vapor transport, leading to extreme rainfall along with strong convection in South China. This study emphasizes the synergistic contributions of climate modes on different time scales to extreme weather.

How to cite: Du, Y., Zhang, L., Zhang, Y., and Chen, Z.: Extreme Rainfall over South China in April 2024 Associated with Early IPOC and MJO Events, EGU General Assembly 2026, Vienna, Austria, 3–8 May 2026, EGU26-4649, https://doi.org/10.5194/egusphere-egu26-4649, 2026.

Tropical cyclones are among the most devastating natural hazards to occur in the South-West Indian Ocean basin (SWIO), posing considerable risk to vulnerable countries such as Madagascar and Mozambique. This study examines changes in tropical cyclone risk across the SWIO, the Main Tropical Cyclone Region, and the Madagascar Region over the last 45 cyclone seasons (1981–2025). Seasonal and monthly time-series of  key tropical cyclone metrics, namely frequency, maximum sustained wind (MSW), and accumulated cyclone energy (ACE) were computed and analysed for trends. The relationship these metrics have with major oceanic and atmospheric drivers, such as ocean temperature, the El Niño–Southern Oscillation (ENSO), the Indian Ocean Dipole (IOD), and the Madden–Julian Oscillation (MJO), were examined.

Results indicate a significant decrease in tropical cyclone frequency in the SWIO and the Main Tropical Cyclone Region, while frequency remained relatively stable in the Madagascar Region. In contrast, MSW increased significantly across all regions (+3.91 Knots per decade), with the strongest intensification occurring within the Madagascar Region (+4.79 Knots per decade). This suggests risk has increased over time in the SWIO despite the occurrence of fewer storms.

Ocean temperatures exhibited significant warming at both surface and subsurface levels, with depths of 35 m and 45 m indicating the greatest warming trends and the strongest relationship with increased cyclone MSW. Cyclone frequency on the other hand was negatively correlated with ocean warming, suggesting warmer waters in the SWIO may create conditions less conducive to the formation of tropical cyclones.

ENSO was found to be a considerable driver of regional cyclone variability, with La Niña conditions associated with higher frequency and stronger cyclones. The MJO was also identified as a key modulator of cyclonic activity, particularly in the Madagascar Region, where active phases 3, 4, and 5 coincided with increased cyclone frequency and MSW. The IOD on the other hand showed little to no influence on cyclone metrics in the SWIO. The incorporation of this research into forecasting and intensity models has the potential to enhance early warning systems in the SWIO, thereby providing a valuable tool for the highly vulnerable region.

(Swan and Hallam, in prep, 2026)

How to cite: Swan, L. and Hallam, S.: The Changing Tropical Cyclone Risk in the South-West Indian Ocean over the last 45 tropical cyclone seasons (1981-2025), EGU General Assembly 2026, Vienna, Austria, 3–8 May 2026, EGU26-5435, https://doi.org/10.5194/egusphere-egu26-5435, 2026.

This study investigates decadal changes in boreal summer Indian Ocean Basin Mode (IOBM) predictability (1948–2022) using the Model-based Analog Forecast (MAF) method, based on a library of 20 CMIP6 models. A pronounced decadal shift is identified, with forecast skill markedly increasing after 1980. This shift is primarily attributable to the decadal modulation of the ENSO–IOBM teleconnection. During the high-skill period, prolonged El Niño events induce significant southwestern Indian Ocean (SWIO) warming. This, in turn, activates a robust wind-evaporation-SST (WES) feedback, which maintains the basin-wide warming into summer, thereby providing an enhanced signal component for IOBM predictions. In contrast, during the low-skill period, weaker ENSO events fail to sustain this feedback, leading to premature termination of IOBM events and consequently lower forecast skill. These findings demonstrate that boreal summer IOBM predictability is nonstationary and reveal that accurately representing the ENSO–IOBM teleconnection is essential for advancing forecast skill.

How to cite: Xu, C. and Wu, Y.: Decadal change in seasonal prediction skills of the Indian Ocean Basin Mode during boreal summer, EGU General Assembly 2026, Vienna, Austria, 3–8 May 2026, EGU26-6100, https://doi.org/10.5194/egusphere-egu26-6100, 2026.

EGU26-6646 | ECS | Posters on site | OS1.10

Dipole variability of subsurface marine heatwaves in the Bay of Bengal 

Ying Zhang, Yan Du, Xinyu Lin, and Yun Qiu

Marine heatwaves (MHWs) are ocean temperature extremes that can occur at any ocean depth. Surface features and drivers of MHWs have been extensively explored based on satellite observations; however, their subsurface features and drivers remain unclear. This study investigates the characteristics and drivers of subsurface MHWs near the thermocline in the Bay of Bengal (BoB) from 1993 to 2024 using high-resolution ocean reanalysis datasets. The subsurface MHW days exhibit a dipole pattern in response to the El Niño-Southern Oscillation (ENSO) and Indian Ocean Dipole (IOD). During El Niño or positive IOD, the anticyclonic mesoscale eddies in the western BoB are favorable for MHW generation in this region, related to the anomalous anticyclonic winds and currents over the BoB. Meanwhile, the equatorial easterly anomalies drive upwelling Kelvin waves to propagate eastward into the eastern BoB, inhibiting MHW formation in that area. Thus, the subsurface MHW days in the BoB increase in the west but decrease in the east during El Niño or positive IOD events. Over the past decades, a significant increasing trend in the subsurface MHW days has been observed due to the rise in mean temperature over the BoB. This study highlights the inconsistent spatial responses of subsurface MHWs to distinct ocean dynamics induced by ENSO and IOD.

How to cite: Zhang, Y., Du, Y., Lin, X., and Qiu, Y.: Dipole variability of subsurface marine heatwaves in the Bay of Bengal, EGU General Assembly 2026, Vienna, Austria, 3–8 May 2026, EGU26-6646, https://doi.org/10.5194/egusphere-egu26-6646, 2026.

The acoustic travel time (τ) measured by an inverted echo sounder (IES) can be converted into vertical temperature profiles using the gravest empirical mode (GEM) technique based on the relationship between τ and temperature. In the Seychelles–Chagos Thermocline Ridge (SCTR) in the southwestern tropical Indian Ocean, where persistent subsurface upwelling occurs, continuous vertical temperature profiles are crucial for monitoring the upwelling variability. However, the conventional GEM method has large uncertainties at the SCTR due to temporal variability in upwelling strength. This study introduces a new approach, termed hybrid GEMs, to improve IES data analysis by reflecting upwelling strength based on the depth of the 20°C isotherm (D20). The hybrid GEMs consist of one moderate GEM and two combined GEMs derived from three groups of historical hydrographic profiles in the SCTR, categorized by D20 ranges. When applied to the in situ τ measured by a pressure-recording IES at Station K (61°E, 8°S) in the SCTR from May 2019 to December 2021, the absolute dynamic topography from satellite altimetry is used as an index to select the appropriate hybrid GEM based on the consistency between the absolute dynamic topography and D20 variability. The vertical temperature profiles based on hybrid GEMs show significant improvements in both the mean and maximum root mean square errors of the upper 300 m temperature, which are reduced by approximately 29% and 20%, respectively. The hybrid GEM–derived temperature profiles reliably capture temperature variability in the upper 300 m, demonstrating the strong potential of acoustic travel time as an essential observational variable in data-sparse tropical upwelling regions of the Indian Ocean.

How to cite: Lee, E., Na, H., and Nam, S.: A Hybrid Gravest Empirical Mode Method for Reconstructing Temperature Profiles in the Seychelles–Chagos Thermocline Ridge , EGU General Assembly 2026, Vienna, Austria, 3–8 May 2026, EGU26-6757, https://doi.org/10.5194/egusphere-egu26-6757, 2026.

EGU26-7310 | Orals | OS1.10

Reconciling Contrasting Marine and Terrestrial Responses of South Asian Summer Monsoon Reveal a Remote Control from South Africa 

Qin Wen, Zhengyu Liu, Tao Wang, Chengwei Ji, Jian Liu, Hai Cheng, Mi Yan, Liang Ning, Zhaowei Jing, Heng Liu, Jing Lei, Jiuyou Lu, Felix Creutzig, and Qiuzhen Yin

South Asian summer monsoon (SASM) delivers substantial rains to Indian subcontinent and drives upwelling in the Arabian Sea that sustains one of the world's most productive fisheries there. Both marine upwelling records and terrestrial rainfall records have been established as fundamental archives for reconstructing past SASM variability. However, the upwelling records vary in opposite direction to the terrestrial rainfall records on orbital timescale, leading to a long-standing paradox in the past monsoon variability. To understand this paradox, here we combine paleoclimate records with novel transient climate simulations that explicitly separate the effects of the Northern and Southern Hemisphere insolation forcing. Our results show that the SASM rainfall is governed by Northern Hemisphere (NH) insolation, whereas the Arabian Sea upwelling is dominated by Southern Hemisphere (SH) insolation. When boreal summer occurs at perihelion, insolation is strongly enhanced not only in the NH but also in the tropical-subtropical SH. The former enhances the SASM rainfall through Eurasian warming, while the latter weakens the Arabian Sea upwelling by inducing South African warming and subsequent atmospheric teleconnections. We reconcile the long-standing paradox, and more broadly, reveal that warming in South Africa could exert a significant and previously overlooked remote forcing on the SASM system.

How to cite: Wen, Q., Liu, Z., Wang, T., Ji, C., Liu, J., Cheng, H., Yan, M., Ning, L., Jing, Z., Liu, H., Lei, J., Lu, J., Creutzig, F., and Yin, Q.: Reconciling Contrasting Marine and Terrestrial Responses of South Asian Summer Monsoon Reveal a Remote Control from South Africa, EGU General Assembly 2026, Vienna, Austria, 3–8 May 2026, EGU26-7310, https://doi.org/10.5194/egusphere-egu26-7310, 2026.

EGU26-7753 | ECS | Posters on site | OS1.10

Iron fertilization enhanced coccolithophore growth rate in the northwestern Arabian Sea during the Last Glacial Maximum 

Xinquan Zhou, Stéphanie Duchamp-Alphonse, Xiaobo Jin, Chuanlian Liu, Xiaoying Jiang, Franck Bassinot, and Catherine Kissel

The Arabian Sea is among the most productive ocean basins globally, driven by summer coastal upwelling, winter convective mixing, and aeolian dust inputs that supply nutrients to the euphotic zone. In several aspects, this region shares characteristics with High Nutrient–Low Chlorophyll (HNLC) systems, where mineral dust deposition partially alleviates iron limitation of surface waters, that are ventilated by iron-depleted waters (e.g., the Antarctic Intermediate Waters). Paleorecords indicate that enhanced dust fluxes during the Last Glacial Maximum (LGM) coincided with increased primary productivity in the northwestern Arabian Sea, suggesting a potential role for iron fertilization, although the underlying mechanisms remain poorly constrained.

Here, we reconstruct millennial-scale variations in coccolithophore growth rates in the northwestern Arabian Sea since the LGM, based on the coccolith carbon isotope vital effect (δ13CVE) recorded in sediment core MD00-2354 (61.48°E, 21.04°N). Combined with coccolithophore cell-size estimates at the studied site, and reconstructed iron fluxes in the area, these data allow us to investigate the links between iron availability and phytoplankton growth from 22 to 4 ka.

Our results show that coccolithophore growth rates and cell sizes were significantly increased during the LGM, coincident with maxima in mineral dust and iron fluxes. This pattern suggests that nutrient availability was the primary control on coccolithophore growth at that time. This interpretation is supported by a positive correlation between coccolithophore growth rates and independently reconstructed net primary productivity at the site. A likely mechanism is that increased iron supply during the LGM enhanced phytoplankton nitrogen assimilation, as further supported by ROMS–PISCES model simulations. Comparisons between simulations with and without atmospheric iron deposition indicate that, under increased iron input, the enhancement in nitrogen utilization exceeds that of phosphorus utilization, and is concomitant to elevated primary productivity.

How to cite: Zhou, X., Duchamp-Alphonse, S., Jin, X., Liu, C., Jiang, X., Bassinot, F., and Kissel, C.: Iron fertilization enhanced coccolithophore growth rate in the northwestern Arabian Sea during the Last Glacial Maximum, EGU General Assembly 2026, Vienna, Austria, 3–8 May 2026, EGU26-7753, https://doi.org/10.5194/egusphere-egu26-7753, 2026.

It has been recognized that the low-tropospheric circulations associated with Northeast Asian and the western North Pacific monsoons are closely related to each other via atmospheric teleconnection in boreal summer. This teleconnection can be understood by the responses to the stationary Rossby wave. In addition, the climate mode including the atmospheric teleconnection has a large variability on inter-decadal as well as interannual time scales associated with adjacent climate variability. This study focuses subseasonal climate modes, which were decomposed by the self-organizing map (SOM) analysis. This study suggests that those modes are significantly increased in the last few decades, and the changes in the climate mode are related to upper ocean warming of Northern Indian Ocean due to global warming and changes in the climate variability in the Indian Ocean. This study also shows the possible reasons for the analysis results.

How to cite: Lee, H. and Kwon, M.: Inter-decadal changes in a subseasonal climate variability in the western North Pacific region with Northern Indian Ocean in boreal summer, EGU General Assembly 2026, Vienna, Austria, 3–8 May 2026, EGU26-8740, https://doi.org/10.5194/egusphere-egu26-8740, 2026.

EGU26-9018 | ECS | Orals | OS1.10

One century of intermediate water masses temperature variability of the West Indian Ocean reconstructed by Li/Mg-thermometer in scleractinian cold-water corals 

Jorit F. Kniest, Jacek Raddatz, Jan Fietzke, Norbert Frank, Tjorge Kaiser, André Freiwald, and Sascha Flögel

As a link between the surface waters and the deep ocean, intermediate water masses play a key role in transmitting atmospheric variations into the deep sea. The paleo-oceanographic reconstructions of intermediate water mass variability are therefore essential to comprehend the pace and extent with which shallow marine changes are transferred into ocean basins. Cold water corals (CWC) thriving in intermediate water depths have been identified as an adequate geochemical proxy archive to reconstructed temporal changes in water mass properties, due to the sustained growth of their carbonate skeleton and their long lifespan (several hundred years).

Two living CWC colonies of Enallopsammia rostrata (Pourtalès, 1878) have been collected in the northern part of the Mozambique Channel around the island of Mayotte, during the research cruise SO306 with the RV Sonne in August 2024. The corals were collected with a ROV from water depths between 600 to 900 meters within the transition zone of South Indian Central Water (SICW) and the underlying Red Sea Water (RSW). The chemical composition (Ca, Li, Mg) of different branches from each colony was analysed using line scan laser ablation inductively coupled mass spectrometry (LA-ICP-MS). U/Th dating enables the determination of ages and calculation of growth rates for the individual colonial parts.

The sclerochronological aligning of the geochemical data along the U/Th-based growth rates enabled a reconstruction of Li/Mgcoral variations until the end of the penultimate century. Pronounced cyclic variabilities in ranges of duration from years to decades could be identified within the Li/Mg-records, due to the spatially high-resolution LA-ICP-MS measurements. However, a significant trend in Li/Mgcoral, that would indicate a continuous change of water temperatures, could not be identified within the two colony records over the reconstructed time period. Water temperatures derived from mean Li/Mgcoral by employing Li/Mg-temperature calibration (Montagna et al. 2014) match well with observed water temperature values between of 6.6°C and 9.4°C, respectively. The reconstructed temperature variability for both colonies show variations on an average range of 3°C (2SD) over multi-year intervals, which can be attribute to a changing extent of influence of the differently temperate water masses around Mayotte.

Our reconstruction shows no long-term temperature increase in the intermediate water masses of the West Indian Ocean during the last century contrary to the anthropogenic warming of the atmosphere and surface ocean. The found temperature variability, however, points to a dynamic and periodic shifting of the different water masses, which suggests a more lateral exchange within intermediate water depths in the northern entry area of the Mozambique Channel.


  • Montagna, M. McCulloch, E. Douville, M. L. Correa, J. Trotter, R. Rodolfo-Metalpa, D. Dissard, C. Ferrier-Pagès, N. Frank, A. Freiwald, S. Goldstein, C. Mazzoli, S. Reynaud, A. Rüggeberg, S. Russo, M. Taviani (2014): Li/Mg systematics in scleractinian corals: Calibration of the thermometer. Geochim. Cosmochim. Acta 132, 288–310

How to cite: Kniest, J. F., Raddatz, J., Fietzke, J., Frank, N., Kaiser, T., Freiwald, A., and Flögel, S.: One century of intermediate water masses temperature variability of the West Indian Ocean reconstructed by Li/Mg-thermometer in scleractinian cold-water corals, EGU General Assembly 2026, Vienna, Austria, 3–8 May 2026, EGU26-9018, https://doi.org/10.5194/egusphere-egu26-9018, 2026.

The Last Glacial Maximum (LGM) and the subsequent deglacial period likely featured climate-ocean dynamics and deep-ocean carbon storage states that contrasted with those of today. In this study, we focus on the Indian Ocean and place regional reconstructions in a global context by integrating published results from other ocean basins. Differences in deep-ocean carbon storage between basins across the LGM and deglaciation reflect changes in (1) deep-water mass sources and circulation structure and (2) regional regulation processes within the ocean basin. We reconstruct deep-water oxygen concentrations ([O₂]) between 26 and 10 ka BP using sediments from IODP Site 353-U1445 (Bay of Bengal) and IODP Site 361-U1479 (Cape Basin). Deep-water [O₂] is inferred from the carbon isotope gradient between epifaunal and infaunal benthic foraminifera (Δδ13Cepi-in). Changes in biological pump efficiency are assessed from the carbon isotope gradient between planktonic and benthic foraminifera (Δδ13Cp-b). Reconstructed [O₂] records are combined with outputs from the TraCE-21ka simulations and CMIP6 EC-Earth3-CC model to estimate respired carbon storage (Pg C).

During the LGM, deep-water [O₂] variations in the Cape Basin and the Bay of Bengal showed broadly synchronous trends, with major inflection points occurring at similar times. However, changes in the Cape Basin systematically preceded those in the Bay of Bengal. This temporal offset indicates a more rapid response in the Cape Basin relative to the Bay of Bengal. From the LGM to the deglaciation, increasing deep-water [O₂] and declining carbon storage in the Cape Basin are closely associated with reduced biological pump efficiency. In contrast, the Bay of Bengal exhibited stronger variability during the deglaciation, with a pronounced response during the Bølling–Allerød (B/A) interval, when deep-water [O₂] sharply decreased. During the B/A stage, the Antarctic Cold Reversal in the Southern Ocean was characterized by weakened AABW formation and reduced deep-water [O₂]. These changes slowed deep-water renewal and enhanced deep-water organic carbon remineralization, which probably resulted in increased deep-water respired carbon storage in the Indian Ocean. The larger LGM–deglacial amplitude in the Cape Basin reflects its location at the confluence of Atlantic, Southern Ocean, and Indian Ocean water masses, resulting in a more rapid and pronounced response to circulation reorganization, whereas the Bay of Bengal exhibits weaker and delayed responses as a distal deep-water reservoir. Estimated respired carbon storage efficiency in the Cape Basin is higher during the LGM by~0.03 mol m⁻³ and ~0.05 mol m⁻³ relative to Heinrich Stadial 1 (H1) and the B/A, respectively. Consistent with this difference, mean respired carbon storage decreased from ~5.51 Pg C (~2.58 ppm CO₂ equivalent) during the LGM to ~2.84 Pg C (~1.33 ppm) and 1.10 Pg C (~0.52 ppm CO₂) during H1 and the B/A, respectively. In contrast, the Bay of Bengal exhibits higher respired carbon storage during the B/A (1.24 Pg C; ~0.58 ppm CO₂ equivalent) than during the LGM (0.51 Pg C; ~0.24 ppm CO₂ equivalent). This study highlights the heterogeneous response of the Indian Ocean deep carbon reservoir during glacial-interglacial transitions.

How to cite: Shen, W. and Zhao, N.: Evolution of deep-ocean carbon storage in the Indian Ocean since the Last Glacial Maximum, EGU General Assembly 2026, Vienna, Austria, 3–8 May 2026, EGU26-15512, https://doi.org/10.5194/egusphere-egu26-15512, 2026.

EGU26-15991 | ECS | Orals | OS1.10

Intensified Indian Ocean Rossby Wave Dynamics as a Driver of Increased Quasi-Biennial Summer Monsoon Floods in the Yangtze River Basin  

Panini Dasgupta, SungHyun Nam, Michael James McPhaden, DongJin Kang, Roxy Mathew Koll, and Saranya Jayanthi Sasikumar

Six major summer monsoon floods occurred in the Yangtze Basin between 1992–2024 affecting millions of people, compared to only one during 1960–1991. This significant rise in hydroclimatic extremes is closely associated with an approximately 50% increase in variability at the quasi-biennial timescale. In this study, using sea surface height and thermocline depth from the ORAS5 reanalysis and EN4 observational analysis, we demonstrate that the increased quasi-biennial variability in East Asian summer monsoon rainfall over the Yangtze River Basin is strongly coupled with intensified quasi-biennial scale wave dynamics in the Indian Ocean. We provide evidence of fundamental changes in the characteristics of baroclinic waves in the tropical Indian Ocean over recent decades. We find that the mean phase speed of westward-propagating tropical Rossby waves has increased by 70%, along with their overall variance. These shifts are likely associated with changes in large-scale atmospheric forcing. Our findings highlight that evolving Indian Ocean wave characteristics are a key driver of changes in East Asian summer monsoon variability at quasi-biennial timescales and the associated hydrological extremes over East Asia, with important implications for the predictability of East Asian summer monsoon rainfall at these timescales.

How to cite: Dasgupta, P., Nam, S., McPhaden, M. J., Kang, D., Mathew Koll, R., and Jayanthi Sasikumar, S.: Intensified Indian Ocean Rossby Wave Dynamics as a Driver of Increased Quasi-Biennial Summer Monsoon Floods in the Yangtze River Basin , EGU General Assembly 2026, Vienna, Austria, 3–8 May 2026, EGU26-15991, https://doi.org/10.5194/egusphere-egu26-15991, 2026.

In this presentation, we review the recent research progress based on moored observations of the Leeuwin Current, an eastern boundary current of the south Indian Ocean, off the west coast of Australia, over the past 15 years. The focus will be on the seasonal cycle of the Leeuwin Current, as well as the interannual temperature variability and its drivers, with a focus on the Ningaloo Niño – an austral summer marine heatwave event. In the future climate projections, the Leeuwin Current (along with the Indonesian Throughflow) will become weaker, as shown in both climate model projections and downscaling models. However, the Ningaloo Niño is expected to strengthen in the future climate, with its peak month shifting from February to March in the austral summer. Climate model projections suggest that both enhanced local air-sea coupling and remote forcing from the Pacific may induce such a strengthening of the warming events.

How to cite: Feng, M.: Observations of the Leeuwin Current and variability, and future projections of Ningaloo Niño marine heatwaves, EGU General Assembly 2026, Vienna, Austria, 3–8 May 2026, EGU26-16944, https://doi.org/10.5194/egusphere-egu26-16944, 2026.

EGU26-17507 | ECS | Orals | OS1.10

Surface and deep chlorophyll microbial community response to mixing events in the stratified Bay of Bengal (NE Indian Ocean) 

Juan Rodríguez-Márquez, Ana Bartual, Annie Bourbonnais, Maria Pachiadaki, and Emilio Garcia-Robledo

The Bay of Bengal (BoB) is characterized by intense stratification driven by monsoonal freshwater flux coupled with high irradiance levels, which limits nutrient supply to the euphotic zone and restricts oxygen ventilation. While the northern part of the Bay remains hypoxic, ubiquitous mesoscale eddies provide a mechanism to break this stratification, pumping nutrients into surface layers and transporting shelf-associated microbial communities to the central bay. The response of these communities to the dynamics of this region remains however poorly understood.

The objective of the present study was to analyse the response of two distinct microbial communities to the environmental dynamics of this region. We conducted a series of onboard incubations using natural microbial communities collected from surface and deep chlorophyll maximum (DCM) waters during a cruise aboard the R/V Thomas G. Thompson in the summer months of 2025. Two distinct treatments were established: a control representing standard stratified conditions (characterized by an abrupt oxygen gradient and low irradiance at depth), and an experimental treatment designed to simulate the nutrient injection and mixing typically induced by cyclonic eddies, under well-oxygenated conditions and the local photoperiod. We monitored physiological parameters as chlorophyll-a concentration, the maximum photosynthetical quantum yield (Fv/Fm) and intracellular nitrate pools.

Our findings indicate that both communities (surface and DCM) exhibited similar response patterns under stratified conditions, with no significant growth and intracellular nitrate levels remaining lower (≈ 0.1 µM) than the freely dissolved pool (0.9-1.2 µM). In contrast, nutrient enrichment from bottom waters resulted in a rapid community response. The surface community exhibited a rapid uptake of nitrate within the first hours of incubation, resulting in an increase in the intracellular pool, which was followed by a gradual consumption over the following days. These results demonstrate the physiological plasticity of the community in response to a highly dynamic environment, with the capacity to utilize episodic nutrient enrichment within this highly variable system. Such plasticity may have significant implications for the nitrogen biogeochemical cycle as well as for the overall microbial community composition in the highly dynamic and increasingly deoxygenated North Indian Ocean.

How to cite: Rodríguez-Márquez, J., Bartual, A., Bourbonnais, A., Pachiadaki, M., and Garcia-Robledo, E.: Surface and deep chlorophyll microbial community response to mixing events in the stratified Bay of Bengal (NE Indian Ocean), EGU General Assembly 2026, Vienna, Austria, 3–8 May 2026, EGU26-17507, https://doi.org/10.5194/egusphere-egu26-17507, 2026.

EGU26-17545 | Posters on site | OS1.10

Regulation and control of the planktonic microbial respiration in the hypoxic waters of the Bay of Bengal 

Emilio Garcia-Robledo, Juan Rodriguez-Marquez, Maria Pachiadaki, Annie Bourbonnais, and Jose Calderon-Caro

The Bay of Bengal is considered one of the largest oceanic Oxygen Minimum Zone (OMZ), characterized by oxygen levels that remains persistently near the threshold of anoxia, possibly limiting the widespread nitrogen loss observed in other major OMZs. Planktonic microbial respiration is largely responsible for the formation and maintenance of the hypoxic and anoxic conditions found in the OMZs. Understanding the respiratory kinetics of the planktonic microbial community is therefore essential to predicting the sensitivity of this area to further deoxygenation. During a cruise aboard the R/V Thomson in the summer months of 2025, we investigated the regulation and control of microbial oxygen consumption within the upper 300 m of the water column. We combined high-resolution vertical profiling with experimental rate measurements using high-sensitivity oxygen sensors to characterize the metabolic transition from the upper oxic layer through the oxycline into the nearly anoxic core. Microbial community abundance was quantified via flow cytometry to link biomass density with metabolic activity. Respiratory kinetics were characterized by onboard water incubations with samples subjected to a wide range of oxygen levels. Our results demonstrate a clear vertical stratification in respiratory potential, with the highest rates associated with the upper oxic layer and a progressive decrease as oxygen and chlorophyll levels decreased. However, higher values were also found at intermediate depths within the hypoxic water layers. By fitting oxygen consumption rates to kinetic models, we calculated the apparent half-saturation constant (Km) for the microbial community throughout the water column. These Km values showed a complex distribution, generally reaching their minimum in the oxycline and increasing within the hypoxic zones. This suggests a counterintuitive decrease in oxygen affinity at low oxygen levels, although significant consumption rates were observed even at trace levels of oxygen. This trend may indicate a taxonomic shift in the microbial community or a change in the expression of different types of terminal oxidases, thereby demonstrating adaptation of the microbial community to the episodic oxygen supply characteristic of the interior of the Bay of Bengal.

How to cite: Garcia-Robledo, E., Rodriguez-Marquez, J., Pachiadaki, M., Bourbonnais, A., and Calderon-Caro, J.: Regulation and control of the planktonic microbial respiration in the hypoxic waters of the Bay of Bengal, EGU General Assembly 2026, Vienna, Austria, 3–8 May 2026, EGU26-17545, https://doi.org/10.5194/egusphere-egu26-17545, 2026.

EGU26-20293 | ECS | Orals | OS1.10

Pronounced volcanic cooling and freshening in the northeastern Indian Ocean during the early 19th century 

Hana Camelia, Thomas Felis, Martin Kölling, Sander Scheffers, and Suchana Chavanich

The Indian Ocean climate response to natural external forcing, such as volcanic eruptions, is still uncertain due to potential model biases and lack of validation from observations and subannual-resolution marine palaeorecords. Here we present monthly temperature and hydrology reconstructions derived from coral Sr/Ca and oxygen isotopes in the northeastern Indian Ocean back to 1774. Our reconstructions reveal anomalous and prolonged cooling and freshening during the early 19th century (~1809-1824), which we attribute to a cluster of tropical volcanic eruptions that includes the unidentified 1809 and Tambora 1815 eruptions. The regional cooling and freshening were unusually strong compared to the wider Indian Ocean. The eruptions forced negative Indian Ocean Dipole (IOD)-like conditions in our reconstructions, followed by positive IOD-like conditions in subsequent years, regardless of eruption magnitude. Our results and other palaeorecords suggest positive IOD-like mean conditions during the early 19th century, accompanied by stronger summer rainfall over areas of India and a negative Interdecadal Pacific Oscillation state, were associated with the regional cooling and freshening. Our findings highlight the sensitivity of the northeastern Indian Ocean to external forcing and that available observations, proxy records, and climate model simulations do not capture the full range of regional climate variability, complicating climate change projections for this highly populated region vulnerable to future climate extremes.

How to cite: Camelia, H., Felis, T., Kölling, M., Scheffers, S., and Chavanich, S.: Pronounced volcanic cooling and freshening in the northeastern Indian Ocean during the early 19th century, EGU General Assembly 2026, Vienna, Austria, 3–8 May 2026, EGU26-20293, https://doi.org/10.5194/egusphere-egu26-20293, 2026.

EGU26-20467 | ECS | Orals | OS1.10

Physically Driven Uncertainty in Future Indian Ocean Chlorophyll: Roles of Stratification, Winds, and Bias Correction 

Sadhvi Kwatra, Matthieu Lengaigne, Suresh Iyyappan, Cyril Dutheil, and Jérôme Vialard

Uncertainty in Earth System Model (ESM) projections of Indian Ocean biogeochemistry is often attributed primarily to differences in biogeochemical process representations. Here, we demonstrate that large present-day physical biases and divergent future physical climates also play a substantial role. Using a bias-corrected ocean-only model forced by air–sea flux anomalies from multiple CMIP6 models, we show that correcting present-day physical biases strongly amplifies projected summer surface chlorophyll (SChl) changes and substantially improves inter-model consistency.

Across key Indian Ocean upwelling regions, increased upper-ocean stratification driven by heat-flux anomalies consistently reduces SChl, highlighting the role of ocean warming in shaping future biogeochemical change. In contrast, wind-driven changes dominate the SChl response in several regions, particularly off southern India and off Sumatra, emphasizing strong regional differences in physical controls. These results underscore the central importance of monsoonal wind variability and its future evolution for Indian Ocean biogeochemistry, with implications for ecosystem functioning and the predictability of regional climate impacts. 

How to cite: Kwatra, S., Lengaigne, M., Iyyappan, S., Dutheil, C., and Vialard, J.: Physically Driven Uncertainty in Future Indian Ocean Chlorophyll: Roles of Stratification, Winds, and Bias Correction, EGU General Assembly 2026, Vienna, Austria, 3–8 May 2026, EGU26-20467, https://doi.org/10.5194/egusphere-egu26-20467, 2026.

EGU26-20563 | ECS | Posters on site | OS1.10

Observed variability of intermediate water masses in tropical western Indian Ocean from a 2019-2025 subsurface mooring time series 

Somang Song, SungHyun Nam, and Viviane V. Menezes

Intermediate water masses in the tropical western Indian Ocean play a key role in subsurface thermohaline circulation by contributing to the redistribution of heat and salt, yet their variability on seasonal to interannual timescales remains poorly understood due to the historical scarcity of sustained in situ observations. We present an observational analysis of intermediate water mass variability based on a continuous subsurface mooring time series collected from 2019 to 2025 at the Seychelles-Chagos Thermocline Ridge (SCTR; 8°S, with the mooring located at 61°E during May 2019-June 2024 and relocated to 65°E thereafter). We focus on the intermediate layer spanning approximately 440-1190 m depth (corresponding to ~27.0-27.4/27.5 sigma-theta), using temperature, salinity, potential density, and spiciness. Pronounced changes in physical properties are observed between the earlier (2019-2021) and later (2022-2025) periods. Relative to the earlier years, the intermediate layer during later period exhibits freshening (34.82 to 34.79 PSU, -0.1%) and warming (7.06 to 7.19 °C, +1.8%), accompanied by a decrease in potential density (27.28 to 27.23 kgm-3, -0.2%) and a concurrent increase in spiciness (0.64 to 0.66, +1.8%), suggesting potential changes in the relative contributions of intermediate water masses. To examine this possibility, we apply an optimal multiparameter (OMP) analysis to quantify the fractional contributions of Red Sea Overflow Water (RSOW), Indonesian Intermediate Water (IIW), and Antarctic Intermediate Water (AAIW). The OMP results show that RSOW has both the largest fractional contribution and the strongest interannual-scale variability among the three intermediate water masses at the SCTR accounting on average for ~0.59±0.05 of the intermediate layer indicating its dominant role in modulating intermediate-layer variability in the region. In comparison, IIW and AAIW contribute smaller mean fractions (~0.25±0.01 and ~0.13±0.03, respectively) and display comparatively weaker temporal variability. Notably, the mean RSOW fraction decreases during 2022-2025 from 0.62±0.04 to 0.57± 0.03 (-7.3%), whereas the contributions of IIW and AAIW increase from 0.24± 0.01 to 0.25± 0.01 (+7.2%) and from 0.11±0.03 to 0.15±0.02 (+34.6%), respectively. While RSOW remains the dominant intermediate water mass at the SCTR, the increased fractions of IIW and AAIW during the later years indicate an enhanced relative contributions of these water masses during the later period, consistent with the observed freshening and increase in spiciness in intermediate layer. By leveraging a rare continuous mooring time series, this study demonstrates the value of sustained in situ observations for resolving multi-year variability in intermediate water mass composition and properties at the SCTR region.

How to cite: Song, S., Nam, S., and Menezes, V. V.: Observed variability of intermediate water masses in tropical western Indian Ocean from a 2019-2025 subsurface mooring time series, EGU General Assembly 2026, Vienna, Austria, 3–8 May 2026, EGU26-20563, https://doi.org/10.5194/egusphere-egu26-20563, 2026.

EGU26-21158 | Posters on site | OS1.10

A 250-year SST and salinity coral record reflecting Indo-Pacific teleconnections by the Indonesian Throughflow  

Jens Zinke, Hedwig A. Krawczyk, Padmasini Behera, Arnoud Boom, Bastian Hambach, Miriam Pfeiffer, Neal Cantin, Janice M. Lough, and Paul Wilson

The tropical southeastern Indian Ocean regarded as a pivotal region for Indo-Pacific climate teleconnections, including phenomena such as the El Niño-Southern Oscillation (ENSO), the Indian Ocean Dipole (IOD), and the Interdecadal Pacific Oscillation (IPO). However, long-term instrumental climate data are often lacking for tropical oceans. The geochemistry of massive stony corals provides a valuable record of past hydroclimatic conditions that compensates for this lack and surpasses existing data.

Using sub-seasonally resolved coral Sr/Ca and δ18O records from Browse Island, Australia spanning 1753–2011, this work provides new insights into sea surface temperature (SST) and salinity variability over interannual to multidecadal timescales. The Sr/Ca record reveals robust correlations with instrumental SST, capturing the long-term industrial era warming starting at the end of the Little Ice Age (LIA) and accelerating trends since the early 20th century, indicative of anthropogenic forcing. The δ18Oseawater record, reconstructed from paired Sr/Ca and δ18O data, highlights hydrological variability driven by precipitation-evaporation dynamics, closely tied to the Australian monsoon, and ITF transport. While the imprint of the IOD seems to be reflected more in SST anomalies in the region, the influence of ENSO is recorded in hydrological anomalies due to changes in ocean advection. Long-term trends in δ18Osw indicate centennial variability, reflecting complex interactions between monsoon-driven freshwater fluxes and ITF circulation. Freshening since the 1950s is likely caused by the intensified hydrological cycle due to anthropogenic warming. The SST reconstruction tracks the cooling and warming periods indicated by the IPO.  

The findings underscore the influence of interannual and decadal variability, particularly the IOD, ENSO, and the Interdecadal Pacific Oscillation (IPO), on SST and salinity, mediated by the combined effects of monsoon dynamics and ITF transport. Discrepancies between δ18Osw and Sr/Ca-SST trends emphasize the need for further investigation into the driving mechanisms of long-term climate variability by pantropical teleconnections.


How to cite: Zinke, J., Krawczyk, H. A., Behera, P., Boom, A., Hambach, B., Pfeiffer, M., Cantin, N., Lough, J. M., and Wilson, P.: A 250-year SST and salinity coral record reflecting Indo-Pacific teleconnections by the Indonesian Throughflow , EGU General Assembly 2026, Vienna, Austria, 3–8 May 2026, EGU26-21158, https://doi.org/10.5194/egusphere-egu26-21158, 2026.

EGU26-1773 | Orals | OS4.3

Low-Cost Multi-Antenna GNSS Buoys for Marine Environment Sensing 

Mingwei Di, Dianguang Ma, Bofeng Guo, and Hanwei Liu

GNSS technology offers the capabilities of global coverage and all-weather positioning and velocity measurement. Deploying modular, low-cost GNSS equipment on small buoys enables ocean environment monitoring, such as of waves and tides, by utilizing precise displacement and velocity information obtained from GNSS signals. Furthermore, networking multiple buoys can capture subtle changes during air-sea exchange processes and support marine target detection. However, the limited anti-interference capability of low-cost GNSS buoys under complex sea states results in reduced measurement accuracy, poor robustness, and constrained sensing dimensions, which severely restrict their operational deployment.

 To address these issues, this work conducts an in-depth investigation into the application of low-cost GNSS buoys for robust multi-element marine environment  sensing. The main contributions are as follows:

  • A low-cost GNSS buoy measurement system is designed. A multi-antenna GNSS buoy platform(MGB) is developed along with three core modules for precise GNSS positioning, high-precision velocity measurement, and marine environmental sensing, providing a reliable foundation for algorithm development and field validation.
  • A tide level measurement model based on a multi-antenna GNSS buoy is developed. To tackle the issues of gross errors in GNSS-derived tide level measurements and high-frequency oceanic noise disturbances, a noise-processing model integrating an attitude error correction model with a robust Vondrak filtering algorithm is established.
  • A robust wave inversion model based on low-cost GNSS buoys is established. To reduce distortion in wave parameter estimation caused by abnormal GNSS velocity measurements, a comprehensive velocity determination method is proposed.  A mapping model based on random wave theory is developed to transform GNSS velocity sequences into the wave spectrum, accompanied by a spectral moment parameter estimation model.
  • A ship sensing model based on low-cost GNSS buoys is proposed. We exploit the observation information from GNSS buoys and employs wavelet analysis for time–frequency transformation to extract ship Kelvin wake signatures.

How to cite: Di, M., Ma, D., Guo, B., and Liu, H.: Low-Cost Multi-Antenna GNSS Buoys for Marine Environment Sensing, EGU General Assembly 2026, Vienna, Austria, 3–8 May 2026, EGU26-1773, https://doi.org/10.5194/egusphere-egu26-1773, 2026.

EGU26-3287 | Orals | OS4.3

Operational Detection of Rip Currents Using Shore-Based Microwave Radar Imagery and Artificial Intelligence 

Li-Chung Wu, Laurence Zsu-Hsin Chuang, and Jian-Wu Lai

Rip currents are a leading cause of coastal drowning accidents worldwide, yet their detection remains challenging due to their significant spatial variability and intermittent nature. While traditional in-situ methods provide high-fidelity but localized insights, optical imagery is often constrained by specific illumination and weather windows. To extend monitoring capabilities across broader areas and diverse environmental conditions, shore-based microwave radar offers a robust alternative. This study investigates the detection and characterization of rip current signatures using time-series microwave radar imagery, focusing on the development of an automated operational technology. Radar imagery captures the observed area by recording variations in backscatter intensity, which are primarily driven by wave breaking and surface roughness. In X-band radar, small-scale surface scatterers, such as breaking gravity waves, facilitate Bragg scattering, which is significantly modulated by rip current dynamics in the surf and outer surf zones.

Our proposed framework adopts a two-stage approach. In the first stage, conventional image processing techniques, including temporal averaging and filtering, are employed to identify candidate rip current patterns from radar sequences. To enhance detection robustness and mitigate false alarms, the second stage introduces an artificial intelligence-based recognition model trained to discriminate rip current signatures from transient wave breaking and background noise. Comparative analyses demonstrate that this AI-assisted approach significantly improves detection consistency across varying sea states. By combining the physical interpretability of traditional image processing with the predictive power of AI, this framework enables near-real-time, continuous rip current monitoring. These results highlight the potential of intelligent microwave radar systems to support coastal safety applications, including early warning systems and real-time hazard mitigation.

How to cite: Wu, L.-C., Chuang, L. Z.-H., and Lai, J.-W.: Operational Detection of Rip Currents Using Shore-Based Microwave Radar Imagery and Artificial Intelligence, EGU General Assembly 2026, Vienna, Austria, 3–8 May 2026, EGU26-3287, https://doi.org/10.5194/egusphere-egu26-3287, 2026.

EGU26-3817 | ECS | Orals | OS4.3

Influence of seagrass restoration on nutrient cycling across contrasting estuarine systems in the southern North Sea 

Luciana Villa Castrillón, Benjamin Jacob, Johannes Pein, Zhengui Wang, and Joanna Staneva

Seagrass meadows play an important role in coastal water quality by regulating nutrient availability, reducing eutrophication pressure and stabilizing sediments. Their decline in many European coastal zones has intensified interest in restoration as a nature-based measure. However, the quantitative influence of seagrass on seasonal nutrient dynamics at the scale of whole estuarine systems remains insufficiently understood. In the Wadden Sea, excessive nutrient load and turbidity are persistent challenges; seagrass restoration is increasingly seen as a nature-based solution for improving nutrient uptake and ecosystem health. This study provides a novel, spatially explicit assessment of seagrass impacts on nutrient cycling across
an entire annual cycle in two hydrodynamically contrasting regions of the southern North Sea. The study is based on a validated three-dimensional hydrodynamic–biogeochemical modelling framework that reproduces observed water levels, temperature, salinity, waves, and nutrient
concentrations across the study area. Paired simulations with and without seagrass were used to quantify changes in dissolved inorganic nitrogen (NO3, NH4), phosphate (PO4), and dissolved organic carbon (DOC). In the Jade Bay, DOC increases by approximately 100–170% across seasons, PO4 decreases by 24–34%, and summer NO3 is reduced by up to 70%. In the Weser Estuary, the strength of vegetation effects is constrained by high riverine inputs
and rapid flushing. Although dissolved organic carbon increases by up to 17% and phosphate decreases by 3–10%, nitrogen responses are smaller and are significantly influenced by river discharge and mixing. Overall, the results show that seagrass restoration can substantially modify local nutrient cycling, but that its effectiveness strongly depends on hydrodynamic conditions and external nutrient load. The study shows that restoration provides ecological benefits in semi-enclosed, moderately flushed systems like the Jade Bay, where biological processes can influence local water quality. In river-dominated estuaries, the effect of seagrass remains more limited because external inputs and rapid transport constrain its influence,
unless accompanied by broader catchment-scale measures. The results highlight the potential of seagrass as a targeted nature-based measure for enhancing local water quality in suitable coastal settings, rather than as a stand-alone remedy for eutrophication at the estuarine scale.

How to cite: Villa Castrillón, L., Jacob, B., Pein, J., Wang, Z., and Staneva, J.: Influence of seagrass restoration on nutrient cycling across contrasting estuarine systems in the southern North Sea, EGU General Assembly 2026, Vienna, Austria, 3–8 May 2026, EGU26-3817, https://doi.org/10.5194/egusphere-egu26-3817, 2026.

EGU26-4425 | Orals | OS4.3

From In Situ Observations to Satellites: Machine Learning–Based Modelling of Seawater pCO₂ and pH in the Canary Islands 

Melchor Gonzalez-Davila, Irene Sánchez-Mendoza, David González-Santana, David Curbelo-Hernández, Aridane González-González, and J. Magdalena Santana-Casiano

The improvement of remote sensing systems, together with the emergence of new model-fitting algorithms based on machine-learning techniques, has allowed the estimation of the partial pressure of carbon dioxide (pCO2,sw) and pH (pHT,sw) in the waters of the Canary Islands (13-19ºW; 27-30ºN). Continuous time series data from moored buoys and Voluntary Observing Ships (VOS) between 2019 and 2024 were used to train and validate the models, providing an observational foundation for the satellite-based estimations. Among all the fitted models, the most powerful one was the bootstrap aggregation (bagging), giving a RMSE of 2.0 µatm (R2 > 0.99) for pCO2,sw and RMSE of 0.002 for pHT,sw, although the multilinear regression (MLR), neural network (NN) and categorical boosting (catBoost) also have a good predictive performance, with RMSE ranging from 5.4 to 10 µatm for 360 < pCO2,sw < 481 µatm and from 0.004 and 0.008 for 7.97 < pHT,sw< 8.07. Using the most reliable model, it was determined that there is an interannual trend of 3.51 ± 0.31 µatm yr-1 for pCO2,sw (which surpasses the rate of increase for atmospheric CO2 of 2.3 µatm yr-1) and an increase in acidity of -0.003 ± 0.001 pH units yr-1. Over the 6 years (2019-2024), the rise in the atmospheric CO2 and the increase in sea surface temperature, which reached 0.2 ºC per year under the influence of the unprecedented 2023 marine head wave, contribute to this important rate. Considering the Canary Islands, the region has moved from a slight CO2 source of 0.90 Tg CO2 yr-1 in 2019 to 4.5 Tg CO2 yr-1 in 2024. After 2022, eastern locations that acted as an annual sink of CO2 switched to acting as a source.


How to cite: Gonzalez-Davila, M., Sánchez-Mendoza, I., González-Santana, D., Curbelo-Hernández, D., González-González, A., and Santana-Casiano, J. M.: From In Situ Observations to Satellites: Machine Learning–Based Modelling of Seawater pCO₂ and pH in the Canary Islands, EGU General Assembly 2026, Vienna, Austria, 3–8 May 2026, EGU26-4425, https://doi.org/10.5194/egusphere-egu26-4425, 2026.

EGU26-5375 | ECS | Posters on site | OS4.3

Toward an AI-enhanced hydro-morphodynamic model for nature-based solutions in coastal erosion mitigation 

Nour Dammak, Wei Chen, and Joanna Staneva

When applying sustainable Nature-based Solution (NbS) for coastal engineering, a major challenge lies in determining the effectiveness of these NbS approaches in mitigating coastal erosion. The efficacy of NbS is influenced by various factors, including the specific location, layout, and the scale of implementation.  This study integrates artificial intelligence (AI) with hydro-morphodynamic numerical simulations to develop an AI-based emulator focused on predicting Bed Level Changes (BLC) as indicators of erosion and deposition dynamics. In particular, we explore the influence of seagrass meadows, which vary in their initial depth (hs) and depth range (hr), on the attenuation of coastal erosion during storm events.

The framework employs a hybrid approach combining the SCHISM-WWM hydrodynamic model with XBeach to simulate 180 depth range and starting depth combination (hr-hs) scenarios along the Norderney coast in the German Bight. A Convolutional Neural Network (CNN) architecture is used with two inputs—roller energy and Eulerian velocity—to efficiently predict BLC. The CNN shows high accuracy in replicating spatial erosion patterns and quantifying erosion/deposition volumes, achieving an R² of 0.94 and RMSE of 3.47 cm during validation.

This innovative integration of AI and NbS reduces computational costs associated with traditional numerical modelling and improves the feasibility of What-if Scenarios applications for coastal erosion management. The findings highlight the potential of AI-based approache to optimize seagrass transplantation layouts and inform sustainable coastal protection strategies effectively. Future advancements aim to further optimize model integration and scalability, thereby advancing NbS applications in enhancing coastal resilience against environmental stressors.

How to cite: Dammak, N., Chen, W., and Staneva, J.: Toward an AI-enhanced hydro-morphodynamic model for nature-based solutions in coastal erosion mitigation, EGU General Assembly 2026, Vienna, Austria, 3–8 May 2026, EGU26-5375, https://doi.org/10.5194/egusphere-egu26-5375, 2026.

EGU26-6025 | Orals | OS4.3

Deterministic and ensemble forecasts of the Kuroshio south of Japan 

Shun Ohishi, Takemasa Miyoshi, and Misako Kachi

Kuroshio flows eastward along the southern coast of Japan and has a variety of flow paths such as straight and large meander paths south of Japan. The Kuroshio path variations cause substantial damage to fisheries, marine transport, and marine environment (e.g., Nakata et al. 2000; Barreto et al. 2021). Consequently, Japanese research institutions have conducted Kuroshio path predictions using regional ocean data assimilation systems with the Kalman filter (Hirose et al. 2013) and the three- and four-dimensional variational methods (Miyazawa et al. 2017; Kuroda et al. 2017; Hirose et al. 2019). However, these systems are not designed for ensemble forecasts, and the predictions have been limited to deterministic ones so far.

We have developed a new local ensemble transform Kalman filter (LETKF)-based regional ocean data assimilation system (Ohishi et al. 2022a, b) and released ensemble ocean analysis datasets called the LETKF-based Ocean Research Analysis (LORA) for the western North Pacific and Maritime Continent regions (Ohishi et al. 2023, 2024a, b). The LORA datasets are shown to have sufficient accuracy for geoscience research, especially in mid-latitude regions (Ohishi et al. 2023), and we can perform both deterministic and ensemble forecasts initialized by the LORA. Therefore, this study aims to compare the predictability of the Kuroshio path south of Japan between deterministic and ensemble forecasts.

We performed 6-month deterministic and ensemble forecasts initialized on the first day of every month from January 2016 to December 2018 (36 cases in total) using the initial conditions of the analysis ensemble mean and 128 analysis ensembles from the LORA dataset, respectively. The results show that the predictability limits of the Kuroshio path are 74 and 108 days in the deterministic and ensemble forecasts, respectively, indicating a significantly longer predictability limit of the ensemble forecasts than the deterministic forecasts.

How to cite: Ohishi, S., Miyoshi, T., and Kachi, M.: Deterministic and ensemble forecasts of the Kuroshio south of Japan, EGU General Assembly 2026, Vienna, Austria, 3–8 May 2026, EGU26-6025, https://doi.org/10.5194/egusphere-egu26-6025, 2026.

EGU26-6775 | ECS | Posters on site | OS4.3

Explainable deep learning based decadal shoreline forecasting in the Southern Baltic 

Kamran Tanwari, Paweł Terefenko, Andrzej Giza, and Jakub Śledziowski

The coastal environments of the Southern Baltic Sea are of high ecological and socio-economic importance. Understanding future changes along its extensive and complex shorelines can help us comprehend the climatic and natural pressures arising from extreme weather events of compound and cascading nature, providing valuable insights for effective coastal management and the prevention of future adverse erosional changes. Current shoreline forecasting methods have limited capabilities to capture nonlinear forcings, have limited temporal forecasting and lack explainability. We present sequence-aware LSTM-RNN framework with optimized lookback functionality designed for end-to-end recursive shoreline forecasting. The model integrates 15 environmental factors spanning climatic, hydrometeorological and geomorphological indicators to enhance spatiotemporal representation, capture compound characteristics and maintain physical consistency. Trained with ERA5 reanalysis products, Landsat satellite observations, and CMIP6 SLR projections, our LSTM-RNN model achieves high forecasting skill of over 25 years, yielding aRMSE of 10.40, MAE of 7.13, and R2 of 0.55. The model was then allowed to make predictions for three proposed sectors, revealing consistent increase in erosional tendencies from 2030 to 2050 across nearly whole study region. Explainable AI method, DeepSHAP reveals that the increasing erosion in these sectors is governed by rising sea levels under high emission scenario when combined with storm surges and maximum significant wave height which far outweigh the accretion caused by wind-wave variables. The progression aligns closely with the established theories of shoreline evolution under the influence of rising sea levels and storm surges, underscoring the model’s ability to identify physically meaningful drivers. The framework demonstrates strong potential for advancing explainable AI in Earth observation, combining predictive accuracy with physical explainability for operational shoreline monitoring and climate change mitigation applications. 

How to cite: Tanwari, K., Terefenko, P., Giza, A., and Śledziowski, J.: Explainable deep learning based decadal shoreline forecasting in the Southern Baltic, EGU General Assembly 2026, Vienna, Austria, 3–8 May 2026, EGU26-6775, https://doi.org/10.5194/egusphere-egu26-6775, 2026.

EGU26-7397 | ECS | Orals | OS4.3

Forecasting Ocean Mesoscale Eddies in the Northwest Pacific in a Dynamic Ocean Forecast System 

Jiakang Zhang, Hailong Liu, Mengrong Ding, Yao Meng, Weipeng Zheng, Pengfei Lin, Zipeng Yu, Yiwen Li, Pengfei Wang, and Jian Chen

Reliable forecasting of ocean mesoscale eddies is essential for applications such as scientific investigation, ecosystem management, and environmental services. However, comprehensive, large-sample evaluations of eddy forecasts from dynamical ocean prediction systems remain largely absent. 

This study evaluates the performance of the LICOM Forecast System (LFS), a global eddy-resolving ocean forecast system, in predicting mesoscale eddies over the Northwest Pacific. One year of 1–15 day sea level anomaly (SLA) forecasts was compared with observations using the GEM-M eddy identification and tracking algorithm. A novel distance-based matching framework is developed to objectively link forecasted and observed eddies. This framework pairs correctly forecasted eddies between observation and forecast, while the remaining eddies are classified as missing eddies or false eddies.

Statistically, the system slightly underestimates eddy number (~8%) and amplitude (~22%), while overestimating eddy radius (~4%) and velocity (~24%). Despite these biases, LFS reproduces the large-scale spatial distribution of mesoscale variability in both eddy-rich and eddy-poor regions. Further, the matching outcomes reveal that LFS successfully forecasts ~63% of observed eddies at a 1-day lead time, while 37% of the observed eddies were missed, and 31% of the forecasted eddies were false. A key finding is that forecast skill is strongly dependent on eddy dynamical characteristics. Eddies with larger amplitudes and slower propagation velocities are more likely to be correctly predicted and exhibit smaller location errors. Quantitative analysis reveals a significant relationship between eddy amplitude and forecast location errors, particularly for weak eddies (amplitude smaller than 1.1 cm), and a robust linear dependence between eddy propagation speed and forecast error. For eddies with amplitudes greater than 1 cm and velocities below 1 km/day, the mean location errors is reduced to ~71 km at a 1-day lead time, compared to ~80 km for the full sample. This provides practical guidance for the forecasting applications: for eddies with larger amplitudes and slower velocity, the forecast system demonstrated greater accuracy in predicting their location. 

This study establishes a systematic and scalable framework for evaluating mesoscale eddy forecasts and demonstrates that eddy predictability is closely linked to intrinsic dynamical properties. Also, the proposed matching-based validation framework further distinguishes between correct, missing, and false forecast eddies, providing new insight into the structural limitations of dynamical ocean forecasts and offering a diagnostic tool for evaluating forecast system performance. 

How to cite: Zhang, J., Liu, H., Ding, M., Meng, Y., Zheng, W., Lin, P., Yu, Z., Li, Y., Wang, P., and Chen, J.: Forecasting Ocean Mesoscale Eddies in the Northwest Pacific in a Dynamic Ocean Forecast System, EGU General Assembly 2026, Vienna, Austria, 3–8 May 2026, EGU26-7397, https://doi.org/10.5194/egusphere-egu26-7397, 2026.

EGU26-7737 | ECS | Orals | OS4.3

Physics-based satellite-derived bathymetry 

Annika Klein and C. Gabriel David

Coastal and inland shallow-water environments are increasingly exposed to climate-change-related impacts such as sea-level rise, coastal erosion and ecosystem degradation. Reliable numerical hydrodynamic and morphological models are essential for assessing these impacts and supporting coastal adaptation strategies [1]. The performance of such models strongly depends on accurate bathymetric input data. Albeit providing a high accuracy, traditional shipborne acoustic surveys remain time-consuming, costly and operationally limited in shallow or hazardous environments, resulting in data gaps and infrequent recurring measurements [2,3].

Satellite-derived bathymetry (SDB) has therefore emerged as a cost-efficient and spatially continuous alternative for mapping optically shallow-waters [3]. Empirical and semi-empirical SDB approaches rely on statistical relationships between reflectance and depth, offering computational simplicity but limited transferability due to their dependence on site-specific calibration. In contrast, physics-based inversion models explicitly describe radiative transfer within the water column, accounting for wavelength-dependent light attenuation controlled by inherent optical properties of the water column. These approaches provide physically interpretable bathymetric retrievals that remain applicable across a range of optical water conditions, with to-be expected accuracies ranging from approximately 0.5 to 1.0 m RMSE for water depth up to 30 m [2,4].

This study implements and extends the physics-based inversion model described in [4] within an open-source Python framework for transparent and reproducible SDB and optical water quality retrieval from multispectral satellite data. The framework enables the simultaneous estimation of the physical water depth and potentially biologic parameters such as suspended matter concentration, chlorophyll-a concentration and colored dissolved organic matter absorption. Beyond the current state-of-the art, this study scrutinizes different implementation parameters to assess and improve computational stability and adaptability across varying optical environments, while maintaining a physically consistent radiative transfer formulation. The approach was validated at two optically contrasting sites: the semi-turbid Lake Constance (Untersee) in southern Germany and the clear-water One Tree Reef (Great Barrier Reef) in eastern Australia. Overall, this study demonstrates that the open-source development of a physics-based SDB approach can achieve competitive accuracy while remaining reproducible and adaptable, making a transferable, cost-efficient bathymetric mapping retrieval in operational shallow water monitoring available to a broader (scientific) audience.

[1] Pacheco, A., Horta, J., Loureiro, C., and Ferreira, (2015). Retrieval of nearshore bathymetry from landsat 8 images: A tool for coastal monitoring in shallow waters. Remote Sensing of Environment, 159:102–116. http://dx.doi.org/10.1016/j.rse.2014.12.004.

[2] Ashphaq, M., Srivastava, P. K., and Mitra, D. (2021). Review of near-shore satellite derived bathymetry: Classification and account of five decades of coastal bathymetry research. Journal of Ocean Engineering and Science, 6(4):340–359. https://doi.org/10.1016/j.joes.2021.02.006.

[3] Liu, Z., Liu, H., Ma, Y., Ma, X., Yang, J., Jiang, Y., and Li, S. (2024). Exploring the most efective information for satellite-derived bathymetry models in diferent water qualities. Remote Sensing, 16(13):2371. http://dx.doi.org/10.3390/rs16132371.

[4] Albert, A. (2004). Inversion technique for optical remote sensing in shallow water. PhD thesis, University of Hamburg. Retrieved from https://ediss.sub.uni-hamburg.de/handle/ediss/812.

How to cite: Klein, A. and David, C. G.: Physics-based satellite-derived bathymetry, EGU General Assembly 2026, Vienna, Austria, 3–8 May 2026, EGU26-7737, https://doi.org/10.5194/egusphere-egu26-7737, 2026.

EGU26-15344 | ECS | Posters on site | OS4.3

Implementation of a High-Resolution Regional Ocean Analysis System for Northwest Pacific Using an Ensemble Data Assimilation Method 

Jae-Sung Choi, Byoung-Ju Choi, Amirhossein Makatabi, Kwang-Young Jeong, and Gwang-Ho Seo

Reliable monitoring of coastal ocean states is critical for understanding regional climate variability and managing marine resources. We developed a high-resolution regional ocean analysis system for the seas around Korea. The system is based on the Regional Ocean Modeling System (ROMS) with a horizontal resolution of approximately 5 km and 30 vertical layers. To resolve complex coastal physical processes, we incorporated tidal forcing from the TPXO9 model and atmospheric forcing from ECMWF ERA5, while boundary conditions were supplied by the global GLORYS-NRT product.

To minimize model errors and incorporate the observation data, we applied the Ensemble Optimal Interpolation (EnOI) method for data assimilation. The background error covariance was estimated from a long-term simulation (1980–2022) comprising 44 ensemble members. We implemented a localization radius of 50 km horizontally and 100 m vertically to eliminate spurious correlations. The system assimilates a wide range of observations, including Sea Surface Temperature (OSTIA), surface geostrophic currents from satellite altimetry, and in-situ vertical profiles of temperature and salinity CTD and Argo floats.

Comparison with independent observation data and the global ocean analysis (GLORYS-NRT) demonstrated the system's reliable performance. The analysis field showed a high correlation (0.99) for sea surface temperature and reduced RMSE compared to the global model. Notably, our system accurately reproduced the vertical structure of the Yellow Sea Bottom Cold Water (YSBCW) and tidal fronts in the Yellow Sea and the meandering path of the East Korea Warm Current and Kuroshio. Furthermore, validation of volume transport through the Korea and Jeju Straits confirmed that our system better captures seasonal variability compared to the global product, which tended to underestimate transport in the Korea Strait.

The regional ocean analysis system successfully tracked significant climate anomalies in 2025. The region experienced distinct warming, with surface temperatures 0.5–2.0°C higher than the climatological mean (1991–2020), a warming trend extending to 150 m depth. Additionally, surface freshening (0.1–0.3 psu decrease) was observed in the Yellow Sea. These results underscore the necessity of including tidal processes and assimilating high-resolution local observations for effective monitoring of ocean climate change in the coastal seas.

How to cite: Choi, J.-S., Choi, B.-J., Makatabi, A., Jeong, K.-Y., and Seo, G.-H.: Implementation of a High-Resolution Regional Ocean Analysis System for Northwest Pacific Using an Ensemble Data Assimilation Method, EGU General Assembly 2026, Vienna, Austria, 3–8 May 2026, EGU26-15344, https://doi.org/10.5194/egusphere-egu26-15344, 2026.

EGU26-16650 | Posters on site | OS4.3

Quantifying surface currents uncertaintiesin French coastal area 

Quentin Jamet, Denis Gourvès, Stéphane Raynaud, Lisa Weiss, and Jean-Michel Brankart

Ocean surface currents are controlled by upper ocean dynamics, atmospheric conditions, as well as air-sea momentum exchanges. In the context of oil spill drift forecasting, this diversity of driving mechanisms imprints various sources of uncertainty, each of which is characterized by specific spatio-temporal patterns. Focusing on French coastal area (i.e. Bay of Biscay and English Channel), we aim at quantifying these uncertainties through ensemble and stochastic modeling approaches. We will present recent model developments within MANGA (MANche-GAscogne) Shom’s operational forecasting system, and discuss preliminary results in this direction. We will pay a particular attention to air-sea momentum exchanges, discussing strategies to model it with a stochastic approach. Such a source of uncertainty includes both large-scale components associated with atmospheric conditions and small-scale components associated with upper ocean dynamics, which a stochastic model should account for.

How to cite: Jamet, Q., Gourvès, D., Raynaud, S., Weiss, L., and Brankart, J.-M.: Quantifying surface currents uncertaintiesin French coastal area, EGU General Assembly 2026, Vienna, Austria, 3–8 May 2026, EGU26-16650, https://doi.org/10.5194/egusphere-egu26-16650, 2026.

EGU26-20032 | Posters on site | OS4.3

Development and Implementation of an Integrated Metocean Monitoring Infrastructure at the Pohang Maritime Unmanned Systems Testbed, Republic of Korea 

Muhea Jung, JunSeok Park, Yosup Park, GiDon Moon, JooYoun Kim, InSung Jang, and Juan Seo

The rapid advancement of unmanned maritime systems (UMS) necessitates rigorous validation protocols within complex and non-linear marine environments. This study presents the comprehensive development and operational framework of an integrated metocean monitoring system at the at the Pohang Maritime Unmanned Systems Testbed, Republic of Korea. The system is specifically engineered to generate high-fidelity environmental datasets, which are pivotal for the systematic performance validation and reliability assessment of unmanned surface vehicles (USVs) and unmanned underwater vehicles (UUVs). To bridge the gap between controlled simulations and highly dynamic real-sea conditions, an integrated observation infrastructure comprising four core components has been established to capture multi-scale environmental variables.

Specifically, the infrastructure incorporates four synergistic core components: (1) onshore meteorological stations equipped with high-precision sensors to collect critical atmospheric parameters, including wind vectors, precipitation, and solar radiation; (2) offshore observation buoys deployed at strategic locations to monitor real-time wave dynamics, including significant wave height and sea surface temperature (SST); (3) bottom-mounted Acoustic Doppler Current Profiler (ADCP) utilized to acquire high-resolution vertical profiles of current velocity and direction across the water column, alongside hydrostatic pressure and wave parameters; and (4) mobile observation platforms integrated with vessel-mounted ADCP, conductivity-temperature-depth (CTD) sensors for high-resolution vertical profiling, and an automatic weather station (AWS). These mobile units are instrumental for ensuring spatial flexibility and mitigate observational gaps that stationary sensors, thereby achieving a holistic 3D characterization of the marine environment.

Crucially, all observation data from these multifaceted platforms are synchronized and transmitted in real-time to a centralized onshore integrated control system via high-speed telemetry. This unified framework facilitates real-time situational awareness, enabling operators to visualize and analyze metocean trends instantaneously. By quantifying precise sea state levels and providing continuous environmental telemetry, the infrastructure significantly enhances operational safety during field trials. This allows for proactive risk mitigation and informed decision-making against hazardous maritime conditions. Ultimately, this multidimensional system facilitates the characterization of environmental variables, enabling a rigorous analysis of the operational envelopes and autonomous navigation efficiency of unmanned systems. This infrastructure is expected to serve as a cornerstone for the international standardization of marine unmanned technologies and the development of extensive empirical databases for machine learning-based motion control algorithms.


How to cite: Jung, M., Park, J., Park, Y., Moon, G., Kim, J., Jang, I., and Seo, J.: Development and Implementation of an Integrated Metocean Monitoring Infrastructure at the Pohang Maritime Unmanned Systems Testbed, Republic of Korea, EGU General Assembly 2026, Vienna, Austria, 3–8 May 2026, EGU26-20032, https://doi.org/10.5194/egusphere-egu26-20032, 2026.

EGU26-20285 | ECS | Posters on site | OS4.3

Improving long-term monitoring around the Shetland and Orkney archipelagos with high resolution modelling and data science.  

Lyuba Novi, Michela De Dominicis, Rory Benedict O’Hara Murray, Alan Hills, Alejandro Gallego, and Simon Waldman

High-resolution coastal ocean modelling is essential for understanding and managing complex coastal systems under increasing environmental and socio-economic pressures. We present the development of an unstructured FVCOM numerical model for the Shetland and Orkney archipelagos in the north of Scotland, with a hindcast run covering a 30-year period at unprecedented high resolution (~70m around the Shetland coast and hourly output), nested in the Scottish Shelf Model and fully-forced with 5.5km CERRA atmospheric data at hourly frequency. The unstructured grid allows to resolve the complex coastline and bathymetry that characterizes these areas. This region is paramount for the aquaculture industry, with Shetland alone making up for more than 20% of the Scottish salmon and more than 80% of Scottish mussel production, yet its energetic circulation, complex bathymetry, and strong coastal–ocean interactions make monitoring and prediction of potential environmental impacts particularly challenging. Combining numerical modelling with data science tools, we explore the system variability and complexity. This allows the identification of emergent patterns, dominant modes and changes that may otherwise be overlooked. Our work helps supporting more effective long-term monitoring and sustainable use of marine resources in a region increasingly affected by climate change.

How to cite: Novi, L., De Dominicis, M., O’Hara Murray, R. B., Hills, A., Gallego, A., and Waldman, S.: Improving long-term monitoring around the Shetland and Orkney archipelagos with high resolution modelling and data science. , EGU General Assembly 2026, Vienna, Austria, 3–8 May 2026, EGU26-20285, https://doi.org/10.5194/egusphere-egu26-20285, 2026.

EGU26-21107 | Orals | OS4.3

FOCCUS: Advances in Open-to-Coastal Ocean Monitoring and Forecasting 

Joanna Staneva and the FOCCUS EU Project Team

The FOCCUS project (Forecasting and Observing the Open-to-Coastal Ocean for Copernicus Users) aims to advance seamless open-to-coastal ocean monitoring and forecasting within the Copernicus framework. FOCCUS focuses on strengthening the integration of multi-platform observations, including satellite, in situ, and land-based remote sensing data, with high-resolution coastal and shelf-sea models and Artificial Intelligence (AI) enabled methodologies to improve the consistency, accuracy, and usability of coastal information.

Building and improving existing coastal monitoring capabilities and developing innovative coastal products is vital for coastal protection in the face of climate change. The integration of coastal observations with advanced hydrodynamic and coastal models and unified coastal management systems is essential to enhance monitoring and forecasting across the open ocean–coastal continuum. Recent technological advances further enable the implementation of novel numerical modelling approaches and AI-based methods, allowing seamless solutions across spatial scales and supporting pan-European applications. Within FOCCUS, recent developments address key challenges related to open-to-coastal interactions, the generation of enhanced coastal products, and the application of AI-supported approaches for data fusion, downscaling, and gap filling. These developments contribute to improved representation of coastal processes and increased robustness of coastal forecasting systems.

FOCCUS outcomes support a wide range of coastal applications, including pollution hazard and risk mapping, coastal erosion assessment, sustainable resource management, harmful algal bloom monitoring, ecosystem protection, support to Marine Protected Areas, and the assessment of natural hazards and extreme events under climate change. By reinforcing the connection between Copernicus marine core services and coastal user needs, FOCCUS contributes to the development of scalable, pan-European coastal products and decision-support tools, enhancing Europe’s capacity to monitor, forecast, and adapt to increasing coastal risks.

How to cite: Staneva, J. and the FOCCUS EU Project Team: FOCCUS: Advances in Open-to-Coastal Ocean Monitoring and Forecasting, EGU General Assembly 2026, Vienna, Austria, 3–8 May 2026, EGU26-21107, https://doi.org/10.5194/egusphere-egu26-21107, 2026.

EGU26-21484 * | Posters on site | OS4.3 | Highlight

Field Validation of the Low-Cost SailingBox for Reliable Ocean Monitoring in the Mediterranean 

Stephan Deschner

The SailingBox is a novel, reliable and user-friendly citizen-science device. Thanks to its compact, low-cost design, it can simultaneously measure up to six essential ocean variables. The SailingBox was tested on two separate sailing vessels in 2025, and here we present the preliminary results from a deployment on a Monaco Explorations sailing catamaran.

Surface water measurements were conducted in the Mediterranean Sea, in September-October 2025, during the Greece Mission, coordinated by Monaco Explorations. We deployed the SailingBox alongside a Pocket FerryBox system used for reference measurements, including temperature, salinity and pH. The resulting data provide insights into the variability of surface water properties along the boat's route from Monaco to Volos, Greece, and back. This study compares the data between the two platforms to assess the quality and consistency of the measurements, and to investigate the characteristics of the surface water dynamic during the stormy fall weather in the Mediterranean. Preliminary analysis indicates good agreement between the two measurement systems for temperature, salinity and density.

We present here the first demonstration of the citizen science version of the SailingBox on sailing vessels across variable conditions, and we demonstrate the potential of this miniaturized flow-through observation system for conducting autonomous, low-power and reliable observations in the surface coastal ocean.

How to cite: Deschner, S.: Field Validation of the Low-Cost SailingBox for Reliable Ocean Monitoring in the Mediterranean, EGU General Assembly 2026, Vienna, Austria, 3–8 May 2026, EGU26-21484, https://doi.org/10.5194/egusphere-egu26-21484, 2026.

EGU26-22155 | Orals | OS4.3

Impact of Space-Time Sampling:  Gliders vs. Profiling Floats 

Patrick Hogan, James Reagan, Alexey Mishonov, and Tim Boyer

In this study, we present ocean heat content/salt content results with and without gliders, in part concentrating on the western North Atlantic, including the continental shelf area where there are typically numerous glider observations.  The impact that the disparity in the number of these two platforms has on the calculation of Upper Ocean Heat Content at NCEI is discussed.  Because gliders (vs. profiling floats)  generally occupy small geographic regions on short time scales, the impact on global estimates vs. local estimates is examined in the context of those two ocean observing systems.  We also look at the impact of NAS UGOS profiling floats vs. non UGOS floats vs. gliders in the Gulf of Mexico.  The NAS program has funded the effort that has resulted in the collection of over 9000 ocean in situ profiles of temperature and salinity since 2019, and the value of those profiles is assessed both in terms of Ocean Heat Content, as well as ocean model forecast skill.  Again, the different space-time sampling of gliders vs. profiling floats is highlighted.  Finally, an overview of fully blended ocean products, including glider observations that come through the IOOS glider DAC to NCEI, Argo, and other observations, is presented. 

How to cite: Hogan, P., Reagan, J., Mishonov, A., and Boyer, T.: Impact of Space-Time Sampling:  Gliders vs. Profiling Floats, EGU General Assembly 2026, Vienna, Austria, 3–8 May 2026, EGU26-22155, https://doi.org/10.5194/egusphere-egu26-22155, 2026.

EGU26-22599 | ECS | Orals | OS4.3

Modeling dissolved oxygen for coastal monitoring and forecasting 

Marco Lo Iacono, Matilde Pattarino, Francesco Caligaris, Gianfranco Durin, Andrea Bordone, Gianfranco Raiteri, Tiziana Ciuffardi, Chiara Lombardi, Francesca Pennecchi, and Marco Coïsson
The effectiveness of monitoring and forecasting dissolved oxygen (DO) levels in coastal regions is pivotal in the assessment of seawater quality, marine ecosystem activity, and aquaculture management. We propose a multi-stage model for coastal DO monitoring and forecasting, leveraging hourly-resolution data of seawater properties (e.g. water temperature, salinity, turbidity, pH, and velocity) collected using an Internet of Underwater Things (IoUT) sensor network. The sensors are located in the ”Smart Bay Santa Teresa”, northwestern Italy, near La Spezia. The measurement campaign started on March 2021 and is still ongoing in 2026. The collected data exhibit typical challenges of IoUT monitoring, such as power supply issues and loss of connectivity.
 
IoUT data are integrated with meteorological data provided by nearby stations (e.g. solar radiation, atmospheric pressure, air temperature, wind, rain), Copernicus Marine data referring to offshore conditions (including both blue and green seawater properties), and freshwater data from nearby rivers monitoring stations.
 
To reconstruct the missing data, we adopted separated regression models for the water temperature, salinity and oxygen. Each model is based on a residual deep learning approach using neural networks: the network is provided with an initial user-defined estimate, allowing the net to focus on unseen dynamics and unexpected behaviour. The adopted residual approach has demonstrated robustness in presence of large gaps in the data.
 
Once continuous monitoring is ensured, forecast DO levels over a horizon of a few days is performed. We currently focus on neural networks-based models, and tree-based regressors such as LightGBM. All these methods are benchmarked against baseline statistical models, such as Prophet and SARIMA. The tested models have shown encouraging ability to capture time-varying daily seasonal components, as well as extreme local events, which is of particular interest during peak blooms and hypoxia events. 

How to cite: Lo Iacono, M., Pattarino, M., Caligaris, F., Durin, G., Bordone, A., Raiteri, G., Ciuffardi, T., Lombardi, C., Pennecchi, F., and Coïsson, M.: Modeling dissolved oxygen for coastal monitoring and forecasting, EGU General Assembly 2026, Vienna, Austria, 3–8 May 2026, EGU26-22599, https://doi.org/10.5194/egusphere-egu26-22599, 2026.

EGU26-1257 | ECS | Posters on site | GI4.3

An Automated Morphometric Approach for Global Lentic and Lotic Classification of Inland Waters  

Ankit Sharma, Mukund Narayanan, and Idhayachandhiran Ilampooranan

The distinction of lentic (still) and lotic (flowing) inland waters is fundamental for understanding ecosystem functions, hydrodynamic behavior, nutrient cycling, and biogeochemical exchanges across terrestrial and aquatic interfaces. These systems influence carbon storage, sediment balance, biodiversity support, water residence time, and regional climate regulation, making accurate separation essential for large-scale hydrological assessments. However, existing classification approaches often depend on site-specific information, manual interpretation, or large training datasets, and commonly struggle to classify inland waters smaller than 3 hectares due to resolution limitations and insufficient annotated samples. This work presents an Automated Data Efficient Morphometric Approach (ADEMA) for classifying inland waters down to 0.09 ha (single LANDSAT pixel) using multi-dimensional morphometric interpretations derived using the Global Surface Maximum Extent (GSMW) dataset. The approach was trained and validated using 17,391 expert-labeled samples from 66 geographically diverse locations across multiple climate zones, varied topographies, and hydrological regimes. Further, ADEMA was benchmarked against optimized machine learning, deep learning, and global classification products. Results showed that across all size classes (small: <10 ha, medium:10-1,000 ha, and large: >1,000 ha), ADEMA provided comparable F1 scores (94%) to machine and deep learning models with minimal omission (2%), demonstrating its ability to achieve reliable classification with significantly lower computational and data requirements. A multi-decadal evaluation from 1991 to 2021 showed stable accuracy, highlighting temporal ADEMA’s robustness (F1 score = 92%). When compared to global classification products, ADEMA achieved substantially higher accuracy (average F1 score: 97% vs. 62%), especially for small and medium inland waters that are often underrepresented in global datasets. The method offers a data-efficient and automated solution suitable for regional to global hydrography. However, the framework excludes inland waters >10,000 ha to maintain computational feasibility, limiting coverage of large systems. Single-pixel detections (~0.09 ha) are less reliable due to noise, vegetation, and GSMW uncertainty, with accuracy stabilizing above ~0.5 ha. With further advancements, ADEMA could improve global open-water inventories, guide conservation strategies, and strengthen our understanding of how small inland waters collectively shape hydrology and ecosystem resilience across different environments.

How to cite: Sharma, A., Narayanan, M., and Ilampooranan, I.: An Automated Morphometric Approach for Global Lentic and Lotic Classification of Inland Waters , EGU General Assembly 2026, Vienna, Austria, 3–8 May 2026, EGU26-1257, https://doi.org/10.5194/egusphere-egu26-1257, 2026.

EGU26-3118 | ECS | Orals | GI4.3

Assessment of chemical contamination of condensed water from Atmospheric Water Harvesting 

Thomas Merlet, Amira Doggaz, Yan Ulanowski, Stéphane Laporte, Mohamed Ali Abid, and Bérengère Lebental

As access to drinking water is a major public health issue worldwide, many technologies have emerged for water harvesting from alternative sources. Among these, active atmospheric water harvesting technologies, known as atmospheric water generators (AWGs), are attracting growing interest as a decentralised water production system. However, the water quality they produce is known to be influenced by the ambient air pollution, but scientific data on air-to-water transfer is limited, stressing the need for assessment tools to support monitoring and management strategies. This difficulty is exacerbated by the complexity of atmospheric chemistry and the large number of compounds present in the air, which far exceeds the number of compounds regulated in drinking water. To address this challenge, we present the first systematic methodology for risk assessment of air-to-AWG water transfer and apply it to the Greater Paris area. First a bibliographic inventory of the compounds found in the air in the region of interest and of their maximum reported concentration was created. For each compound, empirical (when available) or theoretical air-to-water transfer models were applied to determine the upper concentration expected in AWG water. The risk level of each compound was determined based on the ratio between this concentration and experimental or extrapolated guideline values for ingestion toxicity. In the Greater Paris area, while as many as 193 air pollutants were inventoried with quantified ground-level atmospheric concentrations over the last 15 years, only about half of them presented a risk of being present in AWG water above the set thresholds. Of these, around 20 - a much more manageable number of species to monitor - may reach concentration levels two orders of magnitude or more above the threshold values and may require priority consideration. These include ammonium, Polycyclic Aromatic Hydrocarbons -PAHs- (e.g., phenanthrene), pesticides (e.g., prosulfocarb), organic acids (e.g., acetate), phenols (e.g., benzenediol), and aldehydes (e.g., acrolein). The presence of some of these species linked to vehicle emissions was studied experimentally in the water of an AWG exposed to varying levels of diesel emissions through integrated water and air quality monitoring, both in-situ and in Sense-City climatic chamber (https://sense-city.ifsttar.fr/). A large number of species were discovered for the first time in AWG water, notably numerous PAHs and acrylamide, while several were observed to exceed EU regulatory thresholds (pH, ammonium, nitrite, Cu, Al, Mn, Pb, Ni, benzo(a)pyrene, benzene and acrylamide), some of them for the first time (Cu, acrylamide). The composition of raw AWG water was found to be directly correlated with exhaust levels through NOx and TVOC concentrations with turbidity, total organic content, nitrite, BTEX, several metals and most PAHs. Acrylamide concentration also featured correlation with the exhaust pollution, a surprising, as of yet unreported, finding in air or water that thus needs to be extensively confirmed. Overall, the study confirms the strong influence of air pollution on AWG water but its viability despite extreme pollution conditions.

How to cite: Merlet, T., Doggaz, A., Ulanowski, Y., Laporte, S., Abid, M. A., and Lebental, B.: Assessment of chemical contamination of condensed water from Atmospheric Water Harvesting, EGU General Assembly 2026, Vienna, Austria, 3–8 May 2026, EGU26-3118, https://doi.org/10.5194/egusphere-egu26-3118, 2026.

EGU26-7210 | ECS | Posters on site | GI4.3

Monitoring of the saline wedge in the rivers of the Ferrara province (Emilia Romagna region,Italy). 

Francesca Fongo and Enzo Rizzo

Saltwater intrusion threatens coastal ecosystems and water resources globally, intensified by
climate change. Rising sea levels and reduced river flows disrupt the water balance in estuarine
zones, allowing seawater to penetrate upstream into rivers and coastal aquifers. Studies predict a
9.1% global average increase in saltwater intrusion under high emissions scenarios, with extreme
events becoming up to 25 times more frequent [2]. The Po River Delta exemplifies this
vulnerability. The Ferrara area, characterized by minimal slopes and elevations mostly below sea
level, is particularly exposed. Projections indicate the Po di Goro estuary could experience up to
63% annual increase in saltwater intrusion, reaching 120% in summer [6]. The 2022 drought
demonstrated system fragility, with saltwater compromising irrigation and domestic water
supplies. Groundwater aquifers face additional stress from excessive extraction and reduced
natural recharge [1], affecting drinking water quality, agriculture, natural habitats, and soil
integrity. Traditional monitoring relies on point measurements of electrical conductivity using
boat-mounted probes, providing inadequate spatial and temporal resolution. Geophysical
methods—particularly electrical resistivity tomography (ERT) and electromagnetic (FDEM)
surveys—offer rapid, high-resolution alternatives. Previous research demonstrated the
effectiveness of combined ERT-FDEM approaches in the Po di Goro for monitoring saltwater
wedge advancement [4]. Integration of multiple geophysical techniques enables multi-scale
characterization [3].
This PhD project develops an integrated monitoring and predictive modeling system for saltwater
wedge intrusion in Ferrara, combining advanced geophysical methods with machine learning.
Building on long-term FDEM monitoring (2022-2025) in the Po di Goro, the project extends to
other Ferrara rivers and incorporates additional methods (ERT, GPR).
Expected outcomes include: (1) precise mapping of saltwater wedge extent, depth, and temporal
evolution; (2) machine learning-based predictive tools to forecast intrusion evolution; (3) decision-
support tools for sustainable water resource management, agriculture, and territorial planning,
with methodologies transferable to other estuaries globally.


The project addresses a critical gap: the absence of systematic monitoring systems and reliable
predictive tools. Increasing salinization frequency underscores the urgency for robust predictive
capabilities enabling preventive interventions. The project responds to the 2022 Po River basin
water crisis, offering practical solutions through informed policy on coastal defense, flood
mitigation, subsidence reduction, and intrusion control [5].
References
[1] Crestani, E. (2022). Large-Scale Physical Modeling of Salt-Water Intrusion. Water, 14(8), 1183.
[2] Lee, J., et al. (2025). Global increases of salt intrusion in estuaries. Nature Communications, 16,
3444.
[3] Mansourian, D., et al. (2022). Geophysical surveys for saltwater intrusion assessment. Journal
of the Earth and Space Physics, 48(3), 331–341.
[4] Rizzo, E., et al. (2023). DC and FDEM salt wedge monitoring of the Po di Goro river. EGU23-
5297.
[5] Simeoni, U. (2009). A review of the Delta Po evolution. Geomorphology, 107(1–2), 64–71.
[6] Verri, G., et al. (2024). Salt-wedge estuary's response to rising sea level. Frontiers in Climate, 6,
1408038.

How to cite: Fongo, F. and Rizzo, E.: Monitoring of the saline wedge in the rivers of the Ferrara province (Emilia Romagna region,Italy)., EGU General Assembly 2026, Vienna, Austria, 3–8 May 2026, EGU26-7210, https://doi.org/10.5194/egusphere-egu26-7210, 2026.

EGU26-10394 | Orals | GI4.3

Characterization of Offshore Freshened Groundwater systems on the Ross sea shelf 

Francesco Chidichimo, Ariel Tremayne Thomas, Michele De Biase, Salvatore Straface, and Aaron Micallef

Offshore Freshened Groundwater (OFG) is increasingly recognized as an important component of continental shelf hydrogeology, yet its physical structure, geochemical evolution, and preservation mechanisms remain poorly documented in polar settings. This study characterizes OFG systems on the Ross Sea shelf using borehole porewater data from IODP (Integrated Ocean Drilling Program) Sites U1522 and U1524, with the aim of resolving their vertical structure, origin, and diagenetic state.

Depth-resolved porewater samples were analyzed for chloride, stable water isotopes (δ¹⁸O, δ²H), major cations and anions, and redox-sensitive species. Lithological information was used to assess stratigraphic controls on fluid distribution. A groundwater transport model was applied to evaluate the relative roles of diffusive and advective processes in shaping present-day porewater profiles.

Both sites host vertically stratified OFG systems comprising a saline, marine-influenced upper unit, an intermediate transition zone, and a deeper freshened interval preserved beneath finer-grained sediments. Downcore decreases in chloride and progressive depletion of δ¹⁸O and δ²H indicate dilution by a non-marine water source, while elevated Br/Cl ratios and smooth concentration gradients support long residence times and limited modern exchange. Redox profiles show sulfate depletion, ammonium enrichment, and methane production at depth, indicating active diagenetic alteration of the fluids. The transport model demonstrates that diffusion is the dominant control on present-day tracer distributions, with only minor or negligible vertical flow patterns.

The Ross Sea OFG systems at Sites U1522 and U1524 are therefore laterally extensive, vertically stratified, and geochemically evolved bodies, preserved through stratigraphic confinement and diffusion-dominated transport. Their characteristics reflect long-term isolation and water-rock interaction rather than active recharge phenomena, highlighting OFG as a stable subsurface reservoir and an archive of past hydrogeological conditions on polar continental shelves.

How to cite: Chidichimo, F., Thomas, A. T., De Biase, M., Straface, S., and Micallef, A.: Characterization of Offshore Freshened Groundwater systems on the Ross sea shelf, EGU General Assembly 2026, Vienna, Austria, 3–8 May 2026, EGU26-10394, https://doi.org/10.5194/egusphere-egu26-10394, 2026.

EGU26-11204 | ECS | Orals | GI4.3

Preliminary results of a cost-effective optical imaging and deep learning system for algal bloom monitoring in Lake Lugano  

alessandro centazzo, daniele strigaro, claudio primerano, massimiliano cannata, and camilla capelli

Algal blooms represent a significant challenge for the sustainable management of freshwater habitats, strongly affecting water quality, biodiversity, ecosystem functioning, and human activities. Their occurrence is often driven by complex interactions between natural processes and anthropogenic pressures [1–3]. Consequently, there is a growing demand for monitoring strategies capable of capturing the spatial and temporal variability of algal dynamics while supporting a holistic assessment of water habitat health. Traditional monitoring approaches typically rely on point-scale in situ measurements or satellite remote sensing products, which, although essential, are often limited by spatial resolution, revisit frequency, operational costs, or deployment constraints [4]. In this context, low-cost, image-based sensing systems represent a promising complementary solution, enabling continuous and visually explicit observations at local to regional scales. 

This contribution presents preliminary results from an in situ monitoring system based on cost-effective optical imaging cameras combined with deep learning-based image analysis. The proposed approach is developed within the framework of the WINCA4TI (Water Interactions with Nature, Climate and Agriculture for Ticino) Interreg project, which aims to foster cross-border innovation in environmental monitoring through low-cost sensing technologies and data-driven methods. The system is designed to complement high-end in situ instrumentation and satellite observations by providing flexible, scalable, and cost-effective monitoring capabilities, with a specific focus on the automatic characterization of algal bloom phenomena to support near-real-time detection and decision making. 

The monitoring system relies on compact cameras and optical sensors operating in the visible and near-infrared spectral ranges, deployed on fixed platforms suitable for long-term observations and on-site (edge) processing. Image data are initially combined with in situ measurements to build a reliable reference dataset, which is subsequently exploited to enable image-only monitoring. The computational workflow integrates image preprocessing, including illumination normalization and water surface masking, with deep learning–based image segmentation to derive spatial and temporal indicators of algal presence, surface coverage, and bloom dynamics. 

Preliminary results demonstrate the capability of the proposed approach to capture fine-scale spatial and temporal patterns of algal blooms, bridging the gap between localized field measurements and large-scale remote sensing products. The findings suggest that low-cost image-based monitoring systems can enhance the responsiveness and resilience of water management strategies, particularly where traditional monitoring is constrained by cost, logistics, or spatial coverage. 


  • Strigaro D., Capelli C. (2024). An open early-warning system prototype for managing and studying algal blooms in Lake Lugano. https://doi.org/10.5194/isprs-archives-XLVIII-4-W12-2024-143-2024 
  • Bosse K. R., Fahnenstiel G. L., Buelo C. D., Pawlowski M. B., Scofield A. E., Hinchey E. K., & Sayers M. J. (2024). Are harmful algal blooms increasing in the Great Lakes? https://doi.org/10.3390/w16141944 
  • Zeng K., Gokul E. A., Gu H., Hoteit I., Huang Y., & Zhan P. (2024). Spatiotemporal expansion of algal blooms in coastal China seas.  https://doi.org/10.1021/acs.est.4c01877 
  • Ogashawara I. (2019). Advances and limitations of using satellites to monitor cyanobacterial harmful algal blooms. https://doi.org/10.1590/S2179-975X0619 

How to cite: centazzo, A., strigaro, D., primerano, C., cannata, M., and capelli, C.: Preliminary results of a cost-effective optical imaging and deep learning system for algal bloom monitoring in Lake Lugano , EGU General Assembly 2026, Vienna, Austria, 3–8 May 2026, EGU26-11204, https://doi.org/10.5194/egusphere-egu26-11204, 2026.

EGU26-13495 | Posters on site | GI4.3

Advances in supraglacial lake detection and characterization on the Nansen Ice Shelf from active microwave and visible light satellite remote sensing 

Francesco De Biasio, Stefano Vignudelli, Stefano Zecchetto, Matteo Zucchetta, Emiliana Valentini, Marco Salvadore, and Roberto Salzano

The evolution of cryospheric components (snow cover, ice, and meltwater) plays a fundamental role in regulating energy exchanges between the atmosphere and ice shelves and represents a key indicator of climate change impacts in remote polar regions. Within the framework of the HOLISTIC (Holistic Overview of the supraglacial Lake–Ice–Snow Timing and Climate causality) project, funded by the Italian National Antarctic Research Program, we present an advanced multi-sensor assessment of supraglacial lake (SGL) dynamics over the Nansen Ice Shelf (Victoria Land, Antarctica).

We adopted a synergistic remote sensing approach, aimed at integrating active microwave observations from satellite SAR and radar altimetry missions with optical imagery. This multi-frequency and multi-platform strategy investigates the possibility of detection, mapping and temporal monitoring of SGL position and extent and spatial distribution under all-weather conditions and across different spatial and temporal scales. HH-polarized SAR data proved effective in identifying surface meltwater signatures and characterizing seasonal lake evolution, despite polarization limitations, while optical data provided complementary constraints on lake morphology and surface hydrology during cloud-free periods. The seasonal melt and refreezing processes of SGL units were further investigated by leveraging the combined revisit time of operational sensors such as Sentinel-2 and Landsat, together with dedicated tasking missions like PRISMA, providing a more comprehensive understanding of lake dynamics over time.

A dedicated processing chain for Sentinel-3 altimetry L1A individual echoes was implemented using the PISA algorithm (Abileah and Vignudelli, 2021, https://doi.org/10.1016/j.rse.2021.112580). This allowed the retrieval of localized elevation anomalies associated with bright targets, mountainous targets and supraglacial water bodies, and the characterization of surface roughness changes presumably linked to melt and drainage processes, as well as to changes in snow density and surface slope.

The combined analysis highlights the strong coupling between snowpack evolution, surface energy feedback, and the formation and drainage of SGLs, providing new insights into ice-shelf surface hydrology and its seasonal to interannual variability. The results represent a step forward in quantifying SGL properties using active microwave and passive/active optical techniques and offer a valuable testbed for existing and future altimetry missions, such as NASA's ICESat-2 and ESA’s CRISTAL missions, aimed at directly retrieving snow depth. The capabilities of high-resolution satellite-born SAR sensors are also expected to benefit from this study, in detecting and monitoring snowpack changes, particularly those resulting from surface snow melt and the formation of supraglacial lakes. Supraglacial lakes emerge as particularly suitable targets for assessing visible light as well as Ka-, Ku- and C-band scattering contributions and for advancing the understanding of snow–ice–water interactions in polar environments.

How to cite: De Biasio, F., Vignudelli, S., Zecchetto, S., Zucchetta, M., Valentini, E., Salvadore, M., and Salzano, R.: Advances in supraglacial lake detection and characterization on the Nansen Ice Shelf from active microwave and visible light satellite remote sensing, EGU General Assembly 2026, Vienna, Austria, 3–8 May 2026, EGU26-13495, https://doi.org/10.5194/egusphere-egu26-13495, 2026.

EGU26-14117 | ECS | Orals | GI4.3

Coastal and Land Use Variations of Burullus Lake, Egypt Using Remote Sensing  

Elsayed Abdelsadek, Salwa Elbeih, and Abdelazim Negm

Monitoring lakes is traditionally expensive, but satellite technology offers a more affordable solution. Human activities are currently damaging water bodies worldwide, including Egypt's coastal lakes. This study focuses on Burullus Lake, Egypt’s second-largest lake in the northern Mediterranean. Researchers used Remote Sensing and Geographic Information Systems (GIS) to track changes in the coastline and land use. The authors analyzed Landsat images from 1984 to 2019 and compared 2019 Landsat data with Sentinel-2A imagery. They also performed field visits to confirm their findings. Using a supervised classification method, they identified eight categories, including seawater, urban areas, and fish farms.

The results show significant changes between 1984 and 2019: the lake’s open water decreased by 16%, and floating plants dropped by 52%. Conversely, agricultural land expanded by 648 km^2, and fish farms grew by 290 km^2. These updated maps help officials identify where human activity is most harmful. This data is essential for restoring the lake and meeting Sustainable Development Goals (SDGs).

Keywords: Remote Sensing & GIS, Environmental Monitoring, Land Use/Land Cover (LULC), Change Detection, Burullus Lake, Egypt,

How to cite: Abdelsadek, E., Elbeih, S., and Negm, A.: Coastal and Land Use Variations of Burullus Lake, Egypt Using Remote Sensing , EGU General Assembly 2026, Vienna, Austria, 3–8 May 2026, EGU26-14117, https://doi.org/10.5194/egusphere-egu26-14117, 2026.

EGU26-14855 | Posters on site | GI4.3

Benchmarking UAV multispectral sensors and machine learning for water quality estimation 

Caio Mello, Daniel Salim, Bernardo Souza, Gabriel Pereira, and Camila Amorim

The sustainable management of water resources in anthropogenic contexts requires a holistic transition from mere monitoring to comprehensive assessments of water habitats. Urban reservoirs are particularly vulnerable ecosystems, where pressures such as agricultural runoff and untreated sewage discharge drive eutrophication, compromising water quality. Traditional monitoring methods often lack the spatiotemporal resolution required to capture the complex dynamics of these environments. To address this gap, this study evaluates the efficacy of close-range remote sensing combined with Machine Learning (ML) and Explainable Artificial Intelligence (XAI) for estimating optically active water quality parameters (turbidity, chlorophyll-a, and phycocyanin). The research was conducted at the Ibirité Reservoir (Minas Gerais, Brazil), a highly eutrophic urban system serving as a petrochemical industry water supply. Ten monthly field campaigns (August 2024 to May 2025) were conducted, covering both dry and wet seasons, to capture seasonal variability. Data acquisition employed Unmanned Aerial Vehicles (UAVs) equipped with two distinct multispectral sensors: the DJI Phantom 4 Multispectral (P4M – 5 bands) and the MicaSense RedEdge Dual-P (MSR – 10 bands). This setup allowed for a comparative analysis of spectral resolution impacts on model performance. The methodology tested three ML algorithms: Random Forest, CatBoost, and XGBoost. To ensure physical consistency, SHAP (SHapley Additive exPlanations) values were used to interpret the models. This ML-XAI approach assessed: (1) the comparative performance of each sensor and algorithm; and (2) the robustness of the models by identifying the most influential spectral bands for each parameter. Results indicate that ensemble learning algorithms, specifically Random Forest and CatBoost, consistently outperformed others across datasets. The MSR sensor achieved the highest overall accuracy, particularly for Phycocyanin estimation using Random Forest (R² = 0.93), compared to the P4M's best result for the same parameter (R² = 0.90). Explainable AI analysis revealed the physical drivers behind this performance: for Phycocyanin, the MicaSense models relied heavily on the specific 717 nm and 705 nm (RedEdge) bands. This explains the superior performance, as these narrow bands better resolve the specific spectral features of cyanobacteria compared to the single RedEdge band available on the DJI sensor. Conversely, for Chlorophyll-a, the NIR (842 nm) and Red (650 nm) bands were the dominant predictors. Since both sensors possess these bands, the performance gap was narrower (R² = 0.79 for MSR vs. 0.77 for P4M), validating the cost-effectiveness of the 5-band sensor for general pigment monitoring. However, for Turbidity, the additional spectral resolution of the MSR (specifically the 717 nm band) proved decisive, raising accuracy to R² = 0.84 compared to 0.78 for the P4M. Findings demonstrate that integrating high-resolution multispectral sensing with interpretable ensemble learning offers a scalable and physically consistent tool for monitoring water habitat health, supporting data-driven decision-making in complex urban environments.

How to cite: Mello, C., Salim, D., Souza, B., Pereira, G., and Amorim, C.: Benchmarking UAV multispectral sensors and machine learning for water quality estimation, EGU General Assembly 2026, Vienna, Austria, 3–8 May 2026, EGU26-14855, https://doi.org/10.5194/egusphere-egu26-14855, 2026.

EGU26-18033 | ECS | Orals | GI4.3

MaD-OPS: Monitoring & Detection of Organic Pollution from Sewage: Implementation of an agile sensing network for informing river health 

Connie Tulloch, Rosie Perrett, Matthew Coombs, Izaak Stanton, John Attridge, Robin Thorn, Lyndon Smith, and Darren Reynolds

Rivers are under pressure from many different sources, including farming and rural land use, wastewater treatment, towns and transport. In England, very few rivers achieve good ecological status, and none achieve good chemical status. This comes after many years of exploiting our freshwater systems. In 2024 there were more than 450,000 combined sewer overflow discharges in England, totalling over 3.5 million hours of spills. This sewage has direct implications on ecological and human health, increasing the environmental contaminant load in rivers. In response, Section 82 of the Continuous Water Quality Monitoring Programme mandates continuous monitoring of freshwater systems, with scope for future expansion of monitored parameters.  

Current water quality monitoring relies heavily on infrequent spot sampling, often missing key impact events, with limited spatiotemporal context. The MaD-OPS project has developed a novel sensing network for continuous monitoring of biological, chemical, and physical water quality parameters. A key focus is to demonstrate the value of a new fluorescence-based optical sensor for detecting organic pollution and bacterial contamination within a demonstrator catchment, with the potential to reveal underlying biogeochemical cycling processes. 

To isolate different pollution sources, sensor nodes have been deployed at multiple points along a river. Alongside continuous sensor data, regular spot sampling is being carried out for faecal indicator organisms, BOD₅, nutrient analysis, and microbial community profiling to provide robust ground-truthing.  

The project aims to develop a user-friendly dynamic Water Quality Index (WQI) that integrates high-frequency sensor data with machine learning, for real time assessment of river health that can be used by citizen scientists, community groups, and regulators alike. Using a novel dynamic baseline approach, the WQI will assess each sensor node relative to the least impacted section of the river at any given time.  

Preliminary results demonstrate that continuous monitoring captures point source pollution and hydrological events that are not detected through spot sampling alone. Comparison between the dynamic headwater baseline and downstream sensor nodes highlights the direct impact of point source events on river health.  

We present progress in deploying the sensing network, early insights into river health derived from high-frequency data, and how these findings are informing the development of the WQI framework. 


How to cite: Tulloch, C., Perrett, R., Coombs, M., Stanton, I., Attridge, J., Thorn, R., Smith, L., and Reynolds, D.: MaD-OPS: Monitoring & Detection of Organic Pollution from Sewage: Implementation of an agile sensing network for informing river health, EGU General Assembly 2026, Vienna, Austria, 3–8 May 2026, EGU26-18033, https://doi.org/10.5194/egusphere-egu26-18033, 2026.

EGU26-18415 | ECS | Posters on site | GI4.3

Selective Fluorescence Sensing of Methylene Blue Dye Using Yeast-Based Carbon Dots: Experimental and Computational Study 

Neeraj Chauhan, Stefan Krause, Manjinder Singh, and Amrit Pal Toor

Synthetic dyes released from textile and related industries are a major source of aquatic pollution and can pose risks to ecosystem and human health. Methylene blue (MB), a widely used cationic thiazine dye in industrial dyeing and pharmaceutical applications, is of particular concern because it can persist in water and affect photosynthetic activity, aquatic biodiversity, and water quality. However, monitoring dye contamination often relies on laboratory-based analytical techniques that are costly and time-consuming, limiting rapid assessment in field conditions.

In this study, yeast powder (a low-cost and renewable bio-precursor) was converted into fluorescent carbon dots (C-dots) using a simple one-pot hydrothermal synthesis route. The as-prepared C-dots showed excitation-dependent fluorescence emission with a clear red shift from 360 to 460 nm. Structural and chemical characterisation using UV–Vis, TEM, XPS, XRD, FTIR and Raman spectroscopy confirmed quasi-spherical particles with an average size of 3–8 nm and an amorphous carbon structure enriched with oxygen-containing functional groups. The C-dots exhibited high stability across a wide range of pH and salinity (NaCl), under prolonged UV exposure and during storage.

The C-dots were then applied as a fluorescence-based sensor for rapid and selective detection of methylene blue in water. A strong decrease in fluorescence intensity was observed upon addition of MB, with a linear response in the range of 1 ppb to 1 ppm. The sensor achieved a limit of detection (LOD) of 73.9 ppb and a limit of quantification (LOQ) of 246.4 ppb, demonstrating high sensitivity. The sensing mechanism was attributed to fluorescence quenching dominated by FRET, supported by experimental spectroscopy and computational investigations. Theoretical analysis further indicated that π–π stacking and hydrogen bonding interactions between MB molecules and the C-dot surface contribute to strong binding and enhanced selectivity.

Finally, the developed sensor was successfully applied to real water samples, showing satisfactory recoveries between 96% and 116%. Overall, this work demonstrates a green, cost-effective and highly sensitive fluorescent nanosensor for MB monitoring, offering strong potential for real-time water quality assessment and pollution control in freshwater and wastewater systems.

How to cite: Chauhan, N., Krause, S., Singh, M., and Toor, A. P.: Selective Fluorescence Sensing of Methylene Blue Dye Using Yeast-Based Carbon Dots: Experimental and Computational Study, EGU General Assembly 2026, Vienna, Austria, 3–8 May 2026, EGU26-18415, https://doi.org/10.5194/egusphere-egu26-18415, 2026.

EGU26-18591 | ECS | Orals | GI4.3

Monitoring Contaminants of Emerging Concern and eDNA off the Coast of Ireland Using Autonomous Surface Vehicles: A Spatiotemporal Study 

Nicolette Sale, Fiona Regan, Anne Parle-McDermott, Michelle Wosinski, Gerard Dooly, Luke Griffin, Dinesh Babu Duraibabu, Paulo Prodöhl, and M. Isabel Cadena-Aizaga

Contaminants of emerging concern (CECs), including pharmaceuticals, pesticides, and PFAS, have attracted increased attention due to their potential to affect the environment and human health. At the same time, environmental DNA (eDNA) can detect and monitor biological communities and can complement chemical monitoring to give a more comprehensive picture of ecosystem status. The simultaneous sampling of CECs and eDNA presents significant technical and logistical challenges and requires very sensitive techniques. Autonomous surface vehicles (ASVs) offer a flexible platform for monitoring coastal water systems, particularly when repeated or prolonged sampling is required. Their use is increasingly relevant for supporting emerging biological and chemical monitoring techniques. Despite its potential, few studies investigate seawater ecosystems using this combined approach. 


This work involves innovative monitoring of Irish coastal waters using an interdisciplinary approach that integrates expertise in engineering, chemistry, and biology. Research involving an ASV capable of reliable dynamic positioning during extended sampling operations will be shown alongside sensitive analytical techniques for investigating CECs and eDNA in seawater matrices. Results will show strategies to address a key challenge for ASV-based eDNA sampling of maintaining precise station for adequate periods while water is actively pumped through our filtration systems. Study observations include methods for sample handling to overcome the challenge of low target analyte concentration degradation, and contamination.

How to cite: Sale, N., Regan, F., Parle-McDermott, A., Wosinski, M., Dooly, G., Griffin, L., Duraibabu, D. B., Prodöhl, P., and Cadena-Aizaga, M. I.: Monitoring Contaminants of Emerging Concern and eDNA off the Coast of Ireland Using Autonomous Surface Vehicles: A Spatiotemporal Study, EGU General Assembly 2026, Vienna, Austria, 3–8 May 2026, EGU26-18591, https://doi.org/10.5194/egusphere-egu26-18591, 2026.

EGU26-18973 | Posters on site | GI4.3

Quantifying early seagrass growth with UAV imagery 

Matteo Albéri, Mohamed Abdelkader, Cinzia Cozzula, Federico Cunsolo, Nedime Irem Elek, Engin Can Esen, Ghulam Hasnain, Fabio Mantovani, Michele Mistri, Cristina Munari, Maria Grazia Paletta, Marco Pezzi, Kassandra Giulia Cristina Raptis, Andrea Augusto Sfriso, Adriano Sfriso, and Virginia Strati

Within the framework of proximal sensing, monitoring early-stage seagrass colonization in turbid waters presents challenges due to the spectral similarity between the dwarf eelgrass Zostera noltei and ephemeral macroalgae. A preliminary study previously demonstrated the utility of high-resolution Unmanned Aerial Vehicle (UAV) imagery for general monitoring through visual inspection (Mistri et al., 2025). However, the reliance on manual detection and known transplantation coordinates limits the scalability of the approach. In this study, we take a further step to overcome these limitations by applying pixel-based supervised classification to high-resolution orthomosaics. This allows for precise and quantitative tracking of the spatial evolution of seagrass meadows over time.

Ultra-high-resolution aerial surveys were conducted in the Caleri Lagoon (Po River Delta, Italy) using a DJI Air 2S UAV flown at an altitude of 7 meters, achieving a theoretical ground sampling distance of 0.2 cm/pixel. The collected imagery was processed into georeferenced orthomosaics and analyzed using a supervised Maximum Likelihood Classification algorithm based on Bayes’ theorem. To isolate the spectral signal of the target seagrass, the probabilistic framework incorporated 40 regions of interest for each of five classes: seagrass, green algae, red algae, shadow, and background. To reduce high-frequency 'salt-and-pepper' noise, a post-classification Sieve filter (20×20 pixel window) was applied, refining patch segmentation based on neighborhood mode.

Multitemporal analysis revealed a distinct non-linear expansion trajectory within the 0.5-hectare study area. Starting from a planted footprint of just 2.5 m² (~0.05% of the study area) in August 2023, the seagrass colonies expanded to 60 m² (1.2%) by June 2024, reaching approximately 716 m² (14%) by October 2025.

These results demonstrate that combining low-altitude UAV photogrammetry with probabilistic classification offers a highly repeatable and scalable framework for quantifying restoration dynamics. This methodology effectively overcomes the limitations of manual monitoring, enabling the detection of the subtle, non-linear growth patterns typical of early-stage colonization.

How to cite: Albéri, M., Abdelkader, M., Cozzula, C., Cunsolo, F., Elek, N. I., Esen, E. C., Hasnain, G., Mantovani, F., Mistri, M., Munari, C., Paletta, M. G., Pezzi, M., Raptis, K. G. C., Sfriso, A. A., Sfriso, A., and Strati, V.: Quantifying early seagrass growth with UAV imagery, EGU General Assembly 2026, Vienna, Austria, 3–8 May 2026, EGU26-18973, https://doi.org/10.5194/egusphere-egu26-18973, 2026.

Machine learning (ML) models have become essential tools for monitoring water system dynamics, enabling accurate prediction of water levels, discharge patterns, and responses to meteorological forcing. However, their operational deployment remains constrained by limited interpretability and the challenge of translating numerical outputs into actionable insight, particularly when assessing system anomalies, regime shifts, and potential impacts on aquatic and riparian habitats.

This study introduces a novel framework that integrates large language models (LLMs) as a semantic interpretation layer within ML-based hydrological monitoring systems. Building on established time-series ML architectures for water level prediction, model outputs are coupled with statistical anomaly detection techniques to identify atypical hydrological behaviour, threshold exceedances, and periods of elevated system stress relevant to near-real-time monitoring. These quantitative signals, together with meteorological drivers and system metadata, are subsequently processed by an LLM to generate structured, contextual natural-language explanations.

The proposed framework is demonstrated using historical water monitoring datasets, with particular emphasis on extreme events and hydrological anomalies. When such events are detected, the LLM synthesizes information across multiple data streams to articulate observed patterns, plausible hydro-meteorological drivers, and potential implications for water system functioning and associated habitats. Rather than replacing process-based understanding or predictive models, the LLM acts as an intelligent synthesis component that contextualizes ML outputs and supports their interpretation.

Results indicate that LLM-enhanced monitoring outputs can substantially improve transparency, interpretability, and communicability compared to conventional numerical monitoring approaches, thereby facilitating improved situational awareness and decision support during critical periods. By embedding natural-language reasoning within data-driven monitoring workflows, this work establishes a pathway toward interpretable, stakeholder-centred hydrological monitoring that aligns advanced artificial intelligence methods with practical environmental observation and management needs.

Keywords

  • Hydrological monitoring
  • Machine learning interpretability
  • Large language models
  • Water system intelligence

How to cite: slaimi, A. and Scriney, M.: Explainable Hydrological Monitoring: Large Language Models as Semantic Interpreters of Machine-Learning-Based Water System Intelligence, EGU General Assembly 2026, Vienna, Austria, 3–8 May 2026, EGU26-19125, https://doi.org/10.5194/egusphere-egu26-19125, 2026.

EGU26-19151 | ECS | Orals | GI4.3

Open-Source Fluorescence Sensing with a Turbidity Correction Model for Community-based Freshwater Monitoring 

Riccardo Cirrone, Francesco Vesprini, Amedeo Boldrini, Alessio Polvani, Xinyu Liu, Luisa Galgani, and Steven Loiselle

Monitoring and maintaining functioning freshwater habitats is increasingly challenging, despite the widespread implementation of European and international freshwater quality monitoring frameworks. With the complexities of climate change, there is a need for data with higher spatial and temporal resolution. In this context, citizen science initiatives have emerged as a valuable complement to official monitoring programs. These initiatives are particularly important in small river basins and remote rural areas, where data from environmental agencies is often sparse or unavailable. However, concerns regarding the reliability and consistency of citizen-generated data persist, highlighting the need for novel technological solutions capable of improving the quality of in situ measurements collected by volunteers.

We present a low-cost fluorometer for field measurements of phytoplankton biomass, through the measurement of chlorophyll-a, featuring a multivariate turbidity correction algorithm and automated online data upload. This open-source device aims to advance monitoring by integrating cutting-edge optical sensing with IoT connectivity and citizen science.
The sensor is integrated in a 3D-printed case and comprises an optical system with two light sources: an 820 nm LED for turbidity measurements and a 430 nm SMD LED for chlorophyll-a excitation, coupled with a long-pass optical filter. The voltage signal from the photodiode is acquired via a 16-bit analog-to-digital converter and transmitted to a microcomputer (Raspberry Pi Zero 2 W), which powers and controls the system.
Laboratory and field evaluations demonstrated that the sensor delivers accurate and reproducible measurements, achieving higher resolution and precision than measurements without turbidity correction. For ease of replication, the 3D enclosure CAD model, software, and user guidelines are openly accessible online.

How to cite: Cirrone, R., Vesprini, F., Boldrini, A., Polvani, A., Liu, X., Galgani, L., and Loiselle, S.: Open-Source Fluorescence Sensing with a Turbidity Correction Model for Community-based Freshwater Monitoring, EGU General Assembly 2026, Vienna, Austria, 3–8 May 2026, EGU26-19151, https://doi.org/10.5194/egusphere-egu26-19151, 2026.

EGU26-19435 | ECS | Orals | GI4.3

Towards an Assessment of Atmospheric Forcing on Chlorophyll-a and Turbidity in an Oligotrophic Lake: Lake Bolsena Case Study 

Valentina Terenzi, Mariano Bresciani, Cludia Giardino, Anna Joelle Greife, Monica Pinardi, Patrizio Tratzi, Flaminia Fois, and Cristiana Bassani

Chlorophyll-a (Chl-a) is commonly used as an indicator of phytoplankton biomass and eutrophication in inland waters, as it reflects changes in primary productivity and nutrient availability. Turbidity describes the optical effect of suspended particles in the water column and, in oligotrophic lakes, is typically low but highly responsive to external factors such as wind-induced mixing and precipitation. Analyzing Chl-a and turbidity together in relation to atmospheric conditions is therefore crucial for evaluating water quality and identifying potential pressures on aquatic ecosystems.
In this study, Lake Bolsena was investigated as a representative oligotrophic system to evaluate how atmospheric conditions influence Chl-a concentration and turbidity. The analysis was conducted over the lake surface and an additional surrounding land buffer of approximately 15 km, selected to account for meteorological and atmospheric processes that are not confined to the water body itself but can indirectly affect its optical and biological properties.
Chl-a and turbidity were derived from the data set (version 2.1) of the ESA Lakes_cci project based on the processing of OLCI images for the period 2016-2022. Meteorological variables considered include wind speed at 10m, 2-m air temperature, surface pressure, boundary layer height, precipitation, and solar radiation, all derived from the ERA5 reanalysis dataset (Hersbach et al., 2020). In oligotrophic lakes, wind speed regulates water column mixing and sediment resuspension, while air temperature and solar radiation influence thermal stratification and the energy available for phytoplankton growth; precipitation contributes to suspended material modifying surface optical properties. Boundary layer height and surface pressure provide additional information on atmospheric stability and mixing conditions that modulate air–water exchanges.
Aerosol Optical Depth (AOD) retrieved using the MAIAC algorithm was also included, although it is not available directly over the lake surface but only in the surrounding area (Lyapustin et al., 2018). AOD was used as a proxy for regional aerosol loading to investigate its potential indirect effects on the lake through dry and wet deposition of particulate matter and nutrients, which may alter water transparency and, over time, phytoplankton dynamics even under oligotrophic conditions.
Correlation analysis revealed significant seasonal variability throughout the studied period. Chl-a is particularly influenced by multiple atmospheric forces in autumn, while turbidity is primarily driven by meteorological factors in summer. Both water quality parameters exhibit variable but significant dependencies in spring; on the other hand, atmospheric influence is less relevant in winter.
References
Hersbach, H., et al. (2020). The ERA5 global reanalysis. Quarterly Journal of the Royal Meteorological Society, 146, 1999–2049, https://doi.org/10.1002/qj.3803
Lyapustin, A., Wang, Y., Korkin, S., and Huang, D.: MODIS Collection 6 MAIAC algorithm, Atmos. Meas. Tech., 11, 5741–5765, https://doi.org/10.5194/amt-11-5741-2018, 2018.

How to cite: Terenzi, V., Bresciani, M., Giardino, C., Greife, A. J., Pinardi, M., Tratzi, P., Fois, F., and Bassani, C.: Towards an Assessment of Atmospheric Forcing on Chlorophyll-a and Turbidity in an Oligotrophic Lake: Lake Bolsena Case Study, EGU General Assembly 2026, Vienna, Austria, 3–8 May 2026, EGU26-19435, https://doi.org/10.5194/egusphere-egu26-19435, 2026.

EGU26-21301 | ECS | Orals | GI4.3

Advancing Water Data Ecosystems: Identifying and Optimizing Connectivity and Beyond-Connectivity Requirements with 5G/6G Technologies 

Abdelhak Kharbouch, Mehdi Monemi, Pirkko Taskinen, and Mehdi Rasti

This paper examines the connectivity and beyond-connectivity requirements essential for water data ecosystems, highlighting the critical role of advanced communication technologies, such as 5G/6G, in enabling rapid, reliable data transmission for real-time monitoring and decision-making. Optimizing communication protocols supports robust infrastructure, interoperability among diverse sources, including environmental sensors, weather data, and utility-provided information, and seamless data integration and utilization, while promoting innovation, efficiency, and sustainability in water management.

The study is structured in two main parts. First, it identifies specific connectivity and beyond-connectivity requirements, focusing on the integration of various water data sources and evaluating the efficacy of communication protocols to support dynamic data integration, including capabilities like artificial intelligence, sensing, and sustainability. This forms the foundation for subsequent analysis. Second, it analyzes and optimizes connectivity services offered by 5G/6G and beyond technologies to meet these requirements, considering factors such as energy efficiency, reliability, scalability, and integrated services like sensing, AI, and computation.

The study aims to demonstrate that addressing these requirements enhances the integration and utilization of diverse water data, facilitating access to information, development of new solutions, improved understanding of water management challenges, and innovation in water supply through enhanced prediction models and more efficient, sustainable solutions. It identifies and optimizes key performance indicators (KPIs) as well as services derived from standardization bodies, tailored to water-related use cases such as leak detection, wastewater monitoring, and resource efficiency. These include ultra-low latency for critical alerts, high reliability for infrastructure control, energy efficiency in sensor networks, scalability for IoT-dense environments, and integrated AI for dynamic data processing. Anticipated insights reveal how water data ecosystems can overcome challenges like demand-supply gaps through efficient data collection, sharing, and utilization, while addressing barriers such as limited data availability and regulatory constraints. This necessitates clear visions, effective data-sharing mechanisms, and scalable architectures to drive innovation and reduce water loss.

The proposed framework facilitates informed strategies and new opportunities for stakeholders in water utilities and related sectors. This study advances the understanding of digitalization in critical infrastructure, demonstrating how optimized connectivity can promote efficiency and sustainability in water management.

How to cite: Kharbouch, A., Monemi, M., Taskinen, P., and Rasti, M.: Advancing Water Data Ecosystems: Identifying and Optimizing Connectivity and Beyond-Connectivity Requirements with 5G/6G Technologies, EGU General Assembly 2026, Vienna, Austria, 3–8 May 2026, EGU26-21301, https://doi.org/10.5194/egusphere-egu26-21301, 2026.

EGU26-22477 | Posters on site | GI4.3

Spatial Dynamics of Mercury and Phytoplankton in Lake Maggiore: An Integrated Monitoring Approach 

Martina Austoni, Laura Fantozzi, and Giorgio Luciano

Mercury contamination in freshwater ecosystems is of major concern due to its persistence, toxicity, and bioaccumulation potential.  This preliminary study investigates mercury dynamics in Lake Maggiore by integrating surface water mercury analyses with high-resolution assessments of phytoplankton structure and chlorophyll concentrations along the water column and surface water. Monitoring activities were conducted using FluoroProbe probe (BBE Moldaenke GmbH) to characterize algal groups with particular focus on the horizontal spatial distribution of both chlorophyll and mercury in proximity to tributaries and lake outlets. Surface water samples were analyzed for mercury concentrations using a Lumex RA‑915+ portable atomic absorption spectrometer, equipped with the dedicated attachment for dissolved and total mercury determination in water, while FluoroProbe profiles were used to quantify algal group composition and chlorophyll distribution. Results reveal marked spatial heterogeneity in mercury concentrations, closely associated with tributary zones and changes in chlorophyll patterns, suggesting coupling between hydrological inputs, phytoplankton dynamics, and mercury behavior. This integrated monitoring approach improves understanding of mercury–ecosystem interactions in large lake systems and supports the development of effective monitoring and management strategies for freshwater environments.

How to cite: Austoni, M., Fantozzi, L., and Luciano, G.: Spatial Dynamics of Mercury and Phytoplankton in Lake Maggiore: An Integrated Monitoring Approach, EGU General Assembly 2026, Vienna, Austria, 3–8 May 2026, EGU26-22477, https://doi.org/10.5194/egusphere-egu26-22477, 2026.

BG5 – Palaeobiogeosciences

Dichotomous thinking also known as “black-and-white” and “all-or-nothing” thinking is a common cognitive distortion in which one sees things in absolute extremes without any middle ground. Not only does this bias distort reality and lead to interpersonal conflicts, but it also hinders problem solving. In the Geosciences, this bias is the source of a > 100 years old divide between tectonicists, i.e., early supporters of Continental Drift Theory (e.g., Alfred Wegener, Alexander du Toit), and paleontologists, who argued for (now sunken) land bridges between the continents based on similar fossil records (e.g., Charles Schuchert, John Gregory, Hermann von Ihering, Bailey Willis). Despite explaining the similar fossil record on continents now separated by oceans, Land Bridge Theory implied continental fixity. It was therefore completely abandoned in the 60–70s with the growing body of evidence supporting continent motion. Continental Drift Theory was then fully accepted without any middle ground despite the fossil record suggesting prolonged connection between the continents at specific localities. Possible causes for the black-or-white approach of the Geoscience community include (1) simplicity: easier to envision one hypothesis being right rather than a compromise of both, (2) guilt: Alfred Wegener had died in Greenland in 1931 only to be proven right 30 years later upon acceptance of continent motion, and (3) a feeling of inferiority amongst paleontologists and feeling of superiority (i.e., feeling of inferiority in disguise) amongst tectonicists upon demonstrating continental motion.

Since then, paleontologists have explored new hypotheses to explain the migration of species at times when oceans are believed to have fully separated the continents, e.g., migration of primates from western Africa to South America and of lizards the other way around in the Oligocene. A hypothesis under testing involves floating vegetation islands rafting the species as small groups of individuals across the ocean. This hypothesis implies that enough individuals survived the crossing, i.e., enough food and/or quick journey, and found one another upon landing.

Neither the new hypotheses nor the old ones take into account all the evidence, e.g., microcontinents along major transform faults (e.g., Romanche and St Paul fault zones) and correlation of all former land bridges with major transform faults and rift-oblique orogens on the adjacent margins (e.g., Central African Orogen in western Africa and Sergipano Belt in northeastern Brazil). Orogenic Bridge Theory reconciles these with both continent motion and the fossil record. Orogenic bridges are ribbons of continental crust transected by orogenic structures highly oblique to the active rift. These structures are unsuitably oriented to thin the crust and thus hinder rifting, delay breakup, and control the formation of major transform faults and elongated microcontinents. Orogenic bridges have the potential to form prolonged land connections between the continents while oceanic crustal domains form on either side, thus further allowing the spreading of terrestrial species while hindering that of marine species. This illustrates the need for more multidisciplinary collaboration across the geosciences. Creating a more flexible community that is both inclusive and mindful of diversity is key to enhance collaboration.

How to cite: Koehl, J.-B. and Foulger, G.: Black and white: the bias that shaped plate tectonics and the ongoing > 100 years old divide of the geoscience community, EGU General Assembly 2026, Vienna, Austria, 3–8 May 2026, EGU26-507, https://doi.org/10.5194/egusphere-egu26-507, 2026.

EGU26-1165 | ECS | Orals | BG5.1

Interacting environmental and evolutionary controls on shifting marine biodiversity hotspots through Cenozoic 

Venu Gopal Kella and Devapriya Chattopadhyay

Marine biodiversity hotspots are regions characterized by exceptionally high species richness compared to surrounding areas. Fossil and molecular evidence indicate that these hotspots have shifted across space and time throughout the Cenozoic; yet the mechanisms driving their emergence and relocation remain inadequately understood. Here, we examine these dynamics—and their links to environmental change—using genus-level fossil data for molluscs, cnidarians, and foraminifera compiled from the Paleobiology Database and published sources.

Because publicly available fossil occurrence data exhibit strong geographic and temporal sampling inhomogeneities, sampling standardization is essential for robust interpretation of diversity patterns. To reduce sampling biases, we applied Shareholder Quorum Subsampling (SQS) and identified paleo-hotspots as regions where sampling-standardized richness exceeded global confidence intervals. We detected 40 paleo-hotspots exhibiting distinct clade-specific macro-evolutionary signatures. Using models based on Hierarchical Bayesian structural equations reveal that environmental conditions (sea surface temperature, shelf area, sea level) influence hotspot development formation predominantly by modulating macro-evolutionary processes (origination, extinction, immigration), though the strength and direction of these pathways differ among groups. Cnidarian hotspots arise from high evolutionary turnover, where elevated origination rates and expansive shelf area strongly increase hotspot probability. In contrast, for both benthic and planktic foraminifera, no single environmental or macro-evolutionary factor exerts a dominant direct influence; rather, interconnected processes indirectly shape diversity and, ultimately, hotspot formation. Together, these results show that marine biodiversity hotspots arise through distinct, clade-specific macro-evolutionary mechanisms influenced by the environment.

How to cite: Kella, V. G. and Chattopadhyay, D.: Interacting environmental and evolutionary controls on shifting marine biodiversity hotspots through Cenozoic, EGU General Assembly 2026, Vienna, Austria, 3–8 May 2026, EGU26-1165, https://doi.org/10.5194/egusphere-egu26-1165, 2026.

EGU26-1434 | ECS | Orals | BG5.1

Volcanic forcing of oxygenation dynamics in the mid-Proterozoic 

Longfei Sun, Jeroen E. Sonke, Simon W. Poulton, Dongjie Tang*, Xiaoying Shi, Xinqiang Wang, Xiqiang Zhou, Lin Meng, Baozeng Xie, Lei Xu, Shaochen Yang, and Romain Guilbaud

Large Igneous Province (LIP) volcanism is commonly considered to have driven ocean deoxygenation and associated mass extinctions during the Phanerozoic. However, the impacts and feedback mechanisms associated with LIP emplacement in the prevailingly low-oxygen Precambrian environment remain poorly understood. Here, we present mercury isotope, iron speciation and phosphorus phase partitioning data for mid-Mesoproterozoic marine sediments of the Shennongjia Group, South China, to reconstruct the response of the phosphorus cycle to LIP volcanism. Our data indicate that LIP volcanism triggered an expansion in marine euxinia, which enhanced phosphorus recycling and stimulated surface ocean primary production, thereby promoting increased burial of organic carbon and pyrite. This facilitated net marine oxygenation, with repeated volcanic pulses ultimately resulting in enhanced ventilation of the mid-Proterozoic ocean. We propose that while mid-Proterozoic LIP volcanism may have caused short-term ecological crises, the ensuing redox-nutrient feedbacks ultimately stimulated progressive oxygenation of Earth’s surface environment.

How to cite: Sun, L., Sonke, J. E., Poulton, S. W., Tang*, D., Shi, X., Wang, X., Zhou, X., Meng, L., Xie, B., Xu, L., Yang, S., and Guilbaud, R.: Volcanic forcing of oxygenation dynamics in the mid-Proterozoic, EGU General Assembly 2026, Vienna, Austria, 3–8 May 2026, EGU26-1434, https://doi.org/10.5194/egusphere-egu26-1434, 2026.

EGU26-1919 | ECS | Orals | BG5.1

Widespread chemically oscillating reactions and the phosphatization of hematite filaments and tubes in the oldest BIF from the Nuvvuagittuq Supracrustal Belt  

Yuzhou Ge, Dominic Papineau, Zixiao Guo, Zhenbing She, Jonathan O'Neil, and Marion Garçon

Accurately distinguishing between biotic and abiotic microstructures is crucial for understanding the evolution of early life and the search for extraterrestrial life. The oldest putative fossils reported occur in the form of hematite filaments and tubes in the jasper-carbonate BIF from the Nuvvuagittuq Supracrustal Belt (NSB), Québec, possibly as old as 4.3 Ga. Although these twisted and branched hematite filaments and tubes are very similar to the Fe-oxyhydroxide filaments produced by Fe-oxidizing bacteria in modern hydrothermal deposits, they are still being questioned because morphologically and compositionally similar abiotic filamentous biomorphs can be produced in “chemical gardens”. Additionally, the origin of ubiquitous circularly concentric rosettes that occur with the filaments and tubes remains unclear. Systematic mineralogical and morphological characterization of these microstructures using a variety of correlated in-situ micro-analytical techniques such as polarizing microscopy, Raman spectroscopy, SEM-EDS, and XPS now yield a new understanding of these ancient microscopic objects.

Firstly, new observations of hematite filaments and tubes preserved in apatite crystals indicate phosphatization as another taphonomic mode of preservation. These apatites with filaments that are several hundred micrometers in size, and usually distributed in discontinuous bands between the silicon-rich and iron-rich microbands. The diameter of these hematite filaments and tubes is 4 to 8 μm, while their lengths are 10 to 200 μm. They are thinner than those previously reported preserved in quartz and their diameter is closer to that of modern iron-oxidizing bacteria. As for co-occurring hematite tubes, their interior is usually filled with apatite. The walls of tubes are often straight, and even crossing crystal boundaries between apatite and microcrystalline quartz. Furthermore, new Raman spectra show the occasional presence of organic matter in these filaments preserved in apatite, independently supporting a biological origin.

Secondly, rosettes widely present in the quartz have circularly concentric layers, radially geometric crystals of acicular hematite, and circular double or triple twins. These microstructures are akin to patterns seen in botryoidal minerals and likely produced by abiotic chemically oscillating reactions (COR). In addition, the walls of the tubes preserved in quartz are also sometimes wavy, curved, or botryoidal-like, along with concentric layers, which is comparable to botryoidal coatings on modern hollow filaments of ferrihydrite in deep-sea hydrothermal ecosystems, indicating the interaction between iron-containing minerals and decaying organic matter from biomass during diagenesis.

The latest observations suggest that in the early Earth's submarine hydrothermal environments rich in phosphate and organic acids, the widespread phosphatisation enables the oldest life preserved in the apatite in the form of hematite filaments and tubes. The new observations also emphasize the potential role of abiotic COR in the formation of rosettes, as well as the modifications of the surface features of microfossils during diagenesis. These biological and abiotic “biosignatures” provide a valuable reference to search for life signals in extraterrestrial environments such as Mars and icy moons.

How to cite: Ge, Y., Papineau, D., Guo, Z., She, Z., O'Neil, J., and Garçon, M.: Widespread chemically oscillating reactions and the phosphatization of hematite filaments and tubes in the oldest BIF from the Nuvvuagittuq Supracrustal Belt , EGU General Assembly 2026, Vienna, Austria, 3–8 May 2026, EGU26-1919, https://doi.org/10.5194/egusphere-egu26-1919, 2026.

EGU26-2111 | Orals | BG5.1

Phanerozoic trends in deep water rejuvenation: Is there a relation between global temperature and ocean mixing?  

Or Mordechay Bialik, Anta-Clarisse Sarr, Yannick Donnadieu, and Alexander Pohl

The concept of a warm, sluggish ocean recurs in the palaeoceanographic literature, yet over the last few years, both observation and model studies have challenged this concept repeatedly. Nevertheless, observations in the modern do link the ongoing anthropogenic warming to the slowing down of oceanic circulation. This mismatch between the different scales of observations presents a critical problem to our understanding of the past ocean. Here, we present a critical evaluation of this concept through an extensive series of intermediate complexity Earth system model experiments. Multiple paleogeographic scenarios across the Phanerozoic, CO2 concentration, and orbital configuration have been simulated to evaluate the relations between planetary surface temperatures and deep-water rejuvenation rate. Combined, the results of these simulations present a very limited contribution of warm climates to the global ocean circulation slowdown. For most experiments, warmer conditions enhanced overall oceanic turnover due to an increase in vertical density gradient, supporting more efficient downwelling. However, this state is only achieved in the long term, with some slowdown after the initial warming. The overall range of turnover time, even during the slowest period of deep-water rejuvenation, remains within the same order of magnitude as the modern. In light of these findings, it is unlikely that at any point through the Phanerozoic did oceanic turnover rate changed in a magnitude that would impact the mixing state of most marine dissolved chemical elements, at least at current flux state.

How to cite: Bialik, O. M., Sarr, A.-C., Donnadieu, Y., and Pohl, A.: Phanerozoic trends in deep water rejuvenation: Is there a relation between global temperature and ocean mixing? , EGU General Assembly 2026, Vienna, Austria, 3–8 May 2026, EGU26-2111, https://doi.org/10.5194/egusphere-egu26-2111, 2026.

EGU26-3338 | ECS | Posters on site | BG5.1

Early Cenozoic mammal radiation coincides with increased terrestrial habitability 

Nicholas Hadjigavriel

Environmental variables like temperature, land availability and food availability constrain the ecological niches of terrestrial animals and, along with atmospheric oxygen levels, likely had a direct effect on their evolution and distribution over geological time. In this study we develop an agent-based terrestrial palaeoecological model, which we couple to an Earth system model to reconstruct how Earth’s habitability for terrestrial mammals has changed over the Mesozoic to Cenozoic eras. This allows us to investigate whether there was an environmental component to the early Cenozoic mammal radiation. Our findings indicate that Earth’s habitability for terrestrial mammals was maximised during the Cretaceous–Paleogene interval, due to the combination of elevated plant Net Primary Productivity (NPP), expansion of continental land areas, minimal glaciation, and elevated atmospheric oxygen levels. We propose that the rapid diversification of mammals during this period, while clearly enabled by the extinction of non-avian dinosaurs, was also influenced by the enhanced habitability of Earth’s surface during this time. Similar environmentally-driven changes in terrestrial habitability likely also play a significant role for other palaeobiological events.

How to cite: Hadjigavriel, N.: Early Cenozoic mammal radiation coincides with increased terrestrial habitability, EGU General Assembly 2026, Vienna, Austria, 3–8 May 2026, EGU26-3338, https://doi.org/10.5194/egusphere-egu26-3338, 2026.

EGU26-4337 | ECS | Posters on site | BG5.1

A Plate-Tectonic Framework for Predicting Ore Deposit Formation 

Jakub Ciazela, Taras Gerya, Christian Verard, Robert Stern, Matthew Leybourne, and Wenyong Duan

Long-term sustainability of human civilization depends on secure supplies of metals and critical minerals that underpin energy systems, infrastructure, and technology (IEA, 2021; UNEP, 2024). By 2040, total mineral demand from clean energy technologies is expected to double or quadruple (IEA, 2021), raising concerns about long-term supply sustainability as anthropogenic extraction operates on timescales and magnitudes unconstrained by geological ore-forming rates. Although recycling and substitution can mitigate pressure, widely adopted outlooks still require substantial expansion of primary supply and are commonly framed around reserves, production, and announced project pipelines (IEA, 2024; USGS, 2025).

We present a plate-kinematic framework to forecast ore deposit formation over the next 10 Myr by coupling tectonic setting–specific deposit-generation functions to a forward plate-motion model. Unlike reserve- or discovery-trend extrapolations, this approach explicitly links plate tectonics to mineralization rates, providing a first-order estimate of Earth’s natural “mineral renewal” capacity (IEA, 2024; USGS, 2025). We apply the method to two deposit types: (1) porphyry–epithermal systems in continental arcs, parameterized by plate convergence rates and lithospheric factors (crustal thickness, slab composition, and proxies for slab oxidation state), reflecting how rapid convergence and thick crust favor porphyry formation, while explicitly accounting for melt–fluid–driven mass transfer of copper and oxidized species within subduction zones; and (2) mid-ocean ridge seafloor massive sulfides (SMS), linked to spreading rate, ridge depth, and detachment fault occurrence at slow-spreading centers. These parameterizations are integrated into a global 1°-resolution plate model extrapolated 10 Myr into the future to produce spatially explicit, time-dependent maps of ore-forming potential. Because most new oceanic crust is not subducted within a 10 Myr horizon, our model estimates gross SMS formation within a limited accessibility window (controlled by sediment burial), while acknowledging subduction recycling as a longer-term sink.

The resulting formation- and accessibility-weighted metrics provide benchmarks for Earth’s natural mineral replenishment rate, against which scenario-based demand projections can be compared, thereby strengthening sustainability discussions with geodynamically grounded constraints.

References:

International Energy Agency (IEA): The Role of Critical Minerals in Clean Energy Transitions, IEA, Paris, 2021.

International Energy Agency (IEA): Global Critical Minerals Outlook 2024, IEA, Paris, 2024.

United Nations Environment Programme (UNEP) and International Resource Panel (IRP): Global Resources Outlook 2024 – Bend the trend: Pathways to a Liveable Planet as Resource Use Spikes, UNEP, 2024, doi:20.500.11822/44901.

U.S. Geological Survey (USGS): Mineral Commodity Summaries 2025 (ver. 1.2, March 2025), U.S. Geological Survey, 212 pp., doi:10.3133/mcs2025, 2025.

How to cite: Ciazela, J., Gerya, T., Verard, C., Stern, R., Leybourne, M., and Duan, W.: A Plate-Tectonic Framework for Predicting Ore Deposit Formation, EGU General Assembly 2026, Vienna, Austria, 3–8 May 2026, EGU26-4337, https://doi.org/10.5194/egusphere-egu26-4337, 2026.

EGU26-5361 | ECS | Posters on site | BG5.1

Tracking the spatial extent of redox variability in the mid-Proterozoic ocean 

Yafang Song, Benjamin Mills, Fred Bowyer, Morten Andersen, Frantz Ossa Ossa, Alexander Dickson, Jason Harvey, Shuichang Zhang, Xiaomei Wang, Huajian Wang, Donald Canfield, Graham Shield, and Simon Poulton

Emerging geochemical evidence suggests highly heterogeneous ocean redox conditions in the mid-Proterozoic. Quantitative estimates of the extent of different modes of anoxia, however, remain poorly constrained. Considering the complementary redox-related behaviour, uranium and molybdenum isotopes can be combined to reconstruct ancient marine redox landscapes, which has not been applied to the mid-Proterozoic. In this study, we present new δ238U and δ98Mo data for shales from the ~1.4 Ga Xiamaling Formation, North China Craton, together with independent redox proxies, including Fe speciation and redox-sensitive trace metals. We find that most oxic and dysoxic samples retain low U and Mo concentrations, with δ238U and δ98Mo values indistinguishable from continental crust. While euxinic samples record the highest authigenic δ238U and δ98Mo, consistent with efficient reduction of U and Mo. Samples deposited under ferruginous conditions exhibit a wider range of δ238U and δ98Mo values that generally fall between the (dys)oxic and euxinic end-members. Using a coupled U-Mo isotope mass balance model, we infer limited euxinia but extensive low productivity, ferruginous conditions in mid-Proterozoic oceans.

How to cite: Song, Y., Mills, B., Bowyer, F., Andersen, M., Ossa Ossa, F., Dickson, A., Harvey, J., Zhang, S., Wang, X., Wang, H., Canfield, D., Shield, G., and Poulton, S.: Tracking the spatial extent of redox variability in the mid-Proterozoic ocean, EGU General Assembly 2026, Vienna, Austria, 3–8 May 2026, EGU26-5361, https://doi.org/10.5194/egusphere-egu26-5361, 2026.

Prevailing interpretations of large underground cavities in carbonate terrains are predominantly based on karst-related genetic models, in which dissolution-driven hydrological processes are assumed to be the primary mechanism of formation. While effective for explaining certain cave types, these models commonly rely on an implicit assumption: that underground cavities should be analyzed as isolated natural features. This assumption has limited the recognition of broader spatial patterns and system-level organization.

This study proposes a geoarchaeological, system-based approach to the interpretation of underground spaces, using the Zagros Mountains as a key case study. Given the extensive carbonate lithology of the region, classical karst theory would predict cave development closely associated with active or fossil drainage networks. However, field observations reveal a contrasting pattern, with numerous underground openings located at elevated positions, often on cliff faces or near ridgelines, lacking any evidence of hydrological concentration or outlet channels.

A focal example is provided by the Deh Sheikh area (central Zagros), where multiple underground entrances occur at the same elevation level and are separated by relatively regular horizontal distances. Such repeated and level-aligned configurations are difficult to reconcile with stochastic karstic dissolution processes and instead suggest a coherent spatial logic that becomes visible only when these features are considered collectively rather than individually.

Additional evidence includes stable arched geometries and persistent cavities that contrast with the irregular, downward-oriented erosion expected from water-dominated processes. These observations indicate that natural processes observed today are largely secondary modifications, overprinting earlier phases of space formation.

Rather than rejecting natural cave formation mechanisms, this study argues that, in the Zagros region, a system-based geoarchaeological framework provides a more coherent and parsimonious interpretive model. The results highlight the importance of analytical scale and interdisciplinary perspectives in re-evaluating underground spaces.


How to cite: Baghbani, F. and Baghbani, H.: From Isolated Caves to Spatial Systems: A Geoarchaeological Re-reading of Underground Spaces in the Zagros Mountains, EGU General Assembly 2026, Vienna, Austria, 3–8 May 2026, EGU26-5975, https://doi.org/10.5194/egusphere-egu26-5975, 2026.

EGU26-6597 | ECS | Orals | BG5.1

Distinguishing Snowball Earth climate modes using field data and climate simulations 

Chloe Griffin, Thomas Gernon, Minmin Fu, Elias Rugen, Anthony Spencer, Geoffrey Warrington, and Thea Hincks

The degree to which Earth’s climate retained seasonality and ocean-atmospheric coupling during the two Cryogenian snowball Earth glaciations, the Sturtian (~717-658 Ma) and Marinoan (~654-635 Ma), is unknown. The classic hypothesis envisions ice at equatorial latitudes with a largely quiescent hydrological cycle. However, other observations imply the persistence of open water in the tropics, permitting ocean-atmospheric coupling and reconciling photosynthetic survival with low-latitude glacial activity. Consequently, open questions remain as to whether internal climate cycles could operate during snowball Earth, and if so, what their expression reveals about the extent of open ocean and the dynamics of the Cryogenian climate system; important climate questions that carry key biological implications. Varve-like laminites provide high resolution records of climatic variability as far back as the Proterozoic. However, varved sediments that retain climatic information are rare in the Cryogenian. Here, we analyse field data from rhythmic laminites from the Port Askaig Formation (Scotland). Petrographic and spectral analysis indicates that the laminites represent glacio-lacustrine annual varves, which reveal statistically significant centennial to interannual periodicities strongly similar to solar phenomena and modern ocean-atmospheric climate patterns. We interpret these signals with fully coupled Cryogenian climate simulations using the Community Earth System Model (CESM) under varying degrees of ice coverage to reconstruct climate variability during this interval of the Sturtian glaciation. These simulations suggest that open water is present to some degree in the tropics. Our study reveals a wider range of climatic variability than previously envisaged under snowball Earth conditions, and hints at the possibility of unfrozen tropical waters during this discrete interval of the Sturtian glaciation, or yet unexplored mechanisms of interannual variability on icy worlds.

How to cite: Griffin, C., Gernon, T., Fu, M., Rugen, E., Spencer, A., Warrington, G., and Hincks, T.: Distinguishing Snowball Earth climate modes using field data and climate simulations, EGU General Assembly 2026, Vienna, Austria, 3–8 May 2026, EGU26-6597, https://doi.org/10.5194/egusphere-egu26-6597, 2026.

The shift from the climate of the “boring billion” without evidence for major glaciations to the globally ice-covered “Snowball Earth” events of the Cryogenian (720–635 million years ago, Ma) remains enigmatic. Various factors have been suggested to drive the cooling in the early Neoproterozoic (1000–539 Ma), most prominently decreasing carbon-dioxide levels due to enhanced weathering of tropical continents or fresh volcanic material. However, these processes should have operated during the boring billion as well, triggering the quest for alternative explanations. It has been suggested, for example, that the increase in both the diversity and the biomass of eukaryotic algae around 800 Ma could have contributed to the cooling via the emission of dimethyl sulfide (DMS), a source of cloud condensation nuclei instrumental in forming bright clouds over dark ocean surfaces. Here, we investigate this hypothesis with a coupled climate–ocean biogeochemistry model, allowing for the first time the quantification of the relevant marine carbon cycle feedbacks. We confirm that the increase in cloud condensation nuclei cools the Neoproterozoic climate and can lead to global glaciation at low atmospheric carbon-dioxide concentrations. Our analysis sheds light on the positive and negative feedback loops associated with the rise of algae and demonstrates that changes in cloud cover remain a plausible contribution to Neoproterozoic cooling.

How to cite: Feulner, G., Hofmann, M., Eberhard, J., and Petri, S.: Ocean biogeochemistry amplifies cooling caused by increase in cloud condensation nuclei from algae prior to Cryogenian Snowball Earth events, EGU General Assembly 2026, Vienna, Austria, 3–8 May 2026, EGU26-6828, https://doi.org/10.5194/egusphere-egu26-6828, 2026.

EGU26-7017 | ECS | Orals | BG5.1

African paleogeography since 30Ma : setting boundary conditions for climatic, physiographic and biodiversity models. 

Raphaël Tournier, Laurent Husson, Sandrine Prat, Jean-Renaud Boisserie, Doris Barboni, Nicolas Bellahsen, Cécile Doubre, Raphaël Pik, Tristan Salles, Pierre Sepulchre, and Christel Tiberi

The African continent has undergone major Cenozoic transformations, including the formation of the East African Rift System and the opening of the Red Sea and the Gulf of Aden. The impact of these transformations on the various components of the Earth system over time—climate, hydrographic networks, and the dispersal and evolution of biological species—raises multiple questions.

In this context, we aim to reconstruct the paleogeographic evolution of continental Africa over the past 30 million years using a multi-layered modelling approach. First, the integration of several geodynamic components (including mantle-driven dynamic topography, the history of crustal tectonics, plate tectonic motions, and volcanic eruptive dynamics) allows us to produce an elevation model for Africa since 30 Ma that is continuous in space and time. This elevation model is then used as a boundary condition for climate simulations, followed by physiographic simulations, generating a more comprehensive and coherent representation of past environments.

The simulation outputs reveal the sensitivity of climate reconstructions to topographic boundary conditions, as well as temporal variations in hydrographic networks. These new topographic, climatic, and physiographic constraints provide improved calibration for future eco-evolutionary studies (e.g., geographic barriers, water availability, resource distribution, and environmental stability) on the African continent.

We then evaluate the spatial and temporal accuracy of these reconstructions by confronting them with field-based evidence. This assessment identifies the scales at which the models are most robust, informing which interrogation can be explored with confidence. It also highlights where the reconstructions are consistent with geological, paleoenvironmental, and paleontological data, and where their precision may require further refinement.

Looking ahead, the objective is to continuously update these maps and simulations, which will also be used to investigate the dispersal and evolutionary changes of Cenozoic faunal communities in Africa, notably early hominids. This whole study offers a coherent spatio-temporal context for evaluating links between the different components of the Earthsystem.

How to cite: Tournier, R., Husson, L., Prat, S., Boisserie, J.-R., Barboni, D., Bellahsen, N., Doubre, C., Pik, R., Salles, T., Sepulchre, P., and Tiberi, C.: African paleogeography since 30Ma : setting boundary conditions for climatic, physiographic and biodiversity models., EGU General Assembly 2026, Vienna, Austria, 3–8 May 2026, EGU26-7017, https://doi.org/10.5194/egusphere-egu26-7017, 2026.

EGU26-7068 | ECS | Posters on site | BG5.1

How palaeogeographic reconstructions influence climate: the Permian-Triassic Boundary case study 

Byeongseok Kang, Laure Moinat, Charline Ragon, Christian Vérard, and Maura Brunetti

Paleogeographic reconstructions of the deep past are affected by large uncertainties due to limitations in dating, the scarcity of sedimentary sequences, and imperfect constraints on the positions of tectonic plates. These uncertainties in the boundary conditions propagate into climate simulations, affecting their accuracy.

In this study, we compare two paleogeographic reconstructions, Panalesis [1] and PaleoMap [2], to assess how differences in the paleogeographic reconstructions influence the climate response at the Permian-Triassic Boundary. Climate simulations are performed using biogeodyn-MITgcmIS [3], a recently developed modelling tool in which the dynamical core of both the atmosphere and the ocean is provided by the MIT general circulation model, while offline coupling ensures the consistent evolution of vegetation and ice sheets (when present).

Beyond the direct comparison of paleogeographic reconstructions, aquaplanet and simplified configurations are employed under the same paleoclimate conditions to isolate feedbacks arising from land distribution. The resulting steady-state climates are systematically compared with those obtained using Pangea configurations derived from Panalesis and PaleoMap. The impact on terrestrial vegetation is also estimated and discussed. Overall, the results provide a framework for systematically assessing how paleogeographic reconstructions affect coupled climate-biosphere dynamics.


References

[1] Vérard, Geological Magazine 156, 320 (2019)

[2] Scotese, Atlas of Earth History, PALEOMAP Project (2001)

[3] Moinat et al., EGUsphere [preprint], https://doi.org/10.5194/egusphere-2025-2946 (2025).

How to cite: Kang, B., Moinat, L., Ragon, C., Vérard, C., and Brunetti, M.: How palaeogeographic reconstructions influence climate: the Permian-Triassic Boundary case study, EGU General Assembly 2026, Vienna, Austria, 3–8 May 2026, EGU26-7068, https://doi.org/10.5194/egusphere-egu26-7068, 2026.

EGU26-7342 | ECS | Posters on site | BG5.1

Can CO2 outgassing explain Lomagundi Excursion? 

P a Janaarthanan and Sanjeev Kumar

The Lomagundi-Jatuli event (2.3-2.0 Ga) is one of the grandest carbon isotopic (δ13Ccarbonate) excursion events in the Earth’s history, marked by anomalous δ13Ccarbonate reaching up to + 30 ‰. Several hypotheses have been proposed to explain this excursion; however, they remain inadequate due to associated drawbacks. The conventional explanation is organic carbon burial due to enhanced productivity. But, the lack of organic rich stratas synchronous with the excursion demands the reconsideration of alternative biogeochemical processes to explain this isotopic anomaly. Moreover, the excursion is observed only in the evaporitic and nearshore carbonates, with no evidence from open ocean; demanding facies based biogeochemical explanation. Here, we explore the possibility of CO2 outgassing and calcite precipitation as potential drivers responsible for this excursion as these two processes remain the least explored among the proposed hypotheses. Through sedimentological evidences from previous studies and Rayleigh fractionation calculations, we argue that dominant loss of DIC through CO2 outgassing in the evaporitic facies and calcite precipitation in the nearshore facies along with a well-mixed DIC reservoir in the open ocean led to observed Lomagundi Excursion.

How to cite: Janaarthanan, P. A. and Kumar, S.: Can CO2 outgassing explain Lomagundi Excursion?, EGU General Assembly 2026, Vienna, Austria, 3–8 May 2026, EGU26-7342, https://doi.org/10.5194/egusphere-egu26-7342, 2026.

EGU26-7347 | Orals | BG5.1

The different approaches for reconstructing palæogeography at the global scale in deep time 

Christian Vérard and Florian Franziskakis

Plate tectonic reconstructions are different from palæogeographic reconstructions. The latter can be derived from the former, but not the opposite.

Many end-users (palæontologists, palæoclimate or mantle dynamics modellers) use a map (often without citing the source) of the palæogeography for a given time. However, there are various reconstructions of palæogeographies, based upon numerous plate tectonic models.

Aimed primarily at end-users, the presentation will focus on what are the main similarities and differences when creating a plate tectonic model. Then, different ways (mainly two) of proposing palæogeographies will also be discussed.

This information is crucial when using such maps and can have a significant impact on interpretations drawn from climate simulations or studies of the evolution of life through Earth history.

How to cite: Vérard, C. and Franziskakis, F.: The different approaches for reconstructing palæogeography at the global scale in deep time, EGU General Assembly 2026, Vienna, Austria, 3–8 May 2026, EGU26-7347, https://doi.org/10.5194/egusphere-egu26-7347, 2026.

EGU26-7546 | ECS | Posters on site | BG5.1

Climate Sensitivity in a Pre-Plant World: Why High CO₂ May Not Have Been Sufficient to Maintain a Paleozoic Hothouse 

Niklas Werner, Florian Franziskakis, Andrew Merdith, Christian Vérard, Maura Brunetti, Taras Gerya, and Paul Tackley

Despite evidence for generally elevated atmospheric CO₂ concentrations, the climate of the early Phanerozoic appears to have been neither uniformly warm nor stable. Proxy records, climate simulations, and paleogeographic reconstructions all carry large uncertainties, yet taken together they suggest that greenhouse forcing alone may not fully explain observed climatic variability, including intervals of pronounced cooling, such as the Hirnatian Glaciation. Understanding how early Phanerozoic climate responded to high CO₂ therefore requires explicit consideration of the boundary conditions under which greenhouse forcing operated.

Here, we examine the combined roles of paleogeography, land-surface properties, and reduced solar luminosity in shaping early Phanerozoic climate states. Using an intermediate-complexity Earth system model, we systematically explore climate sensitivity across a wide range of atmospheric CO₂ concentrations under pre-vegetation boundary conditions and early Paleozoic paleogeographic configurations. The experimental design focuses on how land–sea distribution, continental arrangement, and surface characteristics influence large-scale heat transport, cryospheric feedbacks, and the CO₂ levels required to maintain ice-free conditions.

Our working hypothesis is that early Phanerozoic climates were intrinsically biased toward cooler states relative to later, vegetated periods, due to higher surface albedo, altered hydrological cycling, and reduced incoming solar radiation. In such a climate system, maintaining temperate conditions may have required persistently high CO₂ concentrations, while gradual CO₂ drawdown could have positioned the system close to critical thresholds. Under these circumstances, comparatively small paleogeographic changes—such as shifts in continental connectivity or topographic relief—may have been sufficient to trigger short-lived glacial episodes, without invoking abrupt or extreme changes in greenhouse forcing.

By framing early Phanerozoic climate evolution as a problem of threshold behavior under uncertain boundary conditions, this work aims to clarify why high CO₂ and cooling are not necessarily incompatible. The results will help constrain which combinations of forcing and boundary conditions are physically plausible and guide more robust interpretations of proxy records and future paleoclimate modeling efforts.

How to cite: Werner, N., Franziskakis, F., Merdith, A., Vérard, C., Brunetti, M., Gerya, T., and Tackley, P.: Climate Sensitivity in a Pre-Plant World: Why High CO₂ May Not Have Been Sufficient to Maintain a Paleozoic Hothouse, EGU General Assembly 2026, Vienna, Austria, 3–8 May 2026, EGU26-7546, https://doi.org/10.5194/egusphere-egu26-7546, 2026.

EGU26-7612 | ECS | Orals | BG5.1

Effect of the Milankovitch cycles on climate multistability for the last 1 Myr 

Laure Moinat, Christian Vérard, Daniel N. Goldberg, Jérôme Kasparian, Taras Gerya, John Marshall, and Maura Brunetti

During the last million years, the growth and retreat of massive ice sheets in North America and Eurasia defined the alternating climate conditions of the glacial-interglacial cycle. The main driver of these climatic oscillations is the combined effect of precession, eccentricity, and obliquity frequency modes (Milankovitch cycles) [1]. However, the climate expected from the Milankovitch cycles does not always align with the records from the Marine Isotope Stages [2].

To address this discrepancy, we test the hypothesis that multiple climatic steady states (attractors) exist for a given CO2 concentration and can be destabilized by different combinations of Milankovitch forcing. We developed a biogeodynamical coupled setup, biogeodyn-MITgcmIS [3], which has the MIT general circulation model as its dynamical core, and asynchronously couples hydrology, ice sheets, and vegetation. The results of this new coupled model show that including the long-term dynamics of vegetation and ice sheets is crucial to evaluate past and future climate trajectories.  
 
First, we construct the bifurcation diagram by varying the CO2 concentration between 180 ppm and 320 ppm (i.e., within the observed range over the last 1 Myr). We analyze the stability range of the cold (glacial) and warm (interglacial) attractors, and identify their tipping points at the global scale. Second, we repeat selected simulations with different Milankovitch configurations to evaluate the robustness of the bifurcation structure. Finally, to detect signatures of climate multistability, we compare the simulation outputs with global mean sea level and temperature reconstructions [4], and we discuss preliminary results. 


[1] Barker et al. Science 387, eadp3491 (2025)

[2] Past Interglacials Working Group of PAGES, Rev. Geophys. 54, 162–219 (2016)

[3] Moinat et al. EGUsphere [preprint], https://doi.org/10.5194/egusphere-2025-2946 (2025).

[4] Clark et al. Science 390, eadv8389 (2025)

How to cite: Moinat, L., Vérard, C., Goldberg, D. N., Kasparian, J., Gerya, T., Marshall, J., and Brunetti, M.: Effect of the Milankovitch cycles on climate multistability for the last 1 Myr, EGU General Assembly 2026, Vienna, Austria, 3–8 May 2026, EGU26-7612, https://doi.org/10.5194/egusphere-egu26-7612, 2026.

EGU26-7891 | ECS | Orals | BG5.1

Timing and magnitude of Phanerozoic plant diversification are linked to paleogeography and atmospheric CO2 

Julian Rogger, Bethany Allen, Philip Donoghue, Dirk Karger, Tristan Salles, Alexander Skeels, and Dan Lunt

The evolution of plant diversity through Phanerozoic time is often understood as a succession of dominating evolutionary floras. Following the onset of land plant expansion and diversification in the Silurian to Middle Devonian, these include the successive dominance of plant ecosystems by spore-bearing plants (Paleophytic flora), gymnosperms (Mesophytic flora), and angiosperms (Cenophytic flora). The succession of these floras is associated with major evolutionary innovations in plant growth forms, physiology and reproductive systems, allowing for new strategies to utilize resources and diversify. In concert with biological innovation, environmental conditions over the Phanerozoic have strongly varied due to plate tectonic rearrangements of continents and topography, together with variation in atmospheric CO2 and climate. However, our understanding of how biological innovation and environmental changes interacted to shape the diversity of land plants through deep time is limited by a fragmentary geologic record of both plant diversity and environmental conditions.

Here, we reconstruct high-resolution climatologies (0.5° in longitude and latitude) over the last 470 million years using the fully coupled atmosphere-ocean general circulation model HadCM3 [1], the landscape evolution model goSPL [2], and the mechanistic climate downscaling algorithm CHELSA [3]. Applying the trait-based plant diversity model TREED [4] we then investigate how paleogeographic changes, variation in atmospheric CO2, and climate conditions shaped the Phanerozoic plant diversification. Combining the model-based diversity reconstruction with an analysis of 140,000 plant fossil occurrences from the Paleobiology Database, we show that Phanerozoic plant genus originations were strongly associated with variation in atmospheric CO2 and the tectonic supercontinent cycle, both limiting terrestrial resource and niche availability, and modulating the efficiency of environmental heterogeneity to generate diversity. We further show that the angiosperm terrestrial revolution is unique not only due to the intrinsic diversification potential of flowering plants, but also because of the exceptional environmental opportunities following the Pangea supercontinent breakup.


[1] P. J. Valdes, et al., The BRIDGE HadCM3 family of climate models: HadCM3@Bristol v1.0. Geoscientific Model Development 10 (10), 3715–3743 (2017), doi:10.5194/gmd-10-3715-2017, https://gmd.copernicus.org/articles/10/3715/2017/

[2] T. Salles, et al., Landscape dynamics and the Phanerozoic diversification of the biosphere. Nature 624 (7990), 115–121 (2023), doi: 10.1038/s41586-023-06777-z, https://www.nature.com/articles/s41586-023-06777-z

[3] D. N. Karger, et al., Climatologies at high resolution for the earth’s land surface areas. Scientific Data 4 (1), 170122 (2017), doi:10.1038/sdata.2017.122, https://www.nature.com/articles/sdata2017122

[4] J. Rogger, et al., TREED (v1.0): a trait- and optimality-based eco-evolutionary vegetation model for the deep past and the present (2025), doi:10.5194/egusphere-2025-6002, https://egusphere.copernicus.org/preprints/2025/egusphere-2025-6002/

How to cite: Rogger, J., Allen, B., Donoghue, P., Karger, D., Salles, T., Skeels, A., and Lunt, D.: Timing and magnitude of Phanerozoic plant diversification are linked to paleogeography and atmospheric CO2, EGU General Assembly 2026, Vienna, Austria, 3–8 May 2026, EGU26-7891, https://doi.org/10.5194/egusphere-egu26-7891, 2026.

During the Cambrian explosion, animals underwent profound ecological and evolutionary configuration. Small shelly fossils (SSFs), micrometre- to millimetre-scale skeletal elements representing multiple animal phyla, are particularly valuable for early Cambrian biostratigraphy and intercontinental correlation because of their widespread distribution. SSFs from North Greenland provide a high-resolution record of biotic and environmental change along the eastern margin of Laurentia. Here, we document a SSF assemblage that includes molluscs, hyoliths, brachiopods, ecdysozoans, echinoderms, and several problematic taxa from the Aftenstjernesø Formation in North Greenland. This integrated dataset enables detailed correlation with other Cambrian Series 2, Stage 4 successions on several palaeocontinents, including Gondwana, Siberia, and peri-Gondwana, based on shared taxa. During this period, many regions record a major faunal collapse associated with the first widely recognized Phanerozoic extinction event, the so-called Sinsk event, which has been linked to marine anoxia, decrease of diversity, and body-size reduction. In contrast, the Laurentian margin records pronounced taxonomic turnover dominated by faunal replacement rather than a net loss of diversity. This difference underscores the importance of palaeogeography and local geodynamic conditions in modulating how early Cambrian environmental crises were expressed biologically, and it demonstrates the utility of SSFs for reconstructing the biotic response to early Cambrian environmental crises.

How to cite: Oh, Y., Park, T.-Y. S., and Peel, J. S.: Global correlation of small shelly fossils from North Greenland and their importance for early Cambrian ecosystem change, EGU General Assembly 2026, Vienna, Austria, 3–8 May 2026, EGU26-8575, https://doi.org/10.5194/egusphere-egu26-8575, 2026.

EGU26-9305 | ECS | Orals | BG5.1

Geodynamic controls on long-term carbon cycle: insights from fully integrated virtual planets 

Marie Martin, Nicolas Coltice, Yannick Donnadieu, Pierre Maffre, Tristan Salles, Julian Rogger, Maëlis Arnould, Laurent Husson, Jonathon Leonard, Sabin Zahirovic, and Loïc Pellissier

Over geological timescales climate is regulated by the long carbon cycle, in which a balance is struck between CO2 degassing from the solid Earth and CO2 consumption by continental silicate weathering stabilizing atmospheric CO2 levels and maintain habitable conditions. Geodynamic processes regulate both CO2 degassing rates as well as the distribution and elevation of continents, thereby controlling continental weatherability and, ultimately, atmospheric CO2 and long-term climate.

However, long-term carbon cycle models are often limited by their definition of degassing independently of geodynamics evolution and their inevitable attribution of continental weatherability as the primary driver of long-term climate. Furthermore, the sparsity of the geological record means that models often rely on observations of present-day Earth to simulate past Earth states. All these constrains provide limited insight into how geodynamics interacts with climate, and surface processes to regulate atmospheric CO2 over geological timescales.

To address these limitations, we use fully integrated "digital siblings” of the Earth: 3D fully virtual planets designed to simulate internally consistent evolution of habitable planets over a several 100~Myr timescales, not necessarily aiming to replicate Earth. We integrate three numerical models in a dynamically interdependent framework: the geodynamic model StagYY (Coltice et al., 2019), the climate model PLASIM-GENIE (Holden et al., 2016), and the surface processes model goSPL (Salles et al., 2023).

From these simulations, we compute time-dependent CO2 degassing rates, using geodynamic outputs, and weathering fluxes, using the formulation of West (2012). Our results reveal fluctuations in degassing rate over a factor of about three, consistent with reconstruction of Earth (Müller et al., 2024) and correlated with seafloor production rate. Weatherability strongly depends on True Polar Wander during supercontinent aggregation, and on sea level fluctuations controlled by seafloor production. Together, these results highlight how geodynamic evolution may regulate the long-term carbon cycle through its interdependent effects on degassing and continental weatherability.

How to cite: Martin, M., Coltice, N., Donnadieu, Y., Maffre, P., Salles, T., Rogger, J., Arnould, M., Husson, L., Leonard, J., Zahirovic, S., and Pellissier, L.: Geodynamic controls on long-term carbon cycle: insights from fully integrated virtual planets, EGU General Assembly 2026, Vienna, Austria, 3–8 May 2026, EGU26-9305, https://doi.org/10.5194/egusphere-egu26-9305, 2026.

EGU26-10596 | ECS | Posters on site | BG5.1

 Numerical Simulation of True Polar Wander during Supercontinent Assembly 

Yusen Liu, Zheng-Xiang Li, and Xi Liu

The supercontinent cycle is often accompanied by True Polar Wander (TPW) events (Evans, 2003) — reorientation of the silicate Earth relative to its spin axis in response to internal mass redistribution. During TPW events, the maximum inertia axis (Imax) aligns with the spin axis to conserve the angular momentum (Gold, 1955). While an assembled supercontinent typically reside near the equator once it has developed its own degree-2 mantle structure driven by a circum-supercontinent subduction girdle with two antipodal superplumes (Li et al., 2023), this configuration is not always instantaneous with the assembly of a supercontinent. Supercontinent is in fact believed by some to assembly over a degree-1 mantle structure: a cold downwelling beneath the supercontinent and a hemispheric superplume on the opposite hemisphere (Zhong et al., 2007; Zhong and Liu, 2016). The resulting TPW behavior during such processes remains poorly constrained. Here we report a novel computational framework that couples 3D spherical mantle convection (CitcomS) with Earth’s rotational dynamics to simulate TPW driven by both convective mass anomalies and rotational bulge readjustment. We particularly examined the effect of varying upper/lower mantle viscosity ratios (ηum/ηlm).

Our results reveal a critical dependence of TPW behavior on viscosity stratification. For high ηum/ηlm (1:30), supercontinents assemble near the pole over a degree-1 mantle structure. Subsequent formation of a subduction girdle triggers TPW, transporting the supercontinent to the equator. In contrast, low ηum/ηlm (1:100) with a mean lower-mantle viscosity of 3×10²² Pa·s promotes equatorial assembly. Here, girdle development induces TPW that transports the supercontinent toward the pole, where it stabilizes for a considerable period. However, reducing lower-mantle viscosity destabilizes this polar position, causing rapid return to the equator. These dynamics arise because viscosity stratification determines the structure of the geoid kernel, which governs the geoid’s response to mass anomalies and thereby modulates TPW pathways. Our models demonstrate that before a stable degree-2 structure (e.g., modern LLSVPs) is developed, TPW can drive complex supercontinent trajectories—including equator-to-pole-to-equator round-trip migrations. Future work integrating plate reconstruction with viscosity constraints will refine predictions for specific supercontinents.

Evans, D. True Polar Wander and Supercontinents. Tectonophysics 362, 303-320 (2003).

Gold, T. Instability of the Earth’s axis of rotation. Nature 175, 526–529 (1955).

Li, Z.-X., Liu, Y. & Ernst, R. A dynamic 2000–540 Ma Earth history: From cratonic amalgamation to the age of supercontinent cycle. Earth-Science Reviews 238, 104336(2023).

Zhong, S., Zhang, N., Li, Z.-X. & Roberts, J. H. Supercontinent cycles, true polar wander, and very long-wavelength mantle convection. Earth and Planetary Science Letters 261, 551–564 (2007).

Zhong, S. & Liu, X. The Long-Wavelength Mantle Structure and Dynamics and Implications for Large-Scale Tectonics and Volcanism in the Phanerozoic. Gondwana Research 29: 83-104 (2016).

How to cite: Liu, Y., Li, Z.-X., and Liu, X.:  Numerical Simulation of True Polar Wander during Supercontinent Assembly, EGU General Assembly 2026, Vienna, Austria, 3–8 May 2026, EGU26-10596, https://doi.org/10.5194/egusphere-egu26-10596, 2026.

EGU26-10751 | ECS | Orals | BG5.1 | Highlight

Ending the Proterozoic: A Poetic Reimagining  

Kate Simpson

The Ediacaran-Cambrian Transition (approx. 550-539 mya) was one of the planet’s most revolutionary events, marking the emergence of diverse and abundant animals. Changing environmental conditions – such as oxygen availability, carbon cycling and nutrient levels – are likely to have been both constricting and galvanising, resulting in the rapid radiation of diverse body plans alongside a permanently altered ocean-atmosphere system. For my PhD research, as part of the UK’s first Doctoral Training Programme in Extinction Studies, I took a biocultural approach, seeking to acknowledge both the catastrophic and creative aspects of ecological regime shifts, whilst offering an artistic response to the complex processes that occur at key chronostratigraphic boundaries, from mass extinctions and evolutionary radiations to global oxidation events. Combining palaeontological study and creative practice, I established a novel methodology conducting ‘lyric fieldwork’ at Global Stratotypes and Section Points, writing a radically ‘indisciplined’ thesis and accompanying long poem spanning deep time, from the Precambrian through to the Phanerozoic. In this presentation – a performative reading – I will share an excerpt of my poem, focusing on the closing moments of the Proterozoic Eon and the start of the Phanerozoic Era, where the Ediacaran Period moves into the Cambrian Period, and where major geochemical perturbations correspond with an ‘explosion’ of biological innovations, from biomineralisation and the evolution of hard body parts to the rise of predator-prey dynamics and increased locomotive strategies. 

How to cite: Simpson, K.: Ending the Proterozoic: A Poetic Reimagining , EGU General Assembly 2026, Vienna, Austria, 3–8 May 2026, EGU26-10751, https://doi.org/10.5194/egusphere-egu26-10751, 2026.

EGU26-11212 | ECS | Posters on site | BG5.1

Modelling the Phanerozoic: Discrepancies and conformity with the geological record 

Chiara Krewer and Benjamin J. W. Mills

The Phanerozoic Eon is characterized by profound variability in global climate and biogeochemical cycles, driven by some combination of the formation and break up of supercontinents, changes to tectonic degassing, the emplacement of Large Igneous Provinces and by biosphere evolution. Understanding the key drivers of these environmental transitions is an ongoing challenge in deep-time Earth system science.

The Spatially Continuous IntegratiON (SCION) climate-biogeochemical model is often used for the analysis these processes, and has successfully reproduced a number of first-order global trends through the Phanerozoic (1) and Neoproterozoic (2), including reconstructions of atmospheric CO₂, atmospheric O₂, and surface temperature. But many notable mismatches still occur, e.g. during the late Paleozoic icehouse interval and in the underestimation of warmth during the Cretaceous greenhouse period. Furthermore, many novel or revised proxy records have not yet been compared to the model outputs (e.g. global erosion rates (3), or new records for Phanerozoic temperature evolution (4) and atmospheric CO₂ (5)).

Here, we present a new integration of multiple environmental proxy record compilations with the SCION model outputs. We determine the key periods of model-data mismatch and explore possible solutions within the current model formulation, or possible model extensions. We then suggest critical intervals where proxy development or sampling work may be best directed.


(1) Merdith et al., 2025, Science Advances

(2) Mills et al., 2025, Global and Planetary Change

(3) Hay et al., 2006, Palaeo3

(4) Judd et al., 2024, Paleoclimate

(5) Steinthorsdottir et al., 2024, Treatise on Geochemistry

How to cite: Krewer, C. and Mills, B. J. W.: Modelling the Phanerozoic: Discrepancies and conformity with the geological record, EGU General Assembly 2026, Vienna, Austria, 3–8 May 2026, EGU26-11212, https://doi.org/10.5194/egusphere-egu26-11212, 2026.

During the Neoproterozoic, early land biota consisted of cyanobacteria, microalgae and various fungi or fungi-like communities. Although called micro-organisms, their role in stabilising environments, and driving and controlling nutrient cycles [1], creates a macro-scale impact. Photosynthetic microbial mats are predicted to have been present ~3 billion years ago, creating microcosms of oxygen-rich environments that contribute towards global net primary productivity, weathering and nitrogen fixation [2]. However due to the lack of fossil evidence and understanding of their role in a non-vegetated environment, it is unclear what their impact is on biogeochemical cycling and thus the shaping of Neoproterozoic climate. Building on the new process based spatial vegetation model [3], we try to understand the role of expanding microbial communities on events such as the Neoproterozic Oxygenation Event and Snowball Earth.


[1] Taylor, T.N., Krings, M. (2005) Fossil microorganisms and land plants: Associations and interactions. Symbiosis 40:119-135

[2] Lenton, T.M., Daines, S.J. (2016) Matworld- the biogeochemical effects of early life on land. New Phytologist 215: 505-507

[3] Gurung, K., Field, K.J, et al. (2024) Geographic range of plants drives long-term climate change. Nature Comms 15: 1805

How to cite: Gurung, K. and Mills, B. J. W.: Influence of terrestrial productivity by photosynthetic microbial mats on biogeochemical cycles over the Neoproterozoic landscape, EGU General Assembly 2026, Vienna, Austria, 3–8 May 2026, EGU26-11296, https://doi.org/10.5194/egusphere-egu26-11296, 2026.

EGU26-11517 | ECS | Posters on site | BG5.1

Modelling the changes in marine ecosystem and carbon cycle after the K/Pg boundary event 

Tomoki Takeda and Eiichi Tajika

The mass extinction occurred at the Cretaceous/Paleogene (K/Pg) boundary event, approximately 66 million years ago, which resulted in global-scale biotic turnover that was ecologically diverse but selective. This extinction coincides with both the activities of Deccan Traps volcanism spanning approximately one million years and a large asteroid impact which formed the Chicxulub crater on the Yucatan Peninsula, Mexico. These two events and their environmental and biological consequences left a global imprint in the deep-sea sediments. Deep-sea sediment records indicate the collapse of the oceanic bottom-to-surface gradient of carbon isotope ratio and the carbonate compensation depth (CCD) deepening for several hundred thousand years after the K/Pg boundary. The collapse of the carbon isotope gradient has been variously interpreted as changes in biological production, including a global shutdown of primary production, reduced export production, and enhanced spatial heterogeneity. However, these interpretations remain insufficiently tested for consistency with the geological records. The pronounced long-term decline of carbonate mass accumulation rates (MAR) after the K/Pg boundary is also indicated from deep-sea records. This suggests the necessity of a prolonged reduction in biological carbonate productivity. However, existing boron isotope-based ocean surface pH reconstructions do not support prolonged and severe ocean acidification, making it difficult to explain the long-term decrease of carbonate MAR.

Here, we first investigate changes in marine biological productivity and particulate organic matter (POM) decomposition rate using a vertical one-dimensional ocean carbon cycle model to interpret the collapse of the vertical carbon isotope gradient. We find that, provided POM production and burial persist in coastal regions, the collapse can be explained by either reduced export productivity in the open ocean or reduced POM sinking rates, but cannot discriminate them from the modeling of this study with existing data. These results support the discussion of Kump (1991) and the Living Ocean hypothesis (e.g., D’Hondt et al., 1998). In this model, the CCD deepened, but carbonate production rate was comparable to previous modelling studies, and we were unable to reproduce the pronounced long-term decline of carbonate MAR after the K/Pg boundary event.

Next, we explore an alternative explanation for the long-term decline in carbonate MAR based on changes in the structure of primary producers. At the K/Pg boundary, calcareous nannoplankton, such as coccolithophores, experienced catastrophic extinction, whereas non-calcifying phytoplankton, such as diatoms, were relatively resilient. In addition, enhanced diatom productivity has been suggested for several hundred thousand years following the K/Pg boundary in the South Pacific. Therefore, climate change and ocean eutrophication following the K/Pg boundary may have favored diatom primary production at the expense of carbonate production by calcareous nannoplankton, but its quantitative contribution remains poorly constrained. We will distinguish calcareous nannoplankton and diatoms by their physiological characteristics and explore how background environmental changes sustain enhanced diatom abundance and reduced carbonate production.

How to cite: Takeda, T. and Tajika, E.: Modelling the changes in marine ecosystem and carbon cycle after the K/Pg boundary event, EGU General Assembly 2026, Vienna, Austria, 3–8 May 2026, EGU26-11517, https://doi.org/10.5194/egusphere-egu26-11517, 2026.

EGU26-11558 | ECS | Posters on site | BG5.1

Paleolatitude bias in reconstructions of Cenozoic greenhouse climates 

Bram Vaes, Yannick Donnadieu, Alexis Licht, Erwan Pineau, Pierre Maffre, Thomas Chalk, and Pietro Sternai

Cenozoic greenhouse climates offer important insights into Earth’s climate system and carbon cycle under elevated CO2 conditions. A major challenge in simulating these warm intervals lies in the accurate reconstruction of the paleogeography, yet its impact on modeled climates and their agreement with proxy data remains poorly quantified. In this study, we systematically assess the sensitivity of fully coupled climate simulations to alternative paleogeographic reconstructions for the Paleocene, early Eocene, and middle-late Eocene. Using the IPSL-CM5A2 Earth System Model, we find that regional climates are particularly sensitive to the paleolatitudinal position of landmasses and ocean basins. Latitudinal shifts of more than 5°, arising from the choice of mantle versus paleomagnetic reference frame, significantly alter modeled regional temperature and precipitation patterns, as well as ocean circulation patterns. Moreover, we demonstrate that reconciling simulated climates with temperature proxy data depends strongly on the reconstructed paleolatitude of the proxy sites. In regions such as the southwest Pacific, correcting for paleolatitude bias induced by a mantle frame reduces model-data temperature misfits by up to 5°C. Our results further show that the regional climatic impact of paleogeography can equal or even exceed that of a doubling of atmospheric CO2, particularly at mid-latitudes. These findings highlight the importance of using accurate paleogeographic reconstructions and an appropriate reference frame for improving paleoclimate simulations and their integration with proxy data.

How to cite: Vaes, B., Donnadieu, Y., Licht, A., Pineau, E., Maffre, P., Chalk, T., and Sternai, P.: Paleolatitude bias in reconstructions of Cenozoic greenhouse climates, EGU General Assembly 2026, Vienna, Austria, 3–8 May 2026, EGU26-11558, https://doi.org/10.5194/egusphere-egu26-11558, 2026.

EGU26-13853 | ECS | Orals | BG5.1

Phanerozoic paleogeography and its impact on long-term climatic change and habitability 

Eivind Straume, Trond Torsvik, Mathew Domeier, and Aleksi Nummelin

Paleogeography is a key boundary condition for reconstructing Earth’s climatic evolution and habitability. On geological timescales, paleogeographic changes control the latitudinal positioning of environments, governing received and reflected solar radiation and climatic zonation. The distribution and morphology of continents and oceans further control ocean–atmosphere circulation and influence the evolution and dispersal of marine and terrestrial biota.

Here we present a new effort to construct a continuous (1 Myr resolution) global paleogeographic digital elevation model for the entire Phanerozoic (540–0 Ma). The reconstructions integrate new and previously published plate models, and global and regional paleo-elevation datasets. Building on and extending methodologies previously applied to the Cenozoic (66–0 Ma), our approach incorporates dynamic topography from mantle circulation (100–0 Ma), oceanic lithospheric ages, sediment thickness, detailed continental margin evolution, parameterized subduction zones, and spatiotemporal interpolation between topographic datasets of different time intervals. The reconstructions focus in detail on key paleogeographic features relevant for ocean circulation, climate, and biogeography, including oceanic gateways, land bridges, and large-scale orogenies.

Finally, we present results from a variety of fully coupled Earth system model experiments, mainly with Cenozoic paleogeographic boundary conditions (e.g., present, Eocene–Oligocene, Late Eocene, and the DeepMIP Early Eocene ensemble), to demonstrate how paleogeographic changes influences planetary energy budgets, ocean circulation, and climate sensitivity. These results highlight systematic relationships that offer potential for extrapolation throughout the Phanerozoic.

How to cite: Straume, E., Torsvik, T., Domeier, M., and Nummelin, A.: Phanerozoic paleogeography and its impact on long-term climatic change and habitability, EGU General Assembly 2026, Vienna, Austria, 3–8 May 2026, EGU26-13853, https://doi.org/10.5194/egusphere-egu26-13853, 2026.

EGU26-14220 | Posters on site | BG5.1

Reconstructing volcanic ash input to the Pacific Ocean: how does it link to Cenozoic climate? 

Jack Longman, Ann G. Dunlea, and Andrew S. Merdith

Volcanic ash is known to influence a range of biogeochemical processes once deposited in the oceans, with explosive volcanism inputting large amounts of highly reactive and nutrient-rich material to the oceans every year. This material can stimulate increases in primary productivity, with ash alleviating nutrient limitations. This may eventually lead to enhanced carbon burial at the seafloor, with evidence from deep time suggesting this process may play a role in episodes of global cooling. As a result, reconstructing the amount of volcanic ash entering the oceans is important for understanding the role explosive volcanic activity has on global climates. However, extant records of changing volcanic intensity are either limited to regional studies of small numbers of volcanoes or are based on imperfect methods such as visible tephra layer counting.

In this work, we use the output of a model-derived dataset of sediment provenance from the Pacific Ocean, which provides estimates of changing volcanic material input for 67 sites. We use these data, and an inverse weighting approach, to reconstruct changing levels of volcanic ash input for the Cenozoic Period (66 million years ago to present). With around 75% of all active volcanoes located in the Pacific Ring of Fire, this record likely represents the majority of all volcanic ash through the Cenozoic, and so we compare it to known climate change through the period. We see increases in volcanic ash input around 35 million years ago and 10 million years ago, which can be linked to eruptions from the Sierra Madre Occidental, and Izu Bonin Arc, respectively. The first uptick occurs at the same time as the Eocene-Oligocene transition, an episode of global climate cooling, whilst the second covers the descent into the Pleistocene glaciations. These findings hint at the climatic impact of ash input, one which has major implications for the development of the Earth system.

How to cite: Longman, J., Dunlea, A. G., and Merdith, A. S.: Reconstructing volcanic ash input to the Pacific Ocean: how does it link to Cenozoic climate?, EGU General Assembly 2026, Vienna, Austria, 3–8 May 2026, EGU26-14220, https://doi.org/10.5194/egusphere-egu26-14220, 2026.

EGU26-15332 | ECS | Orals | BG5.1

Local diversity remained relatively stable across the Great Ordovician Biodiversification Event (GOBE) in South China 

Hanhui Huang, Tianyi Chu, Yiying Deng, Linna Zhang, Junxuan Fan, and Erin E. Saupe

The Great Ordovician Biodiversification Event (GOBE) marks one of the most profound radiations of marine life in Earth history. Numerous hypotheses have been proposed for the drivers of the increase in richness during this interval. Distinguishing among these factors requires biodiversity to be evaluated at both local and regional scales across different environments. Here, we compiled a high-resolution, assemblage-level dataset comprising 557 stratigraphic sections and 12,898 fossil occurrences from South China. We integrated these records using a quantitative stratigraphic approach, to examine changes in local (assemblage-level) and regional marine species richness from the Furongian (late Cambrian) to the Middle Ordovician across four depositional environments: littoral, platform, slope, and deep-shelf. We additionally assessed faunal differences across environments and geographic space. Our results suggest regional richness increased four-fold during the GOBE, closely paralleling the spatial expansion of fossil-bearing environments, especially the platform and slope. In contrast, local (assemblage-level) richness remained relatively stable and low through the study interval, despite fluctuations within the slope environment. The taxonomic composition of the platform and slope environments diverged during the GOBE, and spatial turnover increased from the early to late stages of the GOBE. Our findings suggest the expansion of shallow-marine environments tied to increasing sea levels may have been one of the primary drivers of the Ordovician marine biodiversification in South China, with increased faunal differentiation across both environment and space.

How to cite: Huang, H., Chu, T., Deng, Y., Zhang, L., Fan, J., and Saupe, E. E.: Local diversity remained relatively stable across the Great Ordovician Biodiversification Event (GOBE) in South China, EGU General Assembly 2026, Vienna, Austria, 3–8 May 2026, EGU26-15332, https://doi.org/10.5194/egusphere-egu26-15332, 2026.

EGU26-15410 | ECS | Orals | BG5.1

Biogeodynamic controls on Caribbean community structure during the formation of the Isthmus of Panama  

Amanda Godbold, Aaron O’Dea, Ethan L. Grossman, Brigida de Gracia, Javier Pardo Díaz, Sven Pallacks, Jonathan Todd, Kenneth Johnson, and Sean R. Connolly

The progressive restriction of seaways between the Caribbean and Pacific during the formation of the Isthmus of Panama fundamentally reorganized ocean circulation, biogeochemical cycling, and marine ecosystem structure across the tropical Americas. This tectonically driven reorganization provides a natural experiment for examining how long-term Earth system processes influence the structure, stability, and resilience of biological communities. The Bocas del Toro region of Caribbean Panama preserves a rich fossil record that captures ecological responses to these coupled physical and environmental changes.

This study examines temporal variation in marine community composition and functional trait structure using fossil assemblages from four marine formations: Cayo Agua, Escudo de Veraguas, Old Bank, and Isla Colón, spanning approximately 6.0 to 0.43 Ma. The analyses integrate multiple taxonomic groups, including bivalves, gastropods, bryozoans, corals, and fishes, enabling comparison of ecological responses among organisms that differ in life habit, mobility, feeding strategy, tiering, and ecological function. By incorporating multiple clades with contrasting ecologies, this approach allows assessment of whether community change reflects reorganization within broadly conserved functional roles or more fundamental shifts in ecosystem structure.

Community dynamics are quantified using a combination of model-based ordination, taxon-specific response analyses, and functional diversity metrics applied within a stratigraphic framework. These methods explicitly account for variation in sampling intensity and taxonomic richness, allowing ecological patterns to be distinguished from sampling effects. Biological patterns are evaluated alongside sedimentological and geochemical records to place community dynamics within their environmental context. Environmental–trait and environmental–taxon relationships are evaluated within a generalized linear latent variable modeling (GLLVM) framework to assess how changes in physical conditions, sedimentary processes, and geochemical variability influence community reorganization before, during, and after the formation of the Isthmus of Panama. Comparisons among contemporaneous formations allow local ecological responses to be distinguished from regionally coherent environmental signals.

Overall, this study aims to clarify how long-term tectonic and oceanographic reorganization shapes marine ecosystem structure and stability, providing a stratigraphically grounded perspective on the links between Earth system processes and ecological dynamics over geological timescales.

How to cite: Godbold, A., O’Dea, A., Grossman, E. L., de Gracia, B., Pardo Díaz, J., Pallacks, S., Todd, J., Johnson, K., and Connolly, S. R.: Biogeodynamic controls on Caribbean community structure during the formation of the Isthmus of Panama , EGU General Assembly 2026, Vienna, Austria, 3–8 May 2026, EGU26-15410, https://doi.org/10.5194/egusphere-egu26-15410, 2026.

The reconstruction of paleogeography, that is, the reconstruction of Earth’s surface elevation within a plate tectonic context, is crucial for understanding changes in past climate, sea level, as well as variations in biodiversity through deep time. Although often presented as picturesque maps in publications or even museums, paleogeography reconstructions can provide important geoscientific context and serve as a key boundary condition in many aspects of Earth science including, but not limited to, the simulation of past climates and landscape evolution modelling. However, despite the potential influence and impact of paleogeography on many aspects of Earth’s history, there are very few published global reconstructions of paleogeography, and available reconstructions are often constrained to a single time slice (e.g., Middle Miocene, ~15 Ma), or are available in and represent longer (~5–10 Myr) increments. Additionally, there are major uncertainties in reconstructions of paleogeography, in part due to the poor temporal and/or spatial coverage of proxy data, but also uncertainties within the underlying workflows used to derive its key components. Here, I examine published paleogeography reconstructions throughout the Cenozoic, focusing on key time intervals. I compare the similarities and differences in reconstructions, including aspects of their workflows and sources of uncertainties within them. Finally, I present new approaches for generating paleogeography and quantified uncertainties in a more open and reproducible framework, allowing for future advances in proxy data and other constraints to be incorporated.

How to cite: Wright, N.: Current state and future directions in paleogeography reconstructions throughout the Cenozoic, EGU General Assembly 2026, Vienna, Austria, 3–8 May 2026, EGU26-15492, https://doi.org/10.5194/egusphere-egu26-15492, 2026.

Insects are the most diverse groups on earth and preserved with plenty of fossils. Disentangling their ecological roles are crucial for understanding the evolution of terrestrial ecosystems, however, reconstructing the adaptive evolution of extinct insects has been proven to be highly challenging. Here, we conduct integrated approaches to reveal the macroevolution of two insect clades, katydids (Hagloidea) and giant cicadas (Palaeontinidae), on the basis of newly compiled morphological datasets. Our results provide novel information for coevolution of insects and vertebrates in the Mesozoic, and highlight the significance of fossil morphologies. 1) Acoustic evolution of katydids. We present a database of the stridulatory apparatus and wing morphology of Mesozoic katydids and analyze the evolution of their acoustic communication. Our results demonstrate that katydids evolved complex acoustic communication including mating signals, intermale communication, and directional hearing, by the Middle Jurassic; evolved high-frequency musical calls by the Late Triassic. The Early—Middle Jurassic katydid transition coincided with the diversification of mammalian clades, supporting the hypothesis of the acoustic coevolution of mammals and katydids. 2) Flight evolution of giant cicadas. We reveal the flight evolution of the Mesozoic arboreal insect clade Palaeontinidae. Our analyses unveil a faunal turnover from early to late Palaeontinidae during the Jurassic–Cretaceous, accompanied by a morphological adaptive shift and improvement in flight abilities including increased speed and enhanced maneuverability. The adaptive aerodynamic evolution of Palaeontinidae may have been stimulated by the rise of early birds, supporting the hypothesis of an aerial evolutionary arms race between Palaeontinidae and birds.

How to cite: Xu, C.: Coevolution of Insects and vertebrates in the Mesozoic: examples from katydids and giant cicadas, EGU General Assembly 2026, Vienna, Austria, 3–8 May 2026, EGU26-15628, https://doi.org/10.5194/egusphere-egu26-15628, 2026.

EGU26-16017 | ECS | Posters on site | BG5.1

Tectonic and climatic influence on sediment-hosted ore deposits in deep time  

Sheree Armistead and Simon Williams

Sediment-hosted copper–cobalt and base metal deposits are critical to the global energy transition, yet the environmental conditions that favour their formation and preservation through Earth history remain poorly understood. Evaporites are considered crucial for the formation of sediment-hosted ore deposits as they generate saline brines that circulate metals and sulphur. These tend to form in desert belts at particular latitudes where evaporation outpaces rainfall. The world’s largest sediment-hosted Cu-Co deposits – located in the Central African Copperbelt – are hosted by Neoproterozoic rocks that formed during one of Earth’s most chaotic climatic periods. Whether this is a coincidence, or whether extreme climate plays a role in mineralisation remains to be tested. The relative roles of tectonic setting, climate and latitude remain poorly constrained but have important implications for predicting where sediment-hosted ore deposits formed in deep time.

We integrate a global database of sediment-hosted ore deposits with full-plate tectonic reconstructions spanning the last billion years to explore the relationship between deposits, paleolatitude and tectonic setting. Plate reconstructions and fossil rift margin datasets are used to assess the spatial association between ore deposits and long-lived extensional settings, with a focus on Neoproterozoic basins.

Preliminary results indicate a spatial correlation between sediment-hosted ore deposits and rifted continental margins. Paleolatitude reconstructions suggest that many deposits formed at low to mid latitudes; however, their distribution varies through time, which may be driven by major climatic fluctuations, including global-scale glaciations. Ongoing work integrating depositional age constraints from key regions and paleoclimate model outputs aims to further quantify these relationships and refine predictive frameworks for underexplored sedimentary basins.

How to cite: Armistead, S. and Williams, S.: Tectonic and climatic influence on sediment-hosted ore deposits in deep time , EGU General Assembly 2026, Vienna, Austria, 3–8 May 2026, EGU26-16017, https://doi.org/10.5194/egusphere-egu26-16017, 2026.

EGU26-16603 | ECS | Posters on site | BG5.1

Linking paleogeography and Earth system dynamics to evolutionary innovation during the Cambrian Explosion  

Anna Lewkowicz, Antonin Affholder, Nicolas Coltice, Marie Martin, Tristan Salles, Niklas Werner, Jonathon Leonard, and Loïc Pellissier

Geodynamic redistribution of continents fundamentally reshapes Earth’s climate, ocean circulation, and nutrient cycles, thereby exerting a first-order control on biological evolution. A possible example of this coupling is the Cambrian explosion, a rapid diversification of animal life that followed profound tectonic, climatic, and oceanographic reorganization during the late Neoproterozoic. However, identifying the causal drivers of the Cambrian explosion remains challenging due to the fragmentary geological record.  To circumvent these limitations, we implement aintegrated, mechanistic simulation framework that integrates the key Earth system processes governing climate, circulation, surface evolution, and marine biogeochemistry, allowing their interactions to be explored consistently in space and time. These components provide time-evolving boundary conditions for biological productivity, oxygen availability, and nutrient supply, which are then used to study how changing environmental states shape the range of biologically feasible organismal strategies.  Rather than simulating realized biodiversity or reconstructing a specific episode of Earth history, the model explores the full dynamical evolution of an Earth-like system across a supercontinent cycle, from continental assembly to breakup. In this framework, changing Earth system states expand or restrict the range of biologically feasible organismal strategies, providing a quantitative link between paleogeographic restructuring and the environmental opening of functional trait space relevant to the Cambrian explosion.  

How to cite: Lewkowicz, A., Affholder, A., Coltice, N., Martin, M., Salles, T., Werner, N., Leonard, J., and Pellissier, L.: Linking paleogeography and Earth system dynamics to evolutionary innovation during the Cambrian Explosion , EGU General Assembly 2026, Vienna, Austria, 3–8 May 2026, EGU26-16603, https://doi.org/10.5194/egusphere-egu26-16603, 2026.

EGU26-16889 | Orals | BG5.1

Biogeodynamic Barrier: Lithospheric Delamination and Delayed Miocene Faunal Migration in the Anatolian Highland 

Oğuz H Göğüş, Joel Saylor, Demet Biltekin, Kurt Sundell, Chelsea Mackaman-Lofland, Xutong Guan, Cem Özyalçın, and Ömer Bodur

Biogeodynamics research seeks to link lithospheric scale processes with surface ecosystem evolution. Western Anatolia-Aegean region provides a critical testing ground for this coupling, where mantle dynamics have driven dramatic topographic reversals. Tectonostratigraphic and geomorphic insights indicate that Western Anatolia maintained elevated landscapes prior to and through Early Miocene extension. These observations are inconsistent with simple rift-related thinning but support dynamic uplift driven by removal of dense lithospheric mantle. Here, we integrate geodynamic modeling with geological observations to reconstruct the region's paleoelevation and its control on intercontinental faunal connectivity.  Our results indicate that lithospheric delamination (slab peel-back) was the primary driver of Early Miocene topographyNumerical models show that slab peeling from beneath the crust and subsequent asthenospheric upwelling triggered a transient surface uplift of > 1 km and southward younging volcanism from İzmir-Ankara suture to the western Taurides. Supported by metamorphic constraints indicating crustal thickness consistent with elevations of 2–3 km, these results are in good agreement with the existence of a paleo-"Anatolian Highland" at ~20 Ma Crucially, this geodynamically sustained topography acted as a significant biogeographic barrier. Synthesizing our models with recent fossil record analyses, we suggest that high elevations delayed faunal migration between Eurasia and Afro-Arabia, severing connectivity despite the closure of the Neo-Tethys. The timing of increased biotic interchange in the Middle–Late Miocene coincides with evidence for topographic lowering linked to post-delamination driven by crustal stretchingWe conclude that the thermal and mechanical evolution of the Anatolian lithosphere exerted a first-order control on the timing of biotic exchange, highlighting the direct link between lithosphere dynamics and vertebrate evolution.

How to cite: Göğüş, O. H., Saylor, J., Biltekin, D., Sundell, K., Mackaman-Lofland, C., Guan, X., Özyalçın, C., and Bodur, Ö.: Biogeodynamic Barrier: Lithospheric Delamination and Delayed Miocene Faunal Migration in the Anatolian Highland, EGU General Assembly 2026, Vienna, Austria, 3–8 May 2026, EGU26-16889, https://doi.org/10.5194/egusphere-egu26-16889, 2026.

EGU26-17018 | ECS | Posters on site | BG5.1

Assessing Sediment Flux Evolution for the entire Phanerozoic with Palaeogeography and Palaeoclimate simulations 

Florian Franziskakis, Niklas Werner, Christian Vérard, Sébastien Castelltort, and Grégory Giuliani
Deep-time Earth reconstructions, through plate tectonic models and derived products such as palaeogeography provide information about the location of continents, the size of oceans basins and the variations in sea level, hundreds of millions of years back.
Due to the uncertainties in plate tectonic models, and the current limitations of palaeogeographic reconstructions, understanding global scale surface processes such as the erosion of continental areas, the transport of these sediments and their deposition remains a challenge, despite recent advances (Salles et al., 2023a), who calculated the sediment fluxes at the global scale over the last 100 million years with the goSPL software (Salles et al., 2023b).
We present here new sediment fluxes calculations spanning the entire Phanerozoic (44 reconstructions over the last 545 million years). We use high resolution (10x10km) palaeogeographic maps created from the PANALESIS plate tectonic model (Franziskakis et al., 2025), together with climate simulations from the PLASIM model, to calculate the sediment flux at the local (drainage basin) scale following the BQART equation (Syvitski & Milliman, 2007).
We consider scenarios with increasing complexity in parameters, to assess the influence of ice coverage, climate zones and intensity of runoff. Our estimates allow us to better understand the distribution of sediment fluxes at outlet points and their variation in time at the global scale.
 
References:
Franziskakis, F., Vérard, C., Castelltort, S., & Giuliani, G. (2025). Global Quantified Palaeogeographic Maps and Associated Sea-level Variations for the Phanerozoic using the PANALESIS Model [Dataset]. Zenodo. https://doi.org/10.5281/zenodo.15396265
Salles, T., Husson, L., Rey, P., Mallard, C., Zahirovic, S., Boggiani, B. H., Coltice, N., & Arnould, M. (2023). Hundred million years of landscape dynamics from catchment to global scale. Science, 379(6635), 918–923. https://doi.org/10.1126/science.add2541
Salles, T., Husson, L., Lorcery, M., & Hadler Boggiani, B. (2023). Landscape dynamics and the Phanerozoic diversification of the biosphere. Nature, 624(7990), 115–121. https://doi.org/10.1038/s41586-023-06777-z
Syvitski, J., & Milliman, J. (2007). Geology, Geography, and Humans Battle for Dominance over the Delivery of Fluvial Sediment to the Coastal Ocean. Journal of Geology, 115(1), 1–19. https://doi.org/10.1086/509246

How to cite: Franziskakis, F., Werner, N., Vérard, C., Castelltort, S., and Giuliani, G.: Assessing Sediment Flux Evolution for the entire Phanerozoic with Palaeogeography and Palaeoclimate simulations, EGU General Assembly 2026, Vienna, Austria, 3–8 May 2026, EGU26-17018, https://doi.org/10.5194/egusphere-egu26-17018, 2026.

EGU26-17538 | Posters on site | BG5.1

Timing and mode of initial marine flooding in the southern Pannonian Basin: new U-Pb age constraints from the Prnjavor and Tuzla basin 

Oleg Mandic, Nevena Andrić-Tomašević, Robert Šamarija, Stjepan Ćorić, Ljupko Rundić, Armin Zeh, Davor Pavelić, Sejfudin Vrabac, and Patrick Grunert

The Pannonian Basin in Central and Southeastern Europe is a huge landlocked basin delineated by Alpine-Carpathian-Dinarides chain. This extensional backarc basin originating by tectonic rifting in the Early Miocene, was successively flooded by the Central Paratethys Sea. Slovenian Corridor along the Alpine-Dinarides junction enabled its communication with the Mediterranean Sea.  Marine flooding of the southern part of the Pannonian Basin - between the Styrian Basin in Austria and Velika Morava Basin in Serbia - is still poorly understood. While the conflicting biostratigraphic interpretations contribute to ongoing discussion on timing and mode of this major environmental turnover, independent radiometric data are still rare.  The present study contributes three new U-Pb zircon ages which are the very first such data on the Miocene marine transgression in northern Bosnia and Herzegovina. Dating from autochthonous tephra airfalls prove uniformly the middle Badenian age for marine transgression, with a 0.5 Ma eastwards-younging trend of its onset. This trend stays in line with the literature data suggesting a steady eastwards propagation of extension along the Pannonian Basin southern margin. Towards a better understanding of interplay between tectonic and glacioeustatic forcing of the regional marine progression, a review of published stratigraphic data has been conducted, depicted correspondingly in four paleogeographic maps of one-million-year resolution. Building on these data, we bracket the initial gradual flooding interval to the late Burdigalian–early Serravallian time interval, respectively, attaining up to 3.5 Myr overall duration in a step-wise manner.  Although the tectonic phases were main drivers in the creation of accommodation space, along the NE Dinarides, glacioeustasy driven by the global climate suspended landward propagation of the coastline during sea-level low-stands at long obliquity nodes. This result enables a more precise reconstruction of the interplay between landward sea ingression, regional climate change and effects to endemic evolution of biota inhabiting long-lived paleolakes in adjoining intramountainous basins.

This research was funded by the Austrian Science Fund (FWF) grant DOI 10.55776/I6504 and by the Deutsche Forschungsgemeinschaft (DFG) grant no. TO 1364/3-1.

How to cite: Mandic, O., Andrić-Tomašević, N., Šamarija, R., Ćorić, S., Rundić, L., Zeh, A., Pavelić, D., Vrabac, S., and Grunert, P.: Timing and mode of initial marine flooding in the southern Pannonian Basin: new U-Pb age constraints from the Prnjavor and Tuzla basin, EGU General Assembly 2026, Vienna, Austria, 3–8 May 2026, EGU26-17538, https://doi.org/10.5194/egusphere-egu26-17538, 2026.

EGU26-18914 | Posters on site | BG5.1

Understanding the drivers of the Phanerozoic strontium isotope record 

Benjamin Mills, Jack Longman, and Andrew Merdith

The strontium isotope ratio of 87Sr/86Sr is one of the best-defined tracers of Earth’s evolving surface environment over the Eon of macroscopic life, due to the long residence time of Sr in the ocean. If offers tantalising clues about past CO2 emissions and the rate of continental weathering, which are vital considerations for understanding Earth’s changing surface temperature, climate, and atmospheric oxygen abundance. However, the Sr isotope ratio has strong regional lithological control, with mafic and felsic rocks having dramatically different isotopic compositions, which limits any simple analysis of Sr ratios over Phanerozoic timescales. We present an update to the SCION Earth Evolution Model, which allows it to track the spatial distribution of lithologies and Sr compositions over deep time, enabling regional-scale Sr isotope inputs to be assessed in the context of wider Earth system evolution. We use this to explore to what degree we currently understand the Phanerozoic Sr record, and how it can be used as a proxy to validate or falsify theories about long-term climate change and oxygen levels.

How to cite: Mills, B., Longman, J., and Merdith, A.: Understanding the drivers of the Phanerozoic strontium isotope record, EGU General Assembly 2026, Vienna, Austria, 3–8 May 2026, EGU26-18914, https://doi.org/10.5194/egusphere-egu26-18914, 2026.

EGU26-19123 | Posters on site | BG5.1

 Arctic cold-water corals record depleted radiocarbon signatures during the Holocene  

Jacek Raddatz, Martin Butzin, Sascha Flögel, Andres Rüggeberg, Klaus Wallmann, and Norbert Frank

Changes in atmospheric CO2 concentrations during the last deglaciation have been attributed to the release of fossil carbon. However, the processes and mechanisms of the various carbon sources that contributed to this change in the carbon cycle are not yet fully understood. Cold-water corals and their ecosystems are considered important carbonate factories in the Arctic and are particularly vulnerable to changes in the carbon cycle and present an unique archive recording such changes.

Here, we present paired 230Th/U and radiocarbon (14C) measurements on pristine fragments of the scleractinian cold-water coral Desmophyllum pertusum, combined with measurements of stable carbon isotopes (δ13C) on various benthic foraminifera from a sediment core taken from the Lopphavet CWC reef (71°N, 21°E) covering the last 10 kyrs. This combined approach helps to narrow down sources of carbon cycled within this Holocene CWC reef in the Arctic.

Our results show Δ14C values that are as low as -500 ‰ resulting in extremely high bottom- atmosphere ages of up to 6000 years. Radiocarbon simulations performed with the 14C-equipped model CLIMBER-X show that such negative Δ14C values and high ventilation ages cannot be explained by oceanographically controlled changes in the marine radiocarbon cycle of the Arctic Ocean. Furthermore, the δ¹³C values of various benthic foraminifera with different microhabitats show the expected offsets, suggesting that the carbon source does not originate from dissociations of gas-hydrates.

We suggest that a continuous retreat of the ice-sheets has led to an accelerated release of terrestrial organic carbon into the Norwegian Arctic Ocean on which the corals fed on.  

Our results therefore highlight the need for further studies that constrain the mechanism and processes of organic carbon pathways from high-latitude terrestrial regime into the Arctic Ocean, especially in high latitude carbonate factories.  


How to cite: Raddatz, J., Butzin, M., Flögel, S., Rüggeberg, A., Wallmann, K., and Frank, N.:  Arctic cold-water corals record depleted radiocarbon signatures during the Holocene , EGU General Assembly 2026, Vienna, Austria, 3–8 May 2026, EGU26-19123, https://doi.org/10.5194/egusphere-egu26-19123, 2026.

EGU26-19221 | ECS | Orals | BG5.1

Reef crises as an Earth-system driver of marine biodiversity loss 

Danijela Dimitrijevic and Wolfgang Kiessling

Metazoan reefs have experienced repeated crises throughout the Phanerozoic, marked by geologically rapid declines in reef carbonate production. While some of these crises coincided with major biotic turnovers, others left reef-building communities largely intact, and no simple relationship exists between crisis magnitude and ecological change. Consequently, the extent to which reef crises reshaped reef community composition and whether they triggered cascading extinctions among reef-dependent organisms remains unresolved.

Here, we use a global compilation of reef-related fossil occurrences over the Phanerozoic to test whether reef crises affected not only reef builders but also the wider marine biota. We distinguish three cohorts of reef affinity: (i) metazoan reef builders (i.e. colonial corals and sponges), (ii) reef dwellers, and (iii) non-reef organisms. By integrating these data with stage-level changes in reef volume, we evaluate extinction dynamics across four major Phanerozoic reef crises.

We find that reef builders and reef dwellers were tightly coupled over the last 500 million years. Although their background extinction patterns do not indicate simple, one-to-one cascading extinctions, extinction rates in both groups increased significantly during intervals of major reef loss. In contrast, non-reef organisms show no comparable response to reef crises. Our findings highlight the fundamental ecological interdependence between reef-building organisms and the diverse communities they support, and they underscore that the collapse of reef frameworks likely entails the loss of far more biodiversity than reef-building organisms alone.

How to cite: Dimitrijevic, D. and Kiessling, W.: Reef crises as an Earth-system driver of marine biodiversity loss, EGU General Assembly 2026, Vienna, Austria, 3–8 May 2026, EGU26-19221, https://doi.org/10.5194/egusphere-egu26-19221, 2026.

EGU26-22916 | Orals | BG5.1

Ecological and biogeochemical consequences of benthic ecosystem engineer responses to the end-Permian mass extinction   

Alison Cribb, Aspen Sartin, Bethany Allen, Richard Stokey, Pedro Monarrez, and Dominik Hulse

Organisms whose activities impact the availability of resources in their environments, known as ecosystem engineers, are known to have profound controls on ecological and evolutionary dynamics throughout Earth history. Bioturbators – animals that mix seafloor sediments – are especially powerful ecosystem engineers due to their direct impacts on key benthic biogeochemical cycles. The emergence or loss of bioturbators throughout Earth history is associated with unique and profound shifts in benthic ecology and biogeochemistry. The end-Permian mass extinction (EPME), regarded as the most devastating climate-driven mass extinction in Earth history, saw devastating losses in marine benthic biodiversity and bioturbators, with the bioturbation-driven sedimentary mixed layer completely collapsing in some regions. The loss of bioturbating ecosystem engineers during the EPME has long been implicated in the rates of benthic recovery in the Early Triassic, although the precise impacts of bioturbator responses have remain unconstrained. Here, we test the hypothesis that loss of bioturbating ecosystem engineers during the EPME led to unique ecological and biogeochemical consequences in Early Triassic communities. Combining trace fossil data from literature and body fossil data from the Paleobiology Database for continuous stratigraphic sections across the EPME, we construct multiple comparative local time series of ecological responses of bioturbators and local benthic communities. We use the Earth system model cGENIE to reconstruct marine environmental conditions across the EPME, which also serve as boundary conditions for local biogeochemical models. For each region represented by continuous stratigraphic sections, we then use the fossil record to parameterise pre-EPME and post-EPME bioturbation in biogeochemical reactive-transport models and compare the impacts of the complete loss, reduction, or persistence of bioturbation on benthic biogeochemistry. Finally, we run local sensitivity analyses to constrain the impacts of bioturbation responses on biogeochemical change, and effect size analyses to quantify the relative roles of bioturbators and climate change on ecological responses across the EPME. These results address long-standing assumptions about the role of bioturbation in benthic ecosystem recovery through the Early Triassic and underscore the importance of local environments and community ecology for contextualising recovery in the aftermath of mass extinctions.

How to cite: Cribb, A., Sartin, A., Allen, B., Stokey, R., Monarrez, P., and Hulse, D.: Ecological and biogeochemical consequences of benthic ecosystem engineer responses to the end-Permian mass extinction  , EGU General Assembly 2026, Vienna, Austria, 3–8 May 2026, EGU26-22916, https://doi.org/10.5194/egusphere-egu26-22916, 2026.

EGU26-2001 | ECS | Orals | CL1.1.1

Quantifying PETM Carbonate Burndown and Alkalinity Feedbacks through Cyclostratigraphy  

Nina M Papadomanolaki, Heather L Jones, Emma M Hanson, Kirsty M Edgar, Or M Bialik, Sietske J Batenburg, and David De Vleeschouwer

The dissolution of calcium carbonate (CaCO3) is a key regulator of long-term changes in oceanic CO2 uptake, through the generation of alkalinity. Geological records from past climatic and carbon-cycle perturbation events contain abundant evidence for ocean acidification and seafloor CaCO3 dissolution. Such events can thus serve as natural laboratories to assess the role of carbonate compensation in mitigating extreme carbon release and stabilizing the Earth system. In this study, we aim to evaluate the magnitude, rate, and climatic significance of carbonate dissolution for the Paleocene-Eocene Thermal Maximum (PETM, ~56 Ma), the most dramatic of the early Cenozoic hyperthermals. Specifically, we use a new high-resolution record from IODP Site U1514 from the Mentelle Basin in the SE Indian Ocean (paleolatitude: ∼60°S at 50 Ma) to quantify the dissolution of seafloor CaCO3 deposited prior to the PETM (‘burndown’), in the earliest phases of the event.  Our site is ideally positioned to document this process due to its location in the deep-sea, relatively high sedimentation rates, expanded upper Paleocene record and sensitivity to changes in carbonate saturation. We use precession-scale cyclostratigraphy to create an age model for the late Paleocene and early Eocene at U1514, anchored within 405-kyr astrochronozones and subsequently tied to the established astrochronology of ODP Site 690 in the Weddell Sea, allowing for refined interbasinal stratigraphic alignment across the Southern Ocean. The age model forms the basis for our analysis of ‘burndown’ dissolution and alkalinity generation at our site and across the PETM seafloor. Our work is an important step forward in our ability to quantify alkalinity fluxes from seafloor dissolution and their impact relative to terrestrial weathering, on millenial to orbital timescales.

How to cite: Papadomanolaki, N. M., Jones, H. L., Hanson, E. M., Edgar, K. M., Bialik, O. M., Batenburg, S. J., and De Vleeschouwer, D.: Quantifying PETM Carbonate Burndown and Alkalinity Feedbacks through Cyclostratigraphy , EGU General Assembly 2026, Vienna, Austria, 3–8 May 2026, EGU26-2001, https://doi.org/10.5194/egusphere-egu26-2001, 2026.

Reconstructing carbon release fluxes during extreme climatic events in Earth history—particularly quantifying the magnitude and climatic impacts of biogenic greenhouse-gas emissions—is crucial for building high-confidence “past–future” climate analog frameworks. In paleoclimate research, the Toarcian Oceanic Anoxic Event (T-OAE; ~183 Ma), one of the most prominent global warming episodes of the Mesozoic, still features key knowledge gaps regarding the coupled mechanisms linking its carbon-isotope excursions (CIEs) to greenhouse-gas release. Here we integrate multi-proxy constraints to develop a global coupled biogeochemical model that explicitly represents methane cycling across the sediment–ocean–atmosphere system, and we apply a Markov chain Monte Carlo (MCMC) Bayesian inversion to systematically quantify methane emission fluxes during the T-OAE for the first time. Model simulations indicate that reproducing the pulsed negative CIEs, the rise in atmospheric pCO2, and the 4–6 °C global warming inferred from paleotemperature proxies requires at least ~4700 Gt (CO2-equivalent) of sustained biogenic methane input to the Earth’s surface system. Notably, the inferred carbon-isotopic composition of the methane (δ¹³C = −50‰ to −70‰) closely matches the characteristic fractionation associated with methanogenic archaeal metabolisms. The model further suggests that methane release may have amplified methanogenesis and increased organic-matter input, while sulfate-depleted ocean conditions reduced methane oxidation, together establishing a positive feedback of “enhanced methane production–suppressed oxidation efficiency.” Sensitivity experiments show that methane emissions of this magnitude could drive an atmospheric pCH₄ increase of >5 ppm, producing additional radiative forcing sufficient to yield ≥2 °C extra surface warming. Moreover, oceanic methane release promotes a millennial-scale decline in dissolved oxygen, triggering systemic collapse of benthic habitats. This nonlinear coupling between biogeochemical cycling and ecosystem responses may have been a key driver of widespread marine biotic losses during the T-OAE.

How to cite: Qiu, R.: Pulsed biogenic methane emissions and episodic carbon cycle perturbations during the Toarcian Oceanic Anoxic Event, EGU General Assembly 2026, Vienna, Austria, 3–8 May 2026, EGU26-2050, https://doi.org/10.5194/egusphere-egu26-2050, 2026.

EGU26-2419 | Orals | CL1.1.1

Eastern Pacific El Niño activated by the Atlantic Ocean 

Yongyun Hu, Sheng Wu, and Yonggang Liu

Understanding of different types of El Niño events, notably Eastern Pacific (EP) and Central Pacific (CP) El Niño, is hindered by the limited length of observations. Using climate simulations, we investigated the evolution of El Niño flavor from 250 million years ago (Ma) to present. Results show that El Niño has been persistent throughout the entire period the simulation spans, but was dominated by CP El Niño at 250 Ma - 80 Ma. With the emergence of the Atlantic Ocean, which modulated the state of the Pacific Ocean through atmospheric circulation, EP El Niño became the predominant El Nino state (70 Ma - 10 Ma). After the closure of the Central American Seaway (0 Ma), EP and CP El Niño occurred with similar frequencies. Our findings highlight that El Niño types are controlled by geography over tectonic timescales.

How to cite: Hu, Y., Wu, S., and Liu, Y.: Eastern Pacific El Niño activated by the Atlantic Ocean, EGU General Assembly 2026, Vienna, Austria, 3–8 May 2026, EGU26-2419, https://doi.org/10.5194/egusphere-egu26-2419, 2026.

Paleoproterozoic cap carbonates provide vital records of post-glacial environmental and biogeochemical transitions, offering crucial insights into early Earth’s climatic, ocean–atmosphere evolution, and the planet’s habitability[1]. This study reports, for the first time, well-preserved evidence of such cap carbonates from the Aravalli Supergroup, India, identified within calc-silicate horizons embedded in the metavolcanics of the Delwara Formation. Comprehensive geochemical and isotopic analyses confirm their primary depositional signatures and effectively rule out major diagenetic or metamorphic overprinting. The systematically collected samples exhibit negative δ13CV-PDB values, characteristic of global cap-carbonate sequences that formed immediately after the Paleoproterozoic glaciation. These strata are subsequently overlain by dolomites displaying the pronounced positive δ13CV-PDB excursion associated with the Lomagundi–Jatuli Event (LJE). Unlike the Sausar Group of India, which records cap carbonates without evidence of the LJE, the Aravalli Supergroup uniquely preserves both features within its Paleoproteozoic succession[2]. This integrated record establishes the Aravalli Basin as a key site for understanding the temporal link between deglaciation, large-scale carbon-cycle shifts, and atmospheric oxygenation. Furthermore, the coexistence of post-glacial and LJE signatures enables refined global chemostratigraphic correlations with other Paleoproterozoic basins across continents such as South Africa, Canada, and Australia[3]. These findings highlight the Aravalli Basin’s pivotal role in tracing the aftermath of Paleoproterozoic glaciations and provide new perspectives on how early Earth’s surface environments evolved during one of the most transformative intervals in the planet’s history.

References

[1] Bekker et al. [2005]. Precamb Res. 137(3-4), 167-206.

[2] Goswami et al. [2023]. Precamb Res. 399.

[3] Maheshwari et al. [2010]. Gondwana Res.  417, 195-209.

How to cite: Goswami, A., Jang, Y., and Kwon, S.: When Ice Met Oxygen: Unveiling the Oldest Clues of Earth’s Climate Shift from the Aravalli Supergroup, India. , EGU General Assembly 2026, Vienna, Austria, 3–8 May 2026, EGU26-2953, https://doi.org/10.5194/egusphere-egu26-2953, 2026.

EGU26-3078 | Orals | CL1.1.1

Data-model comparison of marine 13C across Termination I  

Peter Köhler and Stefan Mulitza

We use benthic isotope data from 491 sediment cores compiled in the World Atlas of late Quaternary Foraminiferal Oxygen and Carbon Isotope Ratios (Mulitza et al., 2022) to evaluate transient simulations across the last 25 kyr performed with BICYCLE-SE, the solid Earth version of the Box model of the Isotopic Carbon cYCLE (Köhler & Mulitza, 2024), which have been updated by data-based constraints on the deglacial release of ~250 PgC from land via permafrost thaw (Winterfeld et al., 2018), extensive petrogenic organic carbon oxidation (Wu et al., 2022) and biomass burning (Riddell-Young et al., 2025). These additional land carbon fluxes reduce mean ocean δ13C by 0.1‰ since the Last Glacial Maximum (LGM). The increase in mean ocean δ13C is 0.45‰ since the LGM in both data and model, but the rise started only after Heinrich Stadial 1 in the data, but earlier in the simulations. Abrupt reductions in Atlantic Meridional Overturning Circulation during Greenland stadials as suggested from 14C (Köhler et al., 2024) lead to simulated anomalies in δ13C in most ocean boxes, that are not confirmed by the δ13C data. Further model-data offsets suggest that the so far applied assumptions on changes in the Southern Ocean physical and biological carbon pumps during the deglaciation in BICYCLE-SE might need to be revised – or point to the limitations of this simple box model approach.        

References:

Köhler, P. and Mulitza, S.: No detectable influence of the carbonate ion effect on changes in stable carbon isotope ratios (δ13C) of shallow dwelling planktic foraminifera over the past 160kyr, Clim. Past, 20, 991–1015, https://doi.org/10.5194/cp- 20-991-2024, 2024.

Köhler, P., Skinner, L. C., and Adolphi, F.: Radiocarbon cycle revisited by considering the bipolar seesaw and benthic 14C data, Earth Planet. Sc. Lett., 640, 118801, https://doi.org/10.1016/j.epsl.2024.118801, 2024.

Mulitza, S., Bickert, T., Bostock, H. C., Chiessi, C. M., Donner, B., Govin, A., Harada, N., Huang, E., Johnstone, H., Kuhnert, H., Langner, M., Lamy, F., Lembke-Jene, L., Lisiecki, L., Lynch- Stieglitz, J., Max, L., Mohtadi, M., Mollenhauer, G., Muglia, J., Nürnberg, D., Paul, A., Rühlemann, C., Repschläger, J., Saraswat, R., Schmittner, A., Sikes, E. L., Spielhagen, R. F., and Tiedemann, R.: World Atlas of late Quaternary Foraminiferal Oxygen and Carbon Isotope Ratios, Earth Syst. Sci. Data, 14, 2553–2611, https://doi.org/10.5194/essd-14-2553-2022, 2022.

Riddell-Young, B., Lee, J. E., Brook, E. J., Schmitt, J., Fischer, H., Bauska, T. K., Menking, J. A., Iseli, R., and Clark, J. R.: Abrupt changes in biomass burning during the last glacial period, Nature, 637, 91–96, https://doi.org/10.1038/s41586-024-08363-3, 2025.

Winterfeld, M., Mollenhauer, G., Dummann, W., Köhler, P., Lembke-Jene, L., Meyer, V. D., Hefter, J., McIntyre, C., Wacker, L., Kokfelt, U., and Tiedemann, R.: Deglacial mobilization of pre-aged terrestrial carbon from degrading permafrost, Nature Communications, 9, 3666, https://doi.org/10.1038/s41467-018-06080-w, 2018.

Wu, J., Mollenhauer, G., Stein, R., Köhler, P., Hefter, J., Fahl, K., Grotheer, H., Wei, B., and Nam, S.-I.: Deglacial release of petrogenic and permafrost carbon from the Canadian Arctic impacting the carbon cycle, Nature Communications, 13, 7172, https://doi.org/10.1038/s41467-022-34725-4, 2022.

How to cite: Köhler, P. and Mulitza, S.: Data-model comparison of marine 13C across Termination I , EGU General Assembly 2026, Vienna, Austria, 3–8 May 2026, EGU26-3078, https://doi.org/10.5194/egusphere-egu26-3078, 2026.

Climate-induced changes in salinity and hydrological restriction can reshape ecological communities and biogeochemical cycles in anoxic water bodies, thereby altering the productivity–preservation balance and influencing organic carbon burial. This study distinguishes two anoxic depositional modes and employs lipid biomarkers, trace element indices, and C–N stable isotopes to elucidate their ecological and biogeochemical implications. During arid intervals (Mode A), characterized by hypersaline, restricted conditions and high TOC, elevated δ¹⁵N values (~6‰) indicate enhanced denitrification. Although cyanobacterial abundance is relatively high, low Mo/TOC ratios suggest limited Mo availability, which constrains nitrogen fixation. In humid periods (Mode B), corresponding to low‑salinity, open‑system settings with low TOC, δ¹⁵N values decrease (~4.5‰). Increased Mo/TOC ratios point to improved Mo availability that promotes nitrogen fixation, superimposing a nitrogen‑fixation signal on the δ¹⁵N record and causing a slight negative shift even under anoxic conditions. Differences in δ¹³C between the two modes further indicate that higher productivity during arid phases enriches the dissolved inorganic carbon pool in heavier carbon, whereas humid periods are marked by reduced productivity and greater input of terrestrially derived light carbon. Overall, the sensitivity of the nitrogen cycle to environmental perturbation is primarily governed by the supply of Mo—a key cofactor for nitrogenase—rather than cyanobacterial abundance. Meanwhile, aridity‑driven nutrient concentration combined with brief oxidative decomposition under a shallow halocline jointly enhances both organic matter input and preservation, ultimately promoting organic carbon burial. This framework highlights the coupling among climate, nutrient dynamics, trace‑metal limitation, and biological communities, offering an ecological‑process perspective for interpreting nitrogen‑cycle perturbations and carbon‑sink formation in anoxic systems.


How to cite: Chen, A. and Liang, C.: Climate fluctuations drive periodic shifts in anoxic depositional environments: Mo availability regulates nitrogen cycling and organic carbon burial, EGU General Assembly 2026, Vienna, Austria, 3–8 May 2026, EGU26-3098, https://doi.org/10.5194/egusphere-egu26-3098, 2026.

Organic carbon (OC) burial is a critical process regulating the global carbon cycle and climate system. However, compared to well-studied marine systems, the role and mechanisms of lacustrine OC burial in deep time remain poorly constrained. Despite covering an area only 1/80th that of the oceans, modern lakes contribute 10–50% of the global OC burial, highlighting their exceptional sequestration efficiency. This review synthesizes OC burial records from typical deep-time lacustrine shales, revealing that the geological-scale transition in OC burial capacity was driven by the evolution of lake ecosystems from "dead" and "starved" lakes to "ecologically primary" and "prosperous" ones. Based on the "productivity, preservation, and dilution" ternary equilibrium theory, we evaluate the multi-factor composite controls on the OC burial process, including tectonics, climate, hydro-ecological conditions, volcanic–hydrothermal activities, and marine transgressions. Our findings show that efficient OC burial results from the synergistic coupling of tectonic–climatic–ecological systems. Notably, nutrients from volcanic and hydrothermal activities were crucial for overcoming adverse climatic or ecological conditions—particularly during the "ecologically primary lakes" stage before the Late Paleozoic—thereby enabling effective OC sequestration. Finally, we propose five primary mechanisms for large-scale lacustrine OC burial: (1) volcanic–hydrothermal driven, (2) climate–volcanic activities coupling, (3) climate–basin scale coupling, (4) climate–transgressions coupling, and (5) tectonic–climate coupling. This synthesis not only offers a new perspective from lake records for understanding deep-time Earth's sphere interactions and carbon cycling but also establishes a geological-historical framework for predicting the response of lacustrine carbon reservoirs to future climate change.

How to cite: Liang, C., Chen, A., and Cao, Y.: Lacustrine organic carbon burial in deep time: Perspectives from major geologic events and tectonic-climatic-ecological coupling, EGU General Assembly 2026, Vienna, Austria, 3–8 May 2026, EGU26-3702, https://doi.org/10.5194/egusphere-egu26-3702, 2026.

EGU26-4416 | ECS | Orals | CL1.1.1

The transformation and burial of methane-derived organic carbon in the South China Sea 

Lihua Dong, Mengfan Chu, and Rui Bao

Methane seeping from the submarine has long been recognized as a driver of climate warming, owing to its oxidation that emits carbon dioxide to the atmosphere. Yet, the biogeochemical processes that transfer methane to organic carbon (OC), serving as a negative feedback on warming, remain largely under constrained. Here, we measured concentration and stable and radiocarbon isotopes of the dissolved and sedimentary OC, as well as foraminifera, across contemporary and past methane seepage settings. Our findings reveal that methane undergoes transformation into OC, promoting its long-term burial in sediments and mitigating climate change. At active methane seeps in the South China Sea, methane contributes up to 23% of dissolved OC in the contemporary bottom water. And our results suggest that methane may be emitted to the water column ~700 m above the seafloor during the Last Glacial Maximum, and subsequently undergoes transformation into OC buried in sediments. It accounts for up to 11% of methane-derived OC burial during the Last Glacial Maximum with active methane seepage events, and reduces the radiative forcing caused by methane emission over glacial cycles. Our discovery of the enhanced methane carbon burial calls for reconsideration of methane’s impact on climate warming.

How to cite: Dong, L., Chu, M., and Bao, R.: The transformation and burial of methane-derived organic carbon in the South China Sea, EGU General Assembly 2026, Vienna, Austria, 3–8 May 2026, EGU26-4416, https://doi.org/10.5194/egusphere-egu26-4416, 2026.

EGU26-4725 | ECS | Posters on site | CL1.1.1

Reconstructing pelagic fish productivity and export productivity during the Paleocene-Eocene Thermal Maximum 

Xiuwen Zhou, Ruiling Zhang, Man-Yin Tsang, and Weiqi Yao

Ocean productivity is highly sensitive to climate change, but its future trend remains largely unknown, complicating projections for marine ecosystems and fisheries. Past warm climate events offer valuable analogs for understanding the long-term effects of anthropogenic warming on ocean productivity. The Paleocene–Eocene Thermal Maximum (PETM, about 56 million years ago) is one of the most pronounced global warming events in the Cenozoic era, triggered by massive and rapid injections of isotopically light carbon into the ocean-atmosphere system. While previous studies have evaluated ocean productivity during the PETM, proxy records and model results remain contradictory, and the response of fish productivity is also poorly constrained. Here we present global records of ichthyolith accumulation rates (IAR) from deep-sea sediment cores across the PETM. Our new data show the temporal and spatial evolution of pelagic fish productivity as well as the resilience in fish communities. These IAR data are then compared with export productivity estimates derived from marine barite accumulation rates (BAR) from the same or proximal sites to explore their correlation. Using the Earth system model cGENIE, we further conduct sensitive simulations to investigate the roles of elevated atmospheric pCO2, changes in nutrient supply (internal and external), and ocean circulation in driving carbon export during the PETM. Through combining multi–proxy and model–informed analyses, this study provides an integrated perspective on how ocean productivity and fish communities reacted to abrupt warming, offering a critical long-term context for understanding the future of ocean ecosystems.

How to cite: Zhou, X., Zhang, R., Tsang, M.-Y., and Yao, W.: Reconstructing pelagic fish productivity and export productivity during the Paleocene-Eocene Thermal Maximum, EGU General Assembly 2026, Vienna, Austria, 3–8 May 2026, EGU26-4725, https://doi.org/10.5194/egusphere-egu26-4725, 2026.

EGU26-5416 | Posters on site | CL1.1.1

The impact of paleogeography and atmospheric CO2 concentrations on Miocene warmth in AWI-ESM 

Gregor Knorr and Gerrit Lohmann

Proxy records from the Miocene epoch (∼23‐5 Ma) indicate a warmer climate than today with a reduced meridional temperature gradient. These characteristics have been partly attributed to atmospheric CO2 changes and differences in the tectonic setting. In this contribution we present climate simulations using the complex coupled earth system model AWI-ESM2  for Miocene boundary conditions to investigate the impact of different atmospheric CO2 concentrations and paleogeographic configurations.  Besides investigating their individual contribution, we will also examine the combination of both forcing factors and differences that arise from different orographic and bathymetric reconstructions. We will discuss implications for global and meridional temperature responses, as well as sea ice changes and high latitude ocean ventilation.

How to cite: Knorr, G. and Lohmann, G.: The impact of paleogeography and atmospheric CO2 concentrations on Miocene warmth in AWI-ESM, EGU General Assembly 2026, Vienna, Austria, 3–8 May 2026, EGU26-5416, https://doi.org/10.5194/egusphere-egu26-5416, 2026.

EGU26-5914 | ECS | Posters on site | CL1.1.1

Input and output fluxes of surface CO2 throughout the Cenozoic 

Luca Castrogiovanni, Claudia Pasquero, Nicola Piana Agostinetti, Bram Vaes, Jack Longman, and Pietro Sternai

Changes in the geological carbon cycle and associated surface input and output CO2 fluxes drive long-term Cenozoic climate trends mainly through magmatic emissions and weathering of silicate minerals. Proxy records, which indirectly reconstruct past climate conditions, demonstrate a steady decline in both surface CO2 and temperature since ˜50 million years ago (Ma), punctuated by shorter periods of climatic optima and hyperthermals such as the PETM, EECO, MECO and MMCO. However, lack of constraints in terms of input and output CO2 fluxes prevents the assessment of responsible processes for these trends. Here, we use a newly developed technique based on a reversible-jump Markov chain Monte Carlo algorithm (rj-McMC) to invert the temporal CO2 changes from the Proxy Integration Project (CENCO2PIP) (Hönisch et al., 2023) and obtain estimates of the surface input and output CO2 fluxes throughout the Cenozoic. We base the inversion on a general formulation of the geological carbon cycle that includes a degassing source and a temperature-dependent sink term, with the temperature time history (Hansen et al., 2023) used as an additional constraint. Reconstructed fluxes reveal that perturbations of the carbon cycle are stronger during the early Cenozoic (i.e., ˜66 – 34 Ma), while these reduce since˜34 Ma. We hypothesise that stronger degassing from the solid-Earth during the EECO and MECO prevent an earlier onset of the Antarctic ice cap during the Eocene. We discuss that the higher carbon emissions during these periods can partially link to the evolution of the Neo-Tethyan magmatic margin, which extinction occurs ˜34 Ma. Results show that carbon flux stabilization since the Oligocene could be due to temperature dependent processes like albedo increase and enhanced silicate weathering in the context of Tibetan Plateau uplift. Finally, we estimate that the net amount of CO2 removed since ˜34 Ma is four times greater than that of the first half of the Cenozoic.  


References


Hansen, J. E., Sato, M., Simons, L., Nazarenko, L. S., Sangha, I., Kharecha, P., Zachos, J. C., von Schuckmann, K., Loeb, N. G., Osman, M. B., Jin, Q., Tselioudis, G., Jeong, E., Lacis, A., Ruedy, R., Russell, G., Cao, J., & Li, J. (2023). Global warming in the pipeline. Oxford Open Climate Change, 3(1). https://doi.org/10.1093/oxfclm/kgad008.

Hönisch, B., Royer, D. L., Breecker, D. O., Polissar, P. J., Bowen, G. J., Henehan, M. J., Cui, Y., Steinthorsdottir, M., McElwain, J. C., Kohn, M. J., Pearson, A., Phelps, S. R., Uno, K. T., Ridgwell, A., Anagnostou, E., Austermann, J., Badger, M. P. S., Barclay, R. S., Bijl, P. K., … Zhang, L. (2023). Toward a Cenozoic history of atmospheric CO2. Science, 382(6675). DOI: 10.1126/science.adi517.


How to cite: Castrogiovanni, L., Pasquero, C., Piana Agostinetti, N., Vaes, B., Longman, J., and Sternai, P.: Input and output fluxes of surface CO2 throughout the Cenozoic, EGU General Assembly 2026, Vienna, Austria, 3–8 May 2026, EGU26-5914, https://doi.org/10.5194/egusphere-egu26-5914, 2026.

EGU26-5952 | ECS | Orals | CL1.1.1

Simulated Ocean Oxygen under Miocene Boundary Conditions 

James Berg, David Hutchinson, Katrin Meissner, Benoit Pasquier, Mark Holzer, and Alexandra Auderset

Investigating changes in ocean oxygenation during past warm climates advances our process understanding of biogeochemical and physical dynamics in the ocean and may inform our predictions of future changes. The Miocene Climatic Optimum (MCO) was a warm climate episode ~15, million years ago (Ma), with high atmospheric CO2 concentrations that are comparable to end-of-century predictions for mid-range future emission scenarios. Proxy records suggest that the Oxygen Minimum Zone (OMZ) in the Eastern Tropical Pacific (ETP) was small or non-existent during the high-CO2 MCO, and only expanded when CO2 declined after 15 Ma. In contrast, the OMZ in the Eastern Pacific was already extensive in the recent preindustrial era, and is currently expanding further with increasing CO2, due to ocean warming and stratification. Despite the importance of understanding the controls on Pacific OMZ extent under warm conditions, there are no existing model investigations of these opposing OMZ dynamics. Here, we use a climate model with an offline biogeochemical framework to investigate ocean oxygen concentrations during the Miocene for a range of CO2 concentrations and two different topographic configurations. We compare results to available physical and biogeochemical proxies and assess which combination of boundary conditions best replicates recorded proxy trends. We find that for higher CO2 concentrations, oxygen declines globally and OMZs expand, particularly in the Atlantic Ocean. However, for one of the topographic configurations, OMZs in the ETP contract under higher CO2 concentrations. This contraction can be attributed to regionally reduced export production and remineralization rates, which are caused by weaker upwelling due to a southward shifted Hadley cell and correspondingly weaker southern hemisphere trade winds. This atmospheric response is driven by hemispheric asymmetries in warming due to changes in large scale ocean circulation. These results emphasize the complexity and spatial heterogeneity of the marine oxygen response to climate change.

How to cite: Berg, J., Hutchinson, D., Meissner, K., Pasquier, B., Holzer, M., and Auderset, A.: Simulated Ocean Oxygen under Miocene Boundary Conditions, EGU General Assembly 2026, Vienna, Austria, 3–8 May 2026, EGU26-5952, https://doi.org/10.5194/egusphere-egu26-5952, 2026.

EGU26-5987 | Orals | CL1.1.1

Paleogeography strongly influences CO2 threshold for Sturtian Snowball Earth initiation 

Minmin Fu, Robert Graham, and Dorian Abbot

Neoproterozoic “snowball Earth” refers to extreme glaciations when sea ice extended from the poles to the tropics and perhaps to the equator. Despite decades of study, the mechanisms that triggered global glaciation are still debated, although many mechanisms link their onset to reductions in atmospheric CO2 concentration. We use a coupled general circulation model and two geologically constrained paleogeographic reconstructions to re-examine the CO2 threshold for the initiation of the Sturtian snowball Earth (~717 Ma). With modern landmasses, a hard-Snowball transition occurs at 95±5 ppm CO2, consistent with prior estimates. In contrast, one 720 Ma reconstruction, resists global glaciation down to 6±1 ppm CO2 – a threshold so low that initiation via CO2 drawdown might be challenging – while maintaining an "oasis climate" with a small, zonally asymmetric region of open tropical ocean. A second 720 Ma reconstruction glaciates at 110±10 ppm, similar to modern. We show that the oasis climate is possible because the former continental configuration inhibits ocean heat transport out of a small, tropical ocean basin, allowing it to maintain above-freezing sea surface temperatures. While the "oasis climate" lacks the hysteresis expected for snowball glaciations in our climate model, hysteresis might be supplied by land ice sheets. The apparent sensitivity of Earth's snowball glaciation behavior to subtle changes in continental geometry points to a need for better-constrained paleogeographic reconstructions for understanding snowball Earth events and highlight potential challenges to CO2 drawdown mechanisms for snowball initiation.

How to cite: Fu, M., Graham, R., and Abbot, D.: Paleogeography strongly influences CO2 threshold for Sturtian Snowball Earth initiation, EGU General Assembly 2026, Vienna, Austria, 3–8 May 2026, EGU26-5987, https://doi.org/10.5194/egusphere-egu26-5987, 2026.

EGU26-6267 | Orals | CL1.1.1

Loess weathering as an important contributor to the glacial atmospheric pCO2 drawdown 

Miho Ishizu, Axel Timmermann, and Kyung-Sook Yun

Loess deposits are silt sediments that can contain up to 30% carbon. As they are transported into the ocean, whether by wind or by rivers, they can increase the ocean's alkalinity. Recent studies have reported that accounting for the carbon weathering of loess under glacial conditions could increase the global alkalinity flux by more than 50% compared with previous estimates. This, in turn, could lower atmospheric CO2 concentrations by increasing the ocean's buffering capacity. To test this hypothesis in a transient Earth System Modeling framework and quantify the role of loess weathering in orbital-scale global carbon reorganizations, we employed the cGENIE model, nudged the ocean circulation state to a previously conducted transient 3 Ma CESM1.2 simulation, and applied various loess weathering scenarios. Our results suggest that plausible estimates of loess-derived carbon fluxes can explain a considerable fraction of interglacial/glacial CO2 variability during the last 1 Ma.

How to cite: Ishizu, M., Timmermann, A., and Yun, K.-S.: Loess weathering as an important contributor to the glacial atmospheric pCO2 drawdown, EGU General Assembly 2026, Vienna, Austria, 3–8 May 2026, EGU26-6267, https://doi.org/10.5194/egusphere-egu26-6267, 2026.

EGU26-7593 | ECS | Posters on site | CL1.1.1

Modeling Long Memory Cyclical Trends in the Cenozoic 

Yeliz Özer, Tomás del Barrio Castro, Álvaro Escribano, and Philipp Sibbertsen

Long paleoclimate time series combine strong persistence, multiple orbital cycles, and regime shifts, which complicates the analysis of dynamical coupling and predictability. We analyze Cenozoic variability using the Cenozoic global reference benthic foraminiferal carbon and oxygen isotope dataset, in a regime based time series framework that integrates deterministic decomposition, cyclical fractional cointegration, and regime aware forecasting. We divide the record into segments in line with the major Cenozoic climate states. Within each segment, deterministic components are estimated and removed, including linear trends, orbital forcing variables, and harmonic cycles identified via a GARMA based filtering procedure. We then apply cyclical fractional cointegration tests at shared orbital frequencies to assess whether common spectral peaks reflect a stable frequency specific linkage (cointegration) between the proxies and orbital variables. The results reveal pronounced regime dependence. The long eccentricity cycle (405 kyr) shows recurrent evidence of cointegration with both proxies across different climate states. For obliquity, an indication of frequency specific linkage is primarily found after the middle Miocene Climate Transition. Finally, we fit regime specific VAR(2) models to the residuals and report in-sample forecasts, and we generate a 100 kyr out-of-sample projection based on the Icehouse specific dynamics. Forecast behaviour varies across climate states, highlighting that non-stationarity and regime specific dynamics place strong constraints on predictability in long paleoclimate records. 

How to cite: Özer, Y., del Barrio Castro, T., Escribano, Á., and Sibbertsen, P.: Modeling Long Memory Cyclical Trends in the Cenozoic, EGU General Assembly 2026, Vienna, Austria, 3–8 May 2026, EGU26-7593, https://doi.org/10.5194/egusphere-egu26-7593, 2026.

EGU26-8129 | ECS | Orals | CL1.1.1

Isotopic Imprints of Coccolithophore Blooms Overthe Past Million Years 

Josué Dauvier, Luc Beaufort, Corinne Sonzogni, Clara Bolton, Jean Charles Mazur, Tachikawa Kazuyo, William Rapuc, Nicolas Thouveny, Yohan Lichterfeld, and Laurence Vidal

Coccolithophores, calcifying marine phytoplankton, play a dual role in the oceanic
carbon cycle by contributing to carbon fixation through photosynthesis and to carbon
release via calcification (uptake of bicarbonate and release of CO2). To evaluate the net
effect of coccolithophore long-term evolutionary and productivity dynamics on the car-
bon cycle, we analyzed two sediment cores, MD96-2060 (Mozambique Channel) and MD97-
2125 (Coral Sea), spanning the past 1 Myr. Using automated light microscopy and im-
age recognition, we quantified coccolithophore assemblages, morphology, and calcite mass.
These data were complemented by stable isotope analyses (δ13C and δ18O) of coccolith-
dominated the fine fraction (< 30 µm,) sediment samples. Our results reveal pronounced
coccolithophore bloom phases, characterized by high abundances of Gephyrocapsa caribbean-
ica and Emiliania huxleyi, and sharp increases in total Noelaerhabdaceae mass accumu-
lation rate. The Morphological Divergence Index, a proxy for evolutionary divergence,
exhibits similar long-term trends at both sites, in phase with orbital eccentricity cycles.
Fine-fraction δ13C records display long-term patterns that are absent in benthic and plank-
tonic foraminiferal δ13C records, indicating a persistent coccolithophore-driven isotopic
signal. We interpret this signal as the result of species-specific vital effects in dominant
blooming taxa, particularly during periods of low eccentricity, when reduced ecological
niche partitioning may have favored the proliferation of smaller more cosmopolitan species.
This, in turn, may have led to a significant depletion in δ13C values of the fine fraction
during low eccentricity phases, thereby influencing the marine carbon cycle on orbital
timescales.

How to cite: Dauvier, J., Beaufort, L., Sonzogni, C., Bolton, C., Mazur, J. C., Kazuyo, T., Rapuc, W., Thouveny, N., Lichterfeld, Y., and Vidal, L.: Isotopic Imprints of Coccolithophore Blooms Overthe Past Million Years, EGU General Assembly 2026, Vienna, Austria, 3–8 May 2026, EGU26-8129, https://doi.org/10.5194/egusphere-egu26-8129, 2026.

EGU26-8384 | Orals | CL1.1.1

Waterbelt solutions to avoid a hard Snowball Earth 

Aiko Voigt and Johannes Hörner

During the Neoproterozoic, Earth experienced at least two extreme glaciations with ice extending to tropical latitudes. While the Snowball Earth hypothesis proposes a fully ice-covered planet, geological evidence and the persistence of life suggest that parts of the ocean may have remained ice-free. This has motivated the concept of Waterbelt states: alternative climate equilibria featuring open equatorial oceans that could act as refugia for early life and expand the range of habitable climates relevant to Earth-like exoplanets. Despite their appeal, Waterbelt states remain disputed due to uncertainties in the mechanisms required to halt the ice–albedo feedback at low latitudes, including the role of bare sea-ice albedo and cloud radiative effects.

Here, we investigate whether Waterbelt states are robust solutions of the coupled climate system and identify the processes controlling the stability of low-latitude ice margins. Using a hierarchy of models, this work combines mechanistic insights from a Budyko–Sellers energy balance model with a large ensemble of global climate simulations. In particular, we present results from a coordinated model intercomparison that includes three versions of the ICON model and five versions of the CAM model, all run in the same aquaplanet slab-ocean setup. The simulations are analyzed with respect to three key factors that have been proposed to influence Waterbelt stability: the area of exposed bare sea ice, cloud masking of the ice–albedo feedback, and shortwave cloud radiative feedbacks.

We demonstrate that stable Waterbelt states can be found in a wide variety of models. While ICON Waterbelt states depend on cloud tuning, all CAM models readily simulate stable Waterbelt states over a substantial range of CO2 radiative forcing. These differences are primarily due to cloud radiative effects: the CAM models exhibit stabilizing shortwave cloud feedbacks and stronger cloud masking than ICON. Overall, this suggests that clouds do not present a fundamental obstacle to Waterbelt climates, but instead play a modulatory role that varies across models. This implies that Waterbelt states may be more physically plausible than studies based on a single model have suggested, while at the same time emphasizing the importance of clouds for deep-time climate and exoplanet habitability.

How to cite: Voigt, A. and Hörner, J.: Waterbelt solutions to avoid a hard Snowball Earth, EGU General Assembly 2026, Vienna, Austria, 3–8 May 2026, EGU26-8384, https://doi.org/10.5194/egusphere-egu26-8384, 2026.

EGU26-8390 | ECS | Orals | CL1.1.1

Southern Ocean circulation reorganization led to abrupt CO2 outgassing during the Mid-Miocene Climate Transition 

Yuhao Dai, David Hutchinson, Jimin Yu, Sebastian Bland, and Michael Ellwood

The Antarctic Ice Sheet (AIS) expansion and global cooling during the Mid-Miocene Climate Transition (MMCT) is thought to be closely linked to marine carbon cycle changes. However, how the marine carbon cycle interacted with the rest of the climate system during this period remains elusive. Here, we reconstruct surface-water CO2 and intermediate-depth seawater carbonate chemistry from the Southern Ocean during the MMCT. We show that a marked surface-water CO2 rise in the Southern Ocean, accompanied by carbon loss from the intermediate depths, coincided with AIS retreat and surface Southern Ocean warming within the MMCT. The release of CO2 from the intermediate depths to the surface ocean was likely caused by the northward shift of the Southern Ocean fronts and possibly strengthening of the Southern Ocean overturning circulation. Southern Ocean circulation reorganization, triggered by AIS expansion and global cooling, was able to transiently interrupt the transition of the Earth’s climate into a cooler state during the MMCT.

How to cite: Dai, Y., Hutchinson, D., Yu, J., Bland, S., and Ellwood, M.: Southern Ocean circulation reorganization led to abrupt CO2 outgassing during the Mid-Miocene Climate Transition, EGU General Assembly 2026, Vienna, Austria, 3–8 May 2026, EGU26-8390, https://doi.org/10.5194/egusphere-egu26-8390, 2026.

Large Igneous Province (LIP) volcanism is widely invoked as a primary driver of major carbon-cycle perturbations and climate extremes in Earth history, yet its short-term eruptive tempo and terrestrial environmental impacts remain poorly constrained. Most existing models assume temporally smoothed volcanic carbon release, largely due to the limited temporal resolution of marine sedimentary archives. Here we present a sub-millennial-resolution lacustrine sedimentary record spanning Oceanic Anoxic Event 1a (OAE1a) from the Aptian Jiufotang Formation in the Kazuo Basin, northeastern China, providing a rare terrestrial perspective on high-frequency LIP activity. A total of 199 samples were collected from a ~130 kyr interval (covering the transition from high to low 187Os/188Os) of organic-rich lacustrine black shales, achieving a temporal resolution of ~0.3–1.0 kyr per sample—comparable to Quaternary paleoclimate studies but applied to a deep-time volcanic event. High-resolution stratigraphic profiles of carbon isotopes reveal repeated, abrupt excursions, indicating episodic volatile release associated with super-eruptive volcanism. These geochemical signals are stratigraphically coupled with sedimentological features, including volcanic ash layers, sulfide laminae, and storm-induced deposits, demonstrating that individual eruptive pulses are not only geochemically resolvable but also sedimentologically expressed. Additional Pb isotope constraints further support an Ontong Java Plateau mantle source. Importantly, the magnitude and frequency of lacustrine carbon isotope excursions exceed those typically observed in coeval marine records, implying strong terrestrial amplification through enhanced organic carbon burial, primary productivity blooms, and potentially intensified methanogenesis. These results challenge conventional time-averaged carbon-cycle models and highlight that the climatic and ecological impacts of LIP volcanism are governed by short-lived, threshold-crossing forcing events. Lacustrine systems thus provide a uniquely sensitive archive for resolving the true temporal structure of deep-time volcanic perturbations and their consequences for Earth’s surface environments.

How to cite: Sun, M.-D., Matsumoto, H., and Xu, Y.-G.: A sub-millennial-resolution lacustrine record of Large Igneous Province volcanism during Early Cretaceous OAE1a, EGU General Assembly 2026, Vienna, Austria, 3–8 May 2026, EGU26-8621, https://doi.org/10.5194/egusphere-egu26-8621, 2026.

EGU26-8803 | Posters on site | CL1.1.1

Diagnosing deglacial ocean carbon cycle change through radiocarbon and stable carbon isotopes 

Hidetaka Kobayashi, Akira Oka, Takashi Obase, Miyano Nishida, and Ayako Abe-Ouchi

Radiocarbon (Δ14C) and stable carbon isotope (δ13C) proxy records provide important constraints on how carbon is redistributed among Earth’s surface reservoirs during major climate transitions. Previous work by Kobayashi et al. (2024, Climate of the Past) showed that transient simulations with the MIROC 4m climate model reproduce the timing of deglacial atmospheric pCO2 changes but underestimate their magnitude. Here, we extend this analysis by using carbon isotope proxies to better diagnose ocean carbon cycle processes during the last deglaciation (21 to 11 ka BP).

We combine three-dimensional transient model output with marine sediment core and ice core records of Δ14C and δ13C to examine how changes in ocean ventilation, biological carbon export efficiency, and alkalinity cycling are reflected in carbon isotope budgets. Particular attention is given to Heinrich Stadial 1 (HS1), the Bølling–Allerød, and the Younger Dryas, periods characterized by abrupt changes in the Atlantic Meridional Overturning Circulation (AMOC) and pronounced interhemispheric climate asymmetry.

We analyze three-dimensional transient model output and compare the results with existing marine sediment core and ice core records of Δ14C and δ13C. This comparison is used to examine how changes in ocean circulation and biological carbon export and remineralization are expressed in carbon isotope budgets. We focus on Heinrich Stadial 1 (HS1), the Bolling-Allerod, and the Younger Dryas, periods associated with abrupt changes in the Atlantic Meridional Overturning Circulation (AMOC) and strong interhemispheric climate asymmetry.

The model reproduces the sequence of atmospheric pCO2 variations across these events, but comparisons with proxy data reveal a systematic underestimation of enhanced deep-ocean ventilation during HS1, particularly in the Southern Ocean and North Pacific, as indicated by marine Δ14C records. Stable carbon isotope data further suggest that reductions in biological carbon export efficiency during HS1 are weaker in the model than implied by benthic and planktonic δ13C records. During the Younger Dryas, proxy records indicate a continued increase in deep-ocean δ13C, whereas the model simulates an opposite trend, pointing to potential biases in simulated AMOC changes, ecosystem responses, or terrestrial carbon exchange.

Overall, radiocarbon and stable carbon isotope comparisons indicate that the redistribution of carbon within the ocean is underestimated in the model. To further investigate these discrepancies, we additionally report sensitivity experiments that revisit the initialization of the Last Glacial Maximum state and assess the respective roles of ocean circulation and the biological pump in shaping deglacial carbon isotope and atmospheric pCO2 evolution. 

How to cite: Kobayashi, H., Oka, A., Obase, T., Nishida, M., and Abe-Ouchi, A.: Diagnosing deglacial ocean carbon cycle change through radiocarbon and stable carbon isotopes, EGU General Assembly 2026, Vienna, Austria, 3–8 May 2026, EGU26-8803, https://doi.org/10.5194/egusphere-egu26-8803, 2026.

The efficiency of the ocean to store or release gases, such as carbon, is mainly governed by overturning circulation and air-sea gas exchanges, thereby it regulates the carbon dioxide (CO2) sequestration in the ocean interior and its subsequent outgassing. Changes in the ocean circulation are considered as one of the primary drivers of atmospheric CO2 fluctuations during the last glacial-interglacial cycle. Although Indian Ocean role plays an important role in the global ocean circulation, its role in carbon cycle during the last glacial termination remains scantily studied. In this study, the ventilation records from the northern Indian Ocean over the last 25 kyr has been compiled and examined, where the ventilation ages are calculated as the difference between the radiocarbon ages of coexisting benthic and planktic foraminifera.  The most notable feature from our result is the stratification between the intermediate and deep water of the northern Indian Ocean during the Last Glacial Maximum (LGM). During this period, the water mass at a depth of ~2000 m below was poorly ventilated, characterized by low-14C, enrich in CO2 and high ventilation ages exceeding 2000 14C years. In contrast, the reported ventilation ages of water mass above ~2000 m depth were low (~1400 14C years) indicating relatively better ventilated water. This strong vertical stratification between the water masses implies a reduced renewal of deep water in the northern Indian Ocean during the LGM, suggesting that the northern Indian Ocean basin was a part of the glacial ocean aged carbon pool. The condition changed to better-ventilated water during the deglaciation, probably due to increased contribution of the northern sourced deep water to the northern Indian Ocean and outgassing the glacially stored CO2.

How to cite: Kumari, N. and Naik, S.: Radiocarbon evidence for the last glacial-interglacial ventilation changes in the northern Indian Ocean, EGU General Assembly 2026, Vienna, Austria, 3–8 May 2026, EGU26-8941, https://doi.org/10.5194/egusphere-egu26-8941, 2026.

EGU26-9562 | ECS | Orals | CL1.1.1

Global reconstruction of ocean export productivity from the late Eocene to the early Oligocene 

Ruiling Zhang, Erwan Pineau, Yannick Donnadieu, and Weiqi Yao

The Earth's climate shifted swiftly from a "greenhouse" state to an "icehouse" state ~34 million years ago (Ma). This climatic transition is characterized by abrupt atmospheric pCO2 drawdown, the initiation of Antarctic glaciation, and perturbations of marine carbon cycling. While previous studies have suggested heterogeneous changes across ocean basins in primary productivity, but a global unchanged state of fish production. The net effect of the marine biological pump on sequestrating atmospheric pCO2 is still an enigma. Marine barite (BaSO4) is a reliable proxy of export productivity owing to its biologically induced formation and refractory nature. Here, we present global records of marine barite accumulation rates from multiple sediment cores representing different oceanographic regions from the late Eocene to the early Oligocene. We reconstruct the temporal and spatial evolution of export productivity between 41 and 28 Ma, and investigate its contribution to the global carbon budget before and after the Eocene–Oligocene Transition. Additionally, we use the Earth System Model IPSL-CM5A2 and biogeochemical model PISCESv2, and compare proxy data with model results of the 40 Ma and 30 Ma simulations. Together, they can help to explore the role of tectonic-driven reorganization of ocean circulation in export productivity. These findings offer implications for understanding feedbacks between tectonic, climate, and carbon cycling at the onset of the early Cenozoic icehouse world.

How to cite: Zhang, R., Pineau, E., Donnadieu, Y., and Yao, W.: Global reconstruction of ocean export productivity from the late Eocene to the early Oligocene, EGU General Assembly 2026, Vienna, Austria, 3–8 May 2026, EGU26-9562, https://doi.org/10.5194/egusphere-egu26-9562, 2026.

Oceanic Anoxic Event 1b (OAE1b) occurred near the Aptian–Albian boundary during the mid-Cretaceous and represents a unique long-lasting global perturbation of the carbon cycle, characterized by multiple black shale intervals and four distinct negative carbon isotope excursions (Jacob/113, Kilian, Urbino/Paquier, and Leenhardt events). Compared with other OAEs, OAE1b is notable for its prolonged duration (~4 Myr) and its subdivision into multiple sub-events. Despite extensive marine studies, its triggering mechanisms remain controversial, with proposed drivers including volcanism related to the Southern Kerguelen Plateau, enhanced ocean stratification, intensified monsoonal circulation, and methane hydrate dissociation. However, terrestrial environmental responses to OAE1b remain poorly constrained.

Here we present a high-resolution terrestrial record of OAE1b from the Songliao Basin, northeastern China, based on the ICDP SK-2 borehole. Integrated analyses of organic carbon isotopes (δ¹³Corg), mercury concentrations, mercury isotopes (Δ¹⁹⁹Hg), and major and trace elements, combined with an established astrochronological framework, allow identification of three OAE1b sub-events (Jacob, Kilian, and Paquier) in terrestrial deposits. For the first time, mercury isotope evidence reveals three episodes of globally significant volcanic activity occurring prior to the Jacob event, prior to the Kilian event, and following the Kilian event. These volcanic signals correlate well with records from other basins worldwide, indicating a global volcanic influence.

Notably, the temporal decoupling between volcanic pulses and OAE1b sub-events suggests that volcanism was unlikely the direct trigger of OAE1b. Instead, relatively weak and predominantly subaerial volcanism of the Southern Kerguelen Plateau may have exerted a longer-term climatic influence, promoting a transition from transient cooling to greenhouse conditions and enhancing continental weathering. This long-term forcing, superimposed on orbital-scale monsoon intensification and increased wildfire activity, likely enhanced primary productivity and organic carbon burial, ultimately contributing to the development of OAE1b.


How to cite: Yang, L., Gao, Y., and Wu, Z.: Mercury Isotopic Evidence that global carbon cycle disturbance decoupled from volcanism during the Oceanic Anoxic Event 1b, EGU General Assembly 2026, Vienna, Austria, 3–8 May 2026, EGU26-10145, https://doi.org/10.5194/egusphere-egu26-10145, 2026.

EGU26-10197 | ECS | Orals | CL1.1.1

Lithium isotopes reveal enhanced weathering fluxes in North America during the Paleocene–Eocene Thermal Maximum: Perspectives on clay chronology 

Rocio Jaimes-Gutierrez, Lucas Vimpere, Sébastien Castelltort, David J. Wilson, Patrick Blaser, Philip A.E. Pogge von Strandmann, Thierry Adatte, Swapan Sahoo, and Georgina E. King

Silicate weathering regulates Earth’s surface climate over geological timescales by removing atmospheric CO2. Understanding changes in weathering dynamics and rates is key to predicting climate response time scales. We investigated the reactivity of the North American source-to-sink system and the chemical weathering regime during the Paleocene–Eocene Thermal Maximum (PETM). We measured the detrital lithium isotope composition (δ7Li) in a deep-marine sediment core from the Gulf of Mexico, tracking changes in the formation of clay minerals, alongside neodymium isotopes (εNd), to constrain sediment provenance.

We find a buffered negative δ7Li excursion during the PETM body, likely reflecting the mixing of newly formed and reworked clays from continental floodplains, followed by a pronounced negative δ7Li excursion during the recovery phase. This pattern is consistent with the continental Bighorn Basin (Wyoming, USA) δ7Li record (Ramos et al., 2022), indicating a rapid propagation of enhanced weathering and erosion fluxes in response to the PETM, which would have contributed to efficient CO2 drawdown (Jaimes-Gutierrez et al., 2025).

To fully understand weathering–climate feedbacks during the PETM, future work will target the radiometric dating of clay minerals exported to the ocean during this climatic perturbation. Constraining the timing of clay formation and residence on continental floodplains will allow us to distinguish between newly formed and reworked clays. Such age constraints would provide critical insights into the response timescales of continental weathering processes and thereby improve our understanding of carbon budgets during the PETM.

References:

Jaimes-Gutierrez, R., Vimpere, L., Wilson, D.J., Blaser, P., Adatte, T., Sahoo, S., and Castelltort, S., 2025, Lithium isotopes reveal enhanced weathering fluxes in North America during the Paleocene–Eocene Thermal Maximum: Geology, doi:https://doi.org/10.1130/G53708.1.

Ramos, E.J. et al., 2022, Swift Weathering Response on Floodplains During the Paleocene‐Eocene Thermal Maximum: Geophysical Research Letters, v. 49, doi:10.1029/2021GL097436.


How to cite: Jaimes-Gutierrez, R., Vimpere, L., Castelltort, S., Wilson, D. J., Blaser, P., Pogge von Strandmann, P. A. E., Adatte, T., Sahoo, S., and King, G. E.: Lithium isotopes reveal enhanced weathering fluxes in North America during the Paleocene–Eocene Thermal Maximum: Perspectives on clay chronology, EGU General Assembly 2026, Vienna, Austria, 3–8 May 2026, EGU26-10197, https://doi.org/10.5194/egusphere-egu26-10197, 2026.

Semi-arid and arid regions have traditionally been regarded as peripheral to the global carbon cycle because of their presumed low silicate weathering rates, resulting in their systematic omission from long-term carbon budget assessments. Direct quantification on CO₂ consumption by silicate weathering (CO₂(SIW)) in eolian-dominated drylands, however, remains scarce. Here we reconstruct both silicate weathering rate (RCO) and annual CO₂ consumption (CO₂(SIW)) flux using red clay and loess–paleosol sequences from the Chinese Loess Plateau (CLP). We demonstrate that variability in eolian mass accumulation rate (MAR), rather than intrinsic silicate weathering intensity (RCO), exerted the primary control on CO₂(SIW), reflecting persistently low to moderate chemical weathering across the CLP. Our results further reveal a rise in CO₂(SIW) from ~3.3 Tg C yr⁻¹ to ~12.3Tg C yr⁻¹ between 4.0 and 1.0 Ma, followed by a subsequent decline to ~9.0 Tg C yr⁻¹, broadly coincident with the late Pliocene decrease in atmospheric CO₂... These findings provide the first long-term quantitative budget of silicate weathering–mediated CO₂ drawdown in drylands and highlight the previously underrecognized role of semi-arid and arid eolian systems as negative feedback on atmospheric CO₂ over both million-year and orbital timescales.

How to cite: Zhang, C., Wu, H., Qiao, Y., and Guo, Z.: Quantification of silicate weathering CO2 consumption in semi-arid and arid eolian-dominated regions since the late Pliocene, EGU General Assembly 2026, Vienna, Austria, 3–8 May 2026, EGU26-10497, https://doi.org/10.5194/egusphere-egu26-10497, 2026.

EGU26-10809 | Posters on site | CL1.1.1

A Greener but Less Productive Proterozoic Ocean 

Yonggang Liu and Peng Liu

Geological records suggest that marine phytoplankton might have arisen in the Proterozoic while zooplankton remained absent, and marine productivity was not excessively low. However, quantitative estimates of phytoplankton biomass and net primary productivity (NPP) remain elusive. Here, we use the Earth system model CESM1.2.2, modifyingbiological module and boundary conditions, to simulate marine biogeochemical cycles in the Proterozoic. The simulations demonstrate that, within the expected range of nutrient levels, phytoplankton at sea surface was >2 times denser than present, sustaining a greener ocean due to the absence of predators. Heavier surface chlorophyll in the Proterozoic would block sunlight from penetrating subsurface layers. This so-called self-shielding effect would decrease subsurface NPP significantly. Simulations show that, through the combined influence of low nitrate level under a low-oxygen environment, the absence of diatoms, and self-shielding, the Proterozoic NPP was only ~60% and 30% of the present level in warm (almost ice-free) and cold (sea-ice reaches ~30°N/S) periods, respectively.

How to cite: Liu, Y. and Liu, P.: A Greener but Less Productive Proterozoic Ocean, EGU General Assembly 2026, Vienna, Austria, 3–8 May 2026, EGU26-10809, https://doi.org/10.5194/egusphere-egu26-10809, 2026.

EGU26-12349 | Posters on site | CL1.1.1

Radiocarbon evidence for early deglacial changes in deep ocean upwelling near the Antarctic Divergence Zone in the Atlantic sector of the Southern Ocean 

Julia Gottschalk, Cassandra Bartels, Robert F. Anderson, Xavier Crosta, Felix J. Elling, Oliver Esper, Daniel A. Frick, Jacqueline Hartmann, David A. Hodell, Samuel L. Jaccard, Yair Rosenthal, Luke C. Skinner, Sönke Szidat, and Lukas Wacker

Antarctic ice core evidence indicates that atmospheric CO2 levels increased during Heinrich Stadial (HS) 1 and the Younger Dryas (YD) during the last deglaciation. A substantial fraction of this carbon is believed to have stemmed from the ocean interior, released, in part, through enhanced wind-driven upwelling and air-sea CO2 exchange in the Southern Ocean. This was highlighted by two deglacial opal flux peaks identified in sediment core TN057-13-PC4 (53.17 °S, 5.13 °E, 2818 m water depth) from the Atlantic Southern Ocean south of the Polar Front, proximal to the Antarctic Divergence Zone (Anderson et al., 2009). However, there is limited information on changes in deep-ocean 14C ventilation and surface ocean hydrography in the Atlantic Antarctic Divergence, and their role in atmospheric CO2 variations during these two periods of deglacial CO2 rise. Here, we provide a new set of 12 mixed-benthic and 63 planktonic foraminiferal (i.e., Neogloboquadrina pachyderma) 14C ages obtained with a MIni-CArbon-DAting-System (MICADAS) in sediment core TN057-13-PC4, along with high-resolution multi-proxy (sub-)sea surface temperature reconstructions for the same site (N. pachyderma Mg/Ca ratios, TEX86, diatom assemblages). Our data help better constrain the nature, timing, and impacts of deep-ocean upwelling on surface ocean hydrography and on atmospheric CO2 exchange near the Antarctic Divergence of the Southern Ocean. Our data show strong (sub-)surface warming in the Antarctic Divergence during HS1 and YD that is accompanied by a rapid decline in benthic-minus-planktic 14C ages towards mean Holocene values at the onset of the deglaciation. We also observe millennial-scale increases in seawater d18O (paired N. pachyderma Mg/Ca-d18O analyses), hence local surface salinity and marked variations in 14C surface ocean reservoir ages that parallel changes in Antarctic sea ice extent. This corroborates previous evidence indicating increased upwelling of Circumpolar Deep Water in the Atlantic Antarctic Divergence during HS1 and YD, yet suggests an onset of strong Southern Ocean ventilation earlier than what is expected from increases in opal fluxes alone. Our data support a fundamental role of upwelling and CO2 outgassing in the Antarctic Divergence of the Southern Ocean in the two-step atmospheric CO2 rise during the last deglaciation, and further suggest that possible variations in CO2 solubility and sea-ice retreat amplified the effects of physical circulation changes on Southern Ocean air-sea CO2 exchange.

References: Anderson, R.F., Ali, S., Bradtmiller, L.I., Nielsen, S.H.H., Fleisher, M.Q., Anderson, B., Burckle, L.H., 2009. Wind-driven upwelling in the Southern Ocean and the deglacial rise in atmospheric CO2. Science 323, 1443–1448. doi: 10.1126/science.1167441

How to cite: Gottschalk, J., Bartels, C., Anderson, R. F., Crosta, X., Elling, F. J., Esper, O., Frick, D. A., Hartmann, J., Hodell, D. A., Jaccard, S. L., Rosenthal, Y., Skinner, L. C., Szidat, S., and Wacker, L.: Radiocarbon evidence for early deglacial changes in deep ocean upwelling near the Antarctic Divergence Zone in the Atlantic sector of the Southern Ocean, EGU General Assembly 2026, Vienna, Austria, 3–8 May 2026, EGU26-12349, https://doi.org/10.5194/egusphere-egu26-12349, 2026.

EGU26-13087 | ECS | Orals | CL1.1.1

Revisiting radiocarbon production and the glacial carbon cycle during the Laschamps geomagnetic excursion 

Vincent Wall, Frank Lamy, Lester Lembke-Jene, Johannes Lachner, Stella Winkler, and Florian Adolphi

Reconstructions of atmospheric radiocarbon during the Laschamps geomagnetic excursion show a pronounced increase in Δ14C. The amplitude of this increase remains poorly reproduced by current carbon cycle models driven by independent 14C-production rates derived from 10Be ice-core records or geomagnetic field intensity reconstructions. This mismatch has commonly been attributed to uncertainties in cosmogenic 14C production rates, potentially arising from the underestimation of global production-rate changes in polar ice-core 10Be records during periods of strongly reduced geomagnetic field intensity.

Here we present a new global compilation of 10Be records from ice cores and marine sediments spanning the Laschamps event, providing an improved, globally integrated estimate of cosmogenic nuclide production for the period from 30,000 to 60,000 years BP. This compilation overcomes previous limitations of polar-only ice-core records, is more representative of global production, and is consistent with latest geomagnetic field intensity reconstructions. However, while the revised production rate implies larger 14C production-rate changes than previous estimates, it remains insufficient to reproduce the full amplitude of the observed Δ14C increase when implemented in carbon cycle models under conservative parameterization.

Using transient tuning of a simple carbon cycle model, we show that the remaining model–data mismatch is closely linked to signals observed in independent climate proxies, in particular ice-core δ18O records. This similarity suggests that the interactions between climate changes and carbon cycle dynamics during the glacial period are not adequately represented in current models.

Our results indicate that uncertainties in cosmogenic production alone cannot explain the radiocarbon anomaly associated with the Laschamps event. Instead, they point to a need for improved representations of climate–carbon cycle interactions under glacial conditions. This finding highlights the importance of revisiting carbon cycle dynamics, including carbon reservoir sizes, exchange rates, and circulation changes, in glacial climates, and demonstrates the value of globally integrated cosmogenic isotope records for disentangling production and carbon cycle effects in past radiocarbon variations.

How to cite: Wall, V., Lamy, F., Lembke-Jene, L., Lachner, J., Winkler, S., and Adolphi, F.: Revisiting radiocarbon production and the glacial carbon cycle during the Laschamps geomagnetic excursion, EGU General Assembly 2026, Vienna, Austria, 3–8 May 2026, EGU26-13087, https://doi.org/10.5194/egusphere-egu26-13087, 2026.

EGU26-13842 | Orals | CL1.1.1

Paleoclimate and Paleoenvironments of Early to Middle Miocene strata in West Turkana, Kenya: proxy records of forests, woodlands, and hydroclimate change 

William Lukens, Daniel Peppe, Susanne Cote, James Rossie, Alan Deino, Joslyn Herold, Ana Venters, Venanzio Munyaka, and Francis Muchemi

The Lothidok Range west of Lake Turkana, Kenya contains a rich paleontological record, including multiple well-preserved Miocene fossil ape taxa. Our work, as part of the West Turkana Miocene Project, seeks to integrate new paleontological surveys with modern tools in geologic mapping, stratigraphic analysis, geochronology, and proxy-based climatic and environmental reconstructions. The Early Miocene Moruorot and Kalodirr localities are well known for fossils of the ape taxa Afropithecus, Turkanapithecus, and Simiolus. Our work at Moruorot demonstrates that these ape taxa were coeval and are preserved in humid alluvial fan complexes. Paleovegetation proxies based on stable carbon isotope ratios in paleosol organic matter (δ13Com = -28 to -31 ‰) and pedogenic carbonates (δ13Cpc = -9 to -12 ‰) are consistent with C3 plants thriving in a forested ecosystem. This interpretation is bolstered by the presence of calcified branches and fruits in lahar deposits. We also use a paleosol bulk geochemical proxy for mean annual precipitation (MAP), which yields values of 1700-1900 mm, which requires intense seasonality of rainfall for pedogenic carbonate stability. In contrast to the Early Miocene paleoenvironments, nearby Middle Miocene deposits at Esha that contain at least one newly discovered fossil ape taxon preserve floodplain paleosols that suggest seasonal woodland conditions (δ13Com = -19 to - 27‰, δ13Cpc = -6.5 to -12 ‰) with a minor fraction of C4 plants in a C3-dominated biome. The paleosol bulk geochemical proxy yields MAP estimates of 500-1000 mm, notably drier than the Early Miocene paleosols. This multi-proxy investigation demonstrates that the West Turkana region experienced drying from the Early to Middle Miocene, and that both time intervals were much wetter than modern conditions. Our ongoing work is focused on refining the stratigraphy and geochronology at both known and newly discovered Early and Middle Miocene sites, and placing systematically collected fossils within a well resolved geological and paleoenvironmental framework across the southern Lothidok Range.

How to cite: Lukens, W., Peppe, D., Cote, S., Rossie, J., Deino, A., Herold, J., Venters, A., Munyaka, V., and Muchemi, F.: Paleoclimate and Paleoenvironments of Early to Middle Miocene strata in West Turkana, Kenya: proxy records of forests, woodlands, and hydroclimate change, EGU General Assembly 2026, Vienna, Austria, 3–8 May 2026, EGU26-13842, https://doi.org/10.5194/egusphere-egu26-13842, 2026.

EGU26-14111 | ECS | Posters on site | CL1.1.1

Methane–Climate Interactions over Phanerozoic Timescales in an Earth System Modelling Framework 

Yixuan Xie, Paul Valdes, Peter Hopcroft, and Dan Lunt

Methane is a powerful greenhouse gas that plays an important role in Earth’s climate. However, its long-term evolution over deep-time remains poorly constrained. Consequently, methane is rarely treated as an explicit, dynamically evolving component in Earth system models, and its potential contribution to long-term climate variability has not been systematically explored.

Here we present a modelling framework coupled to the Earth System Model HadCM3, designed to investigate methane–climate interactions over multi-million-year timescales. The model represents major methane sources, with a particular focus on wetland emissions, and simulates methane sinks through an explicit atmospheric chemistry scheme, enabling a process-based calculation of atmospheric methane concentrations. Methane radiative forcing is subsequently derived from the simulated concentrations to evaluate its long-term climatic impact.

Our preliminary simulations indicate that methane variations exhibit nonlinear and systematic dependencies on background climate state and carbon cycle conditions. The persistent co-variation between CO₂ forcing and global temperature over the Phanerozoic, despite the gradual increase in solar luminosity, implies the presence of additional compensating forcings or feedback mechanisms. Our results indicate that methane radiative forcing alone is insufficient to provide this compensating influence, pointing to the involvement of additional long-term climate factors that are not yet fully understood.

How to cite: Xie, Y., Valdes, P., Hopcroft, P., and Lunt, D.: Methane–Climate Interactions over Phanerozoic Timescales in an Earth System Modelling Framework, EGU General Assembly 2026, Vienna, Austria, 3–8 May 2026, EGU26-14111, https://doi.org/10.5194/egusphere-egu26-14111, 2026.

EGU26-14466 | Posters on site | CL1.1.1

Decoupling of Neogene Seawater Lithium Isotopes from Uplift-driven Weathering 

Yudong Liu, Yibo Yang, Philip A. E. Pogge von Strandmann, Zhangdong Jin, and Xiaomin Fang

The ~9‰ increase in seawater lithium isotope composition (δ7Li) during the Cenozoic is widely interpreted as evidence for uplift-driven intensification of continental silicate weathering, particularly associated with major orogenic systems such as the Tibetan Plateau. However, this interpretation remains largely untested due to the lack of long-term riverine δ7Li records from tectonically active regions. Here we present the first Neogene paleowater δ7Li records spanning the past ~15 Myr from both the southern and northern Tibetan Plateau, a region that today contributes ~18% of the global riverine Li flux. Our dataset is derived from a 3500-m-thick fluvial sequence (15-5 Ma) in the Siwalik foreland basin (southern, monsoon-dominated Plateau) and a 1700-m drill core (7.3-0.1 Ma) from the Qaidam Basin (northern, arid Plateau). These two archives capture contrasting climatic, lithological and denudation regimes associated with Neogene uplift and cooling. Reconstructed paleowater δ7Li values reveal persistently low values in the southern Plateau and a long-term decrease in the northern Plateau, indicating reduced silicate weathering intensity under conditions of climatic cooling and rapid exhumation. These trends contrast with the coeval rise in seawater δ7Li, challenging the view that enhanced silicate weathering from uplifted mountain belts directly drives the marine lithium isotope record. By integrating our δ7Li reconstructions and reconstructed Li fluxes from the entire Tibetan Plateau into a global lithium cycle model, we show that continental silicate weathering from tectonically active mountains alone is unlikely to account for the observed Neogene increase in seawater δ7Li. Our results highlight the need for direct continental records from major orogenic systems to robustly constrain the links between tectonics, weathering, and the long-term carbon cycle.

How to cite: Liu, Y., Yang, Y., Pogge von Strandmann, P. A. E., Jin, Z., and Fang, X.: Decoupling of Neogene Seawater Lithium Isotopes from Uplift-driven Weathering, EGU General Assembly 2026, Vienna, Austria, 3–8 May 2026, EGU26-14466, https://doi.org/10.5194/egusphere-egu26-14466, 2026.

EGU26-14764 | ECS | Orals | CL1.1.1

A novel approach for quantifying the timing and volume of volcanic degassing in deep time: A case study from the Sinemurian – Pliensbachian Boundary Event 

Oliver Neilson, Isabel Fendley, Joost Frieling, Tamsin Mather, Stephen Hesselbo, Hugh Jenkyns, and Clemens Ullmann

Understanding deep-time climatic feedbacks relies on quantifying the initial drivers of Earth system perturbations. Earth system perturbations are highly sensitive to, among other parameters, the timing and duration of volcanic degassing. Currently, these input parameters are coarsely constrained, with volatile estimates coming from melt inclusion data and radiometric dating1. However, recent work has highlighted the power of combining sedimentary mercury (Hg), a volcanic tracer, and simple Hg cycle box models to estimate the tempo and volume of volcanic degassing in deep time2.

Here, we present a quantitative high-resolution degassing history through the Sinemurian - Pliensbachian Boundary Event (SPBE). This protracted negative “U-shaped” carbon isotope excursion lasted for over 3 million years in the Early Jurassic (ca. 190 Ma). We utilise over 1600 samples collected from the recently drilled core at Prees, Cheshire Basin, U.K., as part of the International Continental Scientific Drilling Program JET project, to create this history.

The SPBE is broadly coeval with increased rifting and the associated opening of the Hispanic Seaway, and potentially a late pulse of volcanic activity from the Central Atlantic Magmatic Province3–5, all of which may have contributed to its shape and duration. We quantify the tempo and volume of volcanic degassing during the SPBE using a novel geochemical machine-learning framework to isolate volcanically sourced Hg, followed by identification of the best-fit degassing scenarios using a global Hg box model.

The results of our method have implications regarding the sensitivity and feedbacks of the carbon cycle in deep time.  Specifically, we quantify the evolution of emissions during this enigmatic excursion. This will directly aid in understanding climate sensitivity during this period, where the protracted “U-shaped” change in carbon isotopes must now be reconciled with our evidence for distinct pulses of volcanic emissions throughout.

This work helps bridge the gap between the palaeoclimate modelling and proxy communities. By quantitatively linking Hg concentrations to volcanic degassing, we can provide volcanic inputs with a precision of a few thousand years to modellers aiming to simulate deep-time climate change.

References:

1. Hernandez Nava, A. et al. Reconciling early Deccan Traps CO2 outgassing and pre-KPB global climate. Proceedings of the National Academy of Sciences 118, e2007797118 (2021).

2. Fendley, I. M. et al. Early Jurassic large igneous province carbon emissions constrained by sedimentary mercury. Nat. Geosci. 17, 241–248 (2024).

3. Franceschi, M. et al. Early Pliensbachian (Early Jurassic) C-isotope perturbation and the diffusion of the Lithiotis Fauna: Insights from the western Tethys. Palaeogeography, Palaeoclimatology, Palaeoecology 410, 255–263 (2014).

4. Ruhl, M. et al. Astronomical constraints on the duration of the Early Jurassic Pliensbachian Stage and global climatic fluctuations. Earth and Planetary Science Letters 455, 149–165 (2016).

5. Jiang, H. et al. Large-scale volcanogenic Hg enrichment coincided with the Sinemurian-Pliensbachian boundary event (Early Jurassic). Geological Society of America Bulletin https://doi.org/10.1130/B37640.1 (2025) 

How to cite: Neilson, O., Fendley, I., Frieling, J., Mather, T., Hesselbo, S., Jenkyns, H., and Ullmann, C.: A novel approach for quantifying the timing and volume of volcanic degassing in deep time: A case study from the Sinemurian – Pliensbachian Boundary Event, EGU General Assembly 2026, Vienna, Austria, 3–8 May 2026, EGU26-14764, https://doi.org/10.5194/egusphere-egu26-14764, 2026.

EGU26-15171 | ECS | Orals | CL1.1.1

North Atlantic sea surface temperature evolution across the Oligocene–Miocene Transition from TEX86 paleothermometry 

Tobias Agterhuis, Heather Stoll, Thomas Tanner, Emily Hollingsworth, Gavin Foster, Bridget Wade, and Gordon Inglis

The Oligocene–Miocene Transition (OMT) includes a pronounced ~1‰ positive excursion in benthic oxygen isotope records (δ18O), reflecting Antarctic ice sheet expansion and/or deep ocean cooling, commonly referred to as the Mi-1 glaciation. At present, limited reconstructions of sea surface temperature (SST) evolution across the OMT have been published, leaving the magnitude of global cooling during Mi-1 uncertain. Here we present high-resolution (~10 kyr) SST reconstructions from IODP Site U1406 on the Newfoundland Margin (North Atlantic) using the lipid biomarker TEX86 proxy, based on isoGDGT distributions. Our record shows TEX86 values ranging from 0.64 to 0.76, with a ~0.04 decrease during the Mi-1 event. To assess potential non-thermal overprints on the TEX86 data, we calculated GDGT-based indices, including the Branched-to-Isoprenoid Tetraether (BIT) index. BIT values are relatively high (0.4–0.8), suggesting significant input of terrestrial GDGTs that could bias TEX86. However, TEX86 and BIT show weak correlation (R2 = 0.124), indicating limited terrestrial overprint on the TEX86 signal. Furthermore, a ternary plot of brGDGT compositions shows that the Newfoundland samples differ from modern soils and peats, suggesting marine production of brGDGTs as the source of the high BIT values. These findings suggest that the Newfoundland Margin was not influenced by substantial terrestrial organic matter input across the OMT, and that TEX86 provides a reliable record of SST. Translating TEX86 into temperature, our record indicates warm SSTs ranging from 25 to 31 °C, with a cooling of ~2 °C during the Mi-1 event, consistent with published low-resolution alkenone-derived (UK’37) estimates (Guitián et al., 2019). Future work will focus on determining whether the observed SST cooling at Site U1406 reflects a global climate signal or is driven by latitudinal shifts in the North Atlantic SST gradient. This could be addressed using seawater oxygen isotope (δ18Osw) reconstructions based on the combination of SST proxies and planktic foraminiferal δ18O to infer changes in surface ocean circulation, alongside comparisons with Earth System Model simulations.

How to cite: Agterhuis, T., Stoll, H., Tanner, T., Hollingsworth, E., Foster, G., Wade, B., and Inglis, G.: North Atlantic sea surface temperature evolution across the Oligocene–Miocene Transition from TEX86 paleothermometry, EGU General Assembly 2026, Vienna, Austria, 3–8 May 2026, EGU26-15171, https://doi.org/10.5194/egusphere-egu26-15171, 2026.

EGU26-15355 | Orals | CL1.1.1

Long-term climate dynamics and carbon cycling in eastern Australian from MIS5 to present 

Haidee Cadd, John Tibby, Jonathan Tyler, Cameron Barr, Matthew Forbes, Melanie Leng, Michela Mariani, Patrick Moss, Timothy Cohen, Bo Li, Sam Marx, Debashish Mazumder, Tsuyoshi Kobayashi, and Fabian Boesl

The last glacial cycle is a key period in the environmental and cultural history of the Australian continent, yet the climate of this time period remains poorly understood. Conflicting evidence from spatially disparate lacustrine records and discontinuous fluvial archives have hindered consensus on environmental change during this period. Here, we present two new, highly resolved organic sedimentary records from the Thirlmere Lakes (NSW) and Minjerribah (North Stradbroke Island, QLD) regions of eastern Australia that provide new constraints on long-term climate and environmental variability through the last glacial cycle.

Australian aquatic systems often deviate from biogeochemical frameworks developed largely from Northern Hemisphere environments. The prevalence of low-nutrient conditions results in unusual carbon isotope signatures, complicating the identification of organic carbon sources and their transport between terrestrial and aquatic reservoirs. Through characterisation of modern aquatic carbon isotopes, we develop alternative threshold values for distinguishing organic matter sources and, in turn, demonstrate the utility of sedimentary stable carbon isotopes as robust tracers of environmental and climatic change in southern mid-latitude systems.

Applying these newly developed isotope thresholds, we reconstruct millennial-scale climate variability in eastern Australia from Marine Isotope Stage 5 to the present. The resulting records reveal strong coupling between regional carbon cycling and Southern Hemisphere high-latitude climate, with limited evidence for Northern Hemisphere forcing. These findings highlight the importance of regionally calibrated carbon isotope frameworks and demonstrate the value of stable carbon isotopes for reconstructing past Earth system change in under-represented Southern Hemisphere environments.

How to cite: Cadd, H., Tibby, J., Tyler, J., Barr, C., Forbes, M., Leng, M., Mariani, M., Moss, P., Cohen, T., Li, B., Marx, S., Mazumder, D., Kobayashi, T., and Boesl, F.: Long-term climate dynamics and carbon cycling in eastern Australian from MIS5 to present, EGU General Assembly 2026, Vienna, Austria, 3–8 May 2026, EGU26-15355, https://doi.org/10.5194/egusphere-egu26-15355, 2026.

Discovery of abundant lake ice-rafted debris (L‑IRD) coeval with dinosaurs in continental strata of the Late Triassic to middle Jurassic of northwestern China (Junggar Basin) led to reevaluation of paleolatitude for that region (1). The basin was inferred to lie north of the Arctic Circle during the Late Triassic/Early Jurassic, along with much of Northeast Asia, consistent with paleomagnetic reference frame data (2–4). Similarities in facies transitions through the Triassic and Jurassic in both the North and South China blocks, together with recent paleomagnetic interpretations, suggest amalgamation with the Siberian plate by the Late Triassic (5, 6), implying a giant Early Mesozoic Arctic continent dwarfing present-day Antarctica.

The L‑IRD shows that the southern margin of the Arctic had freezing winters despite high pCO₂, consistent with climate models (7), and the outsized Arctic continent would have had an enhanced continental climate with even colder winters. With lowlands freezing in winter in the southern Arctic, there were presumably significant mountain glaciers, perhaps even a small ice cap, as a background condition, consistent with glacioeustatic Triassic–Jurassic sea-level fluctuations (8).

The end-Triassic sea-level drop stands out in particular: a ∼10⁵‑year event on a multimillion-year rise, broadly coincident with the end-Triassic mass extinction (ETE) (9). This sea-level drop is coincident with the onset of the Central Atlantic Magmatic Province (CAMP), but modeling suggests that CAMP-related uplift would have had relatively local effects (10). An increase in glacial ice triggered by CAMP volcanic winters provides a possible mechanism (11). Perhaps enhanced via ice–albedo feedback and a consequent increase in Earth System sensitivity to polar orbital forcing, ice-sheet growth may have triggered a recently identified ~400 kyr switch in tropical orbital pacing from expected precession dominance to obliquity dominance and back (12), a temporary transition resembling the onset of the “40 kyr world” at the mid-Miocene transition, plausibly caused by growth of the Antarctic Ice Sheet to near-modern size (13).

This giant Arctic continent may have primed the Earth System to switch from a hothouse to a transient icehouse world during CAMP volcanic winters, causing an abrupt sea-level drop. The same cold perturbations may also have driven the extinction of all large non-insulated land animals, paving the way for dinosaur ecological dominance, as these insulated reptiles were already living in the freezing Arctic beforehand.

1) Olsen et al. 2022. Sci. Adv. 8, eabo6342; 2) Marcilly et al. 2021.  http://www.earthdynamics.org/climate/exposed_land.zip; 3) van Hinsbergen et al. 2014. paleolatitude.org; 4) Leonard et al. 2025. Commun. Earth Environ. 6, 508. 5) Yi et al. 2023. Earth Planet. Sci. Lett. 118143; 6) Olsen et al. 2024. Geol. Soc. Lond. Spec. Publ. 538, SP538–2023–2089; 7) Landwehrs et al. 2022. Proc. Natl. Acad. Sci. 119, e2203818119; 8) Wang et al. 2022. Glob. Planet. Change 208, 103706; 9) Fox et al. 2020. Proc. Natl. Acad. Sci.; 10)  Austermann et al. 2015. EGU Gen. Assem. Abstr. 3073; 11) Schoene. 2010. Geology 38, 387–390; 12) Olsen et al. 2024. AGU24, Abstr. V22A-05; 13) Westerhold et al. 2020. Science 369, 1383.

How to cite: Olsen, P.: A Giant Arctic Continent During the Early Mesozoic:  its Climatic, Eustatic, and Biotic Implications, EGU General Assembly 2026, Vienna, Austria, 3–8 May 2026, EGU26-15949, https://doi.org/10.5194/egusphere-egu26-15949, 2026.

EGU26-16243 | Orals | CL1.1.1

 Impact of Ocean Physical Conditions on Ocean Carbon Pumps and Atmospheric CO2 

Miyano Nishida, Akira Oka, and Hidetaka Kobayashi

During glacial periods, atmospheric COconcentrations are known to have been about 90 ppmv lower than during interglacial. However, climate models have not been able to fully reproduce this decrease, partly due to large uncertainties in changes in ocean physical fields. In this study, we evaluate the impact of uncertainties in ocean physical fields on atmospheric pCOduring the Last Glacial Maximum (LGM) using a single offline ocean biogeochemical model forced by 12 ocean physical states derived from PMIP.

The simulated glacial atmospheric pCOreduction is 40.3 ± 7.8 ppmv on average, with a large inter-model spread. This reduction mainly comes from the SST-dependent solubility effect (−30.1 ± 5.6 ppmv) and the enhanced efficiency of the organic matter pump (−21.6 ± 6.6 ppmv), cancelled somewhat by the response of the gas-exchange pump (+6.2 ± 9.4 ppmv). Our analysis suggests that the enhanced efficiency of the organic matter pump is associated with the older deep-water age in the glacial ocean and the response of the gas-exchange pump appears controlled by the SST contrast between the North Atlantic and the Southern Ocean.

We find that models with older radiocarbon deep-water ages exhibit more efficient sequestration of carbon transported by the organic matter pump into the deep ocean, leading to a larger glacial reduction in atmospheric pCO2. However, all models used in this study underestimate the deep-water radiocarbon ages suggested by Δ14C paleoclimate records. In addition, both the global mean SST and the global mean ocean temperature are tend to be underestimated in the model compared to paleoclimate proxy reconstructions, leading to the smaller contribution of the SST-dependent solubility effect to the pCO2 reduction. If such model biases (i.e. underestimation of deep-water ages and the SST cooling) are corrected, we estimate that the corrected model estimate of the glacial pCO2 reduction becomes up to ~65ppmv which is still not enough for 90 ppmv reduction obtained from ice core record. Our results imply that the improvement in the reproducibility of the glacial ocean physical field alone are insufficient to fully account for the glacial atmospheric COreduction and further improvements in the representation of ocean biogeochemical processes are also required under constraints including carbon isotope records.

How to cite: Nishida, M., Oka, A., and Kobayashi, H.:  Impact of Ocean Physical Conditions on Ocean Carbon Pumps and Atmospheric CO2, EGU General Assembly 2026, Vienna, Austria, 3–8 May 2026, EGU26-16243, https://doi.org/10.5194/egusphere-egu26-16243, 2026.

EGU26-16785 | ECS | Posters on site | CL1.1.1

Quantifying spatiotemporal variability in Neogene organic carbon burial: a case for ocean model upsampling 

Aspen Sartin, Richard G. Stockey, Pam Vervoort, Eelco J. Rohling, and Thomas M. Gernon

3D biogeochemical ocean models such as cGENIE can explicitly model depth-dependent carbon cycle processes, such as remineralisation of organic carbon. This potential advantage of 3D models (in comparison to box ocean models) can, however, be limited by coarse spatial resolutions. In particular, continental shelves may be underresolved in 3D model bathymetric grids. Such grids are created by downsampling (palaeo)-digital elevation models (DEMs).

We develop an algorithm (here termed ‘DEM-based upsampling’) to project 3D ocean model output onto its associated DEM. This resolves depth-dependent quantities and fluxes at the seafloor at degree-scale and better captures shallow seafloor, including continental shelves. This is critical for modelling organic carbon cycling, as continental shelves receive more than half of the global flux of organic carbon to the seafloor. We validate the DEM-based upsampling algorithm using area-weighted errors between a modern-Earth model run and observational data (World Ocean Atlas 2023). Upsampling yields statistically significant reductions in error in modelled temperature, salinity, oxygen concentration, and phosphate concentration across bootstrap confidence intervals and paired non-parametric tests.

We then derive the first spatially-resolved model record of ocean organic carbon burial from 25 Ma – present using the PhanerO3D framework, driving cGENIE with SCION biogeochemistry and HadCM3L atmospheric physics. We obtain organic carbon burial flux by upsampling cGENIE’s organic carbon export flux and applying a simple burial scheme. We find the global burial rate peaks in the early Miocene, then declines over the remaining Neogene. This trend agrees well with geochemical records until the latest Miocene – Pliocene. We find global variability to be largely driven by regional changes; notably declining North Atlantic margin burial over the Miocene, and rising West Pacific burial in the Pliocene.

These results highlight the advantages of DEM-based upsampling as a tool in palaeoclimate modelling: better constraining depth-dependent ocean processes, facilitating deeper investigation of spatiotemporal patterns, and potentially facilitating more spatially precise proxy-model comparison.

How to cite: Sartin, A., Stockey, R. G., Vervoort, P., Rohling, E. J., and Gernon, T. M.: Quantifying spatiotemporal variability in Neogene organic carbon burial: a case for ocean model upsampling, EGU General Assembly 2026, Vienna, Austria, 3–8 May 2026, EGU26-16785, https://doi.org/10.5194/egusphere-egu26-16785, 2026.

EGU26-16908 | ECS | Orals | CL1.1.1

Late Ordovician Climate Reconstruction Based on State-Dependent Climate Sensitivity 

Qingteng Zhang and Junxuan Fan

The Hirnantian glacial maximum was a brief but intense glacial event that occurred during the latest Ordovician (~445-443 million years ago). It was characterized by global cooling, major ice-sheet expansion over Gondwana, and substantial perturbations to the carbon cycle. Previous studies have combined Earth system models with proxy records to investigate the magnitude of the cooling and to explore the mechanisms linking ocean deoxygenation to the Late Ordovician mass extinction. However, the results of these reconstructions exhibit considerable discrepancies, primarily due to the increasing uncertainty of proxy data with geological age and the difficulty of constraining boundary conditions required by models in deep time. Here we introduce state-dependent climate sensitivity, in which the radiative forcing of atmospheric CO2 increases with its concentration, to improve the Earth system modelling. We then perform a series of simulations with varying levels of greenhouse gases and nutrients to identify the climate-productivity conditions that plausibly drove the cooling during the Hirnantian glacial maximum. Applying rigorously screened Late Ordovician sea-surface temperature estimates derived from oxygen isotope studies as constraints, alongside a semi-quantitative constraint based on a new compilation of local redox proxies, we identify a plausible scenario of Hirnantian climate and redox changes. Our results show that deep-ocean deoxygenation during the Hirnantian was driven by a combination of cooling and changes in ocean nutrient inventory, and that temperature-driven microbial respiration can reconcile the spatial distribution of seafloor anoxia as reconstructed, providing new insights into the decoupling of redox conditions between the surface and deep waters. In addition, our simulations suggest that Late Ordovician atmospheric CO2 levels before cooling may have been substantially overestimated (up to 6,720 ppm according to previous studies), likely due to a fixed climate sensitivity assumed in previous modelling studies. This overestimation may not be limited to this event, but could also affect climate simulations of other periods.

How to cite: Zhang, Q. and Fan, J.: Late Ordovician Climate Reconstruction Based on State-Dependent Climate Sensitivity, EGU General Assembly 2026, Vienna, Austria, 3–8 May 2026, EGU26-16908, https://doi.org/10.5194/egusphere-egu26-16908, 2026.

EGU26-16949 | ECS | Posters on site | CL1.1.1

Multi-proxy reconstruction of late Maastrichtian surface-ocean dynamics in the tropical Pacific 

Alexa Fischer, Thomas Westerhold, Ursula Röhl, André Bahr, Silke Voigt, and Oliver Friedrich

The Late Cretaceous greenhouse climate experienced a pronounced cooling trend during the Campanian–Maastrichtian, potentially driven by declining atmospheric CO2 and ocean-gateway reorganization. Yet, low-latitude high-resolution reconstructions remain limited, hampering mechanistic interpretations of surface-ocean dynamics. Here, we present a new high-resolution planktonic Mg/Ca-derived sea-surface temperature (SST) record from Ocean Drilling Program (ODP) Sites 1209 and 1210 (Shatsky Rise, western tropical Pacific), spanning ~2.5 Myr (67.0–69.4 Ma). Reconstructed SSTs range between ~32 and 34 °C, consistently exceeding modern tropical surface-ocean temperatures. SSTs rise toward ~68.1 Ma before cooling in the youngest part of the record. While absolute Mg/Ca temperatures are higher than published TEX86 and planktonic δ18O-based SSTs, the major trends agree across proxies. To place these SST changes into a broader paleoceanographic framework, we integrate our record with new high-resolution planktonic δ13C and δ18O data from the same sites. The combined dataset enables evaluation of carbon-cycle perturbations, surface-water salinity variability (δ18Osw), and productivity-related vertical δ13C gradients, as well as their pacing on orbital timescales. Together, these results refine Maastrichtian low-latitude climate variability and highlight a trend toward increased meridional temperature gradients.

How to cite: Fischer, A., Westerhold, T., Röhl, U., Bahr, A., Voigt, S., and Friedrich, O.: Multi-proxy reconstruction of late Maastrichtian surface-ocean dynamics in the tropical Pacific, EGU General Assembly 2026, Vienna, Austria, 3–8 May 2026, EGU26-16949, https://doi.org/10.5194/egusphere-egu26-16949, 2026.

EGU26-18128 | ECS | Posters on site | CL1.1.1

Refining Phanerozoic Extreme Climate Simulations with Equilibrium Climate Sensitivity (ECS) in cGENIE 

Qingteng Zhang and Junxuan Fan

Equilibrium climate sensitivity (ECS), defined as the response of the global mean surface temperature response to a sustained doubling of atmospheric CO2 at equilibrium, is a key metric for quantifying the Earth’s climate sensitivity to greenhouse gas emissions. Accurate ECS estimates are therefore fundamental for reliable simulations of the long-term carbon cycle. cGENIE, as an Earth system model of intermediate complexity that integrates ocean circulation, atmospheric energy balance, and global biogeochemical cycling, is widely used to investigate cross-sphere carbon cycle evolution and long-term climate feedback mechanisms. However, previous cGENIE studies have assumed a fixed climate sensitivity (with a default radiative forcing of 4 W m-2 per CO2 doubling), which often led to inaccurate surface temperature estimates compared with proxy reconstructions, limiting the model’s ability to capture state-dependent climate feedbacks. Here we use fully coupled models (e.g., HadCM3 and CESM) to derive the relationship between atmospheric CO2 concentrations and ECS throughout the Phanerozoic. These simulations are considered to closely match proxy reconstructions of temperatures. We then incorporate state-dependent climate sensitivity into cGENIE to enhance its representation of climate feedbacks across varying CO2 levels. Our results show that temperature simulations using the unmodified cGENIE model exhibit substantial discrepancies for periods of rapid cooling and warming, such as the Late Ordovician and the PETM. However, incorporating state-dependent climate sensitivity substantially reduces the discrepancy between simulated and proxy-reconstructed surface temperatures. These findings highlight the importance of accounting for state-dependent climate sensitivity in Earth system models, both for accurately reconstructing past climate extremes and for improving projections of future climate change.

How to cite: Zhang, Q. and Fan, J.: Refining Phanerozoic Extreme Climate Simulations with Equilibrium Climate Sensitivity (ECS) in cGENIE, EGU General Assembly 2026, Vienna, Austria, 3–8 May 2026, EGU26-18128, https://doi.org/10.5194/egusphere-egu26-18128, 2026.

EGU26-18315 | Orals | CL1.1.1

Pacific and Atlantic Modes of Overturning in the Miocene Climatic Optimum 

David Hutchinson, Katrin Meissner, Laurie Menviel, Nicky Wright, James Berg, Paul Acosta, and Benjamin Anthonisz

During the Cenozoic Era, the ocean's meridional overturning circulation (MOC) has alternated between North Pacific and North Atlantic sinking modes. The Miocene Climatic Optimum (17.0–14.7 Ma) is a key interval for reconstructing this history because there is partial and inconclusive evidence for both MOC modes during this period. Here we investigate the MOC during the Miocene Climatic Optimum using two different climate models, GFDL CM2.1 and ACCESS-ESM1.5. Simulations are forced with atmospheric CO2 levels of pre-industrial concentration (286 ppm), double (572 ppm) and triple (858 ppm) CO2- the latter two falling within proxy-based estimates for this period.

In the GFDL CM2.1 model, we find either North Pacific overturning or North Atlantic overturning modes at all three CO2 levels, depending on the details of the paleogeography. Arctic-Atlantic gateways are especially important in controlling the freshwater balance, and hence surface density, in the North Atlantic sinking regions. By contrast, in the ACCESS-ESM1.5 model, we find that North Atlantic overturning consistently occurs at pre-industrial CO2 only. At double or triple CO2, the model becomes increasingly stratified, leading to a weakening or collapse of the global overturning circulation. The more stratified regimes are linked to a significantly higher climate sensitivity in ACCESS-ESM1.5, with intensified surface buoyancy changes.  These markedly different overturning regimes have major implications for deep ocean oxygenation, with the stratified cases becoming largely hypoxic in the deep ocean, while cases with active overturning remain well oxygenated.

How to cite: Hutchinson, D., Meissner, K., Menviel, L., Wright, N., Berg, J., Acosta, P., and Anthonisz, B.: Pacific and Atlantic Modes of Overturning in the Miocene Climatic Optimum, EGU General Assembly 2026, Vienna, Austria, 3–8 May 2026, EGU26-18315, https://doi.org/10.5194/egusphere-egu26-18315, 2026.

EGU26-18645 | ECS | Posters on site | CL1.1.1

Model-dependent latitudinal temperature gradient drives Late Ordovician climate stability 

Joseph Naar, Yannick Donnadieu, Guillaume Le Hir, Alexandre Pohl, and Jean-Baptiste Ladant

Among the five great extinction events of the Phanerozoic, the Late Ordovician stands out as it is
concomitant with a massive glacial event under high atmospheric pCO2. This apparent climate
paradox was addressed in numerous climate modeling studies. In particular, [1] showed that under
the specific palaeogeographical conditions of the Hirnantian (445 Ma), with an ocean-dominated
Northern Hemisphere, the climate system may undergo a “tipping point” where a small pCO2
variation leads to either glacial or ice-free warm equilibrium state.
Those results were obtained with the intermediate complexity Fast Ocean Atmosphere Model
(FOAM). We have conducted new simulations using the state-of-the-art coupled IPSL-CM5A2-LR
Earth System Model [2], spanning a wide range of pCO2 for the Hirnantian. We find that the climate
tipping point is entirely absent, and that the equilibrium climate sensitivity is strikingly linear in this
set of simulations.
We conducted a detailed model intercomparison and we have identified major differences between
the models in the representation of the radiative transfer, cloud cycle and oceanic eddy dynamics
which contribute to the qualitatively different model behaviors, enhanced under high atmospheric
pCO2 content. Specifically, the FOAM tipping point corresponds to an abrupt transition from a sharp
Northern latitudinal temperature gradient at low pCO2 (cold state) to a flattened gradient with warm
polar latitudes (ice-free warm state). In contrast, the IPSL-CM5A2 temperature gradient is relatively
constant across pCO2, with year-long sea ice confined in the Northern latitudes even under 15X
preindustrial pCO2 level (4200 ppm).
We propose a physical mechanism to link the warm FOAM flattened latitudinal temperature gradient
to the dramatic sea-ice albedo feedback sensitivity via the increased stratification of the superficial
ocean. Since this mechanism is independent of the physical parameterizations and relative
complexity of the models, and comparing our results with other scarce published climate simulations
of the Hirnantian [3,4], we propose that the latitudinal temperature gradient, seen as a model-
dependent emerging feature, may be the main driver of the previously unveiled sea-ice albedo
climate tipping point.
References:
[1] Pohl et al. (2014), Climate of the Past, 10, 6
[2] Sepulchre et al. (2020), Geoscientific Model Development, 13,7
[3] Pohl et al. (2017), Paleoceanography, 32, 4
[4] Valdes et al. (2021), Climate of the Past, 17, 4

How to cite: Naar, J., Donnadieu, Y., Le Hir, G., Pohl, A., and Ladant, J.-B.: Model-dependent latitudinal temperature gradient drives Late Ordovician climate stability, EGU General Assembly 2026, Vienna, Austria, 3–8 May 2026, EGU26-18645, https://doi.org/10.5194/egusphere-egu26-18645, 2026.

EGU26-18913 | Posters on site | CL1.1.1

Diapycnal mixing in the Early Eocene: insights from the DeepMIP intercomparison project phase 1 

Jean-Baptiste Ladant, Casimir de Lavergne, Wing-Le Chan, David Hutchinson, Dan Lunt, and Jiang Zhu

Tides are the main energy source for diapycnal mixing in the ocean interior. However, energy-constrained tidal mixing parameterizations are not routinely included in ocean models applied to the deep-time past of the Earth. Instead, diapycnal mixing is usually parameterised by a constant vertical diffusivity or a prescribed vertical profile of vertical diffusivity.

Here, by leveraging outputs from the DeepMIP project, we compute the power effectively consumed by parameterized diapycnal mixing in each DeepMIP model and for different CO2 concentrations. We show that this power slightly increases with increasing CO2 in simulations integrated to quasi-equilibrium but skyrockets in warming, out-of-equilibrium, simulations. This reflects the increased stratification in a warming ocean, even though in principle the same amount of tidal energy is available for mixing. We find no evident relationships between the intensity of the overturning circulation and the power consumed by diapycnal mixing across the DeepMIP models. Finally, we use coupled climate-biogeochemistry simulations performed with the IPSL-CM5A2 model to show that the marine biogeochemistry is largely impacted by the vertical mixing scheme employed, even if the total power consumed by diapycnal mixing remains similar.

How to cite: Ladant, J.-B., de Lavergne, C., Chan, W.-L., Hutchinson, D., Lunt, D., and Zhu, J.: Diapycnal mixing in the Early Eocene: insights from the DeepMIP intercomparison project phase 1, EGU General Assembly 2026, Vienna, Austria, 3–8 May 2026, EGU26-18913, https://doi.org/10.5194/egusphere-egu26-18913, 2026.

EGU26-19757 | ECS | Orals | CL1.1.1

Variability and controls of organic and carbonate carbon burial on the West Australian shelf during the Late Pleistocene 

Arianna V. Del Gaudio, Or M. Bialik, Gerald Auer, and David De Vleeschouwer

The mid and late Pleistocene are marked by large-amplitude fluctuations in global ice volume and pronounced climatic variability. Around ~1 Ma, Earth’s climate system underwent a fundamental reorganization, as glacial–interglacial variability shifted from predominantly 41-kyr cycles to higher-amplitude, quasi-100-kyr oscillations. This transition was accompanied by enhanced atmospheric CO2 drawdown during glacial periods. However, how the global carbon cycle adjusted to this shift, and which reservoirs account for the lowered glacial atmospheric CO2 concentrations, remains not fully quantitatively constrained. In this context, marine carbon burial, particularly on continental shelves, represents a potentially important yet underexplored long-term sink for atmospheric CO2.

Here, we quantify variability in organic and carbonate carbon burial on the West Australian shelf and evaluate its potential contribution to Pleistocene atmospheric CO2 drawdown. We measured δ¹³C and calculated relative burial fractions and mass accumulation rates for organic and carbonate carbon in sediments recovered from IODP Expedition 356 Site U1460 (27°22′S, 112°55′E), spanning the last ~210 kyr (MIS 7–MIS 1). The site was drilled at ~214 m water depth in the northern Perth Basin and is situated in a dynamic oceanographic setting influenced by the interaction between the warm, oligotrophic Leeuwin Current (LC) and the cooler, nutrient-rich West Australian Current (WAC).

Our results reveal two pronounced maxima in organic carbon burial relative to carbonate during glacial MIS 6 (~168 ka) and MIS 2 (~26 ka), as well as a more moderate increase at ~109 ka across the MIS 5a–d to MIS 5e transition. These patterns are consistent with previous suggestions of enhanced shelf organic carbon burial during glacial periods (Auer et al., 2021). Variations in organic-to-carbonate burial ratios are paced by eccentricity-modulated glacial–interglacial sea-level changes and Milankovic-driven shifts in seasonality, both of which influence the strength of the LC and its interaction with the WAC. High sea level and enhanced seasonality strengthen the LC, restricting nutrient supply to the West Australian shelf. Conversely, low sea level and reduced seasonality weaken the LC, allowing the nutrient-rich WAC to dominate, thereby enhancing primary productivity and organic carbon burial.

Finally, we use organic carbon mass accumulation rates to place first-order constraints on the potential for carbon storage on the West Australian shelf during Late Pleistocene glacials. Although organic carbon burial increased during glacial intervals, limited accommodation space on the shelf likely restricted total organic carbon accumulation, preventing it from exerting a major influence on global glacial–interglacial atmospheric CO₂ variability.

How to cite: V. Del Gaudio, A., M. Bialik, O., Auer, G., and De Vleeschouwer, D.: Variability and controls of organic and carbonate carbon burial on the West Australian shelf during the Late Pleistocene, EGU General Assembly 2026, Vienna, Austria, 3–8 May 2026, EGU26-19757, https://doi.org/10.5194/egusphere-egu26-19757, 2026.

EGU26-19878 * | ECS | Orals | CL1.1.1 | Highlight

How old is the world’s oldest desert? Investigating the coevolution of landscape and climate in the development of the Namib Desert 

Bethany Allen, Jean Braun, Esteban Acevedo-Trejos, Christoph Böhm, and Georg Feulner

The Namib Desert in Southern Africa is likely the world’s oldest desert, experiencing arid to hyperarid conditions for most of the Cenozoic. The desert is inhabited by a unique flora and fauna, some of which has adapted to obtain water from fog, which develops along the Namibian coastline. However, our knowledge of the climatic history of this desert is fragmentary, based on evidence from lithology and geochemistry. Temporal constraints are often provided by biostratigraphy based on fossilised ratite eggshells, which only gives an approximate sequence of events.

In order to test different scenarios for the development of the Namib Desert, we employ FastScape, a landscape evolution model, combined with a model of orographic rainfall. We use this framework to reconstruct Southern African landscape evolution based on different hypotheses arising from geological data, and infer consequential climatic histories, over the last 100 million years. Modern-day remote sensing and weather station data are used to tune and test the fit of the final model timeslice. This allows us to determine which landscape evolution scenarios are most likely, providing novel insights into the onset and evolution of aridity in the Namib Desert.

How to cite: Allen, B., Braun, J., Acevedo-Trejos, E., Böhm, C., and Feulner, G.: How old is the world’s oldest desert? Investigating the coevolution of landscape and climate in the development of the Namib Desert, EGU General Assembly 2026, Vienna, Austria, 3–8 May 2026, EGU26-19878, https://doi.org/10.5194/egusphere-egu26-19878, 2026.

EGU26-19938 | ECS | Orals | CL1.1.1

Reconstructing Late Palaeozoic Land-Ice Distributions: A Machine Learning Framework for Model-Data Comparison 

Sayon Beura, Thomas Gernon, Richard Stockey, and Dan Lunt

Deep-time glacial intervals provide critical benchmarks for assessing Earth System Model (ESM) performance under past climate states. However, most paleo-simulations lack dynamic icesheets, leaving this key component poorly constrained. Here, we introduce a machine learning approach for reconstructing global glacial extent across the Phanerozoic, integrating paleoclimate simulations, paleo-topography, and a global stratigraphic database of glacial deposits. This framework generates spatially explicit, probabilistic reconstructions that enable quantitative comparison between geological archives and climate model ensembles, highlighting regions of agreement and mismatch.

The Late Palaeozoic Ice Age (LPIA), a >100-million-year glaciation variously attributed to declining atmospheric CO₂, palaeographic changes, and tectonic activity, provides an ideal case-study considered here. A persistent enigma concerning the LPIA is its hemispheric asymmetry, whereby preserved glacial deposits are abundant in the Southern Hemisphere but sparse in the Northern Hemisphere. Whether this bipolarity reflects genuine climate asymmetry or preservation bias remains unresolved. We address this by modelling the distribution of land-ice using environmental predictors such as temperature, precipitation, transpiration, and topography, derived from HadCM3L simulations that do not include dynamic icesheets. This analysis yields time-slice specific probabilistic reconstructions that can be directly compared with the preserved sedimentary record. We calibrate our framework against modern glaciers and LPIA glacial deposits, and subsequently applying it to other Phanerozoic ice ages, producing a consistent reference dataset for model-data comparison. While our approach does not replace fully coupled ice-climate simulations, it highlights some key discrepancies between models and geological evidence and allows climate asymmetry to be distinguished from preservation bias. By quantitatively bridging paleo-archives and climate models, our framework provides a new means of evaluating ESM performance across diverse climate states, strengthening constraints on ice-climate feedback relevant to future projections.

How to cite: Beura, S., Gernon, T., Stockey, R., and Lunt, D.: Reconstructing Late Palaeozoic Land-Ice Distributions: A Machine Learning Framework for Model-Data Comparison, EGU General Assembly 2026, Vienna, Austria, 3–8 May 2026, EGU26-19938, https://doi.org/10.5194/egusphere-egu26-19938, 2026.

Globally distributed data from the Last Glacial Maximum (LGM) indicate a significant depletion of radiocarbon in the ocean, equivalent to ~800 14Cyrs.  Some interpretations of these data have emphasized a slow-down of the North Atlantic overturning, as well as a reduction or even ‘reversal’ of overturning in the North Pacific.  While many model simulations have been able to produce a shoaled and weakened circulation in the Atlantic under glacial conditions, many others (and many of the same) produce a stronger overturning overall and in the Pacific.  If the glacial ocean circulation was indeed stronger, despite reduced radiocarbon ventilation, it would constrain the balance of contributions from marine ‘respired’ and ‘disequilibrium’ carbon pools to glacial atmospheric CO2 drawdown.  Here we show that global marine radiocarbon fields from the LGM and deglaciation are not consistent with the modern transport when taking into account past air-sea equilibration changes at the sea surface.  Rather, they imply a reduced and/or shoaled transport in the North Atlantic (consistent with most interpretations to date), and an enhanced transport throughout the Pacific.  Although the latter conflicts with some previous interpretations of LGM North Pacific radiocarbon data, it coheres with several key model simulations in suggesting an overall ‘faster’ glacial mass turnover despite weaker exchange of CO2 between the ocean and atmosphere.  This would emphasize the role of the disequilibrium carbon pool (and therefore ocean-atmosphere gas-exchange, influenced by upper ocean mixing, sea ice etc.) in determining the overall ocean’s overall sequestered carbon inventory during the last glacial period.

How to cite: Skinner, L. and Primeau, F.: Enhanced ocean transport despite reduced radiocarbon ventilation at the Last Glacial Maximum: were the models right all along?, EGU General Assembly 2026, Vienna, Austria, 3–8 May 2026, EGU26-21691, https://doi.org/10.5194/egusphere-egu26-21691, 2026.

The earliest Cenozoic Antarctic bryozoan fossil records (late Early Eocene) are well documented from the shallow-marine–estuarine clastic succession of the lower part (Telm1-2) of the La Meseta Formation of Seymour Island. In the 800-meters thick stratigraphical profile of the LMF in the basal facies of the (Telm1), the earliest – late Early Eocene bryozoans are represented by the internal moulds of the loosely encrusting, unizooidal, flexible articulated or rooted colonies belonging to cheilostome buguloids and catenicelloideans, which are taxonomically and morphologically different from the overlying fauna. At present, representatives of (Beanidae, Catenicellidae, Savignyellidae and Calwelliidae widely occur in the tropical-warm temperate latitudes in the shallow-marine settings (Hara, 2015). Higher in Telm1 the most common are spectacular in size, massive multilamellar colonies, showing a great variety of shapes dominated by cheilostome celleporiforms and cyclostome cerioporids (Hara, 2001). The stable isotopic δ18O analyses of the bryozoan skeletons from the lower part of the LMF show the temperature range from 13.4 to 14.6°C (Hara, 2022), what is consistent with the isotopic data of other marine macrofaunal fossil records (Ivany et al., 2008).

The distinct free-living lunulitiforms bryozoans, for the first time reported from Antarctica from the middle part of the LMF (Telm4-6, Cucullaea I-II; Ypresian/Lutetian) are represented by the disc-shaped colonies - characteristic for the temperate warm, shallow-shelf environment, with the bottom temperature, which are never lower than 10 to 12°C. The skeletons of Lunulites, Otionellina, and Uharella are formed by the intermediate-Mg calcite (IMC) with the 4.5 mol% MgCO3. Their bimineralic zoaria (with the traces of aragonite, calcite and strontium apatite) are indicative for the sandy, temperate shelf environment (Hara et al., 2018).

Contrary to occurrence of the rich bryozoans of the (Telm1–2), the Late Eocene bryozoans from the upper part of the LMF (Telm6–7), are represented by the scarce lepraliomorphs accompanied by the crustaceans, brachiopods and gadiform fish remains. The bryozoan-bearing horizon is composed of the single taxon tentatively assignated to Goodonia terminating the occurrence of the bryozoans, showing a sharp decline in their biodiversity between the lower and upper part of the formation (Hara, 2001), what is consistent with the overall pattern of Eocene cooling up to around 10,5°C in Telm6 and 7.

References

Hara U. 2001 – Bryozoa from the Eocene of Seymour Island, Antarctic Peninsula. Palaeontologia Polonica. III, 60: 33–156.

Hara U. 2015. Bryozoan internal moulds from the La Meseta Formation (Eocene) of Seymour Island, Antarctic Peninsula. PPR, 36, 25-49.

Hara U., 2022 – Geochemistry of the fossil and Recent bryozoan faunas in the natural diagenetic environments and their significance for the reconstruction of biota and climatic regimes in Cenozoic. Archive PGI-NRI, nr. 5210/2022.

Hara U., Mors T., Hagstrom J., Reguero M.A., 2018 – Eocene bryozoans assemblages from the La Meseta Formation of Seymour Island, Antarctica. Geol. Quar., 62: 705–728.

Ivany L.C., Lohmann K.C., Hasiuk F., Blake D.B., Glass A., Aronson R.B., Moody R.M., 2008 – Eocene climate record of the high southern latitude continental shelf: Seymour Island, Antarctica. Geol. Soc. Amer. Bull., 120, 5–6: 659–678.


How to cite: Hara, U.: Palaeoenvironmental and climatic events (EECO-EOT) in the bryozoan fossil  records of the Early Cenozoic  of Antarctica, EGU General Assembly 2026, Vienna, Austria, 3–8 May 2026, EGU26-21840, https://doi.org/10.5194/egusphere-egu26-21840, 2026.

EGU26-21846 | ECS | Posters on site | CL1.1.1

The oxidation of petrogenic organic carbon: a source of CO2 during transient warming events? 

Emily Hollingsworth, Robert Sparkes, Jean Self-Trail, Gavin Foster, and Gordon Inglis

The terrestrial carbon cycle has long been discussed under a framework that focuses on inorganic carbon (i.e. the balance between solid Earth degassing and silicate weathering). Therefore, the role of organic carbon has remained poorly constrained in both the present and past. A recent study highlighted the importance of rock-derived “petrogenic” organic carbon (OCpetro), suggesting that the amount of CO2 released during the exhumation and mobilisation of OCpetro may be comparable to that from volcanism. To determine the response of OCpetro to future climate change, warming events in the geologic record can be investigated. For example, there are biomarker-based evidence for up to an order-of-magnitude increase in the burial of OCpetro in shallow-marine sediments dated to the Paleocene-Eocene thermal maximum (PETM; ∼56 Ma). However, estimates of the proportion of OCpetro lost via oxidation are unavailable due to the lack of suitable techniques.

Raman spectroscopy assesses differences in the crystallinity of OCpetro, allowing the distinction between graphitised and disordered carbon. Modern river systems have shown a shift towards a dominance of graphite downstream, as disordered carbon are more susceptible to oxidation. Here, we explore whether Raman spectroscopy can be used to reconstruct OCpetro oxidation in the past. During the PETM, there is an increase of graphite in the mid-Atlantic Coastal Plain, indicating enhanced OCpetro oxidation. This is consistent with signs of intensified physical erosion and enhanced OCpetro delivery. On the other hand, the distribution of graphitised carbon vs. disordered carbon (and biomarkers) do not change in the Arctic Ocean, implying spatial variability. This study demonstrates, for the first time, the utility of Raman spectroscopy as a novel tool to evaluate OCpetro oxidation in a geological context. Applying this approach to quantify oxidation rates require further ground truthing in settings with different degrees of weathering.

How to cite: Hollingsworth, E., Sparkes, R., Self-Trail, J., Foster, G., and Inglis, G.: The oxidation of petrogenic organic carbon: a source of CO2 during transient warming events?, EGU General Assembly 2026, Vienna, Austria, 3–8 May 2026, EGU26-21846, https://doi.org/10.5194/egusphere-egu26-21846, 2026.

EGU26-22682 | ECS | Posters on site | CL1.1.1

Biogenic magnetite reveals marine deoxygenation during the Paleocene-Eocene Thermal Maximum 

Victor Piedrahita, Andrew Roberts, Eelco Rohling, David Heslop, Simone Galeotti, Fabio Florindo, Liu Yan, and Jinhua Li

Magnetotactic bacteria produces biogenic magnetite in marine environments with low oxygen (O2) concentrations. These conditions are typical of past global warming events, which has led to generation of biogenic magnetite records that have been interpreted as proxies for O2 variability. However, biogenic magnetite is still poorly studied and there are no records of this mineral in land-based sections. Here, we present a new biogenic magnetite record for the Palaeocene-Eocene Thermal Maximum interval of the land-based Contessa Road section (Gubbio, Italy). We quantified biogenic magnetite in the marine sedimentary rocks of Contessa Road with new geochemical, rock magnetic and electron microscopy data, which indicate that biogenic magnetite contents increase during the PETM body phase and reduce in coincidence with the PETM recovery. These patterns are similar to those of the stable carbon/oxygen isotopes, and reveal warming-induced deoxygenation in the Contessa Road setting in the PETM peak phase, and gradual marine reoxygenation during the PETM interval of carbon uptake. Our results are compared to a new model that confirms strong coupling between the carbon and oxygen cycles during the PETM.

How to cite: Piedrahita, V., Roberts, A., Rohling, E., Heslop, D., Galeotti, S., Florindo, F., Yan, L., and Li, J.: Biogenic magnetite reveals marine deoxygenation during the Paleocene-Eocene Thermal Maximum, EGU General Assembly 2026, Vienna, Austria, 3–8 May 2026, EGU26-22682, https://doi.org/10.5194/egusphere-egu26-22682, 2026.

EGU26-837 | ECS | Posters on site | CL1.2.3

Using stalagmite geochemistry to reconstruct paleoclimate in the Philippines during Heinrich Events 

Mira Hart, Street Senan, Jaren Yambing, Mónica Geraldes Vega, Bryce Belanger, Celia Kong-Johnson, Mart Geronia, Sharon Jalandoni, Carlos Primo David, Jessica Oster, David McGee, Daniel Ibarra, and Natasha Sekhon

The Indo-Pacific Warm Pool (IPWP), a region in the western Pacific Ocean known as the “heat engine of the globe”, is critical for modulating global climate patterns. Tropical island nations within the IPWP are especially well suited to study how the IPWP will respond to anthropogenic climate change. To understand the effects of future climate change within the IPWP, it is useful to look to past rapid climate change events, like Heinrich Events, which were periods of Northern Hemisphere freshwater forcing. Despite the critical role that paleoclimatic studies of Heinrich Events play in constraining the effects of future climate change, there are few terrestrial paleoclimate records from within the IPWP focusing on these events. 

Here, we use speleothems from the Puerto Princesa Underground River cave (PPUR) in Palawan, Philippines to reconstruct rainfall patterns during Heinrich Events. We present a combined record of δ18O, δ13C and trace elements (Mg/Ca, Sr/Ca, and Ba/Ca) for two stalagmites (GP-0 and GP-1) from PPUR’s Gaia Passage. GP-0 is 10.5 cm in length and grew between 41,855 ± 1099 to 31,637 ± 280 years B.P. (±2𝜎). GP-1 is 12.5 cm in length and grew between 40,849 ± 272 to 20,914 ± 206 years B.P. (±2𝜎). Taken together, our partially replicated record spans 41.9 to 20.9 ka and provides a robust dataset highlighting the effects of Heinrich Events 2, 3, and 4 on the southwestern Philippines and IPWP. Preliminary δ18O results show approximately 1.5 ‰ variability, suggesting fluctuations between wetter and drier intervals through time. In addition, statistically significant co-variation between Mg/Ca, δ18O, and δ13C indicates that prior calcite precipitation influences the GP-0 and GP-1 records. Additional statistical analyses between the geochemical results of GP-0 and GP-1 during coeval periods of growth will provide a strong understanding of the mechanisms driving rainfall in the Philippines during periods of rapid climate change. Regional comparisons to other archives (speleothems, marine core records) will help to elucidate the ocean-atmosphere feedbacks driving rainfall variability within the IPWP. A comparison to iTRACE climate model output across Heinrich Event 1 will broaden our understanding of the regional hydroclimate response to high latitude forcing. Furthermore, these results will inform much needed policy for water resource management and effective climate adaptation and resilience in the tropics. 

How to cite: Hart, M., Senan, S., Yambing, J., Geraldes Vega, M., Belanger, B., Kong-Johnson, C., Geronia, M., Jalandoni, S., David, C. P., Oster, J., McGee, D., Ibarra, D., and Sekhon, N.: Using stalagmite geochemistry to reconstruct paleoclimate in the Philippines during Heinrich Events, EGU General Assembly 2026, Vienna, Austria, 3–8 May 2026, EGU26-837, https://doi.org/10.5194/egusphere-egu26-837, 2026.

Recent studies have demonstrated the efficacy of high-precision ∆′17O analysis in carbonates, biogenic and abiotic origin, to deduce geological and environmental processes. The δ17O values can be influenced by processes such as kinetic fractionation during carbonate precipitation, which is associated with the hydroxylation of CO2, thereby making it an emerging proxy crucial for interpreting the oxygen isotopic ratio in carbonates and improving the accuracy of palaeoclimate reconstruction efforts (Bajnai et al., 2024). Δ′17O in cave carbonates helps determine the various factors influencing speleothem formation, including evaporation, condensation, and cave kinetics, which have been inadequately captured by the conventional dual-isotope (δ18O and δ16O) systematics. We follow the framework developed by (Huth et al., 2022) wherein interpretations of speleothem formation are done by examining trends of data spread through the distribution of triple oxygen isotopes in Δ′17O versus δ′18O space, with the conventional excess of 17O expressed as Δ′17O = δ′17O – λRL * δ′18O. By comparing triple oxygen isotopic compositions across various speleothem samples from different caves in North East India, this study seeks to improve our understanding of the control mechanisms on Δ17O variability and its utility in reconstructing past environmental conditions. The analysis of samples involved the acid digestion (in ~105 % H3PO4) of carbonate powders (~10 mg) followed by the catalytic CO2-O2 exchange reaction method as followed in the triple oxygen isotope analysis (Fosu et al., 2020) using in-house equipment with a quartz reactor containing Pt sponge (99.98% trace metal purity). The results yielded Δʹ17O in the range of -83 to -129 per meg.  When plotted in the Δ′17O versus δ′18O space, the data expands across three dominant controlling factors, majorly indicating an interplay of cave kinetics, Rayleigh distillation and cave temperature. This study proves that Δ′17O in cave carbonates act as a potential proxy for identifying fractionation processes.


References

  • Bajnai, D., et al. (2024). Correcting for vital effects in coral carbonate using triple oxygen isotopes. Geochemical Perspectives Letters, 31, 38–43.
  • Huth, T. E., at al. (2022). A framework for triple oxygen isotopes in speleothem paleoclimatology. Geochimica et Cosmochimica Acta, 319, 191–219.
  • Fosu, B. R., et al. (2020). Technical Note: Developments and Applications in Triple Oxygen Isotope Analysis of Carbonates. ACS Earth and Space Chemistry, 4(5), 702–710.

How to cite: Subba, R. and Ghosh, P.: Identifying Cave Carbonate Isotope Fractionation Mechanisms through Triple Oxygen Isotope Analysis, EGU General Assembly 2026, Vienna, Austria, 3–8 May 2026, EGU26-1039, https://doi.org/10.5194/egusphere-egu26-1039, 2026.

The karst of the Yorkshire Dales, situated in the Pennine hills of northern England, provides an under realised opportunity for paleo climate studies in mid latitudes. It was marginal to the Last Glacial Maximum British and Irish Ice Sheet.

The valley is surrounded by extensive moorland underlain by sandstone and mudstone dominated Millstone Grit Group strata. Underlying the Millstone Grit are strata of the cyclothemic Yoredale Group which include cavernous limestone units. The incision of the Upper Nidderdale valley has partially removed the clastic cover revealing limestone beds within the Yordale succession in three valley floor inliers.

By far the most extensive cave system is that beneath the main valley where the River Nidd in normal conditions sinks into the Limley inlier through impenetrable fissures upstream of Manchester Hole. The underground river from Manchester Hole flows into Goyden Pot, then onto New Goyden Pot to finally resurges at Nidd heads Risings forming a combined system with over 9 km of passages. The main stream passage and main chamber of Goyden Pot are floored by fallen blocks indicating collapse has played a major part in cave development. Some of the blocks consist entirely of speleothem and many show evidence of re-dissolution including incision and the development of scalloped surfaces cutting across the original depositional structure.

U-series dating of speleothem from the Goyden Pot cave system has shown that the incision of the upper reaches of the Nidd valley must have exposed the limestone strata of the Limley, Thrope and Lofthouse inliers prior to the Last Glacial Maximum and cave development was well underway by early MIS 3. The nature of the samples so far dated show the presence of significant detrital thorium seriously limiting the precision of the work.

The Canal Cave system is located in the Lofthouse inlier and consists of a narrow east-west orientated passage containing a 5 m climb with the upstream (western) end blocked by calcite. Down cutting of the River Nidd has intersected the route of the passage, thus draining the cave, which can be traced across the riverbed as a slot leading to the downstream continuation under the east bank. The sample was again contaminated by detrital thorium resulting in a considerable loss of precision as has been found elsewhere in the valley however a late Pleistocene date is indicated for the basal part of the sample (14136 +11.7 - 11.3 ka BP). This shows the cave was drained and thus valley of the River Nidd at Lofthouse had incised close to its present level by the very latest late Pleistocene.

How to cite: Murphy, P.: Incision, Instability and isolation-       attempting to constrain cave development in the most easterly of the Yorkshire Dales, northern England, UK, EGU General Assembly 2026, Vienna, Austria, 3–8 May 2026, EGU26-2599, https://doi.org/10.5194/egusphere-egu26-2599, 2026.

EGU26-3142 | ECS | Posters on site | CL1.2.3

Holocene temperature variability in the Black Sea region recorded by speleothem fluid inclusions from Sofular Cave in northern Türkiye 

Frederick Held, Hai Cheng, R. Lawrence Edwards, Timon Kipfer, Okan Tüysüz, Stéphane Affolter, and Dominik Fleitmann

Quantitative paleotemperature reconstructions of the Holocene are crucial for understanding the evolution of the climate system in response to various natural and anthropogenic forcings and shed further light on the so-called “Holocene temperature conundrum” (Liu et al., 2014). In the eastern Mediterranean – Black Sea (EMBS) region, records of Holocene temperature variations in continental interiors are predominately based on palynological reconstructions, specifically, pollen records from lake and peat sediments (e.g., Davis et al., 2003). However, vegetation was severely compromised by human activities since the mid-Holocene period and possibly even earlier (e.g., Fyfe et al., 2018) causing uncertainties regarding the general temperature development over the course of the Holocene. In contrast to these biological paleoclimate archives, quantitative paleotemperature reconstructions can be provided by speleothem fluid inclusions (e.g., Affolter et al., 2019; Bernal-Wormull et al., 2025). Speleothems from Sofular Cave in northern Türkiye are known to be highly sensitive to climatic shifts on orbital to decadal timescales (Fleitmann et al., 2009; Held et al., 2024, 2025), making them an excellent archive for recording Holocene low-amplitude climate change.

Temperature estimates based on fluid inclusion isotope analysis average 11.7 ± 2.6°C for the mid- to late-Holocene period, which is almost identical with the modern cave air temperature of 11.8 ± 0.2°C. Overall, temperatures decrease by approximately 1.5°C from the mid- to late-Holocene (~7 ka – 3 ka BP), most likely related to orbital forcing and altering atmospheric circulation patterns in the EMBS region. The Sofular speleothem record also captures distinct temperature minima associated with the 4.2 ka event and the Little Ice Age. Both time intervals are characterized by a cooling of around 1-3°C within decades, although they differ in hydrological conditions, exhibiting wetter conditions during the 4.2 ka event and a dry period during the Little Ice Age in the Black Sea region.


References

Affolter et al., 2019: Central Europe temperature constrained by speleothem fluid inclusion water isotopes over the past 14,000 years, Science Advances, 5.

Bernal-Wormull et al., 2025: Temperature variability in southern Europe over the past 16,500 years constrained by speleothem fluid inclusion water isotopes, Climate of the Past, 21, 1235-1261.

Davis et al., 2003: The temperature of Europe during the Holocene reconstructed from pollen data, Quaternary Science Reviews, 22, 1701-1716.

Fleitmann et al., 2009: Timing and climatic impact of Greenland interstadials recorded in stalagmites from northern Turkey, Geophysical Research Letters, 36 (19), L19707.

Fyfe et al., 2018: Trajectories of change in Mediterranean Holocene vegetation through classification of pollen data, Vegetation History and Archaeobotany, 27, 351-364.

Held et al., 2025: Hydrological variability in the Black Sea region during the last 670,000 years recorded in multi-proxy speleothem records from northern Türkiye, Quaternary Science Reviews, 367, 109534.

Held et al., 2024: Dansgaard-Oeschger cycles of the penultimate and last glacial period recorded in stalagmites from Türkiye, Nature communications, 15(1), 1183.

Liu et al., 2014: The Holocene temperature conundrum, Proceedings of the National Academy of Sciences, 111(34), E3501-E3505.

How to cite: Held, F., Cheng, H., Edwards, R. L., Kipfer, T., Tüysüz, O., Affolter, S., and Fleitmann, D.: Holocene temperature variability in the Black Sea region recorded by speleothem fluid inclusions from Sofular Cave in northern Türkiye, EGU General Assembly 2026, Vienna, Austria, 3–8 May 2026, EGU26-3142, https://doi.org/10.5194/egusphere-egu26-3142, 2026.

EGU26-3642 | ECS | Orals | CL1.2.3

Climatic controls on speleothem initial δ234U: evidence from Ejulve Cave over the last 260 ka 

Carlos Pérez-Mejías, Jian Wang, Youfeng Ning, Ana Moreno, Antonio Delgado-Huertas, R. Lawrence Edwards, Hai Cheng, and Heather M. Stoll

The use of δ234U as a paleoclimatic proxy in stalagmites has remained sporadic, despite uranium isotopes being routinely obtained through U-Th dating. Here, we investigate δ234U values in six stalagmites from Ejulve cave (northeastern Iberia) spanning the last 260 ka. Elevated δ234U values are attributed to selective leaching of 234U from damaged lattice sites and recoil-induced oxidation, with an additional accumulation of 234U recoils resulting from alpha-decay after growth hiatuses. This selective leaching mechanism weakens under conditions of enhanced bedrock dissolution, resulting in lower δ234U values.

The mechanisms controlling δ234U are primarily governed by infiltration frequency and the exposure of mineral surfaces to percolating solutions. However, the efficiency of these processes is strongly modulated by temperature, through its control on soil respiration, soil CO2 availability, and the intensity of bedrock dissolution. This interpretation is supported by the consistent long-term correlation between δ234U and sea surface temperatures from the Atlantic Iberian Margin, with lower δ234U values observed during warmer SST intervals. During stadials and glacial maxima, lower temperatures likely reduced vegetation cover and soil respiration rates, thereby decreasing soil CO2 concentrations and overall carbonate dissolution rates. Under such conditions, preferential leaching of 234U from bedrock surfaces is enhanced due to lower bulk rock dissolution. In addition, the high elevation of the study area and the occurrence of frequent winter frosts may have promoted repeated freeze–thaw cycles, inducing microfracturing and increasing the exposure of fresh mineral surfaces to selective leaching. 

Conversely, warmer conditions during interstadials and interglacials promoted higher soil respiration rates and soil CO2, accelerating bedrock dissolution and yielding low δ234U values. This coupling between bedrock dissolution intensity and δ234U is clearly expressed by its correlation with stalagmite growth rate, with important implications. The link between δ234U, bedrock dissolution, and the initial dripwater oversaturation indicates that δ234U can serve as a valuable complement to δ13C, as both proxies are strongly influenced by soil respiration and soil CO2, and thus reflect soil and vegetation productivity sensitive to both humidity and temperature. A further implication is that, unlike δ13C, uranium isotopes are not fractionated during prior calcite precipitation (PCP). Consequently, δ234U can be combined with PCP-sensitive proxies such as Mg/Ca or δ44Ca to disentangle PCP variations driven by changes in drip rate from those related to shifts in the initial saturation state of dripwater. Finally, we advocate for the broader use of δ234U as a paleoclimatic proxy in speleothem-based studies from other cave systems.

How to cite: Pérez-Mejías, C., Wang, J., Ning, Y., Moreno, A., Delgado-Huertas, A., Edwards, R. L., Cheng, H., and Stoll, H. M.: Climatic controls on speleothem initial δ234U: evidence from Ejulve Cave over the last 260 ka, EGU General Assembly 2026, Vienna, Austria, 3–8 May 2026, EGU26-3642, https://doi.org/10.5194/egusphere-egu26-3642, 2026.

EGU26-3993 | ECS | Posters on site | CL1.2.3

A LIBS hyperspectral imaging methodology for high-resolution element profiling of speleothems: applications within the LEAP project 

Christian Burlet, Sophie Verheyden, Koen Deforce, Possum Pincé, Soraya Bengattat, Mathieu Boudin, Giacomo Capuzzo, Philippe Crombé, Isabelle De Groote, Serge Delaby, Guy De Mulder, David Gillikin, Hannah Leonard, Elizabeth Olson, Christophe Snoeck, Hans Vandendriessche, Elliot Van Maldegem, and Marine Wojcieszak

Speleothems (stalagmites, stalactites, flowstones, …) are currently one of the best datable terrestrial archives valuably recording past environmental and climatic variability. Their geochemical composition reflects complex interactions between host rock, rainwater infiltration and soil processes dependent on climate (Fairchild & Baker, 2012). In particular, Mg, Sr and Ba are commonly linked to prior calcite precipitation related to water availability and therefore indirectly to rainwater amount (Fairchild et al., 2000), while other elements such as P or S, may reflect organic matter cycling or anthropogenic and marine aerosol inputs (Borsato et al., 2007). Despite their importance, high-resolution spatial profiling of trace elements in speleothems remain analytically demanding, often requiring destructive sample preparation and time-consuming laboratory workflows.

Within the framework of the LEAP project (Learning from the Past - https://www.leap-belgium.be/) funded by BELSPO, we developed and implemented a Laser-Induced Breakdown Spectroscopy (LIBS) hyperspectral imaging methodology to obtain rapid, minimally destructive trace-element profiles along speleothem growth axes. The approach combines automated raster scanning with synchronized multi-spectrometer acquisition, producing two-dimensional LIBS spectral images over scan widths of 15–20 mm at 100 µm spatial resolution. Elemental ratio maps (Mg/Ca, Sr/Ca, Ba/Ca) are generated from the hyperspectral data cube and converted into one-dimensional profiles by buffered averaging along growth-parallel transects. A robust filtering and masking strategy based on Ca signal thresholds and calculated plasma parameters allows efficient exclusion of spectra affected by surface defects, detrital inclusions or existing sampling holes.

The method was first validated through comparison with LA-ICP-MS elemental mapping on a reference speleothem section, showing consistent relative variations and stratigraphic coherence in Mg/Ca, Sr/Ca and Ba/Ca profiles. Following validation, multiple trace-element profiles were extracted from speleothems from Hotton, Père Noël and Remouchamps caves (Belgium). In the Père Noël cave for example, the approach enabled the extraction of a continuous >1 m long profile at 0.1 mm spatial resolution, demonstrating the capability of LIBS hyperspectral imaging to generate high-resolution geochemical records over large stratigraphic distances.

Applied to a flood-impacted speleothem (calcite floor) from the Hotton Cave, the LIBS-derived profiles also revealed distinct elemental profiles associated with thin detrital layers incorporated within the calcite. This allows a more precise and objective assessment of past extreme flooding events at that location that can be compared to population migration information and changes in funerary practices. This contributes to the investigation of the link between climatic and environmental changes and human behaviour in the LEAP project.


References:

Borsato, A., Frisia, S., Fairchild, I.J.,, Somogyi, A.,, and Susini,J. 2007. Trace Element Distribution in Annual Stalagmite Laminae Mapped by Micrometer-Resolution X-Ray Fluorescence: Implications for Incorporation of Environmentally Significant Species. Geochimica et Cosmochimica Acta 71 (6): 1494–1512.

Fairchild, I. J., & Baker, A. (2012). Speleothem science: From process to past environments. Wiley-Blackwell.

Fairchild, I. J., Borsato, A., Tooth, A. F., Frisia, S., Hawkesworth, C. J., Huang, Y., McDermott, F., & Spiro, B. (2000). Controls on trace element (Sr–Mg) compositions of carbonate cave waters: Implications for speleothem climatic records. Chemical Geology, 166(3–4), 255–269.

How to cite: Burlet, C., Verheyden, S., Deforce, K., Pincé, P., Bengattat, S., Boudin, M., Capuzzo, G., Crombé, P., De Groote, I., Delaby, S., De Mulder, G., Gillikin, D., Leonard, H., Olson, E., Snoeck, C., Vandendriessche, H., Van Maldegem, E., and Wojcieszak, M.: A LIBS hyperspectral imaging methodology for high-resolution element profiling of speleothems: applications within the LEAP project, EGU General Assembly 2026, Vienna, Austria, 3–8 May 2026, EGU26-3993, https://doi.org/10.5194/egusphere-egu26-3993, 2026.

EGU26-4574 | Posters on site | CL1.2.3

Börtlüce Cave: A Natural Archive Linking Earthquakes, Volcanism, Climate Variability, and Human History in Western Türkiye 

Mesut Kolbüken, Ezgi Unal Imer, Chuan-Chou Shen, Chun-Yuan Huang, and Hsun-Ming Hu

Börtlüce Cave (Manisa) in western Türkiye has a unique geographical location, which is a transition zone between tropical and polar atmospheric circulation systems, increasing its climate sensibility, and is a tectonically active region generating significant earthquakes, and lastly close to Kula Volcanic Field with remarkably well-exposed young volcanic structures. The cave is surrounded by significant archeological settlements, such as the ancient city of Sardis in Salihli, the capital of the Lydian Kingdom in the Bronze Age, where fossil footprints in volcanic ashes dated back to 4700 years ago (Ulusoy et al., 2019). Potential speleothem records from this cave therefore provide a valuable opportunity to explore paleoenvironmental changes in detail and to better understand how human populations responded to such changes.

Employing state-of-the-art methods, including U-Th dating, stable isotope (δ18O and δ13C), and trace element analyses, enables high-resolution and reliable reconstructions of hydroclimate variability, environmental evolution, and the effects of volcanic activity and earthquake-induced processes on cave environments.

Here we present initial records from two Börtlüce Cave stalagmites, reflecting changes in the stalagmite growth such as abrupt surface steps, growth axis deviations, and growth interruption. First results indicate that the occurrence of pronounced hiatuses in the underlying layers in stalagmites, accompanied by changes in fabric/stratigraphy and growth orientation, are consistent with seismic disturbance recurrences affecting drip hydrology rather than climatic forcing over the mid-late Holocene.

In addition to earthquake-induced changes, the isotope records from both stalagmites display similar isotopic patterns throughout the mid-late Holocene, indicating negligible kinetic fractionation effects in the cave. The δ18O values range between −7.4 and −4.2‰, while δ13C values vary from −9.3 to −3.7‰ along the growth axes of the stalagmites. Between 6 and 4 ka, both δ18O and δ13C values are depleted, reflecting wetter climatic conditions and enhanced soil biological activity.  After ~4 ka and until ~2 ka, isotope values become progressively more enriched in both stalagmites, indicating a transition to drier climatic conditions accompanied by reduced soil activity. Two distinct dry intervals are recorded, corresponding to the 4.2 ka Bond event and a second event at approximately 3.2 ka. These intervals likely represent significant hydroclimatic deteriorations that may have impacted regional human communities. Understanding their responses will provide valuable information for assessing current and future climatic hazards such as droughts.

Ongoing analyses of both stalagmites, together with expanded sampling of additional stalagmites from Börtlüce Cave, aim to produce a comprehensive reconstruction of paleoenvironmental changes related to climate dynamics, volcanic influences, and seismic activity, and to evaluate their combined impacts on the archaeological record.

References

Ulusoy İ., Sarıkaya M.A., Schmitt A. K., Şen E., Danisik M., Gümüş E., 2019. Volcanic eruption eye-witnessed and recorded by prehistoric humans. Quaternary Science Reviews, 212, 187-198.

Acknowledgement

This research was granted by the National Science and Technology Council, Taiwan, ROC (111-2116-M-002-022-MY3;114-2116-M-002-016-MY3), Academia Sinica (AS-TP-113-L04), and National Taiwan University Core Consortiums Project (113L891902). The authors are grateful to Kamil Altıparmak, Ali Karataş, Tuğberk Yetiş, Yiğit Karakuzu, Faruk Bilmez, and Kula Municipality for their assistance during the fieldwork. The authors thank Mehmet Oruç Baykara for his support.

How to cite: Kolbüken, M., Unal Imer, E., Shen, C.-C., Huang, C.-Y., and Hu, H.-M.: Börtlüce Cave: A Natural Archive Linking Earthquakes, Volcanism, Climate Variability, and Human History in Western Türkiye, EGU General Assembly 2026, Vienna, Austria, 3–8 May 2026, EGU26-4574, https://doi.org/10.5194/egusphere-egu26-4574, 2026.

EGU26-4828 | ECS | Posters on site | CL1.2.3

Influence of fluid Mg/Ca ratios on speleothem petrography – Insights from cave analogue experiments 

Pascal Hambsch, Sylvia Riechelmann, Daniel Herwartz, and Adrian Immenhauser

Speleothems are recognized as reliable archives of past continental climate dynamics. Depending on the research focus, both geochemical and petrographic proxies are employed. While previous studies have explored the petrographic features of speleothems - particularly mineralogy and crystal fabric development - the relationship between drip water geochemistry and the petrographic attributes of speleothems remains underexplored. Research indicates that several physicochemical parameters, such as drip rate, pH, supersaturation, growth rate, fluid Mg/Ca ratio, and organic matter content, influence the mineralogy and crystal morphology of cave carbonates. Among these, the Mg/Ca ratio of drip water is the most influential, directly affecting crystal morphology and serving as a proxy for prior calcite precipitation (PCP). Cave environments are subject to various factors that can alter drip water Mg/Ca ratios. To disentangle these effects, a series of cave analogue experiments were conducted in a climate chamber set to 15 °C and 70 % humidity under atmospheric CO2 conditions. Each solution was purified of organic material and maintained at a constant pH of 7.9 with a steady drip rate of 98 µL/min. Roughened watch glasses provided a crystallization surface for the carbonate precipitates. The fluid Mg/Ca ratio was the only variable, adjusted between experiments (0.5, 0.375, 0.25, 0.125). Each Mg/Ca ratio was tested both with and without the influence of PCP, with experiments lasting 90 days. Throughout this period, temperature, humidity, CO2 level, drip rate, conductivity, pH, and outflow element concentrations were continuously monitored. Carbonate precipitates were analyzed using SEM, EBSD, and EMPA. Initial results suggest that calcite crystal morphology varies with changes in fluid Mg/Ca ratio, and aragonite precipitates only form in experiments influenced by PCP at the same initial Mg/Ca ratio as non-PCP experiments.

How to cite: Hambsch, P., Riechelmann, S., Herwartz, D., and Immenhauser, A.: Influence of fluid Mg/Ca ratios on speleothem petrography – Insights from cave analogue experiments, EGU General Assembly 2026, Vienna, Austria, 3–8 May 2026, EGU26-4828, https://doi.org/10.5194/egusphere-egu26-4828, 2026.

EGU26-4830 | ECS | Posters on site | CL1.2.3

Kinetic carbon isotope effects during calcite precipitation: role of water–air exchange geometry and precipitation rate 

Serena Pietri-Orsini, Marina Gillon, Christophe Emblanch, and Florent Barbecot

Stable carbon and oxygen isotopes in calcite are widely used to reconstruct environmental and hydrological conditions, but kinetic isotope effects related to CO₂ degassing and carbonate precipitation are still poorly quantified [1]

In particular, the role of water–air exchange geometry and water height on the δ¹³C (and δ¹⁸O) of precipitated calcite remains difficult to isolate from that of other controls in natural systems [2].

Here we present a series of laboratory precipitation experiments to establish an empirical relationship between air–water exchange geometry surface and ¹³C fractionation between calcite and Dissolved Inorganic Carbon, providing a framework to quantify how changes in exchange surface area and water height modulate δ¹³C signatures.

CaCO₃ precipitates from the same Ca2+–HCO₃- rich bottled water in containers with two exchange geometries: low vs high air–water exchange, expressed as S/h (air–water surface area divided by water height), with the low-exchange configuration having S = 130 cm² and h = 11.5 cm and the high-exchange configuration having S = 273 cm² and h = 5.5 cm. All experiments start from identical temperature, volume and initial chemistry. Conductivity, pH and temperature are measured every 24 h. Major ions concentrations, δ¹³C of DIC and δ¹³C of precipitated calcite are measured each day. Precipitation rates are quantified from the temporal decrease in dissolved Ca²⁺ concentration. They are higher when air–water exchanges increase: 1.0 × 10⁻³ mol L⁻¹ d⁻¹ for low air–water exchanges vs 1.6 × 10⁻³ mol L⁻¹ d⁻¹ for high air–water exchanges during the first day of the experiment. δ¹³C of calcite is higher for high air-water exchanges than for low air-water exchanges at a same time step (e.g., at second day: −7.1 ±0.2‰ vs −9.2 ±0.3‰).

δ¹³C of DIC increases by +8.5‰ (mean) for high air–water exchanges compared to +5.7‰ (mean) for low air–water exchanges over 4 days. However, the evolution δ¹³C of DIC with DIC concentrations appears to depend little on the air–water exchanges and follows an apparent Rayleigh-type trend.

The calcite–DIC enrichment factor ε becomes more negative with increasing precipitation rate, indicating stronger kinetic fractionation under conditions favouring rapid CO₂ degassing, consistent with the rate dependent trends observed in cave analogue precipitation experiment [3]. At low precipitation rates 4.3 × 10⁻⁴ mol L⁻¹ d⁻¹ , ε is close to equilibrium near to 0.2‰ compared to the equilibrium value of 0.5–0.8‰ at 17–23°C [4], whereas at higher precipitation rates 1.87 × 10⁻³ mol L⁻¹ d⁻¹, ε shows a much larger deviation from equilibrium, reaching −2.8‰.

These experiments provide quantitative data on isotope effects linked to exchange geometry and precipitation kinetics, that could be used to interpretations of δ¹³C signatures in natural carbonate deposits such as speleothems and tufas.

[1]  Dreybrodt, W. & Fohlmeister, J. (2022)  doi:10.1016/j.chemgeo.2021.120676

[2] Fairchild et al. (2006)  doi:10.1016/j.earscirev.2005.08.003

[3] Hansen et al. (2019) doi:10.1016/j.chemgeo.2018.12.012

[4] Salomons, W. & Mook, W. G. (1986) doi:10.1016/B978-0-444-42225-5.50011-5

How to cite: Pietri-Orsini, S., Gillon, M., Emblanch, C., and Barbecot, F.: Kinetic carbon isotope effects during calcite precipitation: role of water–air exchange geometry and precipitation rate, EGU General Assembly 2026, Vienna, Austria, 3–8 May 2026, EGU26-4830, https://doi.org/10.5194/egusphere-egu26-4830, 2026.

EGU26-4850 | ECS | Posters on site | CL1.2.3

Daily rainfall δ18O suggests Southern Thailand speleothem 18O records controlled by extreme winter monsoon events 

George Kontsevich, Helmut Duerrast, Mao-Chang Liang, Akkaneewut Jirapinyakul, Sakonvan Chawchai, Annapureddy Phanindra, Harsh Oza, and Ludvig Lowemark

For speleothems found in the Asian Monsoon region, variability in oxygen isotopes (18O) over time is often taken as an indicator of changes in monsoon intensity. In regions affected by both the summer and winter monsoons the picture is more complex, as each system may have its own mechanism for driving changes in rain 18O. To try to tease out the possible drivers behind changes in 18O, published speleothem records from a region of Southern Thailand are compared to over a decade of daily rainfall 18O measurements. When comparing winter and summer monsoon isotope averages, the seasonal difference is found to be too small to explain the changes seen in speleothems over the past several thousand years. This suggests a simple change in monsoon ratio is unlikely to be a direct driver. However, there is a strong indication that periodic intense winter monsoon pulses show a distinct isotopic signature. This signature is sufficient to explain past variability, and by extension suggests that speleothem 18O records from the locality mostly reflect changes in the winter monsoon system. We explore possible mechanisms driving these 18O-light pulses and what they suggest about the past climate configuration in the region.

How to cite: Kontsevich, G., Duerrast, H., Liang, M.-C., Jirapinyakul, A., Chawchai, S., Phanindra, A., Oza, H., and Lowemark, L.: Daily rainfall δ18O suggests Southern Thailand speleothem 18O records controlled by extreme winter monsoon events, EGU General Assembly 2026, Vienna, Austria, 3–8 May 2026, EGU26-4850, https://doi.org/10.5194/egusphere-egu26-4850, 2026.

EGU26-5348 | Posters on site | CL1.2.3

Magnesium isotope time-series analyses of dolostone cave dripwater and speleothems: Proxy calibration and application 

Sylvia Riechelmann, Andrea Schröder-Ritzrau, Jasper A. Wassenburg, and Adrian Immenhauser

Speleothems are an important archive for reconstructing past climate variability. The Magnesium isotope proxy tested so far in limestone-hosted caves provides the possibility of reconstructing climate conditions from changes in the silicate-to-carbonate weathering ratio. Other caves, however, are situated in dolostone host rock. Consequently, the Mg content of the host rock is much higher than that of limestone. Dripwater monitoring in a set of dolostone-dominated caves in Germany and Morocco, as well as the collection of soil (silicate minerals), host rock (carbonate), and speleothem samples, aims to apply the Mg isotope proxy in dolostone-hosted caves. The time-series analyses of the Mg isotope composition of dripwaters revealed, for most dripwater sites, significant variations in δ26Mg values, which can be related to changes in the silicate-to-carbonate weathering ratio. Silicate weathering is enhanced under dry, warm conditions, whereas cold, wet conditions favour carbonate weathering. Due to significant differences in the Mg isotope composition of silicate (soil) and carbonate (host rock) minerals, changes in the weathering regime are detectable in drip-water Mg isotope ratios in both climate regions. In German caves, where changes in temperature are more pronounced than changes in rainfall amount, the weathering ratio is driven by temperature variations. In Morocco, however, both temperature and rainfall amount complement each other and drive changes in the silicate-to-carbonate weathering ratio. Furthermore, the different transfer times at each drip site ranged from a few months to at least a year. Some drip water sites show no variation in Mg isotope composition. In these cases, the signal of the weathering ratio is strongly buffered by longer water transfer times/residence times and mixing of waters in the aquifer. Although possible, no dependence of Mg isotope variations in the dripwaters on prior calcite precipitation was observed. Corresponding speleothems from the monitored dripwater sites exhibit varying Mg isotope compositions of calcite and aragonite. There is no overprint of other factors during carbonate precipitation; thus, these variations are solely due to changes in the silicate-to-carbonate weathering ratio and, consequently, changes in temperature and rainfall amount. Furthermore, observations on the Mg isotope fractionation factor of aragonite-dominated samples revealed a smaller Δ26Mg than for calcite speleothem samples. Generally, the Mg isotope proxy is a valuable tool for reconstructing past climate conditions in both limestone- and dolostone-dominated caves.

How to cite: Riechelmann, S., Schröder-Ritzrau, A., Wassenburg, J. A., and Immenhauser, A.: Magnesium isotope time-series analyses of dolostone cave dripwater and speleothems: Proxy calibration and application, EGU General Assembly 2026, Vienna, Austria, 3–8 May 2026, EGU26-5348, https://doi.org/10.5194/egusphere-egu26-5348, 2026.

EGU26-7468 | ECS | Posters on site | CL1.2.3

Implementing a cave and climate monitoring system across the Swabian Alb, southwestern Germany 

Desirée Lo Triglia, Valdir Novello, Markus Maisch, Armelle Ballian, and Kira Rehfeld

Monitoring studies of cave systems are essential for understanding the hydrological and microclimatic processes that control the isotopic signatures preserved in speleothems and for improving the interpretation of paleoclimate records. Despite increasing efforts in recent years, many aspects of karst system responses to climate variability and change remain poorly constrained.

In 2023, a comprehensive cave and climate monitoring network was established across the Swabian Alb (N 48°30'60''; E 9°24'15''), a karstic region in southwestern Germany, covering both the Neckar and Danube catchments. Four caves were chosen for a monitoring infrastructure based on their location and accessibility: Bärenhöhle, Nebelhöhle, Schertelshöhle, and Hohle Fels. Continuous measurements of relative humidity, temperature and water dripping rates were conducted inside the caves. Measurements of cave air CO2 concentrations and dripping water samples were taken during periodic site visits. Dripping and spring water samples were analyzed for triple oxygen (δ18O and δ17O) and hydrogen (δD). External climate monitoring included temperature and precipitation measurements, as well as the isotopic analysis of rainfall and the calculation of δ17O-excess and δD-excess from rainwater collected at multiple locations on and around the Swabian Alb.

Preliminary results from the first year of monitoring indicate: (1) seasonal fluctuations in the concentration of CO2 in cave air due to winter ventilation and cave-air stagnation in summer, indicative of buoyancy-driven airflow between the surface and the cave; (2) a uniform air moisture source feeding the rainfall over the Swabian Alb; (3) caves and springs appear to be decoupled from short-term weather signals, implying integration over longer-term climatic conditions; and (4) the isotopic composition of rainwater seems to be related to the rainfall amount and temperature at the monitoring sites. By combining multiple-site and cave monitoring at different elevations and two basins of the Swabian Alb, this study provides new insights into the environmental factors controlling the isotopic signal and airflow dynamics in caves. These findings are essential for improving the interpretation of speleothem-based climate proxies and the sensitivity of karst systems to ongoing future climate change.

How to cite: Lo Triglia, D., Novello, V., Maisch, M., Ballian, A., and Rehfeld, K.: Implementing a cave and climate monitoring system across the Swabian Alb, southwestern Germany, EGU General Assembly 2026, Vienna, Austria, 3–8 May 2026, EGU26-7468, https://doi.org/10.5194/egusphere-egu26-7468, 2026.

EGU26-8808 | ECS | Orals | CL1.2.3

A speleothem mineralogy perspective on interannual wet-dry cycles in Botswana during the Late Holocene 

Anupam Samanta, Nitesh Sinha, Jasper A. Wassenburg, Andrea Borsato, Silvia Frisia, Fulvio Franchi, Franziska Lechleitner, Yuna Oh, Yun Seok Yang, Hai Cheng, Laurent Bruxelles, Andy E. Moore, and Axel Timmermann

Interannual rainfall variability in the Kalahari Desert is strongly controlled by the El Niño-Southern Oscillation (ENSO). Paleo-reconstructions of hydroclimate (wet-dry) cycles in this area may therefore provide insights into the past behaviour of ENSO. Here, we present new petrographic and geochemical data of Late Holocene speleothem samples from Gcwihaba Cave, Botswana. The cave system, which is home (colony) to large numbers of bats, formed in highly karstified metamorphic dolomite. The studied speleothems consist of calcite and aragonite laminae at micrometer to millimetre-scales. High-resolution mineralogical, stable carbon (δ13C) and oxygen (δ18O) isotope ratios, and trace elemental concentrations, combined with chronological constraints (14C and U-Th data) and layer counting under the optical microscope, suggest that calcite/aragonite duplets record annual to interannual fluctuations in hydroclimate. Wet conditions favor calcite formation, whereas aragonite forms preferentially during the dry period. Speleothem lamina thickness is closely linked to the annual infiltration, which is controlled by seasonal aquifer recharge cycles. High-resolution laser-ablation trace-element (TE) analysis and isotope data support the petrographic observations. Calcite carbonate farming experiments in the cave revealed that aragonite and calcite are in distinct layers and well-preserved. There is no evidence in modern precipitates of dissolution-reprecipitation processes that lead to the transformation of aragonite to calcite. Of all TE, Y and La appear to be the best rainfall proxies, reflecting their transport pathway from the soil horizon at the top of the cave to the speleothem via drip water. Synchronous occurrences of higher Y and La with calcite phases suggest wet conditions, i.e., more rainfall. In contrast, aragonite layers exhibit higher concentrations of Sr, Ba, and U, and increased fluorescence due to the presence of organic matter, which possibly originates from bat guano deposits. However, this proposition requires further investigation. Aragonite formation can be linked to drier conditions in the cave, which are accompanied by an increase in the drip water Mg/Ca ratio. Drier conditions also increase the likelihood of preserving air-borne dust (guano particle) deposition rich in phosphorus from the cave interior within speleothem layers. Our results highlight that mixed calcite-aragonite speleothems provide a robust archive of high-frequency (annual to interannual) hydroclimate variability in southern Africa.

How to cite: Samanta, A., Sinha, N., Wassenburg, J. A., Borsato, A., Frisia, S., Franchi, F., Lechleitner, F., Oh, Y., Yang, Y. S., Cheng, H., Bruxelles, L., Moore, A. E., and Timmermann, A.: A speleothem mineralogy perspective on interannual wet-dry cycles in Botswana during the Late Holocene, EGU General Assembly 2026, Vienna, Austria, 3–8 May 2026, EGU26-8808, https://doi.org/10.5194/egusphere-egu26-8808, 2026.

EGU26-10137 | ECS | Orals | CL1.2.3

North Atlantic drivers of Southern Hemisphere rainfall: A high-resolution speleothem record from Waipuna Cave, New Zealand. 

Mathilde Dubois, Russell Drysdale, John Hellstrom, Agathe Lise-Pronovost, Bethany Fox, Sebastian Hoepker, and Adam Hartland

During the Last Glacial Period, Earth was characterised by rapid millennial-scale climate oscillations, known as ‘Dansgaard–Oeschger’ (D-O) events, associated with large-scale reorganisations of oceanic and atmospheric circulation. While such variability is well documented in Northern Hemisphere high-latitude archives, such as Greenland ice cores, its expression remains less constrained in the Southern Hemisphere mid-latitude, raising the question of whether these climate disturbances, initiated in the North Atlantic Ocean, influenced rainfall patterns thousands of kilometres away in the Southern Hemisphere’s Southwest Pacific.

Here we present a new high-resolution speleothem composite record from Waipuna Cave (North Island, New Zealand), integrating two cores from the same flowstone aligned using a dynamic time warping approach. The composite spans 36.2–11.1 thousand years before present, and is constrained by 61 U–Th ages, yielding a mean age uncertainty of ~250 years (2σ). Combined stable isotope (δ18O, δ¹³C) and trace element (Mg/Ca) profiles provide a multiproxy record of hydroclimatic variability at  Southern Hemisphere mid-latitudes.

The Waipuna record reveals rapid millennial-scale variability that resembles Dansgaard–Oeschger (DO) events. Periods of reduced regional water balance (precipitation minus evapotranspiration) on New Zealand’s northwest coast are consistent with large-scale atmospheric and oceanic reorganizations involving a shift of the rainfall belt, or the Intertropical Convergence Zone (ITCZ), and modulation of the Southern Westerly Winds. Comparison with well-dated, monsoon-sensitive speleothem records from equatorial to subtropical latitudes suggests that the Waipuna hydroclimate variability forms part of a broader pattern of global atmospheric reorganisation.

These results highlight the sensitivity of the Southwest Pacific mid-latitude hydroclimate to the large-scale atmospheric circulation changes during the last glacial period and emphasize the importance of the Southern Hemisphere records for constraining the understanding of the interhemispheric climate coupling. In the context of ongoing climate change, such past analogues may inform future shifts in subtropical rainfall distribution and extreme precipitation events.

Keywords: Last Glacial Period, Speleothem, New Zealand, Interhemispheric teleconnections.

How to cite: Dubois, M., Drysdale, R., Hellstrom, J., Lise-Pronovost, A., Fox, B., Hoepker, S., and Hartland, A.: North Atlantic drivers of Southern Hemisphere rainfall: A high-resolution speleothem record from Waipuna Cave, New Zealand., EGU General Assembly 2026, Vienna, Austria, 3–8 May 2026, EGU26-10137, https://doi.org/10.5194/egusphere-egu26-10137, 2026.

EGU26-10573 | Posters on site | CL1.2.3

Exploring sub-annual to decadal hydroclimate variability and tropical cyclone activity on the northeastern Yucatán peninsula  

Sophie Warken, Antonia Wantzen, Aaron Mielke, Nils Schorndorf, Fernanda Lases Hernández, Jerónimo Avíles Olguín, and Norbert Frank

Disentangling dominant patterns and underlying drivers of hydroclimate variability and tropical cyclone activity in the tropical Americas remains a challenge of paleoclimatology. To explore the potential of speleothem trace metal abundances to close this gap, we study a fast-growing stalagmite from Xplor Cave from Mexico's Yucatán Peninsula. High precision 230Th/U dating with average uncertainties of 5-6 years combined with annual layer counting confine XPL04’s growth between c. 1590 to c. 1970. Due to exceptionally high growth rates between 1 and 4mm per year, the record allows to assess sub-annually resolved proxy variations from post-Colombian times into the 20th century.

Laser Ablation ICP-MS trace metal data from speleothem XPL04 indicate pronounced patterns in hydroclimate sensitive elements. For example, increasing Mg/Ca values suggest a significant drying trend along with a rise in hydroclimate variability during the 20th century. Furthermore, multiannual transition metal changes covary with long-term tropical cyclone activity. Superimposed on that pattern, Cu concentrations and Cu/Ni ratios peak during major hurricane years, with the most pronounced speleothem responses corresponding with the largest events that made landfall at the cave site (the 1933 ‘Tampico’ Hurricane and a 1903 unnamed event).

This preliminary evaluation encourages in-depth analyses of sub-annual to decadal speleothem trace element variations. Future work will include the integration of elemental and isotopic proxies in order to construct a precisely dated multi-proxy record allowing to assess regional hydroclimatic changes on unprecedented timescales.

How to cite: Warken, S., Wantzen, A., Mielke, A., Schorndorf, N., Lases Hernández, F., Avíles Olguín, J., and Frank, N.: Exploring sub-annual to decadal hydroclimate variability and tropical cyclone activity on the northeastern Yucatán peninsula , EGU General Assembly 2026, Vienna, Austria, 3–8 May 2026, EGU26-10573, https://doi.org/10.5194/egusphere-egu26-10573, 2026.

EGU26-10789 | ECS | Posters on site | CL1.2.3

Assessing millennial to orbital-scale controls of Caribbean hydroclimate variability via data-model-comparisons 

Francisca Lövenich, Aaron Mielke, Christoph Spötl, Martin Werner, Ángel Acosta-Colón, Isabel Rivera Collazo, Amos Winter, and Sophie Warken

Tropical rainfall is conventionally linked to orbital-scale insolation variability, with higher summer insolation corresponding to stronger precipitation. Yet speleothem d18O records from the greater Mesoamerican region show opposing behaviour (Lucia et al. (2024), Li et al. (2025)), hinting at other forcing mechanisms. Here, we present a precisely dated speleothem record from Puerto Rico covering the past 234,000 years, which is compared to isotope-enabled climate model time slice simulations. By combining our new data with speleothem data from northern Brazil we create climate indeces to assess local ITCZ position and width. The data-model comparison offers the opportunity for an orbital time scale analysis, where insolation is considered for different months and latitudes. Preliminary analyses indicate that the early-rainy season might play a bigger role than previously assumed. Furthermore, millennial-scale variability strongly characterises the proxy record, which cannot be attributed to orbital forcing, but suggests a persistent sensitivity to AMOC strength (compare Warken et al. (2020)). Future work will assess, why Caribbean hydroclimate appears to be not a classical monsoon system throughout MIS 7 to 1 but rather the result of multiple factors superimposing on different timescales.


References:

Lucia et al. (2024). Atlantic Ocean thermal forcing of Central American rainfall over 140,000 years. Nature communications. DOI: 10.1038/s41467-024-54856-0

Li et al. (2025). North Atlantic Subtropical High forcing of Atlantic Warm Pool hydroclimate variability on millennial to orbital timescales. Science Advances. DOI: 10.1126/sciadv.aea5042

Warken et al. (2020). Persistent Link Between Caribbean Precipitation and Atlantic Ocean Circulation During the Last Glacial Revealed by a Speleothem Record From Puerto Rico. Paleoceanography and Paleoclimatology. DOI: 10.1029/2020PA003944

How to cite: Lövenich, F., Mielke, A., Spötl, C., Werner, M., Acosta-Colón, Á., Rivera Collazo, I., Winter, A., and Warken, S.: Assessing millennial to orbital-scale controls of Caribbean hydroclimate variability via data-model-comparisons, EGU General Assembly 2026, Vienna, Austria, 3–8 May 2026, EGU26-10789, https://doi.org/10.5194/egusphere-egu26-10789, 2026.

EGU26-10810 | Orals | CL1.2.3

A 12.7–5.7 ka multi-proxy stalagmite record from Cueva Fantasma (Atapuerca, N Spain): inland Iberian hydroclimate variability with combustion-derived laminae during the 8.2 ka interval. 

Altug Hasözbek, Javier Martín-Chivelet, Ana Isabel Ortega, Josep Parés Casanova, Josep Vallverdú Poch, Marcos Terradillo Bernal, Eric Font, Joana Ribeiro, Fernando Jiménez Barredo, Ismail Isintek, and Silviu Constantin

We present a multi-proxy record of a speleothem from Cueva Fantasma (Atapuerca, N Spain) spanning 12.7–5.7 ka that documents inland Iberian hydroclimate variability and a local expression of the 8.2 ka event.  U–Th chronology indicates continuous deposition with accelerated accretion (higher drip rates) between ~8.5 and 7.7 ka. From base to top, three morphological stratigraphic parts were defined: (i) transparent columnar calcite with low detrital input; (ii) a laminated interval of black, organic-rich calcite laminae with high detrital input; and (iii) an upper part reflecting post 8.2 ka event stabilization characterized by moderate growth, marked absence of black laminae, and lower detrital imprint. Fluorescence and oil-immersion petrography highlight that black carbon occurs as films and clustered particulates that follow the growth-lamina geometry, with films preferentially recorded or preserved along micro-columns. SEM–EDX identifies combustion-derived particulates comprising soot-like carbon films and ash-rich detritus within the calcite crystals and/or detritus matrix. Trace-element profiles exhibit co-enrichment especially in Mn and Th across 8.5–7.7 ka, consistent with enhanced soil flushing and drip-system reorganization. High-resolution δ¹⁸O and δ¹³C data indicate wetter, vegetation-active conditions prior to ~8.5 ka, a hydrological pulse during ~8.5–7.7 ka expressed by increased variability and δ¹³C–δ¹⁸O co-variability, and moderation thereafter. Thus, the 8.2 ka interval is captured not by a hiatus but by a facies and geochemical shift under wetter, more seasonal/flashy recharge, characterized by black laminae containing soot-like films and ash-rich detritus, Mn–Th peaks, and slightly accelerated growth. The combustion-derived particulates, soot-like films and ash-rich micrite/detritus, occur as closely spaced clusters which supports multiple discrete in-cave fire episodes. This interpretation is distinct from external wildfire fallout and is based on the tight lamina-scale coupling, and coeval hydrological proxies. This record provides the first speleothem evidence from Atapuerca of the 8.2 ka climatic anomaly embedded within regional Holocene hydroclimate variability, alongside independent evidence for repeated in-cave combustion during that interval.

How to cite: Hasözbek, A., Martín-Chivelet, J., Isabel Ortega, A., Parés Casanova, J., Vallverdú Poch, J., Terradillo Bernal, M., Font, E., Ribeiro, J., Jiménez Barredo, F., Isintek, I., and Constantin, S.: A 12.7–5.7 ka multi-proxy stalagmite record from Cueva Fantasma (Atapuerca, N Spain): inland Iberian hydroclimate variability with combustion-derived laminae during the 8.2 ka interval., EGU General Assembly 2026, Vienna, Austria, 3–8 May 2026, EGU26-10810, https://doi.org/10.5194/egusphere-egu26-10810, 2026.

EGU26-11197 | ECS | Posters on site | CL1.2.3

Tropical Climate Variability During Interglacials of the Last 300,000 Years: Evaluation of High-Resolution LA-ICP-MS Trace-Element Data 

Aaron Mielke, Francisca Lövenich, Noreen Garcia, Christopher Charles, Frank Keppler, Isabel Rivera Collazo, Ángel A. Acosta-Colón, Amos Winter, Christoph Spötl, and Sophie Warken

Past interglacial periods with climatic conditions comparable to those of today, but shaped by different orbital configurations and greenhouse gas concentrations, provide valuable insights into natural climate variability. This project aims to address a major data gap in the highly heterogeneous tropics by developing a long, continuous, and high-resolution multi-proxy stalagmite record from the well-monitored Cueva Larga in Puerto Rico1. High-precision 230Th/U dating shows that this stalagmite archive enables a comprehensive comparison of interglacial periods over the last 300,000 years, covering MIS 1, MIS 5 (127 ka to 54 ka), MIS 7 (255 ka to 190 ka) and MIS 9 (310 ka to 280 ka).

We present multiple high-resolution time series of trace elements (Mg, P, Cu, Sr, Ba, U) obtained using LA-ICP-MS. Because the archive integrates data from several stalagmites, it is essential to account for in-cave variability, including effects of prior carbonate precipitation and CO2 exchange. These processes are evaluated through parallel growth phases of the stalagmites and in combination with stable carbon and oxygen isotopes. Here, we focus on the rigorous evaluation of the LA-ICP-MS trace-element records to ensure a reliable and reproducible reconstruction at decadal resolution.

Time-series analyses of this new composite multi-proxy dataset are expected to enhance both qualitative and quantitative understanding of interglacial environmental change, particularly with respect to precipitation intensity and variability. Ultimately, this work will improve assessments of tropical climate sensitivity to external forcing and provide critical context for evaluating the magnitude of  ongoing climate change relative to natural variability.


1 Warken et al. (2020). Persistent Link Between Caribbean Precipitation and Atlantic Ocean Circulation During the Last Glacial Revealed by a Speleothem Record from Puerto Rico. Paleoceanography and Paleoclimatology, Vol. 35, No. 11, https://doi.org/10.1029/2020PA003944

How to cite: Mielke, A., Lövenich, F., Garcia, N., Charles, C., Keppler, F., Rivera Collazo, I., Acosta-Colón, Á. A., Winter, A., Spötl, C., and Warken, S.: Tropical Climate Variability During Interglacials of the Last 300,000 Years: Evaluation of High-Resolution LA-ICP-MS Trace-Element Data, EGU General Assembly 2026, Vienna, Austria, 3–8 May 2026, EGU26-11197, https://doi.org/10.5194/egusphere-egu26-11197, 2026.

EGU26-11275 | Orals | CL1.2.3

The structure and timing of Termination I in the Central Mediterranean from a multiproxy speleothem record from Sicily (Southern Italy) 

Giovanni Zanchetta, Ilaria Isola, Andrea Columbu, Russell Drysdale, Giuliana Madonia, Timothy Pollard, Jhon Hellstrom, Stefano Natali, Marco Luppichini, Eleonora Regattieri, and Marco Vattano

The transition from the Last Glacial period to the Holocene (T-I) represents the major global climatic reorganisation of occurred in the recent Earth’ history. T-I shows a complex reorganization of ocean-atmospheric climatic system and is pervasively characterised by abrupt climatic changes driven by the instability of Northern Hemisphere ice sheets and the impact on the Atlantic Meridional Overturning Circulation. The iconic climatic phases recognised in Northern Europe and Greenland ice core records are generally recognised also in the Mediterranean region, but structure, timing and eventual regional differences are poorly understood. Here we present a high-resolution multi-proxy speleothem record (stalagmite V3) from Abisso del Vento (Madonie Mountains, Northern Sicily) that spans over the T-I interval (from ca. 20 ka to 10.5 ka BP), comprising stable isotope (δ18O, δ13C) and trace element (Mg/Ca, Sr/Ca) records. Despite V3 proxy data shows the general climatic pattern recognised in Greenland ice cores some differences are observed, especially during the Greenland Interstadial 1 (GI1). Comparisons with various continental and marine records highlight the complexity of the Mediterranean region during T-I, and V3 offers a robustly dated multiproxy records to clarify this complexity.

How to cite: Zanchetta, G., Isola, I., Columbu, A., Drysdale, R., Madonia, G., Pollard, T., Hellstrom, J., Natali, S., Luppichini, M., Regattieri, E., and Vattano, M.: The structure and timing of Termination I in the Central Mediterranean from a multiproxy speleothem record from Sicily (Southern Italy), EGU General Assembly 2026, Vienna, Austria, 3–8 May 2026, EGU26-11275, https://doi.org/10.5194/egusphere-egu26-11275, 2026.

EGU26-11483 | ECS | Posters on site | CL1.2.3

Pluvial periods in northern Arabia over the last 10 million years 

Samuel Nicholson, Hubert Vonhof, Huw Groucutt, Paul Breeze, Nick Drake, Faisal Al Jibreen, Matthew Stewart, Monika Markowska, Denis Sholz, Michael Weber, Axel Gerdes, Alfredo Martinez-García, Michael Petraglia, and Gerald Haug

Green periods are becoming an increasingly important facet of both understanding the climatic evolution of Arabia, and permitting mammal dispersals between Africa and Eurasia. Recent research from central Arabia has shown that recurrent phases of increased monsoonal rainfall extended back into the Miocene. However, the latitudinal extent of the tropical rainbelt and green environments, especially at potential dispersal entry points into Arabia, remains uncertain. Here, we provide information on the timing of northern Arabian pluvial periods over the last 10.5 million years. We applied U-Pb dating to a new set of 50 speleothems from 5 caves, showing that periods of enhanced rainfall occurred between ~1.2 to ~1.7 Ma, ~2.8 to ~3.7 Ma, ~4 to ~7.5 Ma and ~9.8-10.5 Ma. Speleothem fluid inclusion water δ18O and δD stable- sotopes plot in excellent agreement with monsoonal precipitation sources, indicating the tropical rainbelt migrated to at least 29°N over Arabia in Mio-Pleistocene green phases. Absence of speleothem deposition in northern Arabia following the Mid-Pleistocene Transition (1.2 Ma) indicate monsoonal rainfall did not reach high latitudes in sufficient amounts, and reveal a time-transgressive reduction in the northward extent of monsoonal rainfall. These highlight the role of enhanced glacial-boundary conditions as a suppressant to the northern extent of rainfall during green Arabia periods. Whilst Mid-Late Pleistocene lacustrine evidence indicates increased rainfall compared to modern climates, our data suggest that mammal (especially hominin) dispersals in this region took place during relatively drier pluvial periods compared to the Mio-Pliocene.

How to cite: Nicholson, S., Vonhof, H., Groucutt, H., Breeze, P., Drake, N., Al Jibreen, F., Stewart, M., Markowska, M., Sholz, D., Weber, M., Gerdes, A., Martinez-García, A., Petraglia, M., and Haug, G.: Pluvial periods in northern Arabia over the last 10 million years, EGU General Assembly 2026, Vienna, Austria, 3–8 May 2026, EGU26-11483, https://doi.org/10.5194/egusphere-egu26-11483, 2026.

EGU26-11764 | ECS | Orals | CL1.2.3

Millennial-scale temperature and precipitation dynamics during Marine Isotope Stage 11a and 10 

Michael Weber, Hubert Vonhof, Alfredo Martínez-García, and Denis Scholz

Millennial-scale climate variability is a prominent feature of the last glacial cycle, intensively studied in Greenland ice cores as well as other marine and terrestrial climate archives. The most widely recognised expressions of abrupt millennial- to centennial- scale climate oscillations during this period are Dansgaard – Oeschger (D/O) events. For the past 125 ka, Greenland ice cores provide a benchmark for studying D/O events, but their restriction to the last glacial cycle limits investigations of the timing, duration and amplitude of D/O-type events during previous glacial cycles. Synthetic Greenland ice core data suggest that D/O-type millennial-scale climate variability occurred across all glacial phases of the past 800 ka. However, a major limitation for understanding the timing and dynamics of millennial-scale climate variability in preceding glacial cycles is the progressively more challenging dating of older material and the general lack of absolutely and precisely dated high resolution climate records beyond the last interglacial.

Here we present a new speleothem record from Cueva Victoria in SE Spain covering Marine Isotope Stages (MIS) 11a and 10, showing millennial-scale climate variability in both temperature and precipitation. Previous studies confirm that speleothems from Cueva Victoria are sensitive archives of past atmospheric and hydrological changes on both millennial and orbital timescales. For the last glacial cycle, numerous D/O events have been identified in Cueva Victoria speleothem stable isotope records, demonstrating their strong connection to North Atlantic climate patterns.

During MIS 11a and 10, millennial-scale variability is evident in multiple high-resolution proxies in the Cueva Victoria speleothems, such as stable carbon and oxygen isotopes, Mg concentrations, as well as TEX86-derived cave temperatures. The structure and timing of those millennial-scale events align closely with millennial-scale variability in marine sediment records, especially from the Iberian Margin, enabling direct comparison of temperature and precipitation dynamics in the marine and terrestrial realm. All events are characterised by a rapid increase in temperature and moisture availability, followed by a more gradual cooling and drying trend. This results in distinct stadial-interstadial D/O-type oscillations, particularly pronounced during MIS 10. The timing of these oscillations matches with the predicted occurrence of D/O events based on the synthetic Greenland ice core record, highlighting the potential of Cueva Victoria speleothems to reconstruct millennial scale climate variability beyond the last glacial cycle.

How to cite: Weber, M., Vonhof, H., Martínez-García, A., and Scholz, D.: Millennial-scale temperature and precipitation dynamics during Marine Isotope Stage 11a and 10, EGU General Assembly 2026, Vienna, Austria, 3–8 May 2026, EGU26-11764, https://doi.org/10.5194/egusphere-egu26-11764, 2026.

EGU26-12750 | ECS | Posters on site | CL1.2.3

Quantitative paleotemperature reconstruction from Cueva Victoria speleothems using nucleation-assisted fluid inclusion microthermometry 

Jennifer Burck, Michael Weber, Anna Nele Meckler, Yves Krüger, Hubert Vonhof, Alfredo Martinez-Garcia, and Denis Scholz

Cueva Victoria is located in the semi-arid region of south-eastern Spain, one of the driest regions in Europe with mean annual precipitation of 200–300 mm and pronounced seasonality. The cave is hosted in Triassic dolomites and limestones of the Alpujarride Complex, part of the Inner Betic Cordillera, where karstification has enabled the development of extensive cave systems and flowstone formation. These flowstone deposits provide a sensitive archive of past climate variability.

Previous studies established robust ²³⁰Th/U chronologies spanning the last ~450 ka, demonstrating that speleothem growth occurred during both interglacial and warmer glacial periods, such as Marine Isotope Stage (MIS) 3, reflecting phases of enhanced regional moisture availability.

Here, we investigate flowstone samples VIC-III-4 and VIC-III-5, covering MIS 11c to MIS 7a (~430–190 ka), to evaluate their potential as quantitative paleotemperature archives. Preliminary nucleation-assisted (NA) fluid inclusion microthermometry measurements of a few flowstone samples yielded cave temperature estimates in agreement with the range of independently derived TEX₈₆-based temperature reconstructions from the same samples.

Detailed petrographic thin section analysis of the two flowstones indicates the presence of several fluid-inclusion-bearing growth layers that appear promising for NA fluid inclusion microthermometry. This provides the basis for targeted selection of additional microthermometry measurements and a more detailed analysis of the two flowstones. Although assisted (NA) fluid inclusion microthermometry has successfully been applied to speleothems from other regions, this study represents the first application to the Cueva Victoria flowstones and one of the first applications to a semi-arid cave system.

The combination of precisely dated high-resolution speleothem proxy records (stable isotopes, trace elements) with direct temperature reconstructions significantly enhances the potential of the Cueva Victoria flowstones for palaeoclimate reconstruction and will contribute to improving terrestrial paleoclimate reconstructions for the western Mediterranean region, an area highly sensitive to future hydroclimate change.


How to cite: Burck, J., Weber, M., Meckler, A. N., Krüger, Y., Vonhof, H., Martinez-Garcia, A., and Scholz, D.: Quantitative paleotemperature reconstruction from Cueva Victoria speleothems using nucleation-assisted fluid inclusion microthermometry, EGU General Assembly 2026, Vienna, Austria, 3–8 May 2026, EGU26-12750, https://doi.org/10.5194/egusphere-egu26-12750, 2026.

EGU26-12788 * | Orals | CL1.2.3 | Highlight

 Speleothems used by Neanderthals, in the Bruniquel Cave, Southern France. 

Sophie Verheyden, Jacques Jaubert, Christian Burlet, Soraya Bengattat, Kim Génuite, Serge Delaby, Hai Cheng, and Xuexue Jia

The Bruniquel Cave contains circular structures made of broken stalagmites, dated to 176.5 ka and attributed to Neanderthals (Jaubert et al., 2016). A key question concerns the origin of the speleothem pieces used in these structures (i.e., speleofacts) and whether Neanderthals intentionally broke stalagmites, or instead collected fragments already lying on the cave floor—an important distinction in terms of intentionality. A related issue is the provenance of these speleothems within the cave, implying a particular selection process indicating potential symbolic value of speleothems for Neanderthals.

Two broken stalagmite bases and one broken stalagmite near the structures in the Salle de la Structure were investigated. U-series dating of the outer layers of the broken bases and stalagmite, as well as of the initial calcite layers that subsequently covered them, yielded ages from 432.8 ± 29.8 ka to 121.3 ± 1.2 ka. The broken base BR-201, produced similar ages for the older and younger calcite, allowing a precise age of 176.5 ± 2.1 ka for the breakage of this ~20 cm diameter stalagmite—consistent with the age of the structures. This result strongly supports breakage by the same Neanderthals who built the structures, and suggests an opportunistic selection of building material.

Laser-Induced Breakdown Spectroscopy (LIBS) with an in-house portable device was performed on speleothems from different sectors of the cave, and on speleothem pieces incorporated into the structures. Multivariate statistical analysis (e.g., principal component analysis), reveal compositional differences, mainly in Mg content, between speleothems from the entrance zone and those from the deeper parts of the cave. To date, the geochemical signature of the speleothem pieces used in the structures matches that of speleothems from the interior of the cave, failing to attribute the building material to a specific place in the cave, which would be an argument for a specific symbolic value.

Other calcite deposits in the Salle de la Structure were dated to constrain the cave floor conditions during Neanderthal occupations. These ages range from 163.0 ± 39.3 ka to 2.8 ± 4.1 ka. The results indicate that calcite deposition occurred in some areas during or shortly after the construction of the structures, implying that the floor surface in these zones likely remained relatively stable thereafter. In contrast, other areas were covered by calcite only during the Holocene. These findings help identify surfaces where human traces may be preserved and contribute to reconstructing the cave’s morphology during Neanderthal times by spotting the more recent calcite deposits that should be removed from the 3D model of the cave.

The study is financed partly by the French Ministry of Culture (DRAC), the Belgian Science Policy Office (BELSPO) and the Research Foundation Flanders (K208822N)

Jaubert J., Verheyden S., Genty D., et al., 2016. Early Neandertal constructions deep in Bruniquel Cave in southwestern France. 2016. Nature 534: 111 114.


How to cite: Verheyden, S., Jaubert, J., Burlet, C., Bengattat, S., Génuite, K., Delaby, S., Cheng, H., and Jia, X.:  Speleothems used by Neanderthals, in the Bruniquel Cave, Southern France., EGU General Assembly 2026, Vienna, Austria, 3–8 May 2026, EGU26-12788, https://doi.org/10.5194/egusphere-egu26-12788, 2026.

EGU26-13781 | Orals | CL1.2.3

Dansgaard/Oeschger-like events detected in MIS 11 speleothem proxy records from Central Europe 

Dana F. C. Riechelmann, Hubert Vonhof, Bernd R. Schöne, Klaus Peter Jochum, and Denis Scholz

Two stalagmites, DH_Br2 and DH_Kn6, were sampled from excavations in Dechencave, western Germany. Both were precisely dated by the 230Th/U-method (Mainz University), thin sections were investigated (Mainz University), and both stalagmites were analysed for their stable oxygen and carbon isotope composition (Mainz University and Max Planck Institute for Chemistry, Mainz) as well as various trace element concentrations (Max Planck Institute for Chemistry, Mainz).

Both stalagmites show evidence for diagenesis, such as roundish voids and mosaic calcite fabric in their lower parts. These parts were excluded from further analyses due to the alteration of the 230Th/U-ages as well as the proxy data. The discussed section of stalagmite DH_Br2 started growing at 401 ka and stopped at 379 ka, which corresponds to late Marine Isotope Stage (MIS) 11c to mid-11a. Stalagmite DH_Kn6 grew between 394 and 390 ka and overlaps with that of DH_Br2. Overall, speleothem records from MIS 11 are rare, in particular from Central Europe.

The δ13C and δ18O records show different levels for both stalagmites, most probably related to different amounts of prior calcite precipitation (PCP) and disequilibrium isotope fractionation during calcite precipitation at the different drip sites. The trace element records of both stalagmites can be identified as different environmental proxies with Al and Y being proxies for detrital material in the stalagmites and P and U reflecting soil microbial and vegetation activity. Strontium and Ba were influenced by leaching of soil minerals as well as changes in stalagmite growth rates. The Mg records correlate well with the δ13C records indicating PCP as dominant controlling factor. All trace element records, except for Al and Y, and the δ13C values are proxies for past precipitation. As revealed by the proxy records of stalagmite DH_Br2, drier conditions prevailed between 401-395 ka as well as between 391-379 ka, whereas wetter conditions existed between 395-391 ka, which is probably related to insolation changes. According to the δ18O values of stalagmite DH_Br2, temperature was slightly lower during 389-379 ka, i.e., after the peak warm phase of MIS 11, in agreement with marine and Antarctic ice core records. During this period 389-379 ka, we observe millennial-scale oscillations, which are most prominent in the δ18O record of stalagmite DH_Br2. They are probably Dansgaard/Oeschger-like events, not described up to now from speleothems from Central Europe during MIS 11. These millennial-scale oscillations are in good agreement with sea surface temperature changes in the North Atlantic.

How to cite: Riechelmann, D. F. C., Vonhof, H., Schöne, B. R., Jochum, K. P., and Scholz, D.: Dansgaard/Oeschger-like events detected in MIS 11 speleothem proxy records from Central Europe, EGU General Assembly 2026, Vienna, Austria, 3–8 May 2026, EGU26-13781, https://doi.org/10.5194/egusphere-egu26-13781, 2026.

EGU26-13872 | ECS | Posters on site | CL1.2.3

Is the 4.2-ka event visible in speleothem records from southwest Asia? 

Alice Paine, Mark Altaweel, Peyman Parvizi, Frederick Held, Stéphane Affolter, Christoph Raible, Morteza Djamali, Hai Cheng, and Dominik Fleitmann

The ‘4.2 ka event’ (~4200–3900 yr BP) is now a globally-recognised Holocene chronostratigraphic marker, delineating the boundary of the middle-to-late Holocene1. First identified as a drought signal corresponding to ~2200 BCE in the Tell Leilan stratigraphy (Syria), correspondence between this signal and the collapse of the Akkadian empire was interpreted as sign of a causal association, and one of the first explicit links made between a major climate shift and civilizational transformation2. Several studies have more recently presented evidence suggesting this drought was in fact a globally-pervasive phenomenon, linked to the decline of the ancient Egyptians, the de-urbanization of the Harappans, and the demise of the Neolithic Culture of China3,4,5. However, no clear consensus exists on whether the 4.2-kyr event was truly global in scale, nor whether the event was consistently marked by aridity6,7. But perhaps most critically, it is unclear whether a clear drought signal at 4.2-ka2 occurs consistently in paleoclimate records across southwest Asia8. Without a clear perspective on if, and how, regional climate signals relate to one another across this interval, it is difficult to ascertain whether changes occurring at ~4.2 ka are mechanistically distinguishable from internal noise in a highly sensitive, and complex climate system9. To address this uncertainty, we present a first look at new stable isotope, trace element, and fluid inclusion measurements from speleothems grown in Kuna Ba and Shalaii Caves (~400 km SE of Tell Leilan) in Iraqi-Kurdistan. By combining these results with published geochemical data from paleoclimate archives across southwest Asia, we will assess whether the hydro climatic changes recorded in these archives capture a distinct anomaly corresponding to the 4.2-ka event.  Hence, providing a chronologically-robust framework with which to assess the regional-scale timing, expression, and coherence of climate variability before, during, and after the proposed 4.2-ka event.

~~

1Walker et al. (2018) Episodes 41(4): 213-223 ; 2Weiss et al. (1993) Science 261 (5124): 995-1003 ; 3Weiss & Bradley (2001) Science 291(5004): 609-610 ; 4Carolin et al. (2019) PNAS USA 116(1): 67-72 ; 5Zhang et al. (2021) Science Advances 7(48): 1-9 ; 6McKay et al. (2024) Nature Communications 15: 6555 ; 7Nan et al. (2025) Earth-Science Reviews 265: 105128 ; 8Finné et al. (2011) Journal of Archaeological Science 38: 3153-3173 ; 9Zittis et al. (2022) Reviews of Geophysics 60: e2021RG000762.

How to cite: Paine, A., Altaweel, M., Parvizi, P., Held, F., Affolter, S., Raible, C., Djamali, M., Cheng, H., and Fleitmann, D.: Is the 4.2-ka event visible in speleothem records from southwest Asia?, EGU General Assembly 2026, Vienna, Austria, 3–8 May 2026, EGU26-13872, https://doi.org/10.5194/egusphere-egu26-13872, 2026.

EGU26-14602 | ECS | Orals | CL1.2.3

Reconstructing Tropical Hydroclimate Variability using Speleothems from the Philippines During Abrupt Climate Events 

Natasha Sekhon, Street Senan, Mira Hart, Celia Kong-Johnson, Jaren Ocampo Yambing, Xiaojing Du, Mónica Geraldes Vega, Bryce Belanger, Mart Geronia, Sharon Jaladoni, Carlos Primo David, Jessica Oster, David McGee, and Daniel Ibarra

Understanding past climate trends is crucial for projecting future hydroclimate changes, especially in the context of rapid anthropogenic climate change. Here, we focus on reconstructing hydroclimate variability during periods of past climate change from the tropics , which remain underrepresented in climate variability studies despite their heightened vulnerability to ongoing climatic shifts.  

Here, we investigate ẟ18O, ẟ13C, and trace elements (Mg/Ca, Ba/Ca, Sr/Ca) in multiple speleothem samples across the Philippines. Speleothem sample, BH-1, was collected from Hinagdanan Cave (9.6253° N, 123.8009° E) and grew between 26-51 kyrs B.P. with an average growth rate of 8.12 μm/yr. Another speleothem sample PPUR-GP-3 collected from the Puerto Princesa Subterranean River National Park (10.1926° N, 118.9266° E) grew between 4-48 kyrs B.P. with a hiatus between 16,243 ± 146 years B.P. to 35,300 ± 538 years (±2𝜎). Collectively, speleothem growth encompasses critical periods of past climate change such as Heinrich Events 1 through 5, the Younger Dryas, and the last deglaciation. Modern climatology data and ongoing cave monitoring data suggests that Hinagdanan Cave and Princesa Subterranean River National Park recharges from summer precipitation. 

Initial geochemical findings indicate fluctuating trace element data suggesting drying trends over time, characterized by an increase in Mg/Ca and a decrease in Sr/Ca in PPUR-GP3. Change-point analysis conducted on the ẟ18O record in BH-1 reveals that Heinrich Event 3 in the Philippines experienced drying conditions. The drying is in alignment with ẟ18O trends reflected in Borneo stacked speleothem records. Further investigation of BH-1 and PPUR-GP3 trace elements and stable isotopes will disentangle regional (ẟ18O amount effect, moisture source) versus local (prior calcite precipitation) hydroclimate variability. Finally, we will compare our new geochemical results with existing isotope-enabled climate model simulations (iTRACE) to discern potential climate drivers that modulate IPWP hydroclimate during key climate events.

How to cite: Sekhon, N., Senan, S., Hart, M., Kong-Johnson, C., Yambing, J. O., Du, X., Vega, M. G., Belanger, B., Geronia, M., Jaladoni, S., David, C. P., Oster, J., McGee, D., and Ibarra, D.: Reconstructing Tropical Hydroclimate Variability using Speleothems from the Philippines During Abrupt Climate Events, EGU General Assembly 2026, Vienna, Austria, 3–8 May 2026, EGU26-14602, https://doi.org/10.5194/egusphere-egu26-14602, 2026.

EGU26-14611 | ECS | Orals | CL1.2.3

Residual stresses preserved in calcite from cave stalagmites and its impact on fluid inclusions 

Leonardo Pasqualetto, Yves Krüger, Luca Menegon, Matteo Demurtas, Silvia Frisia, Andrea Borsato, Mihály Pósfai, Peter Pekker, Hugo van Schrojenstein Lantman, and Nele Meckler

Stalagmites record valuable information within their crystal structure and composition about past climate and environmental changes. Stalagmite crystal fabrics reflect growth conditions: the crystallisation pathway influences the distribution of nano- to micro-particulates, crystal defects, and nano- to micro-porosities. These microstructures may act as nucleation sites for the formation of larger fluid inclusions — small cavities encapsulating relic drip water that are important climate archives. Stalagmite fluid inclusions are widely used for paleotemperature reconstructions using nucleation-assisted microthermometry and oxygen isotope thermometry. However, the influence of different crystallisation mechanisms and fabrics on fluid inclusion properties (e.g., water density and composition) and their preservation is still poorly constrained.

Here, we apply a crystallographic approach to investigate the internal crystal structure of two calcite stalagmites from Borneo and New Zealand. Our aim is to assess whether fluid inclusions are affected by post-growth deformation and/or volume changes and to quantify their impact on microthermometric data. This work seeks to identify non-thermal processes that could explain the observed scatter in microthermometry measurements from coeval fluid inclusions.

Previous electron backscatter diffraction (EBSD) analyses showed these samples exhibit columnar compact, open, and porous fabrics composed of mm- to cm-scale crystal domains, further subdivided into sub-domains characterised by rotations around the c-axis of up to 4°. Fluid inclusions are preferentially located along these sub-domain boundaries, indicating a strong relationship between fluid inclusion nucleation and crystal defects. High-angular resolution EBSD (HR-EBSD) reveals residual stresses up to 200–300 MPa located along the sub-domain boundaries. Since stalagmites form in a nominally stress-free environment, these stresses are interpreted as remnants of crystallisation energy stored in the lattice as crystallographic defects. High-resolution transmission electron microscopy (HR-TEM) confirms the presence of high densities of edge dislocations located along the sub-domain boundaries, that bend the crystal lattice and generate the observed misorientations and stress fields.

Our results demonstrate that fluid inclusions are located in mechanically fragile microstructural environments. The internal stresses stored by these microstructures may be released in response to external forces such as sample preparation or ambient temperature changes and could induce post-formation volume changes in fluid inclusions, ultimately biasing paleotemperature reconstructions. These quantified stress values provide a basis for evaluating the magnitude of this effect on microthermometric data.

How to cite: Pasqualetto, L., Krüger, Y., Menegon, L., Demurtas, M., Frisia, S., Borsato, A., Pósfai, M., Pekker, P., van Schrojenstein Lantman, H., and Meckler, N.: Residual stresses preserved in calcite from cave stalagmites and its impact on fluid inclusions, EGU General Assembly 2026, Vienna, Austria, 3–8 May 2026, EGU26-14611, https://doi.org/10.5194/egusphere-egu26-14611, 2026.

EGU26-16045 | ECS | Orals | CL1.2.3

Speleothem reconstructions of Holocene interannual climate variability in Botswana 

Nitesh Sinha, Anupam Samanta, Jasper A. Wassenburg, Andrea Borsato, Silvia Frisia, Fulvio Franchi, Franziska Lechleitner, Yuna Oh, Yung-Seok Yang, Hai Cheng, Laurent Bruxelles, Andy E. Moore, and Axel Timmermann

The natural variability of rainfall in the Southern African region remains, as yet, poorly understood due to scarce availability of long instrumental and pre-instrumental records and the sparse distribution of weather stations in remote areas. It is known that regional atmospheric circulation features, particularly the Botswana High, control the moisture distribution across the region on seasonal and interannual timescales. The El Niño-Southern Oscillation (ENSO) further influences moisture transport, resulting in alternating wet and dry periods. Understanding the interplay between these forcing in modulating natural rainfall variability is crucial for effective water resource management, agricultural planning, and climate adaptation in a region heavily reliant on seasonal rainfall.

Speleothems (secondary mineral cave deposits) are known to record local hydrology and rainfall over thousands of years and can provide valuable knowledge about natural rainfall variability in Southern Africa. Here, we present two speleothems from Gcwihaba Cave, located in northwestern Botswana, that span the late Holocene period between 200 and 2500 years before present (yrs BP). Robust age models for speleothems were constructed using a combination of U-Th and 14C dating techniques, despite signs of biocorrosion from bat guano in the cave. The two well-laminated speleothems exhibit alternating bands of calcite and aragonite, likely identifying annual to multi-annual timescales. High-resolution stable-isotope (δ18O and δ13C) and trace-element data from these speleothems reveal pronounced interannual variability, suggesting large fluctuations in rainfall amounts in the area, which can be linked to ENSO, as suggested by water tagging experiments with an isotope-enabled climate model. Analyzing multidecadal changes in interannual isotope and trace-element variability provides further insights into low-frequency ENSO dynamics during the late Holocene, which can then be compared with other paleo-ENSO reconstructions.

How to cite: Sinha, N., Samanta, A., Wassenburg, J. A., Borsato, A., Frisia, S., Franchi, F., Lechleitner, F., Oh, Y., Yang, Y.-S., Cheng, H., Bruxelles, L., Moore, A. E., and Timmermann, A.: Speleothem reconstructions of Holocene interannual climate variability in Botswana, EGU General Assembly 2026, Vienna, Austria, 3–8 May 2026, EGU26-16045, https://doi.org/10.5194/egusphere-egu26-16045, 2026.

EGU26-16599 | Orals | CL1.2.3

The anatomy of the Indian summer monsoon variability during the penultimate deglaciation (Termination II) 

Gayatri Kathayat, Kaustubh Thirumalai, Tan Liangcheng, Xiyu Dong, Christoph Spötl, Hanying Li, Ponnusamy Saravanan, Haiwei Zhang, and Hai Cheng

Abstract

Precisely dated East Asian summer monsoon (EASM) speleothem δ¹⁸O records frequently mirror Greenland ice-core variability during deglaciation and stadial–interstadial transitions, however, pronounced regional heterogeneity is evident, particularly during the penultimate deglaciation (Termination II; TII). Not all records align, and mismatches are often ascribed to chronological uncertainty despite high dating precision, yet they persist even in annually band-counted, confocal-imaged speleothem δ¹⁸O records, implying complexity beyond dating artifacts. This ambiguity sustains debate over whether EASM cave δ¹⁸O primarily encodes Asian monsoon intensity via moisture-source shifts or reflects upstream rainout, progressive isotopic distillation and is potentially modulated by precipitation seasonality.

In contrast, speleothem δ¹⁸O records from the Indian subcontinent provide a complementary perspective, with δ¹⁸O variability more directly reflecting Indian Summer Monsoon (ISM)  circulation strength. To better constrain first-order Asian monsoon variability, we present a high-temporal-resolution, precisely dated speleothem δ¹⁸O record from Mawmluh Cave in northeastern India (hereafter ML11 δ¹⁸O). The ML11 δ¹⁸O record spans Termination II (TII) and is derived from a ~70-cm-long stalagmite, with a mean temporal resolution of ~5 years and average ²³⁰Th age uncertainties of ±600 years. Our ML11δ¹⁸O  record resolves the evolution of the Indian Summer Monsoon (ISM) across TII, enabling robust assessment of monsoon structure and variability under changing boundary conditions. We examine what constitutes a “penultimate deglaciation” in a monsoon-dominated system, considering not only its precise timing but also its sensitivity to external forcing. Leveraging the high chronological precision of ML11 δ¹⁸O record, we evaluate similarities and potential differences between the ISM and EASM speleothem δ¹⁸O variability. Our new ISM δ¹⁸O record further tests whether the EASM speleothem δ¹⁸O reflects pan-Asian monsoon dynamics or is dominated by regional-to-local hydroclimate processes. These results highlight the need to integrate chronologically robust archives with regionally diagnostic proxy interpretations to better resolve monsoon behavior and improve constraints on monsoon sensitivity under future climate change.

How to cite: Kathayat, G., Thirumalai, K., Liangcheng, T., Dong, X., Spötl, C., Li, H., Saravanan, P., Zhang, H., and Cheng, H.: The anatomy of the Indian summer monsoon variability during the penultimate deglaciation (Termination II), EGU General Assembly 2026, Vienna, Austria, 3–8 May 2026, EGU26-16599, https://doi.org/10.5194/egusphere-egu26-16599, 2026.

EGU26-16783 | Orals | CL1.2.3

Improved accuracy of oxygen and hydrogen isotope analysis in speleothem fluid inclusions: the importance of crusher temperature 

Jasper Wassenburg, Julian Schröder, Alfred Skeidsvoll, Sayak Basu, Jenny Maccali, A. Nele Meckler, Alvaro Fernandez, Alexander Budsky, Daniel M. Cleary, Alfredo Martinez-Garcia, Yun Seok Yang, Yuna Oh, Hai Cheng, Christoph Spötl, and Hubert B. Vonhof

Speleothem fluid inclusion isotope analysis provides the oxygen and hydrogen isotope composition of the parent water from which the carbonate precipitated (d18OFL; d2HFL). In contrast to carbonate isotopes, it is not affected by kinetic isotope effects. Fluid inclusion isotopes can be analyzed by crushing heated speleothem fragments and measuring the isotopic composition of the released water vapor. However, during this process, analytical artifacts related to pre-crushing evaporation and/or post-crushing adsorption can occur, potentially skewing the isotope values away from their origin and biasing temperatures calculated from the combination of d18OFL and d18OCc. In d2H-d18O cross-plots, analytical (pre-crushing) evaporation has been suggested to induce very shallow slopes down to 1.4, lower than trends induced by evaporation under natural conditions in the soil or inside the cave.

            In this study, we used a Picarro L2140i isotope analyzer with an artificially generated moist background setup to examine the effect of analytical evaporation by quantifying the water loss prior to analysis when applying different crushing temperatures. We targeted two layers with different calcite fabrics from a flowstone of Touhami Cave (GTOF2), Morocco, as well as speleothems from Scladina Cave, Belgium and Bloukrantz Cave, South Africa.

The samples have different water contents and show different isotope effects of analytical evaporation that highly depend on the crushing temperature. Our results indicate that high water content samples (>1-2 µL/g) are generally more reliable compared to low yield samples (<0.5 µL/g), although high yield samples can be altered significantly by in crusher evaporation. In contrast to crushing at 110°C or 125°C, crushing at 90°C prevents most analytical evaporation in the samples we analyzed, increasing the sample water yield by up to 50%. Furthermore, for our low water content samples different crushing temperatures of 110°C and 125°C result in different evaporation slopes. At 110°C, the evaporation slope can even be parallel to the global meteoric water line. A potential explanation for these different evaporation slopes involves various amounts of adsorption of water to freshly crushed calcite powder, although this requires further exploration.

These findings have crucial implications, especially for low yield samples, because data that plot in the vicinity of the global meteoric water line are generally regarded as trustworthy. In our experiments, crushing at 90°C produces accurate d18OFL, d2HFL, and d-excess values for all high yield samples. Realistic cave air temperatures from combined d18OCc and d18OFL analysis is retrieved from all samples analyzed, supported by consistent TEX86 temperatures and modern-day drip water isotope compositions.

How to cite: Wassenburg, J., Schröder, J., Skeidsvoll, A., Basu, S., Maccali, J., Meckler, A. N., Fernandez, A., Budsky, A., Cleary, D. M., Martinez-Garcia, A., Yang, Y. S., Oh, Y., Cheng, H., Spötl, C., and Vonhof, H. B.: Improved accuracy of oxygen and hydrogen isotope analysis in speleothem fluid inclusions: the importance of crusher temperature, EGU General Assembly 2026, Vienna, Austria, 3–8 May 2026, EGU26-16783, https://doi.org/10.5194/egusphere-egu26-16783, 2026.

EGU26-17289 | Orals | CL1.2.3

Quasi - Continuous growth of speleothems on the Yucatan Peninsula and possible drought modulated hiatuses 

Norbert Frank, Sophie Warken, Nils Schorndorf, Aaron Mielke, Fernanda Lases Hernandez, and Jeronimo Avìles Olguìn

The timing of drought occurrence on the Yucatán Peninsula has been a central focus of research linking Maya cultural evolution to regional hydroclimatic variability over the past several millennia. Climate proxy records that span periods of cultural decline and political instability are particularly valuable for constraining potential causal relationships. Numerous studies have proposed such links, most recently supported by sub-annual drought reconstructions (James et al. 2025, Science Advances). However, the precise and accurate determination of absolute ages for drought events and drought-related growth hiatuses remains a major challenge.

Advances in radiometric dating of speleothems, including 230Th/U and 14C methods, as well as independent stratigraphic approaches such as visual laminae counting and geochemical or isotopic proxy cycles, have substantially improved chronological resolution over the past decade. Nonetheless, combining independent dating techniques introduces important pitfalls related to systematic uncertainties. Corrections for initial 230Th can substantially degrade age accuracy, as they rely on the assumption of a single, well-characterized source rarely constrained by multiple measurements (e.g., isochrons). These corrections introduce systematic uncertainties that may exceed those associated with individual layer counts by up to two orders of magnitude. Conversely, layer counting alone provides absolute age control only when robust anchor points are available or when records are demonstrably continuous, and it requires independent constraints to interpret proxy-derived periodicities.

Here, we compile and assess available speleothem 230Th/U data from the Yucatán Peninsula to (i) evaluate the impact of variable initial 230Th on chronological precision and accuracy, (ii) identify pitfalls associated with combining radiometric dating and annual layer counting, and (iii) demonstrate quasi-continuous speleothem growth across the region over the past 3000 years. Our analysis reveals substantial geochemical variability in initial 230Th concentrations in drip waters from different cave systems, indicating a strong potential for underestimated systematic uncertainties, particularly at the onset of discontinuous chronologies. While annual layer counting based on geochemical proxies independent of water isotopic composition or vegetation changes can significantly reduce relative age uncertainties, systematic errors persist and require careful evaluation. Using more than 20 speleothem chronologies, we further document the frequency and regional coherence of growth hiatuses and their changes across the Terminal Classic Period. Integrating chronological data with soil-sensitive tracers allows assessment of critical thresholds in soil CO₂ concentration, drip-water availability, cave–drip water CO₂ gradients, and carbonate oversaturation.

Overall, our results highlight that accurately constraining drought timing from speleothem records remains challenging, underscoring the need for rigorous methodological integration and transparent quantification of systematic uncertainties.

How to cite: Frank, N., Warken, S., Schorndorf, N., Mielke, A., Lases Hernandez, F., and Avìles Olguìn, J.: Quasi - Continuous growth of speleothems on the Yucatan Peninsula and possible drought modulated hiatuses, EGU General Assembly 2026, Vienna, Austria, 3–8 May 2026, EGU26-17289, https://doi.org/10.5194/egusphere-egu26-17289, 2026.

EGU26-17746 | Posters on site | CL1.2.3

A climatic link between speleothem formation in south-eastern Spain and Eastern Mediterranean sapropel deposition? 

Alexander Budsky, Denis Scholz, Christoph Spötl, Michael Weber, and Hubert Vonhof

The modern Western Mediterranean climate is characterised by strong seasonality and, especially in south-eastern Spain, by limited rainfall. In contrast, terrestrial and marine archives indicate that the peak of the last interglacial was marked by warmer conditions and potentially more variable climate, partly driven by meltwater outbursts in the North Atlantic. High insolation during interglacials forced a northward displacement of the Intertropical Convergence Zone, increasing rainfall over Northern Africa. Enhanced fluvial input leads to stratification of the Eastern Mediterranean Sea and ultimately to the deposition of sapropels. However, the climatic consequences of these large-scale processes for south-eastern Iberia have not yet been systematically investigated.

Several speleothems from Cueva Victoria, south-eastern Spain, cover the mid-Pleistocene to the Holocene. During the last glacial period, Dansgaard/Oeschger (D/O)-type variability is expressed in the speleothem stable isotope records. Variations in speleothem stable isotope values are interpreted in terms of changes in temperature (δ18O) and vegetation cover (δ13C). In general, warmer temperatures during D/O events are associated with lower δ18O values due to temperature and moisture source effects. Increased effective precipitation (precipitation-evaporation) is reflected by more negative δ13C values, resulting from higher soil microbial activity and denser vegetation cover.

Here, we present a compilation of speleothem records from Cueva Victoria spanning several interglacials and encompassing the timing of multiple sapropel layers in the Eastern Mediterranean. A comparison of speleothem stable isotope signatures during the formation of different sapropels reveals contrasting climatic responses in south-eastern Spain. During glacial phases, speleothem growth coincided with the timing of the sapropel deposition, indicating more humid conditions in south-eastern Spain. In contrast, during the Holocene Climate Optimum and the formation of sapropel 1, elevated δ13C values point to a decline in vegetation cover, interpreted as a result of enhanced seasonality. Speleothem formation is almost completely absent during sapropel 5 (≈ 122-128 ka), which may reflect enhanced seasonality with warmer temperatures associated with a reduction in precipitation-evaporation compared to the Holocene.

How to cite: Budsky, A., Scholz, D., Spötl, C., Weber, M., and Vonhof, H.: A climatic link between speleothem formation in south-eastern Spain and Eastern Mediterranean sapropel deposition?, EGU General Assembly 2026, Vienna, Austria, 3–8 May 2026, EGU26-17746, https://doi.org/10.5194/egusphere-egu26-17746, 2026.

Karst landscapes of Peninsular Malaysia preserve some of the most important terrestrial archives of Quaternary fauna and paleoenvironmental indicators. Due to its location in between the Indochina and Sundaic subregions, the peninsula is critical for assessing faunal dispersal, landscape contiguity, and climatic fluctuations effects on the ecosystem. Published fossil and geochronological evidence from cave sites across the peninsula are synthesised to evaluate the faunal habitat structure and ecological variation from the Middle Pleistocene to the Last Glacial Maximum (LGM).

Early Quaternary research in the peninsula was largely conducted through geological, sedimentological, and palynological records, often in placer tin-mining pits. It was suggested that vegetation cover during the LGM and earlier glacial phases was reduced and more open relative to the present day. Pollen preserved within alluvium deposits indicates cooler, drier climates, with grassland–savanna and pine woodland corridors. These interpretations were embedded within broader landscape evolution models including deep weathering of exposed basement in Mio-Pliocene time during the maximum extent of the Sundaland continent, regolith mobilisation after the initiation of slumping due to the rise of sea levels and precipitation, braided fluvial aggradation, episodic interglacial downcutting, the development of peneplanation and pedogenesis followed by the establishment of modern fluvial, infill of V-shaped valleys in association with high-sea level deposits along the coast during the Late Pleistocene.

Numerically dated karst cave fossil assemblages provide a new insight to complement these open-site models. The persistence of orangutan (Pongo sp.) at Batu Caves until ~60 ka implies continued lowland forest cover along the west coast during the last glacial phase. Pleistocene small mammal assemblages from Semadong Cave, located in the northern peninsula, feature environmental variability with the co-occurrence of grassland- and forest-affiliated taxa suggesting a mosaic vegetation model under cooler and drier conditions. Reflected by the occurrence of arboreal mammals including Pongo and colobine monkeys, the Middle–Late Pleistocene Layang Mawas Cave represents an assemblage that is dominated by species closely tied to tropical forest habitats.

Notable recent finding includes the first reported occurrence of Stegodon in Peninsular Malaysia, which was discovered together with a Pongo within the same Middle Pleistocene stratigraphic unit. Based on the ecological tolerances of modern Pongo and stable isotope evidence from fossil Pongo and Stegodon elsewhere in Southeast Asia and adjacent regions, it is reasonable to infer that the palaeoenvironment at this site was either under continuous forest cover or comprised a mixed landscape, with forest patches interspersed within more open vegetation. Recent studies on palaeoecological records across Southeast Asia and pollens from South China Sea during the LGM further challenge the “savanna corridor” paradigm and support the concepts of “forest” and “mosaic vegetation” across Sundaland.

Collectively, karst cave archives in Peninsular Malaysia add critical faunal constraints to existing sedimentary and palynological frameworks. Future combination of stable carbon and oxygen isotope data on fossil remains, with high-resolution rainfall and monsoon proxies will further refine paleoenvironmental reconstructions in the peninsula, subsequently contribute to a better understanding of the paleoenvironment in this region.

How to cite: Muhammad, R. F.: Karst Records of Quaternary Fauna and Environments in Peninsular Malaysia: A Literature Review, EGU General Assembly 2026, Vienna, Austria, 3–8 May 2026, EGU26-18068, https://doi.org/10.5194/egusphere-egu26-18068, 2026.

EGU26-18529 | Posters on site | CL1.2.3

Evaluating the limits and potential of fluid-calcite δ¹⁸O and Δ₄₇ thermometry in modern speleothems from Borneo 

Alvaro Fernandez Bremer, Jenny Maccali, Yves Krüger, and Anna Nele Meckler

Speleothems are among the most important terrestrial climate archives, combining precise chronologies with sensitivity to temperature and hydrology, yet reconstructing absolute temperatures remains challenging. While fluid inclusion microthermometry provides the most direct temperature constraints, it requires large, well-preserved inclusions and is not applicable to all samples. Emerging approaches such as TEX86 may require site specific calibrations and remain in early stages of development. Consequently, stable isotope-based approaches including fluid-calcite δ18O thermometry and clumped isotope Δ47 thermometry represent promising options for speleothem paleothermometry, despite both being affected by isotopic disequilibrium inherent to speleothem growth. Here, we evaluate whether empirical calibrations that incorporate mean disequilibrium effects can yield meaningful temperature estimates in a tropical setting. Using actively growing speleothems from caves in Borneo, we assess whether δ18O and Δ47 based thermometers can be applied despite expected disequilibrium, whether disequilibrium effects are consistent among samples, and whether particular speleothem morphologies are better suited for clumped isotope thermometry.

We measured calcite δ18O and Δ47, together with fluid inclusion δ18O, in stalagmites, stalactites, flowstones, soda straws, and pool carbonates. We find that oxygen isotope derived temperatures calculated using a speleothem specific calibration such as Tremaine et al. (2011) agree well with modern cave temperatures, with a 1σ spread of approximately 1.5 °C across 22 growth layers from nine different stalagmites. In contrast, Δ47 based temperatures show large sample dependent disequilibrium effects, with an approximately 4 °C 1 σ catter across 14 specimens. Only pool carbonates record Δ47 values consistent with isotopic equilibrium. These results indicate that for Holocene samples fluid-calcite δ18O thermometry can provide meaningful absolute temperatures with an inherent uncertainty of ± 1.5°C, whereas Δ₄₇ disequilibrium effects are highly variable and indicate that an empirical calibration incorporating mean disequilibrium would not yield robust temperature estimates. Pool carbonates emerge as the only speleothem type consistently suitable for clumped isotope thermometry

How to cite: Fernandez Bremer, A., Maccali, J., Krüger, Y., and Meckler, A. N.: Evaluating the limits and potential of fluid-calcite δ¹⁸O and Δ₄₇ thermometry in modern speleothems from Borneo, EGU General Assembly 2026, Vienna, Austria, 3–8 May 2026, EGU26-18529, https://doi.org/10.5194/egusphere-egu26-18529, 2026.

EGU26-19071 | ECS | Posters on site | CL1.2.3

Moisture Source Dynamics during the Penultimate Glacial Inception (MIS 7-6) in Northern Vietnam Stalagmite 

Chloe Riviera, Sebastian F M Breitenbach, Annabel Wolf, Jack Longman, Christopher D Standish, Adam B Jost, David McGee, Ryan J Rabett, Pham Sinh Khanh, Anh Duc Trinh, and Vasile Ersek

Marine Isotope Stage 7 (~243-191 ka BP) represents a complex interglacial period characterised by multiple climate substages and gradual orbital forcing changes, culminating in one of the most rapid glacial inceptions of the Pleistocene at the MIS 7-6 transition (~201-187 ka BP). Despite its importance for understanding monsoon responses to glacial inceptions under differing orbital configurations, monsoon dynamics during this interval remain poorly understood due to a paucity of high-resolution paleoclimate records from Southeast Asia. 
We present a multiproxy speleothem record from Boi Cave in northern Vietnam spanning 201-187 ka BP. In contrast to characteristic glacial-interglacial δ¹⁸O shifts observed at other Asian monsoon sites, our record exhibits minimal amplitude change across the MIS 7-6 transition. The δ¹⁸O signal instead preserves sustained high-frequency variability throughout the interval. Trace element geochemistry, however, documents clear local hydroclimate changes, with peak wet conditions at 197 ka and rapid monsoon reorganisation at ~191.4 ka. These hydroclimate changes align with glacial inception timing in other Asian speleothem records and correlate with North Atlantic and Mediterranean records, suggesting hemispheric-scale reorganisation of atmospheric circulation. Modern climate analysis reveals this region receives rainfall from both the Southwest Summer Monsoon and the Northeast Winter Monsoon systems during the soil recharge period, with the balance between moisture sources varying interannually.
We discuss how stable isotope and trace element proxies record different aspects of monsoon dynamics at this site. While trace elements document local infiltration in response to monsoonal rainfall, δ¹⁸O reflects the balance between Indian Ocean and Pacific moisture sources. This distinction arises from Boi Cave's unique geographical position, where both monsoon systems contribute to annual rainfall. This high-resolution reconstruction fills a critical spatiotemporal gap in understanding Southeast Asian monsoon dynamics during the penultimate glacial inception.

How to cite: Riviera, C., Breitenbach, S. F. M., Wolf, A., Longman, J., Standish, C. D., Jost, A. B., McGee, D., Rabett, R. J., Khanh, P. S., Trinh, A. D., and Ersek, V.: Moisture Source Dynamics during the Penultimate Glacial Inception (MIS 7-6) in Northern Vietnam Stalagmite, EGU General Assembly 2026, Vienna, Austria, 3–8 May 2026, EGU26-19071, https://doi.org/10.5194/egusphere-egu26-19071, 2026.

EGU26-19357 | Orals | CL1.2.3

A speleothem record of the Mid-Brunhes Transition from southern Europe 

Russell Drysdale, Timothy Pollard, Gianni Zanchetta, Eleonora Regattieri, Ilaria Isola, John Hellstrom, Jon Woodhead, Xianglei Li, Isabelle Couchoud, Lawrence Edwards, Julien Leger, Adrien Vezinet, Mathieu Däeron, Nele Meckler, Hai Cheng, Christoph Spötl, and Anthony Fallick

Antarctic ice cores and ocean-sediment records preserve evidence for an increase in the amplitude of glacial-interglacial cycles at around 430 ka, known as the Mid-Brunhes Transition (MBT). However, similar evidence from non-polar terrestrial environments is rare, casting some doubt on the global extent of this transition. Here we present a multi-proxy speleothem record from Corchia Cave (Alpi Apuane, Italy) that spans the MBT. It comprises a stacked d18O and d13C time series from multiple stalagmites anchored in time by U-Th and U-Pb ages; and trace element, 87Sr/86Sr, and d18O and d13C profiles from a subaqueous calcite deposit (CD3) that has grown continuously from 970 ka to the present. We anchored the CD3 record to the chronology of a stalagmite stack by synchronisation of their respective d18O and d13C profiles.


CD3 is well suited to this study because it yields a suite of proxies from just a single specimen that covers multiple glacial-interglacial cycles either side of the MBT. In particular, its d13C profile provides a reference for comparing the amplitude of glacial-interglacial temperature changes at Corchia to globally integrated ice-volume (LR04 benthic 18O/16O stack) and greenhouse gas (ice-core CO2 and CH4)time series. The CD3 temperature record builds on a previous trace element study, which revealed that the Mg/Ca in this speleothem is strongly influenced by mineralisation temperature (a proxy for external air temperature at the cave site). This is supported by subsequent clumped-isotope palaeothermometry. We thus developed a continuous palaeotemperature time series for CD3 extending to ~650 ka via a Mg-D47 transfer function.


The temperature profile reveals compelling evidence for a shift in glacial-interglacial amplitude across the MBT. Temperatures during the interglacials of MIS15e, 15a and 13a are lower in Corchia compared to those of MIS11c, 9e, 5e and the Holocene; temperatures during MIS7e and 7c are the exception, only reaching the levels of the pre-MBT interglacials. Minimum glacial temperatures for MIS16 and 14 are warmer in Corchia than those of the subsequent glacial maxima, and the MIS12 and 6 glacials are the coldest of the last 650 kyr. All of these patterns are consistent with existing global ice-volume and greenhouse gas records but provide a rare and important terrestrial perspective. This finding confirms previous assessments that the MBT was global in extent.

How to cite: Drysdale, R., Pollard, T., Zanchetta, G., Regattieri, E., Isola, I., Hellstrom, J., Woodhead, J., Li, X., Couchoud, I., Edwards, L., Leger, J., Vezinet, A., Däeron, M., Meckler, N., Cheng, H., Spötl, C., and Fallick, A.: A speleothem record of the Mid-Brunhes Transition from southern Europe, EGU General Assembly 2026, Vienna, Austria, 3–8 May 2026, EGU26-19357, https://doi.org/10.5194/egusphere-egu26-19357, 2026.

EGU26-20247 | ECS | Posters on site | CL1.2.3

Northern Alpine temperature lapse rates from the mid Holocene and MIS 5 based on speleothem fluid inclusions 

Timon Kipfer, Dominik Fleitmann, Anamaria Häuselmann, Elisa Hofmeister, Frederick Held, Marc Luetscher, Hai Cheng, and Stéphane Affolter

Medium to high elevations in the European Alps may experience enhanced warming in the future (Kotlarski et al., 2023), potentially leading to a decrease of the temperature lapse rate. However, it remains unclear if such elevation dependent warming has happened during previous interglacials. Therefore, reconstructing temperature lapse rate estimates from past warm intervals offer a unique opportunity to investigate if elevation dependent warming has occurred in the past and whether we are to expect such a process in the future.

In order to examine the past temperature lapse rates, we used speleothem samples from caves collected along an altitudinal transect from the Jura mountains to the Swiss Alps. The speleothems contain past drip water that has been preserved in micrometric sized fluid inclusions (0.01 to 0.1 weight %). This drip water corresponds to precipitation water falling above the cave and thus constitutes an excellent archive of past precipitation (Affolter et al., 2025). By combining the stable isotopic compositions of speleothem fluid inclusion waters and calcite, absolute paleotemperatures can be estimated.

Here we present temperature lapse rates of the Northern Alpine region based on speleothem fluid inclusion water from the mid Holocene and the Marine Isotope stage 5 (MIS 5) intervals. Overall, ~140 fluid inclusions samples obtained from 18 stalagmites from 12 caves situated along a transect from the Jura mountains to the Swiss Alps, across elevations ranging from 373 to 1’890 meters.

Preliminary results indicate that very slight elevation dependent warming might have occurred.  However, especially for MIS 5, mountain uplift and erosion may significantly impact the temperature lapse rate as cave elevations have changed over time, increasing uncertainties. The average paleotemperatures show that modern air temperatures are ~1°C to ~1.5°C warmer compared to the mid Holocene.

How to cite: Kipfer, T., Fleitmann, D., Häuselmann, A., Hofmeister, E., Held, F., Luetscher, M., Cheng, H., and Affolter, S.: Northern Alpine temperature lapse rates from the mid Holocene and MIS 5 based on speleothem fluid inclusions, EGU General Assembly 2026, Vienna, Austria, 3–8 May 2026, EGU26-20247, https://doi.org/10.5194/egusphere-egu26-20247, 2026.

EGU26-20339 | ECS | Posters on site | CL1.2.3

Absolute paleotemperature evolution for MIS6 – MIS5 transition and moisture source changes based on Central European stalagmites 

Elisa Hofmeister, Dominik Fleitmann, Anamaria Häuselmann, Hai Cheng, Timon Kipfer, and Stéphane Affolter

Speleothems represent high-resolution continental archives that provide important information about past climate and paleo environmental changes. Their suitability for uranium-thorium dating enables the development of precisely constrained chronologies. Speleothems often contain small amounts of paleo drip water, which was trapped in the stalagmite fabric during the time of formation. The fluid inclusion oxygen (δ18Ofi) and hydrogen (δ2Hfi) coupled to the calcite δ18Ocalcite stable isotopes can be used for the reconstruction of absolute mean annual paleo temperatures. For our study site realm in Switzerland, δ18Ocalcite was often suggested to be interpreted as a temperature signal, at least during warm intervals such as the Holocene. However, δ18Ocalcite patterns are not able to provide absolute temperature estimates and can be controlled by several factors such as precipitation amount, temperature, and moisture source. Decoupling between δ18Ocalcite evolution and temperature signal can be clarified by comparing with an unambiguous temperature record based on a strong chronology and from the same realm. Such temperature records are scarce for the Central European lowland realm. The existing records are essentially based on biogenic proxies, which are summer biased and where dating can be sometimes difficult.

In this study, we present a new absolute mean annual paleotemperature record for the Central European realm based on fluid inclusion stable isotopes from two Milandre caves (Switzerland) stalagmites. As demonstrated in previous studies conducted within this cave, δ2Hfi has been shown to function as a key proxy for the reconstruction of mean annual paleotemperatures for the central European low elevation realm (Affolter et al. 2019). Here we provide temperature snapshots for the glacial – interglacial transition starting at the penultimate glacial maximum (MIS6) with an average temperature of ca. 4°C until the thermal maximum (MIS5). During MIS6 and the following transition, δ18Ocalcite pattern is decoupled from the temperature evolution. In order to shed light on the δ18Ocalcite interpretation, we discuss the evolution of two high resolution δ18Ocalcite pattern measured on the same stalagmites as the temperature snapshots. With the δ18Ocalcite/temperature comparison we suggest that δ18Ocalcite of the Milandre cave does not represent atmospheric temperature fluctuations during the examined time span. Instead, δ18Ocalcite likely provides information about the moisture source and its changes during the glacial period and the following transition.

How to cite: Hofmeister, E., Fleitmann, D., Häuselmann, A., Cheng, H., Kipfer, T., and Affolter, S.: Absolute paleotemperature evolution for MIS6 – MIS5 transition and moisture source changes based on Central European stalagmites, EGU General Assembly 2026, Vienna, Austria, 3–8 May 2026, EGU26-20339, https://doi.org/10.5194/egusphere-egu26-20339, 2026.

EGU26-20349 | ECS | Posters on site | CL1.2.3

Reconstructing coastal eastern African climate from speleothems: Implications for human biogeography 

Benjamin Tiger, Samuel Nicholson, Emmanuel Ndiema, Rahab Kinyanjui, Jeroen van der Lubbe, Gerald Haug, Denis Scholz, Michael Weber, and Hubert Vonhof

There is strong evidence that cyclical changes to Earth’s orbital configuration during the Pleistocene led to the periodic greening of vast areas of the Sahara, East African Rift Valley, and Arabia. The opening of these humid corridors facilitated the dispersal of humans out of eastern Africa into Asia and beyond. However, less is known about what happened under opposite circumstances, when these corridors dried up due to waning orbital forcing. One hypothesis is that human populations sought refuge in eastern Africa’s coastal forests when conditions in the African interior were inhospitable. We test this hypothesis by evaluating the stability of climate in coastal Kenya from our reconstruction vis-à-vis climate in the African interior from previously published work. Speleothem samples collected from limestone quarries near Mombasa and Kilifi provide a novel record of long-term climate change in eastern Africa and offer new insight into human biogeography. Preliminary U-Th age results suggest that these samples grew throughout the last glacial period and possibly during older glacial-interglacial cycles. This sustained growth indicates that eastern African coastal climate was characterized by stable conditions and a positive moisture balance, supporting the refugia hypothesis. To further constrain the climate dynamics governing coastal eastern Africa, temperature and hydroclimate reconstructions are being developed using fluid inclusion and TEX86 analyses.

How to cite: Tiger, B., Nicholson, S., Ndiema, E., Kinyanjui, R., van der Lubbe, J., Haug, G., Scholz, D., Weber, M., and Vonhof, H.: Reconstructing coastal eastern African climate from speleothems: Implications for human biogeography, EGU General Assembly 2026, Vienna, Austria, 3–8 May 2026, EGU26-20349, https://doi.org/10.5194/egusphere-egu26-20349, 2026.

EGU26-20503 | ECS | Posters on site | CL1.2.3

Multi-centennial hydroclimate shifts of Southeastern Brazil hydroclimate in response to North Atlantic cooling events over the past 7,500 years 

Julio Cauhy, Marcela Eduarda Della Libera, Nicolás M. Stríkis, Juan Pablo Bernal, Mathias Vuille, Francisco W. Cruz Junior, R. Lawrence Edwards, Valdir F. Novello, Hubert Vonhof, and Denis Scholz

New high-resolution trace element records combining stalagmites from Southeastern Brazil (SEBRA) evidence persistent multi-centennial shifts in hydroclimate conditions over the past 7,500 years, with wet anomalies associated with North Atlantic cooling events, including Bond events and the Little Ice Age (LIA). Our analysis reveals a coupling between the Bond events and increased South Atlantic Convergence Zone (SACZ) rainfall over SEBRA, with a persistent pattern over the Middle and Late Holocene. The most pronounced wet anomalies in SEBRA are synchronous with these events, and present a coherent structure with other records from the South American Summer Monsoon (SASM) region and the SACZ, and are in antiphase with Southern Brazil (SB) resembling the multi-centennial dipole between SEBRA and SB. This pattern indicates that large-scale reorganizations of the Intertropical Convergence Zone (ITCZ) are induced by North Atlantic cooling and a strengthened SASM/SACZ convection through changes in cross-equatorial heat transport related to a weakening of the AMOC. Furthermore, the interhemispheric antiphase relationship between SEBRA wet anomalies and drying across the Asian monsoon region evidences the global expression of AMOC–ITCZ modulation under North Atlantic cooling events. These findings demonstrate the pronounced response of SEBRA hydroclimate to even modest perturbations in the interhemispheric energy balance, evidencing the sensitivity of the region towards potential impacts under AMOC weakening scenarios.

How to cite: Cauhy, J., Della Libera, M. E., M. Stríkis, N., Bernal, J. P., Vuille, M., W. Cruz Junior, F., Edwards, R. L., F. Novello, V., Vonhof, H., and Scholz, D.: Multi-centennial hydroclimate shifts of Southeastern Brazil hydroclimate in response to North Atlantic cooling events over the past 7,500 years, EGU General Assembly 2026, Vienna, Austria, 3–8 May 2026, EGU26-20503, https://doi.org/10.5194/egusphere-egu26-20503, 2026.

EGU26-20601 | ECS | Posters on site | CL1.2.3

Exploring past environments based on temperature reconstructions from Pliocene Arabian speleothems 

Julian Schröder, Hubert B. Vonhof, Denis Scholz, Anna Nele Meckler, Monika Markowska, Samuel L. Nicholson, Michael Weber, Alfredo Martinez-Garcia, Yves Krüger, Jens Fiebig, and Gerald Haug

The Arabian Desert experienced multiple periods of wetter and greener conditions that sustained human populations and allowed the dispersal of mammal fauna across the Arabian Peninsula. A recently published speleothem-based paleoclimate reconstruction of central Arabia extends the record of such recurrent short-lasting humid periods over at least the past 8 million years. Here, we applied multiple recently developed paleothermometers to this late Miocene to late Pleistocene speleothem record: Fluid inclusion stable isotopes, microthermometry and dual-clumped isotopes. The data indicate that in the late Miocene and Pliocene, wetter episodes in central Arabia were up to ~4 °C warmer than current Mean Annual Air Temperature (MAAT). These temperature estimates imply that potential evapotranspiration was significantly higher during the late Miocene and Pliocene than during the late Pleistocene. From these temperature estimates, we calculated Pliocene potential evapotranspiration and estimated precipitation amounts for the humid periods in central Arabia. All the evidence from the speleothems combined (temperature, precipitation, δ¹³C values) suggests that over the past 8 million years, the wetter phases in central Arabia typically led to savanna-like environments.

Modern climate data show that our study area has already reached Pliocene MAATs in recent years due to anthropogenic warming. The concomitant drying trend in modern settings indicates that higher temperatures are not the key factor in creating wetter conditions on the Arabian Peninsula. Previously proposed orbital control on the incursion of monsoonal moisture from the south into the Arabian Peninsula remains the most important driver of humidity during these past humid periods. In the modern orbital configuration, monsoonal moisture advection is displaced to the south, and increasing temperatures will likely lead to increased potential evaporation and aridity in central Arabia.

How to cite: Schröder, J., Vonhof, H. B., Scholz, D., Meckler, A. N., Markowska, M., Nicholson, S. L., Weber, M., Martinez-Garcia, A., Krüger, Y., Fiebig, J., and Haug, G.: Exploring past environments based on temperature reconstructions from Pliocene Arabian speleothems, EGU General Assembly 2026, Vienna, Austria, 3–8 May 2026, EGU26-20601, https://doi.org/10.5194/egusphere-egu26-20601, 2026.

EGU26-20606 | ECS | Posters on site | CL1.2.3

450,000 Years of Climate Variability: A Speleothem Composite from the Northern European Alps 

Alexandre Honiat, Jonathan Baker, Charlotte Honiat, Marc Luetscher, Gina Moseley, Jens Fohlmeister, and Christoph Spötl

Understanding continental climates across multiple glacial-interglacial cycles remains fundamentally limited by the scarcity of continuous, high-resolution terrestrial archives. During glacial periods, many terrestrial records are interrupted by prolonged depositional hiatuses. Although Greenland ice cores provide exceptional high-resolution records, they reach back only about 128,000 years, leaving earlier key climate intervals poorly constrained. Here, we present a composite record of subglacial speleothems from the European Alps spanning nearly half a million years (0-450 ka BP), providing a quasi-continuous, high-resolution record of continental climate variability supported by well-constrained chronologies.

Alpine and subglacial speleothems offer a unique paleoclimate window because they record both interglacial warmth during conventional growth phases and glacial conditions during deposition beneath ice cover, thereby capturing the full range of Quaternary climate states within a single archive type. Our Alpine composite reveals coherent oxygen isotope patterns across multiple cave systems and elevational gradients, reflecting regional-scale changes in temperature, precipitation, and moisture sources over five glacial-interglacial cycles.

Millennial-scale variability persists throughout the entire 450,000-year record, suggesting that rapid climate oscillations—often considered characteristic of the last glacial cycle—are instead a persistent feature of Quaternary glaciation dynamics. Orbital-scale forcing is clearly expressed across all cycles, albeit with notable deviations from the hemispheric trend. Most critically, beyond 250 ka BP, Alpine climate dynamics increasingly decoupled from global ice-volume signals while showing a strengthened coherence with global greenhouse gas concentrations.

Based on 37 speleothem records from 10 caves, this composite demonstrates that alpine and subglacial speleothems represent a transformative but underutilized terrestrial climate archive. Their ability to bridge the temporal gap between ice-core and marine records, combined with sub-millennial resolution and exceptional chronological control, opens new possibilities for reconstructing and understanding terrestrial climate evolution across extended Quaternary timescales.

How to cite: Honiat, A., Baker, J., Honiat, C., Luetscher, M., Moseley, G., Fohlmeister, J., and Spötl, C.: 450,000 Years of Climate Variability: A Speleothem Composite from the Northern European Alps, EGU General Assembly 2026, Vienna, Austria, 3–8 May 2026, EGU26-20606, https://doi.org/10.5194/egusphere-egu26-20606, 2026.

EGU26-20937 | Posters on site | CL1.2.3

Tropical South American temperature responses to rapid high-latitude climate shifts since the last deglaciation 

Marcela Eduarda Della Libera, Julio Cauhy, Valdir Novello, Angela Ampuero, Francisco W. Cruz Junior, Nicolás Stríkis, Alfredo Martínez-García, Hubert Vonhof, and Denis Scholz

Reconstructing past temperature variations is essential for understanding climate systems and improve projections for future climate changes. In central-east South America, modern warming has been shown to progress faster than global average. Nonetheless, paleotemperature records remain sparse in central South America, which limits our ability to evaluate the response of this region to rapid shifts in global forcings, such as during the deglacial period. Studies show that temperature evolution during the deglaciation was characterized by high-latitude rapid warming episodes associated with major reorganizations of the Atlantic Meridional Overturning Circulation (AMOC), which led to perturbations in inter-hemispheric heat distribution. Yet, how these perturbations affect temperatures in tropical South America and the thermal evolution of this region is still largely unknown. Here we present a new 15k-year paleotemperature reconstruction from a precisely dated speleothem collected in central-eastern Brazil. The temperature record is based on the glycerol dialkyl glycerol tetraether (GDGT) paleothermometer, revealing a total of 6.1°C±0.81 (2std = 0.81°C) of temperature shifts over the last 15k years. Our findings provide evidence of a non-linear temperature increase since the last deglaciation with abrupt warming and cooling events in response to high-latitude forcings, shifts in South Atlantic sea-surface temperatures (SSTs), and increases in atmospheric CO2. Finally, we present a temperature gradient within central-east Brazil and show how paleoclimate models might underestimate rapid temperature changes.

How to cite: Della Libera, M. E., Cauhy, J., Novello, V., Ampuero, A., Cruz Junior, F. W., Stríkis, N., Martínez-García, A., Vonhof, H., and Scholz, D.: Tropical South American temperature responses to rapid high-latitude climate shifts since the last deglaciation, EGU General Assembly 2026, Vienna, Austria, 3–8 May 2026, EGU26-20937, https://doi.org/10.5194/egusphere-egu26-20937, 2026.

EGU26-20944 | ECS | Posters on site | CL1.2.3

Multi-proxy temperature records from a northern Borneo stalagmite reveal sample-specific challenges 

Hao Ding, Yves Krüger, Jenny Maccali, Alfredo Martínez-García, Leonardo Pasqualetto, and Anna Nele Meckler

Over the last decades, several new methods for quantitative paleo-temperature reconstructions with stalagmites have emerged, further enhancing the value of these powerful paleoclimate archives. Among these innovative stalagmite-based thermometers, fluid inclusion microthermometry (Krüger et al., 2011) is often regarded as the most precise and accurate method (Meckler et al., 2015), but its applicability is restricted to formation temperatures > 10 °C, specific calcite fabrics, and abundant fluid inclusions of appropriate size. Fortunately, other temperature proxies have been proposed that each have different strengths and weaknesses, allowing us to compensate for the limitations of individual methods. Many of them, including fluid inclusion water isotopes and TEX86, are still under active development, with substantial uncertainties remaining in their interpretation (e.g., Affolter et al., 2025; Baker et al., 2019). Applying multiple temperature proxies to the same stalagmite allows a direct comparison of proxy behavior, providing improved constraints on the reconstructed paleoclimate variability.


In this study, we reconstruct tropical temperature using stalagmite GC08 from northern Borneo, which spans multiple glacial cycles. Here we investigate the oldest part from approximately MIS 14 to MIS 11 (ca. 570 ka to 360 ka), which covers the Mid-Brunhes Transition (MBT; Yin, 2013) at the end of MIS 12. The MBT marks a fundamental change in the climate system with a significant increase in the amplitude of the glacial-interglacial cycles observed in various climatic archives (e.g., Barth et al., 2018). We use three different temperature proxies for the reconstruction: fluid inclusion microthermometry, fluid inclusion water isotopes, and TEX86. Our records reveal notably different temperature trends among the three proxies. Both fluid inclusion microthermometry and TEX86 indicate surprisingly little temperature change across the study interval. We note that the fabric is not ideal for fluid inclusion microthermometry, as large intervals are characterized by biogenic influence and/or diagenesis, which limit the applicability and accuracy of the method. TEX86 seems to be influenced by soil-derived compounds in part of the stalagmite. Fluid inclusion water isotopes appear to be affected by large evaporation or other fractionating effects, as indicated in a cross-plot of oxygen and hydrogen isotopes. Correction attempts do not yield realistic temperatures, with an unrealistically large amplitude of 20 °C. These findings highlight the limitations of individual stalagmite-based paleo-thermometers and emphasize the critical role of depositional context in their interpretation. We therefore call for caution when interpreting single-proxy temperature evidence in the absence of constraints on in-cave processes in future stalagmite-based paleo-temperature studies.

How to cite: Ding, H., Krüger, Y., Maccali, J., Martínez-García, A., Pasqualetto, L., and Meckler, A. N.: Multi-proxy temperature records from a northern Borneo stalagmite reveal sample-specific challenges, EGU General Assembly 2026, Vienna, Austria, 3–8 May 2026, EGU26-20944, https://doi.org/10.5194/egusphere-egu26-20944, 2026.

EGU26-21458 | Orals | CL1.2.3

Reconstructing Fire, Vegetation, and Climate Variability over the Last ~1800 Years from a High-Resolution Speleothem Record in the Central Balkans 

Nicolò Ardenghi, Andrea Columbu, Giovanni Zanchetta, Monica Bini, Nicole DeSantis, Ilaria Isola, Eleonora Regattieri, Chuan-Chou Shen, John Hellstrom, Russell Drysdale, Ivica Milevski, and Elena Argiriadis

Understanding long-term interactions between fire activity, vegetation dynamics, and climate variability is essential for contextualizing recent environmental change in the Mediterranean/Balkan region. Speleothems represent a promising yet still underutilized archive for paleofire reconstructions, offering robust chronologies and the integration of multiple environmental proxies within a single, continuous terrestrial record.

Here we present biomarker results from a 220 mm long speleothem from Golubarnica Cave (North Macedonia), spanning approximately the last 1800 years. The record is continuous and constrained by U-Th dating, and combines polycyclic aromatic hydrocarbons (PAHs) as indicators of fire activity with n-alkanes reflecting vegetation composition and terrigenous organic matter inputs. Individual sampled layers integrate on average ~30 years, with both integration windows and temporal spacing ranging from sub-annual to multi-centennial scales, allowing the identification of long-term trends and abrupt shifts in fire-related molecular assemblages. This speleothem forms part of the PROMETHEUS project, which investigates fire-climate-ecosystem interactions using speleothem-based multi-proxy approaches.

The PAH record reveals multi-centennial phases of fire activity broadly corresponding to major late-Holocene climatic intervals. Low and relatively stable PAH concentrations characterize the early part of the record (approximately 2nd-6th centuries CE), indicative of a background fire regime. Fire activity increases during the Medieval Climate Anomaly, peaks in the 12th-13th centuries CE, and declines abruptly toward the end of the 13th century, marking the onset of a prolonged phase of reduced fire activity broadly consistent with cooler

conditions during the Little Ice Age. Fire-related signals increase again from the late 16th century onward toward the present. While primarily interpreted in terms of hydroclimatic variability, potential contributions from medieval socio-environmental changes and land-use practices cannot be excluded.

Throughout the record, PAH variability closely mirrors speleothem δ¹⁸O, indicating a persistent hydroclimatic control on regional fire regimes. The main fire maximum is chemically distinct, dominated by an extreme increase in retene (up to two orders of magnitude above background levels) and accompanied by pronounced increases in higher-molecular-weight PAHs, suggesting a major shift in fuel type and/or fire intensity involving resin-rich woody biomass rather than a simple increase in fire frequency. Low-resolution n-alkane data show a synchronous response during this event, including a temporary increase in total n-alkanes, a minimum in average chain length, and a subsequent increase in carbon preference index, pointing to short-lived changes in vegetation-derived organic matter inputs and/or preservation.

Overall, this study highlights the potential of high-resolution speleothem hydrocarbon records to capture multi-decadal to centennial variability in fire regimes and associated environmental processes, identifying hydroclimate as a primary driver of fire activity in the central Balkans during the late Holocene.

How to cite: Ardenghi, N., Columbu, A., Zanchetta, G., Bini, M., DeSantis, N., Isola, I., Regattieri, E., Shen, C.-C., Hellstrom, J., Drysdale, R., Milevski, I., and Argiriadis, E.: Reconstructing Fire, Vegetation, and Climate Variability over the Last ~1800 Years from a High-Resolution Speleothem Record in the Central Balkans, EGU General Assembly 2026, Vienna, Austria, 3–8 May 2026, EGU26-21458, https://doi.org/10.5194/egusphere-egu26-21458, 2026.

EGU26-21838 | Posters on site | CL1.2.3

Spatial behaviour of water isotopes in past global precipitation recorded in speleothem fluid inclusions 

Stéphane Affolter, Timon Kipfer, Elisa Hofmeister, Martin Werner, and Dominik Fleitmann

Recovering liquid water from past precipitation on continental areas from mid- to low-latitude and analysing its water isotopes presents significant challenges. Paleoclimate archives such as groundwater, ice or speleothems provide direct access to paleowaters. Most of the paleoclimate reconstructions linked to past precipitation water isotopes are not directly based on analysis of paleo liquid water. They are measured, for instance, on carbonate, sediment or cellulose, all of which primarily derive from precipitation water, yet remain influenced by various fractionation processes during their formation.

Speleothems are advantageous as they can be found in all karstic regions of the Earth, at every latitude and on every continent. They contain fluid inclusions that encapsulated fossil drip water, corresponding to a mixture of precipitation water that fell above the cave area approximately at the time the inclusions were formed. It therefore constitutes thus a unique window into the past hydroclimate cycle for mid- to low latitude. Having better access to paleowater at lower latitudes than those of polar regions allows us to gather global information and understand the behaviour of past meteoric water.

Using published and novel speleothem fluid inclusion data from ~140 caves, we investigate the global behaviour of water isotopes in the past. We explore the spatial distribution of paleoprecipitation, construct a global meteoric water line and develop paleo-isotopic lapse rates for the Holocene and Pleistocene. Furthermore, we compare the speleothem data with observational stable isotope data and two model simulations, i.e. the AWI-ESM-wiso and the ECHAM6-wiso simulations.

How to cite: Affolter, S., Kipfer, T., Hofmeister, E., Werner, M., and Fleitmann, D.: Spatial behaviour of water isotopes in past global precipitation recorded in speleothem fluid inclusions, EGU General Assembly 2026, Vienna, Austria, 3–8 May 2026, EGU26-21838, https://doi.org/10.5194/egusphere-egu26-21838, 2026.

Many proxies reveal that the low-latitude precipitation varies at a periodic of ∼23 ka, which is governed by precessional forcing. Classical theory proposed that precession-induced increased summer insolation in the Northern Hemisphere (perihelion) corresponds to decreased summer insolation in the Southern Hemisphere (aphelion), hence, controlling the inter-hemisphere temperature contrast and driving the meridional shift of the ITCZ. Accordingly, the low-latitude precipitations are expected to be in-phase (for the Northern Hemisphere) or anti-phase (for the Southern Hemisphere) with the Northern Hemisphere summer insolation. However, in the past two decades, collective proxies showed that the low-latitude precipitation follows very different rhythms, very often out-of-phase with hemispheric summer insolation. For example, the Eastern Asian precipitation evolutes resembling the Northern Hemisphere summer insolation, whereas the Malaysian precipitation correlates the variations in October insolation. The mechanism driving this phenomenon has puzzled the paleoclimate community for more than two decades, however, remains elusive. In this study, by combining theoretical analysis, numerical simulations, and geological records, we proposed a new hypothesis, suggesting that the precession regulates the low-latitude precipitation by altering the latitude of perihelion. The “latitude of perihelion” is defined as the latitude of overhead Sun at the time of perihelion. We demonstrated that wherever (the latitude) and whenever (the season) perihelion occurs, the incoming solar radiation at the corresponding latitude reaches its maximum, driving the strongest land-sea temperature contrast and regional precipitation over land in the corresponding season. The perihelion occurs towards different latitudes and in different seasons depending on the precessional phase. Therefore, the precipitation at different latitudes naturally follow different rhythms.

How to cite: Yang, H.: Precession of the Earth's rotation axis drives naturally asynchronous precipitation variation at low-latitudes, EGU General Assembly 2026, Vienna, Austria, 3–8 May 2026, EGU26-21886, https://doi.org/10.5194/egusphere-egu26-21886, 2026.

The end-Guadalupian (Middle Permian) mass extinction represents a pivotal yet enigmatic event in Earth's history. Its drivers, often attributed to the emplacement of the Emeishan Large Igneous Province, are intensely debated, with proposed mechanisms ranging from volcanic outgassing to sea-level fluctuations and widespread marine anoxia. However, a critical lack of high-resolution, multi-proxy records from key paleo-tropical regions has hindered a unified model. This study presents a fully integrated dataset combining field sedimentology, microfacies analysis, and a comprehensive suite of major, trace, and rare earth element geochemistry from the Wordian carbonates of the Salt Range, Pakistan, a classic Neotethyan margin. Our data reveal a pronounced transgressive systems tract, marked by a shift from peritidal cycles to deeper-water carbonates. Crucially, geochemical proxies (e.g., Sr/Ca, Mn/Sr) confirm this sea-level rise was accompanied by a shift in oceanic chemical budgets. More significantly, we identify a pre-extinction perturbation in redox-sensitive trace elements (e.g., V/Cr, U/Th, Mo enrichment) and nutrient tracers (P, Ba), indicating a trend towards deoxygenation and increased nutrient loading in the Tethyan ocean during the Wordian. We interpret this coupled sedimentological-geochemical signal as a direct record of eustatic rise-driven oceanographic stagnation. The transgression likely flooded vast continental shelves, enhancing organic matter burial and fostering the development of stratified, anoxic water masses on a near-global scale. The synchronicity of this event with the onset of Emeishan volcanism suggests a powerful feedback mechanism: sea-level rise created the environmental context in which the effects of volcanism (e.g., nutrient runoff, greenhouse warming) were dramatically amplified. By providing a high-resolution record from the Tethyan gateway, this research places the Wordian of the Salt Range as a vital recorder of pre-extinction environmental deterioration. Our findings demonstrate that the stage for the end-Guadalupian catastrophe was set several million years earlier by oceanographic upheaval, forcing a re-evaluation of the extinction's triggers and providing a critical ancient analogue for modern sea-level rise and ocean deoxygenation.

How to cite: Wadood, B.: Pre-Extinction Stress in the Salt Range: Wordian Eustasy and its Role in the End-Guadalupian Crisis, EGU General Assembly 2026, Vienna, Austria, 3–8 May 2026, EGU26-546, https://doi.org/10.5194/egusphere-egu26-546, 2026.

On the modern Earth, oxidative weathering of continental crust constitutes the dominant source of most nutrient elements to the ocean that ultimately sustains the biosphere over geological timescales. However, continental crust exposed above sealevel may have been scarce on the early Earth, and oxidation was limited prior to the rise of atmospheric O2 at ca. 2.4-2.3 billion years ago (Ga). Several experimental and modelling studies have therefore suggested that anoxic seafloor weathering and hydrothermal alteration provided the major sources of bioessential elements such as phosphate and transition metals. Here, these datasets are reviewed, and new supportive evidence is presented from the Paleoarchean North Star and Mount Ada basalts (3.5-3.47 Ga) in the Pilbara craton, Western Australia. Alteration gradients reveal depletion in key nutrients, supporting the idea that this process contributed to sustaining microbial ecosystems at that time. Direct evidence of a Paleoarchean seafloor biosphere is preserved in the form of microbialites found in an offshore marine setting with no evidence of felsic material influx. Collectively, these findings show that life could be maintained on an ocean-dominated planet; however, continental emergence was perhaps important for biological diversification and innovation over the later course of Earth’s history.

How to cite: Stüeken, E.: Exploring seafloor alteration as a viable mechanism to sustain Earth’s earliest biosphere, EGU General Assembly 2026, Vienna, Austria, 3–8 May 2026, EGU26-2631, https://doi.org/10.5194/egusphere-egu26-2631, 2026.

EGU26-2702 | Posters on site | CL4.16

 Banded Iron Formations as archives for ca. 3.5 Ga old marine environments: Insights from REE and Hf-Nd isotope signatures 

Sebastian Viehmann, Johanna Krayer, Jaganmoy Jodder, Josua Pakulla, Carsten Münker, Axel Hofmann, Toni Schulz, Christian Koeberl, and Stefan Weyer

Banded Iron Formations (BIFs) are authigenic marine sedimentary rocks that record the composition of Precambrian seawater and provide key insights into early marine environments. The Paleoarchean Algoma-type Tomka BIF from the Daitari Greenstone Belt (India) is considered to be ~3.37–3.50 Ga old and to have experienced only greenschist-facies metamorphism, in contrast to many Eo- to Paleoarchean BIFs that were metamorphosed under much higher amphibolite-facies conditions. Despite this relatively low metamorphic overprint, the potential of the Tomka BIF as a reliable archive of ancient seawater chemistry has not yet been evaluated. Still, this location may be crucial to better understand the evolution of Palaeoarchean marine habitats and their interactions with early landmasses and the atmosphere.

To better constrain both the depositional age and the paleoenvironmental conditions of the Tomka BIF, we analysed major and trace element abundances together with radiogenic Hf–Nd isotope compositions of individual Fe- and Si-rich BIF layers, as well as an associated shale. Tomka BIF samples lacking detrital contamination and post-depositional alteration display typical Archean, shale-normalised seawater-like rare earth and yttrium (REYSN​) patterns. These include positive LaSN, EuSN​, and GdSN​ anomalies, superchondritic Y/Ho ratios, the absence of negative CeSN​ anomalies, and enrichment of heavy relative to light REYSN​. Collectively, these signatures indicate deposition in an anoxic marine environment influenced by high-temperature submarine hydrothermal activity.

BIF samples preserving pristine Hf–Nd isotope compositions define coherent trends along the 176Lu–176Hf and 147Sm–143Nd reference isochrons corresponding to the inferred depositional age of 3.37–3.50 Ga. Initial εNd values (+0.1 to +5.3) indicate a juvenile source contribution to Tomka seawater, while the associated shale (εNd = -0.3 to +1.1) reflects a similarly juvenile provenance for the detrital component. In contrast, initial εHf​ values of the BIFs (-4.8 to +145) are strongly decoupled from the Nd isotope system and from the so-called terrestrial array, which reflects the coupled behaviour of Hf-Nd in magmatic systems. A Hf-Nd isotope decoupling in low-temperature systems, however, is related to incongruent Hf weathering, as described by the so-called zircon effect. Applied to the Daitari BIFs, this decoupling likely reflects the emergence and weathering of a zircon-bearing crust in the proto-Singhbhum Craton, which influenced Archean seawater chemistry by at least 3.37 Ga.

How to cite: Viehmann, S., Krayer, J., Jodder, J., Pakulla, J., Münker, C., Hofmann, A., Schulz, T., Koeberl, C., and Weyer, S.:  Banded Iron Formations as archives for ca. 3.5 Ga old marine environments: Insights from REE and Hf-Nd isotope signatures, EGU General Assembly 2026, Vienna, Austria, 3–8 May 2026, EGU26-2702, https://doi.org/10.5194/egusphere-egu26-2702, 2026.

EGU26-2744 | ECS | Posters on site | CL4.16

A reconstruction of Lower Danube-Black Sea climate history. First insights from novel loess-paleosol sequences. 

Andrew Trott, Daniel Veres, Diana Jordanova, and Guido Wiesenberg

Loess–paleosol sequences (LPS) constitute continuous terrestrial archives of Quaternary climate change, recording both local environmental conditions and large-scale atmospheric dynamics. While LPS have been extensively studied worldwide, those of the Lower Danube–Black Sea (LDBS) region of Romania and Bulgaria remain comparatively underexplored. Situated at the nexus of Mediterranean, central European, and continental western Asian air masses, the LDBS region offers a unique opportunity to investigate large-scale climate shifts and their associated environmental responses.

The LOEs-CLIMBE project, funded by the Swiss National Science Foundation (SNSF) through the Multilateral Academic Projects (MAPS) scheme with support from the Romanian (UEFSCDI) and Bulgarian funding agencies, addresses this gap through a high-resolution, multi-proxy investigation of two key LPS sites: Urluia (Romania) and Kolobar (Bulgaria). Spanning the last ~800 ka, with particular focus on the Mid-Brunhes Event onwards (MBE), the project integrates elemental composition, stable isotope records, and molecular biomarkers within a newly established chronological framework. These proxies support reconstructions of vegetation dynamics, climate variability, and pedogenic processes across multiple glacial–interglacial cycles.

Here, we present preliminary results from both LPS. The site at Urluia, located in southeastern Romania, is a former quarry exposing a >20 m thick, continuous LPS. The sequence comprises multiple complex palaeosols (S1–S5), interpreted as interglacial soils, interbedded with massive loess units deposited during glacial periods.

Near the village of Kolobar, situated in northeastern Bulgaria and distal from both the Danube and the Black Sea, is an active quarry. Here, a ~25 m thick LPS is exposed with ~1.1 m of modern soil on top. Approximately seven major palaeosols (S1–S7) extend back to ~800 ka. Field observations identify a marked stratigraphic shift at S4, from thick loess units with thin palaeosols above to massive palaeosols with thinner loess below. This transition coincides with an increase in bulk density from ~1.41 to 1.61 g cm⁻³ and is interpreted as the onset of the MBE, a transition not represented at Urluia. Carbonate precipitation is observed in all palaeosols above the S7, while loess dolls occur in the L1 and L2. Bioturbation, including crotovinas from mammals and earthworm burrows as well as root traces, is widespread throughout the whole sequence. However, this is present at different depths in different assemblages. Altogether, these field observations argue for an apparent grass steppe vegetation with fluctuating populations of burrowing organisms throughout the last 800 ka, while hydrological and sedimentary conditions have changed considerably between periods with predominant loess sedimentation and stronger soil formation. We will present these first findings and support them with elemental and stable isotope composition alongside organic matter composition gained from infrared spectroscopy measurements.

How to cite: Trott, A., Veres, D., Jordanova, D., and Wiesenberg, G.: A reconstruction of Lower Danube-Black Sea climate history. First insights from novel loess-paleosol sequences., EGU General Assembly 2026, Vienna, Austria, 3–8 May 2026, EGU26-2744, https://doi.org/10.5194/egusphere-egu26-2744, 2026.

EGU26-3482 | Orals | CL4.16

Water-Induced Mantle Overturns Leading to the Oxidation of Archean Upper Mantle 

Zhongqing Wu, Xing Deng, and Jian Song

As a consequence of the evolution of the water-bearing basal magma ocean (MO), water-induced mantle overturn can well account for many puzzling observations in the early Earth, such as the formation of the Archean continents, the Archean–Proterozoic boundary, and high Archean paleomagnetic field (Wu et al., 2023; Wang and Wu 2026). The early Earth may have experienced a deep-water cycle totally different from the current. High pressure studies suggest that the whole-mantle MO evolved into an outer MO and a basal MO. With the solidification, water in the basal MO moved toward the core-mantle boundary and the basal MO eventually became gravitationally unstable because of the enrichment of water (Fig.1). The instability triggered the massive mantle overturns and resulted in the major pulses of the thick SCLM and continental crust generations in the Neoarchean. The mantle overturns eventually got rid of the whole basal MO and the mechanism which generated the Archean-type SCLM and continents likely no more worked after the overturns. Thus, water-induced mantle overturns can account for why Archean-type SCLM and continents basically occurred in the Archean (Wu et al., 2023). The mantle overturn can substantially accelerate the cooling of the core and strengthen the geomagnetic field, which explains well the high paleointensity records from ~3.5–2.5 Ga (Wang and Wu 2026).

Besides the enrichment of water, the basal MO was enriched with ferric iron. This study shows that the ascent of ferric-rich basal MO and its mixing with the upper mantle could account for the observed shift in the redox state of the upper mantle during the Archean. Both the redox state shift and the generation of Archean continents result from these mantle overturns. Therefore, it is expected that the shift in mantle fO2 aligns with the timing of continental generation, which is supported by the observations. The mantle overturns are rare with age > ~ 3.6 Ga, but their frequency increases with age < ~3.6 Ga and reaches the maximum in the Neoarchean. The combined effects of the ascent of the deep oxidized material, the emergence of continents, and oxygenic photosynthesis generated the broader First Redox Revolution of the Earth system, ultimately initiating the GOE shortly after the end of the Archean.


Wu, Z., Song, J., Zhao, G., and Pan, Z. (2023). Water-induced mantle overturns leading to the origins of Archean continents and subcontinental lithospheric mantle. Geophysical Research Letters, 50, e2023GL105178. https://doi.org/10.1029/2023GL105178

Wu, Z., and Wang, D. (2026) Water-Induced Mantle Overturn Explains High Archean Paleointensities. National Science Review. https://doi.org/10.1093/nsr/nwaf578

Figure 1. Schematic illustration of the water-induced mantle overturns (superplumes). The waterdrop is used to describe the hydrous silicate melts although hydrogen mainly exists as hydroxyls in silicate melts. (a) The solidification of a whole mantle magma ocean (MO) at the mid mantle forms an outer MO and a basal MO. (b) The basal MO eventually becomes gravity unstable and generates mantle overturns because of the enrichment of water

How to cite: Wu, Z., Deng, X., and Song, J.: Water-Induced Mantle Overturns Leading to the Oxidation of Archean Upper Mantle, EGU General Assembly 2026, Vienna, Austria, 3–8 May 2026, EGU26-3482, https://doi.org/10.5194/egusphere-egu26-3482, 2026.

EGU26-5038 | ECS | Posters on site | CL4.16

Paleoenvironmental and Paleoclimate Changes in the Gulf of Edremit (Northern Aegean Sea) during the Holocene based on Sedimentological and Geochemical Multi-Proxy Records 

Zeynep Duru Vurmuş, İrem Erol, Demet Biltekin, Kürşad Kadir Eriş, Hakan Atabay, Eren Özsu, Ömer Faruk Çiftbudak, Leyla Gamze Tolun, Onur Akyol, Süheyla Kanbur, Beyza Ustaoğlu, Derya Evrim Koç, Gülsen Uçarkuş, and Georg Johannes Schwamborn

Understanding the dynamics between past global climate events and their impact on marine ecosystems and paleoclimate is essential for the estimation of potential future changes. Accordingly, sedimentary archives accumulating on the seafloor provide crucial information on climate-driven environmental variability during the late Quaternary. Sediment cores were taken from the Gulf of Edremit, which is located in the northern Aegean Sea. We aimed to provide a preliminary, multi-proxy parameters, including sedimentological and geochemical records during the Holocene. During the marine survey with the R/V TÜBİTAK MARMARA Research Vessel, three sediment cores (E-01, E-02, and E-03A) obtained from different water depths across the gulf were investigated. Lithological observations from all cores indicate a sedimentation pattern dominated by fine-grained clay- and silt-sized deposits. However, locally occurring black laminae and FeS bands reflect depositional conditions sensitive to variations in bottom-water oxygenation. Fluctuations in the density and magnetic susceptibility measured by MSCL further support variability in sediment input and depositional processes at the sea floor. TOC data from core E-02 (at a water depth of 86 m) show low values (0.8–1.0 wt%) in the lower part, indicating low productivity and/or poor preservation of organic matter. TOC then rises to ~1.0–1.5 wt% further up the core, suggesting improved productivity or preservation. The highest values (1.5–2.0 wt%) in the uppermost 0–10 cm may reflect the presence of sapropelic material. XRF data from core E-03A reveal a Sr/Ca peak at 40–50 cm, which indicates increased salinity during drier periods. At 140–150 cm, the Sr/Ca ratio decreases while the Ca/Ti ratio increases, suggesting enhanced carbonate deposition relative to detrital input. In core E-01, a Mn/Fe peak at 10–15 cm reflects changes in redox and oxygen conditions. There is strong variability in Ca/Ti and Sr/Ca at 45–50 cm: higher Sr/Ca above this depth indicates greater carbonate production, while lower Ca/Ti implies reduced clastic input. Below 65 cm, falling Sr/Ca and rising Ca/Ti suggest diminished carbonate production and a return to lithogenic dominance. As a conclusion, sedimentation in the Gulf of Edremit appears to be highly sensitive to climate and carbon cycle changes.

This study was granted and supported by the TÜBİTAK (The Scientific and Technological Research Council of Türkiye) with Project number 123Y108.

Keywords: Gulf of Edremit, Holocene, multi-proxy analysis, TOC, XRF.

How to cite: Vurmuş, Z. D., Erol, İ., Biltekin, D., Eriş, K. K., Atabay, H., Özsu, E., Çiftbudak, Ö. F., Tolun, L. G., Akyol, O., Kanbur, S., Ustaoğlu, B., Koç, D. E., Uçarkuş, G., and Schwamborn, G. J.: Paleoenvironmental and Paleoclimate Changes in the Gulf of Edremit (Northern Aegean Sea) during the Holocene based on Sedimentological and Geochemical Multi-Proxy Records, EGU General Assembly 2026, Vienna, Austria, 3–8 May 2026, EGU26-5038, https://doi.org/10.5194/egusphere-egu26-5038, 2026.

EGU26-5153 | ECS | Posters on site | CL4.16

Tracking phosphorus redox speciation in microbial carbonates through Earth’s history and beyond 

Marialina Tsinidis and Eva Stueeken

Phosphorous availability is required for biological productivity, nutrient cycling and oxygenation. Over recent years, reduced phosphorous (phosphite) has moved into focus as a potentially new proxy that can provide information about environmental conditions and biogeochemical cycles in deep time. Phosphite can be generated by a range of biological and abiotic processes, but its distribution and implications are so far poorly understood.

To address this knowledge gap, we investigated phosphate and phosphite concentrations in stromatolites spanning from the Archean to the modern. Stromatolites are among the oldest life forms found on Earth, preserved in the fossil record, dating back to 3500 million years ago. They are formed in shallow water, mostly by the metabolic activity of a diverse microbial ecosystem. They are composed of carbonate minerals, which can trap both phosphate and phosphite in their crystal lattice. 

We measured phosphorus speciation with Ion Chromatography and Inductively coupled plasma mass spectrometry. The data reveal that carbonate-associated phosphate and phosphite date back to the early Precambrian, presenting the first record of phosphite in carbonate rocks of low metamorphic grade. The phosphite may be of biogenic origin, but also non-biological sources such as meteorite impacts, hydrothermal activity or weathering of high-grade metamorphic rocks are plausible. These abiotic sources could potentially be more important on Mars, whose mantle has a lower oxygen fugacity, and where impact debris is well-preserved near the surface. Our study reveals that carbonate records can be used to reconstruct the history of phosphorus redox speciation on Earth and perhaps early Mars.


How to cite: Tsinidis, M. and Stueeken, E.: Tracking phosphorus redox speciation in microbial carbonates through Earth’s history and beyond, EGU General Assembly 2026, Vienna, Austria, 3–8 May 2026, EGU26-5153, https://doi.org/10.5194/egusphere-egu26-5153, 2026.

EGU26-5244 | Posters on site | CL4.16

Stable isotope composition of precipitation and temperature seasonal distribution from the South Carpathians: insights for climate variations in the interval 2012 to 2025 

Ana-Voica Bojar, Stanisław Chmiel, Hans-Peter Bojar, Andrzej Pelc, and Florin Vaida

Isotope distribution in precipitation along with climate monitoring data such as amount of precipitation, temperature and relative humidity were collected from a region characterized by a high continentality index, region situated in the external sector of the Southern Carpathians. Stable isotope composition of hydrogen and oxygen in precipitation were collected monthly from 2012 to 2025, with climate monitoring measured automatically each 30 minutes. The isotope and temperature signals were split in two groups including October to April and May to September, variations over an interval of 14 years being statistical presented. For the intervals considered, the LMWL show the effect of secondary evaporation of falling raindrops with lower slope for the warm season. The data support significant relationships between d18O and d D values and average air temperatures with r2 = 0.7, n = 150. Deuterium excess values over the year are compatible with seasonal variations for the origin of moisture, with high values during wintertime, possible resulting from the input of seasonal related Mediterranean moisture during November to February. The strong seasonal distribution of precipitation amount combined with elevated temperature peaks during July have a strong impact on the clastic multi-layered aquifers situated in the Lower Quaternary deposits, driving during the last years to complete evaporation of the highest aquifer.

How to cite: Bojar, A.-V., Chmiel, S., Bojar, H.-P., Pelc, A., and Vaida, F.: Stable isotope composition of precipitation and temperature seasonal distribution from the South Carpathians: insights for climate variations in the interval 2012 to 2025, EGU General Assembly 2026, Vienna, Austria, 3–8 May 2026, EGU26-5244, https://doi.org/10.5194/egusphere-egu26-5244, 2026.

EGU26-7126 | ECS | Orals | CL4.16

Reconstructing marine redox conditions during the Toarcian Oceanic Anoxic Event constrained by combined U-Mo isotopes in black shales 

Viona Klamt, François-Nicolas Krencker, Thomas Mann, Andreas Kaufmann, Gernot Arp, Bas van de Schootbrugge, Sebastian Viehmann, and Stefan Weyer

Oceanic anoxic events represent major perturbations of marine redox conditions with varying spatial extents of ocean deoxygenation through Earth’s history. The isotopic composition of redox-sensitive elements, preserved in sedimentary archives, particularly molybdenum (Mo) and uranium (U) isotopes, are powerful proxies for reconstructing past ocean oxygenation. However, Mo and U isotope compositions can be influenced by both global ocean anoxia and local depositional conditions. Both isotope systems show opposite isotope fractionation behavior under variable local redox conditions but are expected to be shifted in the same direction (towards lower values) at a global expansion of seafloor anoxia, allowing combined U-Mo isotope analyses to discriminate between local and global redox signals. The Toarcian Oceanic Anoxic Event (T-OAE; ~183 Ma) represents an Early Jurassic interval of marine deoxygenation and environmental perturbation, but it remains incompletely understood whether ocean anoxia was globally extensive or locally restricted.

Here, we present combined U-Mo isotope data from black shales deposited during and after the T-OAE at two locations within the European Epicontinental Sea (Schandelah, North German Basin, and Metzingen, South German Basin). During the T-OAE, all sections are characterized by light Mo and U isotope compositions, reaching values as low as 0.61-0.73 ‰ for δ⁹⁸Mo and -0.19 to -0.13 ‰ for δ²³⁸U. Following the T-OAE, both isotope systems show an increase towards heavier δ⁹⁸Mo values between 1.66 and 1.73 ‰ and δ²³⁸U values between 0.12 and 0.19 ‰ across both sites. This observed positive correlation between Mo and U isotope compositions is consistent with a global expansion of seafloor anoxia. To further exclude potential local effects, we used redox- and salinity-sensitive proxies, such as Fe/Al, Sr/Ba, B/Ga, and TS/TOC ratios. These proxies show no significant variations across the T-OAE interval and beyond, indicating stable depositional conditions at both localities. Therefore, the U-Mo isotope shifts in the black shales likely reflect a global expansion of seafloor anoxia during the T-OAE.

How to cite: Klamt, V., Krencker, F.-N., Mann, T., Kaufmann, A., Arp, G., van de Schootbrugge, B., Viehmann, S., and Weyer, S.: Reconstructing marine redox conditions during the Toarcian Oceanic Anoxic Event constrained by combined U-Mo isotopes in black shales, EGU General Assembly 2026, Vienna, Austria, 3–8 May 2026, EGU26-7126, https://doi.org/10.5194/egusphere-egu26-7126, 2026.

EGU26-7400 | Orals | CL4.16

Reconstructing climate dynamics on terrestrial environment using the stable isotope composition of earthworm calcite granule: An experimental approach 

Charlotte Prud homme, Thomas Rigaudier, Apolline Auclerc, and Mathieu Daëron

Reconstructing past climate dynamics on terrestrial environment remains a major challenge in paleoclimate research. Improving our understanding of how continental ecosystems responded to abrupt climate oscillations is essential for assessing future climate impacts on terrestrial environments and human societies. While ice-core and marine archives document large-scale and rapid climate variability, the links between climate and continental surface processes remain poorly constrained. Identifying robust climate proxies in continental sedimentary records is therefore crucial.

Fossil earthworm calcite granules preserved in loess–paleosol sequences have recently emerged as promising archives of past climate conditions, providing insights into temperature and precipitation during the last glacial period in Western Europe. However, the climatic interpretation of these proxies requires a robust calibration based on modern earthworm calcite granules to better constrain the environmental and biological parameters controlling granule formation, such as temperature, soil moisture, and litter composition.

Here, we present an experimental calibration approach using modern earthworms (Lumbricus terrestris) reared under controlled environmental conditions. Soil temperature and food sources were systematically varied to assess their influence on granule production and isotopic signatures. Calcite granules were analysed for δ¹⁸O and δ¹³C, while δ¹³C was also measured in soil organic matter and litter. For the first time, clumped isotope (Δ₄₇) measurements were performed on earthworm calcite granules, allowing direct temperature estimates independent of past soil-water δ¹⁸O.

This experimental approach provides new constraints on vital effects and isotopic fractionation in earthworm calcite granules and improves their use as quantitative paleoclimate proxies. Our results complement previously established empirical relationships between (i) the oxygen isotopic composition of meteoric water, granules, and temperature, and (ii) the δ¹³C of litter and the δ¹³C of granules, strengthening the potential of earthworm calcite granules for reconstructing past terrestrial climate dynamics.

How to cite: Prud homme, C., Rigaudier, T., Auclerc, A., and Daëron, M.: Reconstructing climate dynamics on terrestrial environment using the stable isotope composition of earthworm calcite granule: An experimental approach, EGU General Assembly 2026, Vienna, Austria, 3–8 May 2026, EGU26-7400, https://doi.org/10.5194/egusphere-egu26-7400, 2026.

EGU26-7765 | Orals | CL4.16

 A regional scale data–model comparison of modern oxygen stable isotopes in precipitation (Swabian Alb, southwest Germany)  

Armelle Ballian, Muriel Racky, Markus Maisch, Valdir Novello, Desirée Lo Triglia, and Kira Rehfeld

The analysis of isotopic composition (δ18O and δ2H) in precipitation is a powerful approach for investigating (paleo)climatic processes within the hydrological cycle. Variations in δ18O and δ2H in precipitation result from successive isotopic fractionation processes during atmospheric transport and are observed across both spatial and temporal scales. While modern isotopic records are extensively documented, e.g., through the IAEA/WMO network, European datasets are largely limited to monthly resolution and remain sparse at the regional scale. This is particularly the case for the Swabian Alb (or Swabian Jura) in southwestern Germany, a karst plateau south of Stuttgart, approximately 220 km long and 40 km wide, with mean elevations around 500 m and peaks reaching 1110 m. The Swabian Alb holds international significance as a UNESCO Global Geopark and includes six caves designated as UNESCO World Heritage sites. The region constitutes a natural divide between two significant European basins: the Rhine and the Danube. The oxygen isotopic composition of meteoric water from the Swabian Alb provides key insights into modern moisture sources and, when preserved in paleoclimate archives such as speleothems, offers valuable information on past atmospheric circulation and hydroclimate.

Here, we compare measured δ18O and δ2H in meteoric water with simulations of isotope-enabled climate model (ECHAM6-wiso) to investigate spatial and temporal variabilities, and identify climatic factors influencing regional isotopic patterns. We present δ18O and δ2H records of weekly to monthly sampled rainwater across the Swabian Alb from October 2023 to present-day. We examine simulated and observed interannual changes in precipitation, teleconnections, and seasonality patterns. In addition, we fill a gap by providing daily δ18O and δ2H values of meteoric water collected at a weather station located in Tübingen.

Investigating variations in modern water isotope records across the Swabian Alb is essential for regional paleoclimate research and allows the validation of isotope-enabled climate models on the local scale. Our results show the first model–data comparison for the Swabian Alb and pave the way towards regional climatic reconstructions e.g., paleoclimate of the last glacial period, when modern humans occupied caves of the Swabian Alb.

How to cite: Ballian, A., Racky, M., Maisch, M., Novello, V., Lo Triglia, D., and Rehfeld, K.:  A regional scale data–model comparison of modern oxygen stable isotopes in precipitation (Swabian Alb, southwest Germany) , EGU General Assembly 2026, Vienna, Austria, 3–8 May 2026, EGU26-7765, https://doi.org/10.5194/egusphere-egu26-7765, 2026.

EGU26-7870 | ECS | Posters on site | CL4.16

A not so tranquil basin: recording of the west-European geodynamics amidst marine incursions and retreats in the Paris Basin. 

Mathilde Beernaert, Laurence Le Callonnec, Fabrice Minoletti, Hugues Bauer, and Florence Quesnel

Around the Late Priabonian-Early Rupelian, the Paris Basin is characterized by an incomplete succession of sediments deposited at the marine-continent interface. In the overall marine record, this interval is marked by the Eocene-Oligocene Transition (EOT), characterized by a climate deterioration and a significant sea level drop, associated with the permanent establishment of the Antarctic ice cap. Nevertheless, the EOT is poorly documented and understood in terrestrial areas.

Located between the active tectonic regions of the Pyrenean and Alpine orogens and the West-European Cenozoic Rift Systems, the lagoon to lacustrine deposits of the Paris Basin therefore enable to acutely record both global and local processes (glacio-eustasy, climate, tectonic). A detailed stratigraphic framework is consequently necessary to estimate the contribution of each of these controls. This study is based on: 1) a large-scale correlation of boreholes in order to study the 3D organization of deposits and their lateral and vertical variations, and 2) an elementary and isotopic geochemical, mineralogical, and paleontological study to clarify the depositional environments and the causes of the observed variations (sea level, tectonic and hydrological changes). The analyzed sites are located around tectonic structures (the Bray, Beynes-Meudon, and Remarde anticlines and the Saint-Denis syncline) and in various areas, ranging from the edges to the center of the Paris Basin.

We established a correlation between lagoon-marine deposits of the center of the basin and lacustrine deposits of its southern and eastern edges. Detailed sedimentological studies of the sites reveal a two-steps evolution. The first step is marked by marls deposited during the latest Priabonian. Their mineralogical and chemical composition indicates a deposition evolving from a clastic to a chemical-dominated system in a wetter to drier climate. The second step, during Early Rupelian times, shows the return to detrital deposition in a wetter climate. More specifically, the sections show a mineralogical, chemical and environmental separations. The Priabonian cycle is influenced by sea level variations (marine incursion, then confinement of the basin) and a climate changing from wetter to drier. The Rupelian cycle shows a global transgression in a wetter climate, briefly interrupted by a confinement of the basin, but above all the reactivation of tectonic structures linked to the Pyrenean compression, which caused palustrine deposits on the anticlines and marine deposits in the synclines.

The Paris Basin shows to a lesser extent the same record of the EOT as several marine sites. The major regression is only illustrated by the confinement and partial emersion of the basin in the latest Priabonian; the cooling seems to be recorded by the progressive increase in oxygen isotope values, and the aridification by mineralogical proxies and the known floral evolution. The basin also reflects the west-European regional geodynamics with the recurrence of tectonic structures in the Early Rupelian associated with the African-Eurasian convergence, illustrated for instance as well by the inversion of the Cotentin and Hampshire basins, further north of the Paris Basin. 

How to cite: Beernaert, M., Le Callonnec, L., Minoletti, F., Bauer, H., and Quesnel, F.: A not so tranquil basin: recording of the west-European geodynamics amidst marine incursions and retreats in the Paris Basin., EGU General Assembly 2026, Vienna, Austria, 3–8 May 2026, EGU26-7870, https://doi.org/10.5194/egusphere-egu26-7870, 2026.

EGU26-10177 | Posters on site | CL4.16

Carbon isotope excursions during the Oxfordian: multi-proxy constraints on carbon cycle dynamics 

François-Nicolas Krencker, Johanna Hansen, Malte Rudolph, Simon Andrieu, Martin Blumenberg, Thomas Mann, and Ulrich Heimhofer

The Oxfordian interval is characterized by a long-term (~6 Myr) increase in carbon isotope values, punctuated by several short-lived (<1 Myr) positive carbon isotope excursions (CIEs) occurring in the lower Oxfordian, and in the middle Oxfordian. These excursions have only been recognized in a limited number of sections and their spatial extent, stratigraphic reproducibility, and paleoenvironmental significance remain poorly constrained, and their potential relationship to oceanic anoxic events (OAEs) remains uncertain.

Here, we present a high-resolution, multi-proxy chemostratigraphic dataset from shallow-marine Oxfordian successions of northwestern Europe, integrating inorganic and organic carbon isotopes (δ13Cinorg and δ13Corg), palynofacies analysis, and Rock-Eval pyrolysis. The dataset combines subsurface data from the Konrad #101 borehole (southeastern Lower Saxony Basin, northern Germany) with new outcrop data from the northern Paris Basin (Normandy, France). Both successions are constrained by robust biostratigraphic frameworks, enabling detailed intra- and interbasinal correlations.

Our results reveal pronounced and reproducible carbon isotope trends, including a ~3.0‰ positive CIE recorded in both δ13Cinorg and δ13Corg within the lower to middle Oxfordian interval. Comparison with available records from Europe, western Asia, and the Gulf of Mexico suggests that these excursions may reflect regionally synchronous perturbations of the exogenic carbon cycle, although the degree of global synchronicity remains equivocal. The integration of geochemical and palynofacies data provides new insights into the paleoenvironmental context of these events by demonstrating that the observed carbon isotope fluctuations are not driven by changes in organic matter preservation or mixing of organic matter sources (e.g., marine versus terrestrial inputs). This multi-proxy approach allows a critical assessment of whether Oxfordian CIEs constitute robust chemostratigraphic markers and whether they can be plausibly linked to episodes of widespread marine oxygen depletion.

How to cite: Krencker, F.-N., Hansen, J., Rudolph, M., Andrieu, S., Blumenberg, M., Mann, T., and Heimhofer, U.: Carbon isotope excursions during the Oxfordian: multi-proxy constraints on carbon cycle dynamics, EGU General Assembly 2026, Vienna, Austria, 3–8 May 2026, EGU26-10177, https://doi.org/10.5194/egusphere-egu26-10177, 2026.

EGU26-10242 | Orals | CL4.16

Ultra-low background gamma-ray spectrometry, SEM-EDX and XRD investigation of a fragment of the Mundrabilla (Australia) iron meteorite. Rare cosmogenic 26Al and 60Co radioisotopes evidenced 

Delia-Georgeta Dumitras, Cristiana Radulescu, Romul Mircea Margineanu, Calin Ricman, Ana-Maria Blebea-Apostu, Claudia Gomoiu, Ioana-Daniela Dulama, Claudia Stihi, Ion-Alin Bucurica, Octavian G. Duliu, Stefan Marincea, and Doina Smaranda Sirbu-Radaseanu

The Mundrabilla meteorite can be classified as a medium octahedrite nickel-iron type, the kamacite being the dominant mineral. The meteorite was discovered in 1911 in Mundrabilla (Australia), the most important fragments weighing between 3.5 kg and 24 tons.

To get more information concerning the structure and composition of a 1.5 kg fragment of the Mundrabilla meteorite existing in the collection of the National Geological Museum, Bucharest, a small fragment was extracted using a water jet cutter. More analytic techniques, such as XRD, SEM-EDX, and ultra-low background gamma ray spectrometry, were used to analyse it.

A detailed investigation performed by XRD evidenced the presence of the α-FeNi phase, identified as kamacite. Its crystal chemical formula, calculated based on SEM-EDX analysis, was Fe0.937Ni0.063. The cell parameters of kamacite, as determined by least squares refinement of the X-ray powder data, are: a = 2.8717(7) Å and V = 23.68 Å3. On the diffraction pattern, minor peaks were observed, which could be attributed to γ-FeNi taenite.

The geochemical composition determined by SEM-EDX investigation is typical of iron-bearing meteorites. XRD indicates as main phase kamacite, but traces of other elements reflect the presence of other minor mineral phases. The presence of quite abundant C and minor Si fits with the presence as minor phases of moissanite (SiC) and cohenite (Fe,Ni)3C. The S content could be related to traces of troilite (FeS) or pyrrhotite (Fe1-xS), while the presence of minor P could be attributed to rhabdite (Fe, Ni)P.

The gamma-ray spectroscopy performed in the ultra-low background laboratory at the Slanic (Prahova) salt mine evidenced the presence of 26Al and 60Co, two cosmogenic radionuclides produced by cosmic neutrons through the spallation of 28Si or resulting from the β-decay of 60Fe, which is also generated by the neutron activation of the stable 28Fe. Both 26Al and 60Fe are long-lived isotopes with half-life times of 0.747 and 2.62 My, respectively, which explain their presence in meteorites.

How to cite: Dumitras, D.-G., Radulescu, C., Margineanu, R. M., Ricman, C., Blebea-Apostu, A.-M., Gomoiu, C., Dulama, I.-D., Stihi, C., Bucurica, I.-A., Duliu, O. G., Marincea, S., and Sirbu-Radaseanu, D. S.: Ultra-low background gamma-ray spectrometry, SEM-EDX and XRD investigation of a fragment of the Mundrabilla (Australia) iron meteorite. Rare cosmogenic 26Al and 60Co radioisotopes evidenced, EGU General Assembly 2026, Vienna, Austria, 3–8 May 2026, EGU26-10242, https://doi.org/10.5194/egusphere-egu26-10242, 2026.

Lead (Pb) and its isotopes are known to be released incongruently during early chemical weathering in continental settings. Incongruent weathering implies that a chemical weathering induced continental runoff trace metal isotope signature is not identical to bulk rock isotopic compositions. The incongruent release of Pb can mostly be ascribed to preferential chemical weathering of less weathering resistant accessory uranium and thorium-rich mineral phases present that are most abundant in differentiated continental crust. If this continental crust is ancient, these accessory mineral phases contain present-day Pb isotopic signatures that are in places extremely radiogenic, as well as substantially different from bulk rock Pb isotopic compositions. Several studies that investigated the Pb isotopic runoff evolution in the Labrador Sea, NW Atlantic and Arctic Beaufort Sea already reported very radiogenic Pb isotopic runoff signatures in these marine basins bordering the Laurentide Ice Sheet (LIS) during key time intervals of the last deglaciation. These earlier results require the existence of very radiogenic Pb isotopic freshwater signatures inland North America that were generated during incipient post-glacial chemical weathering reactions in response to the retreat of the LIS during the last deglaciation.

We targeted subarctic Lake Melville in central Labrador aiming to resolve how the Pb specific chemical weathering signature changed in response to deglacial warming, in an initially subglacial setting that transitioned to completely ice-free conditions in the early Holocene. Lake Melville is a fjord‑like subarctic estuary in central Labrador that receives most of its freshwater and sediment from the Churchill River and other major tributaries draining a large early to mid-Proterozoic shield. We analysed two sediment cores from central Lake Melville that together archived the ambient dissolved Pb isotope signature over the past 13 ka. Our authigenic Pb isotope records are complemented by associated bulk detrital Pb isotope compositions, enabling us to compare the dissolved Pb isotope signature in the lake with corresponding sedimentary signatures. The lake was covered by the LIS until about 10.3 ka BP, yet still located in an ice-proximal setting until 8.5 ka BP. The region Labrador-Québec was ice free after ca. 5.7 ka BP.

The most striking result of our record is the observation of (i) very radiogenic authigenic Pb isotope compositions throughout that are (ii) much elevated relative to the associated detrital compositions, which are rather unradiogenic. Very invariant Pb isotopic signatures observed until 10.5 ka BP confirm the suggested subglacial lacustrine sedimentary setting in the oldest section. The subsequent deglaciation witnessed most variable compositions, with most radiogenic compositions seen at ~8.2 ka BP. The record becomes substantially smoother after ~6 ka BP when the catchment area was no longer influenced by direct glacial runoff. While the detrital compositions suggest some geographic variability in sediment sourcing, the authigenic Pb isotopic compositions are not following these detrital signatures. Our results highlight the unique geological setting that make authigenic Pb isotopes in proximal North American sediment cores a sensitive proxy for for the detection of elevated deglacial runoff fluxes in circum-North American marine basins.   

How to cite: Gutjahr, M., Thomsen, S., Hallmaier, M., Gebhardt, C., and Ohlendorf, C.: Continental runoff lead isotopic signatures released during incongruent chemical weathering in subarctic Lake Melville associated with the retreat of the Laurentide Ice Sheet over the past 14 ka, EGU General Assembly 2026, Vienna, Austria, 3–8 May 2026, EGU26-10274, https://doi.org/10.5194/egusphere-egu26-10274, 2026.

This presentation examines recent developments in the application of oxygen stable isotope analyses to lacustrine invertebrate remains (e.g. chironomids) within palaeoenvironmental science. We explore improvements to instrumentation and measurement, and the opportunities that this presents for a more nuanced palaeoenvironmental approach. The improvements to the existing methodology of δ18Ochitin measurements now allow the possibility of taxon specific δ18Ochitin reconstructions and thus the potential to enhance our understanding of paleoclimate dynamics. Opportunities to reduce the sample size required have come from improvements to instrumentation, through more sensitive Thermal Conversion Elemental Analyser isotope ratio mass spectrometry (TC/EA-IRMS). We discuss the considerations needed to assess the sample size measured and avoid systematic bias. Is smallest always best or does this lead to a biased environmental reconstruction? Further, it is also unclear what between-taxa offsets exist for different chironomid morphotypes and whether δ18Ochitin offsets between taxa are stationary across large climate transitions, and the extent to which changing vital effects play a role. We present new data on taxon-specific trends from the robustly dated late-glacial sediment record from Lake Llangorse, UK. This will allow us to determine whether temperature is the main driver of the δ18Ochitin signal of each taxon, or if vital effects play a role.

How to cite: Lamb, A. and Engels, S.: Stable isotope analyses of lacustrine chitinous invertebrate remains: analytical advances, challenges and potential., EGU General Assembly 2026, Vienna, Austria, 3–8 May 2026, EGU26-10452, https://doi.org/10.5194/egusphere-egu26-10452, 2026.

EGU26-11051 | ECS | Posters on site | CL4.16

An evaluation of phases in banded iron formation of the 3.25 Ga Fig Tree Group (Barberton Greenstone Belt) suitable as a seawater archive  

Vanessa Winkler, Johanna Krayer, Axel Hofmann, Stefan Weyer, and Sebastian Viehmann

Banded iron formations (BIFs) are authigenic marine sedimentary rocks that formed in Precambrian oceans. They may record the chemical composition of the ambient seawater and are thus important archives for reconstructing ancient marine environments. The ca. 3.25 Ga Algoma-type BIF of the Fig Tree Group in the Barberton Greenstone Belt, South Africa, provides insights into the Palaeoarchaean marine environments and seawater chemistry during the early development of the Kaapvaal Craton [1,2]. However, it remains incompletely understood, which mineral phases within this BIF most reliably preserve primary seawater-derived signatures and therefore represent the most suitable archives for palaeo-environmental reconstructions.

We present trace and major element concentrations of 28 individual layers of Fig Tree Group BIF. These layers are dominated by either magnetite, chert, or siderite. In addition, mudstones intercalated with BIF were also analysed. All samples originate from the BARB 4 drill core and were digested using HF–HNO₃–HCl digestion combined with ICP-MS and OES analyses to investigate the geochemical composition of the different mineral phases and their reliability as archive for ancient seawater chemistry.

Immobile element (Zr, Th) concentrations are in the ppb to ppm level range and vary over four orders of magnitude between the BIF samples. Samples with the highest immobile element concentrations show non-seawater-like shale-normalised (subscript SN) rare earth element and yttrium (REY) patterns and a positive correlation of REY and immobile element concentrations (e.g. Zr), in indicating detrital contamination. However, cherts and five of the magnetite samples with the lowest immobile element concentrations show typical Archaean seawater-like signatures with positive LaSN GdSN, and YSN anomalies as well as a depletion of light REY relative to heavy REYSN, indicating a seawater-derived origin. Positive EuSN anomalies indicate contributions of high-temperature hydrothermal fluids. The lack of negative CeSN anomalies indicates anoxic depositional conditions with respect to the Ce3+-Ce4+ redox couple. The chert layers, however, show Th/U fractionation compared to the value of the continental crust, suggesting redox-dependent uranium mobilization, indicative of slightly oxic conditions.

We identified chert and magnetite, if devoid of detrital contamination, to be the most suitable phases in Fig Tree Group BIF for obtaining information to reconstruct their depositional environment. The remaining layers, on the contrary, do not reflect pure seawater precipitates and have to be excluded for interpretations regarding ancient seawater chemistry.


[1] Hofmann, 2005, Precambrian Res. 143, 23-49

[2] Satkoski et al., 2015, EPSL 430, 43-53

How to cite: Winkler, V., Krayer, J., Hofmann, A., Weyer, S., and Viehmann, S.: An evaluation of phases in banded iron formation of the 3.25 Ga Fig Tree Group (Barberton Greenstone Belt) suitable as a seawater archive , EGU General Assembly 2026, Vienna, Austria, 3–8 May 2026, EGU26-11051, https://doi.org/10.5194/egusphere-egu26-11051, 2026.

EGU26-11598 | ECS | Posters on site | CL4.16

Investigating the controlling factors of nucleoside bacteriohopanepolyol abundances in soils 

Olga Novik, Stefan Schouten, Yufei Chen, Melissa Berke, Gerd Gleixner, Helen Mackay, Marcel van der Meer, Ellen Hopmans, and Darci Rush

There is a growing need within the paleoclimate community for robust soil paleoproxies capable of reconstructing past terrestrial environments with high precision. Existing proxies for past mean annual air temperature (MAT), such as branched GDGTs (1) and chironomids (2), suffer from large uncertainties (i.e., ≥ 4°C error on these land temperature reconstructions), which limit their applicability.

Bacteriohopanepolyols (BHPs) are pentacyclic triterpenoid membrane lipids produced by bacteria that are ubiquitous in terrestrial and aquatic environments (3). Functionalized BHPs have a large structural diversity both in the rings and head groups. They have been detected in sedimentary archives extending back 1.2 Myr (4), underscoring their considerable potential as tools for reconstructing past climatic conditions.

BHPs with nucleoside (adenosyl and inosyl) head groups (Nu-BHPs) have been widely used as indicators of terrestrial organic matter input into marine systems (Rsoil) (5). Recently, a large range of previously unknown Nu-BHPs were identified thanks to a newly developed method using Ultra High Performance Liquid Chromatography – high resolution Orbitrap Mass Spectrometry (6). The relative abundances of several Nu-BHPs found in Alaskan soils were shown to correlate with pH and temperature and thus are potential paleotemperature proxies (7). To validate these correlations on a global scale, we present Nu-BHP abundances analyzed across 89 globally distributed surface soil samples. These include soils previously used to calibrate branched GDGTs (1), as well as soils from Northern Norway and Finland and Brazil, to complete coverage from the Arctic to the tropics. Complementary analyses included six soil environmental variables (pH, latitude, total organic carbon (TOC), C/N, δ¹³C, δ¹⁵N) and four climate parameters (mean annual and warmest quarter air temperature, obtained from CHELSA climatological data (8), annual and wettest quarter precipitation, retrieved from the Copernicus Climate Change Service (9)).

Forty-eight Nu-BHPs were identified in soils with a pH range of 3.3-8.1 and total organic carbon (TOC) range of 0.2 and 48.4%. The most dominant compound in the dataset is adenosylhopane with 0 methylations. Of the forty-eight Nu-BHPs, thirty compounds were present in trace amounts (less than 1% of total relative abundances). The remaining eighteen Nu-BHPs were further used to investigate climatic controls on Nu-BHP abundances.

This showed that only a few Nu-BHPs showed a good correlation with pH (R2 ~0.65), while temperature did not appear to influence Nu-BHP distributions. Non-metric multidimensional scaling analysis was conducted on relative abundance of these eighteen Nu-BHPs, along with the soil environmental variables and climate parameters (Fig. 1).  This revealed that none of the measured parameters measured fully explains the variability in Nu-BHP distributions. We hypothesize that the main control factors instead are related to nutrient availability and/or bacterial community diversity. Future work includes investigating these variables using samples with strong nutrient and pH gradients; and known bacterial community abundances.

 References

  • Weijers et al., 2007.
  • Brooks et al., 2001. 
  • Cooke et al., 2009. 
  • Zhu et al., 2011.
  • Talbot et al., 2014. 
  • Hopmans et al., 2021. 
  • O’Connor, 2025. 
  • Krager et al., 2017. 
  • Dorigo et al., Copernicus Climate Change Service (C3S) Climate Data Store (CDS).

How to cite: Novik, O., Schouten, S., Chen, Y., Berke, M., Gleixner, G., Mackay, H., van der Meer, M., Hopmans, E., and Rush, D.: Investigating the controlling factors of nucleoside bacteriohopanepolyol abundances in soils, EGU General Assembly 2026, Vienna, Austria, 3–8 May 2026, EGU26-11598, https://doi.org/10.5194/egusphere-egu26-11598, 2026.

EGU26-12194 | Posters on site | CL4.16

Effect of pH and temperature on oxygen and carbon isotope fractionation during ACC transformation to crystalline carbonates. 

Aurélie Pace, Michael Pettauer, Martin Dietzel, Gerald Auer, and Maria P. Asta

Carbonates are widely used as paleoenvironmental archives because they record past environmental conditions through their chemical and isotopic signatures. However, primary crystallization processes and subsequent diagenetic alterations can modify these signatures, potentially affecting their reliability as paleoenvironmental proxies.


This study investigates isotopic changes during the precipitation of amorphous calcium carbonate (ACC) into crystalline CaCO₃ under variable pH and temperature (T) conditions, in order to better constrain the role of ACC in calcification processes and its influence on the final isotopic composition of the crystalline carbonate polymorphs. ACC was synthesized by automated titration of an equimolar CaCl₂ solution into NaHCO₃ (+NaOH) solutions. A first set of experiments was conducted over a pH range of 8–11 and at temperatures of 10, 20, and 30 °C. A second set was performed at pH 8 and T of 10, 20, and 30 °C in the presence of polyaspartic acid (pASP) to simulate biomineralization effects on ACC metastability and its transformation to crystalline CaCO3 polymorphs. Precipitates were characterized using scanning electron microscopy, Fourier-transform infrared spectroscopy, X-ray diffraction and in-situ Raman; oxygen and carbon isotope ratios were measured by isotope-ratio mass spectrometry.

The onset of vaterite precipitation from ACC occurs rapidly at all investigated pH and T conditions, with transformation times less than 1 min. In the presence of pASP, ACC is stabilized and crystalline phase precipitation is delayed to 5 min. The transformation of ACC into calcite is strongly T dependent, with shorter transformation time periods at higher T for all pH conditions. Spherulitic ACC size is strongly controlled by pH and T, decreasing from ~0.25 µm at pH 8 and 10 °C to ~0.10 µm at pH 11 and 30 °C.


For all investigated temperatures and pH conditions, oxygen isotope values of the initial ACC (e.g. at 10 °C and pH 8: δ¹8OVPDB = –4.94 ‰) decrease during CaCO₃ precipitation, reaching lower values in the resulting calcite (e.g. δ¹8OVPDB = –6.10 ‰), with values systematically decreasing with increasing T and pH. In contrast, carbon isotope values are comparatively more constant, showing only limited differences between ACC and crystalline phases (e.g. at 10 °C and pH 8, δ¹³CVPDB= –3.99 ‰ for ACC and –4.95 ‰ for calcite). This relative stability reflects the weaker temperature dependence of carbon isotope fractionation and the dominant control exerted by pH on dissolved inorganic carbon (DIC) speciation, sensitive to pH variations.

Oxygen and carbon isotope equilibrium between carbonate phases and the initial reactive water is variably approached depending on pH, T, and mineral phase. At high pH (≥10) and elevated T, isotopic equilibrium is not reached for ACC and the resulting crystalline phases due to rapid precipitation and transformation kinetics that limit isotope exchange with the aqueous phase. Lower pH and moderate T favor closer approach to equilibrium, whereas low water/solid ratios and the presence of pASP promote isotopic disequilibrium by limiting recrystallization-driven exchange.

These results highlight the potential for kinetically controlled isotopic signatures in carbonates formed via amorphous precursors, with implications for paleoenvironmental interpretations.

How to cite: Pace, A., Pettauer, M., Dietzel, M., Auer, G., and Asta, M. P.: Effect of pH and temperature on oxygen and carbon isotope fractionation during ACC transformation to crystalline carbonates., EGU General Assembly 2026, Vienna, Austria, 3–8 May 2026, EGU26-12194, https://doi.org/10.5194/egusphere-egu26-12194, 2026.

Constraining the weathering history of the British Isles in the Cenozoic is limited by the sparse distribution of terrestrial rock units of appropriate age.  This has prompted many workers to rely on examination of the regional marine record to make inferences about terrestrial weathering and climate in this era.  We have begun a project to date supergene mineral deposits across the region to provide direct temporal information about the timing and extent of weathering processes.  We show first results of dating with the 40Ar/39Ar technique on cryptomelane (KMn8O16) from Scotland, suggesting a late Miocene age.  A full sample suite from across Great Britain and Ireland is currently being analysed.

In addition to dating of cryptomelane and other Hollandite group minerals, the NEIF argon isotope laboratory at SUERC has developed the capability of dating difficult hydrous sulphate minerals alunite and jarosite that occur across the region and will be the subject of future weathering studies. Sample preparation remains a challenging aspect of dating supergene minerals.  This is because of the fine-grained nature of the material coupled with the intergrowth of potentially complicating phases such as clay, feldspar or quartz.  HF leaching of materials to remove silicate impurities have shown promise, suggesting a reduction in the budget of trapped atmospheric argon, and reproducible ages have been obtained for samples as young as Pleistocene.  Attempts at micro-sampling, for example, growth layers in cryptomelane using microdrill techniques, have met with limited success.  Future work will look at laser micro-sampling coupled with high precision and high sensitivity 40Ar/39Ar analysis on the next-generation THERMO ARGUS VI mass spectrometer.

How to cite: Barfod, D. and Pickersgill, A.: Progress on supergene mineral dating utilising the 40Ar/39Ar technique and terrestrial weathering in Great Britain & Ireland, EGU General Assembly 2026, Vienna, Austria, 3–8 May 2026, EGU26-12719, https://doi.org/10.5194/egusphere-egu26-12719, 2026.

EGU26-14831 | Orals | CL4.16

Evidence and significance of the oldest Paleoarchean to Mesoproterozoic evaporites 

Barbara Kremer and Maciej Bąbel

Evaporites are rarely recorded in the Precambrian. In the oldest rocks they are known mostly from pseudomorphs of salt minerals, or can be inferred from other sedimentary and geochemical features. Only in some younger rocks are they present as salt minerals.

About 50 inferred or definitive occurrences of evaporites in Archean through Mesoproterozoic rocks were compiled. These data allow characterisation of the mineralogy and sedimentary environments of the earliest evaporite sediments and insight into their evolution over time.

The earliest documented evaporites are from the Archean eon, with about 15 occurring mostly in the Paleoarchean (3.6–3.2 Ga) and Neoarchean era (2.8–2.5 Ga). 

The earliest Paleoarchean deposits considered as „evaporitic” in origin are bottom-grown barite crystals, formerly interpreted as pseudomorphs after gypsum, and silica pseudomorphs after radiating splays of aragonite in North Pool Chert of the Dresser Formation (3.48 Ga old), Australia. Barite and aragonite presumably crystallized in a volcanic caldera evaporitic basin from brine of both hydrothermal and seawater derivation. However barite, unlike aragonite, cannot be classified as an evaporite mineral due its very low solubility. The other Palaeoarchean evaporites are represented mostly by enigmatic pseudomorphs (after possible gypsum, aragonite, nahcolite, halite, and others). The Archean evaporite crystals are interpreted as precipitated in both marine and non-marine environments, including soils or weathering zones where they could represent terrestrial or pedogenic evaporites.

In the Proterozoic eon the most frequent occurrences are from the Paleoproterozoic (Rhyacyan, Orosirian and Statherian; 2.3–1.6 Ga). Their appearance directly follows the beginning of the Great Oxidation Event in Siderian at about 2.4 Ga. The first abundant evaporites, with mineralogy similar to the present-day marine evaporites (carbonates, Ca-sulphates, halite, and KMg sulphates), appear in the Mesoproterozoic and include several saline giants (evaporites with volume ≥ 1000 km3). The oldest ones are: a) 2.31 Ga old Gordon Lake Formation, Canada, and Kona Dolomite, USA, b) ca 2.0 Ga old Tulomozero Formation, Onega Basin, Karelian craton, Russia (with preserved KMg salts), c) 2.1 Ga old Juderina Formation, Yilgarn craton, Australia. They strongly suggest appearance of marine water very similar to the modern ocean water.

Information about evaporite minerals from the Archean era is uncertain and ambiguous, coming from enigmatic pseudomorphs and geochemical signals. This evidence originates from sedimentary environments that are not widely recognised, including marine, terrestrial, hydrothermal and/or lacustrine environments. Such evidence does not provide a basis for unambiguously characterising the composition of Archean seawater.

How to cite: Kremer, B. and Bąbel, M.: Evidence and significance of the oldest Paleoarchean to Mesoproterozoic evaporites, EGU General Assembly 2026, Vienna, Austria, 3–8 May 2026, EGU26-14831, https://doi.org/10.5194/egusphere-egu26-14831, 2026.

EGU26-16562 | Orals | CL4.16

Timing the Cambrian Sauk Transgression in the Southeastern Arabian Plate: Evidence from Radiogenic Strontium of Early Calcite Cement 

Mohamed El-Ghali, Mohamed Moustafa, Iftikhar Ahmed Abbasi, Olga Shelukhina, Osman Salad Hersi, and Arshad Ali

The Cambrian Sauk transgression marks one of the most extensive episodes of marine inundation in Earth’s geological record. Despite its importance, accurately constraining its timing remains problematic in many regions because of limited biostratigraphic indicators and the scarcity of robust chronometric tools. In this study, we introduce an integrated petrographic, geochemical, and geochronological framework to constrain the age of the Sauk transgression on the southeastern Arabian Plate. This is achieved through analysis of trace-fossil burrows developed along the Cambrian maximum flooding surface (Cm20 MFS) within the middle Miqrat Formation of central Oman. Microscopic examination shows that calcite cement infilling the burrows is characterized by a drusy crystal fabric and occupies loosely arranged framework grains, indicating early cementation under near-surface conditions soon after sediment deposition. This interpretation is corroborated by clumped isotope (Δ47) data, which indicate calcite precipitation temperatures between 33.8°C and 36.4°C, with a mean value of approximately 34.8°C. These temperatures align well with independently estimated middle Cambrian sea-surface conditions. Measured Sr87/86 ratios of the burrow-filling calcite range from 0.7088456 to 0.7090134 (mean 0.7089270), yielding an inferred age of approximately 508.20–509.86 Ma, with an average age of 509.26 Ma. This age assignment falls within the middle Cambrian and is marginally younger than the maximum depositional age of ~511 Ma obtained from detrital zircon analyses. The ages reported here represent the first direct numerical constraints on the Sauk transgression from the southeastern Arabian Plate and demonstrate consistency with equivalent ages documented from the northern and northwestern parts of the plate. Overall, the results highlight the effectiveness of Sr87/86 isotope analysis of early diagenetic calcite as a chronostratigraphic tool. Because such calcite precipitates from marine-derived fluids shortly after deposition, it faithfully records the seawater isotopic composition at the time of cementation, allowing reliable dating of sedimentary successions.

How to cite: El-Ghali, M., Moustafa, M., Ahmed Abbasi, I., Shelukhina, O., Salad Hersi, O., and Ali, A.: Timing the Cambrian Sauk Transgression in the Southeastern Arabian Plate: Evidence from Radiogenic Strontium of Early Calcite Cement, EGU General Assembly 2026, Vienna, Austria, 3–8 May 2026, EGU26-16562, https://doi.org/10.5194/egusphere-egu26-16562, 2026.

The geochemical signatures of clastic sedimentary sequences are determined by the parent rocks, weathering intensity, and the complex processes of transport and deposition. These variables define the mineralogical and chemical attributes of the basin fill, offering significant insights into the prevailing geodynamic settings and paleoclimatic conditions. The Upper Cretaceous deposits in the Lesser Caucasus are widely distributed and represent a vital geological archive for studying the region’s history. To reconstruct the paleogeographic and depositional conditions of the northeastern slope of the Lesser Caucasus, Inductively Coupled Plasma Mass Spectrometry (ICP-MS) was employed for high-precision elemental analysis, while X-ray diffraction (XRD) was utilized to determine the mineralogical composition of the sequences. The terrigenous sequences of the region comprise the diverse lithological assemblages, primarily categorized as shales, iron-rich shales (Fe-shales), and greywackes. These rocks exhibit low compositional and mineralogical maturity, indicating accumulation in high-energy environments with a significant influx of fresh volcaniclastic material. Geochemical proxies for chemical weathering reveal a transition from intensive to moderate alteration. This low maturity is further substantiated by the preservation of primary silicates, which is characteristic of rapid sediment burial. Elemental analysis indicates that the detrital material was predominantly derived from first-cycle mafic and ultramafic magmatic sources, reflecting the significant erosion of ophiolitic and associated sequences. Geochemical indicators confirm a first-cycle sedimentary regime with minimal recycling and limited hydraulic sorting. Tectonic discrimination functions identify an oceanic island arc setting, where volcaniclastic and terrigenous debris accumulated in basins governed by active subduction and convergence processes. These findings are consistent with semi-humid and semi-arid paleoclimatic conditions that prevailed during the Late Cretaceous. Collectively, these indicators elucidate the geodynamic setting of the region and emphasize the interplay between arc volcanism and the regional tectonic framework in shaping the Mesozoic sedimentary record.

How to cite: Guliyev, E. and Aliyeva, E.: Geodynamic and paleogeographic settings of the Upper Cretaceous terrigenous successions, northeastern slope of the Lesser Caucasus: Geochemical and mineralogical constraints , EGU General Assembly 2026, Vienna, Austria, 3–8 May 2026, EGU26-16974, https://doi.org/10.5194/egusphere-egu26-16974, 2026.

EGU26-18474 | ECS | Posters on site | CL4.16

Late Miocene to Pleistocene deep water Productivity in the Southeast Atlantic: Evidence from Benthic Foraminiferal Assemblages 

Rudra Narayan Mohanty, Anil Kumar Gupta, and Jeet Majumder

Benthic foraminifera are widely considered as marker proxy for past changes in surface and deep water productivity, organic matter flux, bottom water oxygenation, and deep water circulation. This study presents benthic foraminiferal relative abundance records from ODP Site 1087 (31°27.9137’S, 15°18.6541’E, water depth 1374m), located in the southeast Atlantic Ocean beneath the productive Benguela Upwelling System (BUS). The main objective is to assess long-term productivity and oceanographic variability in the region from the Late Miocene to Pleistocene. Our results indicate a major shift in regional oceanographic conditions at ~10 Ma. A distinct increase in the relative abundance of Bulimina striata, a dysoxic, infaunal species associated with elevated flux of organic matter, suggests enhanced surface productivity and marks the emergence of the BUS. This timing closely matches with the onset of the BUS as inferred from multiple independent proxy records. The late Miocene–early Pliocene biogenic bloom (~ 8–5 Ma), characterised by sustained and widespread high productivity across the Indian, Pacific and Atlantic Oceans, is often indicated by higher relative abundance of Uvigerina proboscidea, a suboxic, infaunal species associated with high delivery rates of organic matter to the seafloor. A similarly higher relative abundance of U. proboscidea is clearly recorded in our benthic assemblages, pointing to intensified export productivity during this interval. Additionally, an increased relative abundances of the opportunistic species Epistominella exigua during ~8 to 6 Ma and ~3.7 to 3.0 Ma indicate seasonal input of phytodetritus from the surface waters due to extensive phytoplankton blooms associated with the strengthening of the upwelling. The early Pliocene interval between ~5 and 3.7 Ma is marked by the co-occurrence of Globocassidulina subglobosa, U. proboscidea, and B. striata. This assemblage reflects alternating oxic and suboxic–dysoxic benthic environments, which might be linked to oligotrophic and eutrophic surface conditions, respectively. Decreased surface productivity related to reduced upwelling and enhanced oxygenation of bottom waters favoured oxic species, but the continued presence of dysoxic-suboxic species indicate a continuous nutrient supply, perhaps related to Agulhas Leakage. A rapid increase in U. proboscidea and Uvigerina peregrina during the Plio–Pleistocene cooling reflects re-intensification of BUS-related productivity. Overall, benthic foraminiferal assemblages at ODP Site 1087 provide a robust record of productivity and associated oceanographic changes in the Southeast Atlantic Ocean between the Late Miocene and Pleistocene.

How to cite: Mohanty, R. N., Gupta, A. K., and Majumder, J.: Late Miocene to Pleistocene deep water Productivity in the Southeast Atlantic: Evidence from Benthic Foraminiferal Assemblages, EGU General Assembly 2026, Vienna, Austria, 3–8 May 2026, EGU26-18474, https://doi.org/10.5194/egusphere-egu26-18474, 2026.

EGU26-18713 | ECS | Posters on site | CL4.16

Zr/Hf ratios in Banded Iron Formations as tracers of Early Ocean evolution  

Johanna Krayer, Arathy Ravindran, Josua J. Pakulla, Carsten Münker, Stefan Weyer, and Sebastian Viehmann

The Zr/Hf ratio of modern seawater (150-3001) is significantly fractionated relative to the chondritic value (32.7-34.22) and magmatic systems. This deviation is driven by the higher particle reactivity of Hf relative to Zr in low-temperature, aqueous systems, resulting in preferential sorption of Hf onto (particle) surfaces. The Zr/Hf ratio of aqueous systems increases from the continents towards the open oceans, varies with water depth and water mass age, making it a powerful tool for tracing water masses. While reasonably well constrained in modern aquatic systems, the Zr/Hf composition of ancient seawater remains poorly understood, but may provide unique insights into the circulation of water masses.

To investigate the Zr/Hf evolution of the seawater throughout Earth’s history, banded iron formations (BIFs) represent a viable archive for the Precambrian seawater chemistry because they are chemical sedimentary rocks and reflect the chemistry of the seawater from which they precipitated. Here, we present new high-precision Zr–Hf data from Precambrian BIFs, complemented by available literature data, to evaluate the Zr/Hf ratio as a paleoceanographic tracer of ancient water masses.

Archean BIFs predominantly display near-chondritic Zr/Hf ratios, with ratios not exceeding 75. The first super-chondritic Zr/Hf ratios occur in individual BIF-layers at ~2.51 Ga, and the formation showing overall super-chondritic Zr/Hf ratios is the ca. 2.4 Ga Hotazel Formation, indicating widespread Zr/Hf fractionation in marine environments. Formation-scale averages largely remain near-chondritic until ~2.0 Ga, while younger BIFs show predominantly super-chondritic ratios. This secular trend from chondritic towards super-chondritic Zr/Hf ratios in the early to mid Proterozoic likely reflects changing seawater conditions that enabled widespread Zr–Hf fractionation. The increasing availability of Fe–Mn(oxide) particles, based on increasing atmospheric oxygenation but also the progressive development of modern-style estuarine and shelf environments, may have led to global Zr-Hf fractionation in marine systems by that time. Within individual formations, Zr/Hf ratios correlate with Mn/Fe ratios, indicating a link between Zr-Hf fractionation and the redox-evolution of the Earth. Moreover, regional differences among coeval BIFs suggest variable depositional settings and distinct water-mass circulation patterns already in the Neo-archean. Thus, our results highlight the potential of Zr/Hf ratios in BIFs and other chemical sedimentary rocks to trace the redox-evolution of the Earth with the appearance and spatial heterogeneity of oxygenated water masses in Early Earth oceans.

 1Godfrey et al., 1996, GCA 60

 2Münker et al., 2025, GPL 36

How to cite: Krayer, J., Ravindran, A., Pakulla, J. J., Münker, C., Weyer, S., and Viehmann, S.: Zr/Hf ratios in Banded Iron Formations as tracers of Early Ocean evolution , EGU General Assembly 2026, Vienna, Austria, 3–8 May 2026, EGU26-18713, https://doi.org/10.5194/egusphere-egu26-18713, 2026.

In many carbonate archives, Δ47 signatures appear to be primarily driven by crystallization temperatures, with little evidence for other influencing factors, implying that 13C and 18O isotopes are effectively (re)distributed among carbonate isotoplogues in accordance with thermodynamic stability during or just before mineralization. This is not the case for all types of carbonates, but appears to hold true for biocarbonates such as bivalves, gastropods, or planktic foraminifera. For historical reasons, things are not as clear-cut when it comes to benthic foraminifera, a particularly important source of information on past marine environments at the scale of the Cenozoic and beyond. In hope of fostering productive discussions, we revisit this issue with a focus on the following questions:

  • What is the current body of evidence from modern/recent observations?
  • How much do the various Δ47 calibrations currently applied to foraminifera differ?
  • Is there any practical difference between Δ47 calibrations based exclusively on modern/recent foraminifera and "composite" calibrations based on many different types of carbonates?
  • What should be the foraminifer Δ47 community's next steps to try and resolve these issues?

How to cite: Daëron, M. and Gray, W.: Does it matter whether benthic foraminifera achieve clumped-isotope thermodynamic equilibrium?, EGU General Assembly 2026, Vienna, Austria, 3–8 May 2026, EGU26-19790, https://doi.org/10.5194/egusphere-egu26-19790, 2026.

EGU26-20576 | Orals | CL4.16

Rare Earth Elements as tracers for past ocean chemistry 

Patrick Blaser, Ricardo Monedero-Contreras, Florian Scholz, Samuel L. Jaccard, and Martin Frank

The rare earth elements (REE) are transported and transformed coherently in the environment, yet subtle differences in their chemical properties cause variable fractionation patterns. In the ocean, their relatively long residence times (centuries to millennia) allow REE to be advected across basins while recording fractionation processes en route. Scavenging onto sinking particles – especially metal oxides and organic matter – leads to their burial on the seafloor, where their abundances can be further modified by early diagenetic processes. The fraction of REE preserved in sediments enters the geological record where it can be used to reconstruct past ocean chemistry provided their marine geochemical cycling is understood well enough.

Here we present REE concentration data from authigenic phases of a global suite of marine sediments. We assess which environmental parameters they predominantly relate with, how early diagenesis affects the archived REE, and whether authigenic REE can be used to reconstruct past ocean chemistry and particle fluxes.

How to cite: Blaser, P., Monedero-Contreras, R., Scholz, F., Jaccard, S. L., and Frank, M.: Rare Earth Elements as tracers for past ocean chemistry, EGU General Assembly 2026, Vienna, Austria, 3–8 May 2026, EGU26-20576, https://doi.org/10.5194/egusphere-egu26-20576, 2026.

EGU26-21375 | Orals | CL4.16

Elemental mapping and stable isotope analyses of cryogenic cave carbonates from Scărișoara Ice Cave, Romania 

Cristina Montana Pușcaș, Ciprian Cosmin Stremțan, Aurel Perșoiu, and Lukas Schlatt

Cryogenic cave calcite is a relatively rare type of cave deposit formed in periglacial environments by drip water freezing and discharging its soluble components in form of mostly calcium carbonates. While cryogenic calcite formation as a phenomenon was recognized early on by researchers (see [1,2] for references), most studies to date have focused on the morphological characteristics of these deposits or their stable isotope composition.

In this contribution we investigate the elemental and stable isotopic composition of cryogenic cave carbonate deposits (pearls) from the Scărișoara Ice Cave, Romania. The pearls were collected from within the cave at locations where active drip water was present. Samples (millimeters to centimeters in diameter) were embedded in epoxy resin, cut in half and the exposed surface was analyzed. Laser ablation inductively coupled mass spectrometry (LA ICP TOF MS) was used to identify the qualitative distribution of trace elements that can we expected to reach the cave from atmospheric deposition above the cave, rather that from the bedrock. A Teledyne Photon Machine 193 nm wavelength excimer laser Iridia was used in conjunction with Nu Instruments Vitesse time-of-flight ICP MS for elemental mapping. Stable isotopic (δ13C and δ 18O) composition was explored using laser ablation isotope ratio mass spectrometry (Photon Machines Fusions CO2 laser coupled to a Sercon HS2022 IRMS).

Elemental data shows highly zoned structures in the studied deposits. Layers of clear detrital input (characterized by high 89Y and low 48Ca+/28Si+) alternate with layers with monotonous chemical composition. Furthermore, the layers of detrital input are often characterized by the presence of 3–5 micron Au-containing particles. We believe those particles to be anthropogenic pollutants windblown from areas with historically intense Au mining located in relative proximity of the cave. 

[1] I.D. Clark, B. Lauriol, Kinetic enrichment of stable isotopes in cryogenic calcites, Chem. Geol. 102 (1992) 217–228.

[2] K. Žák, B.P. Onac, A. Perşoiu, Cryogenic carbonates in cave environments: A review, Quat. Int. 187 (2008) 84–96.

How to cite: Pușcaș, C. M., Stremțan, C. C., Perșoiu, A., and Schlatt, L.: Elemental mapping and stable isotope analyses of cryogenic cave carbonates from Scărișoara Ice Cave, Romania, EGU General Assembly 2026, Vienna, Austria, 3–8 May 2026, EGU26-21375, https://doi.org/10.5194/egusphere-egu26-21375, 2026.

The mechanisms that allowed the oxygenation of the Earth’s atmosphere to occur at the end of the Archean, an event known as the Great Oxidation Event (GOE), remain unclear. For the GOE to occur, two conditions must be met: first, oxygenic photosynthesis must evolve; second, the net production of dioxygen by photosynthesizers (i.e. the imbalance between carbon fixation and respiration corresponding to burial of organic matter), must exceed oxygen sinks such as reduced volcanic gases. Evidence points toward oxygenic photosynthesis evolving long before the traces of the GOE appear in the geological record. Thus, the oxygenation of Earth’s atmosphere may have been triggered by a combination of an increase in the burial flux of organic carbon (net O2 source) or a decreased O2 sink (e.g. via a decrease in the volcanic emissions of reduced gases). However, the drivers and dynamics of each of these processes are complex, and leveraging the geological record (e.g. stable carbon isotope record) to draw mechanistic conclusions about geochemical cycling at the time of the GOE remains challenging.

Recent modeling studies have highlighted the role of ecological competition for nutrient between anoxygenic and oxygenic photosyntheses as a potential driver for a delayed oxygenation of the atmosphere following the emergence of oxygenic photosynthesis (Ozaki et al 2019; Olejarz et al 2021). Here, I use adaptive dynamics theory (Metz et al., 1992) to rigorously and efficiently model the outcome of ecological competition in the upper layer of the Archean ocean as a function of boundary conditions set by the compositions of the deep ocean and of the atmosphere. Using a separation of timescales assumption, I then use the steady-state outcome of this ecological model as a boundary condition in a simplified geochemical model of phosphorous and iron cycling, and atmospheric oxygen.

The model shows how small perturbations in the delivery rate of iron or phosphorous to the deep ocean can trigger reversible or irreversible global oxygenation events. I examine a scenario where the upper ocean is initially phosphorous-limited and photoferrotrophs (anoxygenic photosynthesis where the electron donor is soluble iron) competitively exclude oxygenic photosynthesis. Then I assume that delivery rates of iron and phosphorus evolve or are perturbed such that the upper ocean transitions to conditions where photoferrotrophs would be iron-limited, giving oxygenic photosynthesis a fitness advantage (owing to its use of abundant water as an electron donor). In this scenario, an initially rare variant performing oxygenic photosynthesis may take come to dominate phototrophic primary production while the total remains constant, if local oxidation of soluble iron by dioxygen is fast enough (i.e. if the pH is high enough). The model demonstrates that coexistence between anoxygenic and oxygenic photosyntheses may not prevent oxygenation of the atmosphere, if the total productivity is high enough, and determines conditions where small perturbation in the geochemical system can trigger reversible or irreversible atmospheric oxygenations.

How to cite: Affholder, A.: Eco-Evolutionary dynamics of oxygenic and anoxygenic photosyntheses in the late Archean., EGU General Assembly 2026, Vienna, Austria, 3–8 May 2026, EGU26-21473, https://doi.org/10.5194/egusphere-egu26-21473, 2026.

Banded Iron Formations (BIFs) are important archives of early Earth's history, offering critical geochemical insights on Archaean oceanic and atmospheric chemistry. BIFs provide critical constraints on ancient seawater conditions, temperature, pH, nutrient cycles, redox processes and the evolution of microbial metabolisms, which are fundamental to understanding early planetary habitability. In the Singhbhum Craton of India, their immense economic importance has made BIFs a primary research target for decades.

But so far, the different BIF units exposed within the Singhbhum Craton remain yet to be dated and characterized. Numerous BIF units are distributed within the Singhbhum Craton, which holds immense potential to unravel deep insights into not only seawater chemistry but also conditions related to the emergence of the craton and/or presence of terrestrial landmass. Recent studies have placed BIFs exposed in the southern part of the Singhbhum Craton amongst some of the oldest BIFs with evidence for terrestrial inputs around ca. 3.37 Ga. Here, we report ancient BIFs of the Gorumahisani Greenstone Belt that are well exposed near the mining town of Gorumahisani, with alternate banding of Si- and Fe-rich bands and intercalated with cherts. To date, the age of this critical iron formation within the Gorumahisani greenstone sequence remains poorly known. We dated an intrusive granitoid within the BIF sequence. U-Pb dating of zircon crystals recovered from the intrusive granitoid provided a 207Pb/206Pb age of 3286 ± 10 Ma. The emplacement age of this granitoid brackets the minimum age for the Gorumahisani greenstones, and on the other hand, it is identified as part of the Singhbhum Granitoid Complex (i.e., the Singhbhum Suite). Field and geochronological evidence confirms the presence of Palaeoarchaean BIFs in the Gorumahisani belt, establishing a critical foundation for future studies to determine precise depositional constraints and unravel details of early Earth surface processes.


How to cite: Jodder, J. and Elburg, M.: Banded Iron Formation of the Gorumahisani Greenstone Belt, Singhbhum Craton, India: Insights into Archaean surface processes., EGU General Assembly 2026, Vienna, Austria, 3–8 May 2026, EGU26-21888, https://doi.org/10.5194/egusphere-egu26-21888, 2026.

The Azores Front marks the boundary between subtropical and
subpolar water in the North Atlantic. Its position during glacial periods
is debated, tracing it would improve our understanding of glacial ocean
circulation. Neodymium (Nd) isotopes are an important tracer for past and
current water mass mixing. They are however subject to overprinting on
local scales by processes including erosion and volcanic activity.
Cold-water corals incorporate Nd into their skeletons without
fractionation, making them valuable archives. In this work, the epsilon-Nd
of corals from several locations close to the Azores Islands was measured.
The corals were previously dated by U/Th measurements, which revealed ages
between 0.458 and 22.14 ka. The epsilon-Nd measurements found a range of
values between -12.07 and -1.26. The results reveal clear
evidence of radiogenic overprinting, which occurs on decadal timescales
and can most likely be attributed to volcanic activity. The extent and
frequency at which this overprinting occurs does not depend on climate
phases. A part of the samples may represent unaltered seawater values,
these show no evidence of a change in water mass mixing over the last 20
ka.'

How to cite: Schöfer, C. and Frank, N.: Epsilon-Nd-Signatures and Radiogenic Overprinting in Cold-Water Corals near the Azores, EGU General Assembly 2026, Vienna, Austria, 3–8 May 2026, EGU26-22506, https://doi.org/10.5194/egusphere-egu26-22506, 2026.

EGU26-103 | ECS | Posters on site | CL1.2.9

Eastern Brazil Hydroclimate Weakening Linked to Stronger AMOC During the Pleistocene 

Bruno Gomes, Igor Venancio, João Ballalai, Thiago Figueiredo, Anderson de Almeida, and Ana Luiza Albuquerque

Several paleoclimate studies focus on the impacts of changes in Atlantic Meridional Overturning Circulation (AMOC) on the dynamics of the South American Monsoon System (SAMS) on millennial timescales; however, they lack interpretations on longer timescales throughout the Quaternary. Here, we present a sediment core covering the last 1 million years collected in the tropical region of the eastern Brazilian margin near the São Francisco River mouth. We used the ln(Si/Al) as hydroclimate proxy, interpreting as changes in the SAMS activity, and also δ13C of benthic foraminifera to track changes on deep-water circulation. We observed substantial changes between 700-400 ka, marked by the weakening of the SAMS simultaneously with increasing long-term trend of δ13C, suggesting a coupled ocean-atmosphere changes during this period. We infer that the observed increase in ventilation is a response to a stronger AMOC, which leads to a global northward migration of the Intertropical Convergence Zone (ITCZ), resulting in a decrease in SAMS intensity. Thus, our data offer insights into long-term coupled responses between the oceanic and atmospheric systems in the tropical realm during the Quaternary.

How to cite: Gomes, B., Venancio, I., Ballalai, J., Figueiredo, T., de Almeida, A., and Albuquerque, A. L.: Eastern Brazil Hydroclimate Weakening Linked to Stronger AMOC During the Pleistocene, EGU General Assembly 2026, Vienna, Austria, 3–8 May 2026, EGU26-103, https://doi.org/10.5194/egusphere-egu26-103, 2026.

EGU26-104 | ECS | Posters on site | CL1.2.9

Stability of the Equatorial Atlantic mid-depth circulation across the mid-Pleistocene transition 

Luiza Freitas, Igor Venancio, Thiago Santos, Ana Beatriz Pedrazzi-Chacon, Charlotte Skonieczny, Natalia Vázquez Riveiros, Ana Luiza Spadano Albuquerque, Aline Govin, and Cristiano Chiessi

The mid-Pleistocene Transition (1.25-0.7 Ma) marks the emergence of the 100-kyr-periodicity and more intense glacial cycles without changes in orbital forcing, requiring a fundamental shift in Earth’s internal climate system. A critical glacial Atlantic deep circulation weakening and increased Southern Ocean water masses incursion between MIS 24 – MIS 22, even during the interglacial MIS 23, has been suggested as a key driver, responsible for enhancing carbon storage, reducing atmospheric CO2 and facilitating ice-sheet growth, and has been called as “AMOC crisis” event. However, the expression of this thermohaline disruption is not well-documented at intermediate depths in the Equatorial Atlantic, an important AMOC flow branch. To investigate the Equatorial Atlantic mid-depth water masses variability across the MPT, we applied a benthic foraminiferal δ13C record from a two-core composite MD23-3677Q (1988 m) and MD23-3678 (1988 m), positioned in the NADW upper layer. We built two vertical gradients (Δδ13C) between our record and two published data from deeper cores (DSDP 607 and ODP 925), influenced by the NADW deep layer. A close-to-zero Δδ13C indicates the same water mass influence at mid-depth and deep ocean. Our data suggests that the proposed Southern Ocean water masses incursion and expansion across the AMOC crisis event did not affect depths shallower than 2000 m. Moreover, no substantial changes were observed between intervals pre- and post-MPT at intermediate depths in the Equatorial Atlantic, and the variability observed in the vertical gradients is mainly driven by deep ocean changes, which were affected by the reorganization of the glacial Atlantic Ocean structure after the MPT.

How to cite: Freitas, L., Venancio, I., Santos, T., Pedrazzi-Chacon, A. B., Skonieczny, C., Vázquez Riveiros, N., Spadano Albuquerque, A. L., Govin, A., and Chiessi, C.: Stability of the Equatorial Atlantic mid-depth circulation across the mid-Pleistocene transition, EGU General Assembly 2026, Vienna, Austria, 3–8 May 2026, EGU26-104, https://doi.org/10.5194/egusphere-egu26-104, 2026.

EGU26-154 | ECS | Orals | CL1.2.9

Increased precipitation during the Little Ice Age promoted human settling in eastern South America 

Viviane Korres Bisch, Cristiano Mazur Chiessi, Paulo César Fonseca Giannini, Thais Aparecida Silva, André Bahr, Ximena Suarez Villagran, and Vinícius Ribau Mendes

In the instrumental record, eastern South America (ESA) is marked by severe droughts that triggered substantial human displacements, making it a hotspot for climate-society interactions. It is not clear, however, if past centennial-scale changes in climate like the Little Ice Age (LIA) also controlled human occupation. Here we present a precipitation reconstruction for ESA covering the last two millennia, based on the thermoluminescence sensitivity of the 110°C peak of quartz (TL sensitivity) from a marine sediment core collected off ESA. TL sensitivity serves as a proxy for sediment provenance in the region, which is controlled by rainfall patterns. Our data show that centennial-scale changes in precipitation in semi-arid northern ESA varied according to shifts in the Intertropical Convergence Zone (ITCZ). During the LIA, when the ITCZ moved southward, our core shows lower TL sensitivity values, suggesting wetter conditions over northern ESA. Importantly, these wetter intervals align with peaks in ages of archaeological remains found in the region. Concurrently, hydroclimate and archaeological records point to a drier and less populated southern ESA. Our data indicate a temporal correspondence between changes in hydroclimate and human migration from the southern to the nowadays semi-arid northern ESA. We suggest that improved environmental conditions facilitated settlement in otherwise semi-arid landscapes. By integrating marine sediment proxies and archaeological evidence, this study provides support for a climatic influence on human occupation patterns in ESA, particularly during the LIA. It also highlights the utility of luminescence-based techniques in paleoclimate reconstructions from fluvially influenced marine archives.

How to cite: Korres Bisch, V., Mazur Chiessi, C., Fonseca Giannini, P. C., Aparecida Silva, T., Bahr, A., Suarez Villagran, X., and Ribau Mendes, V.: Increased precipitation during the Little Ice Age promoted human settling in eastern South America, EGU General Assembly 2026, Vienna, Austria, 3–8 May 2026, EGU26-154, https://doi.org/10.5194/egusphere-egu26-154, 2026.

EGU26-216 | ECS | Posters on site | CL1.2.9

Advancing Paleoclimate Proxies: Insights from a Novel Luminescence Scanner Applied to Stalagmites and Corals 

Raquel de Carvalho Gradwohl, Giorgo Battistella, Francisco J. Nascimento, Francisco W. C. Junior, Nicolás M. Strikis, Natan S. Pereira, and Vinicius R. Mendes

There are several natural climate archives where proxies can be applied to retrieve information about changes in vegetation, soil and water temperature, continental rainfall regimes, as well as variations in sea surface salinity and temperature. Among these records, stalagmites and corals stand out for their high temporal resolution: the former allow the reconstruction of continental precipitation variations, while the latter enable the identification of changes in marine temperature and salinity. Both are predominantly composed of calcium carbonate (CaCO₃), and generally their proxies comprehend  isotopic analyses of carbon and oxygen, as well as magnesium-to-calcium ratios. Given the importance of understanding climate fluctuations in continental and marine environments, the development of new analytical methods to improve the interpretation of these records is essential. In this context, luminescence techniques (Optically Stimulated Luminescence (OSL), Fluorescence, and Phosphorescence) have proven to be promising tools, as they allow the establishment of correlations between luminescent signals and environmental variables such as temperature, precipitation, and salinity. Although the use of OSL is already well established for dating minerals such as quartz and feldspar, its application to carbonate materials as proxies for environmental changes is still recent and under development, while the study of fluorescence and phosphorescence in these materials remains little explored. The development of the first luminescence scanner dedicated to measuring carbonates enabled high-resolution testing of these emissions, specifically in stalagmites and corals. Measurements were performed continuously, at a constant speed of 100 mm/min, along the main growth axis of the stalagmites and from the top to the base of the corals. The experimental protocol was designed to assess temporal variations and consisted of five main steps: (1) X-ray irradiation (40 kV, 300 µA, 100 mm/min); (2) signal reading with LEDs turned off (11x); (3) IRSL signal reading (3x); (4) BOSL signal reading (5x); and (5) signal reading with LEDs turned off (2x). The tests revealed a strong correlation between the blue-light fluorescence signal and oxygen isotopes (ẟ¹⁸O) in the stalagmites, whereas in the coral samples, a greater similarity was observed between the blue-light fluorescence signal and carbon isotopes (ẟ¹³C). Furthermore, the decay tests showed no signal loss over time, suggesting that the stalagmites emit not only optically stimulated luminescence but also fluorescence and phosphorescence. These results demonstrate the potential of the technique not only for detecting quartz and feldspar grains trapped within carbonate matrices but also for investigating intrinsic properties of calcium carbonate itself, opening new perspectives for high-resolution paleoclimate studies. The newly developed equipment enables rapid sequential analyses, thus representing an excellent alternative for material screening. Due to its low cost per analysis, it will be possible to examine a wide range of samples, which constitutes a significant advantage over conventional, well-known methods, typically more expensive and time-consuming.

How to cite: de Carvalho Gradwohl, R., Battistella, G., J. Nascimento, F., W. C. Junior, F., M. Strikis, N., S. Pereira, N., and R. Mendes, V.: Advancing Paleoclimate Proxies: Insights from a Novel Luminescence Scanner Applied to Stalagmites and Corals, EGU General Assembly 2026, Vienna, Austria, 3–8 May 2026, EGU26-216, https://doi.org/10.5194/egusphere-egu26-216, 2026.

EGU26-281 | ECS | Orals | CL1.2.9

Climate and Human Impacts on Neotropical Vegetation and Fire Regimes since the Last Glacial Maximum 

Thomas Kenji Akabane, Cristiano Mazur Chiessi, Paulo Eduardo De Oliveira, Jennifer Watling, Ana Carolina Carnaval, Vincent Hanquiez, Dailson José Bertassoli Jr., Thaís Aparecida Silva, Marília H Shimizu, and Anne-Laure Daniau

Vegetation and fire regimes in the Neotropics have fluctuated in response to past climate oscillations, yet the drivers of these changes remain complex and regionally variable. Based on analyses of large datasets of pollen and charcoal records, we addressed how climate changes since 21 ka drove major trends of vegetation and fire changes across the Neotropics. Our findings suggest that temperature, atmospheric CO2 concentrations, and precipitation exert distinct and alternating roles as primary drivers of tree cover and fire regime changes, with additional impacts from vegetation-fire feedbacks and human activities. During the Last Glacial Maximum, tree cover in high elevation sites and at sub- and extra-tropical latitudes was mainly limited by low temperatures and reduced atmospheric CO2 concentrations, while fuel-limited conditions and/or low temperatures restrained fire activity. In the warmer tropical regions, moisture availability was likely the main controlling factor of both vegetation and fire, with the effects of low CO2 amplifying these constraints. Deglacial warming and rising CO2 promoted biomass expansion and intensified fires in temperate areas. Meanwhile, precipitation variability associated with millennial-scale events was positively correlated with tree cover and negatively correlated with fire regimes. Throughout the Holocene, relatively stable temperatures and CO2 shifted the primary control to precipitation patterns, with human activities increasingly impacting vegetation and fire regimes in the late Holocene, particularly in Central America and tropical Andes. These findings highlight the complex interplay of climate factors and anthropogenic influences shaping Neotropical ecosystems over millennia.

How to cite: Akabane, T. K., Chiessi, C. M., De Oliveira, P. E., Watling, J., Carnaval, A. C., Hanquiez, V., Bertassoli Jr., D. J., Silva, T. A., Shimizu, M. H., and Daniau, A.-L.: Climate and Human Impacts on Neotropical Vegetation and Fire Regimes since the Last Glacial Maximum, EGU General Assembly 2026, Vienna, Austria, 3–8 May 2026, EGU26-281, https://doi.org/10.5194/egusphere-egu26-281, 2026.

EGU26-384 | ECS | Posters on site | CL1.2.9

Reconstructing bottom currents along the Brazilian margin from the Last Glacial Maximum to the Holocene 

Raissa Tayt-Sohn, Igor Venancio, Joao Ballalai, Thiago Figueiredo, Anderson de Almeida, and Ana Luiza Albuquerque

The deep ocean circulation during the last glacial cycle exhibited characteristics distinct from the Holocene. This interval marks the transition between glacial and interglacial conditions, strongly influenced by millennial-scale Heinrich events, which were characterized by massive iceberg discharges into the North Atlantic. Studies indicate that during these events, the AMOC became shallower and weaker, resulting in a pronounced reduction in deep ocean circulation across the Atlantic. In this study, we present three sediment cores: DGL-1914 (1131 m), DGL-1905 (2513 m) and DGL-1903 (2704 m), collected along the western Brazilian margin near the São Francisco River, spanning the last 40.000 years. To investigate variability in deep-current velocity, we applied the Sortable Silt proxy in combination with the Zr/Rb ratio, both indicators of paleocurrent strength.  Our results show that during Heinrich events (H1, H2, H3, and H4), significant changes occurred in current velocities, reflecting distinct hydrodynamic conditions associated with the Intermediate Western Boundary Current (IWBC) (core DGL-1914) and the Deep Western Boundary Current (DWBC) (cores DGL-1905 and DGL-1903). In particular, we observe a pronounced reduction in the DWBC flow during these events, indicating a weakening of the AMOC in the South Atlantic throughout these intervals. These results provide new insights into deep circulation in the western South Atlantic and contribute to a more comprehensive understanding of bottom-waters dynamics along the Brazilian margin.

How to cite: Tayt-Sohn, R., Venancio, I., Ballalai, J., Figueiredo, T., de Almeida, A., and Albuquerque, A. L.: Reconstructing bottom currents along the Brazilian margin from the Last Glacial Maximum to the Holocene, EGU General Assembly 2026, Vienna, Austria, 3–8 May 2026, EGU26-384, https://doi.org/10.5194/egusphere-egu26-384, 2026.

EGU26-761 | ECS | Posters on site | CL1.2.9

Late Quaternary deglaciations in the western tropical Atlantic and eastern tropical South AmericaLate Quaternary deglaciations in the western tropical Atlantic and eastern tropical South America 

Laura Kraft, Marília C. Campos, Viviane Q. P. Turman, Tatiana L. Campese, Breno S. Marques, Bruna B. Dias, Rodrigo A. Nascimento, Gelvam A. Hartmann, Aline Govin, and Cristiano M. Chiessi

Deglaciations are periods in Earth’s geological history marked by the transition from glacial to interglacial climates. Recent research has increasingly focused on identifying similarities and differences among terminations, particularly the role of millennial-scale climate variability. These transitions are marked by episodes of a weakened Atlantic Meridional Overturning Circulation (AMOC), with widespread climate impacts. Observational data suggest that the AMOC may be weakening at present due to human-induced climate change, reinforcing the importance of terminations as case studies for understanding climate behavior under reduced AMOC, global warming, global ice loss, and monsoon changes. This study compares the evolution of Terminations V (ca. 430 ka), II (ca. 135 ka), and I (ca. 20 ka) from a paleoceanographic and paleoclimatic perspective based on marine sediment cores from the western tropical Atlantic. Sea surface temperature and salinity, bottom-water ventilation, and continental precipitation over the adjacent tropical South America will be reconstructed. For this purpose, we are conducting stable oxygen and carbon isotope analyses on planktonic and benthic foraminifera, Mg/Ca analyses on planktonic foraminifera, and X-ray fluorescence analyses on bulk sediment. Our goal is to identify specific patterns of climatic variability among these terminations, focusing on regional and global ocean-atmosphere responses. These results may improve our understanding of the dynamics of rapid climate transitions and their effects on the tropical Atlantic, as well as provide insights into potential present-day climate responses to AMOC weakening. Preliminary results will be presented. [FAPESP grants 2022/06452-0, 2024/11054-9, 2024/00949-5, 2025/19613-0 and 2025/05117-0].

How to cite: Kraft, L., C. Campos, M., Q. P. Turman, V., L. Campese, T., S. Marques, B., B. Dias, B., A. Nascimento, R., A. Hartmann, G., Govin, A., and M. Chiessi, C.: Late Quaternary deglaciations in the western tropical Atlantic and eastern tropical South AmericaLate Quaternary deglaciations in the western tropical Atlantic and eastern tropical South America, EGU General Assembly 2026, Vienna, Austria, 3–8 May 2026, EGU26-761, https://doi.org/10.5194/egusphere-egu26-761, 2026.

EGU26-835 | ECS | Posters on site | CL1.2.9

Planktonic foraminifera luminescence as a new paleoclimate proxy for oceanic and atmospheric conditions off South America 

Tatiana de Lourdes Campese, Marília de Carvalho Campos, Carlos Ortiz, Bruna Borba Dias, Cristiano Mazur Chiessi, Breno de Souza Marques, Laura Kraft, Viviane Querollaine Pires Turman, Gelvam Hartmann, Svetlana Radionovskaya, Luke Skinner, Aline Govin, Vinícius Ribau Mendes, Thays Desirée Mineli, André Bahr, Stefan Mulitza, and André Oliveira Sawakuchi

Luminescence emitted by minerals has long been used in paleoenvironmental studies, particularly thermoluminescence (TL) from carbonates. TL emission in calcite is controlled by the type and quantity of defects in the crystal lattice, which may act as charge traps and/or recombination centers. These defects can be influenced by environmental conditions prevailing at the time of crystallization, for example through the incorporation of impurities substituting calcium in the calcite lattice (e.g., Mg, Mn, Fe). In this context, this study investigates the potential of TL signals emitted from the calcite of the planktonic foraminifera Globigerinoides ruber (white sensu stricto, 250–350 μm) as a paleoclimate proxies. This species was selected due to its widespread use in paleoclimate reconstructions, high abundance, and known sensitivity to environmental variability. We analyzed samples from three marine sediment cores from the western Atlantic, encompassing different spatial and temporal contexts. Two cores represent modern conditions under contrasting oceanographic settings: MD23-3669MC (equatorial Atlantic) and GeoB6211-1 (subtropical South Atlantic). The third core, CDH-89 (equatorial Atlantic), spans the penultimate glacial–interglacial transition (143–122 ka), allowing the comparison between modern and paleoclimatic signal.

The resulting TL intensity curves (light emitted per unit mass and unit radiation dose) exhibit peaks at approximately 65°C and 400°C. These TL signals were compared with classical paleoceanographic proxies, i.e., Mg/Ca, Mn/Ca, Fe/Ca and stable isotope data, measured on shells of the same planktonic foraminifera species. Principal component analysis indicates that the 400°C peak is primarily controlled by sea surface temperature variations, whereas the 65°C peak is associated with proxies related to continental input to the ocean. These results demonstrate that TL signals in planktonic foraminifera preserve environmental signatures, supporting their potential as new paleoclimate proxies. Further systematic testing across environments and experimental conditions is required to fully validate and advance these proxies for broader paleoenvironmental applications.

How to cite: Campese, T. D. L., Campos, M. D. C., Ortiz, C., Dias, B. B., Chiessi, C. M., Marques, B. D. S., Kraft, L., Turman, V. Q. P., Hartmann, G., Radionovskaya, S., Skinner, L., Govin, A., Mendes, V. R., Mineli, T. D., Bahr, A., Mulitza, S., and Sawakuchi, A. O.: Planktonic foraminifera luminescence as a new paleoclimate proxy for oceanic and atmospheric conditions off South America, EGU General Assembly 2026, Vienna, Austria, 3–8 May 2026, EGU26-835, https://doi.org/10.5194/egusphere-egu26-835, 2026.

EGU26-1091 | ECS | Posters on site | CL1.2.9

Upper-ocean variability in the Equatorial Atlantic across the Mid-Pleistocene Transition 

Ana Beatriz Pedrazzi-Chacon, Igor Venancio, Luiza Freitas, Natalia Riveiros, Ana Luiza Albuquerque, Cristiano Chiessi, and Aline Govin

The Mid-Pleistocene Transition (MPT, ~1.2-0.8 Ma) marks a fundamental reorganization of Earth’s climate system, characterized by a shift from 41 kyr to 100 kyr glacial-interglacial cycles, a long-term expansion of global ice volume, and increasingly asymmetric glacial stages. This interval also witnessed widespread aridification, though the underlying drivers varied regionally: in Asia, enhanced dryness was linked to the growth of Northern Hemisphere ice sheets, whereas in Eastern Africa, more arid hydroclimate conditions were tied to a strengthened Pacific Walker Circulation. Despite the global significance of the MPT, paleoenvironmental reconstructions from Brazil are extremely limited, largely due to the scarcity of long, continuous, high-resolution sedimentary archives. As a result, the response of the western equatorial Atlantic to reorganized glacial boundary conditions remains poorly constrained, even though this region plays a key role in tropical ocean-atmosphere dynamics. To address this gap, we investigate paleoclimatic variability along the western tropical South Atlantic margin throughout the MPT and evaluate how large-scale cooling influenced regional hydroclimate and upper-ocean structure. We developed a composite sedimentary record from cores MD23-3677Q and MD23-3678 (3°14.35′S, 36°11.87′W; 1988 m water depth), recovered from a seamount off northeastern Brazil during the AMARYLLIS AMAGAS II expedition. Planktonic foraminiferal geochemistry (δ13C, δ18O and Mg/Ca ratios) was measured in Globigerinoides ruber and Neogloboquadrina dutertrei at 4-cm resolution to reconstruct sea-surface temperatures, atmosphere–ocean coupling, and upper-ocean stratification through the MPT. Ongoing analyses will provide new constraints on tropical hydroclimate variability, SST changes, and the evolution of upper-ocean structure in the western equatorial Atlantic, offering fresh insight into how low-latitude feedbacks evolved under progressively cooler global climates during the MPT.

How to cite: Pedrazzi-Chacon, A. B., Venancio, I., Freitas, L., Riveiros, N., Albuquerque, A. L., Chiessi, C., and Govin, A.: Upper-ocean variability in the Equatorial Atlantic across the Mid-Pleistocene Transition, EGU General Assembly 2026, Vienna, Austria, 3–8 May 2026, EGU26-1091, https://doi.org/10.5194/egusphere-egu26-1091, 2026.

EGU26-1675 | ECS | Orals | CL1.2.9

Reconstructing Holocene floodplain ecosystems in the lower Negro River (central Amazonia) using sedaDNA, pollen, and charcoal  

Erika Ferreira Rodrigues, Paulo Eduardo De Oliveira, Xiaowei Zhang, Kam-biu Liu, Qiang Yao, Cristiano Mazur Chiessi, Dailson José Bertassoli Jr, Thomas Kenji Akabane, Vitor Araujo de Carvalho, Luiz Carlos Ruiz Pessenda, and Xianglin Liu

Sedimentary DNA (sedaDNA), pollen, and charcoal records from two sediment cores along the lower Negro River floodplain revealed complementary ecological and hydrological patterns throughout the Holocene in the main blackwater river located in central Amazonia. The sedaDNA record from the Lake Pacú sediment core (~9440–370 cal yr BP) provides unprecedented insight into microbial and planktonic communities across millennial-scale environmental changes. During the early Holocene (~9440–8852 cal yr BP), the presence of planktonic diatoms (Discostella nipponica, Melosira varians) and ciliates (Rimostrombidium sp., Strombidium sp.) indicate shallow, moderately productive waters with relatively low acidity compared with current Negro River conditions. A transition from ~8852 to 4520 cal yr BP is characterized by increased biological diversity compared to the early Holocene, with higher abundances and taxonomic richness of diatoms, ciliates, rotifers (Brachionus sp., Asplanchna brightwellii), and Chlorophyta (Pyramimonas tetrarhynchus). These assemblages suggest episodes of elevated nutrient input, temporary water column stratification and hydrological connectivity with surrounding floodplain environments. This interval reflects a dynamic limnological regime, with productivity fluctuating under seasonal flooding and broader hydroclimatic variability. The Late Holocene interval (~4520–370 cal yr BP) shows a pronounced ecological shift. Particularly around ~3000 cal yr BP, sedaDNA reveals the occurrence of mesotrophic diatoms, green algae, rotifers and ciliates, taxa not found under the acidic, humic waters of the Negro River. These conditions were likely driven by river connectivity, changes in water level and flow from tributaries such as the Branco River, whose chemical properties differ significantly from the Negro River. After this interval, these taxa decline toward the most recent samples, reflecting a return to more acidic, low productivity conditions similar to the river today. Complementarily, palynological data from the Apuaú River sediment core (~6450–3540 cal yr BP), a left bank tributary of the Negro River, document simultaneous expansion of Várzea type vegetation and the presence of mesotrophic diatoms (~13%), reinforcing a regional pattern of increased nutrient flux and hydrological heterogeneity during the mid- to late Holocene. Additionally, charcoal peaks dated to ~3320–2620 cal yr BP indicate intensified fire activity during the late Holocene, most likely associated with a regional dry phase rather than anthropogenic activity. Overall, our multi-proxy reconstruction of the lower Negro River provides a rare molecular record throughout the Holocene, revealing shifts in aquatic communities, vegetation and fire regimes in central Amazonia.

How to cite: Rodrigues, E. F., De Oliveira, P. E., Zhang, X., Liu, K., Yao, Q., Chiessi, C. M., Bertassoli Jr, D. J., Akabane, T. K., de Carvalho, V. A., Pessenda, L. C. R., and Liu, X.: Reconstructing Holocene floodplain ecosystems in the lower Negro River (central Amazonia) using sedaDNA, pollen, and charcoal , EGU General Assembly 2026, Vienna, Austria, 3–8 May 2026, EGU26-1675, https://doi.org/10.5194/egusphere-egu26-1675, 2026.

EGU26-3112 * | ECS | Orals | CL1.2.9 | Highlight

AMOC weakening modulates global warming impacts on precipitation over Brazil 

Isabelle Vilela, Paolo De Luca, Shunya Koseki, Thiago Silva, Doris Veleda, and Noel Keenlyside

Global warming is expected to substantially weaken the Atlantic Meridional Overturning Circulation (AMOC). However, climate models disagree greatly on the magnitude of AMOC weakening. This adds uncertainties in climate change projections, across the globe, through influencing poleward ocean and atmospheric energy transports. Here, we show through multi-model analysis of future climate change projections that AMOC weakening during this century will strongly influence precipitation and its extremes over Brazil. Such weakening dominates over the direct global warming impacts, causing drying in the Amazon, while completely mitigating them in northeast Brazil. We trace this to a tropical Atlantic warming, consistent with weakened heat transport along the southern branch of the South Equatorial Current. This induces a cross-equatorial sea surface temperature gradient and changes in latent heat flux, shifting the intertropical convergence zone southward. Our findings highlight the need to reduce uncertainties in the AMOC response to global warming and its oceanic mediated influences on Brazilian climate.

How to cite: Vilela, I., De Luca, P., Koseki, S., Silva, T., Veleda, D., and Keenlyside, N.: AMOC weakening modulates global warming impacts on precipitation over Brazil, EGU General Assembly 2026, Vienna, Austria, 3–8 May 2026, EGU26-3112, https://doi.org/10.5194/egusphere-egu26-3112, 2026.

EGU26-3877 | Orals | CL1.2.9

Coupled changes in intermediate water ventilation and northeastern Brazil precipitation during the last glacial period 

Bruna B. Dias, Gabriel R. Shimada, Manuela S. Carvalho, Thalia V. Montoya, Marie Haut-Labourdette, Rodrigo A. Nascimento, Laura Kraft, Marília C. Campos, Igor M. Venancio, Thiago P. Santos, Natalia V. Riveiros, Aline Govin, and Cristiano M. Chiessi

Previous studies have linked increased precipitation over northeastern Brazil to millennial-scale climate events, particularly Heinrich Stadials (HS), which are associated with increased freshwater input into the subpolar North Atlantic and weakening of the Atlantic Meridional Overturning Circulation (AMOC). During these intervals, reduced northward heat transport promotes a southward displacement of the Intertropical Convergence Zone, leading to enhanced precipitation over northeastern Brazil. While the atmospheric response to AMOC variability during HS is relatively well documented, the variability of ocean circulation at intermediate depths, especially in the western equatorial Atlantic (WEA), remains poorly constrained.

Here, we reconstruct intermediate depth circulation and northeastern Brazil climate over the last glacial period (i.e., the last 35 ka) using marine sediment core MD23-3670Q (1ºS 43ºW; 1,357 mbsl) from the WEA. Stable carbon isotopes (δ13C) were measured in epibenthic (i.e., Cibicidoides pachyderma, C. lobatulus, C. incrassatus) and endobenthic (i.e., Uvigerina peregrina, Globobulimina affinis) foraminiferal species at a minimum resolution of 4 cm as a proxy for ventilation and carbon cycle. X-ray fluorescence (XRF) scanning performed every 1 cm provided proxies for redox conditions (i.e., ln(Mn/Ti)) and continental input (i.e., ln(Ti/Ca)).

Negative δ13C excursions in epibenthic foraminifera during the Younger Dryas and HS 1, 2, and 3 suggest the accumulation of respired carbon at intermediate depths in the WEA. This interpretation is supported by the low input of terrestrial and marine organic matter to the bottom of the ocean, inferred from the small δ13C gradient between C. pachyderma and U. peregrina. In addition, neodymium isotope records from nearby core indicate only minor changes in intermediate water mass provenance throughout the last glacial period, suggesting the persistent predominance of southern sourced waters at our site. Negative C. pachyderma δ13C excursions, together with reduced ln(Mn/Ti) values during HS, indicate decreased oxygen penetration in the sediments due to a combination of reduced intermediate depth ventilation and increased sedimentation rates. A reduced δ13C gradient between C. pachyderma and G. affinis further suggests a shallower redox boundary during HS, corroborating the reduced oxygen penetration into the bottom sediments. The close correspondence between our ventilation proxies and millennial-scale variations in ln(Ti/Ca) provides evidence for ocean-atmosphere coupling between reduced intermediate water ventilation in the WEA and enhanced precipitation over northeastern Brazil, driven by changes in the AMOC strength over the last 35 ka.

How to cite: B. Dias, B., R. Shimada, G., S. Carvalho, M., V. Montoya, T., Haut-Labourdette, M., A. Nascimento, R., Kraft, L., C. Campos, M., M. Venancio, I., P. Santos, T., V. Riveiros, N., Govin, A., and M. Chiessi, C.: Coupled changes in intermediate water ventilation and northeastern Brazil precipitation during the last glacial period, EGU General Assembly 2026, Vienna, Austria, 3–8 May 2026, EGU26-3877, https://doi.org/10.5194/egusphere-egu26-3877, 2026.

EGU26-5684 | ECS | Posters on site | CL1.2.9

Millennial and orbital-scale variability of Amazon Basin precipitation over the last 200 kyr 

Júlia Grigolato, Cristiano Mazur Chiessi, Bruna Borba Dias, Thiago Pereira dos Santos, Lara Valloto Silva, Jaqueline Teixeira Alves, Maysa Almeida Leonetti, Stefano Crivellari, Rodrigo Azevedo Nascimento, Renê Hamada Magalhães, Pedro Benitez, and Aline Govin

The Amazon rainforest is a key component of the South American climate system, with strong vegetation-convection feedback and a tight coupling with large-scale atmospheric circulation. However, the relative roles of abrupt millennial-scale climate events and orbital forcing in modulating Amazon Basin hydroclimate remain incompletely understood over long timescales. Indeed, most available records either cover short time windows or come from distal sites where Amazonian signals may be diluted by non-local influences. Here, we reconstruct precipitation variability over the Amazon Basin during the last 200 kyr using the composite marine sediment core MD23-3652Q-53, recovered from the mid-depth western equatorial Atlantic and directly influenced by Amazon River discharge. First, we produced a detailed age model for the composite core based on nine calibrated radiocarbon ages and 511 benthic foraminifera stable oxygen isotope values. Second, we assessed changes in continental runoff and precipitation based on X-ray fluorescence elemental ratios and sediment reflectance data. Third, we determined the timing of millennial-scale changes in the strength of the Atlantic Meridional Overturning Circulation (AMOC) based on benthic foraminifera stable carbon isotope (d13C). Lower δ13C values during millennial-scale events coincide with increased ln(Ti/Ca) ratios and higher L* reflectance, indicating a reduction in North Atlantic Deep-Water ventilation and enhanced terrigenous sediment supply to the western equatorial Atlantic. These hydroclimate changes are consistent with a weakened AMOC, which promoted interhemispheric temperature asymmetry, a southward displacement of the Intertropical Convergence Zone, and strengthened of Amazonian precipitation. In contrast, higher a* reflectance values could be associated with periods of increased austral summer insolation, likely reflecting orbitally-driven changes in terrigenous sediment composition, primarily linked to enhanced precipitation over the Andean headwaters. These findings highlight the response of the Amazon hydrological system to distinct modes of climate forcing and provide important constraints on the sensitivity of tropical South American precipitation to future changes in the AMOC.

How to cite: Grigolato, J., Mazur Chiessi, C., Borba Dias, B., Pereira dos Santos, T., Valloto Silva, L., Teixeira Alves, J., Almeida Leonetti, M., Crivellari, S., Azevedo Nascimento, R., Hamada Magalhães, R., Benitez, P., and Govin, A.: Millennial and orbital-scale variability of Amazon Basin precipitation over the last 200 kyr, EGU General Assembly 2026, Vienna, Austria, 3–8 May 2026, EGU26-5684, https://doi.org/10.5194/egusphere-egu26-5684, 2026.

EGU26-5796 | ECS | Posters on site | CL1.2.9

Reconstructing South Atlantic climate during MIS 11 and Termination V 

Marília Campos, Laura Kraft, Breno Marques, Tatiana Campese, Viviane Turman, Bruna Dias, Rodrigo Nascimento, Gelvam Hartmann, and Cristiano Chiessi

The scientifically and politically agreed-upon benchmark for limiting global warming in the coming decades, as stated in the Paris Agreement, was set to “well below 2 °C above pre-industrial levels”. The interglacial period known as Marine Isotope Stage (MIS) 11, which occurred ca. 400 thousand years ago, is thought to have reached temperatures up to ~2 °C warmer than pre-industrial conditions, making it an excellent case study for investigating the behaviour of Earth’s climate under warmer-than-pre-industrial conditions.

The South Atlantic is particularly important for Earth’s climate, as it represents a major heat reservoir and plays a crucial role in heat transport between the hemispheres. To better understand the behaviour of the South Atlantic under a ~2 °C warmer-than-pre-industrial climate, we are generating and compiling paleoceanographic records from the eastern and western margins of the basin spanning MIS 11 and its preceding deglaciation (Termination V). The outcomes of this research have the potential to greatly improve our understanding of South Atlantic dynamics under warmer-than-pre-industrial climates, thereby helping to constrain plausible future climate scenarios.

How to cite: Campos, M., Kraft, L., Marques, B., Campese, T., Turman, V., Dias, B., Nascimento, R., Hartmann, G., and Chiessi, C.: Reconstructing South Atlantic climate during MIS 11 and Termination V, EGU General Assembly 2026, Vienna, Austria, 3–8 May 2026, EGU26-5796, https://doi.org/10.5194/egusphere-egu26-5796, 2026.

EGU26-6035 | ECS | Orals | CL1.2.9

Atlantic ITCZ dynamics during millennial-scale North Atlantic cold events 

Rodrigo Nascimento, Aline Govin, Masa Kageyama, Marie Haut-Labourdette, Marília Campos, and Cristiano Chiessi

The modern rainfall regime over semiarid northeastern Brazil (NEB) is primarily controlled by the seasonal migration of the Intertropical Convergence Zone (ITCZ), with the rainy season occurring during March-April, when the ITCZ reaches its southernmost position. It is well accepted that reductions in cross-equatorial northward heat transport mediated by the Atlantic Meridional Overturning Circulation (AMOC) during abrupt cold phases of Dansgaard-Oeschger (DO) cycles, namely Greenland stadials (GS) and Heinrich stadials (HS), triggered southward migrations of the ITCZ. These migrations led to enhanced precipitation over NEB, a signal that is more clearly captured in paleoclimate records during HS.

Here, we present a reconstruction of millennial-scale Atlantic ITCZ dynamics based on the longest continuous paleoprecipitation records available for NEB, spanning the last 160 thousand years (kyr) at a temporal resolution of ca. 30 years. In addition, we use numerical climate model outputs to investigate the mechanisms underlying this millennial-scale variability. The hydroclimate records are derived from a composite of iron-to-calcium (Fe/Ca) and iron-to-potassium (Fe/K) log-ratios measured in bulk sediments from marine sediment cores MD23-3670Q and MD23-3671 (1365 m water depth; 1°34.7′ S, 43°1.4′ W), retrieved offshore NEB during the AMARYLLIS-AMAGAS II cruise in 2023. High ln(Fe/Ca) and ln(Fe/K) values reflect increases in continental precipitation, which enhance chemical weathering, erosion, and terrigenous discharge to the adjacent continental margin. Our records reveal enhanced continental precipitation during cold phases (i.e., GS and HS) of the 25 DO cycles identified in the NGRIP ice core, reinforcing the strong teleconnection between tropical hydroclimate variability and high-latitude climate changes.

The records further indicate consistently higher continental precipitation over NEB during HS than during GS. We show that terrigenous input (i.e., continental precipitation) is inversely related to AMOC strength (r = 0.78, p < 0.05) and to mid- to high-latitude North Atlantic sea surface temperatures (SSTs) (r = 0.9, p < 0.05). Particularly, HS are systematically associated with the highest ln(Fe/Ca) values, the weakest AMOC conditions, and the lowest North Atlantic SSTs.

Numerical simulations performed with the Institut Pierre Simon Laplace climate model version 4 show a gradual increase in annual NEB rainfall as AMOC intensity is progressively reduced. This enhanced rainfall results from a gradual (i) lengthening of the rainy season over NEB and (ii) increase in mean monthly precipitation during the rainy season. The lengthening of the rainy season is driven by both a southward shift in the annual mean ITCZ position and an expansion of its southward seasonal migration range. Meanwhile, we propose that the increase in mean monthly precipitation is related to warmer SSTs in the tropical South Atlantic, which can enhance deep atmospheric convection and act as a direct moisture source for the adjacent continent. Together, these findings suggest that enhanced rainfall over NEB during North Atlantic cold events is not solely driven by a southward migration of the ITCZ, thereby advancing our understanding of tropical atmospheric dynamics during episodes of AMOC slowdown.

How to cite: Nascimento, R., Govin, A., Kageyama, M., Haut-Labourdette, M., Campos, M., and Chiessi, C.: Atlantic ITCZ dynamics during millennial-scale North Atlantic cold events, EGU General Assembly 2026, Vienna, Austria, 3–8 May 2026, EGU26-6035, https://doi.org/10.5194/egusphere-egu26-6035, 2026.

EGU26-6411 | ECS | Posters on site | CL1.2.9

Natural variability of the Amazonian hydroclimate over the last two glacial cycles (220,000 years). 

Pedro Benitez Frometa, Aline Govin, Gwenaël Herve, Júlia Grigolato, Rodrigo Azebedo Nascimento, and Cristiano Mazur Chiessi

The Amazon basin is one of the most influential hydroclimatic systems on the planet, modulating the water cycle and energy balance of the tropical regions. The long-term stability of the Amazon rainforest is closely linked to regional hydroclimate, as shifts in rainfall amount and seasonality can drive substantial ecological transformations across the basin. Understanding how the Amazon system has naturally responded to past oceanic and atmospheric forcings is crucial, and paleoclimate records provide information to investigate the mechanisms governing Amazonian hydroclimate variability through time. Yet, paleoclimate archives that allow us to explore its variability beyond the last 50 ka are limited. The objective of this study is to characterize orbital- and millennial-scale hydroclimatic changes within the Amazon basin over the last 220,000 years through high-resolution X-ray fluorescence (XRF) analysis on marine sediment cores recovered from the northern margin of French Guyana during the AMARYLLIS–AMAGAS II cruise, specifically at stations S6 and S7 where a composite record was produced for each station by combining cores MD23-3652Q/53 and MD23-3655Q/56, respectively.

XRF results of S6 cores, which have an age model, allowed us to associate geochemical changes with Marine Isotopic Stages (MIS 1–7) and Heinrich Stadials of the last 60 ka. High values of Fe/Ca and Al/K log-ratios are observed during Heinrich Stadials (HS1–H6), indicating increased input of terrigenous vs. biogenic material, consistent with enhanced fluvial discharge, and an enhanced contribution of chemically weathered material from the Amazon basin. Elevated ln(Fe/K) and ln(Al/K) ratios specifically suggest a stronger contribution from lowland, highly leached soils and enhanced precipitation-driven weathering within the basin, rather than changes in sediment provenance. These patterns suggest globally wetter conditions over the Amazon Basin during HS, in agreement with the documented southward shift of the Intertropical Convergence Zone (ITCZ) and strengthening of the South American monsoon. During interglacial periods such as MIS 5e and MIS 1, higher sea levels likely reduced the continental influence on sedimentation at the core sites, enhancing the relative contribution of marine carbonates. This is reflected by lower ln(Fe/Ca) and ln(Fe/K) ratios, together with higher ln(Sr/Ca) values, which indicate a decline in terrigenous input and a stronger oceanic influence. During glacial stages (MIS 6, 4 and 2), the combination of high ln(Fe/Ca) and an increased ln(Al/K), denotes intensified fluvial supply and stronger chemical weathering under humid conditions, despite lowered sea level.

S7 cores, although lacking an age model, allow for a qualitative comparison due to their geographic proximity to S6. The general trends in Fe/Ca and Al/K log-ratios are consistent with those of S6, suggesting that S7 cores record the same regional signal of Amazonian fluvial variability, modulated by the tropical hydroclimatic regime. These preliminary results demonstrate that XRF records from S6 and S7 cores constitute an exceptional archive for evaluating the interaction between the Amazonian hydroclimatic system and North Atlantic forcings, indicating that during Heinrich Stadials, a southward migration of the ITCZ and intensified tropical rainfall enhanced Amazonian river discharge and continental runoff.

How to cite: Benitez Frometa, P., Govin, A., Herve, G., Grigolato, J., Azebedo Nascimento, R., and Mazur Chiessi, C.: Natural variability of the Amazonian hydroclimate over the last two glacial cycles (220,000 years)., EGU General Assembly 2026, Vienna, Austria, 3–8 May 2026, EGU26-6411, https://doi.org/10.5194/egusphere-egu26-6411, 2026.

EGU26-7217 | ECS | Posters on site | CL1.2.9

AMOC-driven shifts in Amazon sediment sources since the Last Glacial Maximum 

Renê Hamada Magalhães, Cristiano Chiessi, Thiago Pereira dos Santos, Igor Venancio, Vinícius Ribau Mendes, André Oliveira Sawakuchi, Júlia Grigolato, Ana Luiza Albuquerque, and Germain Bayon

As the largest drainage in the world, the Amazon River basin shows intricate and only partially known responses to hydroclimate changes linked to atmospheric reorganization and/or the strength of the Atlantic Meridional Overturning Circulation (AMOC). Many of the hydroclimatic reconstructions for the region were obtained from speleothems, often representing limited local characteristics. Thus, tracking the source of siliciclastic sediments deposited off northeastern South America is particularly well suited to understanding how precipitation in different sectors of the basin may have responded to distinct climate and ocean circulation states. Here we present a high-resolution multi-proxy approach to determine the provenance of the sediments deposited off the Amazon River mouth since the Last Glacial Maximum (LGM) using radiogenic Nd isotopes on clay-size detrital fractions, bulk-sediment major elemental ratios (e.g., Fe/K, Fe/Ca, and Al/K), and quartz optically stimulated luminescence (OSL) sensitivity. We applied these proxies to marine sediment core GL-1251 (1°04.1' N, 45°48.0' W, 2.596 m water depth), the most proximal core to the Amazon River mouth ever studied, making it an excellent archive to address this subject. The new data presented here shows that during the (i) LGM, the (ii) Bølling–Allerød and the (iii) Younger Dryas (YD), deposition at our core site was dominated by sediments transported directly by the Amazon River. During these periods, Andean material dominated the siliciclastic fraction, and fluvial sediment discharge into our core site was favored by relatively low sea level. Our εNd data suggest an abrupt increase in the contribution of the Solimões catchment (northern Central Andes) at the expense of the Madeira catchment (southern Central Andes) during the late YD. However, we identify two periods during which cratonic sources dominated the siliciclastic fraction. The first and most prominent occurred during Heinrich stadial 1 (HS1), and the second during the early to mid-Holocene. During HS1, we argue that, despite enhanced Amazon River freshwater discharge caused by increased precipitation over the Amazon basin, relatively few Andean-derived sediments were deposited at the GL-1251 site. This could be explained by a reduction in the strength of the North Brazilian Current (NBC) towards the northwest, which, in turn, depends on the control of the AMOC. In contrast, the massive intensification of precipitation over eastern Amazon and northeastern Brazil substantially increased cratonic sediment input from catchments draining the Brazilian Shield, resulting in high sedimentation rates. During the early Holocene, we propose that sea-level rise was accompanied by predominant transport of the Amazon sediment plume in the northwestern portion of the Amazon shelf, allowing sustained sediment input from rivers draining the Brazilian Shield at the site of GL-1251. Overall, our data indicate markedly changing precipitation patterns over tropical South America since the LGM, which affected the source of siliciclastic sediments deposited on the northeastern continental margin of South America and possibly imply direct linkage with abrupt changes in the strength of AMOC.

How to cite: Hamada Magalhães, R., Chiessi, C., Pereira dos Santos, T., Venancio, I., Ribau Mendes, V., Oliveira Sawakuchi, A., Grigolato, J., Albuquerque, A. L., and Bayon, G.: AMOC-driven shifts in Amazon sediment sources since the Last Glacial Maximum, EGU General Assembly 2026, Vienna, Austria, 3–8 May 2026, EGU26-7217, https://doi.org/10.5194/egusphere-egu26-7217, 2026.

EGU26-7767 | Posters on site | CL1.2.9

Ventilation decreases during Heinrich stadials in the deep water masses of the western tropical Atlantic 

Natalia Vazquez Riveiros, Claire Waelbroeck, Didier Roche, Santiago Moreira, Pierre Burckel, Fabien Dewilde, Luke Skinner, Helge Arz, Evelyn Boehm, and Trond Dokken

During Heinrich Stadial 1 (HS1), δ13C decreased throughout most of the upper North Atlantic between∼ 1000 – 2500 m, and in some deeper South Atlantic sites. Most studies explain the δ13C decrease as a response to a weakening of the Atlantic circulation, but the origin and pathway of this poorly-ventilated water mass is still debated. The behavior of intermediate and deep waters during previous Heinrich Stadials is even less well constrained. Here, high-resolution records of the last 45 ka from marine sediment cores off the Brazilian margin are compared with freshwater forcing simulations of the Earth System Model of intermediate complexity iLOVECLIM, using δ18O as a water mass tracer. Our data reveal a low-δ13C water mass at 2300 m during the last four HS. HS1 and HS4 are also marked by decreases in benthic foraminifer δ18O too large to be due to sea level changes alone, suggesting the incursion of warmer and/or fresher waters between 2300 - 3600 m. Model simulations indicate the presence of a southward-flowing, low-δ18O water mass spreading from the North Atlantic to the tropics, likely transported by the Western Boundary Current. Our results thus suggest that the minimum in ventilation in the Tropics during HS is of northern origin, rather than being related to an expansion of southern waters to shallower depths.

How to cite: Vazquez Riveiros, N., Waelbroeck, C., Roche, D., Moreira, S., Burckel, P., Dewilde, F., Skinner, L., Arz, H., Boehm, E., and Dokken, T.: Ventilation decreases during Heinrich stadials in the deep water masses of the western tropical Atlantic, EGU General Assembly 2026, Vienna, Austria, 3–8 May 2026, EGU26-7767, https://doi.org/10.5194/egusphere-egu26-7767, 2026.

EGU26-8237 | ECS | Posters on site | CL1.2.9

Meridional shifts in the northern boundary of the South Atlantic Subtropical Gyre during Termination V and MIS 11: a multiproxy approach 

Viviane Q. P. Turman, Marília C. Campos, Bruna B. Dias, Rodrigo A. Nascimento, Tainã M. L. Pinho, Tatiana L. Campese, Breno S. Marques, Laura Kraft, Gelvam Hartmann, Igor M. Venâncio, Ana L. S. Albuquerque, João M. Ballalai, Anderson G. Almeida, and Cristiano M.Chiessi

Subtropical gyres contribute significantly to climate regulation by constituting the main pathways for energy redistribution between low and high latitudes. The South Atlantic Subtropical Gyre (SASG) operates in a region that is critical to the Atlantic energy balance. Its northern boundary, defined by the southern branch of the South Equatorial Current (sSEC), constitutes an important interhemispheric connection for heat and salt exchange. The sSEC bifurcates in the western tropical South Atlantic, giving rise to the Brazil Current, which transports warm and saline tropical waters southward, and the North Brazil Current, which transports heat and salt northwestward. In addition to acting as a linkage between both Atlantic subtropical gyres, the North Brazil Current constitutes an essential part of the upper branch of the Atlantic Meridional Overturning Circulation. Recently, observational data have recorded a reduction in the intensity of heat and salt transport toward the North Atlantic, along with a southward displacement of the SASG. These phenomena are likely influenced by the progressive weakening of the Atlantic Meridional Overturning Circulation, detected since the late 20th century and projected to continue in the coming decades. The lack of long-term oceanic records with adequate spatial coverage for the South Atlantic basin prevents a more complete understanding of the trends and impacts associated with SASG displacements. Here we investigate meridional changes in the position of the northern boundary of the SASG during Termination V and Marine Isotope Stage 11, through a multiproxy approach to reconstruct upper-ocean water-column stratification from a sediment core in the western tropical South Atlantic. To this end, relative abundance counts of the planktonic foraminifer species Globorotalia truncatulinoides (dextral and sinistral) and stable oxygen isotope (δ¹⁸O) analyses of G. truncatulinoides (dextral) and Globigerinoides ruber albus have been conducted. Due to the deeper apparent calcification depth of G. truncatulinoides, the difference in the δ¹⁸O signal of both species (Δδ¹⁸Otrunca-ruber) functions as an indicator of thermocline depth. The strong association of G. truncatulinoides with regions of deep thermocline allows the establishment of a relationship between variations in species abundance and changes in the stratification of the upper ocean. Since deep thermocline conditions can be interpreted as a signature of the presence of both Atlantic subtropical gyres, the proxies employed allow tracking meridional shifts in the SASG. Preliminary results are promising and suggest that the northern boundary of the SASG varied meridionally on millennial and orbital timescales. Mg/Ca ratio analyses will be performed on both species to reconstruct surface and subsurface temperatures, as well as to discriminate the individual roles of temperature and salinity in upper-ocean stratification.

How to cite: Q. P. Turman, V., C. Campos, M., B. Dias, B., A. Nascimento, R., M. L. Pinho, T., L. Campese, T., S. Marques, B., Kraft, L., Hartmann, G., M. Venâncio, I., L. S. Albuquerque, A., M. Ballalai, J., G. Almeida, A., and M.Chiessi, C.: Meridional shifts in the northern boundary of the South Atlantic Subtropical Gyre during Termination V and MIS 11: a multiproxy approach, EGU General Assembly 2026, Vienna, Austria, 3–8 May 2026, EGU26-8237, https://doi.org/10.5194/egusphere-egu26-8237, 2026.

EGU26-8413 | ECS | Posters on site | CL1.2.9

Surface and subsurface Agulhas Leakage dynamics across Termination V and MIS 11 

Breno S. Marques, Marília C. Campos, Rodrigo A. Nascimento, Bruna B. Dias, Thiago P. Santos, Cristiano M. Chiessi, Tatiana L. Campese, Viviane Q. P. Turman, Laura Kraft, Gelvam A. Hartmann, Tainã M. L. Pinho, Marcus V. L. Kochhann, Karl J. F. Meier, Sidney Hemming, Ian Hall, and André Bahr

The glacial termination that occurred approximately 430 thousand years ago (i.e., Termination V) culminated in the interglacial known as Marine Isotope Stage 11 (MIS 11). During this period, Earth’s mean temperature was approximately 2°C warmer than the pre-industrial era. Therefore, it makes an excellent case study for investigating the response of key components of the climate system under global warming conditions. Warm and saline (sub)surface waters from the Indian Ocean enter the South Atlantic through its southeastern sector via the so-called Agulhas Leakage (AL), thereby influencing the heat and salt content of the basin. Variations in the intensity of the AL are thought to play a key role in modulating the strength of the Atlantic Meridional Overturning Circulation on orbital and millennial timescales. However, the scarcity of high-resolution paleoceanographic records hampers detailed investigations of AL variability during Termination V and MIS 11. Here, we assess changes in AL across this time interval based on planktonic foraminiferal assemblages, as well as Mg/Ca ratios and stable oxygen isotopic ratios of surface and subsurface planktonic foraminiferal species (i.e., Globigerinoides ruber (white) and Globorotalia truncatulinoides (sinistral)). Our results allow us to reconstruct AL faunal index, a proxy for AL intensity, and associate (sub)surface temperature and salinity changes. Altogether, the records suggest an increase in AL intensity across Termination V. Interestingly, millennial-scale subsurface signals display a delayed response of up to ~6 thousand years relative to surface conditions. Although the mechanism underlying this decoupling remain unclear, it suggests that additional processes may have influenced subsurface oceanographic variability during this key climatic interval.

How to cite: S. Marques, B., C. Campos, M., A. Nascimento, R., B. Dias, B., P. Santos, T., M. Chiessi, C., L. Campese, T., Q. P. Turman, V., Kraft, L., A. Hartmann, G., M. L. Pinho, T., V. L. Kochhann, M., J. F. Meier, K., Hemming, S., Hall, I., and Bahr, A.: Surface and subsurface Agulhas Leakage dynamics across Termination V and MIS 11, EGU General Assembly 2026, Vienna, Austria, 3–8 May 2026, EGU26-8413, https://doi.org/10.5194/egusphere-egu26-8413, 2026.

EGU26-11608 | Posters on site | CL1.2.9

Magnetic fingerprinting of modern continental sediments in Northeastern Brazil 

Aline Govin, Shahnoor Alam, Hervé Gwenaël, Camille Wandres, Aurélie Van Toer, Marie-Pierre Ledru, Vinicius R. Mendes, and Cristiano M. Chiessi

Northeastern Brazil (NEB) is one of the most hydroclimatically sensitive regions in South America. Its globally semi-arid hydroclimate is shaped by the seasonal migration of the Intertropical Convergence Zone (ITCZ). Paleoclimate records documented a southward shift of the mean ITCZ position and intensified precipitation over NEB during millennial-scale events, which mobilized large quantities of detrital material transported to the adjacent Atlantic margin.

Environmental magnetism offers a non-destructive, high-resolution approach to assess the sediment provenance, weathering intensity, and mineralogical transformations. Magnetic minerals such as magnetite, hematite, and goethite carry unique coercivity and thermal signatures that reflect their formation and transport history. Few paleoclimate studies showed an increase in high-coercivity minerals in NEB marine sediments during past millennial-scale events, which may reflect enhanced riverine input from intensely weathered continental regions. However, the interpretation of magnetic records is limited by the absence of modern reference datasets from upstream continental sources.

Here we provide the first comprehensive rock-magnetic characterization of modern NEB continental sediments to better trace their provenance and improve the paleoclimatic interpretation of magnetic records in marine sediment cores. We investigated the magnetic mineralogy of about 80 modern sediment samples collected within the Parnaíba and the Maranhão hydrological systems using a suite of environmental magnetic techniques, which includes the acquisition and demagnetization of the Natural, Anhysteretic and Isothermal remanent magnetizations (NRM, ARM, IRM), stepwise thermal demagnetization of 3-axes IRM, hysteresis loops, backfield IRM curves with unmixing of coercivity spectra and thermomagnetic curves.

First results highlight the diversity of modern magnetic signatures within the Parnaíba and the Maranhão basins. Different mixing proportions of low-coercivity minerals such as magnetite versus high-coercivity minerals such as hematite and goethite seem to reflect contrasting source conditions within NEB in terms of rainfall amount, weathering intensity and lithology. In addition, while samples dominated by magnetite are abundant in regions with a crystalline bedrock and in downstream areas close to river mouths, samples with a high proportion of high-coercivity minerals (hematite, goethite) dominate in upstream NEB regions. Therefore, a grain-size sorting process may also be at play along the Parnaíba and the Maranhão hydrological systems and contribute to explain the spatial differences in modern magnetic mineralogy observed within NEB.

How to cite: Govin, A., Alam, S., Gwenaël, H., Wandres, C., Van Toer, A., Ledru, M.-P., Mendes, V. R., and Chiessi, C. M.: Magnetic fingerprinting of modern continental sediments in Northeastern Brazil, EGU General Assembly 2026, Vienna, Austria, 3–8 May 2026, EGU26-11608, https://doi.org/10.5194/egusphere-egu26-11608, 2026.

EGU26-15050 | ECS | Orals | CL1.2.9

Geochemical signatures and mercury stable isotopes associated with sedimentary processes at the Amazon River mouth during the Quaternary 

Gabriela Santos Caldeira, Jeremie Garnier, David Amouroux, Cristina Barbieri, Mariana Melo Lage, Pedro Costa Evangelista, Alina Kleindienst, Emanuel Tessier, Pascale Louvat, and Claúdia Carvalhinho Windmöller

The Amazon River is the largest fluvial system on Earth in terms of water and sediment discharge, exporting approximately 1.2 million tons of sediment per year to the Atlantic Ocean [1]. This flux modulates sedimentary and biogeochemical processes along the equatorial Atlantic margin and Amazon River mouth, reflecting interactions between continental, oceanic, and atmospheric processes [2]. This study evaluates three sediment cores collected at AMARYLLIS-AMAGAS II cruise (2023) in the Amazon River mouth region along a shelf–slope gradient, at water depths of 70 m (outer shelf), 696 m (upper slope), and 1696 m (mid-slope). The cores were collected using a CASQ corer and reach lengths of up to 11 meters. A multi-proxy approach was applied, including total organic carbon (TOC), inorganic carbon, calcium carbonate (CaCO₃), major and trace elements, rare earth elements (REEs) normalized to PAAS, as well as total mercury (Hg) and its stable isotopes. Geochemical ratios such as Ca/Ti, Al/Ca, and Ti/Al were used to evaluate the balance between terrigenous and carbonate components. The results indicate significant geochemical variability along the bathymetric gradient. Overall, the cores display TOC values between 1.1 - 3.3%, inorganic carbon between 1.21 - 5.81%, and CaCO₃ contents ranging from 10 to 48%. The shelf core (70 m) shows the highest variability, with CaCO₃ between 15 - 30% and fluctuations in Ca/Ti, Al/Ca, and Ti/Al ratios, reflecting hydrodynamic influence and sediment reworking. The upper slope (696 m) exhibits intermediate behaviour, with more moderate CaCO₃ contents (10–15%), indicating mixing between shelf signals and sediment transfer to deeper ocean environments. In contrast, the deeper slope core (1696 m) records a more integrated signal of sediment export and oceanic deposition, with elevated CaCO₃ contents in the upper intervals (48%), Ti/Al ratios increasing with depth, and reduced carbonate contents (< 20%), indicating enhanced terrigenous input in deeper intervals. PAAS-normalized REE patterns were parallel across all cores, indicating a relatively constant continental source consistent with the upper continental crust. The records show light to moderate enrichment of light REEs relative to heavy REEs (La/Yb 1.1), no Ce anomalies and positive Eu anomalies. Mercury isotope data show δ²⁰²Hg values between −0.9 and −1.6‰, indicating mass-dependent fractionation (MDF) dominated by light isotopes associated with terrigenous input, whereas Δ¹⁹⁹Hg (−0.35 to 0.00‰) and Δ²⁰¹Hg (−0.30 to 0.00‰) values indicate the influence of photochemical processes in the water column, such as Hg(II) photoreduction and methylmercury photodemethylation. Overall, the records suggest changes in oceanic and atmospheric processes in the Amazon River mouth influenced the sediment transport and deposition along the Amazon margin during the Quaternary.

[1] D. Feng, et al., Nat Commun 16 (2025) 3148.

[2] C.A. Nittrouer, et al., Annu. Rev. Mar. Sci. 13 (2021) 501–536.

How to cite: Santos Caldeira, G., Garnier, J., Amouroux, D., Barbieri, C., Melo Lage, M., Costa Evangelista, P., Kleindienst, A., Tessier, E., Louvat, P., and Carvalhinho Windmöller, C.: Geochemical signatures and mercury stable isotopes associated with sedimentary processes at the Amazon River mouth during the Quaternary, EGU General Assembly 2026, Vienna, Austria, 3–8 May 2026, EGU26-15050, https://doi.org/10.5194/egusphere-egu26-15050, 2026.

EGU26-16941 | Posters on site | CL1.2.9

Legacy of Northern Hemisphere deglaciation on Tropical Rainbelt Migration during the Early Last Interglacial Period 

Anastasia Zhuravleva, Mahyar Mohtadi, Sophie K.V. Hines, Kassandra M. Costa, Kirsten Fahl, Markus Kienast, and Henning A. Bauch

During the penultimate deglaciation, which largely coincided with Heinrich Stadial 11 (HS-11, ~136-129 ka), meltwater pulses cooled the North Atlantic and weakened the Atlantic Meridional Overturning Circulation (AMOC), driving a southward shift of the Intertropical Convergence Zone (ITCZ) and arid conditions in northern South America. Although deglacial effects persisted for several millennia into the subsequent Last Interglacial period (LIG, ~129-115 ka), the response of the ITCZ to this transitional climate state remains poorly constrained. Here, we present paleoenvironmental records from a marine sediment core north of the Orinoco River delta, where runoff-sensitive proxies track northern South American rainfall and Atlantic ITCZ migration, and benthic δ¹³C records indicate AMOC strength. Our records show a gradual increase in precipitation during the early LIG, indicating a progressive northward migration of the ITCZ. Notably, the onset of peak wet conditions at 126.5±1 ka coincides with stabilized benthic δ¹³C values, consistent with the re-establishment of a fully developed interglacial AMOC. This temporal alignment suggests that the lingering effects of the penultimate deglaciation, such as gradual cessation of freshwater influence, subpolar North Atlantic SST warming and AMOC recovery, played an important role in shaping tropical hydroclimate during the first 4 millennia of the LIG, and should be incorporated in climate models.

How to cite: Zhuravleva, A., Mohtadi, M., Hines, S. K. V., Costa, K. M., Fahl, K., Kienast, M., and Bauch, H. A.: Legacy of Northern Hemisphere deglaciation on Tropical Rainbelt Migration during the Early Last Interglacial Period, EGU General Assembly 2026, Vienna, Austria, 3–8 May 2026, EGU26-16941, https://doi.org/10.5194/egusphere-egu26-16941, 2026.

EGU26-18850 | ECS | Posters on site | CL1.2.9

Assessing late Quaternary paleohydrology in the Bolivian Amazon through plant waxes 

Giovanni Manzella, Geanina-Adriana Butiseacă, Enno Schefuß, and Umberto Lombardo

Climate variability during the end of the Pleistocene and the Holocene has been widely investigated in tropical South America, where precipitation is primarily controlled by the South American Summer Monsoon. Despite numerous regional syntheses, the existence and role of an east-west tropical South American precipitation dipole remain debated.

Here we present a new paleo-hydrological record from Laguna Larga, a ria lake located in the Llanos de Moxos (Bolivian lowlands). We analyse plant-wax n-alkanes and their hydrogen and carbon stable isotopes, together with portable XRF elemental data, to reconstruct hydroclimate, vegetation and erosion changes in the southwestern margin of the Amazon rainforest over the last 13 kyr BP.

Our results reveal hydrological fluctuations that influenced catchment vegetation. These variations highlight the dominant role of precipitation in shaping seasonally flooded savannahs such as the Llanos de Moxos, with implications for land cover dynamics, biodiversity, and human occupation.

This record provides new insights into late Quaternary rainfall variability in southwestern Amazonia and contributes to the ongoing discussion on large-scale precipitation patterns into tropical South America.

How to cite: Manzella, G., Butiseacă, G.-A., Schefuß, E., and Lombardo, U.: Assessing late Quaternary paleohydrology in the Bolivian Amazon through plant waxes, EGU General Assembly 2026, Vienna, Austria, 3–8 May 2026, EGU26-18850, https://doi.org/10.5194/egusphere-egu26-18850, 2026.

EGU26-19453 | ECS | Posters on site | CL1.2.9

Climate and vegetation dynamics during the last deglaciation in Northeastern Brazil inferred from molecular biomarkers and their isotopic composition 

Orian Pioggini, Jérémy Jacob, Christine Hatté, Iñaki Dejean, Soleine Riausset, Caroline Gauthier, Aline Govin, and Cristiano Chiessi

The climate of Northeastern Brazil is strongly controlled by the latitudinal migrations and intensity of the intertropical convergence zone (ITCZ), which govern the spatial and temporal distribution of precipitation and, in turn, vegetation and faunal resources that have been critical for human populations. However, the long-term interactions between ITCZ variability, climate and ecosystems are still poorly understood. Here we present a new record based on molecular biomarkers and their isotopic composition documenting the evolution of paleoenvironments in Northeastern Brazil during the last deglaciation.

Sixty samples were collected from the MD23-3670Q core retrieved off the Parnaíba delta during the AMARYLLIS-AMAGASII campaign. Concentrations and carbon isotopic composition (δ13C) of molecular biomarkers (n-alkanes, fatty acids, and pentacyclic triterpenes) were determined to reconstruct climate and vegetation dynamics over the 8.9 to 22.2 cal kBP period.

The δ13C record of n-C26 fatty acid shows similar variations as those of bulk organic matter (OM) δ13C, with an average -6‰ offset. This offset increases during the Bølling-Allerød and Preboreal, reflecting enhanced contributions of marine-derived OM and less terrestrial-derived OM. As a matter of fact, fatty acid δ13C values indicate a stronger contribution of C4-vegetation, suggesting drier conditions, during this period. Reversely, lower δ13C values indicate a stronger contribution of C3 vegetation, consistent with wetter conditions, during the Heinrich Stadial 1 and the Younger Dryas. Surprisingly, the Average Chain Length of fatty acids suggests reverse interpretation. Gramineae-specific biomarkers are abundant during the Heinrich Stadial 1 but rare during the Younger Dryas although climatic conditions appear close. High levels of Asteraceae biomarkers are abundant during both Heinrich Stadial 1 and Younger Dryas. Finally, taraxerol levels are notable during two episodes included in the Younger Dryas. This might reflect two phases of conditions favorable for the development of mangroves during sea level rise.

Together, these results reveal a complex and sometimes decoupled response of vegetation and coastal ecosystems to deglacial climate variability in Northeastern Brazil, emphasizing the combined influence of ITCZ-driven hydroclimate changes, sea-level fluctuations, and non-linear response of NE Brazil vegetation to climate changes.

We are grateful to the crew of the R/V Marion Dufresne and GENAVIR staff members for their help in collecting AMARYLLIS-AMAGAS II cores. We also acknowledge the Brazilian Navy and the Brazilian National Council for Scientific and Technological Development (CNPq) for granting access to collect and investigate the material taken in Brazilian jurisdictional waters during the AMARYLLIS- AMAGAS II cruise (ANR 17-EURE-0006).

This research was supported by the project ANR SESAME “Human paleoecology, Social and cultural Evolutions among first Settlements in Southern America (ANR 20-CE03-0005).

How to cite: Pioggini, O., Jacob, J., Hatté, C., Dejean, I., Riausset, S., Gauthier, C., Govin, A., and Chiessi, C.: Climate and vegetation dynamics during the last deglaciation in Northeastern Brazil inferred from molecular biomarkers and their isotopic composition, EGU General Assembly 2026, Vienna, Austria, 3–8 May 2026, EGU26-19453, https://doi.org/10.5194/egusphere-egu26-19453, 2026.

EGU26-19837 | Posters on site | CL1.2.9

Climate–Floodplain Interactions in the Amazon Basin Revealed by Organic Geochemical Proxies  

Dayane Melo, Julius Lipp, Enno Schefuß, Cristiano Chiessi, André Sawakuchi, and Dailson Bertassoli

Changes in Amazonian hydrology and vegetation strongly influence global geochemical and hydrological cycles. In particular, the vast Amazon floodplains are a major source of atmospheric methane (CH₄), so variations in their extent can substantially impact the global methane budget. Understanding how these floodplains responded to past climate change, especially during periods prior to dominant anthropogenic influence, is therefore critical for constraining natural methane–climate feedbacks and their role in global climate dynamics.

Here, we investigate past vegetation and hydroclimate changes in lowland Amazonia using organic geochemical proxies from a marine sediment core offshore the Amazon River. The δD and δ¹³C signatures of long-chain n-alkanes provide information on past rainfall and vegetation dynamics, while bacteriohopanepolyol (BHP) biomarkers are used to reconstruct variations in the extent of terrestrial wetlands. We assess how climatic and environmental differences between the Holocene and earlier interglacials, particularly the Last Interglacial, influenced the expansion and contraction of Amazonian floodplains. In particular, we aim to test the hypothesis that differences in orbital-scale insolation between these periods contributed to divergent Glacial–Interglacial methane emission patterns. Funding provided by FAPESP (22/06440-1, 23/15362-7, and 25/09149-4).

Keywords: organic geochemistry, paleoclimatology, Amazon

How to cite: Melo, D., Lipp, J., Schefuß, E., Chiessi, C., Sawakuchi, A., and Bertassoli, D.: Climate–Floodplain Interactions in the Amazon Basin Revealed by Organic Geochemical Proxies , EGU General Assembly 2026, Vienna, Austria, 3–8 May 2026, EGU26-19837, https://doi.org/10.5194/egusphere-egu26-19837, 2026.

EGU26-21720 | Orals | CL1.2.9

Exploring the sensitivity of marine sediment luminescence as a new proxy for past changes in precipitation and dust supply 

Vinícius Mendes, Giorgio Battistella, Francisco Júlio do Nascimento, Rene Rojas Rocca, Cristiano Mazur Chiessi, Aline Govin, Charlotte Skonieczny, Maxime Leblanc, Julia Grigolato, Viviane Korres Bisch, Daniela Lika Nishimura, Marie Haut-Labourdette, and André Oliveira Sawakuchi

Marine sediment cores are key archives for reconstructing past environmental conditions, including continental precipitation amount and dust flux, which are essential drivers of climate variability. Commonly, precipitation is inferred from proxies such as plant-wax hydrogen isotopes (n-alkane δD) or elemental ratios (e.g., ln(Fe/Ca)). In contrast, dust supply variability is reconstructed from aeolian mass accumulation rates or normalized-constant flux (230Th or 3HeET‐normalization) methods. Although these proxies are very powerful when the sedimentary context is favorable, they can be limited by numerous factors, including material availability, post-depositional alteration, and sea-level fluctuations. Here, we explore an alternative methodology: the study of the quartz Optically Stimulated Luminescence (OSL) sensitivity. We developed a novel luminescence scanner capable of analysing intact sediment cores without the need for subsampling. The system integrates an OSL reader equipped with infrared (850 nm) and blue (480 nm) LEDs, corresponding cutoff filters (780 nm and 420 nm), and a photomultiplier tube with an ultraviolet bandpass filter (Hoya U340). An X-ray source (60 kV) provides controlled irradiation. All components are managed by custom software, Vagalume, which enables real-time control and automatic calculation of key parameters such as BOSL₁s/BOSL_total and IRSL₁s/BOSL₁s ratios, as well as X-ray voltage and current. BOSL₁s (quartz) and IRSL₁s (feldspar) were derived from the first second of the respective decay curves, while BOSL_total was calculated from integrating the whole decay curve. These parameters allow tracking changes in terrestrial sediment sources that correlate with changes in precipitation or wind patterns. Method validation was conducted on two particularly well constrained marine sediment cores: (1) site MD23-3670Q (AMARYLLIS-AMAGAS II cruise) located off the Amazonian basin from which the Southern American monsoon precipiation amounts were reconstructed for the last 60ka and (2) site MD03-2705 (PICABIA cruise) located off West Africa from which the Saharan dust flux was reconstructed for the last 240ka (Skonieczny et al., 2019). Sediment cores were scanned at 1 cm resolution, with a 3-hour acquisition time per section (1,5m). For precipitation, the luminescence results were then compared with Fe/Ca ratios obtained via X-ray fluorescence (Avaatech) on the same sediments (MD23-3670Q). In contrast, the dust-flux estimates derived from luminescence were further compared with 230Th-normalized fluxes obtained from the same sediments (MD03-2705). Our findings demonstrate that the new scanner provides reliable, high-resolution data and represents a robust alternative for reconstructing past continental precipitation and dust flux using luminescence proxies in marine sediment archives.

How to cite: Mendes, V., Battistella, G., do Nascimento, F. J., Rojas Rocca, R., Mazur Chiessi, C., Govin, A., Skonieczny, C., Leblanc, M., Grigolato, J., Korres Bisch, V., Lika Nishimura, D., Haut-Labourdette, M., and Oliveira Sawakuchi, A.: Exploring the sensitivity of marine sediment luminescence as a new proxy for past changes in precipitation and dust supply, EGU General Assembly 2026, Vienna, Austria, 3–8 May 2026, EGU26-21720, https://doi.org/10.5194/egusphere-egu26-21720, 2026.

EGU26-500 | ECS | Posters on site | CL4.15

Western Mediterranean vegetation and climate responses to MIS 14-12 glacial-interglacial variability: new insights from ODP Site 976 (Alboran Sea) 

Tiffanie Fourcade, Nathalie Combourieu-Nebout, Vincent Lebreton, Séverine Fauquette, Odile Peyron, Dael Sassoon, Mary Robles, Lionel Dubost, Carolina Cucart-Mora, and Marie-Hélène Moncel

Marine Isotope Stages (MIS) 14 to 12 (~563-424 ka) precede the Mid-Brunhes Event (~424 ka, MIS 12/11 transition), which marks a significant shift in the amplitude of glacial-interglacial cycles, and an increase in interglacial temperatures. This interval would also encompass the end of the Early-Middle Pleistocene transition (EMPT; 1.4-0.4 Ma) as defined by Head & Gibbard (2015). Despite ongoing debate regarding the precise EMPT boundaries, the MIS 14-12 interval remains crucial for understanding Pleistocene climate dynamics; particularly MIS 12 (~478–424 ka), one of the Pleistocene’s most intense Northern Hemisphere glaciations. The climatic oscillations during MIS14-12 profoundly influenced environmental conditions, potentially creating areas that were more or less favourable for human settlements in southern Spain. Archaeological data indeed show an absence of sites south of Spain during MIS 14-12 period, a pattern that could be interpreted as a possible response to environmental and climatic constraints. However, vegetation dynamics in the region during this key interval are still poorly understood due to the scarcity of available records.

Here, we present a new, continuous and regional pollen record from marine ODP Site 976 in the Alboran Sea, located south of the Iberian Peninsula. This record covers MIS 14 to MIS 12. to document the vegetation response in a climatically sensitive region. A multi-method approach, combining modern analogues, regression models and machine-learning techniques (e.g., Modern Analogue Technique (MAT), Weighted Average Partial Least Squares (WAPLS), Boosted Regression Trees (BRT), Random Forest (RF) & Climatic Amplitude Method (CAM)), are applied to the pollen data to reconstruct annual and seasonal temperature and precipitation. These results are compared with those from other western Mediterranean pollen records, as well as with the timing of human occupations recorded in an archaeological database to strengthen our understanding of settlement dynamics and their relationship with environmental changes.

The pollen data and climate reconstructions reveal significant shifts in vegetation and climate: a steppe-dominated landscape under less severe conditions during MIS 14, two phases of temperate forest expansion during MIS 13; and an enhanced steppe development under the very cold MIS 12 climate. Additionally, this study reveals three distinct climatic phases in southern Spain during MIS 13 and MIS 12, which are also recorded in several marine, pollen and Chinese loess archives. Although these archives were able to distinguish several phases within MIS 14, the resolution of our pollen record is insufficient to detect them. 

How to cite: Fourcade, T., Combourieu-Nebout, N., Lebreton, V., Fauquette, S., Peyron, O., Sassoon, D., Robles, M., Dubost, L., Cucart-Mora, C., and Moncel, M.-H.: Western Mediterranean vegetation and climate responses to MIS 14-12 glacial-interglacial variability: new insights from ODP Site 976 (Alboran Sea), EGU General Assembly 2026, Vienna, Austria, 3–8 May 2026, EGU26-500, https://doi.org/10.5194/egusphere-egu26-500, 2026.

EGU26-501 | ECS | Posters on site | CL4.15

Climatic and environmental variability of the Early–Middle Pleistocene transition in the western Mediterranean 

Maé Catrain, Nathalie Combourieu-Nebout, Vincent Lebreton, Séverine Fauquette, Odile Peyron, Sébastien Joannin, Viviane Bout-Roumazeille, Morgane Fischer-Fries, Patricia Richard, Lionel Dubost, Marion Delattre, Adele Bertini, Francesco Toti, and Marie-Hélène Moncel

The transition between the Early and Middle Pleistocene (1400-400 ka) represents a key phase of climatic system reorganization, marked by the shift in dominant orbital periodicity from 41 kyr to 100 kyr cycles. In the Mediterranean region, this transition is associated with a trend toward increasing aridity. A multi-proxy analysis was conducted on the continuous marine sediment sequence from ODP Leg 161- Site 976, in the Alboran Sea. The study integrates pollen, isotopic, and clay mineral data together with a multi-method pollen-based climate-reconstruction approach (CAM, MAT, WA-PLS, RF and BRT) and reveals contrasting dynamics among the different indicators. The isotopic records, pollen assemblages, and quantitative climate reconstructions all display variability structured by glacial–interglacial alternation. These proxies show progressive yet well-defined transitions between open cold and dry phases and warmer and more humid conditions. Between 1100 and 870 ka, the record shows a decrease in the amplitude of temperate deciduous forest development. In contrast, the clay mineral composition exhibits a distinct cyclicity that diverges from the classical glacial–interglacial rhythm, and is characterized by a series of abrupt changes, particularly pronounced between 1235 and 870 ka. These mineralogical disruptions suggest rapid reorganizations of hydro-sedimentary conditions, potentially linked to regional modifications in ocean and/or sea circulation and aeolian inputs. Altogether, the results highlight the complexity of the Early–Middle Pleistocene transition in the western Mediterranean, shaped by the superposition of global climatic forcing and regionally specific responses.

How to cite: Catrain, M., Combourieu-Nebout, N., Lebreton, V., Fauquette, S., Peyron, O., Joannin, S., Bout-Roumazeille, V., Fischer-Fries, M., Richard, P., Dubost, L., Delattre, M., Bertini, A., Toti, F., and Moncel, M.-H.: Climatic and environmental variability of the Early–Middle Pleistocene transition in the western Mediterranean, EGU General Assembly 2026, Vienna, Austria, 3–8 May 2026, EGU26-501, https://doi.org/10.5194/egusphere-egu26-501, 2026.

EGU26-2000 | ECS | Orals | CL4.15

Modelling Resilience and Adaptation to Abrupt Climate Changes in the Belgian Bronze Age: Insights from a High-Resolution Multiproxy Study 

Elliot Van Maldegem, Possum Pincé, Giacomo Capuzzo, Mathieu Boudin, Christian Burlet, Philippe Crombé, Isabelle De Groote, Guy De Mulder, Hannah Leonard, Christophe Snoeck, Sophie Verheyden, Marine Wojcieszak, Nathalie Fagel, and Koen Deforce

During the Belgian Bronze Age two major Rapid Climate Change (RCC) events occured around 4.2 and 3.2 ka. Yet, the impacts of these episodes on environments and human communities in northwestern Europe remain insufficiently understood. This contribution presents results from the Learning from the Past (LEAP) project, which examines how abrupt climate shifts influenced ecosystems, mobility patterns, and population dynamics in pre- and early-complex societies during the Middle to Late Holocene in the Meuse basin of Belgium. 

Using a high-resolution, multiproxy approach, LEAP integrates palaeoclimate data (C and O isotopes, and trace elements from speleothems), palaeoenvironmental evidence (pollen and microcharcoal from raised peat bogs), and archaeological datasets including palaeomobility indicators (O and Sr isotopes from human remains) and palaeodemographic proxies (SPDs and kernel density estimates).  

By statistically modelling and correlating these high-resolution archaeological, environmental, and climatic records, as well as comparative data from neighbouring regions, the project evaluates the synchronicity of environmental stressors and societal responses.  Leads- or lag-responses are explored, as well as handling of unequal sampling intervals, and determining the significance of signals and potential causality.  

Preliminary results point to shifts in settlement density, funerary practices, population size, and mobility that coincide with periods of climatic fluctuation and environmental change. These patterns shed light on the resilience and adaptive capacities of Belgian Bronze Age communities facing short-lived environmental changes. 

How to cite: Van Maldegem, E., Pincé, P., Capuzzo, G., Boudin, M., Burlet, C., Crombé, P., De Groote, I., De Mulder, G., Leonard, H., Snoeck, C., Verheyden, S., Wojcieszak, M., Fagel, N., and Deforce, K.: Modelling Resilience and Adaptation to Abrupt Climate Changes in the Belgian Bronze Age: Insights from a High-Resolution Multiproxy Study, EGU General Assembly 2026, Vienna, Austria, 3–8 May 2026, EGU26-2000, https://doi.org/10.5194/egusphere-egu26-2000, 2026.

EGU26-2478 | ECS | Orals | CL4.15

Role of Climate, Culture, and Waterways in Shaping the Hominin Population Dynamics 

Aneesh Sundaresan, Axel Timmermann, and Shih-Wei Fang

Past climate change and cultural evolution played significant roles in the migration of archaic humans into new geographic areas, contributing to the diversification of the genus Homo. The Mid-Pleistocene period was a critical time when Homo heidelbergensis evolved in Africa and migrated to Eurasia, likely leading to the emergence of new human species, including Homo neanderthalensis and Denisovans. The present study investigates how past climate, rivers, and cultural changes affected possible hominin migration routes to northwest Africa and Eurasia, as well as the timing of their arrival. To identify migration pathways across Africa and Eurasia, we conducted an ensemble of sensitivity experiments using a realistic climate-forced agent-based model (ABM) with varying cultural levels and with coastal and riverine routes enabled or disabled. In the absence of coastal and riverine activation and low cultural levels, the hominin population remains confined to southern and eastern Africa. However, with higher cultural evolution, they could reach north-west Africa via the western Saharan route.

The ABM simulations with river and coastal amplification show that the hominin populations migrated to north-eastern Africa via the Nile route at low cultural levels. However, with increased levels of culture, they could reach north-western Africa through the Nile-Mediterranean coastal route, and the north-western African population shows intermittent interaction with the west-central population. Also, over a short period, they dispersed into Eurasia via the Levant and migrated into Europe. Thus, coastal and riverine amplification helped the hominin reach north-western Africa and Europe with relatively low cultural values at the beginning of the middle Pleistocene period, which closely matches the Homo heidelbergensis archaeological record. Additional analysis of our simulations reveals that the precessional cycle played a dominant role in controlling the hominin migration through the corridors. At the same time, population density in African population hotspot regions was controlled by changes in atmospheric CO2 concentration. The phylogenetic analysis of the individual virtual agents' DNA shows distinct branches for the north-west, central, and south-east African populations. Since low-frequency climate cycles isolate and reconnect north-west and central African populations with east and south African populations, they contribute to the dynamics of genetic diversity.

How to cite: Sundaresan, A., Timmermann, A., and Fang, S.-W.: Role of Climate, Culture, and Waterways in Shaping the Hominin Population Dynamics, EGU General Assembly 2026, Vienna, Austria, 3–8 May 2026, EGU26-2478, https://doi.org/10.5194/egusphere-egu26-2478, 2026.

EGU26-2986 | Posters on site | CL4.15

Understanding multi-hazard disturbance regimes as macro-ecological drivers of biodiversity 

Sarah Hülsen, Katharina Runge, Chahan Kropf, David Bresch, and Laura Dee

Natural disturbances shape ecosystems by redistributing biomass, resources, and mortality across space and time. While the ecological effects of individual disturbance types (e.g. fire, floods, storms) are well studied, a globally consistent assessment of how multiple disturbance types combine into long-term disturbance regimes, and how these regimes relate to biodiversity patterns, is still lacking at the macroecological scale.

Previous work (Kropf et al. in prep) presented 'hazomes,' a novel classification system of the earth based on hazard profiles, which is distinct from existing frameworks such as climate zones that categorize earth according to average conditions. Building up on this, we utilize a disturbance score based on eight different natural hazards (including heavy precipitation, earth quakes, tropical cyclones, cold spells, heat stress, coastal and river floods, water deficit, and wildfires), and their frequency of occurrence at different intensities. Unlike other commonly used climate descriptors such as mean temperature and precipitation, this approach captures the historical disturbance regimes ecosystems have been exposed to, providing a complementary perspective on the environmental drivers of biodiversity.

By correlating the disturbance index with biodiversity indicators, such as species richness across taxa, we find biome-specific disturbance-biodiversity relationships. While climate is understood to be a key driver of global biodiversity patterns, our research implies disturbance regimes may be key to understanding biodiversity patterns within areas of similar climatic conditions. These findings highlight disturbance regimes as an underexplored dimension of biogeography and suggest that biodiversity patterns reflect long-term exposure to disturbance, not only to climate. As climate change increasingly alters the frequency and intensity of natural hazards, understanding how ecosystems have been shaped by historical disturbance regimes is critical for anticipating future biodiversity responses.


Kropf, C. M., Hülsen, S., Stalhandske, Z., Hantson, S., Ward, P. J., Wens, M., Peleg, N., Bresch, D. N., & Steinmann, C. B. (in prep). Hazomes: Earth’s natural multi-hazard terrestrial disturbance regimes. EarthArXiv. https://eartharxiv.org/repository/view/10580/

How to cite: Hülsen, S., Runge, K., Kropf, C., Bresch, D., and Dee, L.: Understanding multi-hazard disturbance regimes as macro-ecological drivers of biodiversity, EGU General Assembly 2026, Vienna, Austria, 3–8 May 2026, EGU26-2986, https://doi.org/10.5194/egusphere-egu26-2986, 2026.

The dispersal of Homo sapiens out of Africa represents a key transition in human prehistory, yet the timing, routes, and environmental mechanisms underlying the expansion into East Asia remain debated. Fossil and archaeological evidence suggests the presence of anatomically modern humans in southern China by at least ~80 ka, but the relative importance of different migration corridors is still unresolved.

Three potential dispersal pathways into East Asia have been proposed: a southern coastal route through South and Southeast Asia, a northern inland route via Central Asia and southern Siberia, and a more speculative interior route through the Tarim Basin. While these routes have been widely discussed, most previous studies remain qualitative, and quantitative assessments of how Late Pleistocene climate variability shaped human existence potential and migration pathways are limited.

Here, we apply a Human Dispersal Model (HDM) based on the Human Existence Potential (HEP) framework to explore climate-based constraints on human migration into East Asia between 80 and 30 ka. Palaeoclimate simulations and archaeological site data are combined using a logistic regression approach to estimate HEP through time. The resulting HEP fields are then used to drive dispersal simulations, allowing us to explore potential migration pathways and corridors under different climatic conditions. This modelling framework provides a quantitative perspective on how Late Pleistocene climate variability may have influenced human dispersal into East Asia.


How to cite: Liang, G. and Shao, Y.: Modelling climate-based human existence potential and dispersal of Homo sapiens into East Asia (80–30 ka), EGU General Assembly 2026, Vienna, Austria, 3–8 May 2026, EGU26-3069, https://doi.org/10.5194/egusphere-egu26-3069, 2026.

Hydroclimatic variability has significantly influenced societal dynamics in arid Central Asia (ACA), by triggering periods of unrest and migration. The western part of ACA, a key node of the ancient Silk Roads, remains poorly investigated due to limited climatic and environmental records, hindering our understanding of how environmental changes shaped the evolution of civilization in this region. This study uses records of high-resolution scanning XRF (X-Ray Fluorescence), n-fatty acids, and grain size from the sediments of Green Spring Lake, in northeastern Iran, within the historically prominent region of Greater Khorasan. This record is then used to reconstruct the regional hydroclimatic variability over the past 1,350 years. It reveals a generally dry and stable climate during the Medieval Climate Anomaly (950–1250 CE), a pronounced drought during 1250–1350 CE, and a transition to wetter conditions accompanied by increased hydroclimatic variability during the Little Ice Age (1400–1850 CE). During the LIA, increased moisture supply to northeastern Iran was caused by a negative NAO phase in spring, coupled with anomalous ascending atmospheric motion caused by the weakening of the Siberian High, which jointly led to increased spring precipitation in this region. Additionally, drought events during 970–1040 CE, 1220–1250 CE, 1480–1520 CE, 1600–1650 CE, and 1850–1910 CE align with documented events in eastern Iran, including severe famines and population declines, as recorded in historical Iranian sources.

How to cite: Xie, H.: Decadal hydroclimate fluctuations recorded in lake sediments from northeastern Iran over the past 1350 years, EGU General Assembly 2026, Vienna, Austria, 3–8 May 2026, EGU26-4595, https://doi.org/10.5194/egusphere-egu26-4595, 2026.

EGU26-6137 | Orals | CL4.15

Homo longi, Denisovans, Neanderthals, and other archaic hominins in eastern Asia prior to the Rise of Homo sapiens 

Fahu Chen, Jingkun Ran, Huan Xia, Song Xing, and Hao Li

Archaic hominin fossils from East Asia dating to the late Middle Pleistocene and Late Pleistocene display substantial morphological diversity, and their systematic classification has long remained controversial. In this Perspective, we integrate morphological evidence with recent advances in molecular research to re-evaluate the evolutionary landscape of archaic hominins in East Asia prior to the emergence of Homo sapiens, with particular focus on the Harbin cranium and its implications for the taxon Homo longi. Recent paleoproteomic and ancient DNA studies indicate that the Harbin cranium carries Denisovan-related genetic and proteomic signatures and is closely affiliated with Denisovan lineages identified at Xiahe, Penghu, and in the Altai Mountains. When viewed in a broader morphological context, the Harbin cranium and the Xiahe mandible form a sister grouping, together with fossils from Dali, Jinniushan, and Hualongdong, suggesting a coherent East Asian archaic hominin “Homo longi” clade. We propose a unifying taxonomic framework in which East Asian Denisovan populations are provisionally referred to as Homo longi, and discuss the possibility that this lineage comprised multiple deeply divergent populations with the capacity to occupy diverse ecological niches, including high-altitude environments. Future research integrating additional ancient genomes, proteomic data, and high-precision chronologies will be essential to further elucidate the origins, dispersal, environmental adaptations, and contributions of Homo longi populations to the formation of modern humans in East Asia.

How to cite: Chen, F., Ran, J., Xia, H., Xing, S., and Li, H.: Homo longi, Denisovans, Neanderthals, and other archaic hominins in eastern Asia prior to the Rise of Homo sapiens, EGU General Assembly 2026, Vienna, Austria, 3–8 May 2026, EGU26-6137, https://doi.org/10.5194/egusphere-egu26-6137, 2026.

EGU26-6843 | ECS | Posters on site | CL4.15

Occupation and settlement through time: Applying the human existence potential model to European societies 

Christian Wegener and Yaping Shao

The rising number of climate reconstructions of the past utilizing both proxy data and climate models enable further numerical model based research of human occupation and settlement patterns. In conjunction with statistical, numerical or machine learning powered spatial downscaling methods, spatial resolutions can be achieved that better fit with the scale of human-landscape interactions. This study gives an overview of combinations of archaeological site distribution data with paleoclimate reconstructions and additional environmental data by using the Human Existence Potential (HEP) model. The focus lies on European societies starting from the first hunter-gatherer occupation of modern humans in Europe roughly 50k years before present to the earliest farming societies that settled down around 7.5k years ago. The resulting potential fields allow occupation and settlement pattern analysis as well as further use for other applications within the “Our Way” Framework of population dynamics modeling. This framework includes an agent-based model for small scale dynamics and a density based model for continental scale dispersal.

How to cite: Wegener, C. and Shao, Y.: Occupation and settlement through time: Applying the human existence potential model to European societies, EGU General Assembly 2026, Vienna, Austria, 3–8 May 2026, EGU26-6843, https://doi.org/10.5194/egusphere-egu26-6843, 2026.

EGU26-7184 | ECS | Posters on site | CL4.15

Learning the Green Wave: A Hybrid Machine Learning Framework for Reconstructing Past Vegetation Dynamics 

Philipp Schlüter and Yaping Shao

Understanding the seasonal timing of vegetation growth ("Green Wave") is crucial for modeling prehistoric human mobility and settlement patterns. However, high-resolution vegetation data is only available for the modern satellite era. To reconstruct these dynamics in the deep past, we present a hybrid modeling approach that combines domain-specific knowledge of seasonality with the flexibility of supervised machine learning.

Our core premise is that while we cannot observe the past directly, we can learn the rules of phenology from the present. We utilize global modern datasets to learn a mapping between climatic conditions and vegetation greenness, which can then be applied to paleoclimate simulations.

Our method decomposes the problem. First, we compress modern satellite observations into compact, interpretable parameters using a harmonic seasonal model. Second, we train a machine learning regressor to learn the complex, non-linear mapping between bioclimatic drivers and these phenological parameters. By treating the seasonal shape as a prediction target, we ensure that our reconstructions maintain structural integrity. We validate the model using spatially-disjoint cross-validation to account for spatial autocorrelation, ensuring robust generalization. The resulting framework allows us to translate paleoclimate simulations into high-resolution maps of ancient vegetation seasons, providing new quantitative inputs for archaeological hypotheses.

How to cite: Schlüter, P. and Shao, Y.: Learning the Green Wave: A Hybrid Machine Learning Framework for Reconstructing Past Vegetation Dynamics, EGU General Assembly 2026, Vienna, Austria, 3–8 May 2026, EGU26-7184, https://doi.org/10.5194/egusphere-egu26-7184, 2026.

EGU26-7510 | Posters on site | CL4.15

Palaeotemperature calibration of palynological assemblages and palaeovegetation through the last stage of the Late Palaeozoic Ice Age  

Michael Henry Stephenson, Shuzhong Shen, Junxuan Fan, Linshu Hu, and Jin Qi

The Late Palaeozoic Ice Age (LPIA), was one of Earth's most extensive and long-lasting glacial episodes, spanning roughly from 350 to 260 Ma. The Arabian Peninsula is long known to have experienced the LPIA at its position at the northern edge of Gondwana throughout the Late Carboniferous (Pennsylvanian) to the Early Permian (Cisuralian) and particularly the deglaciation that occurred from the latest Gzhelian, through late Sakmarian/early Artinskian to mid-Kungurian. Modelling of Mean Annual Surface Temperature (MAST; Li et al. 2022) for this period superimposed on palaeogeographic maps based on PaleoDEM and points/polyline/polygon (rotation and geometry files) of Scotese and Wright (2018) allows temperature-calibration of the succession of palynological assemblages. A number of trends and generalisations are possible related to MAST change between -0.2°C to -3.4°C  (latest Gzhelian) and 9.3°C to 11.1°C (mid-Kungurian). As a group, the plants that produced monosaccate pollen (now extinct) appear amongst the most tolerant of MAST increase, with certain genera, for example Plicatipollenites and Cannanoropollis, being common throughout. Punctatisporites probably produced by the simplest most cold-adapted plants such as mosses were the most sensitive to climate warming. Cingulicamerate spores and fern spores of Microbaculispora and Horriditriletes are similarly sensitive to warming conditions particularly as MAST reaches above 0°C. MAST above 0°C appears to have stimulated a surge of caytonialean-type, probably upland, trees or shrubs that produced Pteruchipollenites indarraensis, although continued warming seems to have been at least partly responsible for restricting their distribution because such plants are almost absent at 208 Ma where MAST is ~10°C. Kingiacolpites subcircularis, probably produced by a cycad, may, also have been stimulated by MAST reaching above 0°C. Some of these trends in palaeovegetation in response to climate warming may have relevance in studies of modern environmental change.

How to cite: Stephenson, M. H., Shen, S., Fan, J., Hu, L., and Qi, J.: Palaeotemperature calibration of palynological assemblages and palaeovegetation through the last stage of the Late Palaeozoic Ice Age , EGU General Assembly 2026, Vienna, Austria, 3–8 May 2026, EGU26-7510, https://doi.org/10.5194/egusphere-egu26-7510, 2026.

The Holocene in the Korean Peninsula offers an ideal natural laboratory for evaluating long-term interactions among climate, vegetation, fire, and human activity. We present high-resolution pollen and sedimentary charcoal records from paleo-lake Gaho in southern Korea covering the last ~7,000 years, and derive quantitative reconstructions of mean annual temperature and annual precipitation using the modern analogue technique and an extensive modern pollen dataset. The temperature estimates (approximately 9–12°C) capture millennial-scale variability linked to changes in the East Asian winter monsoon and Bond-scale events, whereas reconstructed precipitation (around 1,250–1,540 mm) follows shifts in the Intertropical Convergence Zone and the strength of the East Asian summer monsoon. Hydroclimate signals inferred from pollen are consistent with lake-level changes, geochemical indicators, and multivariate statistical analyses. Charcoal influx records indicate persistent fire occurrence throughout the Holocene, with a marked rise in large-scale burning around 5.0–4.0 ka BP, likely associated with progressive drying and increased fuel availability. After ~3.0 ka BP, the appearance of abundant large Poaceae pollen (>40 μm) suggests expansion of agriculture, and pronounced fluctuations in Pinus and Quercus after ~2.0 ka BP indicate intensifying human disturbance. We infer that late Holocene fires were increasingly anthropogenic, associated with land clearance, warfare, and metallurgical activities rather than purely climatic forcing. Overall, our results demonstrate the coupled evolution of climate, ecosystem dynamics, and human impact in southern Korea during the Holocene, providing important context for anticipating ecosystem responses under ongoing climate change.

How to cite: Lee, J. and Yi, S.: Tracking Holocene climate, fire, and human activities in southern Korea using pollen and charcoal records., EGU General Assembly 2026, Vienna, Austria, 3–8 May 2026, EGU26-8569, https://doi.org/10.5194/egusphere-egu26-8569, 2026.

EGU26-8730 | Posters on site | CL4.15

A predator-prey model for Pleistocene global vegetation and wildfire dynamics 

In-Won Kim, Axel Timmermann, and Sarthak Mohanty

Global vegetation patterns are not only determined by climate, water availability, and soil conditions, but also by the dynamics of seed/plant dispersal, competition, herbivory, and fire. To account for these processes, we developed a new dynamical vegetation model (ICCP Global Vegetation Model) based on coupled 2D Lotka-Volterra equations that also includes plant and fire diffusion. The model simulates the area fraction of three plant functional types (grass, shrubs, and trees) and fire. Fire is introduced as a stochastic predator that "feeds" on available burnable carbon and emerges when climate conditions are suitable. The climate dependence of the competing plant functional types is calculated from a species distribution model that calculates habitat suitability from key climatic parameters. The model can also account for herbivore grazing, which is estimated from the ICCP Global Mammal model. In this presentation, we will compare transient Pleistocene simulations conducted with the ICCP Global Vegetation Model with Biome4 model simulations and time-slice vegetation reconstructions for the mid-Holocene (6 ka) and the Last Glacial Maximum (21 ka).

How to cite: Kim, I.-W., Timmermann, A., and Mohanty, S.: A predator-prey model for Pleistocene global vegetation and wildfire dynamics, EGU General Assembly 2026, Vienna, Austria, 3–8 May 2026, EGU26-8730, https://doi.org/10.5194/egusphere-egu26-8730, 2026.

EGU26-8838 | ECS | Orals | CL4.15

A coupled vegetation–mammal modeling framework for Earth system models 

Sarthak Mohanty, Axel Timmermann, Thushara Venugopal, and In-Won Kim

Terrestrial vegetation models are typically based on quasi-empirical or dynamical relationships that link climatic, soil, nutrient, and land-use conditions to the presence of different plant taxa, biomes, or plant functional types. The majority of these models neither include plant seed dispersal nor herbivore grazing effects, potentially leading to a misrepresentation of climate-biosphere feedbacks. Both of these factors, however, are known to play a critical role in the global distribution of plant types. 

In this presentation, we will introduce a new coupled global model with a 1x1 degree horizontal resolution that integrates vegetation dynamics with mammal herbivory. The vegetation model (ICCP global vegetation model, IGVM) simulates the fractional cover of grass, shrubs, trees, and desert using coupled reaction-diffusion equations. These quantities are translated into net primary productivity (NPP) through a non-parametric empirical method. The mammal model (ICCP global mammal model, IGMM) - also based on coupled reaction diffusion dynamics - realistically simulates the biomass of over 2,100 mammal species worldwide and has been extensively validated against observational datasets. The NPP from the vegetation model determines the biomass of individual herbivore species through their carrying capacities. In turn, herbivore grazing acts as a sink for vegetation carbon, and this effect is mapped back onto grass, shrub, and tree fractions in the vegetation model. Furthermore, the impact of mammal-mediated seed dispersal can be estimated.

By running the fully coupled model with and without mammal grazing, we determine the impact of mammal distributions on pre-Anthropocene global vegetation biogeography. This allows us to directly test the “Zimov Vegetation Hypothesis” and document the effects of trophic coupling on ecosystem functionality and stability at global-to-regional scales. We will further discuss how this new coupled modeling framework can be implemented into Earth System models.

How to cite: Mohanty, S., Timmermann, A., Venugopal, T., and Kim, I.-W.: A coupled vegetation–mammal modeling framework for Earth system models, EGU General Assembly 2026, Vienna, Austria, 3–8 May 2026, EGU26-8838, https://doi.org/10.5194/egusphere-egu26-8838, 2026.

Among wild pollinators, diurnal butterflies are important in natural ecosystems and contribute significantly to agricultural productivity. Worryingly, a growing body of literature suggests that Climate Change (CC) may result in the extinction and decline of many butterfly species. Understanding which species and areas are most vulnerable to CC is essential for planning conservation and mitigation efforts. In this work we present the main results obtained during LIFE project BEEadapt (LIFE21-CCA-IT-LIFE BEEadapt/101074591) which aims to improve wild pollinator climate resilience in four areas in Central Italy, including protected areas, natural and agro-ecosystems.

Results show first that CC signals are evident in all the studied areas in terms of increased temperatures, and increased extreme events, both in intensity and frequency. Furthermore, they show that butterflies have a consistent vulnerability pattern at both the species and multispecies level. In the study areas, CC appears to favor lowland and generalist species, which increase their climatic suitability under both scenarios, particularly in mountains. Mountain and specialist species are expected to have reduced climatic suitability, especially under the SSP5-8.5.

Findings are comparable with recent studies on the effects of CC on pollinators, which revealed similar sensitivity patterns based on species ecology, and provided new insights into species potential local responses to CC, allowing to set conservation priorities and direct LIFE BEEadapt mitigation actions which need to be combined with the definition of governance strategies and the involvement of key actors at different spatial levels.

How to cite: Baldi, M. and Biancolini, D.: How climate change impacts on wild pollinators: the case of butterflies in Central Italy, EGU General Assembly 2026, Vienna, Austria, 3–8 May 2026, EGU26-8952, https://doi.org/10.5194/egusphere-egu26-8952, 2026.

How global vegetation responded to climate change since the Last Glacial Maximum (LGM) remains incompletely understood due to the lack of continuous, global-scale reconstructions. Here we present a millennial-resolution reconstruction of global vegetation patterns since the LGM based on a synthesis of 3,286 pollen records using a biomization framework. We show that tundra dominated the mid- to high-latitudes of the Northern Hemisphere during the LGM, while steppe and open coniferous forests characterized western North America, taiga prevailed in eastern North America, and extensive steppe covered much of Eurasia. In the tropics, rainforest extent was markedly reduced, accompanied by widespread expansion of arid shrublands across Africa.

We find that forest expansion following deglaciation was spatially asynchronous across latitudes and hemispheres. Global forest cover increased by ~31% from the LGM to the mid-Holocene, before declining by ~5% during the late Holocene. In the Northern Hemisphere mid- to high-latitudes, forest cover rose rapidly after the LGM, peaked between ~7 and 5 ka BP, and subsequently declined, whereas Southern Hemisphere mid-latitudes experienced a more gradual increase, reaching maximum forest extent earlier (~12–8 ka BP) and remaining relatively stable thereafter. Tropical regions exhibited the most heterogeneous trajectories, with early deglacial fluctuations, sustained expansion to a mid-Holocene maximum (~6–4 ka BP), and enhanced variability in the late Holocene.

Our results reveal pronounced asynchrony in global vegetation evolution and provide a biome-scale perspective that refines previous global reconstructions. This dataset establishes a benchmark for evaluating palaeovegetation simulations and offers new constraints on vegetation–climate feedbacks relevant to future ecosystem change.

How to cite: Wu, H., Geng, J., Zhang, W., Li, Q., and Yu, Y.: Spatiotemporal Evolution of Global Vegetation Since the Last Glacial Maximum: Insights from Quantitative Pollen Reconstructions, EGU General Assembly 2026, Vienna, Austria, 3–8 May 2026, EGU26-9191, https://doi.org/10.5194/egusphere-egu26-9191, 2026.

Reconstructing the spatiotemporal features of past climate variability and assessing its influence on societal change are essential for understanding long-term human–environment co-evolution and for informing contemporary climate adaptation. The “4.2 ka event” (around 4.2 ka BP) has long been regarded as a major hydroclimatic anomaly marking the onset of the Late Holocene and has frequently been invoked to explain major societal disruptions across multiple regions. However, expanding and increasingly detailed proxy records have challenged both the presumed global uniformity of this event and the magnitude of its societal impacts.

To address these debates, this study conducts a global transient simulation for 4.5–3.5 ka BP using the Community Earth System Model (CESM) to obtain continuous climate fields across Eurasia and to evaluate whether the 4.2 ka anomaly represents coherent regional change or spatially heterogeneous variability. In parallel, we compile archaeological cultural sequences and key regional syntheses across Eurasia, and delineate seven sub-regions based on subsistence strategies and environmental settings. By comparing the spatiotemporal pattern of climate anomalies with trajectories of social change within each sub-region, we examine plausible pathways through which climate perturbations may have shaped early societal dynamics.

Our results indicate that the 4.2 ka signal is widespread across Eurasia but is far from uniform: anomaly intensity, persistence, and hydroclimatic expression exhibit pronounced spatial heterogeneity. Such heterogeneity implies region-specific societal consequences, ranging from amplified stress and risk accumulation in some socio-ecological settings to the reorganization of resources and interregional connectivity in others. These differential impacts may have contributed to divergent developmental pathways among early societies, including those in early China, the Harappan world, Mesopotamia, the Mediterranean, and the Eurasian steppe. Overall, our findings underscore the need to move beyond deterministic “collapse vs. flourishing” narratives and toward process-based, regionally explicit mechanisms linking climate variability and social change.

How to cite: Han, L., Yang, H., and Liu, M.: Spatiotemporal Characteristics of the 4.2 ka Climate Event Across Eurasia and Its Implications for Early Societal Trajectories, EGU General Assembly 2026, Vienna, Austria, 3–8 May 2026, EGU26-9369, https://doi.org/10.5194/egusphere-egu26-9369, 2026.

EGU26-9467 | ECS | Orals | CL4.15

Past Climate and Cultural Impacts on African Human Genetic Diversity  

Shih-Wei Fang, Pasquale Raia, Aneesh Sundaresan, Chiara Barbieri, Jiaoyang Ruan, Ali R. Vahdati, Elke Zeller, Christoph Zollikofer, and Axel Timmermann

Total genomic diversity in humans increases when populations are isolated from each other for extended periods. However, the role of past astronomically forced climate conditions in the generation of human diversity remains unresolved. Here, we employ an agent-based model with genetic inheritance, a representation of culture, and realistic climate conditions to simulate the genetic history of African hominin populations throughout the Pleistocene. Our simulations of human population density and DNA changes show the dominant effect of Milanković cycles on dispersal, population structure, and genomic diversity. Warm early Pleistocene climates supported a heterogeneous patchwork of genetically diverse subpopulations across Africa. However, with the onset of colder conditions and reduced food resources at ~900 thousand years ago, human populations disappeared everywhere except in southern and eastern Africa. The corresponding simulated rapid decline in nucleotide diversity during this time is consistent with archaeological and genomic evidence. Following this regime change, humans began adapting to harsher climatic conditions, leading to rapid population expansions across the continent during interglacials. Boosted further by the spread of cultural traits and facilitated by warm, wet climate corridors over the last 400 thousand years, eastern African hominin populations eventually dispersed into Eurasia, contributing to the emergence of new geographically isolated populations and distinct genomic lineages.

How to cite: Fang, S.-W., Raia, P., Sundaresan, A., Barbieri, C., Ruan, J., Vahdati, A. R., Zeller, E., Zollikofer, C., and Timmermann, A.: Past Climate and Cultural Impacts on African Human Genetic Diversity , EGU General Assembly 2026, Vienna, Austria, 3–8 May 2026, EGU26-9467, https://doi.org/10.5194/egusphere-egu26-9467, 2026.

EGU26-13603 | ECS | Orals | CL4.15

Reconstructing the Environmental History of the Bear River Massacre Site, Idaho, USA 

Emma Layon, Jennifer Watt, Emel Aichele, Andrea Brunelle, and Brian Codding

In 1863, the Bear River Massacre took place in Southeastern Idaho, USA, where about 400 members of the Northwestern Band of the Shoshone Nation were murdered by the United States Government. The massacre caused significant ecological land changes from the massacre itself but also from the colonization of the land, which presented land use changes and the introduction of invasive species. The tribe has since received 350 acres of their traditional land back from the government, but the land has been vastly altered since their ancestors lived on it. The Bear River restoration project, led by the Shoshone tribe, was created with the aim to bring the native vegetation back to the land and to allow the tribe to learn about the relationship between their ancestors and the resources they used. 

This research is contributing to the tribe’s restoration goals by reconstructing the past vegetation and environmental history of the Bear River Massacre Site using a quantitative, multiproxy paleoecological approach. The primary questions of concern that we aim to answer for the tribe are what was the native vegetation like when their ancestors lived on the land, and what is the environmental history of the site being a spring. The methodological approach to answer these questions will utilize pollen counts and loss on ignition from a wetland sediment core collected from a spring along the Bear River to reconstruct the paleoenvironment and identify past changes and disturbances in the environment. 

How to cite: Layon, E., Watt, J., Aichele, E., Brunelle, A., and Codding, B.: Reconstructing the Environmental History of the Bear River Massacre Site, Idaho, USA, EGU General Assembly 2026, Vienna, Austria, 3–8 May 2026, EGU26-13603, https://doi.org/10.5194/egusphere-egu26-13603, 2026.

Climate and vegetation are inherently intertwined through feedbacks that are still not fully understood. Reconstructing past climate-vegetation interactions is challenging because plants have undergone evolutionary, physiological, and ecological changes that cannot be inferred from the present day vegetation. Here we investigate a range of potential vegetation/climate states that could have existed 3 million years ago with the use of the BIOME4 vegetation model, pollen data, and iCESM1.3 mid-Pleistocene model simulations,. The BIOME4 model is widely used to reconstruct paleo vegetation although the plant phenology parameterization is based on modern day vegetation types. We explore the sensitivity of the model to the plant phenology parameterization and the space of possible vegetation distributions to find best fits to pollen data. With the use of iCESM1.3 we estimate the range of vegetation related climate uncertainties showing that this can cause local to global changes impacting e.g. arctic amplification and global circulations.

How to cite: Zeller, E.: Vegetation related climate uncertainty during the mid-Pleistocene warm period, EGU General Assembly 2026, Vienna, Austria, 3–8 May 2026, EGU26-13794, https://doi.org/10.5194/egusphere-egu26-13794, 2026.

EGU26-15242 | Orals | CL4.15

Turnover pulses, intermittent stability and trends — on the time scales of large mammal evolution 

Andrej Spiridonov, Shaun Lovejoy, Simona Bekeraitė, and Robertas Stankevič

The Mammal fossil record is long recognized as an excellent source for testing the causality of evolutionary change. The large mammal evolution shows a wide diversity of patterns including so called turnover pulses (high magnitude random impulses of extinctions and originations), periods of taxonomic stasis, while also there is plenty of evidence for long-term trends in morphological traits and taxonomic diversity. The major question is: how can we reconcile such a diversity of dynamical regimes given that we are having a single history of life?In this contribution we approach this question of dynamical regimes from the scaling perspective. The shapes of species diversity curves were reconstructed using spatio-temporal occurences of Perissodactyla, Artiodactyla (excluding Cetacea) and Carnivora (excluding Pinnipedia) from the NOW (New and Old Worlds) database by applying the Bayesian PyRate approach. The derived diversity curves were analyzed applying Haar fluctuations which were used in constructing structure functions, which reveal typical fluctuation magnitudes as a function of time scales.The results reveal that there are three separate time scales characterized by contrasting regimes. At shorter macroevolutionary time scales the episodic events produce turnover pulse patterns with the magnitudes peaking at time scales around 2 Ma. At time scales ranging from 3 to 5 Ma the stabilizing processes dominate. And the longer time scale the positive scaling trends in diversity dominate the biodiversity change. These longest time scale changes in biodiversity are directly coupled with the long-term megaclimate drift. The large mammal evolution is shaped by the superposition of qualitatively different processes operating on three time scales. The separation of time scales is shaped by the climate-macroclimate-megaclimate transitions and internal biotic feedbacks.
The study was supported by the project S-MIP-24-62 BretEvoGeneralized.

How to cite: Spiridonov, A., Lovejoy, S., Bekeraitė, S., and Stankevič, R.: Turnover pulses, intermittent stability and trends — on the time scales of large mammal evolution, EGU General Assembly 2026, Vienna, Austria, 3–8 May 2026, EGU26-15242, https://doi.org/10.5194/egusphere-egu26-15242, 2026.

Due to processes such as climate change, construction, and agricultural expansion, natural habitats have become fragmented and functionally degraded. As a result, numerous wildlife species are forced to migrate to new suitable habitats. During these migrations, their ranges increasingly overlap with human activities, creating potential risks for human-wildlife conflicts. Unlike previous studies relying merely on species distribution models, this study innovatively predicts future human-wildlife conflict risks during wildlife migration driven by habitat degradation in Southwest China in 2030 and 2050. By integrating habitat degradation assessments under multiple climate change and socio-development scenarios with species migration path simulations employing landscape ecology methods, alongside land-use modeling and human footprint data, this study quantifies conflict risks between humans and wildlife species such as takin and wild boar while classifying conflict types. Building upon historical and current conditions, the findings demonstrate that future climate change and human activities will trigger large-scale habitat degradation and significant spatial shifts in suitable habitats. Consequently, a chain reaction—involving increased conflicts, wildlife capture, and questioning of conservation actions—threatens the harmonious relationship between humans and wildlife. This research offers a complementary perspective on understanding climate change impacts on terrestrial life and holds significant value for guiding the optimization of biodiversity conservation planning and policy development.

How to cite: Li, Q. and Jin, X.: Mapping future human-wildlife conflict risks during habitat degradation and species migration driven by climate and human factors in Southwest China, EGU General Assembly 2026, Vienna, Austria, 3–8 May 2026, EGU26-15372, https://doi.org/10.5194/egusphere-egu26-15372, 2026.

EGU26-15702 * | ECS | Orals | CL4.15 | Highlight

Rapid vegetation changes of the late Quaternary 

Mateo Duque-Villegas, Thomas Kleinen, Victor Brovkin, and Martin Claussen

During glacial cycles of the late Quaternary, terrestrial vegetation changed globally in response to orbitally controlled insolation changes, variable levels of carbon dioxide, and availability of ice-free land. As they developed, the emerging vegetation patterns also in turn influenced climatic and carbon cycle trends via biogeophysical and biogeochemical feedbacks. Although such trends are clearly seen in proxy data covering glacial cycles, the vegetation patterns still remain poorly constrained due to short, scarce and discontinuous plant fossil and pollen records. For understanding the varying vegetation patterns, and for assessing terrestrial sources and causes of rapid atmospheric greenhouse gas changes, we have simulated the entire last glacial cycle, covering over 130,000 years, using an Earth system model with dynamic vegetation, carbon pools and methane emissions. In line with proxy records, our simulation shows an Eemian interglacial globally warmer than the preindustrial era, with slightly more boreal forest cover and a greener Sahara, while the simulated much colder Last Glacial Maximum, has larger subtropical deserts, more boreal tundra and fragmented tropical forests. We separate regions where vegetation change is mainly bound to forcing from ice-sheet extent (and sea level) or carbon dioxide fertilization, or the result of a feedback response to climate change. Regions where the feedbacks with climate are strong, like in northern Africa where there is hydroclimate-driven vegetation growth, and eastern Siberia where there is thermally-driven taiga-tundra turnover, the vegetation responses are highly dynamic, including a clear precessional signal that propagates to land carbon allocation and greenhouse gas emissions. Such regions have the largest potential to contribute to rapid changes in atmospheric greenhouse gases, besides any fast changes that depend directly on cryosphere or sea-level dynamics. In contrast, large parts of the tropics have vegetation with a muted response to climate change, and rapid coverage changes within this region may only occur when there are sudden changes in carbon dioxide fertilization.

How to cite: Duque-Villegas, M., Kleinen, T., Brovkin, V., and Claussen, M.: Rapid vegetation changes of the late Quaternary, EGU General Assembly 2026, Vienna, Austria, 3–8 May 2026, EGU26-15702, https://doi.org/10.5194/egusphere-egu26-15702, 2026.

The impacts of both natural and human-induced climate change are evident across the pine (Pinus) dominated forests of the Northern Rocky Mountains, USA. Paleoecological records have been used to investigate climate driven vegetation change and the complexities of fire disturbance in these forests over the Holocene, providing important information to the development of forest management plans and fire suppression protocols. 

Mountain pine beetle (Dendroctonus ponderosae) (MPB) outbreaks have also influenced ecosystem change in the Northern Rocky Mountains. However, little is known about the occurrence of MPB outbreaks beyond the historic time period (past 200 years). Without direct evidence (fossil beetle remains) to identify MPB outbreaks in paleoecological records, it has been challenging to identify the timing and frequency of outbreaks over a longer time period (Holocene) and to demonstrate how unusual the patterns of the past 200 years are. The increase in MPB outbreaks in the historic time period has been attributed to increasing temperatures affecting the reproductive cycle of the beetles and the weakening of the defense mechanisms in pine species. Understanding the frequency of MPB outbreaks and forest response over the Holocene is helping land managers better plan for the future management strategies of these iconic landscapes. 

This project used both traditional paleoecological time series analysis and quantitative analysis (regression analysis and machine learning) to investigate the frequency and timing of MPB outbreaks over the Holocene and identify patterns related to climate change. The data presented are from a series of sites across an elevational and latitudinal gradient in the Northern Rocky Mountains, USA and includes periods of high resolution (every cm) paleoecological proxy data. Initial findings indicate a positive relationship between MPB outbreaks and pine (Pinus) dominance on the landscape and more frequent MPB outbreaks during the historic time period than during any other time throughout the Holocene.

How to cite: Watt, J., Codding, B., and Brunelle, A.: Using Regression Analysis and Machine Learning to Investigate the Connection Between Mountain Pine Beetle (Dendroctonus ponderosae) Outbreaks and Human-Induced Climate Change, EGU General Assembly 2026, Vienna, Austria, 3–8 May 2026, EGU26-15812, https://doi.org/10.5194/egusphere-egu26-15812, 2026.

Investigating the intricate connection among the combustion types (smoldering v.s. flaming), human activity and climatic patterns is is crucial for understanding the mechanisms of paleo-fire occurrences. This interaction requires further clarification, especcially in the NE Tibetan Plateau, due to the dramatic climatic and human activity shifts during the mid-late Holocene. Here, we examined the black carbon (BC, comprising char and soot) content within sediments from Caodalian (CDL) lake spanning the past 7600 years. The findings indicate paleo-fire intensity was consistent with variations in combustion types revealing by the ratio of char/soot on different timescales during the mid-late Holocene. An integrtated paleo-fire index shows that the fire activity underscores a pattern of low middle Holocene and rapidly increasing late Holocene fires, with two distinct peaks occurring during the Bronze Age and historical period. This variation aligns with the shifts observed in the char/soot ratio, indicating that enhanced flaming fires were more prevalent during the late Holocene. A comparative analysis of regional paleo-climate data has revealed that the progressive aridification of the climate, along with rising spring temperatures, contributed to the increase in paleo-fires. And the expansion of grasslands likely fueled the rise in flaming fires, thereby intensifying paleo-fire activity. Notably, we contend that human fire practices heightened the incidence of late Holoceng regional flaming fires, which in turn contributed to the intensification of paleo-fire regimes. High-intensity human activities (e.g. land reclamation, pottery production, bronze crafting) that have been prevalent since 4000 BP, along with the increased warfare since 1200 BP, were significant factors behind this outcome.

How to cite: Zhang, S.: Enhanced late Holocene flaming fires in the NE Tibetan Plateau: coupled impacts of climate and human activities, EGU General Assembly 2026, Vienna, Austria, 3–8 May 2026, EGU26-16560, https://doi.org/10.5194/egusphere-egu26-16560, 2026.

Vegetation actively regulates climate through biophysical processes such as altering surface albedo, evapotranspiration, and roughness. Despite its recognized importance in modern and Quaternary systems, the role of terrestrial vegetation in shaping Earth’s climate on geological timescales remains poorly quantified. Understanding how vegetation–climate interactions vary across different background states—from icehouse to greenhouse worlds—is critical for interpreting paleoclimate proxies and for constraining future biosphere–climate feedbacks.

Here, we present a series of coupled climate–vegetation experiments using the Community Earth System Model (CESM1.2.2) with BIOME4 to systematically isolate the biophysical effects of land plants across 42 time slices from 410 Ma to the pre-industrial era. Through paired “Vegetated” and “Bare-ground” simulations, we assess the global and regional climatic impacts of vegetation across a wide range of paleogeographic and climatic conditions.

Our results show that vegetation consistently exerts a warming influence of 2–6 °C, primarily via albedo reduction, and increases precipitation by 30–105 mm yr⁻¹. This forcing is strongly state-dependent, being most pronounced during cold, high-ice climates where vegetation activates potent snow/ice-albedo feedbacks. Moreover, vegetation systematically reorganizes large-scale atmospheric circulation: it intensifies the Walker circulation, redistributing tropical rainfall, and under certain configurations can reverse the global meridional overturning circulation, thereby altering oceanic heat transport.

These findings establish terrestrial vegetation as a persistent, state-dependent climate modulator throughout the Phanerozoic, offering a unifying framework for understanding its role in past and future vegetation–climate interactions.

How to cite: Guo, J., Hu, Y., Liu, Y., and Liu, Y.: The Biophysical Forcing of Terrestrial Vegetation: A Persistent Climate Modulator with State-Dependent Efficacy Through the Phanerozoic, EGU General Assembly 2026, Vienna, Austria, 3–8 May 2026, EGU26-17530, https://doi.org/10.5194/egusphere-egu26-17530, 2026.

EGU26-17644 | ECS | Posters on site | CL4.15

Eemian reforestation patterns in central Italy, a palynological comparison between a lowland basin (Valle di Castiglione) and an intramontane basin (Piana del Fucino). 

Costanza Borgognone, Biagio Giaccio, Patrizia Macrì, Carole A. Roberts, Laura Sadori, Chronis Tzedakis, Giovanni Zanchetta, and Alessia Masi

The onset of the Eemian interglacial (MIS 5e) represents a critical interval for investigating vegetation responses to rapid climate warming and changes in hydroclimatic seasonality in the Mediterranean region. While forest expansion during early interglacial phases is rather well-documented, the degree to which reforestation pathways differed within the same geographic region across contrasting physiographic settings, remains insufficiently explored. Here we present a palynological comparison of early Eemian vegetation development at two central Italian sites characterised by different topographic and climatic contexts: Valle di Castiglione, a lowland crater lake of Alban Hills, located in the alluvial plain close to Rome, and the Fucino Basin, a wide intramontane dried out lake situated in the central Apennines. The explicit aim of this comparison is to assess whether early Eemian reforestation followed synchronous or differentiated trajectories in lowland versus intramontane settings, and to evaluate the role of altitude, basin morphology and continentality on modulating forest establishment and stability.

Preliminary pollen data from Valle di Castiglione carried out in the frame of AMUSED project (https://progetti.ingv.it/it/amused), indicate a rapid expansion of arboreal taxa at the MIS 6–MIS 5 transition, associated with increasing temperature and precipitation and the rapid establishment of predominantly mesophilous and Mediterranean vegetation during MIS 5e. These lowland dynamics are compared with evidence from the Fucino Basin, one of the most complete and sensitive terrestrial archives in the Mediterranean and a key reference for vegetation–climate relationships in central Italy. The comparison is explicitly designed to explore whether early Eemian reforestation followed synchronous or differentiated pathways in lowland coastal versus intramontane environments. This lowland record is compared with the high-resolution, radiometrically constrained pollen sequence from the Fucino Basin recently presented by Roberts et al. (2025), which provides a detailed reconstruction of vegetation dynamics between ~139 and 107 ka based on a robust tephrochronological framework. The Fucino record shows that early Eemian forest expansion was not monotonic but involved a rapid increase in many temperate deciduous taxa interspersed with centennial-scale fluctuations and transient reductions in forest cover.

This contribution is conceived as a pilot and contextual study in support of the ICDP proposal for the drilling of the Fucino paleolake (MEME project – the longest continuous terrestrial archive in the Mediterranean recording the last five million years of Earth system history), which aims to recover a continuous, high-resolution and chronologically robust record of environmental change across the entire basin infill. By placing early Eemian vegetation dynamics from Valle di Castiglione into a regional comparative framework with Fucino, this study provides a first step towards disentangling the role of altitude, basin setting and climatic gradients in shaping interglacial reforestation patterns in central Italy.


Roberts, C. A., Zanchetta, G., Giaccio, B., Nomade, S., Mannella, G., Sadori, L., ... & Tzedakis, P. C. (2025). A radiometrically-constrained reference record of Last Interglacial climate and vegetation changes from the Fucino Basin, Central Italy. Quaternary Science Reviews, 363, 109377.

How to cite: Borgognone, C., Giaccio, B., Macrì, P., Roberts, C. A., Sadori, L., Tzedakis, C., Zanchetta, G., and Masi, A.: Eemian reforestation patterns in central Italy, a palynological comparison between a lowland basin (Valle di Castiglione) and an intramontane basin (Piana del Fucino)., EGU General Assembly 2026, Vienna, Austria, 3–8 May 2026, EGU26-17644, https://doi.org/10.5194/egusphere-egu26-17644, 2026.


Plant responses to glacial–interglacial climate change are frequently delayed by migration lags and shaped by landscape connectivity and changing biotic interactions. Yet most spatio‑temporal species distribution models (SDMs) still assume near‑equilibrium with climate, treat dispersal only implicitly, and rarely confront their hindcasts with independent, process‑relevant validation data. This limits confidence in both late‑Quaternary reconstructions and future projections, especially in regions with complex topography and strong post‑glacial ecological reorganization.

Here we present a model–proxy framework that links occurrence‑based niche modelling with dynamic, taxa‑specific dispersal and connectivity and evaluates predicted trajectories using sedimentary ancient DNA (sedaDNA). We initially parameterize SDMs for Arctic and Tibetan Plateau taxa using modern occurrences and climate (first implementations with MaxEnt), hindcast climatic suitability through late‑Quaternary paleoclimate reconstructions, and translate suitability into time‑varying accessibility using spatially explicit dispersal models and landscape‑configured networks. This enables hypothesis testing on how connectivity, terrain, and interactions modulate community change beyond shared climatic forcing.

Broader high‑latitude analyses further indicate recurrent glacial legacy effects on interglacial assemblages, identify persistent hotspots and migration corridors. It also show that future Arctic vegetation may occupy only a small fraction of emerging climate niches due to limited dispersal, leading to extirpation from declining suitability often exceeding new colonizations in driving compositional change. We also evaluate how community assembly shifts from predominantly facilitative interactions during glacial conditions to more negative interactions in the Holocene.This is coincident with post‑glacial woody encroachment and trait shifts toward taller, deeper‑rooted communities—mechanisms relevant to contemporary “arctic greening”. On the eastern Tibetan Plateau, proxy–model agreement demonstrates that complex terrain and connectivity to refugia are first‑order controls on post‑glacial vegetation trajectories: steep valley configurations enhance connectivity and reduce migration lags, whereas long gentle terrain can impose pronounced lags despite similar climate.

Finally, we outline how these proxy‑validated developments motivate a forthcoming multimodal deep‑learning foundation model (FOUNA) integrating global occurrences, paleo‑occurrences (including sedaDNA), remote sensing, and (paleo)climate to deliver transferable, decision‑relevant biodiversity predictions from decades to millennia.


How to cite: Herzschuh, U., Jia, W., Liu, S., Schild, L., Liu, Y., and Schwenkler, R.: Plant dispersal and biotic interactions across glacial–interglacial timescales: evidences from combining spatio‑temporal niche modelling with sedimentary ancient DNA proxy data, EGU General Assembly 2026, Vienna, Austria, 3–8 May 2026, EGU26-17762, https://doi.org/10.5194/egusphere-egu26-17762, 2026.

Throughout the first millennium of East Asian imperial history, Chinese empires periodically extended military control over the semi-arid to arid southern Central and Inner Asia. During warmer, wetter climatic phases, states undertook efforts to establish or restore agricultural settlements in the region. Crop production was primarily intended to sustain frontier garrisons and their livestock through systems of state-organized military colonies (tuntian), in which soldier-farmers cultivated the land. The military colonies addressed growing demand for land and agricultural output to support both people and livestock. Recent scholarship on Han military farming (Trombert 2020) argues that agricultural colonies in the Hexi Corridor and Tarim Basin were largely unproductive and placed heavy demands on soldier-farmers, who had to balance cultivation with military service; the main significance of military colonies was likely not in their productivity, but rather in their role as strategic footholds that facilitated subsequent civilian settlement. Building on this argument, I examine the Tang military colonies along the Yellow River in the northwestern fringes of the empire, from the Qinghai Plateau to the Ordos Loop. This semi-arid region, situated at the edge of the monsoon zone, was traditionally more conducive to an agropastoral economy. It comprised the southern segment of the trade routes connecting Central Asia, extending through the Hexi Corridor. The Tang established large, permanent armies in the region and expanded agricultural settlements to sustain them. Scholars argue that the expansion of cropland into typically unsuitable areas was likely enabled by a particularly favorable climatic period in the 7th century, characterized by warm and humid conditions. Rising temperatures could have enabled earlier planting dates and extended growing seasons, while also expanding arable land into higher-altitude regions. Increased precipitation would have further supported crop growth by boosting water availability. Unlike earlier periods, Tang administrative records detail the civil and military populations, livestock numbers, farm counts, crop types, and the man-days of labor needed to cultivate each crop. This extensive data can serve as a proxy for productivity and sustainability. By combining historical and administrative data with climatic data, the paper emphasizes the importance of studying how state institutions addressed environmental challenges and climate variability in the empire's semi-arid peripheries. It shows how military farms relied on continuous state intervention, particularly in land distribution, irrigation system maintenance, and labor enforcement.

How to cite: Barenghi, M.: State Agriculture on the Ecological Margins of Empire: Military Colonies and Environmental Adaptation in the Sui–Tang Period (6th–8th Centuries CE), EGU General Assembly 2026, Vienna, Austria, 3–8 May 2026, EGU26-18040, https://doi.org/10.5194/egusphere-egu26-18040, 2026.

Understanding how past societies adapted to climatic and environmental changes offers valuable perspectives for contemporary sustainability challenges. This study investigates the long-term interplay between climate, vegetation, and human settlement patterns in the Liaoxi Corridor—a sensitive forest-steppe transition zone at the northern margin of the East Asian Summer Monsoon. We provide a quantitative assessment of how Holocene climate variability influenced human habitat preferences through mediating changes in vegetation cover.

We integrated multi-proxy datasets to address this question. Thirty high-resolution pollen records were analyzed using the REVEALS model to reconstruct vegetation dynamics across the Holocene. Archaeological site distributions were examined through kernel density estimation and spatial clustering techniques to identify settlement aggregation patterns. For each period, we calculated site elevation, slope, and distance to rivers to assess topographic and hydrological preferences. To synthesize these variables, we applied a Human Ecological Niche Model (HENM), which allowed us to evaluate the relative importance of environmental factors in driving settlement location and to detect shifts in human habitat selection over time.

The results highlight several key findings. First, the forest-steppe boundary shifted markedly in response to Holocene monsoon variability, with forest expansion during humid phases and steppe dominance during arid intervals. Second, human settlements consistently clustered in environmentally favorable niches, but these niches changed over time. During warm-wet periods associated with forest expansion, populations dispersed into upland areas. In contrast, cooler and drier conditions led to settlement contraction into lowland river valleys, reflecting a strategic shift toward resource-security under climatic stress. Third, the HENM identified vegetation type, water accessibility, and gentle terrain as the primary factors influencing site location, with their relative weights varying across climatic phases.

This study underscores the role of vegetation as a critical intermediary between climate and human behavior. By quantifying past human-environment linkages in a climatically sensitive region, we offer a refined framework for understanding adaptive responses to environmental change. These insights not only deepen our knowledge of East Asian prehistory but also inform current models of landscape resilience and sustainable habitat planning under future climate scenarios. In an era of rapid global change, such long-term perspectives are essential for anticipating human-environment feedbacks and fostering resilient socio-ecological systems.

How to cite: Liang, C., Qin, F., Huang, B., and Li, J.: How Vegetation Mediated Human Settlement Responses to Holocene Climate Change: A Quantitative Spatiotemporal Analysis from the East Asian Transitional Zone, EGU General Assembly 2026, Vienna, Austria, 3–8 May 2026, EGU26-18492, https://doi.org/10.5194/egusphere-egu26-18492, 2026.

EGU26-18520 | ECS | Orals | CL4.15

Exploring Holocene growing season variability in Central Europe: Evidence from Vegetation Proxies 

Eliise Poolma, Friederike Wagner-Cremer, Piotr Kołaczek, Sandra Słowińska, Anneli Poska, Fabian E. Z. Ercan, Mariusz Lamentowicz, Karolina Leszczyńska, Katarzyna Marcisz, Jakub Niebieszczański, Michał Słowiński, Witold Szambelan, Siim Veski, and Leeli Amon

The lengthening of the growing season in the Northern Hemisphere is a key response of terrestrial ecosystems to climate warming, yet long-term perspectives on Holocene growing season dynamics remain limited. Growing Degree Days (GDD), a widely used metric for assessing growing season thermal conditions, can be reconstructed using the micro-phenological method, a relatively recent proxy based on changes in leaf epidermal cell morphology. When combined with pollen-based reconstructions, this integrated approach provides robust estimates of past growing season thermal conditions.

In this study, we explore Holocene growing season variability at Linje peatland in northern Poland by combining Betula nana leaf micro-phenology with pollen-based GDD reconstructions derived from the same sediment sequence. Linje peatland represents a mid-latitude microrefugium where B. nana has persisted throughout the Holocene and where long-term peat accumulation, together with modern hydrometeorological monitoring, provides a unique opportunity for local proxy calibration. Building on an existing micro-phenological model developed for northern Finland, a site-specific inference model was established using annually collected modern leaves and applied to subfossil B. nana remains spanning approximately the last 11,350 years.

Preliminary results suggest broadly coherent long-term patterns in growing season thermal variability during the Late Holocene, while intervals of divergence between the two proxies are more pronounced during the Early Holocene. Interestingly, these differences may reflect contrasting proxy sensitivities or ecological response times. Overall, this study illustrates how combining micro-phenological and pollen proxies can be used to investigate past vegetation-climate interactions, growing season dynamics, and their relationship to prehistoric and historic human societies.

This research was supported by ESF project PRG1993, the Doctoral School of Tallinn University of Technology, the (Estonian) Ministry of Education and Research Centre of Excellence grant TK215, and the National Science Centre, Poland (grant nos. 2021/41/B/ST10/00060 and 2022/45/B/ST10/03423).


How to cite: Poolma, E., Wagner-Cremer, F., Kołaczek, P., Słowińska, S., Poska, A., Ercan, F. E. Z., Lamentowicz, M., Leszczyńska, K., Marcisz, K., Niebieszczański, J., Słowiński, M., Szambelan, W., Veski, S., and Amon, L.: Exploring Holocene growing season variability in Central Europe: Evidence from Vegetation Proxies, EGU General Assembly 2026, Vienna, Austria, 3–8 May 2026, EGU26-18520, https://doi.org/10.5194/egusphere-egu26-18520, 2026.

EGU26-19420 | ECS | Posters on site | CL4.15

Environmental scenarios for hominin habitats in East Africa during the Plio-Pleistocene (4-1 Ma) 

Alexia Angeli, Gilles Ramstein, Frédéric Fluteau, Ning Tan, Doris Barboni, and Cédric Gaucherel

Climate strongly constrains vegetation structure and the availability of surface water, thereby shaping the distribution, quality, and accessibility of resources for mammals, including hominins, over long timescales. Unfortunately, fossil and archaeological archives are discontinuous and biased by preservation and sampling, which limits the use of deterministic or fully probabilistic approaches that typically rely on continuous time series, homogeneous observations, and well-constrained parameters.

To address these constraints, we formalized current knowledge and competing hypotheses on climate–ecosystem linkages into a qualitative, possibilistic dynamic model. This approach was designed to (i) accommodate incomplete and heterogeneous evidence, (ii) make causal assumptions explicit, and (iii) systematically explore the range of environmental trajectories compatible with those assumptions. We implemented this knowledge base within the EDEN (Ecological Discrete Event Network) framework as a set of formal rules « if-then » describing interactions among climate-related variables, vegetation states, and surface-water availability.

It then reconstructed the resulting transition graph linking successive states through admissible event sequences. The resulting scenario ensemble provided a structured view of which combinations of climate, vegetation, and surface-water availability corresponded to feasible system states, which transitions were enabled or disabled by the rule base and its causal constraints, and where key uncertainties in rule definition and variable discretization most strongly affected the inferred habitat dynamics.

How to cite: Angeli, A., Ramstein, G., Fluteau, F., Tan, N., Barboni, D., and Gaucherel, C.: Environmental scenarios for hominin habitats in East Africa during the Plio-Pleistocene (4-1 Ma), EGU General Assembly 2026, Vienna, Austria, 3–8 May 2026, EGU26-19420, https://doi.org/10.5194/egusphere-egu26-19420, 2026.

EGU26-19430 | Posters on site | CL4.15

Paleoclimatic Evidence across the Ordos Region and Yellow River Loop 

Elena Xoplaki, Juerg Luterbacher, Fahu Chen, Bing Liu, Chun Qin, Bao Yang, Raorao Su, Michael Kempf, Shuai Ma, Zhixin Hao, Moritz Haupt, Maddalena Barenghi, David Bello, and Nicola Di Cosmo

The Greater Ordos Region (GOR), located at the interface between the East Asian Summer Monsoon and mid-latitude westerly circulation systems, is highly sensitive to both oceanic forcing and regional land–atmosphere interactions. This study synthesises annually resolved tree-ring and documentary records with lower-resolution evidence from lake sediments, aeolian archives, and pollen data to reconstruct hydroclimatic and temperature variability over the past ~3500 years. The multi-proxy evidence reveals pronounced alternations between wetter and drier conditions across successive dynastic periods. High-resolution records resolve the timing, duration, and severity of extreme events, including multi-decadal droughts during the late Han and Tang periods and a widespread megadrought in the early seventeenth century CE associated with crop failures and societal stress. Lower-resolution archives provide longer-term context, documenting progressive shifts towards increased aridity, steppe expansion, and desertification, particularly following major drought episodes. The combined proxy approach demonstrates how recurrent hydroclimatic extremes, interspersed with phases of recovery, have exerted a persistent influence on agricultural systems, land-use dynamics, and societal stability. Integrating high- and low-resolution climate records allows assessment of both abrupt climate shocks and longer-term environmental trends that have shaped regional vulnerability through time.

How to cite: Xoplaki, E., Luterbacher, J., Chen, F., Liu, B., Qin, C., Yang, B., Su, R., Kempf, M., Ma, S., Hao, Z., Haupt, M., Barenghi, M., Bello, D., and Di Cosmo, N.: Paleoclimatic Evidence across the Ordos Region and Yellow River Loop, EGU General Assembly 2026, Vienna, Austria, 3–8 May 2026, EGU26-19430, https://doi.org/10.5194/egusphere-egu26-19430, 2026.

EGU26-19819 | ECS | Posters on site | CL4.15

Coupled climate-human drivers of Late Quaternary megafaunal decline 

Thushara Venugopal, Axel Timmermann, Jiaoyang Ruan, Pasquale Raia, Kyung-Sook Yun, Elke Zeller, Sarthak Mohanty, Silvia Castiglione, and Giorgia Girardi

Global megafaunal populations experienced widespread decline and extinctions during the Late Quaternary period. Adverse climatic conditions during the Last Glacial Maximum (LGM), and the emergence and global spread of modern humans are widely considered as the primary drivers of megafaunal loss and the associated decline in global biodiversity. However, the relative contributions of climate change and human influence on the unprecedented Late Quaternary megafaunal extinctions remain unresolved, largely due to the scarcity of palaeoecological evidence. Here, we employ a new spatially explicit dynamical model (ICCP Global Mammal Model, IGMM) to simulate climate-driven changes in the distribution of about 2000 terrestrial mammal species (including humans), incorporating biotic interactions through predation and competition, across space and through time on a global scale. While adverse climatic conditions during the LGM, marked by dramatic changes in habitat suitability, created a favorable background for the megafaunal decline, our model reveals that the global spread of culturally advanced modern humans played a crucial role in exacerbating the population loss of iconic species including mammoths, mastodons, stegodons, and giant sloths, ultimately leading to their extinction during the Late Quaternary period.

How to cite: Venugopal, T., Timmermann, A., Ruan, J., Raia, P., Yun, K.-S., Zeller, E., Mohanty, S., Castiglione, S., and Girardi, G.: Coupled climate-human drivers of Late Quaternary megafaunal decline, EGU General Assembly 2026, Vienna, Austria, 3–8 May 2026, EGU26-19819, https://doi.org/10.5194/egusphere-egu26-19819, 2026.

EGU26-20151 | ECS | Orals | CL4.15

Hydroclimate-driven ecological and fire regime shifts in a unique forest biome of Baja California since the mid-Holocene 

Samuel Enke, Jennifer Watt, Brian Codding, Emma Layon, and Andrea Brunelle

Baja California, Mexico occupies a climatically sensitive peninsular setting between the cool Pacific Ocean and the comparatively warmer Gulf of California. This Mexican state is home to a large spectrum of environmental conditions and diverse ecology, due in part to the compounding effects of variable precipitation from El Niño Southern Oscillation (ENSO) cycling and the North American Monsoon (NAM) across a topographical gradient. Near the center of the state resides Sierra de San Pedro Mártir, a high elevation mountain range at the tip of the California Floristic Region, forming a California Mountains ecoregion that is drastically different in biodiversity than the area that surrounds it. Sierra de San Pedro Mártir is a pine-dominated forest that receives ~75% of its annual precipitation during winter months, making it particularly sensitive to ENSO-driven hydroclimatic variability. Notably, this forest has only recently seen the emergence of fire management strategies.

In a palaeoecological reconstruction from this region, a high-resolution fossil pollen record, coupled with macro-charcoal analysis, highlights shifting dominance between precipitation sources through the middle to late Holocene. More contemporarily, however, the impacts of fire suppression can already be seen in the palynological record. Methods of inferential statistics are employed alongside a traditional time series, and cohesion between these two methods of data analysis provides additional confidence in a compelling and robust precipitation-fire-ecology relationship detected through generalized linear regression. This finding has significant implications for the future of fire management in this unique environment, representing the integrative potential for high-resolution palaeoecological research. As this environment represents a natural laboratory for studying ENSO and NAM, this finding additionally has implications for how these two hydrological systems contribute to the future of more regional conservation and restoration.

How to cite: Enke, S., Watt, J., Codding, B., Layon, E., and Brunelle, A.: Hydroclimate-driven ecological and fire regime shifts in a unique forest biome of Baja California since the mid-Holocene, EGU General Assembly 2026, Vienna, Austria, 3–8 May 2026, EGU26-20151, https://doi.org/10.5194/egusphere-egu26-20151, 2026.

The past decades have seen an upsurge in the paleoenvironmental studies of Chinese archaeological sites. However, systematic investigations on human-environment interactions in river valleys are still rare in Central China and thus require further study. Here, we reconstruct the landscape evolution of the Shuangji River valley in the eastern foothills of Songshan Mountain and its relationship with climate change and human settlement patterns since the terminal Pleistocene. From 50 ka BP to the terminal Paleolithic, under cold climate conditions, approximately 20 m of fluvial-lacustrine sediments and loess-derived alluvium were deposited in the middle reaches of the river valley. A transition from fluvial-lacustrine to aeolian deposits occurred around 28 ka BP, accompanied by a decrease in deposition rate. Three stages of fluvial terraces were formed since the terminal Pleistocene. The formation of the third terrace (T3) was dated between 20~10 ka BP. It provided the ideal habitat for the last hunter-gatherers and early farmers through the terminal Paleolithic to early Neolithic. From 8 to 4 ka BP, the river valley aggraded under a warm and humid climate, while the second terrace (T2) formed slowly. Due to its suitability for human habitation, settlements gradually moved downstream and clustered on the alluvial valleys, associated with the change of subsistence strategy. After 4 ka BP, the climate aridity coincided with large-scale river downcutting, which led to the disappearance of lakes and swamps. This paralleled the emergence of urban settlements. The late Holocene valley incision and smaller-scale first terrace (T1) during the historical period shaped the present landscape. Our results contribute to a better understanding of the relationships between climate change, landscape evolution, and human settlement patterns in the cradle of Chinese civilization.

How to cite: Ren, X. and Mo, D.: Climate-human-landscape interaction in the eastern foothills of Songshan Mountain, Central China since the terminal Pleistocene, EGU General Assembly 2026, Vienna, Austria, 3–8 May 2026, EGU26-21407, https://doi.org/10.5194/egusphere-egu26-21407, 2026.

EGU26-427 | ECS | Posters on site | SSP4.5

Tracing Anthropogenic Impacts in an Urban Environment: Ostracod Evidence From Lake Müggelsee and Other Water Bodies of Berlin, Germany 

Nele Wagner, Olga Schmitz, Arezoo Enayati, Patrick Roberts, Kristina von Rintelen, Diego Volosky, and Peter Frenzel

Rapid urbanization and industrialization have left a persistent imprint on freshwater ecosystems, particularly in metropolitan regions where lakes act as both sinks and archives of anthropogenic pollution. The present study investigates the potential of ostracods as proxies of anthropogenic impacts by studying several surface water sites for an actualistic calibration and by applying a multi-proxy approach to a short core from lake Müggelsee for testing ostracod performance in paleoenvironmental reconstruction of pollution history.

The 26 surface water sites investigated are situated in the east, center and west of the city and reflect different kinds and degrees of anthropogenic impacts. Water types sampled comprise lakes, ponds, rivers and artificial canals. Almost all samples contain ostracods, proving their general availability for analyses in these contexts. One exception is the artificial, concrete covered canals with high turbulence caused by currents and whirling due to ship traffic, where fine-grained sediments and ostracods are broadly lacking. Opportunistic species tolerating oxygen deficiency dominate within the ostracod fauna. The other fossils the >125 µm size fraction are primarily molluscs.

Müggelsee is the largest lake within the Berlin urban region and is fed and drained by the river Spree entering the Berlin area here. The 70 cm long sediment core B25-MS1, taken from Müggelsee in 2025, allows us to study ostracods through time. The core records transitions from massive black muds to laminated black-greenish muds and surficial blackish muds, reflecting varying redox conditions linked to changing organic matter contents. The ostracod assemblages are dominated by candonids, Darwinula stevensoni, Limnocytherina sanctipatricii and Physocypria kraepelini . Their distribution shows marked stratigraphic shifts: The lowermost section below 56 cm sediment depth is characterised by taxa typical for a dense cover of submerged macrophytes. Afterwards and up to the limit between the black and the black-greenish mud at 22 cm, phytal species decrease in proportion, but cold-water taxa are still abundant pointing to a moderate pollution level and cooler conditions probably associated with the end of the Little Ice Age. The black-greenish mud between 22 cm and 7 cm yields the highest ostracod densities and a maximum of Neglecandona neglecta pointing to high organic pollution. Phytal ostracods decrease considerably with the vanishing of submerged macrophytes due to plankton blooms during the second half of the 20th century when not properly treated and increasing sewage water outfalls caused rising trophic conditions in water bodies in and around Berlin. The last phase shows similar ostracod distributions as before the maximum pollution but phytal taxa do not recover and Darwinula stevensoni becomes even more abundant.

Overall, our study shows the potential of ostracod data from water body sediments to reveal increasing anthropogenic impact in the vicinity of Berlin, corresponding to phases of city’s industrial development, post-war and 1990s changes in wastewater management, and modern water quality status. Müggelsee thus exemplifies how urban freshwater archives record the Great Acceleration in local ecological systems. These findings provide crucial baselines for restoration strategies in alignment with the EU Biodiversity Strategy for 2030 and the EU Water Framework Directive.

How to cite: Wagner, N., Schmitz, O., Enayati, A., Roberts, P., von Rintelen, K., Volosky, D., and Frenzel, P.: Tracing Anthropogenic Impacts in an Urban Environment: Ostracod Evidence From Lake Müggelsee and Other Water Bodies of Berlin, Germany, EGU General Assembly 2026, Vienna, Austria, 3–8 May 2026, EGU26-427, https://doi.org/10.5194/egusphere-egu26-427, 2026.

The Plio-Pleistocene Transition (PPT, 2.7-2.4 Ma) marks a major climatic reorganization with the onset of Northern Hemisphere glaciation. While the western Mediterranean1 has served as a standard for biostratigraphic and paleoceanographic reconstructions during this period, the eastern Mediterranean, remains less explored. This study (3.7–2.3 Ma) provides the first quantitative planktonic foraminiferal data from ODP Leg 160 Site 967 (Eratosthenes Seamount, 2554 mbsf, well-developed sapropel), aiming to elucidate regional similarities and differences in faunal dynamics and bioevents across the two basins.

The Mediterranean biostratigraphy1 for studied time interval is mainly based on genus Globorotalia, but the eastern record shows low abundance respect to the western ones.

Despite astronomically tuned sapropel records, the biostratigraphic correlation is very difficult.

When compared the eastern Mediterranean Site 967 to western planktonic foraminiferal biozones, key bioevents, including the Last Occurrence (LO) of Globorotalia puncticulata dated at 3.57 Ma, and First Occurrences (FO) of Globorotalia bononiensis and Globorotalia crassaformis, show approximately synchronous timings but contrast in relative abundances. Notably, the LCO of G. bononiensis at 2.46 Ma in the western Mediterranean appears inconsistent in the eastern record, whereas G. crassaformis provides a more reliable marker, suggesting a need for revised regional biozonation schemes.

An outstanding feature is the temporal disappearance of Globorotalids (G. bononiensis and G. crassaformis) at ca. 2.4 Ma, an event not observed in western records where these taxa continued to persist beyond this interval. 

The Neogloboquadrina atlantica signature, although resemble the western Mediterranean cooling signal, is minimally expressed in the eastern Mediterranean, emphasizing limited Atlantic water influence and distinct oceanographic control. Also, the Sphaereodinellopsis signal seems to mimic very well the western record with a synchronous LO at ca. 3.2 Ma.

As expected from the palaeoceanography of the eastern Mediterranean, micropaleontological analyses reveals a warm-water and oligotrophic assemblages including Globigerinoides ruber white (morphotypes Type b-platys, c-elongate, d-kummerform), Globoturborotalita rubescens, Globigerinoides obliquus, the Trilobatus sacculifer gr., Orbulina universa, and Globigerinella spp. Conversely, nutrient-dependent and cooler-tolerant species, such as Turborotalita quinqueloba, Globigerinita glutinata, and Globigerina bulloides, peak in abundance near sapropels, marking episodic productivity increases.

High Globigerinoides abundances underscore sustained warm, salty, and stratified water conditions, punctuated by clear paleoenvironmental shifts from red-to-black sapropel phases (~3.2 Ma). This shift is characterized by an acme end of Neogloboquadrinids and incipient warming and increased humidity, shown in oxygen stable isotope G. ruber signal. Another outstanding change is the G. ruber white morphotype faunal turnover and reductions in Globigerinoides obliquus around 3.0 Ma.

As final remarks, the acme end of Trilobatus sacculifer gr., the LO of total Globorotalids and LRO of Globigerinoides obliquus seem to approximate the Gelasian boundary (~2.6 Ma), with important paleoenvironmental and ecological reorganization marked by the decline of warm taxa and an expansion of cooler and productive waters.

Correlation reveals similarities and differences in planktonic foraminiferal abundance highlighting complex basin-specific responses to global climate forcing. These findings advance understanding in paleoceanography and biostratigraphic correlation frameworks crucial for reconstructing PPT climate evolution.

1Lirer, F. et al. (2019). Earth-Science Reviews, 196, 102869

How to cite: Raimondi, M., Margaritelli, G., Foresi, L. M., and Lirer, F.: Differences and similarities in Plio-Pleistocene Planktonic Foraminifera through the western and eastern Mediterranean basins: Insights from ODP Site 967 (3.7–2.3 Ma), EGU General Assembly 2026, Vienna, Austria, 3–8 May 2026, EGU26-460, https://doi.org/10.5194/egusphere-egu26-460, 2026.

EGU26-1871 | ECS | Posters on site | SSP4.5

Síðumúlaskógur: the saga of an Icelandic birchwood narrated by pollen 

Scott Riddell and Egill Erlendsson

Quasi-historical narratives describe extensive birch (Betula pubescens) woodland in Iceland “milli fjalls og fjöru” (lit. between the mountains and the shore) when humans first colonised it in the late 9th century. It has been estimated that prior to human settlement up to 25% of the island supported woodland; today, only c. 1% of Iceland supports woodland. Kjarardalur in western Iceland is home to a surviving birchwood known as Síðumúlaskógur (c. 1 km2). A small wetland hollow (c. 5 m2) is located within Síðumúlaskógur, exceptional for Iceland in terms of the environmental and ecological context. The pollen preserved within the sediments of this hollow provide a unique opportunity to examine the history of an Icelandic birchwood from just before human settlement down to the present. Therefore, a 30 cm core was extracted from the wetland hollow which was sub-sampled for pollen analysis. In all, there were 24 sub-samples, with a resolution of one sample per centimetre between 877 CE and 1693 CE, the chronological framework defined by tephrochronology and supplemented by radiocarbon dating. This research considers why Síðumúlaskógur was able to survive into the present when so much woodland was lost elsewhere in Iceland; including areas immediately adjacent to Síðumúlaskógur that should, in theory, also continue to support birch woodland.

How to cite: Riddell, S. and Erlendsson, E.: Síðumúlaskógur: the saga of an Icelandic birchwood narrated by pollen, EGU General Assembly 2026, Vienna, Austria, 3–8 May 2026, EGU26-1871, https://doi.org/10.5194/egusphere-egu26-1871, 2026.

EGU26-2156 | Orals | SSP4.5

Understanding changing Indonesian Throughflow dynamics during the Early Pliocene using differences between TEX86 and foraminiferal Mg/Ca 

Benjamin Petrick, Ann Holbourn, Janika Jöhnck, Wolfgang Kuhnt, and Felix Elling

The Indonesian Throughflow (ITF) is a critical conduit for the inflow of Pacific waters into the Indian Ocean. It has long been considered a potential switch in controlling global climate events. Previous work has primarily focused on Pleistocene glacial-interglacial variability, and there have been few records of ITF variability from the highly dynamic Late Miocene period.  In this study, we present two new high-resolution sea surface temperature (SST) records from Site U1482 spanning the Late Miocene Cooling (LMC) to investigate the changing dynamics in the ITF between 8-4 Ma. The two records we have used are based on Mg/Ca analysis of Trilobatus sacculifer and on TEX86.  One limitation of many studies is that Mg/Ca analysis has been performed at much higher resolution than TEX86. However, here, owing to the high preservation of glycerol dialkyl glycerol tetraethers (GDGTs), we were able to reconstruct TEX86-derived temperatures at about 21 ka resolution high enough to match cycles in Mg/Ca-derived SST.  Before the LMC, there is a strong connection between the two records. Both records show the major cooling event around 6.5 Ma associated with the LMC as well as prominent transient cooling events between 6.5-5.5 Ma. However, in the early Pliocene at 5.2 Ma, the two records diverge markedly, with the Mg/Ca-based record recording several cooling episodes that are not reflected in the TEX86 data.  Based on previous work, the TEX86H proxy, which employs a nonlinear fit to better reflect SSTs above those of the modern era, matches Austral Summer SSTs in this region. Interestingly, the TEX86H data at this point aligns more closely with temperature trends in the West Pacific Warm Pool (WPWP) than local Mg/Ca.  Given that the TEX86H data have been interpreted as Austral summer SSTs, this suggests that in the Early Pliocene, there was a shift in the ITF, allowing seasonal throughflow directly from the WPWP.  Given that the WPWP currently exerts little influence, this shift has critical implications for ocean circulation and for the impact of the end of the LMC and the onset of the very warm Early Pliocene. This may help explain the rapid warming at the end of the LMC.  It also demonstrates the importance of multi-proxy analysis being done at a similar resolution.

How to cite: Petrick, B., Holbourn, A., Jöhnck, J., Kuhnt, W., and Elling, F.: Understanding changing Indonesian Throughflow dynamics during the Early Pliocene using differences between TEX86 and foraminiferal Mg/Ca, EGU General Assembly 2026, Vienna, Austria, 3–8 May 2026, EGU26-2156, https://doi.org/10.5194/egusphere-egu26-2156, 2026.

EGU26-2887 | Posters on site | SSP4.5

The Paleocene to Eocene calcareous nannofossil assemblage from Kurgan-Tyube West section in the Tajik Basin 

Tian Jiang, Qianyu Zhou, and Wenxin Cao

The Tajik Basin, located in southern Tajikistan, is a Cenozoic foreland basin preserving relatively complete marine sedimentary sequences. This study conducts a quantitative biostratigraphic analysis of calcareous nannofossils from a Paleocene to Eocene section West to the Kurgan-Tyube (Qurghonteppa) of the northeastern Tajik Basin. The investigated interval comprises mudstone, marl, sandstone, silty mudstone, gypsum, and clay interbeds. Calcareous nannofossil assemblages, including 31 genera and 75 species, were identified. With the analysis of calcareous nannofossil data, the section was constrained to the latest Paleocene through the end of the Eocene. Within the bottom unit of the section (the Ganjina Unit), index fossils for the Paleocene-Eocene boundary, including Discoaster backmanii, Tribrachiatus orthostylus, and Discoaster diastypus, were identified. Alongside these, characteristic taxa of the Paleocene-Eocene Thermal Maximum (PETM), namely Rhomboaster bramlettei and Discoaster araneus (collectively referred to as the R-D assemblage), were also recorded. The fossil assemblage within this interval is predominantly composed of long-ranging species such as Prinsius martinii and Coccolithus pelagicus, indicating a warm, shallow marine environment with high productivity. The early Eocene in the study section was characterized by a significant increase in the diversity and abundance of Discoaster and the thriving of Coccolithus pelagicus, during which fossil abundance and diversity reached a peak, reflecting a comprehensive recovery of the marine ecosystem during this period. The middle to late Eocene was marked by the continued prosperity of the genus Discoaster, albeit with changes in species composition, and the emergence of Reticulofenestra as the dominant taxon. During this period, fossil abundance declined, and the community structure underwent significant turnover, directly responding to global temperature changes and nutrient fluctuations. These characteristics of biotic succession show consistency with the manifestations of the biostratigraphic patterns from the late Paleocene to the end of the Eocene in shallow marine deposits.

Acknowledgements: This research was supported by the National Natural Science Foundation of China (Nos. 42072001, 41930218), National Key R&D Program of China (Grant No. 2023YFF0804000).

How to cite: Jiang, T., Zhou, Q., and Cao, W.: The Paleocene to Eocene calcareous nannofossil assemblage from Kurgan-Tyube West section in the Tajik Basin, EGU General Assembly 2026, Vienna, Austria, 3–8 May 2026, EGU26-2887, https://doi.org/10.5194/egusphere-egu26-2887, 2026.

EGU26-3103 | ECS | Orals | SSP4.5

Distribution, Diversity and Preservation of Shallow-Water Foraminifera in the Extremely Organic-Rich Mud Flats of French Guiana 

Jasper Lendla, Martin Langer, Olugbenga Temitope Fajemila, and Pierre Olivier Antoine

This study investigates the modern distribution, diversity, composition, and extreme preservation challenges of shallow-water benthic foraminifera along the nearshore marine mud flats of French Guiana. This coastal environment is overwhelmingly controlled by the vast, high-flux discharge of sediment and organic matter (OM) from the Amazon River system, creating a highly stressed habitat for calcifying organisms. Quantitative analysis reveals a severely constrained and moderately diverse fauna. The community structure is heavily skewed towards extremely small species (e.g., Ammonia, Elphidium), and a few robust calcareous taxa (e.g., Eponides). The dominance of stress-tolerant genera is consistent with a highly turbid, high-organic, and potentially low-oxygen environment.

The primary finding is the exceptionally poor preservation of calcareous foraminiferal shells, acting as a powerful taphonomic filter. This dissolution is a direct consequence of the extremely high rates of OM decomposition within the muddy sediments. Microbial breakdown (remineralization) of the abundant Amazon-derived OM rapidly consumes oxygen and generates large quantities of carbon dioxide (CO2). This CO2 increases the concentration of carbonic acid (H2CO3) in the sediment pore waters, leading to a significant pH decrease. The resulting undersaturation (Ω < 1) with respect to CaCO3 minerals (calcite and aragonite) triggers the rapid chemical dissolution of the foraminiferal tests. The poor buffering capacity of the fine-grained, terrigenous muds exacerbates this effect. In addition to the completely preserved foraminifera, almost all samples contain an impressive number of hardened, brown molds (ˈSteinkerneˈ) that capture the original shape of the foraminifera's chamber arrangement, as well as the space once occupied by the living cell. Here, the original calcium carbonate shell is dissolved by acidic waters over time. What remains is a three-dimensional "negative" of the shell's interior.

The sedimentary environment of the French Guiana mud flats represents an end-member environment where near-complete post-mortem dissolution of the calcareous fraction severely biases the fossil record and acts as an effective taphonomic filter. The observed foraminiferal census, dominated by Ammonia, Elphidium and a very few robust taxa, therefore represents a highly-biased reflection of the original living community. This has significant implications for paleoenvironmental reconstructions based on foraminifera in similar high-organic-flux, tropical deltaic systems, highlighting the need to account for dissolution-driven loss of the calcareous fraction.

How to cite: Lendla, J., Langer, M., Fajemila, O. T., and Antoine, P. O.: Distribution, Diversity and Preservation of Shallow-Water Foraminifera in the Extremely Organic-Rich Mud Flats of French Guiana, EGU General Assembly 2026, Vienna, Austria, 3–8 May 2026, EGU26-3103, https://doi.org/10.5194/egusphere-egu26-3103, 2026.

EGU26-4257 | Posters on site | SSP4.5

Calcareous nannoplankton response to Oceanic Anoxic Event 2 on the southern Tethyan margin (Bahloul Formation, Tunisia) 

Paula Granero Ordóñez, Michael Wagreich, Erik Wolfgring, and Theobald Hazod

Oceanic Anoxic Event 2 (OAE2; latest Cenomanian–earliest Turonian) represents a major perturbation of the global carbon cycle and marine ecosystems, yet its expression along the southern Tethyan margin remains incompletely constrained. We present new quantitative calcareous nannofossil data from the Oued Kharroub section (central Tunisia), integrated with carbon-isotope stratigraphy (δ¹³C), carbonate content, and total organic carbon (TOC), to investigate surface-water environmental changes across OAE2. The Oued Kharroub section spans nannofossil zones UC3 to UC8 and records a positive δ¹³C excursion that allows identification of the main phases of OAE2. Calcareous nannofossil assemblages display pronounced variations in abundance, diversity, and composition through the event. Species richness and Shannon diversity index values decrease significantly during the main build-up and plateau of the δ¹³C excursion, coinciding with reduced CaCO₃ content and increased TOC. Assemblages during this interval are dominated by the opportunistic taxon Watznaueria barnesiae, whereas meso- to eutrophic indicators such as Biscutum constans and Zeugrhabdotus erectus show strong short-term fluctuations, suggesting unstable surface-water conditions. Morphometric analyses of W. barnesiae reveal a statistically significant reduction in coccolith size during the core of OAE2, with minimum values coinciding with peak TOC levels, followed by partial size recovery in the post-OAE2 interval. This pattern indicates subtle but detectable calcification stress affecting even ecologically tolerant taxa under peak anoxic conditions. A short-lived increase in Eprolithus floralis near the onset of the event, together with the decline of warm-water taxa, may reflect a weakly expressed cooling episode tentatively linked with the Plenus Cold Event.

How to cite: Granero Ordóñez, P., Wagreich, M., Wolfgring, E., and Hazod, T.: Calcareous nannoplankton response to Oceanic Anoxic Event 2 on the southern Tethyan margin (Bahloul Formation, Tunisia), EGU General Assembly 2026, Vienna, Austria, 3–8 May 2026, EGU26-4257, https://doi.org/10.5194/egusphere-egu26-4257, 2026.

EGU26-4316 | Posters on site | SSP4.5

Calcification without Strong Proton Extrusion in the Pearl Oyster Pinctada fucata 

Takashi Toyofuku, Yukiko Nagaia, Yue Horikawa, Yugo Kato, Satsuki Nagao, Takashi Atsumi, Jun Kawano, and Michio Suzuki

Biomineralization in marine calcifying organisms has traditionally been regarded as a process that involves proton release associated with calcium carbonate precipitation, which may lead to localized acidification. In several taxa, including foraminifera, pronounced pH gradients have been reported between calcification sites and the surrounding environment. However, it remains unclear whether strong proton extrusion into the external environment is universally required for shell formation.

In this study, we re-evaluated pH distributions during shell formation in juvenile pearl oysters (Pinctada fucata) using improved HPTS ratiometric fluorescence calibration combined with spatial analysis. We found that regions involved in shell formation, corresponding to extrapallial fluid domains inferred to represent calcification sites, consistently showed relatively higher pH values than internal soft tissues. The pH in these regions was approximately 7.8, which is slightly lower than that of the surrounding seawater (~8.0). At the spatial scale examined, no pronounced acidification was detected in the external environment outside the shell. By contrast, strongly acidic regions reaching pH ~6.0 were observed in internal tissues, which are likely associated with digestive organs. In addition, within or adjacent to the inferred calcification sites, moderately lower-pH regions (approximately pH ~7.0) were observed as ribbon-like distributions composed of small, discrete spots.

These observations indicate that shell formation in P. fucata does not depend on strong proton extrusion into the surrounding seawater, nor on extreme alkalization of the calcification site. Instead, pH regulation in this species appears to occur in a manner that is spatially separated from the surrounding seawater. This suggests that elevation of pH alone may not be the primary factor controlling calcification. Alternative mechanisms may therefore contribute to shell formation, including regulation of calcium concentration, modulation of ionic composition that inhibits calcification (e.g., Mg²⁺ and sulfate ions), and intracellular proton processing mediated by organic components.

Although acidification driven by carbon dioxide production is theoretically expected to accompany calcium carbonate precipitation, such changes could not be directly resolved under the imaging conditions employed in this study. Taken together, our results highlight diversity in proton regulation strategies among marine calcifying organisms and provide a basis for comparative discussions of shell formation mechanisms.

How to cite: Toyofuku, T., Nagaia, Y., Horikawa, Y., Kato, Y., Nagao, S., Atsumi, T., Kawano, J., and Suzuki, M.: Calcification without Strong Proton Extrusion in the Pearl Oyster Pinctada fucata, EGU General Assembly 2026, Vienna, Austria, 3–8 May 2026, EGU26-4316, https://doi.org/10.5194/egusphere-egu26-4316, 2026.

EGU26-4899 | ECS | Orals | SSP4.5

Foraminiferal Records of Pollution and Environmental Resilience in the Eastern Mediterranean Sea 

Yaroslav Trubin, Revital Bookman, and Orit Hyams-Kaphzan

The shallow marine environment of the Eastern Mediterranean Sea is an ultra-oligotrophic system that provides essential ecosystem services, yet it is increasingly exposed to anthropogenic pressures, including fish farming, desalination activities, and municipal and industrial pollution. Understanding ecosystem responses to disturbance and subsequent recovery is therefore critical for sustainable marine management.

For three decades (1987-2017), the primary source of anthropogenic pollution along the Israeli coast was the Shafdan sewage outfall, which enriched the surrounding environment with nutrients, organic matter, and heavy metals. This long-term pollution history, followed by recent recovery, offers a unique natural laboratory to investigate benthic foraminiferal responses to sustained anthropogenic stress and post-impact recovery.

Two sediment gravity cores were collected at ~36 m water depth near the Shafdan outfall: one from a formerly polluted site (PL3; 0.2 km north of the outfall) and one from a more distal reference site (PL29; 5.5 km north). Sedimentological and geochemical analyses included total organic carbon, grain-size distribution, and mineral and elemental composition. Micropaleontological analyses focused on down-core dead benthic foraminiferal assemblages, complemented by living (Rose-Bengal stained) foraminifera from surface sediments. We assessed changes in species composition, community structure, dominant taxa, and diversity patterns. Ecological status was evaluated using three biotic indices (Foram-AMBI, TSI-Med, FSI) and two diversity indices (ES100 and Exp(H’bc)).

Distinct assemblage shifts corresponding to pre-pollution, pollution, and post-pollution phases were identified at the Shafdan site. Pre-pollution sediments (20-6 cm in core-depth) were characterized by predominance of sensitive taxa such as Ammonia parkinsoniana and Adelosina species whereas the polluted interval (6-2 cm) was characterized by a marked decline in sensitive species and dominance of opportunistic taxa as foraminifera from Ammonia tepida group. During the post-pollution phase (2-0 cm), sensitive taxa recolonized the sediments; however, opportunistic species remain abundant, indicating that recovery is ongoing and not yet complete. Foram-AMBI values clearly increased during the pollution interval, while TSI-Med fluctuations were strongly influenced by grain-size variability. In contrast, FSI and diversity indices showed limited down-core variation.

These results highlight the value of benthic foraminifera as sensitive tracers of both anthropogenic impact and recovery, and demonstrate the robustness of Foram-AMBI for reconstructing historical environmental conditions. Incorporating down-core foraminiferal records into monitoring frameworks can substantially improve long-term assessments of ecological status and inform marine conservation and management strategies in ultra-oligotrophic systems.

This research was conducted as part of the project no. 0005817 «REFORM – REFerence conditions based on historical FORaminiferal Monitoring» funded by the Israeli Ministry of Science and Technology (2024–2026) and the University of Haifa Institutional Postdoctoral Scholarship funded by Graduate Studies Authority – Bloom Graduate School (2024–2025).

How to cite: Trubin, Y., Bookman, R., and Hyams-Kaphzan, O.: Foraminiferal Records of Pollution and Environmental Resilience in the Eastern Mediterranean Sea, EGU General Assembly 2026, Vienna, Austria, 3–8 May 2026, EGU26-4899, https://doi.org/10.5194/egusphere-egu26-4899, 2026.

EGU26-5310 | ECS | Orals | SSP4.5

Reconstruction of environmental and climatic dynamics during the Eemian (MIS 5e, 130-115 ka) in temperate Europe through malacological and isotopic analysis of calcareous tufas  

Eva Sambourg, Nicole Limondin-Lozouet, Julie Dabkowski, David Herisson, and Valentine Flichet

Reconstruction of the Eemian interglacial environmental dynamics (MIS 5e, 130-115 ka) is essentially based on the study of long palynological sequences but remains limited in Western Europe due to the scarcity of lacustrine deposits. Therefore, calcareous tufas have been favoured in recent years as they are widely distributed on the continent and are particularly useful for the study of Pleistocene interglacials. These carbonate deposits identified in alluvial valleys with calcareous substratum are formed in temperate climates and in waters at ambient temperature. An approach combining malacology and isotopic geochemistry (δ18O and δ13C of tufa calcite) used on several Pleistocene calcareous tufas has demonstrated its effectiveness for the detailed reconstruction of environments and climates of past interglacials.

This study mainly focuses on the malacological contribution. Mollusc carbonated shells are particularly well-preserved in calcareous sediments such as tufas and are powerful bioindicators for palaeoenvironmental studies. Indeed, these small organisms are very dependent on their environment and have reduced mobility and thus provide a strong local signal of plant cover. In addition, identification to the species rank allows deeper palaeoenvironmental interpretations.

This study of Eemian calcareous tufas along an east-west transect in temperate Europe aims to report on the evolution of malacofaunas and associated environments during this period. Similar data obtained for the Holocene show a decrease in biodiversity towards the west, linked to a distancing from the main European refuge area, the Carpathian Mountains. Since the current distributions of species on the continent are intrinsically linked to Quaternary climate fluctuations, the existence of a similar gradient remains to be demonstrated for Pleistocene interglacials. This study will ultimately improve knowledge on the chronology of the Eemian interglacial in Europe (palaeoenvironmental axis), on the current and fossil distribution of molluscs (biodiversity/palaeobiogeography axis) and will establish the palaeoenvironmental context of associated archaeological sites. Two Eemian tufas form the core of this project: Resson (France) and Burgtonna (Germany). This communication will present the preliminary results obtained at both sites.

At Resson, the malacological analysis highlights the importance of this site as a new reference sequence of the Eemian in northwestern Europe by uncovering several diagnostic species of the period and identifying the maximum forest development at the top of the sequence, in agreement with the results of isotopic geochemistry for the climatic optimum.

Burgtonna tufa, formerly known through the work of Mania (1978), has been selected for its impressive malacological content (more than 50 species and 8 phases of forest cover development) and the accuracy of the chronological attribution to the Eemian. Field observations and preliminary results confirm the excellent preservation of shells and the richness of the malacological cortege.

How to cite: Sambourg, E., Limondin-Lozouet, N., Dabkowski, J., Herisson, D., and Flichet, V.: Reconstruction of environmental and climatic dynamics during the Eemian (MIS 5e, 130-115 ka) in temperate Europe through malacological and isotopic analysis of calcareous tufas , EGU General Assembly 2026, Vienna, Austria, 3–8 May 2026, EGU26-5310, https://doi.org/10.5194/egusphere-egu26-5310, 2026.

EGU26-5313 | Posters on site | SSP4.5

Integrated stratigraphy and new radiolaria bioevent constraints of Late Pliocene to Holocene sediments from the subpolar North Atlantic (IODP Site U1314) 

Iván Hernández-Almeida, Kentaro Hatakeda, Brendan Reilly, and Kjell Bjørklund

Radiolarian biozonations constitute an important tool in Cenozoic stratigraphic studies in polar regions. Neogene-Quaternary radiolarian biostratigraphical schemes have been established mainly in low latitude regions, but only a few attempts have been carried out in the high-latitude North Atlantic. In this study, we quantitatively analyze a radiolarian zonation for the Late Pliocene-Holocene (3 Myr to present) at IODP Site U1314 (Gardar Drift, 56.36°N, -27.88°E, 2820 m water depth). The present study focuses on taxa of both stratigraphic importance and of limited occurrence. Specifically, we determined several radiolarian bioevents, some of which are the first time that they are found in the North Atlantic, such as the last occurrences of Druppatractus irregularis Popofsky and Cycladophora sakaii, and first occurrence of Cycladophora davisiana Ehrenberg. In addition, we described two new radiolarian species; Pseudocubus abruptus n.sp. and Spongasteriscus chiasmos n.sp., whose biostratigraphic ranges are also defined and have the potential to be used as biomarkers across the high-latitude North Atlantic Ocean.

In addition to the new radiolarian biostratigraphic record, on-board bio and magnetostratigraphy, refined relative paleointensity and physical property records, and published isotope stratigraphy and radiocarbon ages were used to construct an integrated chronostratigraphic framework at Site U1314 to constraint the new radiolarian bioevents. The stratigraphic distributions of these marker species indicates that the radiolarian scheme proposed herein has a potential to be applied in a broader region, from the mid-latitude North Atlantic, north of about 40°N to the Norwegian Sea. Furthermore, comparison of the radiolarian bioevents with other northern hemisphere datasets provides novel perspectives on the evolutionary dynamics, ecological adaptation and origins of radiolarian lineages.


How to cite: Hernández-Almeida, I., Hatakeda, K., Reilly, B., and Bjørklund, K.: Integrated stratigraphy and new radiolaria bioevent constraints of Late Pliocene to Holocene sediments from the subpolar North Atlantic (IODP Site U1314), EGU General Assembly 2026, Vienna, Austria, 3–8 May 2026, EGU26-5313, https://doi.org/10.5194/egusphere-egu26-5313, 2026.

EGU26-5485 | Orals | SSP4.5

Benthic Foraminifera as Indicators of Oil-Induced Stress in the Imo River Estuary (Niger Delta, Nigeria) 

Olugbenga Temitope Fajemila, Michael Martínez-Colón, Moshood Adegboyega Olayiwola, and Martin Langer

The Niger Delta is one of the most polluted deltaic ecosystems globally, with decades of oil spills and leakages severely impacting aquaculture, local flora, and water quality. This study investigates the environmental health of the Imo River estuary, a primary sink for regional pollutants. Benthic foraminifera were utilized as environmental proxies due to their high abundance, rapid reproduction rates, and sensitivity to physicochemical shifts. Analysis of benthic assemblages, stable isotopes, and heavy metal concentrations revealed an ecosystem under extreme physiological stress, characterized by significantly low species diversity and a dominance of stress-tolerant taxa. The presence of negative δ13C values indicates significant deterioration in the quality of organic matter, alongside a notable increase in acidity. This has a detrimental effect on calcareous benthic foraminifera due to lower pH levels. Our findings provide a critical baseline for evaluating the long-term impact of oil contamination and offer a quantitative metric to assess the efficacy of ongoing remediation and clean-up efforts in the region.

How to cite: Fajemila, O. T., Martínez-Colón, M., Olayiwola, M. A., and Langer, M.: Benthic Foraminifera as Indicators of Oil-Induced Stress in the Imo River Estuary (Niger Delta, Nigeria), EGU General Assembly 2026, Vienna, Austria, 3–8 May 2026, EGU26-5485, https://doi.org/10.5194/egusphere-egu26-5485, 2026.

EGU26-5502 | ECS | Orals | SSP4.5

Palaeoclimatic influence on the evolution of a lower Priabonian mixed carbonate-siliciclastic system in the Ebro Basin (NE Spain) 

Laura Camila Acosta Fernández, Carles Ferràndez Cañadell, and Telm Bover Arnal

This study presents a detailed facies analysis of the lower Priabonian La Tossa Formation, a mixed carbonate-siliciclastic succession deposited in the eastern sector of the Ebro basin (South-Pyrenean foreland basin). Through integrated macro- and micro-facies interpretations, we reconstruct the palaeoecological evolution of a shallow-water carbonate ramp system and asses its response to environmental and climatic shifts during the lower late Eocene. Sedimentation was strongly influenced by coeval fan-delta systems along the basin margins, which directly influenced the facies belt distribution and composition. A total of 13 different facies were identified, arranged along a transect from proximal to distal ramp settings. Their spatial and stratigraphic organisation reflects the interplay of global climatic trends, regional tectonics and local environmental controls.

The facies model for the lower interval of the succession is characterized by proximal ramp facies consisting of siliciclastic-influenced packstones, dominated by Campanile and acervulinid-gypsinid foraminifera. These deposits transition laterally into Nummulites packstones, with localized Nummulites banks. Basinwards, the facies grade into coral frame- and cluster-reefs, which in some sections exhibit coralline algal crusts, and rhodoliths associated with encrusting foraminifera facies. The distal ramp facies are distinguished by the presence of orthophragminids and bryozoan-rich limestones, interbedded with marls devoid of macrofossils, as well as bryozoan and hexactinellid sponge’s marls.  Interspersed with this facies belt pattern are two episodes of coralline algal maërl environment. The two maërl levels extend from proximal zones, where they overlie the Campanile sandstones, to distal zones, where they overlie the orthophragminid facies. The upper interval reflects a distinct evolution into a purely carbonate-dominated system. The low-energy proximal ramp setting, consists of porcelaneous foraminifera-rich grainstones with abundant Nummulites, bivalves and echinoids. These units grade into coral frame reef facies with encrusting foraminifera, which in the distal ramp settings transition into marls and orthophragminid-rich limestones.

The changes in facies indicate that climatic oscillations influenced the distribution of benthic communities in this region of the western Tethys. The development of maërl environments and the stabilization of the platform into a purely carbonate system in the upper interval of the succession, suggest cooler climatic periods. This evolution of facies thus reflects the climatic shift from greenhouse to icehouse conditions during the onset of the late Eocene, which led to the Antarctic glaciation in the earliest Oligocene.


Keywords: Ebro basin, Tossa Formation, palaeoecology, late Eocene, facies analysis

How to cite: Acosta Fernández, L. C., Ferràndez Cañadell, C., and Bover Arnal, T.: Palaeoclimatic influence on the evolution of a lower Priabonian mixed carbonate-siliciclastic system in the Ebro Basin (NE Spain), EGU General Assembly 2026, Vienna, Austria, 3–8 May 2026, EGU26-5502, https://doi.org/10.5194/egusphere-egu26-5502, 2026.

EGU26-5671 | Orals | SSP4.5

Foraminiferal assemblage as environmental indicators: A case study from  Ebrie (Cöte d'Ivoire) and Densu (Ghana) Estuaries, West Africa. 

N'goran Jean-Paul Yao, Lailah Gifty Akita, Edgard Allanne Michael Gnakabi, and Bamba Kader

In order to assess and monitor the health of West African ecosystems, a vast biomarker-based BEACON program has been initiated. This study presents preliminary and partial results comparing two sectors of the Ebrié (Jacqueville bridge) and Densu (Gahna) lagoons. It is based on the analysis of benthic foraminifera from thirty-three (33) samples of surface sediments from these lagoon beds, including fifteen (15) from Ghana and eighteen (18) from Côte d'Ivoire. On the whole, the foraminifera identified fall into ten genera left in open nomenclature. These are the genera Ammotium, Ammobaculites, Ammonia, Amphistegina, Quinqueloculina, Cribloelphidium, Nonion, Miliammina, with a few rare planktonic individuals in the genera Globigerina, Globorotalia (cultrata). A qualitative analysis of these benthic individuals was carried out. The genera Amphistegina, Ammonia, Cribloelphidium and Nonion were found to have calcareous haline tests coiled in a planispiral or trochospiral mode. We also find the Quinqueloculina genus, with a porcelain test in an elongated and milioline mode. The living conditions of these foraminifera are closely linked to the existence of an aerated environment favoring the permanent renewal of oxygen in the bottom sediments. They are abundant in the Densu lagoon and in very low proportions in the Ebrié lagoon. In contrast, benthic forms with elongated, agglutinated testes, such as Ammotium, Ammobaculites and Miliammina, characterize poorly oxygenated waters, i.e. oxic to anoxic or eutrophic waters. They are very well represented in the Ebrié lagoon and rare in the Densu lagoon. From the above, this distribution of benthic foraminifera shows that the Ebrié lagoon (Jacqueville bridge) is very confined and disoxic compared with the Densu lagoon.  The presence of planktonic foraminifera such as the genera Globigerina, Globorotalia suggests a marine influence in both lagoons.

Keywords : Ebrié lagoon, Densu lagoon, foraminifera, biomarkers, anoxia

How to cite: Yao, N. J.-P., Akita, L. G., Gnakabi, E. A. M., and Kader, B.: Foraminiferal assemblage as environmental indicators: A case study from  Ebrie (Cöte d'Ivoire) and Densu (Ghana) Estuaries, West Africa., EGU General Assembly 2026, Vienna, Austria, 3–8 May 2026, EGU26-5671, https://doi.org/10.5194/egusphere-egu26-5671, 2026.

The 4.2 ka event is widely recognized as a major cooling and aridity episode across the Northern Hemisphere. However, its specific impact on the Korean Peninsula remains under-researched compared to neighboring China. In this study, we present a 9,000-year hydroclimatic reconstruction from the subalpine Sara-oreum wetland on Jeju Island, using diatom assemblages and monitoring data. Contrary to the typical "drought" narrative of the 4.2 ka event, our findings reveal prevailing humid conditions on Jeju, evidenced by an increase in summer-associated tychoplanktonic species. This moisture pattern aligns with records from Southern China, suggesting a southward shift of the westerly jet that anchored the monsoonal rain belt over the region. Furthermore, strong correlations between lake-level indicators (PC1 and sand content) and the δ¹⁸O  records from Xianglong Cave and the Westerlies Effect Index highlight the sensitivity of Jeju’s diatom records to large-scale atmospheric circulation. This study underscores the complex spatial heterogeneity of the 4.2 ka event and its linkages to westerly jet variability.

How to cite: Cho, A.: Holocene Hydroclimatic Variability on Jeju Island, Korea: Reassessing the 4.2 ka Event via Diatom Records and Westerly Jet Dynamics, EGU General Assembly 2026, Vienna, Austria, 3–8 May 2026, EGU26-6209, https://doi.org/10.5194/egusphere-egu26-6209, 2026.

EGU26-6343 | ECS | Orals | SSP4.5

Testing the applicability of automated size and shape analyses in non-marine ostracods-A case study from the Tibetan Plateau 

Marlene Höhle, Peter Frenzel, Antje Schwalb, Torsten Haberzettl, Junbo Wang, Liping Zhu, and Claudia Wrozyna

Evolutionary developmental biology seeks to elucidate the developmental mechanisms underlying phenotypic evolution. Central to this endeavour is the quantitative analysis of morphological variation, for which morphometric approaches have become indispensable tools across micropaleontology.

The suitability of ostracods (bivalved microcrustaceans) for evolutionary, developmental, and paleoecological investigations stems from several key attributes: near-ubiquitous distribution across marine and freshwater habitats, remarkable taxonomic and morphological diversity, sensitivity to environmental parameters, and an exceptional fossil record with calcified carapace valves that preserve fine morphological details across geological time scales. These characteristics make ostracods powerful proxies for paleoenvironmental reconstruction and biostratigraphy. While morphometric methods are widely applied to other microfossil groups, their use in ostracods remains comparatively limited, largely because the labor-intensive nature of manual data acquisition constrains dataset size, scalability, and reproducibility despite their considerable potential.

To address this bottleneck, we evaluate the efficacy of AutoMorph (Hsiang et al. 2016), a high-throughput imaging pipeline, for automated extraction of size and shape data from ostracod valves. We apply this approach to two lacustrine ostracod species, Leucocythere dorsotuberosa and Leucocytherella sinensis, sampled from four lakes across the Tibetan Plateau—a region offering both exceptional ecological diversity and significant paleoclimatic archives.

Our findings demonstrate that AutoMorph successfully extracts morphometric measurements and coordinate data from ostracod valves, reducing processing time by approximately 90% compared to traditional manual methods while minimizing subjective bias inherent in landmark placement.

This methodological advancement facilitates the generation of large-scale spatial and temporal datasets from both modern and fossil assemblages, which enables more comprehensive investigations of ecological responses to environmental change and evolutionary processes. The utilization of tools like AutoMorph can, thus, fundamentally expand existing micropaleontological methodologies, enabling robust, high-throughput quantitative analyses and opening new avenues for comparative and integrative research not only for ostracods.

How to cite: Höhle, M., Frenzel, P., Schwalb, A., Haberzettl, T., Wang, J., Zhu, L., and Wrozyna, C.: Testing the applicability of automated size and shape analyses in non-marine ostracods-A case study from the Tibetan Plateau, EGU General Assembly 2026, Vienna, Austria, 3–8 May 2026, EGU26-6343, https://doi.org/10.5194/egusphere-egu26-6343, 2026.

EGU26-6519 | ECS | Posters on site | SSP4.5

Integrating Environmental Proxies and Benthic Foraminifera to Assess Desalination Outflow Impacts in the Western Arabian Gulf 

Sinatrya Diko Prayudi, Bassam S. Tawabini, Abduljamiu O. Amao, Thomas F. Garrison, Fabrizio Frontalini, and Michael A. Kaminski

While desalination is indispensable for freshwater security in arid regions, the ecological consequences of hypersaline brine discharge remain a concern. This study assesses the environmental conditions and benthic foraminiferal response near the Al-Dur Power and Desalination Plant in Bahrain, western Arabian Gulf. By analyzing physico-chemical parameters in water and sediment along a spatial gradient, we utilized foraminiferal community composition, diversity indices, and test preservation as proxies for environmental stress. Proximal to the discharge, we observed extreme hypersalinity (above 40 psu), reduced pH, and elevated concentrations of total organic carbon and heavy metals. These conditions correspond to a significant decline in biological status: living assemblages near the outflow exhibited reduced abundance and lower Shannon diversity (less than 2) compared to reference sites (above 2). Additionally, test discoloration, a key stress indicator, affected more than 50% of specimens near the discharge, versus lower than 50% at downstream sites. Our results delineate a localized impact zone where, despite the persistence of stress-tolerant taxa such as Ammonia, Elphidium, and Peneroplis, overall biodiversity is markedly reduced. As the first record of desalination-driven impacts on foraminifera in the western Arabian Gulf, this research provides a vital baseline and emphasizes the need for targeted mitigation strategies to protect vulnerable marine ecosystems amidst expanding desalination infrastructure.

How to cite: Prayudi, S. D., Tawabini, B. S., Amao, A. O., Garrison, T. F., Frontalini, F., and Kaminski, M. A.: Integrating Environmental Proxies and Benthic Foraminifera to Assess Desalination Outflow Impacts in the Western Arabian Gulf, EGU General Assembly 2026, Vienna, Austria, 3–8 May 2026, EGU26-6519, https://doi.org/10.5194/egusphere-egu26-6519, 2026.

EGU26-7515 | ECS | Orals | SSP4.5

First Record of Hantkenina from Saudi Arabia and its Paleoclimatic Significance across the Bartonian–Priabonian Transition 

Asmaa Korin, Sherif Allam, Syouma Hikmahtiar, and Kaminski Michael

The middle to late Eocene represents a critical interval of global climatic transition following the Middle Eocene Climatic Optimum, yet its expression across the Arabian Plate remains poorly constrained due to limited deep-marine records and long-standing assumptions of regional stratigraphic hiatuses. Here, we present the first comprehensive documentation of the planktonic foraminiferal genus Hantkenina from Saudi Arabia, based on integrated micropaleontological and geochemical analyses of the Rashrashiyah Formation in the Sirhan–Turayf Basin, northwestern Saudi Arabia. Seven species (Hantkenina dumblei, H. australis, H. longispina, H. compressa, H. primitiva, H. alabamensis, and H. nanggulanensis) are identified and calibrated to planktonic foraminiferal biozones E13–E14 and calcareous nannoplankton zones NP17–NP18, confirming the presence of both Bartonian and Priabonian marine sediments and challenging previous interpretations of a middle–late Eocene depositional hiatus in the region. There is a clear bimodal pattern to the stratigraphic distribution of Hantkenina, with occurrences concentrated in the upper and lower portions of the succession and a period of diminished abundance or disappearance in between. Stable oxygen and carbon isotope analyses (δ18O and δ13C) derived from benthic foraminifera (Uvigerina) reveal alternating intervals of warming and cooling, with reconstructed bottom-water temperatures ranging from approximately 23°C to 30°C. The presence of Hantkenina is closely linked to milder intervals, highlighting the genus's noticeable sensitivity to temperature and confirming its significance as a dependable indicator in paleoclimatic and paleoecological studies. An unconformity at the top of the Rashrashiyah Formation indicates the erosion of the uppermost Eocene and Oligocene sediments, attributed to the combined influence of global eustatic sea-level fall during the Eocene–Oligocene transition and regional tectonic uplift associated with Red Sea rifting. These findings refine the Eocene stratigraphic framework of the Arabian Plate and highlight the valuable application of planktonic foraminifera in reconstructing paleoclimate conditions and marine ecosystem responses during major climate transitions.

How to cite: Korin, A., Allam, S., Hikmahtiar, S., and Michael, K.: First Record of Hantkenina from Saudi Arabia and its Paleoclimatic Significance across the Bartonian–Priabonian Transition, EGU General Assembly 2026, Vienna, Austria, 3–8 May 2026, EGU26-7515, https://doi.org/10.5194/egusphere-egu26-7515, 2026.

EGU26-8107 | ECS | Posters on site | SSP4.5

Seasonal succession of diatoms in the coastal Baltic Sea: insights into diatom-based proxy for past environmental change 

Sohvi Railo, Kaarina Weckström, Maija Heikkilä, and Saija Saarni

Diatoms are excellent environmental proxies due to their often species-specific, narrow environmental tolerances, but the annual succession of diatom communities in coastal seas remains deficiently known. This knowledge gap constrains our ability to reconstruct past seasonal changes in marine systems, as variation in seasonal conditions strongly impacts the composition of diatom species assemblages, and consequently assemblages preserved in the sediments. In particular species dynamics related to sea ice are still underexplored, as ice-cover restricts undisturbed access. Automated sequencing sediment traps offer an effective solution to overcome these challenges, even during the ice-cover period.


In this PhD project, the seasonal succession of coastal diatom communities, as well as their contribution to vertical particulate organic matter fluxes and sedimentation are studied over multiple years in Tvärminne Storfjärden, Gulf of Finland. The aim is to enhance our understanding of the seasonal patterns of diatom species succession and sedimentation at a high temporal resolution, with a focus on understanding seasonal environmental drivers of species assemblage composition and the development of paleoenvironmental reconstruction methods. The data is collected with automated sequencing sediment traps, moored to the sea floor to continuously collect vertical material fluxes settling from the sea surface at a two-week temporal resolution. Two sediment traps are deployed at depths of 15 m and 27m (approximately 3 meters above the seabed) to assess how processes like decomposition and predation impact the vertical sediment flux. Diatom assemblages are analysed by microscopic identification and compared to simultaneous environmental measurements of e.g., sea-surface temperature, salinity and sea-ice cover to assess species-specific seasonal ecologies and deposition patterns. In addition, bulk organic geochemical analysis renders information about carbon flux and sources to the seafloor. Enhanced seasonal ecological information will improve diatom-based methods, enabling more accurate reconstructions of past and predictions of future coastal environments. Also, the advancement provides valuable insights into the impacts of ongoing environmental change and anthropogenic pressure on aquatic systems and, ultimately human well-being.

How to cite: Railo, S., Weckström, K., Heikkilä, M., and Saarni, S.: Seasonal succession of diatoms in the coastal Baltic Sea: insights into diatom-based proxy for past environmental change, EGU General Assembly 2026, Vienna, Austria, 3–8 May 2026, EGU26-8107, https://doi.org/10.5194/egusphere-egu26-8107, 2026.

EGU26-8443 | ECS | Orals | SSP4.5

New Caledonian Large Benthic Foraminiferal S/Ca signatures as sulfate seawater proxies: Results from controlled growth experiments 

Tobias Walla, Delphine Dissard, Thierry Jauffrais, Lennart de Nooijer, Cyril Marchand, and Gert-Jan Reichart

Sulfate (SO42-) is the second most abundant anion in seawater. Nevertheless, its long-term accumulation and variability throughout Earth's history remains largely uncertain. Considering the preservation potential of benthic foraminifera in the fossil record, geochemical signatures of large tropical benthic foraminifera (LBF) are an important tool for paleoclimatic proxies. Considering their significant deposit of high-magnesium calcite within fragile tropical ecosystems largely threatened by climate change, an improved understanding of both their calcification processes and geochemical signatures in the face of climate change environmental variables, is of main interest, particularly as LBF have not been as intensively studied as planktonic - and smaller benthic foraminifera. The study of Marginopora sp., an ubiquitous LBF in tropical regions of the Pacific Ocean, provides a unique opportunity to reconstruct changes in environmental parameters in seawater over time. Cultures of Marginopora sp. from New Caledonian environments were performed with modern and decreased seawater pH values and modern and increased [SO42-]sw to calibrate impact of seawater sulfate concentration on both S/Ca concentrations and δ34S composition of the S incorporated in the shells of Marginopora sp.. Here, we present S/Ca data and other Element/Calcium ratios derived from LA-Q-ICP-MS (NWR193UC & Thermo Fisher Scientific iCAP-Q) and solution SF-ICP-MS (Thermo Fisher Scientific Element-2) analyses, as well as sulfur isotope data acquired from Isotope Ratio Mass Spectromety (IRMS with Elementar vario EL cube). As already described in previous studies looking at the geochemical signatures of small benthic foraminifera, S/Ca ratios within Marginopora sp. test, increased with increasing seawater S/Ca concentration. However, and contrarily to what was reported previously, the Mg/Ca content of Marginopora was observed to decrease with increasing S/Ca calcite content, highlighting potential differences in calcification disruption between low-Mg and high-Mg calcitic foraminifers when exposed to an increase in seawater sulfate concentrations. 

How to cite: Walla, T., Dissard, D., Jauffrais, T., de Nooijer, L., Marchand, C., and Reichart, G.-J.: New Caledonian Large Benthic Foraminiferal S/Ca signatures as sulfate seawater proxies: Results from controlled growth experiments, EGU General Assembly 2026, Vienna, Austria, 3–8 May 2026, EGU26-8443, https://doi.org/10.5194/egusphere-egu26-8443, 2026.

Oceanic Anoxic Event 2 (OAE 2; Cenomanian–Turonian) is an interval of environmental perturbation associated with elevated CO₂, linked to the activity of the Caribbean Large Igneous Province. It represents a natural experiment for investigating the response of marine organisms, including calcareous nannoplankton, to extreme oceanic disruption. This study focuses on Eprolithus floralis, a nannolith with cooler surface water affinity. Previous morphometric analyses documented size and morphological changes of E. floralis across OAE 2 in the Eastbourne section (UK). To assess whether this signal is global and to explore the drivers, we investigated the size, morphology, and abundance of E. floralis across: Clot Chevalier (France), Novara di Sicilia (Italy) -up to peak B- and Tarfaya (Morocco). Our results indicate that the morphometric and morphological response of E. floralis to OAE 2 consist of reproducible signals, although modulated by local paleoceanographic conditions. A reduction in mean total diameter during OAE 2 is observed in all sections, with minimum values at peak B of the δ13C, or slightly later at Tarfaya. Only at Novara di Sicilia E. floralis displays reduced dimensions prior to OAE 2. A post-OAE 2 size increase is observed in all records. Two morphotypes, spiky and rounded previously identified at Eastbourne, occur in all studied sections and show broadly similar patterns thus excluding a diagenetic control on nannolith morphology. Rounded E. floralis increases in abundance immediately prior to the onset of OAE 2 and dominates throughout the event (>50%), whereas spiky forms prevail in pre- and post-OAE 2 intervals. The spiky morphotype is larger than the rounded morphotype and, consequently, variations in total mean size reflect changes in morphotype dominance. Interestingly, the size offset between morphotypes varies geographically, being smaller at Eastbourne and Clot Chevalier (ca.0.2 μm) and larger at Novara di Sicilia and Tarfaya (ca.0.5 μm). No correspondence is observed between E. floralis size or abundance with the Plenus Cold Event, suggesting that temperature was not a primary control. Notably E. floralis is more common at Novara di Sicilia and Tarfaya possibly due to different oceanographic settings, being the two sections located in upwelling areas. We conclude that E. floralis responded globally to OAE 2 with size reduction and change in dominance of morphotype abundance. Size variation is comparable to that documented in Biscutum constans coccoliths. This correspondence suggests a common sensitivity to peak environmental stress, potentially linked to elevated CO₂ levels and increased concentrations of toxic trace metals. Importantly, regional variability provides insights into the adaptive strategies of E. floralis. The predominance of smaller, rounded morphotypes at Novara di Sicilia and Tarfaya suggests a preference for unstable conditions, such as those of upwelling. We speculate that the rounded morphotype may reflect a r-like strategy whereas the larger spiky were better adapted to more stable conditions.

How to cite: Bottini, C., Erba, E., and Tungo, E.:  The response of calcareous nannofossil Eprolithus floralis to Oceanic Anoxic Event 2 (Cenomanian-Turonian, Late Cretaceous), EGU General Assembly 2026, Vienna, Austria, 3–8 May 2026, EGU26-9070, https://doi.org/10.5194/egusphere-egu26-9070, 2026.

EGU26-9480 | ECS | Posters on site | SSP4.5

Bayesian astrochronology and radioisotope geochronology reveal contrasting carbon-isotope and biotic turnovers across the Jurassic–Cretaceous boundary in Tethys and Boreal realms 

Jihede Haj messaoud, Nicolas Thibault, Nicholas Boehm, Thomas Finkbeiner, and Frans van Buchem

The Jurassic–Cretaceous boundary, conventionally placed at the base of the Berriasian, remains one of the most contentious horizons in the Phanerozoic timescale because the basal Berriasian is difficult to correlate consistently across Austral, Tethyan, and Boreal realms. Recent refinements in calcareous nannofossil biostratigraphy, notably the zonation proposed by Casellato and Erba (2021), together with emerging high-resolution carbon-isotope records from multiple basins, promise more robust global constraints on this transition. Although not tied to a single global event, the Jurassic–Cretaceous interval registers evolutionary turnover and reorganization of marine ecosystems, including shifts in carbonate production, ocean circulation, and floral assemblages, yet efforts to resolve their timing and drivers are hampered by fossil preservation/provincialism, stratigraphic discontinuities, and limited high‑precision geochronology.

The BH-02 well (207 m thick, Tithonian–Berriasian, Manifa and Sulaiy formations) in central Saudi Arabia offers a suitable archive to address these issues. High‑resolution calcareous nannofossil biostratigraphy/counting, integrated with correlations to calpionellid and calcareous nannofossil biozonations in Kuwait, enables recognition of key bioevents across the Jurassic–Cretaceous transition, while complementary strontium isotope geochronology, detailed cyclostratigraphy, and Bayesian astrochronology refine the temporal resolution to less than 100 kyr. Within this integrated scheme, the δ¹³Ccarb record captures both the early Tithonian and Late Berriasian carbon‑isotope excursions, which are placed in a high‑resolution age model together with Nannofossil Calcification Events I and II and the Late Berriasian Nannoconus Event, thereby constraining the coupling of biotic and isotopic change along the southern Tethyan margin.

Cyclostratigraphic analysis of high-resolution gamma-ray and potassium logs (~20,000 data points) using multitaper spectral methods, evolutive harmonic analysis, correlation coefficient spectra, band-pass filtering, and wavelet analysis reveals a pervasive ~7 m cycle interpreted as long eccentricity (405 kyr). Extraction of 30 E405 cycles implies a duration of ~12.1 Myr for the studied interval, in close agreement with independent Sr-isotope estimates of ~11.9 Myr (137.9–149.8 Ma). Age–depth modelling is achieved using astroBayes, a Bayesian inversion framework that jointly assimilates astrochronologic and radioisotopic constraints to reduce interpolation uncertainties between dated horizons and to resolve subtle changes in sedimentation rate while considering prior information on sedimentation and potential hiatuses.

This integrated stratigraphic, geochemical, and astrochronologic framework provides a precisely constrained, orbitally calibrated reference section for the Jurassic–Cretaceous boundary on the Arabian Plate. Comparison with coeval successions reveals contrasting carbon-isotope trends between the Tethyan and Boreal realms, reflecting a decoupling of oceanographic conditions through the J/K transition with recoupling during the Weissert Event, signaling a renewed phase of oceanic connectivity.

How to cite: Haj messaoud, J., Thibault, N., Boehm, N., Finkbeiner, T., and van Buchem, F.: Bayesian astrochronology and radioisotope geochronology reveal contrasting carbon-isotope and biotic turnovers across the Jurassic–Cretaceous boundary in Tethys and Boreal realms, EGU General Assembly 2026, Vienna, Austria, 3–8 May 2026, EGU26-9480, https://doi.org/10.5194/egusphere-egu26-9480, 2026.

EGU26-10513 | Orals | SSP4.5

Revision of Amazonian Perissocytheridea Species (Ostracoda, Crustacea) from the Pebas Formation (Middle Miocene) 

Maria Belen Zamudio, Martin Gross, Andres Salazar-Rios, and Werner E. Piller

During the Miocene (c. 23–10 Ma), a large wetland with shallow lakes and swamps developed in Western Amazonia (Hoorn et al., 2010). This predominantly aquatic environment – the ‘Pebas system’ – was colonized by rapidly evolving endemic invertebrate faunas, with mollusks and ostracods being the best documented (e.g., Wesselingh, 2006; Purper, 1979).

Over the last four decades, ‘Pebasian’ ostracods have been thoroughly studied. However, most research has focused on the genus Cyprideis Jones, which typically constitutes the bulk of the ostracod fauna (Purper, 1979; Muñoz-Torres et al., 1998; Gross et al., 2014).

In this study, we focus on the genus Perissocytheridea Stephenson (Cytheridae). The material examined consists of approximately 1,400 mostly well-preserved valves and carapaces. These specimens come from 14 fertile samples, collected from eight outcrops in the Iquitos region (Peru), which cover the Middle Miocene mollusk biozones MZ4–MZ8 (Wesselingh et al., 2006).

Eight taxa were identified. The most abundant are Perissocytheridea ornellasae and Perissocytheridea? elongata, followed by Perissocytheridea sp. 1, Perissocytheridea sp. 2 and fewer specimens of P. acuminata and Perissocytheridea sp. 3. All taxa appear to be endemic to the Pebas system. Notably, the specimens assigned to Perissocytheridea sp. 2 and Perissocytheridea sp. 3 display ‘inverse’ hinges. Perissocytheridea sp. 2 is recorded only in the stratigraphically oldest sections (mollusk zone MZ4; Boca Napo and Santa Teresa localities), together with Perissocytheridea sp. 1. In contrast, P. ornellasae occurs in samples from several localities and biozones (MZ5, MZ7 and MZ8), and is associated with P.? elongata in MZ7 (Puerto Almendras) and with P. acuminata in MZ8 (Palo Seco). The later was only recorded from one sample in the youngest biozone (MZ8). Unfortunately, in the samples analysed from MZ6 we not recorded Perissocytheridea.

Several intraspecific variations were observed. For example, specimens assigned to P.? elongata from MZ7 (Puerto Almendras and Tamshiyacu) exhibit smooth, reticulated, or strongly ornate surfaces, as well as the presence of nodes, which appear to have an ecophenotypic origin. Additionally, analyses of the ontogeny of P. ornellasae, Perissocytheridea sp. 1 and Perissocytheridea sp. 2, suggests that it is possible to distinguish a form of incipient sexual dimorphism in the final instars.

Although numerous references exist to ‘Pebasian’ ostracods with ‘inverse’ hinges, all previously documented cases correspond to the genus Cyprideis (Purper & Pinto, 1983, 1985; Whatley et al., 1998; Gross et al., 2013, 2014). The presence of such ‘inverse’ forms may indicate reproductive isolation and, consequently, sympatric speciation, as suggested for the ‘Cyprideis species flock’ (Gross et al., 2014). Nevertheless, the trigger for the occurrence of these ‘inverse’ forms in ‘Pebasian’ ostracods remains unknown.

How to cite: Zamudio, M. B., Gross, M., Salazar-Rios, A., and Piller, W. E.: Revision of Amazonian Perissocytheridea Species (Ostracoda, Crustacea) from the Pebas Formation (Middle Miocene), EGU General Assembly 2026, Vienna, Austria, 3–8 May 2026, EGU26-10513, https://doi.org/10.5194/egusphere-egu26-10513, 2026.

The uplift of the Qinghai-Tibet Plateau is considered a major driver of the Cenozoic environmental evolution in Asia. The paleoenvironment reconstruction of the Qinghai-Tibet Plateau provides valuable insights into the study of uplift history and environmental evolution of the plateau. The continuous Cenozoic sediments preserved in the Lunpola Basin, northern Tibet, make it an ideal area for investigating the paleoenvironment of the Qinghai-Tibet Plateau. However, there is still no consensus on the reconstructions of paleoelevation and paleoclimate or on the chronological assignment of their corresponding results. This study focuses on the lacustrine strata of the Dingqinghu Formation in the Lunpola Basin. We combine U-Pb zircon dating with biostratigraphic evidence to place the study section within the Late Oligocene, providing a well-constrained chronological framework. The sporopollen data reveal a paleovegetation landscape consisting of coniferous forest in high-midlands, mixed coniferous and broad-leaved forests in mid-lowlands, and shrubs and herbs distributed within forests. This indicates an obvious vertical vegetation zonation in the Lunpola area. On the basis of sporopollen records, we defined three sporopollen zones and identified a paleoclimatic change characterized by an initial humid phase, a subsequent shift to relatively arid condition, and a final return to a humid climate. The paleoelevation reconstruction carried out on this basis enables us to exclude plateau uplift as a primary driver of the climate change in this period. Furthermore, the observed coupling between the arid trend and contemporaneous global temperature change might suggest that this aridification is linked to the global climate change associated with Antarctic ice-sheet expansion.

How to cite: Deng, J. and Fu, X.: Paleoenvironment of Late Oligocene in the central Qinghai-Tibet Plateau: Insights from Sporopollen Fossils, EGU General Assembly 2026, Vienna, Austria, 3–8 May 2026, EGU26-10890, https://doi.org/10.5194/egusphere-egu26-10890, 2026.

The genus Coccolithus includes some of the most widespread and abundant coccolithophore species during the early Eocene. While the early Eocene saw major evolutionary turnover within the calcareous nannoplankton, in particular during the Early Eocene Climatic Optimum (EECO; ~53–49 Ma), Coccolithus remained consistently common throughout the extremely warm EECO and the subsequent cooling interval. Notably, early Eocene Coccolithus exhibited substantially broader morphological variability than its modern representatives, spanning wide ranges in coccolith size and shape. This high intrageneric diversity may in part explain why this taxon remained ecologically prominent. Different Coccolithus species/morphotypes and their specific traits could reveal what selective pressures favoured this group across climatic extremes. Here, we quantify intrageneric morphological variability by combining species-level assemblage counts with coccolith biometry in 53 deep-sea sediment samples from ODP Site 1258 (Demerara Rise, equatorial Atlantic). This dataset provides an opportunity to better understand the adaptive flexibility and resilience of the Coccolithus lineage during the early Eocene. For example, preliminary data reveal that small species were more common (C. pauxillus and C. pelagicus <5 μm) during the EECO, while a shift towards larger species and morphotypes (e.g., C. formosus and C. pelagicus >5 μm) is observed afterwards. Supported by biometric analysis, these patterns indicate long-term community shifts in mean cell size and associated physiological strategies under prolonged greenhouse conditions.

How to cite: Asanbe, J. and Henderiks, J.: Quantifying intrageneric morphological variability and evolution in Coccolithus across the Early Eocene Climatic Optimum in the equatorial Atlantic (ODP Site 1258), EGU General Assembly 2026, Vienna, Austria, 3–8 May 2026, EGU26-12330, https://doi.org/10.5194/egusphere-egu26-12330, 2026.

EGU26-12898 | ECS | Posters on site | SSP4.5

Non-linear ecological responses of Ostracod communities to multi-metal pollution based on tolerance-weighted indices from the Vedaranyam shelf, Bay of Bengal, India. 

Prakasheswar Palanichamy, Sivapriya Vimal Kanth, Sabari Nathan Chellamuthu, Ramya Subramani, and Shaik Mohammad Hussain

Benthic ostracods serve as effective bioindicators of sediment quality and metal enrichment in coastal systems, but quantitative tools linking their community structure to multi-metal contamination are limited. This study develops and validates two ostracod-based biotic indices, the Ostracoda Assemblage Pollution Index (OAPI) and its reduced form, Mini-OAPI, to evaluate benthic ecological responses to metal contamination on the Vedaranyam shelf, Bay of Bengal. Twenty-eight surface sediment samples were analysed for Fe, Mn, Cr, Cu, Ni, Pb, and Zn concentrations along with ostracod assemblage data. The indices integrate species diversity, functional guild composition, and normalized pollution load to produce a tolerance-weighted ecological deviation measure. The OAPI includes diversity, evenness, guild shift, and pollution load, performs best in data-rich settings, while Mini-OAPI shows stable diagnostic behaviour under data-limited conditions and consistently captures ecological responses along contamination gradients. Normalization to a 0-1 scale and the use of standardized disturbance classes (Low = 0.00-0.33; Moderate = 0.34-0.66; High = 0.67-1.00) ensure comparability across marine and estuarine systems. A unimodal diversity-pollution pattern consistent with the Intermediate Disturbance Hypothesis and weak Cu-organic associations indicate complex metal-biota interactions. These indices provide transferable, tolerance-weighted tools for ecological assessment and understanding ecosystem responses to environmental change.

Keywords: Ostracoda Assemblage Pollution Index (OAPI); Mini-OAPI; benthic bioindicators; non-linear ecological modelling; Intermediate Disturbance Hypothesis (IDH); copper paradox; marine pollution assessment.


How to cite: Palanichamy, P., Vimal Kanth, S., Chellamuthu, S. N., Subramani, R., and Hussain, S. M.: Non-linear ecological responses of Ostracod communities to multi-metal pollution based on tolerance-weighted indices from the Vedaranyam shelf, Bay of Bengal, India., EGU General Assembly 2026, Vienna, Austria, 3–8 May 2026, EGU26-12898, https://doi.org/10.5194/egusphere-egu26-12898, 2026.

EGU26-14021 | ECS | Posters on site | SSP4.5

Impact of temperature and salinity on the morphological variability of lab-grown Cyprideis torosa (Jones, 1850) (Ostracoda) 

Paulina Kukacka, Christopher Berndt, Isolde Berger, Matthias Nagy, Romana Melis, Gianguido Salvi, and Petra Heinz

Keywords: Culture experiment, Size, Proxy development, Phenotypic adaptation

The carapace of ostracods (small crustaceans) protects their soft body from harsh conditions. Its size can vary distinctly within one species but major causes for this variability remain uncertain. Cyprideis torosa is a widespread brackish water ostracod-species with high morphological variability, making it a well-suited study object relating environmental conditions quantitatively to its morphology. Since this species lives in habitats with great spatio-temporal variability, lab-cultures are highly valuable for studying its phenotypic adaptation to different conditions.

In June 2024 location water and sediment samples were collected from the Marano Lagoon (North Italy). The samples provided three levels of salinity (PSU 7.7, 16.1 and 29.6) which were used to start experimental cultures (sediment from PSU 7.7 served as origin of all ostracod specimens). All three levels of salinity were incubated at four different constant temperature conditions ranging from 15 to 35°C. One set of cultures was placed outside the building, being exposed to fluctuating temperatures. Size and other morphological features were analysed to identify specific environmental influences on its morphological characteristics.

Our study reveals that temperature and salinity play an important role on size variability and variance of the carapace. Individuals living in higher salinities and cooler temperatures grow bigger. The opposite is true for extreme conditions (high temperatures) or low salinities. While high temperatures cause significantly smaller carapaces at high salinities, they lead only to higher variances in lower salinities without affecting the average size. The average size of one outside culture (PSU 7.7) reveals that size may be unaffected by diurnal changes. The results were compared to C. torosa valves collected from ostracods grown in the lagoon (PSU 22.7). The length of the individuals of this sample correlates best with rather extreme conditions in our cultures. The length/height ratio of left valves of natural environments (such as lagoon sample, permanent culture and naturally grown ostracod culture starters) are similarly low to each other, corresponding only to the experimental grown ostracods in high mesohaline salinity at 30°C, while other experimental grown individuals show a higher ratio in average.

Our results indicate that salinity as well as temperature influence the size of C. torosa simultaneously and requires further morphological analysis to separate these factors.

How to cite: Kukacka, P., Berndt, C., Berger, I., Nagy, M., Melis, R., Salvi, G., and Heinz, P.: Impact of temperature and salinity on the morphological variability of lab-grown Cyprideis torosa (Jones, 1850) (Ostracoda), EGU General Assembly 2026, Vienna, Austria, 3–8 May 2026, EGU26-14021, https://doi.org/10.5194/egusphere-egu26-14021, 2026.

EGU26-14225 | Orals | SSP4.5

Deeper-water gypsum formation constrained by micropaleontology and stable isotopes in the Burdigalian, northern Tethyan Seaway (Qom Formation) 

Masoud Sharifi-Yazdi, Iuliana Vasiliev, Kateřina Schӧpfer, and Michael Wagreich

The Qom Formation was deposited in the Central Basin of Iran, representing the northern part of the Tethyan Seaway during the Burdigalian (Lower Miocene). This study focuses on the deep marine marls of member e of the Qom succession in the Dochah section. This study integrates lithostratigraphy, calcareous nannofossils, oxygen and carbon isotopes of planktonic foraminifera, and oxygen isotopes measured on gypsum crystals. Deposition of evaporites started in the lower Burdiglian in the basin, increasing upwards. During middle to late Burdigalian, salinity increased in the basin due to tectonic activity and a relatively warm and definitely arid climate. The negative water budget resulted in precipitation and sedimentation of gypsum and halite. The oxygen isotope data measured on gypsum crystals indicate a primary, syn-depositional origin for these evaporite minerals. In addition, the oxygen measured on the planktonic foraminifera (average: -4.18‰ VPDB) indicate that the biota lived in a surface water with relatively normal salinity. We concluded that the evaporites were formed on the sea-bottom due to an increasing bottom water salinity under increased water column stratification. The Qom Basin shows similarities to the deep Mediterranean basin during the Messinian Salinity Crisis, where largest part of the evaporites precipitated under water from a deeper-water brine with increasing salinity in a stratified water column. However, the high diversity of calcareous nannoplankton coexistent with planktic foraminifera observed in the Qom succession is interpreted as reflecting high-frequency, low-amplitude sea-level fluctuations within the Milankovitch band with establishment of a temporary connection to the open-marine realm. These oscillations alternated between more open-marine conditions and short-lived stressed intervals, during which basin restriction, enhanced evaporation and episodic evaporite deposition occurred. Subsequently, thin evaporite layers that formed on the seafloor, were later fragmented and dispersed within the marls during diagenesis. Overall, this study provides new insights into the detailed paleoenvironmental evolution of the northern part of Tethyan seaway.

Keywords: Qom Formation, Paleosalinity, Tethyan Seaway, Evaporites, Nannoplankton

How to cite: Sharifi-Yazdi, M., Vasiliev, I., Schӧpfer, K., and Wagreich, M.: Deeper-water gypsum formation constrained by micropaleontology and stable isotopes in the Burdigalian, northern Tethyan Seaway (Qom Formation), EGU General Assembly 2026, Vienna, Austria, 3–8 May 2026, EGU26-14225, https://doi.org/10.5194/egusphere-egu26-14225, 2026.

EGU26-14640 | ECS | Posters on site | SSP4.5

Planktic foraminifera-bound nitrogen isotopes across the Middle Eocene Climatic Optimum (MECO, ~40 Ma): implications for photosymbiosis and community change in the Atlantic Ocean 

Silvia Sigismondi, Alexandra Auderset, Michael Henehan, Alfredo Martínez-García, and Valeria Luciani

The Cenozoic Era provides a key framework for investigating how ocean oxygenation and marine productivity responded to past global warming events, offering valuable analogues for ongoing and future climate change. Here, we integrate foraminifera-bound nitrogen isotopes (FB-δ¹⁵N) with stable carbon and oxygen isotopes (δ¹³C, δ¹⁸O) to reconstruct nitrogen-cycle dynamics, water-column oxygenation, and photosymbiotic behaviour in planktic foraminifera across the Middle Eocene Climatic Optimum (MECO; ~40 Ma), a major greenhouse interval lasting ~500–600 kyr. The dataset is based on planktic foraminifera from two Atlantic sites spanning contrasting latitudes: subtropical ODP Site 1051 and subantarctic ODP Site 702. FB-δ¹⁵N records from both sites show a marked and coherent decrease during the MECO, reaching minimum values at peak warming. This trend indicates a general reduction in water-column denitrification, a process that generally occurs under extremely low oxygen conditions, suggesting that prolonged warming was not associated with widespread deoxygenation  in the global ocean .  These results are consistent with patterns observed during other Cenozoic hyperthermals (e.g. PETM, EECO, MCO) and imply that enhanced deep-water ventilation and/or reduced biological productivity counteracted warming-driven oxygen loss. Paired δ¹³C and δ¹⁸O data confirm persistent vertical habitat partitioning among planktic foraminiferal taxa, despite partial convergence in δ¹⁸O values during the MECO, indicating upper-ocean thermal homogenization and temporary niche compression. This preservation of depth-related ecological structure supports the interpretation of interspecific FB-δ¹⁵N offsets as reflecting distinct symbiotic strategies. Lower δ¹⁵N values in Acarinina and Globigerinatheka relative to Subbotina confirm their photosymbiotic nature, while systematic differences between the two symbiotic genera suggest dinoflagellate symbionts in Acarinina and non-dinoflagellate algae (e.g. diatoms or coccolithophorids) in Globigerinatheka. The contrasting evolutionary trajectories of these taxa, recording a decline for Acarinina and expansion for Globigerinatheka during and after the MECO, likely reflect differences in symbiont flexibility and sensitivity to photic-zone environmental change. Overall, this study provides the first reconstruction of the nitrogen cycle across the MECO and demonstrates the value of FB-δ¹⁵N, combined with δ¹³C–δ¹⁸O constraints, as a dual proxy for local and global denitrification and planktic foraminiferal ecology during sustained greenhouse warming.

How to cite: Sigismondi, S., Auderset, A., Henehan, M., Martínez-García, A., and Luciani, V.: Planktic foraminifera-bound nitrogen isotopes across the Middle Eocene Climatic Optimum (MECO, ~40 Ma): implications for photosymbiosis and community change in the Atlantic Ocean, EGU General Assembly 2026, Vienna, Austria, 3–8 May 2026, EGU26-14640, https://doi.org/10.5194/egusphere-egu26-14640, 2026.

EGU26-14963 | ECS | Orals | SSP4.5

Effects of heavy metal pollution (Fe, Mn, Ni) on the large benthic foraminifera Amphistegina lobifera: implications for metabolic function and coevolved host-endosymbiont interactions 

Leon Plakolm, Matthias Nagy, Tina Palme, Wolfgang Wanek, Michael Schagerl, Jarosław Tyszka, and Michael Lintner

Foraminifera are remarkably diverse unicellular eukaryotes that inhabit almost all marginal marine environments and perform crucial functions for a multitude of biotic and abiotic processes. Large benthic foraminifera (LBF) such as Amphistegina lobifera are essential contributors to marine carbon and nitrogen cycling, carbon sequestration, and overall biomass in their corresponding ecosystems. Furthermore, many LBF - including A. lobifera – have obligate photosymbiotic relationships with microalgae (predominantly diatoms of the family Fragilariaceae), which assist in the formation of the foraminifera’s calcareous shell.

Shallow marine habitats are often severely impacted by anthropogenic activities due to the introduction of multiple organic and inorganic pollutants by agricultural, domestic, and industrial sources. Among these pollutants, heavy metals are particularly problematic because of their toxicity and long-lasting impact on affected environments. We exposed 140 A. lobifera individuals to various concentrations of selected metals (Fe, Mn, Ni) to evaluate possible effects on their metabolism. During incubation, the cultures were provided with 13C- and 15N-labeled microalgae as a food source, which allows for the quantification of food uptake and metabolic activity via isotope-ratio mass spectrometry. For assessing the health of the photobionts, both the maximum quantum efficiency of photosystem II and photoactive area were measured via pulse-amplitude modulation fluorescence imaging. This novel combination of analytical methods allowed us to examine the complex host-endosymbiont reactions to heavy metal pollution in detail.

Within the first 10 days of contaminant exposure, almost all incubated individuals exhibited a reduction in C and N ingestion, as well as a decline in photosynthetic area and maximum quantum yield. Conversely, after 15 days of incubation an increase in food C and especially N uptake was noticeable in certain cultures, while the activity and health of the photobionts further declined. This metal-specific decoupling between host and photosymbiont implies differential stress tolerance of the partners towards environmental pollutants and exemplifies the necessity for further research in order to fully understand the implications of anthropogenic pollution in coastal marine areas for marine microbial communities.

How to cite: Plakolm, L., Nagy, M., Palme, T., Wanek, W., Schagerl, M., Tyszka, J., and Lintner, M.: Effects of heavy metal pollution (Fe, Mn, Ni) on the large benthic foraminifera Amphistegina lobifera: implications for metabolic function and coevolved host-endosymbiont interactions, EGU General Assembly 2026, Vienna, Austria, 3–8 May 2026, EGU26-14963, https://doi.org/10.5194/egusphere-egu26-14963, 2026.

EGU26-14993 | ECS | Posters on site | SSP4.5

Species- and size-dependent δ¹¹B signatures of abrupt climate events in the Equatorial Atlantic 

Allana Azevedo, Michael J. Henehan, Francisco J. Jiménez-Espejo, and Luigi Jovane

Boron isotopes (δ¹¹B) measured in planktonic foraminifera are widely used to reconstruct past surface ocean pH and atmospheric pCO₂, yet their application in tropical regions relied on understanding of species-specific ecology and size-dependent vital effects. Here we present new data from Globigerinoides ruber (sensu stricto) and Trilobatus sacculifer spanning the last ~60 kyr from Tropical Atlantic Ocean. Our dataset comprises paired analyses of multiple size fractions (200–250 µm, 250–300 µm, 300–355 µm, and ≥355–400 µm), which enabled an assessment of species’ vital effects and how they vary with size. During the Younger Dryas, Heinrich Stadial 1 and Heinrich Stadial 4, G. ruber varied from ~19.0–19.5‰ (200–250 µm), increased to ~19.0–20.0‰ (250–300 µm) and reached values up to ~20–21‰ in the largest studied size fraction (300-350 µm). This positive relationship between δ¹¹B and test size demonstrates a pronounced size-dependent enrichment, consistent with strong biological control and near-surface calcification. In contrast, T. sacculifer exhibits lower δ¹¹B values during the same intervals, ranging from ~18.5–19‰ (200–250 µm), 18.25-17.80 ‰ (250-300 µm), 18.2-19‰ (300-355 µm). Paired species analyses from identical depth horizons reveal persistent interspecific offsets, with G. ruber recording higher δ¹¹B values than T. sacculifer across all size fractions. These offsets are maintained throughout YD, HS1, and HS4. The magnitude of size-related offsets within each species (up to ~1‰) is comparable to the expected glacial–interglacial δ¹¹B signal, underscoring the first-order importance of size fraction. We conclude that robust δ¹¹B-based reconstructions in the Equatorial Atlantic require strict size-fraction control and species-specific ecological interpretation. These findings highlight that different planktonic foraminifera record distinct levels of the upper ocean carbonate system during periods of rapid climate change, providing new constraints on tropical ocean buffering during abrupt climate events.

Keywords: Boron Isotopes, Globigerinoides ruber, Trilobatus sacculifer, Tropical Atlantic Ocean

How to cite: Azevedo, A., J. Henehan, M., J. Jiménez-Espejo, F., and Jovane, L.: Species- and size-dependent δ¹¹B signatures of abrupt climate events in the Equatorial Atlantic, EGU General Assembly 2026, Vienna, Austria, 3–8 May 2026, EGU26-14993, https://doi.org/10.5194/egusphere-egu26-14993, 2026.

EGU26-15249 | ECS | Orals | SSP4.5

Thrombolite reefs with archaeocyaths from the Fouanou syncline, Anti Atlas, Morocco: implications for early Paleozoic bioconstruction 

Asmaa El Bakhouch, Abdelfattah Azizi, Adeline Kerner, and Khadija El Hariri

The Cambrian microbial-dominated reefs, associated with archeocyaths, are considered to exhibit a style of bioconstruction similar to the Late Paleozoic microbial-sponge consortiums (James and Gravestock, 1990; Wood et al., 1993; Zhuravlev, 1996).

Microbial reefs from the Early Cambrian containing archeocyaths have been reported globally (Debrenne et al., 1989; Gandin & Debrenne, 2010). In the Anti-Atlas, stromatolite-dominated microbial reefs remained relatively stable until the Atdabanian (Lower Cambrian), after which they were replaced by thrombolitic reefs with archeocyaths that became widespread during this period (Álvaro & Debrenne, 2010). In the Fouanou syncline of the Western Anti-Atlas, thrombolite reefs with archeocyaths are more common in the subtidal limestones of the Igoudine Formation (the basal formation of the Tata Group), characterized by successive phases of reef growth, and separated by growth interruption surfaces (Azizi et al., 2022). These calcareous microbial thrombolites are tabular to dome-shaped, with dark micritic mesoclots of various sizes and shapes, with a maximum diameter of up to 20 mm, forming upward-growing dendritic structures. They contain numerous calcimicrobes, including Renalcis, aggregates of Epiphyton, and, to a lesser extent, tubes of Girvanella (Zhang et al., 2015). These calcimicrobes are associated with archeocyaths of irregular (more abundant) and regular (less abundant), small, dispersed inside and around these thrombolite reefs. Three genera of irregular archeocyaths, preserved in their growth position, have been identified: Dictyocyathus, Erismacoscinus, and Agastrocyathus.

The Cambrian reefs of the Western Anti-Atlas provide fascinating examples of early bioconstructions that illustrate the evolution of reef ecosystems and the interactions between microbial organisms and metazoans, showing significant morphological diversity influenced by environmental factors such as depth, hydrodynamics, as well as sedimentation and microbial influence (Gandin and Debrenne, 2010).

Keywords: Cambrian reef, thrombolites, archaeocyaths, microbial consortia, paleoenvironment, Western Anti-Atlas, Morocoo.

How to cite: El Bakhouch, A., Azizi, A., Kerner, A., and El Hariri, K.: Thrombolite reefs with archaeocyaths from the Fouanou syncline, Anti Atlas, Morocco: implications for early Paleozoic bioconstruction, EGU General Assembly 2026, Vienna, Austria, 3–8 May 2026, EGU26-15249, https://doi.org/10.5194/egusphere-egu26-15249, 2026.

EGU26-15385 | ECS | Posters on site | SSP4.5

Variability of oxygenation index in the Southwestern South Atlantic Ocean during Heinrich Stadial I based on geochemical proxies 

Maria Eduarda Santana, Allana Queiroz Azevedo, Fabrizio Frontalini, Francisco J. Jiménez-Espejo, Babette A. A. Hoogakker, Thauana R. Gonçalves, Jhulia Mulato, and Luigi Jovane

Oxygen Minimum Zones (OMZ) are water layers characterized by low oxygen saturation state in response to a complex interplay of biological, chemical, and physical processes. Modern OMZs are typically found along the western side of continents (i.e., Arabian Sea, Eastern Pacific Ocean, Eastern Tropical Atlantic Ocean, and the Southeast South Atlantic Ocean). Low oxygen conditions can however be more widely prevalent in shallower, continental shelf environments. Here, we study the evolution of bottom water oxygen conditions of Brazil’s continental shelf Santos Basin from the Southeast Atlantic. The Santos Basin which is located near the Cabo Frio upwelling system. We reconstructed bottom water oxygen conditions using the enhanced Benthic Foraminifera Oxygen Index (EBFOI) using samples from the Santos Basin Slope core C4-GC-2 ( 25°51.519’S/ 45°30.685’W, 395 m water depth). These data are integrated with mineralogical analysis and oxygen and carbon stable isotope data from the benthic foraminifera Cibicidoides spp. The age model was constructed based on four radiocarbon dating samples, which covers most part of the Heinrich Stadial 1 (HS1, 17.8–15.7 kyr). From 16.8 kyr to 16 kyr the continental shelf of Santos Basin was characterized by low oxic conditions as revealed by relatively low EBFOI values (1.9-5.3). The mineralogical analysis from the studied core revealed the presence of pyrite during this time interval, which together with geochemical proxy signatures, indicates low oxygenation of bottom-water conditions, with the development of localized anoxic microenvironments within the sediments. Notably, at 15.8 kyr marine oxygenation decreased to suboxic conditions (EBFOI = -20.3). Elevated δ¹⁸O values indicate cold conditions during HS1, likely associated with intensified upwelling, while low δ¹³C values are comparable to those recorded in Eastern Pacific intermediate waters during the same interval. The dominance of low-oxygen tolerant benthic foraminifera suggests reduced bottom-water oxygenation at ~395 m depth, consistent with a shoaling or expansion of the regional OMZ rather than methane seepage. These conditions were likely sustained by poor ventilation during HS1, limiting benthic foraminiferal diversity.

Keywords: Benthic Foraminifera Assemblage, Isotope Geochemistry, Oxygen Minimum Zone

How to cite: Santana, M. E., Queiroz Azevedo, A., Frontalini, F., J. Jiménez-Espejo, F., A. A. Hoogakker, B., R. Gonçalves, T., Mulato, J., and Jovane, L.: Variability of oxygenation index in the Southwestern South Atlantic Ocean during Heinrich Stadial I based on geochemical proxies, EGU General Assembly 2026, Vienna, Austria, 3–8 May 2026, EGU26-15385, https://doi.org/10.5194/egusphere-egu26-15385, 2026.

EGU26-15793 | ECS | Posters on site | SSP4.5

A closer look at benthic foraminifera shells – implications for biomineralization mechanisms 

Kushani Jayasoma, Dorrit Jacob, Laura Otter, Luiz Morales, Richard Wirth, and Anja Schreiber

The detailed biomineralization mechanisms of planktic and benthic foraminifera is still enigmatic
and a topic of active research. Much progress has been achieved in developing biomineralization
models for some benthic hyaline species (e.g. Erez, 2009; de Nooijer, 2014) and in discovering that
the original phase composition of planktic Orbulina universa (d’Orbigny, 1839) is metastable
vaterite and not calcite, supporting a non-classical crystallization pathway for this important
species (Jacob et al. 2017). It is, however, less clear to date whether these results can be replicated
in other foraminifera species and models for their formation can be generalized.

To extend our earlier studies on planktic species, we studied four species of benthic foraminifera
from the Australian Great Barrier Reef, namely Amphistegina lobifera (Larsen, 1976),
Baculogypsina sphaerulata (Parker and Jones, 1860), Calcarina capricornia (Mamo, 2016) and
Marginopora vertebralis (Quoy and Gaimard, 1830). Samples were collected alive and pulse
chase labelled with Sr in aquaculture before carrying out a detailed, multi-scale study of their
architecture. We used Electron Backscatter Diffraction, Nano-SIMS, Focussed Ion Beam assisted
Transmission Electron Microscopy, Micro-Raman Spectroscopy and Photo-induced Force
Microscopy (Otter et al. 2021) to elucidate and compare phase compositions, micro-architecture
and organic chemistry of the shells. Our results contribute to understand the details of
foraminiferal biomineralization and to develop a general model for shell formation across all
foraminifera species.

de Nooijer , L.J. et al. (2014). Biomineralization in perforate foraminifera. Earth-Science Reviews
135, 48-58.

Erez, J. (2003). The source of ions for biomineralization in foraminifera and their implications for
paleoceanographic proxies. Reviews in Mineralogy and Geochemistry 54, 115-149.

Jacob, D.E. et al. (2017). Planktic foraminifera form their shells via metastable carbonate phases.
Nature Communications, 8, 1265

Otter, L.M. et al. (2021) Nanoscale Chemical Imaging by Photo‐Induced Force Microscopy:
Technical Aspects and Application to the Geosciences. Geostandards and Geoanalytical Research
45, 5-27.

How to cite: Jayasoma, K., Jacob, D., Otter, L., Morales, L., Wirth, R., and Schreiber, A.: A closer look at benthic foraminifera shells – implications for biomineralization mechanisms, EGU General Assembly 2026, Vienna, Austria, 3–8 May 2026, EGU26-15793, https://doi.org/10.5194/egusphere-egu26-15793, 2026.

EGU26-16070 | ECS | Orals | SSP4.5

Large variability in planktic foraminiferal Mg/Ca and δ18O revealed by nearby surface sediments 

Ru-Yun Tung, Sze Ling Ho, Andrew M. Dolman, Thomas Laepple, Lukas Jonkers, Pei-Ting Lee, Chuan-Chou Shen, Pei-Ling Wang, and Takuya Itaki

Foraminiferal Mg/Ca and δ¹⁸O are widely used to reconstruct ocean temperatures. Comparisons between proxy-derived temperatures from surface sediments and modern gridded climatologies are commonly used to infer the recording season and habitat depth of planktic foraminifera, while down-core proxy variations are typically interpreted as reflecting past oceanographic changes at the site or region. Using these approaches requires the assumption that proxy-derived temperatures from a single site represent the mean hydrographic conditions of the corresponding spatial grid used in proxy–model or proxy–proxy comparisons. However, the extent to which this assumption holds across spatially distributed surface sediments remains poorly constrained. Sediment heterogeneity, sampling, and foraminiferal ecological processes could introduce additional variability into foraminiferal proxy data. To address these issues, here we estimated upper-ocean temperatures from the Mg/Ca ratio and δ18O of both surface and subsurface-dwelling foraminifera from multiple surface sediments within seven 1°×1° grids, which correspond to the typical spatial resolution of gridded climate fields, around the Okinawa Islands in the Northwest Pacific. The results suggest that the spread of Mg/Ca- and δ¹⁸O-derived temperatures within individual grid cells reaches up to ~4 °C, which is comparable to the typical glacial–interglacial temperature range in this region, despite the nearshore setting and lack of strong dynamic ocean processes. The Mg/Ca and δ¹⁸O-derived temperature variability differ among species, with subsurface dwellers exhibiting larger variability (~1.1 ºC, 1σ) than surface dwellers (~0.6 ºC, 1σ). To further characterize the contributions of individual processes to observed proxy variability, we used the forward model Sedproxy to simulate the variability induced by seasonal and depth occurrence of foraminifera. This variability is largely attributable to seasonal occurrence in surface-dwelling species, whereas in subsurface-dwelling species it cannot be explained by seasonality alone and likely also reflects variability in calcification depth within the upper thermocline, where temperatures change most rapidly with depth. In summary, our results attempt to quantify the contributions of ecological and sampling-related processes to proxy variability within a grid of nearby surface sediments. We therefore suggest that such variability provides an estimate of proxy uncertainty that should be taken into account in paleoceanographic reconstructions. While the magnitude may depend on regional setting, systematic assessments across regions and species are needed to better constrain proxy uncertainty and avoid over-interpreting proxy-derived temperature differences.

How to cite: Tung, R.-Y., Ho, S. L., Dolman, A. M., Laepple, T., Jonkers, L., Lee, P.-T., Shen, C.-C., Wang, P.-L., and Itaki, T.: Large variability in planktic foraminiferal Mg/Ca and δ18O revealed by nearby surface sediments, EGU General Assembly 2026, Vienna, Austria, 3–8 May 2026, EGU26-16070, https://doi.org/10.5194/egusphere-egu26-16070, 2026.

EGU26-16135 | Posters on site | SSP4.5

A 12,000-year record of dinoflagellate cysts from the Vancouver Island margin (NE Pacific): tracing past climatic, primary productivity, and oceanographic changes. 

Vera Pospelova, Zhen Li, Kenneth Neil Mertens, Alice Chang, and Yongsheng Wu

This study is the first to examine dinoflagellate cyst sedimentary records (core MD02–2496) from the latest Pleistocene to the late Holocene along the Vancouver Island margin (Li et al., 2025). We identified 14 autotrophic and 26 heterotrophic taxa and defined four dinoflagellate cyst zones related to paleoclimatic and paleoceanographic conditions. Zone I (~14–~11.6 cal kyr BP) showed the lowest marine primary productivity (PP), evidenced by the lowest total cyst concentrations and fluxes, with Brigantedinium spp. dominating the assemblages. This was likely a result of cooler conditions associated with glacial meltwater input and weak coastal upwelling. Zone II (~11.6–~10.6 cal kyr BP) displayed a slight increase in both total cyst concentrations and fluxes, alongside a rapid rise in Operculodinium centrocarpum sensu Wall and Dale 1966 and the highest abundances of Nematosphaeropsis labyrinthus. This zone was likely linked to reduced meltwater input and enhanced coastal upwelling, which promoted nearshore PP. Zone III (~10.6–~8.2 cal kyr BP) exhibited a rapid increase in PP, demonstrated by maximum total cyst concentrations and fluxes, as well as higher abundances of autotrophic taxa. This zone was interpreted to reflect a strengthened California Undercurrent and increased upwelling, coinciding with the highest insolation intensity. High abundances of Impagidinium during this time indicated more open ocean conditions. A sharp increase in Operculodinium centrocarpum with short processes around 9–8.2 cal kyr BP may relate to the 8.2 ka event and a deceleration in sea-level rise. Zone IV (~8.2–2.3 cal kyr BP) suggested gentle fluctuations in PP, with overall declines in total cyst concentrations and fluxes, reaching their lowest point around 8.0 cal kyr BP. This was followed by a slight increase at approximately 6.5 cal kyr BP, before stabilizing. After incorporating geochemical proxies from the same sediment core (Chang et al., 2008, 2014), we compared our findings with previously published reconstructions of climatic and oceanographic conditions along the western margin of North America. This comparison revealed spatial and temporal differences in marine PP and sea surface temperatures, especially between the northern and southern regions.


Li, Z., Pospelova, V., Mertens, K.N., Chang, A.S., We, Y. 2025. A 12,000-year dinoflagellate cyst record on the Vancouver Island margin, Canada: tracing past climatic, primary productivity and oceanographic conditions. Palaeogeography, Palaeoclimatology, Palaeoecology, 667: 112876, 18 p. https://doi.org/10.1016/j.palaeo.2025.112876.

Chang, A.S., Pedersen, T.F., Hendy, I.L. 2008. Late Quaternary paleoproductivity history on the Vancouver Island margin, western Canada: a multiproxy geochemical study. Canadian Journal of Earth Sciences, 45: 1283–1297. https://doi.org/10.1139/E08-038.

Chang, A.S., Pedersen, T.F., Hendy, I.L. 2014. Effects of productivity, glaciation, and ventilation on late Quaternary sedimentary redox and trace element accumulation on the Vancouver Island margin, western Canada. Paleoceanography, 29: 730–746. https://doi.org/10.1002/2013PA002581.

How to cite: Pospelova, V., Li, Z., Mertens, K. N., Chang, A., and Wu, Y.: A 12,000-year record of dinoflagellate cysts from the Vancouver Island margin (NE Pacific): tracing past climatic, primary productivity, and oceanographic changes., EGU General Assembly 2026, Vienna, Austria, 3–8 May 2026, EGU26-16135, https://doi.org/10.5194/egusphere-egu26-16135, 2026.

BENTHONIC FORAMINIFERA AND GEOCHEMICAL TRACERS AS INDICATORS OF THE ENVIROMENTAL HEALTH OF LA PAZ LAGOON, B.C.S.


Geological Oceanography.

Magallanes Cordova Karla Grisel¹, Sánchez González Alberto².

¹ Faculty of Marine Biology, Universidad Autónoma de Baja California Sur, La Paz, B.C.S., ²Centro Interdisciplinario De Ciencias Marinas del Instituto Politécnico Nacional, La Paz, B.C.S.

Kama_22@alu.uabcs.mx, alsanchezg@ipn.mx


Abstract. The health of transitional marine environments can often be compromised by inputs of particulate and dissolved material from runoff originating in urban settlements adjacent to coastal zones. In the present study, the abundance of benthic foraminifera was analyzed, the mean grain size was determined, and the contents of organic carbon and calcium carbonate were quantified in two sediment cores collected from the La Paz Lagoon, with the aim of inferring the environmental health conditions of the area. The absence of benthic foraminifera in both sediment cores may be associated with unfavorable environmental conditions. Organic carbon content ranged from 0.2 to 1.1%, showing a decrease with increasing sediment depth. Calcium carbonate content ranged from 0.3% to 0.9%, with variations of approximately 0.20% throughout the core depth. Mean grain size showed a predominance of fine sands (60%–80%). Mean grain size exhibited a decrease from the base to the upper part of both cores. The absence of benthic foraminifera suggests unfavorable environmental conditions and is associated with the decrease in organic carbon and calcium carbonate values, indicating that their availability may not be sufficient to support benthic fauna. A significant reduction is evident compared to the results obtained in 2024 by Sánchez and Gómez. The predominant sediments are fine sand with little silt, which have a reduced capacity to retain organic matter, thereby affecting the feeding of these organisms and confirming the low sedimentary quality. The current absence of foraminifera indicates that conditions have worsened beyond the tolerance of stress-related species such as the genera Ammonia and Elphidium, which previously accounted for more than 80% of dominance.


Keywords: Organic carbon, Calcium carbonate, Sediment, Cores, Isotopes.

How to cite: Magallanes, K.: Benthonic foraminifera and geochemical tracers as indicators of the enviromental health of La Paz lagoon, B.C.S., EGU General Assembly 2026, Vienna, Austria, 3–8 May 2026, EGU26-16595, https://doi.org/10.5194/egusphere-egu26-16595, 2026.

EGU26-17237 | ECS | Orals | SSP4.5

Revisiting Holocene North Pacific Intermediate Water ventilation through the lens of radiolarian morphometric analysis 

Zhi Dong, Xuefa Shi, Jianjun Zou, and Yanguang Liu

Understanding intermediate-depth ventilation processes in the North Pacific during past warm periods is essential for assessing the climatic role of ocean circulation dynamics, which significantly influence global climate change and the carbon cycle. Over the last two decades, considerable efforts have focused on understanding the evolution of North Pacific Intermediate Water (NPIW) during the Holocene (~11,700 years to present), providing the background climate state for modern anthropogenic global warming. While modern NPIW primarily ventilates from the Okhotsk Sea, the Holocene ventilation history of Okhotsk Sea Intermediate Water (OSIW) still remains unresolved: epibenthic δ13C records suggest a 30–50% reduction in oxygenation during the Holocene optimum, whereas most benthic foraminiferal-based oxygen concentrations and radiolarian assemblages indicate well-ventilated conditions in the mid-Holocene. To resolve this discrepancy, this study reconstructs the OSIW evolution pattern from its source region (the Okhotsk Sea northern shelf) using the radiolarian assemblages, revealing an evolution pattern consistent with prior radiolarian reconstructions. Meanwhile, we introduce a novel quantitative approach—Cycladophora davisiana morphometric parameters—providing, to our knowledge, the first time series of C. davisiana size distributions. New radiolarian size data demonstrate that mid-Holocene peaks in C. davisiana abundance are not primarily driven by food supply (vital effects), supporting the hypothesis of well-ventilated OSIW due to reduced freshwater input and saltier surface water. These findings not only advance quantitative methods in radiolarian-based micropaleontology but also help reconcile the intermediate-water ventilation conundrum in the Okhotsk Sea since the Holocene.

How to cite: Dong, Z., Shi, X., Zou, J., and Liu, Y.: Revisiting Holocene North Pacific Intermediate Water ventilation through the lens of radiolarian morphometric analysis, EGU General Assembly 2026, Vienna, Austria, 3–8 May 2026, EGU26-17237, https://doi.org/10.5194/egusphere-egu26-17237, 2026.

EGU26-17585 | Orals | SSP4.5

Middle to Late Miocene paleoceanographic evolution of the southern Indian Ocean (ODP Site 752) inferred from nannofossil assemblages and carbon isotopes  

Xabier Puentes Jorge, Arianna V. Del Gaudio, Werner E. Piller, David De Vleeschouwer, Tamara Hechemer, and Gerald Auer

The Middle to Late Miocene constitutes a critical time interval on a global scale. The continental reorganization that occurred during this time caused the establishment of a near-modern monsoonal wind system in the Indian Ocean (IO). Furthermore, this period is characterised by the succession of climatic scenarios linked to the Middle Miocene Climatic Transition (MMCT) and the subsequent northward shift of the Westerlies region during the Late Miocene. How these processes affected and interactedi with the surface ocean dynamics in the southern IO remains poorly understood. In this regard, Ocean Drilling Program (ODP) Site 752, located on the west flank of Broken Ridge (30° 53.475ˈS/93° 34.652ˈE), constitutes a key location to investigate how the aforementioned processes interacted with the surface current in the eastern sector of the southern IO across the Middle to Late Miocene.

Changes in the nannofossil assemblage between 7.31 and 16.06 Ma at Site 752 were evaluated to ascertain variations in the surface ocean conditions. A total of 122 samples (temporal resolution of ~60 kyr) were analysed for this purpose. The clustering ordination method UPGMA (Bray-Curtis) revealed a total of 5 clusters (Cluster 1-5). Cluster 5 was additionally divided into two sub-clusters (Cluster 5a-5b). The oceanographic conditions were inferred based on the abundance of the main nannofossil species constituting the clusters: Reticulofenestra minuta, Calcidiscus leptoporus, Coccolithus pelagicus, Reticulofenestra haqii, Reticulofenestra producta, Reticulofenestra pseudoumbilicus, and Reticulofenestra perplexa. Subsequently, the assemblage data were compared with a set of global climatic and geochemical data to ascertain the effect of global processes on the regional oceanographic configuration across the Middle to Late Miocene.

Total organic carbon (TOC) and Total Inorganic Carbon (TIC) were measured to ascertain variation in the carbon flux to the ocean floor. Additionally, bulk, organic, and benthic foraminiferal δ13C analyses were performed in order to track productivity changes and variations in the nutrient cycle during the studied time interval in the southern IO and compared with the observed variations in the nannofossil assemblage. Benthic δ13C was measured on two foraminifera species (Lobatula wuellerstorfi and Cibicidoides mundulus).

Our data indicate that the surface water of the southern IO was characterised by low nutrient availability and high temperature conditions during the Middle Miocene. After the MMCT, the surface ocean experienced an increase in nutrient availability, which was concomitant with a decrease in δ18O. Maximum surface ocean nutrient conditions were recorded after ~9.9 Ma, coeval with the establishment of the Late Miocene Cooling. A comparison between the nannofossil assemblage data at Site 752 and eNd records available in the literature confirmed the hypothesis that warm water input from the Pacific Ocean into the southern IO increased between ~10.7 – 9.9 Ma. Furthermore, the comparison of the assemblage data against δ13C, TOC, and TIC measured at ODP Site 752 allowed us to disentangle the local processes driving changes in the IO surface water conditions.

How to cite: Puentes Jorge, X., Del Gaudio, A. V., Piller, W. E., De Vleeschouwer, D., Hechemer, T., and Auer, G.: Middle to Late Miocene paleoceanographic evolution of the southern Indian Ocean (ODP Site 752) inferred from nannofossil assemblages and carbon isotopes , EGU General Assembly 2026, Vienna, Austria, 3–8 May 2026, EGU26-17585, https://doi.org/10.5194/egusphere-egu26-17585, 2026.

EGU26-17972 | ECS | Posters on site | SSP4.5

Diffusion-reaction modelling to predict the boron isotope composition of photosymbiont species O. universa from observed physiological fluxes 

Guy F. Morley, Gavin L. Foster, David Evans, Tali L. Babila, Charles B. Kaplan, Thomas B. Chalk, Julie Meilland, and Amy E. Maas

The boron isotope composition (δ11B) of planktic foraminifera tests is primarily controlled by ambient seawater pH and is therefore a well-established proxy for reconstructing surface ocean carbonate chemistry in the geological past. Reconstructions of past seawater pH from planktic foraminifera underpin estimates of atmospheric pCO2 over geological time and have driven recent advances in using past climate states to improve projections of Earth’s future climate. However, biological “vital effects” necessitate empirical, species-specific, δ11B-pH proxy calibrations for accurate pH (and pCO2) palaeo-reconstructions. Specifically, physiological processes including respiration, photosynthesis and calcification alter the pH of the diffusive boundary layer (DBL) surrounding living foraminifera. Given it is this pH that is thought to be recorded by foraminferal calcite δ11B, shell composition typically deviates from what is predicted based upon equilibrium seawater borate δ11B. This can be mechanically understood using diffusion-reaction modelling, which predicts pH and associated boron systematics within the DBL, and thus the expected δ11B at the shell surface, if respiration, photsynthesis and calcification fluxes are known. Here we report modelled pH and δ11B of individual O. universa specimens using respiration and photosynthesis rates calculated from direct observations using light-dark microelectrode and respiration chamber measurements of [O2] within the DBL. Together with modelled DBL pH/δ11B, these provide valuable insight into the drivers of species-specific and inter-specimen offsets between δ11B of foraminiferal calcite δ11B and seawater borate, addressing a critical limitation in reconstructing past seawater pH, particularly during greenhouse high-CO2 intervals, when vital effects and metabolic behaviour may have differed from the present. Ultimately, this work opens avenues to reconstruct past changes in seawater pH using single shell δ11B analysis, providing a methodology to significantly improve the temporal resolution of palaeo-pH and CO2 records relative to traditional, monospecific, bulk population analyses.

How to cite: Morley, G. F., Foster, G. L., Evans, D., Babila, T. L., Kaplan, C. B., Chalk, T. B., Meilland, J., and Maas, A. E.: Diffusion-reaction modelling to predict the boron isotope composition of photosymbiont species O. universa from observed physiological fluxes, EGU General Assembly 2026, Vienna, Austria, 3–8 May 2026, EGU26-17972, https://doi.org/10.5194/egusphere-egu26-17972, 2026.

EGU26-18014 | Orals | SSP4.5

Temporal and spatial sensitivity of foraminifera-based paleobathymetry proxies: an Early-Middle Pleistocene Transition case 

Anna Arrigoni, Werner E. Piller, Matthias Kranner, Briony Mamo, and Gerald Auer

The study of sedimentary basins´ evolution, ocean circulation patterns, inter-basin connectivity and past marine ecosystems´ spatial distribution often relies on paleobathymetric reconstructions. Foraminiferal abundance and assemblage data can be powerful proxies to unravel the paleodepth history of a given location. In this study, we compare different routinely-used foraminifera-based paleodepth proxies, including the ratio between planktic and benthic foraminifera (P/B ratio), as well as habitat depth ranges of benthic foraminiferal taxa. The respective transfer functions were subsequently applied on a ~100 m sedimentary sequence, at International Ocean Discovery Program (IODP) Site U1460. The targeted IODP Site is situated near the shelf break of the Southwestern Australian continental margin and the selected interval recorded approximately ~450 kyr of glacial-interglacial sea-level variability spanning the Early-Middle Pleistocene Transition (EMPT; 1.25-0.6 Ma). The EMPT, characterized by the transition from a 41-kyr to a 100-kyr glacial-interglacial cyclicity and amplified glacio-eustatic fluctuations, provided the ideal framework for determining: i) the paleodepth evolution of the continental shelf; ii) the temporal and spatial sensitivity of these proxies to the glacial-interglacial forcing. Collectively, the analyzed proxies revealed a deepening of the continental shelf before the onset of Marine Isotope Stage (MIS) 24, followed by a progressive, step-wise shallowing trend. Our research also highlighted the effectiveness and limitations of foraminifera-based paleodepth proxies in a shallow-water setting, where ecological variability exerts a dominant role on foraminiferal assemblages. We observed that the ratio of planktic to benthic foraminifera and its derived paleodepth curves consistently track the global glacial-interglacial sea-level variability. Nevertheless, the calculated absolute depth values are unrealistically high for a continental shelf setting, likely implying the overlapping of an ecological signal dominating the P/B ratio. Conversely, absolute paleodepth values derived solely from the benthic foraminifera depth ranges reflected more realistic bathymetric estimates for a carbonate ramp than those provided by the P/B ratio. However, this approach failed to resolve the glacial-interglacial cyclicity due to a too broad depth zonation of the total benthic assemblage. For a better depth resolution, a more specific selection of benthic taxa is necessary.

How to cite: Arrigoni, A., Piller, W. E., Kranner, M., Mamo, B., and Auer, G.: Temporal and spatial sensitivity of foraminifera-based paleobathymetry proxies: an Early-Middle Pleistocene Transition case, EGU General Assembly 2026, Vienna, Austria, 3–8 May 2026, EGU26-18014, https://doi.org/10.5194/egusphere-egu26-18014, 2026.

EGU26-18462 | ECS | Orals | SSP4.5

Linking surface and deep-ocean ecosystem dynamics across the mid-Brunhes at the Iberian Margin 

Alba Gonzalez-Lanchas, Javier Dorador, Francisco J. Rodríguez-Tovar, and José-Abel Flores

How paleoceanographic changes modulated the influence of surface primary production on deep-ocean settings at the Iberian Margin remains a matter of debate. Here, we address this question for the mid-Brunhes interval by integrating high-resolution micropaleontological records of calcifying phytoplankton with a suite of surface and deep-ocean geochemical proxies, as well as a detailed assessment of ichnological content, sediment colour, and bioturbation. These analyses are based on the Atlantic Iberian Margin sedimentary core IODP Site U1385. Our data indicate that the transfer of organic matter from the surface ocean to the seafloor was strongly modulated by both orbital- and suborbital-scale paleoclimate variability during Marine Isotope Stages (MIS) 12 to 9 (~450–339 ka). Variations in assemblage composition and abundance of calcareous nannofossil and ichnological characterization, together with changes in sediment composition, suggest that surface ocean conditions and production patterns were not always recorded in the deep-ocean environment. The sensitive response of macrobenthic tracemaker communities, coupled with variable sedimentary characteristics, highlights the influence of bottom-water conditions and ventilation on organic matter preservation and benthic ecosystem dynamics. These findings underscore the importance of integrating multiproxy records to achieve a more comprehensive understanding of paleoclimate and paleoceanographically-driven surface to deep-ocean coupling.

How to cite: Gonzalez-Lanchas, A., Dorador, J., Rodríguez-Tovar, F. J., and Flores, J.-A.: Linking surface and deep-ocean ecosystem dynamics across the mid-Brunhes at the Iberian Margin, EGU General Assembly 2026, Vienna, Austria, 3–8 May 2026, EGU26-18462, https://doi.org/10.5194/egusphere-egu26-18462, 2026.

EGU26-18781 | ECS | Orals | SSP4.5

Rainfall Reconstruction through Isotope Signatures of Mollusc Micro-fossils from a Late Holocene Archaeological Site in North West India 

Ritvik Chaturvedi, Narender Parmar, Anil Kumar Pokharia, Pankaj Baghel, Rajveer Sharma, Kaustubh Thirumalai, and Prosenjit Ghosh

Mollusc shells, though often microscopic in size, are preserved ubiquitously in archaeological sites due to their robust calcareous composition that withstands post-depositional stresses. Invariably, ‘flotation’ – a method used conventionally to retrieve botanical remains in archaeological sites – also usually recovers tiny but intact mollusc shells. In archaeological research practice, morphometry-based species identification of mollusc shells has, over the past few decades, proven to be an accessible tool to reconstruct locale-specific past environments at ancient human settlements. Broadening the ambit of the utility of mollusc microfossils, isotopic studies have further allowed us to tap into the chemical composition of these shells to yield insights into the environments in which they lived and formed.

In particular, the stable oxygen isotope composition of the shells (δ¹⁸Oshell) of freshwater and terrestrial mollusc is directly contingent on the oxygen isotope composition of the water body (δ¹⁸Owater) in which the organism lived. The latter, in turn, is driven primarily by the rainfall received, the evaporation dynamics vis-à-vis precipitation as well as the ambient temperature. Therefore, δ¹⁸Oshell in archaeological contexts – and otherwise – has been used extensively in recent decades to retrieve information about past hydrological conditions. That said, however, their immense potential as palaeo-environmental proxies has remained under-utilised in Indian and South Asian archaeological contexts, where most mollusc recoveries rarely find mention in archaeological literature or, if they do, are limited solely to morphology-based species identification.

Here, we present a high-resolution record of δ¹⁸Oshell from the Neolithic/Chalcolithic site of Tigrana, Haryana, a site that falls in the wider network of other Mature Indus Valley Civilisation sites (~5200-3900 BP). Shells under examination here were recovered from well-marked stratums during the excavation seasons through 2019-2024; alongside botanical remains (grains, wood). Of the three morphotypes (or, species/genera) identified from those recovered, only one (here, Bithynia sp.) has been used for stable oxygen and carbon isotope analyses to pre-empt any interference potentially arising from species-based fractionation. The same single-specie aliquots were used for radiocarbon dating. Additionally, the inorganic δ¹⁸O data has been supplemented with that of organic plant matter (δ¹³C) wherever possible.

We observe values ranging from -5.07‰ VPDB to -0.66% VPDB between a period of 4500 to 3800 years BP. The period 4300 BP to 4150 years BP, in particular, witnesses rapid fluctuations of the order of 3-4‰ VPDB, indicating abrupt changes in the rainfall and local evaporative regimes in the location in the above timeframe.

This work carries importance not only in terms of utilising micropalaeontological recoveries for palaeo-environmental reconstruction; but also in-terms of ascribing a climatic agency for the gradual decline of the Indus Valley Civilisation. It is noteworthy that most climate records from North-West India, based on isotopic assessments of molluscs, reconstructed for this purpose have been constructed from lake cores. These records, inevitably, carry ‘averaged-out’ signatures, for lakes collect waters through relatively large time-scales. This study, by contrast, is one of the first few attempts at reconstructing a climate-record directly from mollusc shells recovered in-situ from the archaeological site itself.

How to cite: Chaturvedi, R., Parmar, N., Pokharia, A. K., Baghel, P., Sharma, R., Thirumalai, K., and Ghosh, P.: Rainfall Reconstruction through Isotope Signatures of Mollusc Micro-fossils from a Late Holocene Archaeological Site in North West India, EGU General Assembly 2026, Vienna, Austria, 3–8 May 2026, EGU26-18781, https://doi.org/10.5194/egusphere-egu26-18781, 2026.

EGU26-18846 | ECS | Posters on site | SSP4.5

Micropaleontological insights into Late Pleistocene coastal lagoon and tsunami deposits at Copiapó mouth river (Southern Atacama Desert) 

María Frías Álvarez, Manuel Abad, Rolando Fernández, Francisco Ruiz, and Tatiana Izquierdo

Deposits associated with MIS 3 have been recently described and dated along the coastal margin of the Southern Atacama Desert. These deposits generally exhibit a wide heterogeneity of littoral facies, including beaches, deltaic fans, dunes, and coastal lagoons. In some of these marine terraces, coastal boulder deposits interpreted as tsunami-related have been identified, extending the chronology of major earthquakes and tsunamis in northern Chile and expanding the current geodynamic scenario of a tectonically active coastline back to the terminal Pleistocene.

This work describes deposits from a coastal lagoon exposed in an abandoned quarry at the mouth of the Copiapó River (northern Chile). The stratigraphic succession reaches approximately 22 m in thickness and has been dated at its base and top, yielding ages of 42,431 ± 1,891 yr and 35,984 ± 277 yr, respectively. The lower and middle sections consist of centimeter-thick layers of gypsum and gray argillites, occasionally containing solenoid bivalves and the abundant benthic foraminifera Ammonia confertitesta, with less frequent Buliminella sp., Bolivina sp., and some planktonic forms as Orbulina universa. Interbedded within these deposits are thicker beds (25–165 cm) of gray arkosic sands, slightly micaceous, showing normal grading and horizontal planar lamination.  These levels exhibit tabular geometry and slightly erosive base, dominating the middle and upper parts of the section and defining a coarsening-upward sequence. Additionally, near the base, two layers of fine yellowish sands (<20 cm thick) with gravels and highly erosive surfaces have been identified, containing abundant bioclastic remains, echinoderm spines, siliceous sponge spicules, plant debris and large fragments of Late Miocene calcarenites eroded from surrounding outcrops. The foraminiferal specimens in these layers are relatively scarce, although they exhibit a similar assemblage characterized also by the occurrence of numerous individuals of Cibicides spp. Their tests are commonly broken and/or abraded, which strongly suggests the simultaneous presence of allochthonous marine taxa together with autochthonous groups, providing robust evidence of a high-energy marine inundation of the coastal lagoon.

This stratigraphic succession records the progressive and increasingly frequent arrival of sheet floods into a coastal lagoon from alluvial fans which are likely located at the inland reliefs. The lagoon was connected to the sea and intermittently isolated from the marine basin by a littoral barrier that has not been preserved in the outcrops. During its early stages of evolution at least two high-energy episodes are recorded, in which marine flooding transported sediments from the shallow marine zone, littoral barrier and nearby cliffs into this area. In MIS 3 deposits, that are exceptionally exposed in the Southern Atacama, these findings extend the chronology of major earthquakes and tsunamis and underscore the value of foraminiferal as proxies for coastal dynamics, salinity variability, and high‑energy marine events in the recent Quaternary geological record.

The authors thank project PID2021-127268NB-I00 funded by MCIN/AEI /10.13039/501100011033 and by FEDER/UE

How to cite: Frías Álvarez, M., Abad, M., Fernández, R., Ruiz, F., and Izquierdo, T.: Micropaleontological insights into Late Pleistocene coastal lagoon and tsunami deposits at Copiapó mouth river (Southern Atacama Desert), EGU General Assembly 2026, Vienna, Austria, 3–8 May 2026, EGU26-18846, https://doi.org/10.5194/egusphere-egu26-18846, 2026.

EGU26-19472 | ECS | Posters on site | SSP4.5

Unlocking UK Chalk macrofossil collections using calcareous nannofossil biostratigraphy: Insights into Late Cretaceous ecosystem change, resilience, and extinction 

Deborah Tangunan, James D. Witts, Liam Gallagher, Stephen Stukins, Emma Bernard, Katie Collins, Leila D'Souza, Mike Day, Timothy Ewin, Richie Howard, Zoë Hughes, Marc Jones, Giles Miller, Jonathan A. Todd, Andrew S. Gale, Charlie Underwood, Richard J. Twitchett, and Paul R. Bown

The Upper Cretaceous Chalk Group of the United Kingdom (UK) preserves one of the most complete and fossiliferous records of greenhouse marine conditions, spanning the Cenomanian–Maastrichtian (~100–72 million years ago). While the Chalk has been intensively studied, a large proportion of its macrofossil record remains under-utilised because specimens collected over the past two centuries commonly lack precise stratigraphic or chronological attribution. Previous studies have demonstrated that nannofossil biostratigraphy of the chalk matrix attached to such specimens provides an effective means of unlocking the ‘dark data’ preserved in historic museum collections. Here we update and expand on those pilot studies by applying the biostratigraphic framework developed within the Chalk Sea Ecosystems (ChaSE) project to a wide range of macrofossil groups to investigate temporal and regional patterns in ecosystem change.  

We apply calcareous nannofossil biostratigraphy to re-date >1,500 macrofossil specimens housed at the Natural History Museum, London (NHMUK), many of which are from now-inaccessible localities and are labelled only with broad lithostratigraphic or geographic information. Small, non-destructive samples taken from the chalk matrix associated with individual macrofossils yield diverse nannofossil assemblages, with preservation ranging from poor to moderate. Despite the variability in preservation, key marker species and bioevents were identified, allowing for confident placement within UK Chalk litho- and biostratigraphic schemes. The reliability matrix being developed will strengthen these results by evaluating a range of criteria (e.g. taxonomic clarity, morphological specificity, geographical and temporal distribution, rarity, preservation quality; Tangunan et al., 2024). This approach aims to provide robust age constraints at sub-stage to zonal resolution, substantially improving the stratigraphic utility of specimens previously unsuitable for quantitative analysis.

To complement the museum-based work, targeted field sampling was conducted at key Chalk localities across England, including Yorkshire, Devon, Dorset, Folkestone, and Eastbourne. These sites span northern, central, and southern Chalk provinces and capture spatial variability across the Cretaceous Chalk Sea. Field-derived calcareous nannofossil datasets will be integrated with the re-dated museum material to refine correlations and to investigate temporal and regional patterns in extinction timing and ecosystem change.

The resulting framework will enable both nannofossil and macrofossil occurrences to be analysed within a consistent temporal context across major Cretaceous climatic and oceanographic perturbations, including the Mid-Cenomanian Event and Oceanic Anoxic Event 2, as well as the transition from peak Turonian warmth into Late Cretaceous cooling. By transforming historic museum collections into stratigraphically resolved datasets, the ChaSE project demonstrates the critical role of calcareous nannofossil biostratigraphy in maximising the scientific value of museum archives and provides a foundation for whole-ecosystem reconstructions of Chalk Sea resilience under extreme greenhouse climates.


Reference

Tangunan, D., Bown, P., Hampton, M., Fogerty, T., Gale, A., Twitchett, R., Underwood, C., Witts, J. and Gallagher, L., 2024. Multivariate evaluation rubric for assessing the reliability of Cretaceous nannofossil index taxa and bioevents. Journal of Nannoplankton Research, 42(S), pp.119-119.

How to cite: Tangunan, D., Witts, J. D., Gallagher, L., Stukins, S., Bernard, E., Collins, K., D'Souza, L., Day, M., Ewin, T., Howard, R., Hughes, Z., Jones, M., Miller, G., Todd, J. A., Gale, A. S., Underwood, C., Twitchett, R. J., and Bown, P. R.: Unlocking UK Chalk macrofossil collections using calcareous nannofossil biostratigraphy: Insights into Late Cretaceous ecosystem change, resilience, and extinction, EGU General Assembly 2026, Vienna, Austria, 3–8 May 2026, EGU26-19472, https://doi.org/10.5194/egusphere-egu26-19472, 2026.

EGU26-20075 | ECS | Orals | SSP4.5

A characterisation of biological rhythms in behaviour and holobiont-wide gene expression in the foraminifer Heterostegina depressa from laboratory culture 

Adrian Schoerghofer, Audrey Mat, Matthias Nagy, Paul Wulf, Federico Scaramuzza, and Kristin Tessmar-Raible

Algal symbiosis facilitates the success of Large Benthic Foraminifera (LBF) as major carbonate producers in the ocean. Throughout the evolution of these associations, microalgae and their foraminiferal hosts are exposed to periodic changes in external conditions (e.g. tidal and daily cycles), driven by astronomical cycles such as Earth’s rotation and orbital motions. Many other unicellular and multicellular organisms have evolved biological rhythms, with period lengths similar to those of environmental cycles, as adaptations to these periodic changes. These rhythms can either be exogenously driven as responses to environmental cycles or can emerge from endogenous molecular pacemakers. It has been shown that organisms with internal periods closely aligned with the environmental cycles gain significant advantages. However, climatic changes can lead to disruptions and desynchronization of biological rhythms with adverse effects on the fitness of organisms and ecosystem functions, making the characterisation of biological rhythms an important subject in LBF ecology. While biological rhythms in microalgal model systems, such as diatoms (e.g., Phaeodactylum tricornutum) and dinoflagellates (e.g., Symbiodiniaceae), have gained increasing attention, little is known about the persistence of rhythmic processes in associations with LBF. These foraminifers exhibit reticulopodial locomotion and photoprotective behaviour in response to diurnal changes in irradiance, which are widely regarded to be governed by their microalgal symbionts.

In this experimental study, we characterise the behavioural and holobiont-wide molecular rhythms of the diatom-bearing calcareous LBF Heterostegina depressa. Cultured cells were maintained under light-dark conditions (14:10, LD), at a constant temperature of 25°C. For the behavioural characterisation, locomotor activity was quantified using time-lapse imaging. Behavioural recordings with lengths ranging from 3 to 7 days were conducted to assess rhythmicity and determine dominant period lengths. Transcriptomic dynamics were assessed through bulk RNA sequencing, de novo transcriptome assembly, and subsequent differential gene expression analysis. Cells for the differential gene expression analysis were sampled every 4 hours over a 48-hour period. Rhythm analysis of the activity patterns derived from behavioural recordings revealed substantial inter-individual variability, with some individuals exhibiting recurring spikes in activity with a period length of 24 hours. Additionally, we identified a set of significantly rhythmic transcripts, cycling with a period length of 24 hours.

Our findings suggest that timepoints of observations in studies of LBF ecology need to account for temporal changes across a 24-hour period, even under constant temperature conditions. Beyond these findings, we present insights from locomotion behaviour and gene expression under constant dim light (LL) conditions, highlight enriched pathways, and discuss potential endogenously driven rhythms in transcript expression.

How to cite: Schoerghofer, A., Mat, A., Nagy, M., Wulf, P., Scaramuzza, F., and Tessmar-Raible, K.: A characterisation of biological rhythms in behaviour and holobiont-wide gene expression in the foraminifer Heterostegina depressa from laboratory culture, EGU General Assembly 2026, Vienna, Austria, 3–8 May 2026, EGU26-20075, https://doi.org/10.5194/egusphere-egu26-20075, 2026.

EGU26-20159 | ECS | Orals | SSP4.5

High-resolution reconstruction of Peruvian OMZ bottom-water oxygen since the last deglaciation using automated benthic foraminifera identification 

Sikandar Hayat, Meryem Mojtahid, Jorge Cardich, Mary Elliot, Thibault de Garidel-Thoron, Matthieu Carré, Dimitri Gutiérrez, Renato Salvatteci, Christine Barras, and Emmanuelle Geslin

The Peruvian upwelling system (PUS) sits within the intense, shallow oxygen minimum zone (OMZ) of the eastern tropical South Pacific and is strongly influenced by the El Niño Southern Oscillation (ENSO). El Niño suppresses the upwelling off Peru by weakening the trade winds and allowing warm surface waters to shift eastward, which deepens the thermocline. In contrast, La Niña generally strengthens the trade winds, shoals the thermocline, and enhances upwelling. This study reconstructs Peruvian upwelling variability by using fossil benthic foraminifera assemblages to infer past fluctuations in bottom-water oxygen and productivity. We analysed 168 samples from two sediment cores collected offshore Peru from the center of current OMZ; G10 (14.23° S, 76.40° W; 312 m water depth) and G14 (14.38° S, 76.42° W; 390 m water depth) spanning the last 25,000 years, with average resolution of 113 years. Detecting subtle faunal changes typically requires counting at least 300 specimens per sample, and the identification accuracy and speed depends on the experience of the taxonomist. We trained a CNN to identify and count benthic foraminifera, achieving 92.0% classification accuracy, 93.4% precision, and 92.4% recall. Automated results closely matched manual counts across 31 samples (from both cores at multiple depths), including species abundances, diversity metrics, multivariate assemblage patterns, and bottom-water oxygen estimates, demonstrating the model’s suitability for palaeoecological applications.

We next applied the CNN model to the remaining samples to reconstruct downcore changes in assemblage composition and bottom water oxygenation using the extended Benthic Foraminifera Assemblage index (BFAex). Low- diversity, and high-density assemblages dominated by thin, elongated tests persisted throughout much of the record, consistent with typical OMZ communities. Bolivina humilis was the dominant species across most of the record, whereas Fursenkoina spp. dominated in several intervals in the Heinrich Stadial 1 (H1S), coinciding with high denitrification and a modest increase in organic-matter input. Additionally, Suggrunda porosaB. costataB. plicata, Epistominella obesa, and Cassidulina limbata were among the major species. Reconstructed bottom-water oxygen was generally below 0.1 mL/L, however, H1S exhibits several peaks, some exceeding 1 mL/L. Moreover, H1S also shows the largest oxygen variability, potentially reflecting a stronger transmission of ENSO-related perturbations to the seafloor when sea level was 100 m lower than today. During the early and late Holocene, oxygen levels remained at or below the modern value (0.1 mL/L), implying a persistently developed OMZ. Several stratigraphic intervals, including early Glacial, the last Glacial Maximum, middle Holocene, Bølling-Allerød (BA), and many samples from late Holocene show a complete absence of benthic foraminifera. CT scans of two 10 cm-long sections (from BA and late Holocene) reveal “ghost” foraminifera outlines and the presence of gypsum crystals. These observations suggest post-depositional removal of carbonate tests, either during core storage or via early diagenetic dissolution. This latter interpretation is more likely and supported by the coincidence of barren intervals with low enrichment of redox-sensitive metals, reduced denitrification, and low sedimentation rates, conditions generally associated with more oxygenated periods on the Peruvian margin.

How to cite: Hayat, S., Mojtahid, M., Cardich, J., Elliot, M., Garidel-Thoron, T. D., Carré, M., Gutiérrez, D., Salvatteci, R., Barras, C., and Geslin, E.: High-resolution reconstruction of Peruvian OMZ bottom-water oxygen since the last deglaciation using automated benthic foraminifera identification, EGU General Assembly 2026, Vienna, Austria, 3–8 May 2026, EGU26-20159, https://doi.org/10.5194/egusphere-egu26-20159, 2026.

Larger benthic foraminifera (LBF) are key carbonate producers and nutrient recyclers in shallow tropical–subtropical seas, with much of their ecological success attributed to photosymbiosis with diverse microalgae. Beyond these well-studied living associations, foraminiferal tests also host post-mortem microbial colonizers that can drive early diagenetic alteration. Endolithic cyanobacteria are among the most effective carbonate microborers, yet their diversity and trace-forming styles in LBF tests remain poorly documented, limiting interpretation of micritization pathways and preservation bias in both modern and fossil foraminifera tests.

Here we present a preliminary, morphotype-based classification of endolithic cyanobacteria associated with five common LBF taxa collected from Aziziyah Corniche (near the King Fahd Causeway), Eastern Saudi Arabia (Arabian Gulf): Coscinospira hemprichii, Peneroplis planatus, P. pertusus, P. arietinus, and Sorites orbiculus. Specimens were hand-picked from a scoop of marine beach sediment, selecting tests that showed visible evidence of cyanobacterial infestation/bioerosion; therefore, the dataset is intended to characterize endolithic forms rather than quantify infestation frequency. We examined >40 tests using an embedding–casting approach (Logitech type 301 two part epoxy resin infiltration of microborings in vacuum,  carbonate dissolution with dilute HCl to recover casts) combined with incident-light stereo microscopy and SEM. Endolithic forms were categorized by diagnostic boring architecture (e.g., filament diameter, branching frequency, chamber-wall penetration style, and distribution across whorls/chambers), with taxonomic assignment based on cast morphology where possible.

Across hosts, endolithic assemblages were dominated by Hyella (including an H. imanis-like morphotype; ~90% of observations), with Hyella forms consistently abundant in all five host taxa. At least three additional endolithic cyanobacterial morphotypes were observed but could only be assigned to genus-level. Boring patterns indicate active colonization of test walls that plausibly facilitates structural weakening and subsequent micritization during early taphonomy.

This morphotype inventory offers a practical reference for recognizing cyanobacterial microborings in LBF tests and for comparing bioerosion and micritization signatures among host taxa. The observed boring patterns further suggest that endolithic cyanobacteria can contribute to post-mortem test alteration, including micritization pathways that influence preservation in the fossil record.

How to cite: Amao, A. and Korin, A.: Endolithic cyanobacteria in larger benthic foraminifera: a morphotype-based classification framework for interpreting bioerosion and micritization, EGU General Assembly 2026, Vienna, Austria, 3–8 May 2026, EGU26-22087, https://doi.org/10.5194/egusphere-egu26-22087, 2026.

EGU26-23290 | Orals | SSP4.5 | Jean Baptiste Lamarck Medal Lecture

 The green poles of a warmer past: how Antarctic polar forests shaped plant evolution  

Benjamin Bomfleur

Today, Antarctica appears as a continent locked in eternal ice and snow, but its sedimentary record preserves rich fossil archives of past life. Because present-day Antarctic landmasses have already been circling in polar latitudes for more than 300 million years, many Antarctic fossil occurrences derive from past high-latitude palaeoecosystems without modern analogue. Of special importance are exceptional plant-fossil assemblages—some classic, some only recently discovered—from the early Mesozoic of the Transantarctic Mountains. These yield exquisitely preserved plant compressions and anatomically preserved biotas in silicified peat and wood, allowing detailed insights into the biology and ecology of past polar forests during times of global warmth. The Late Triassic vegetation of Gondwana is particularly well-known. It was dominated by Dicroidium seed-ferns, conifers, ginkgoes, cycads, and diverse fern communities, and documents sophisticated adaptations to extreme seasonal light regimes, including widespread deciduousness, growth dormancy, and specialized understorey life strategies. There is now increasing evidence that such high-latitude ecosystems acted as evolutionary refugia during major biotic crises. The iconic Triassic Dicroidium plants, for example, survived the end-Triassic mass extinction in Gondwanan high-latitude populations and persisted there long into the Jurassic, far beyond their time of disappearance at lower latitudes. Recent discoveries from previously unexplored regions of northern Victoria Land substantially expand this perspective, revealing unexpected growth strategies, complex ecological interactions, and evidence for extreme evolutionary stasis. Taken together, the fascinating fossil record of the Transantarctic Mountains highlights the varied roles of high-latitude palaeoecosystems in plant evolution during times of global change.

How to cite: Bomfleur, B.:  The green poles of a warmer past: how Antarctic polar forests shaped plant evolution , EGU General Assembly 2026, Vienna, Austria, 3–8 May 2026, EGU26-23290, https://doi.org/10.5194/egusphere-egu26-23290, 2026.

BG6 – Geomicrobiomes and their function

EGU26-3355 | ECS | Posters on site | SSS4.4

A Global Meta-analysis on the Impact of Human Activities on Soil Microbial Diversity and Carbon Cycling 

Jose Mathew, Shamik Roy, and Sumanta Bagchi

Changes to the structure or functioning of the soil microbial community could alter the way it metabolises aboveground organic inputs, with significant potential implications for plant nutrient availability, the carbon cycle, and other aspects of soil health. Human activities have been shown to alter microbial diversity and activity in various study sites. However, different ecosystems respond differently to the same disturbance, so we need to identify the globally common patterns.

We perform a meta-analysis of the effects of five human activities – land use change, ecosystem restoration, pollution, pesticide use and fertiliser addition – on microbial diversity (measured as Shannon index of the catabolic diversity) and activity (measured as soil basal respiration). From an initial 693 records from Web of Science, we short-list 177 studies covering 924 datapoints across all six inhabited continents. For each of the five human activities, we identify treatment-control pairs from this dataset, and calculate their log response ratios (‘lRR’, the logarithm of the ratio of the treatment diversity or activity to the control value). From these lRRs, we calculate an overall effect size and confidence interval under a robust variance estimation meta-regression model. We also check for publication bias and any changes in reported effect size over time.

Our dataset did not significantly differ from a random sampling of land points on the earth along various climatic and edaphic axes. Median catabolic diversity in our dataset was 2.57 (with 95% of readings in the range 0.90 - 4.43) and median respiration activity was 1.63 μg CO2 g−1 h−1 (with 95% of readings between 0.12 and 150). Among human activities, fertiliser addition and ecosystem restoration increased diversity (by +12.9% and +8.4% respectively) and activity (+38.9% and +73.5%), while land use change reduced diversity (by 1.5%) and activity (by 21.0%). The effects of pollution and pesticide use were not statistically significant. We found no significant effect of publication bias, and no consistent trends in reported effect size over time.

Greater diversity generally improves ecosystem efficiency, so we expected an increase in diversity to lead to greater carbon assimilation by microbes and a decrease in respiration activity. However, we found human activities to cause changes in the same direction for both diversity and activity. Also, the increase in respiration activity in response to ecosystem restoration is almost three times the reduction in activity due to land use change, even after accounting for the different baselines. This suggests that restored ecosystems might use carbon less efficiently compared to intact ones.

Our results show that land use intensity has a negative impact on soil microbial diversity and activity, whereas nutrient addition has a positive effect. Soil microbes mediate how much carbon and other nutrients remain in soil and how much is lost to the atmosphere or other pools. Therefore, learning how humans alter their community structure and functioning will help in better understanding current global problems like soil nutrient deficiencies and climate change.

How to cite: Mathew, J., Roy, S., and Bagchi, S.: A Global Meta-analysis on the Impact of Human Activities on Soil Microbial Diversity and Carbon Cycling, EGU General Assembly 2026, Vienna, Austria, 3–8 May 2026, EGU26-3355, https://doi.org/10.5194/egusphere-egu26-3355, 2026.

The soil eco-enzymatic stoichiometry approach has been widely used in terrestrial ecosystems for decades to assess microbial carbon (C), nitrogen (N), and phosphorus (P) limitation based on the ratios of five arbitrary-selected enzyme activities. As numerous enzymes are involved in soil C, N, and P cycling, it remains uncertain whether the stoichiometric approach will be valid if it is based on different set of eco-enzymes.

To address this issue, soils were collected from six long-term field experiments (12–123 years in duration) at Bad Lauchstädt, central Germany. These experiments encompass a wide range of soil organic matter contents (1.4–6.9%) and include contrasting field treatments such as fertilization regimes, land-use intensity, and fallow periods. In addition to the five basic enzymes (β-glucosidase, cellobiohydrolase, N-acetyl-glucoseaminidase, leucine aminopeptidase, and acid phosphatase), lipase activity was measured and incorporated into the stoichiometric analysis.

The additional C-cycling enzyme (lipase) increased vector length by 12–90% across all experiments and treatments, in numerous cases increasing a threshold value 0.6 and indicating microbial C limitation, which was not evident by basic set of enzymes. Vector angles showed variable responses to lipase addition. For example, vector angles increased by 13–41% under natural succession and excessive manure application, suggesting reduced N limitation, whereas no effect of lipase addition was observed on vector angles under poor soil conditions (no fertilization and 36 years fallow). However, soil microbial biomass C:N ratios ranged from 20 to 45 under poor soil conditions, indicating strong microbial N limitation, which contradicts the stoichiometry results.

Overall, our findings highlight the considerable uncertainty and potential biases of the enzyme stoichiometry approach and emphasize the need to identify more reliable ecological indicators of microbial nutrient limitation.

How to cite: Wang, S. and Blagodatskaya, E.: Validity of eco-enzymatic stoichiometry to reveal microbial C and nutrients limitation: Evidence from six long-term field experiments, EGU General Assembly 2026, Vienna, Austria, 3–8 May 2026, EGU26-5884, https://doi.org/10.5194/egusphere-egu26-5884, 2026.

Rapid urbanization has substantially changed the soil environment, causing changes in the composition and distribution of soil pathogens. However, critical knowledge gaps persist regarding soil human pathogens in urban regions which are characterized by intensive human-environment interactions. This issue has become urgent amid growing public attention on environmental health and public health events. Utilizing field monitoring, high-throughput sequencing, and geospatial analysis, this study provides the first systematic assessment of human-associated soil pathogens distribution across a typical urban agglomeration in north China. There were 16 major human-pathogenic species identified in soils, with Stenotrophomonas predominating (detected in 57.00% of samples). Significant differences were observed in both abundance and species of soil human pathogens as well as network structure from urban to rural areas, and peri-urban areas can be identified as contamination hotspots. Results of showed that socioeconomic factors accounted for 34.5% of soil human pathogens distribution variability, particularly facility agriculture distribution and cropland fragmentation. Furthermore, we developed an innovation risk assessment framework with considering 12 indicators encompassing abundance and species number of soil human pathogens, network structure, and human exposure parameters to quantify urban-rural exposure risks of human pathogens. The evaluated results demonstrated elevated risks in peri-urban areas, with children being more susceptible than adults to threats posed by soil human pathogens in urban areas. This study provides an innovative approach for quantifying risk of soil human pathogens and scientific guidance for preventing soil human pathogens contamination and enhancing soil health in rapid urbanization areas.

How to cite: Li, M.: Soil human pathogens in rapid urbanization areas: occurrence, distribution, and potential risk, EGU General Assembly 2026, Vienna, Austria, 3–8 May 2026, EGU26-6026, https://doi.org/10.5194/egusphere-egu26-6026, 2026.

EGU26-6480 | ECS | Posters on site | SSS4.4

Active microbiome succession in the rhizosphere of growing plants 

He Zhang, Qicheng Xu, Yang Ruan, Qiwei Huang, Shiwei Guo, Yakov Kuzyakov, Qirong Shen, and Ning Ling

Plant root exudates dynamically shape rhizosphere microbiomes, yet how they drive the succession of active microbial communities across development remains unclear.  Through a novel integration of quantitative stable isotope probing (qSIP), metagenomics and metabolomics, we established a direct link between dynamic root exudate profiles and the succession of active rhizosphere microbiota in watermelon rhizosphere. The results showed that microbial activity in the rhizosphere increased progressively from the seedling to the flowering stage. The microbial codon usage bias increased, with genomes becoming progressively streamlined, suggesting rhizosphere selection toward a microbial community with enhanced growth potential but lower functional redundancy. From seedling to flowering, the metabolic network of rhizosphere microbes utilising root exudates became simpler. Dominant active taxa provided persistent core functions for the plant (e.g., root development and pathogen suppression), and specifically produced siderophores during flowering, thus stabilising rhizosphere ecosystem functioning. Overall, these results reveal how plants orchestrate microbial succession through exudate chemistry, optimising rhizosphere function across development.

How to cite: Zhang, H., Xu, Q., Ruan, Y., Huang, Q., Guo, S., Kuzyakov, Y., Shen, Q., and Ling, N.: Active microbiome succession in the rhizosphere of growing plants, EGU General Assembly 2026, Vienna, Austria, 3–8 May 2026, EGU26-6480, https://doi.org/10.5194/egusphere-egu26-6480, 2026.

EGU26-6628 | ECS | Posters on site | SSS4.4

Microbial lifestyles adapted to distinct soil fertility  

Ling Li, Chao Xue, Yue Wang, Mingtao Liu, Junjie Guo, Manqiang Liu, and Ning Ling

Microbial life-history strategies determine how microbial communities prioritize resource allocation toward growth, resource acquisition, or stress tolerance. However, how soil microbial communities adjust their life-history strategies in response to distinct soil fertility remains poorly understood. In this study, metatranscriptomic sequencing was performed to investigate shifts in microbial life-history strategies in soils with different fertility, developed by 37 year diverse fertilization regimes: no fertilization, mineral fertilization, manure fertilization, and combined mineral/manure fertilization. Organic amendments increased the transcript abundance of genes (normalized by transcripts per million [TPM]) related to biogeochemical cycles by 13 %–246 % relative to unfertilized soils. We quantified the relative transcript abundance of each functional pathway within individual biogeochemical cycles to compare transcriptional allocation across treatments. Within each cycle, organic amendments increased the relative transcript abundance of genes involved in organic matter degradation by 9 %–12 % and dissimilatory nitrate reduction by 24 %–37 % relative to unfertilized soils. Although TPM-normalized transcript abundance of growth-associated genes increased 1.8- to 2.2-fold in fertilized soils, their relative abundance among all life-history transcripts remained stable at approximately 77 %. Organic inputs altered microbial resource allocation by favoring resource acquisition over stress tolerance. This shift was associated with increased nutrient availability and soil pH neutralization. Taxonomic analysis revealed growth yield as the dominant strategy across most phyla. Within each strategy, Desulfobacterota showed a strong association with growth yield, Verrucomicrobiota with resource acquisition, and Pseudomonadota and Actinomycetota with stress tolerance. Notably, while strategy preferences were broadly conserved across phyla, fertilization modulated the intensity of strategy-specific gene expression, indicating functional plasticity of microbial communities in response to environmental change. Collectively, our findings suggest that differences in soil fertility resulting from long-term fertilization alter microbial resource allocation among life-history strategies by changing the functional expression of transcripts assigned to different taxa, reflecting the functional plasticity of soil microbial communities under intensified agriculture.

How to cite: Li, L., Xue, C., Wang, Y., Liu, M., Guo, J., Liu, M., and Ling, N.: Microbial lifestyles adapted to distinct soil fertility , EGU General Assembly 2026, Vienna, Austria, 3–8 May 2026, EGU26-6628, https://doi.org/10.5194/egusphere-egu26-6628, 2026.

EGU26-9634 | ECS | Orals | SSS4.4

Degree of soil disturbance affects success of microbiome restoration by artificial humic substances: a plant health perspective 

Morten Streblow, Samuel Bickel, Anja Lamprecht, Wisnu Adi Wicaksono, Svitlana Filoneko, Markus Antonietti, and Gabriele Berg

Soils are crucial for biogeochemical elemental cycles and, on a more anthropocentric note, for agriculture. The ongoing degradation of agricultural soils, including horticultural substrates, has large scale implications for crops, humans and the surrounding ecosystems (OneHealth). One critical aspect of soil degradation is the subsequent loss of functional microbial diversity, which is essential for soil and plant health. Thus, the maintenance and manipulation of those microbial players is a key interest of sustainable farming and the European Union (The Mission 'A Soil Deal for Europe'; SPIN-FERT: Grant agreement ID: 101157265, DOI: https://doi.org/10.3030/101157265).

To understand the role of artificial humic substances on plant health, plant performance and soil microbiomes we grew tomato seedlings along a soil disturbance gradient. Each substrate was treated with artificial humic substance and/or Rhizoctonia solani AG-4, a fungal soilborne plant pathogen, to infer potential mechanisms of plant growth enhancement and disease resistance. We hypothesize that humic substances increase soil microbial diversity and disease resistance of tomato seedlings.

Plant height and microbial diversity were observed to be highest in undisturbed soil and were further increased by the addition of humic substance and decreased by the presence of R. solani. Disease incidence was noticeably lower under humic substance amendment except for the most disturbed soil. Both treatments caused the microbial communities of the soil and rhizosphere to shift, with β-diversity clustering the most complete and distinct after the disturbance recovery and revealing several plant and soil health associated taxa to be enriched through humic substance addition.

By altering the soil microbiome composition, the plant is offered a wider selection of microorganisms to recruit from while the fungal pathogen is met with a more diverse battery of potential antagonists. Our findings may contribute to more effective manipulation of the microbial aspects of agriculture to promote and improve healthy produce.

How to cite: Streblow, M., Bickel, S., Lamprecht, A., Wicaksono, W. A., Filoneko, S., Antonietti, M., and Berg, G.: Degree of soil disturbance affects success of microbiome restoration by artificial humic substances: a plant health perspective, EGU General Assembly 2026, Vienna, Austria, 3–8 May 2026, EGU26-9634, https://doi.org/10.5194/egusphere-egu26-9634, 2026.

Soil health is essential for crop production and plays a crucial role in agricultural sustainability by supporting vital ecosystem and societal services. The manipulation of beneficial microbes is an emerging strategy for improving soil quality in agroecosystems. However, little is known about whether microbes enriched through organic fertilization can promote plant growth and soil health. This study employed amplicon sequencing and shotgun metagenomics to characterize the fertilizer-induced shifts in soil microbial communities and metabolism-related genes, and their correlations with soil health index. Core organic fertilizer-induced microbial taxa were then isolated and their growth-promoting and soil health-improving effects were experimentally verified. Our results demonstrated that the continuous application of organic fertilizer with higher nitrogen input enhanced soil health index by 119%. Random forest analyses revealed that the abundances of functional genes involved in nitrogen assimilation, especially nasB, gdh, and nirA were important predictors of soil health index. More importantly, functional genes involved in nitrogen cycling explained more variance (63.78%) in soil health index than phosphorus (38.73%) and carbon (32.33%) cycling. Furthermore, inoculation with synthetic communities (SynCom) derived from organic fertilization, which consisted of five Pseudomonas spp. and one Microbacterium sp., enhanced the soil health index by 36.1% compared to the non-inoculated control and significantly improved plant growth, including height, shoot dry weight, and root dry weight. These findings show that organic fertilization-induced core species enhance soil health and plant performance, laying the foundation for leveraging the beneficial microbes for sustainable agricultural practices.

How to cite: Shu, D., Sun, X., and Wei, G.: Core soil microbiota mediated by long-term organic fertilization enhance soil health and plant productivity, EGU General Assembly 2026, Vienna, Austria, 3–8 May 2026, EGU26-10418, https://doi.org/10.5194/egusphere-egu26-10418, 2026.

EGU26-12384 | Orals | SSS4.4

Soil Health in Europe: Policy perspectives  

Diana Vieira, Panos Panagos, Nils Broothaerts, and Carmen Sánchez-García

In Europe soil health is facing emerging challenges that require innovative solutions and policy interventions. We acknowledge that 62% of the European Union (EU) soils are not in healthy condition, while we face serious challenges such as climate change, food security, biodiversity loss, and socio-economic pressures. The severity of these issues is evident in the fact that soil erosion is unsustainable for around ¼ of the EU territory, carbon stocks in soils are declining, nutrients are depleting, and emerging contaminants can pose a serious threat to soil and human health. The costs of soil degradation in the EU may reach up to €70 billion per year, highlighting the urgent need for action. 

To address these challenges, the EU has put in place many policies for agro-environmental protection since 2000, including soil protection. The European Green Deal, launched in 2020, has set an ambitious roadmap to make the EU the first carbon-neutral continent with a modern, competitive, and resource-efficient economy. As part of the Green Deal, the European Commission (EC) has put soil protection in a high position on the EU policy agenda, recognizing that healthy soils are essential to achieve climate neutrality, zero pollution, sustainable food provision, and a resilient environment. This increased focus on soil health has led to the development of new policies and initiatives, such as the Soil Monitoring and Resilience Directive, which aims to establish a common framework for monitoring and assessing soil health in the EU. 

The Soil Monitoring and Resilience Directive, in place since December 2025, lays down measures for monitoring and assessing soil health, managing soils sustainably, and restoring contaminated sites. Furthermore, the Mission Soil, which aims to set up 100 Living Labs to promote sustainable land and soil management in urban and rural areas, will play a crucial role in achieving the objective of healthy soils by 2050. With an estimated investment of nearly €800 million until 2028, funded research projects under the Mission Soil are expected to reverse soil degradation through action on the ground, underpinned by the development and monitoring of a set of indicators. 

In addition to these initiatives, the Carbon Removals and Carbon Farming (CRCF) regulation is the first EU volunteer framework for certifying carbon removals and carbon farming. This regulation will monitor, report, and verify carbon removals, soil emission reduction, and biodiversity benefits, providing a new opportunity for farmers and other stakeholders to contribute to climate change mitigation. The carbon farming framework can also serve as an interesting business model for additional income to farmers, while involving diverse actors such as certification bodies, auditors, tech industry, and creating new jobs. By promoting sustainable land use practices, the CRCF regulation can help sequester carbon, reduce greenhouse gas emissions, and improve soil health. 

This presentation will discuss these EU soil policies in detail, with a specific focus on the role and activities of the EU Soil Observatory (EUSO). Overall, the presentation will show how the EU soil policies and the EUSO are advancing the data, knowledge and tools on soils and leading the transition towards healthy soils in the EU. 

How to cite: Vieira, D., Panagos, P., Broothaerts, N., and Sánchez-García, C.: Soil Health in Europe: Policy perspectives , EGU General Assembly 2026, Vienna, Austria, 3–8 May 2026, EGU26-12384, https://doi.org/10.5194/egusphere-egu26-12384, 2026.

EGU26-12434 | Posters on site | SSS4.4

Co-creation of soil health solutions through digital marketing tools: enhancing stakeholder engagement in the MultiSoil project 

José A. González-Pérez, Félix González-Peñaloza, Daniel Cuella-Guerra, Olaya García-Ruíz, José Mª de la Rosa, and The MultiSoil Team

Soil degradation in agricultural systems is a major environmental and production challenge in European agriculture, requiring both technical innovations and participatory approaches that support real-world adoption and lasting impact (Bouma, 2014; Montanarella et al., 2016). The MultiSoil (Horizon Europe, Mission “A Soil Deal for Europe,” G.A. 101218951; https://www.multisoil.eu/) employs a multi-actor approach and a co-creation framework to develop, test, and demonstrate agricultural practices that enhance soil functional biodiversity and crop health (Leclère et al., 2023).

This contribution outlines the MultiSoil project's stakeholder engagement and co-creation strategy, highlighting the role of digital marketing tools in enhancing participation and interaction. Integrating face-to-face participatory activities—such as farmer-led workshops and round-table discussions—with targeted digital outreach can improve inclusiveness, accessibility, and continuity of engagement in sustainability-oriented research (Reed et al., 2018; Ingram et al., 2020).

We describe activities conducted by the Institute of Natural Resources and Agrobiology of Seville (IRNAS-CSIC) in Mediterranean agricultural systems, in which soil management practices, including organic amendments, biochar application, cover crops, and biodiversity-based management, are being implemented. These actions are supported by digital dissemination campaigns, tailored communication materials, perception surveys, and participatory dynamics shared through professional networks and sector-specific digital channels. This combined approach has increased both the number and diversity of participating stakeholders—particularly farmers—enhancing the representativeness of the co-creation process (Eitzinger et al., 2019).

Digital marketing tools are not used as one-way dissemination channels but as active co-creation instruments that support trust-building, mutual learning, and the emergence of communities of practice focused on soil health (Wenger-Trayner & Wenger-Trayner, 2020). The observed increase in stakeholder participation enhances the quality of social feedback, strengthens ownership of proposed practices, and improves the potential for scaling and replication.

Overall, this work demonstrates how integrating digital engagement tools can reinforce Living Lab and multi-actor approaches in soil science, helping bridge the gap between research and society and supporting the transition towards more resilient and sustainable agricultural systems (European Commission, 2021).

Acknowledgements
MultiSoil project (Multifunctional Soil Biodiversity: Unlocking Potential for Healthy Cropping Systems), EU Horizon Europe programme (GA No. 101218951). The local stakeholders involved in the co-creation activities are also acknowledged.

References
Bouma, J. (2014). J Plant Nutr Soil Sci. 177: 111–120.
Eitzinger, A., et al. (2019). Comput. Electron. Agric, 158: 109–121.
European Commission. (2021). EU Mission: A Soil Deal for Europe – Implementation Plan.
Ingram, J., et al. (2020). J. Rural Stud. 78: 65–77.
Leclère, M., et al. (2023). Agron. Sustain. Dev. 43: 13.
Montanarella, L., et al. (2016). The world’s soils are under threat. SOIL, 2: 79–82.
Reed, M. S., et al. (2018). A theory of participation: What makes stakeholder and public engagement in environmental management work? Restor. Ecol. 26: S7–S17.

How to cite: González-Pérez, J. A., González-Peñaloza, F., Cuella-Guerra, D., García-Ruíz, O., de la Rosa, J. M., and Team, T. M.: Co-creation of soil health solutions through digital marketing tools: enhancing stakeholder engagement in the MultiSoil project, EGU General Assembly 2026, Vienna, Austria, 3–8 May 2026, EGU26-12434, https://doi.org/10.5194/egusphere-egu26-12434, 2026.

EGU26-13105 | ECS | Posters on site | SSS4.4

How Drought Influences Forest Soil Organic Carbon 

Mehdi H. Afshar, David A. Robinson, Panos Panagos, and Nima Shokri

Soil organic carbon (SOC) plays a central role in regulating soil fertility, water retention, and quantifying risks of soil degradation (Afshar et al., 2025). While climate variability is increasingly recognized as a major pressure on SOC, large-scale assessments of drought impacts on forest soils remain limited. Recent studies emphasize that drought effects on SOC are highly context dependent, shaped by soil carbon status, climate regime, and interacting environmental controls, calling for flexible modeling frameworks that can capture nonlinear responses (Hassani et al., 2024; Shokri et al., 2025).

In this study, we analyze SOC change between 2009 and 2018 across European forest soils using generalized additive models (GAMs) applied to harmonized LUCAS topsoil observations. SOC change is modelled as a nonlinear function of initial SOC, drought characteristics derived from the Standardized Precipitation Evapotranspiration Index (SPEI), climate, and soil properties.

GAM results show that drought severity exerts a significant, nonlinear impact on SOC change (p < 0.001), strongly modulated by initial SOC and climatic parameters. On average, under severe drought conditions, SOC declines by ~32% relative to mild drought conditions. Overall, the results demonstrate that drought impacts on forest SOC are state-dependent and spatially heterogeneous, governed by the combined influence of drought severity, initial carbon stocks, and regional climate conditions.

References:

  • Afshar, M. H., Hassani, A., Aminzadeh, M., Borrelli, P., Panagos, P., Robinson, D. A., Or, D., & Shokri, N. (2025). Spatial and temporal assessment of soil degradation risk in Europe. Scientific reports, 15, 44636. https://doi.org/10.1038/s41598-025-33318-7
  • Hassani, A., Smith, P., & Shokri, N. (2024). Negative correlation between soil salinity and soil organic carbon variability. Proceedings of the National Academy of Sciences, 121(18), e2317332121. https://doi.org/10.1073/pnas.2317332121
  • Shokri, N., Robinson, D. A., Afshar, et al. (2025). Rethinking global soil degradation: Drivers, impacts, and solutions. Reviews of geophysics, 63(4), e2025RG000883. https://doi.org/10.1029/2025RG000883

How to cite: H. Afshar, M., Robinson, D. A., Panagos, P., and Shokri, N.: How Drought Influences Forest Soil Organic Carbon, EGU General Assembly 2026, Vienna, Austria, 3–8 May 2026, EGU26-13105, https://doi.org/10.5194/egusphere-egu26-13105, 2026.

EGU26-13697 | ECS | Orals | SSS4.4

Soil additives ameliorate crop´s phosphorus nutrition and the rhizosphere microbiome during drought  

Md Aktarul Islam, Christian Lorenzen, Hamed Kashi, Yijie Shi, Amit Sagervanshi, Karl-Hermann Mühling, Sandra Spielvogel, and Sebastian Loeppmann

Climate models predict that the frequency, magnitude, spatial extent and duration of extreme climate events such as drought will further increase throughout Europe in the 21st century. Drought not only affects water availability but also alters the rhizosphere microbiome and its functions, consequently hampering soil nutrient cycling and crop nutrition. One measure to circumvent drought conditions in soil, at least during short to intermediate dry periods, is the application of additives to enhance P availability by improving diffusion conditions in the rhizosphere. However, studies focusing on the effect of soil additives on crop nutrition and functional capabilities of the rhizosphere microbiome during drought are scarce. We conducted a rhizotron experiment planted with spring wheat and induced 11 days of drought to investigate the effect of novel soil additives such as pelleted biochar-lignocellulose hydrogels including activators and nutrient loadings versus pyrolyzed biochar on wheat´s phosphorus (P) nutrition. Besides analyses of macro- and micro-nutrients in root and shoot as well as wheat’s active gene transporters (PM ATPase, ALMT, MATE, PHT, PHO1, SWEET), we determined the co-localization of enzymatic properties (Vmax, Km), pH, and microbial functional gene abundance in rhizosphere hotspots.

The area of rhizosphere phosphomonoesterases hotspots reduced to 1% during drought without additives (non-drought condition 4%). Biochar-hydrogel pellets amended to soil shifted microbial community composition, increased their diversity, and enhanced functional gene abundances of the microbiome in rhizosphere hotspots under drought conditions. The P content in roots was up to 3-fold higher with pellets than without. Higher P mobilization was determined in soil amended with pellets rather than solely biochar or control which was in line with a doubling in abundance of phosphomonoesterase genes. Consequently, the addition of the pellets increased P availability in the rhizosphere, potentially based on improved diffusion processes. Wheat´s PHT1.6 transporter in the shoots, which are crucial for P uptake and remobilization, was 9-fold higher in pellet amended soil than in control. Moreover, there was a 3-fold increase in the abundance of the PHO1 transporter in roots, which facilitates P transport from roots to shoots. The root: shoot ratio was 3-fold lower when the pellets were added implying less investment in root development across the wheat growth period. Wheat´s active PM ATPase and SWEET gene expression in shoots was 2-fold higher with added pellets than in control during drought, highlighting the potential of H+-ATPase gene regulation in shoots as a strategy to increase the proton motive force and thus co-transport with phosphate.

The results suggest an ameliorated functional redundancy of the microbiome mitigating drought stress and improving soil health compared to single biochar application. Next the application of ecologically uncritical soil additives such as pelleted biodegradable lignocellulose hydrogels with pyrolyzed biochar to mitigate drought stress in crop production is going to be investigated in field trails.

How to cite: Islam, M. A., Lorenzen, C., Kashi, H., Shi, Y., Sagervanshi, A., Mühling, K.-H., Spielvogel, S., and Loeppmann, S.: Soil additives ameliorate crop´s phosphorus nutrition and the rhizosphere microbiome during drought , EGU General Assembly 2026, Vienna, Austria, 3–8 May 2026, EGU26-13697, https://doi.org/10.5194/egusphere-egu26-13697, 2026.

Soil salinization-alkalization severely undermines soil multifunctionality (SMF) by disrupting essential biogeochemical and ecological processes. Remediating saline-alkali soils is therefore critical for enhancing SMF, safeguarding food security, and improving carbon storage. Although previous studies have applied meta-analysis to evaluate soil remediation strategies, the design of location-specific agricultural practices for rehabilitating saline-alkali lands and optimizing their carbon sequestration potential remains underexplored, largely due to China’s pronounced spatial heterogeneity. To address these gaps, this study presents the first integration of nationwide meta-analysis with machine learning-driven spatial predictive modeling to assess the effects of different remediation measures (i.e., physical, chemical, and biological) on soil organic carbon (SOC) content and SMF in saline-alkali lands. We produced spatial maps of effect sizes for SMF and SOC and categorized them into four regions (i.e., northwestern, northeastern, northern, and coastal) based on distinct climatic and hydrological conditions. The results indicate that the topsoil SOC stock in China’s saline-alkali lands is estimated at 126.05 Tg, which could be increased by up to 30% under biological remediation measures. A strong positive relationship was observed between SOC and SMF, with SOC enhancement indirectly boosting crop productivity in saline-alkali soils. On a national scale, chemical remediation proved to be the optimal management strategy for simultaneously promoting SMF and SOC sequestration. Biological measures showed comparable benefits, particularly in the northwestern, northeastern, and coastal regions. However, future changes in temperature and precipitation are projected to undermine SMF improvements while accelerating SOC accumulation under remediation, potentially weakening the SOC–SMF linkage in saline-alkali soils. These insights are vital for guiding future efforts to ensure food security and mitigate climate change.

How to cite: Han, Z.: Location-optimized remediation measures for soil multifunctionality and carbon sequestration of saline-alkali land in China, EGU General Assembly 2026, Vienna, Austria, 3–8 May 2026, EGU26-16219, https://doi.org/10.5194/egusphere-egu26-16219, 2026.

EGU26-16629 | Posters on site | SSS4.4

Evaluation of Soil Chemical Characteristics by Agricultural Land Use Type in South Korea over the Recent Four Years 

Nam-joon Chough, Eunjin Lee, Myung-Sook Kim, Tae-Goo Lee, and Ha-il Jung

The Rural Development Administration (RDA) of South Korea periodically conducts the "Survey on the Status of Agricultural Resources and Environment" to conserve agricultural resources and improve the agro-environment. This program monitors changes in soil fertility, heavy metals, pesticide residues, and microbial communities, as well as agricultural water quality, input usage, and the public functions of agriculture. The results serve as fundamental data for establishing national agricultural policies. Among these factors, soil chemical properties are critical indicators linked to both crop productivity and environmental pollution. This study analyzes the results of soil chemical property surveys conducted over the past four years (2021–2024) and evaluates trends since 1999. From 2021 to 2024, annual topsoil (0–15 cm) samples were collected from uplands (1,760), orchards (1,470), paddy fields (2,110), and greenhouse cultivation sites (1,374). The samples were analyzed for pH (1:5), EC, organic matter (OM), available phosphate (Avail. P), exchangeable cations (K, Ca, Mg), and available silicate (for paddies). Analytical accuracy was strictly managed using reference materials provided by the National Institute of Agricultural Sciences (NAS). The results showed that the mean soil pH was 6.1 for paddies and 6.5 for uplands, while the mean OM content was 27 g kg⁻¹ for both land use types, maintaining levels within the optimal range. These values indicate an increasing trend compared to 1999, reflecting the positive effects of long-term government support programs for soil amendments (since 1957) and organic fertilizers (since 1999). Nutrient contents, including Avail. P, K, and Ca, showed a gradual increasing trend over time. Notably, greenhouse cultivation sites exhibited more severe nutrient accumulation compared to other land use types, largely due to the closed environment of rain-sheltered facilities preventing leaching. These findings suggest that national policies should encourage the use of appropriate fertilizer amounts on agricultural land. Furthermore, integrating these soil monitoring results with fertilizer input data would enable the identification of nutrient sources, facilitating more efficient and sustainable nutrient management strategies.

How to cite: Chough, N., Lee, E., Kim, M.-S., Lee, T.-G., and Jung, H.: Evaluation of Soil Chemical Characteristics by Agricultural Land Use Type in South Korea over the Recent Four Years, EGU General Assembly 2026, Vienna, Austria, 3–8 May 2026, EGU26-16629, https://doi.org/10.5194/egusphere-egu26-16629, 2026.

EGU26-17619 | ECS | Posters on site | SSS4.4

Global patterns of microbial metabolic regulation under conservation tillage and implications for soil carbon cycling 

Yawen Huang, Mengyu Huo, Zhaoqiang Han, Jinyang Wang, Shuwei Liu, and Jianwen Zou

Conservation tillage is a pivotal agricultural strategy for climate change mitigation, primarily credited for enhancing soil organic carbon (SOC) sequestration. However, a comprehensive understanding of its effects on the underlying biological drivers, i.e., the soil microbial community and its metabolic functions, remains fragmented at the global scale. We synthesized global evidence on the effects of conservation tillage on soil microbial community structure, enzyme activities, and metabolic indicators (CUE, Q10, qCO₂, MQ, and CUE). Conservation tillage significantly increases microbial biomass and activities of carbon-, nitrogen-, and phosphorus-acquiring enzymes. Across studies, microbial CUE and MQ increase while qCO₂ decreases, indicating enhanced microbial growth efficiency and reduced carbon loss through respiration. Conservation tillage also moderates the temperature sensitivity of soil respiration, suggesting improved stability of soil carbon under climate warming. These effects are context-dependent and regulated by climate, soil properties, and management duration. Our synthesis demonstrates that conservation tillage promotes a microbial metabolic strategy favoring soil carbon retention and provides a mechanistic basis for evaluating management-induced changes in soil carbon sequestration potential.

How to cite: Huang, Y., Huo, M., Han, Z., Wang, J., Liu, S., and Zou, J.: Global patterns of microbial metabolic regulation under conservation tillage and implications for soil carbon cycling, EGU General Assembly 2026, Vienna, Austria, 3–8 May 2026, EGU26-17619, https://doi.org/10.5194/egusphere-egu26-17619, 2026.

EGU26-18328 | Posters on site | SSS4.4

Climate-driven soil dynamics over 30 years: insights from biological indicators across mediterranean shrubland recovery following agricultural abandonment 

Romina Lorenzetti, Anita Maienza, Gherardo Biancofiore, Filippo Gallese, Francesco Sabatini, Luciano Massetti, Giancarlo Renella, and Francesco Primo Vaccari

Soil biota plays a key role in pedogenesis, influencing nutrient cycling, organic matter transformation, and soil structure, while its composition depends on edaphic properties and pedological origin. In Mediterranean ecosystems, semi-arid conditions and historical land use have altered soil and vegetation dynamics, making natural recovery after land abandonment slow and uncertain. We assessed soil quality more than three decades after agricultural and pastoral abandonment on Pianosa Island a very representative territory of Mediterranean environment, characterized to be a limestone plateau of about 10km2, approximately 20-25 m above sea level. The island has been a penal agricultural colony for more than one century, intensively exploiting almost the entire surface. The agricultural fields  have been abandoned at the beginning of the 90's and the natural vegetation is now expanding, with different degree along the island. For its peculiar history and nature, Pianosa represents an extrapordinary on-field natural laboratory. An integrated approach was used to assess soil quality, combining vegetation surveys and chemical, physical, and biological soil analyses. Five environmental groups were identified, reflecting different regeneration stages: ex-managed areas with low Mediterranean shrub recovery degree, consistent with a higher contribution of pioneer and sub-mature shrub species; ex-managed areas with high Mediterranean shrub recovery,  with  a greater presence of mature shrub species and a more developed shrub structure; Mediterranean shrublands; coniferous forests; and coniferous forests largely colonized by Mediterranean shrubs. Results indicate that, even without human disturbance, recovery of soil biological attributes is extremely slow. Intrinsic soil properties and historical vegetation legacies strongly influence biotic reassembly and ecosystem functioning. These findings underscore the need to integrate pedological constraints and biological indicators in restoration strategies to sustain ecosystem services in Mediterranean landscapes.

How to cite: Lorenzetti, R., Maienza, A., Biancofiore, G., Gallese, F., Sabatini, F., Massetti, L., Renella, G., and Vaccari, F. P.: Climate-driven soil dynamics over 30 years: insights from biological indicators across mediterranean shrubland recovery following agricultural abandonment, EGU General Assembly 2026, Vienna, Austria, 3–8 May 2026, EGU26-18328, https://doi.org/10.5194/egusphere-egu26-18328, 2026.

EGU26-19160 | ECS | Orals | SSS4.4

Predicting soil biological indicators of soil health and identifying environmental constraints on soil biodiversity across European landscapes using earth observation data and machine learning 

Maria Marily Christou, Snezhana Mourouzidou, Yannis Kavakiotis, Nikolaos Monokrousos, Spiros Papakostas, Kostas Karyotis, Maria Tsiafouli, Venetia Koidou, Paraskevi Chantzi, and George Zalidis

Under global change and land-use intensification, changes in soil physical and chemical properties propagate to soil biota, with cascading effects on ecosystem functioning and ecosystem service provision. In turn, soil organisms regulate key soil properties such as aggregation, nutrient cycling, and organic matter stabilization, creating a tightly coupled biophysical feedback loop that underpins soil health and ecosystem resilience. However, across Europe, strong environmental heterogeneity and fragmented datasets have made it difficult to identify biological soil health indicators that are robust across land-use systems and pedoclimatic regions.

We used datasets on soil biotic and abiotic properties generated within the SOB4ES project, land-use information and Earth observation-derived climatic (ERA-5), vegetation (Sentinel-2 NDVI) and topographic (NASA SRTM DEM 30m) variables across European sites. Our aim was to investigate scalable, data-driven approaches for soil health assessment under global change and human pressures. State-of-the-art machine-learning models were used to identify the relative importance of natural environmental drivers, soil state variables and human-induced pressures, shaping soil organism abundance and diversity across spatial scales.

Diversity metrics across multiple  taxa consistently showed stronger relationships with environmental gradients than population densities, highlighting diversity as a more sensitive indicator of environmental change than density. Among the most dominant cross-taxa drivers of species richness was soil pH and organic carbon, with highest biodiversity associated with alkaline, carbon-rich soils under moderate moisture conditions. In contrast, high soil moisture and high relative humidity, reflecting both climatic forcing and land-use effects, reduced abundance and diversity across multiple groups, indicating broad sensitivity of soil biota to excess moisture stress under global change. Microbial biomass and nematode density showed particularly strong and accurately captured responses to soil carbon availability, soil texture and elevation, highlighting their value as integrative indicators of soil resource status and ecosystem functioning. Overall, our results demonstrate that biological indicators respond consistently to large-scale gradients in climate, soil chemistry and land-use, supporting their application in spatially explicit soil health assessments and in evaluating the impacts of environmental change and land management across Europe. By integrating microbial, soil faunal indicators across multiple European countries and contrasting pedoclimatic regions, our analysis shows that soil communities are governed by broadly shared environmental controls under global change and land-use pressures, rather than by idiosyncratic, site-specific effects.

The strong contribution of specific soil properties and  Earth-observation-derived variables, combined with the ability of machine-learning models to integrate heterogeneous datasets, demonstrates a powerful and scalable approach for identifying robust biological soil health indicators across regions and land-use systems.

Acknowledgments: The work and all the authors were supported by the Horizon Europe project SOB4ES (“Integrating Soil Biodiversity to Ecosystem Services”) under Grant Agreement No. 101112831. We acknowledge all participating investigators from the SOB4ES consortium who contributed to the existing sample collection and the field sampling for the generation of the spatial database used in the current analysis. Partners from KNAW, UVIGO, NUID UCD, UNICT, KU Leuven, CU, ARO, IBB, UL, UoC, SLU, EFWSL, Airfield, MFO, and INRAe provided these contributions.

How to cite: Christou, M. M., Mourouzidou, S., Kavakiotis, Y., Monokrousos, N., Papakostas, S., Karyotis, K., Tsiafouli, M., Koidou, V., Chantzi, P., and Zalidis, G.: Predicting soil biological indicators of soil health and identifying environmental constraints on soil biodiversity across European landscapes using earth observation data and machine learning, EGU General Assembly 2026, Vienna, Austria, 3–8 May 2026, EGU26-19160, https://doi.org/10.5194/egusphere-egu26-19160, 2026.

EGU26-19422 | ECS | Orals | SSS4.4

Vetch cover cropping enhances soil biological functioning and rice productivity without increasing greenhouse gas emissions in a Mediterranean rice system 

Alba Llovet Martín, Néstor Pérez-Méndez, Mar Catala-Forner, Josep Borrull, Lluís Jornet, Lluís Matamoros, and Maite Martínez-Eixarch

Cover crops are increasingly promoted as a management strategy to enhance soil carbon (C) stocks and soil health, but their effects on greenhouse gas (GHG) emissions remain uncertain, particularly in flooded rice systems where anaerobic conditions prevail. In these systems, organic inputs such as green manures have been widely reported to stimulate methane (CH₄) emissions, raising concerns about their net climate impact.

Here, we evaluated the impacts of contrasting rice rotational strategies, i.e., winter fallow, hairy vetch (Vicia villosa Roth), and Italian ryegrass (Lolium multiflorum Lam.), on soil health, C dynamics, and GHG emissions in a Mediterranean rice system located in the Ebro Delta (NE Spain). The field experiment was established in 2021, and the results presented here cover the period from February 2024 to October 2025.

Soil biological health was assessed by integrating weekly measurements of CH₄ and nitrous oxide (N₂O) emissions with microbial biomass C and nitrogen (N) and litter decomposition of cover crop shoots and roots assessed at key stages of the rice growing cycle. These indicators were complemented by measurements of soil organic carbon (SOC) stocks and soil aggregation to evaluate links between biological activity, soil structure, and C storage. Ongoing analyses of microbial necromass and SOC fractionation into particulate and mineral-associated pools will provide further mechanistic insight into C stabilization processes under different cover crop strategies.

Cover crop identity strongly influenced biogeochemical dynamics. CH₄ emissions peaked under vetch during the flooded cultivation phase, whereas no significant treatment effects were detected for N₂O emissions, despite a tendency towards lower emissions under vetch. Consequently, no net differences in global warming potential were observed among treatments. Shoot litter decomposition was significantly slower for vetch than for ryegrass, a pattern not mirrored in roots, and consistent with differences in residue lignin content. However, rapid mass loss occurred for both residue types under anaerobic conditions, suggesting an important role of solubilization processes. SOC stocks did not differ among treatments in the most superficial soil layer, but ryegrass was associated with significantly lower stocks in the 10–30 cm soil layer. Cover cropping tended to promote macroaggregate formation, suggesting potential improvements in soil structure and physical protection of organic matter. Microbial biomass C and N were marginally higher under vetch in autumn, indicating enhanced soil biological activity. At the agronomic level, rice grain yield showed a marginal increase under vetch.

Overall, our results suggest that vetch represents a promising cover crop option in Mediterranean rice paddies, enhancing soil biological functioning and rice productivity while not leading to clear increases in total GHG emissions.


Acknowledgements

This study was funded by The Government of Catalonia through the projects AgriCarboniCat and Carboni al Sòl.

How to cite: Llovet Martín, A., Pérez-Méndez, N., Catala-Forner, M., Borrull, J., Jornet, L., Matamoros, L., and Martínez-Eixarch, M.: Vetch cover cropping enhances soil biological functioning and rice productivity without increasing greenhouse gas emissions in a Mediterranean rice system, EGU General Assembly 2026, Vienna, Austria, 3–8 May 2026, EGU26-19422, https://doi.org/10.5194/egusphere-egu26-19422, 2026.

EGU26-20319 | ECS | Posters on site | SSS4.4

Deep soil biota drive trade-offs between above and belowground functioning during dryland restoration 

Zhiyuan Xu, Mark Anthony, Tianyi Qiu, and Zhenhong Hu

Afforestation can enhance carbon sequestration in global drylands but may impair ecosystem functioning via deep-soil water depletion. However, it remains unclear how afforestation-driven turnover in soil biota influences aboveground vegetation status and soil multifunctionality, particularly in deep soil. Here, we conducted a ~500-km transect survey across four precipitation regions on the Loess Plateau, China, comparing 25-year-old plantations with adjacent croplands. We characterized soil biota (bacteria, fungi, protists, and invertebrates) using amplicon sequencing and quantified soil multifunctionality in topsoil (0–20 cm) and deep soil (160–200 cm). We found that afforestation was linked to stronger effects in deep versus topsoil, and the magnitude of these effects varied across the precipitation gradient. Afforestation consistently reduced deep-soil water and multifunctionality, whereas topsoil responses became increasingly negative at the drier range of the precipitation gradient. Soil biotic change was driven primarily by community turnover rather than diversity, and turnover responses across all biotic groups weakened with reduced precipitation. Turnover patterns further supported a trade-off between aboveground greening and belowground functioning. Soil biota that established after afforestation were positively associated with canopy greenness but negatively associated with soil multifunctionality, whereas those that disappeared showed the opposite linkages. Biota that persisted before and after afforestation were positively associated with both canopy greenness and multifunctionality. Overall, our results show that gains in aboveground greenness can mask persistent deep-soil functional losses in dryland afforestation, emphasizing that restoration success should be evaluated with explicit deep-soil indicators.

How to cite: Xu, Z., Anthony, M., Qiu, T., and Hu, Z.: Deep soil biota drive trade-offs between above and belowground functioning during dryland restoration, EGU General Assembly 2026, Vienna, Austria, 3–8 May 2026, EGU26-20319, https://doi.org/10.5194/egusphere-egu26-20319, 2026.

EGU26-20980 | Orals | SSS4.4

Size matters: Fine biochar application mitigates N2O emissions during extreme drying and rewetting events in arable soils 

Ezekiel K. Bore, Harry T. Child, Nina L. Friggens, Cheryl Hook, Elizabeth L. Cressey, Lucy Wierzbicki, John Dowdle, Richard K. Richard K. Tennant, Kees Jan van Groenigen, and Iain P. Hartley

Drying and rewetting (D/W) causes substantial stress to soil microbial communities, with important consequences for soil carbon (C) and nitrogen (N) dynamics. The impacts of biochar addition on these effects are underexplored. Fine biochar increases soil pH and enhances adsorption of labile ammonium (NH4+) released during repeated D/W cycles due to large surface area. We therefore hypothesised that application of fine biochar would decrease D/W-induced soil N2O emissions. Arable soils were prepared as (i) unamended controls, (ii) soils limed to replicate biochar pH effects, and (iii) soils amended at 1% of the dry soil weight with two particle-size fractions of biochar (<1.4mm “fine” and >3mm “coarse” pellets) produced from wheat straw and anaerobic digestate feedstocks. These soils were subjected to different frequencies of D/W cycles; 0, 1 or 4 cycles during a 58-day period. Ammonium nitrate fertilizer was applied at the start and after 45 days of incubation.

In the early stages of the incubation, lime and biochar addition both increased soil N2O emissions relative to the controls. However, fine digestate biochar reduced cumulative N2O emissions by 12.9% in the soil subjected to 0-cycles of D/W compared with non-amended control soils. Addition of lime to induce the same pH change as the biochar additions tended to decrease N2O emissions, suggesting that the reduction in N2O was partly mediated by a pH increase. Increasing D/W frequency elevated N2O emissions across the treatments except for both particle size wheat straw biochar amended soils, where N2O emissions were not altered by D/W frequency. Nonetheless, comparing N2O emissions at highest D/W frequency across treatments, the N2O released from soil amended with fine wheat straw biochar was the lowest. Lime and biochar addition decreased NH4+ concentration in soil by 19 – 55.5% compared to control soils. This reduction in NH4+ concentration suggest a pH-induced stimulation of nitrification with minimal N2O release. Overall, application of fine biochar mitigates soil N2O emissions, even during extreme D/W scenarios that may become increasingly frequent with climate change, and should therefore be considered a promising management practice for N2O emissions reduction in arable soils.

How to cite: Bore, E. K., Child, H. T., Friggens, N. L., Hook, C., Cressey, E. L., Wierzbicki, L., Dowdle, J., Richard K. Tennant, R. K., van Groenigen, K. J., and Hartley, I. P.: Size matters: Fine biochar application mitigates N2O emissions during extreme drying and rewetting events in arable soils, EGU General Assembly 2026, Vienna, Austria, 3–8 May 2026, EGU26-20980, https://doi.org/10.5194/egusphere-egu26-20980, 2026.

EGU26-21429 | Posters on site | SSS4.4 | Highlight

Automated imaging and taxonomy-guided AI for accurate and scalable soil biodiversity diagnosis 

Vojtech Kurfurst, Richard Janissen, Ziad Matar, Gido Verheijen, Adam Cervenka, Aisling Wigman, Kanta Tanahashi, Martin Kolarik, and Hazem Issa

Soil biodiversity is crucial for our functional biosphere and 95% of our food relies on healthy soil. Yet over 70% of earth’s soil is degraded, highlighting the urgency to restore soil health, a goal emphasized by the recent European Soil Monitoring directive. Soil-born nematodes exist within all trophic levels of the soil food web and represent a universal bioindicator of soil biodiversity, even in degraded soils. However, this indicator is not widely used and requires nematologist and soil ecology experts as well as significant labor-intensive manual analyses. With the support of EIC and EIT, we developed an automated end-to-end diagnosis tool, comprised of an automated soil sample imaging system (NEMASCOPE TM) and a multi-level, taxonomy-guided computer vision AI for nematode species identification. Our technology provides quantitative soil biodiversity parameters based on the existing scientific framework of Nematode-based Indices (NBIs), assessing soil health, immunity, fertility, soil-based plant parasites, carbon cycling, pollution, and organic degradation pathway, among other NBIs for soil assessment. Validated by research phytopathogenic laboratories, the tool demonstrated to be in average more accurate (>90%) and over 20-times faster (<15 min) in end-to-end biodiversity analysis compared to manual analysis. The system’s nematode identification performance we evaluated on Root-knot nematode (RKN) species level identification accuracy across Meloidogyne species that are among the most economically damaging plant-parasitic nematodes, using naturally infested field samples containing M. chitwoodi, which are challenging to distinguish from other Meloidogyne species due to their morphological similarities. Compared with manual identification, the AI-based approach achieved an accuracy of ~95% in identifying RKN genera with species-level prediction accuracy for M. chitwoodi with ~96%, essentially matching manual expert performance. Our platform demonstrates expert-level accuracy for nematode identification down to the species level particularly necessary for plant-parasite index (PPI) assessment. The technology allows scalable, industry-ready diagnostics addressing the global shortage of nematologist expertise with the potential to become a new standard in commercial and research sectors, aiding in the global efforts to manage and restore soil health.

How to cite: Kurfurst, V., Janissen, R., Matar, Z., Verheijen, G., Cervenka, A., Wigman, A., Tanahashi, K., Kolarik, M., and Issa, H.: Automated imaging and taxonomy-guided AI for accurate and scalable soil biodiversity diagnosis, EGU General Assembly 2026, Vienna, Austria, 3–8 May 2026, EGU26-21429, https://doi.org/10.5194/egusphere-egu26-21429, 2026.

EGU26-21942 | ECS | Orals | SSS4.4

Wildflower strips and soil fauna: multi-taxa responses to management and consequences for decomposition 

Alfredo Venturo, Martin Štrobl, Jakub Hlava, Eliška Brandová, Karel Tajovský, Vojtěch Pařízek, Nikola Pecníková, and Michal Knapp

Despite being a highly popular topic in agroecological research, the impact of wildflower strips (WFSs) on soil biota and related ecosystem services remains poorly understood. To achieve a more comprehensive understanding, we need long-term studies that combine biodiversity and decomposition data while accounting for the additive effects of management. In this study, we analysed earthworm abundance, species richness and biomass, soil arthropod abundance, and litter decomposition rates in WFSs and adjacent crops across three years, controlling for sowing term and seed mixture effects. Furthermore, we evaluated how contrasting WFS tillage managements (tillage vs. no-till) affect epigeic and soil arthropod communities.

Earthworm abundance, species richness, biomass, and soil arthropod abundance were consistently higher in wildflower strips than in cropped margins. Moreover, the effects strengthen over time, suggesting cumulative benefits from reduced disturbance and the establishment of permanent vegetation. Tillage effects showed taxon-specific responses to disturbances, with carabids, isopods, and other soil-dwelling arthropods being negatively affected. In contrast, taxa less bound to soil stability, such as spiders, exhibited transient rebound dynamics. Undisturbed WFSs showed a lower long-term decomposition rate, suggesting a trade-off between biodiversity gains and decomposition under less disturbed soil conditions.

These results underscore the importance of WFSs for soil biota in agricultural contexts, suggesting that disturbance-sensitive management strategies should be implemented to enhance soil biodiversity. However, the potential trade-offs with ecosystem services, such as decomposition, require further investigation to optimise agricultural practices. Building on these findings, we plan to explore further how changes in vegetation structure influence epigeic arthropods, hypothesising that denser, more structurally complex vegetation promotes higher abundance and diversity. 

How to cite: Venturo, A., Štrobl, M., Hlava, J., Brandová, E., Tajovský, K., Pařízek, V., Pecníková, N., and Knapp, M.: Wildflower strips and soil fauna: multi-taxa responses to management and consequences for decomposition, EGU General Assembly 2026, Vienna, Austria, 3–8 May 2026, EGU26-21942, https://doi.org/10.5194/egusphere-egu26-21942, 2026.

EGU26-1925 | Posters on site | SSS4.3

Deciphering the mechanisms underlying soil fauna-microbe interactions 

Guille Peguero, Xavier Domene, Stefania Mattana, Dolores Asensio, Sara Sanchez-Moreno, Lucia Fuchslueger, Hannes Schmidt, Andreas Richter, and Josep Peñuelas

Soil fauna and microbial communities are key drivers of soil organic matter turnover and nutrient cycling, but we are still far from unraveling the mechanisms underlying the full complexity of their interactions. While soil fauna is generally hypothesized to release microbes from bottom-up resource limitations, they could also exert a strong top-down control by either direct feeding or by shifting the stoichiometric balance of the soil solution, thus constraining microbial growth. To try filling this knowledge gap we report novel data on a microcosm incubation experiment in which we controlled the presence of meso and macrofauna and measured the flows of carbon (C), nitrogen (N) and phosphorus (P) from litter to the different soil pools and tracked their effects on a comprehensive set of microbial functioning variables which included growth rates, stoichiometry, enzyme activity, substrate degrading capacity, and rates of N and P mineralization and consumption. Additionally, we evaluated changes in the microbial community composition through 16S, ITS and 18S DNA marker sequencing. Soil macrofauna boosted the release of C, N and P from the litter pool. This led to a strong increase in dissolved organic C and a moderate increase in free amino acids, ammonium and phosphate concentration, thus resulting in a sharp increment of the C:N and C:P ratios in the soil solution. Microbial C and growth were greater in the microcosms with meso and macrofauna, but their C-use efficiency did not change. Macrofauna presence boosted the microbial gross production and consumption of amino acids, ammonium and nitrate, but P mobilization and uptake rates remained equal across treatments. The activity of beta-glucosidase also increased with macrofauna while N and P mining enzyme activities did not change. Overall, soil macrofauna strongly up regulated microbial communities by releasing them from C limitation.

How to cite: Peguero, G., Domene, X., Mattana, S., Asensio, D., Sanchez-Moreno, S., Fuchslueger, L., Schmidt, H., Richter, A., and Peñuelas, J.: Deciphering the mechanisms underlying soil fauna-microbe interactions, EGU General Assembly 2026, Vienna, Austria, 3–8 May 2026, EGU26-1925, https://doi.org/10.5194/egusphere-egu26-1925, 2026.

EGU26-3071 | Orals | SSS4.3

Quantifying the role of trophic guilds in soil organic carbon mineralization 

Mathilde Dahl, Fabrizzio Protti- Sánchez, Verena Groß, Anna Burns, Andrea Söllinger, Die Hu, Biplabi Bhattarai, Kenneth Dumack, Dennis Metze, Ivika Ostonen, Ivan Janssens, Bjarni Sigurdsson, Michael Bahn, Andreas Richter, and Tim Urich

Soil organic carbon (SOC) is a critical carbon pool on the planet, essential for soil functions and services such as climate regulation through C sequestration. SOC is dynamically recycled within microbial biomass and channelled into long term storage in the soil (the 'microbial carbon pump'). Understanding the biotic processes that drive SOC mineralization is essential for predicting the climate warming-carbon cycle feedback. The microbial pump is influenced by trophic interactions in the soil food web and SOC mineralization is a result of complex biotic interactions.
Here, we combined Tree-of-life sequencing (TOLseq; metatranscriptomic sequencing of ribosomal RNA for three-domain profiling of soil biota) with quantitative conversion factors which links transcript abundance to biomass, using standard parameters of microbial cell stoichiometry and physiology. We show how this can form the basis for energetic food web models, an approach we refer to as TOLmodel. The novel approach was applied on soil samples originating from natural grassland sites in Iceland (‘Forhot’ sites), where geothermal activity has created soil warming for more than 60 years, with soil warming gradients up to +6 °C used in this study. Field observations showed that warming reduced SOC stocks, but after years of warming SOC mineralisation had acclimated. 
Our TOLmodel approach allowed the quantification of soil biota, aligning with laboratory measurements of microbial biomass carbon, and their SOC mineralization rates, aligning with measured CO2 efflux from the field site. Furthermore, the food web model revealed how decimated soil fauna under soil warming relaxed the top-down control of microbial growth increasing SOC mineralisation rate per unit microbial biomass six-fold during summer.

How to cite: Dahl, M., Protti- Sánchez, F., Groß, V., Burns, A., Söllinger, A., Hu, D., Bhattarai, B., Dumack, K., Metze, D., Ostonen, I., Janssens, I., Sigurdsson, B., Bahn, M., Richter, A., and Urich, T.: Quantifying the role of trophic guilds in soil organic carbon mineralization, EGU General Assembly 2026, Vienna, Austria, 3–8 May 2026, EGU26-3071, https://doi.org/10.5194/egusphere-egu26-3071, 2026.

EGU26-3200 | ECS | Posters on site | SSS4.3

Predicting Microbial Functional Diversity for Decomposition along an Aridity Gradient 

Luciana Chavez Rodriguez, Robin Martens, and Gerlinde De Deyn

Soil microbial communities are rarely represented in soil models or with extreme simplifications due to their complexity. Acknowledging that temperature and moisture are the primary controls over microbial functional diversity, this research aims to determine the extent to which soil functional diversity can be predicted based on these factors. We used the aridity index (AI), as this easy-to-measure metric includes temperature and moisture. Following the YAS framework, a widely accepted trait-based approach to characterize soil microbial communities, we hypothesized that under an identical food source, the functional strategies employed by the community will go from high growth yield (Y) in humid areas to higher investment in stress tolerance (S) in arid areas. We also expected a trade-off between investment in S and Y, while relative investment in A (resource acquisition) should remain constant. We further hypothesized that AI is a decent predictor of the microbial investments into the Y, A, and S traits. We used the DEMENTpy model, an in silico simulator, to derive YAS investments for hypothetical soil microbial communities at five sites along an aridity gradient in Spain. We validated model simulations using mass loss from Rooibos tea samples from each site and employed a Dirichlet regression model to predict YAS investments, using AI. Contrary to the hypotheses, increasing aridity changes community investment from Y to A, with limited changes in S. The A strategy could be predicted considerably well based on AI, while Y and S could not. Together with further validation of our modeling results with experimental data, our findings lay the groundwork in deriving simple mathematical formulations that can be integrated into Earth system models, allowing for upscaling from genomes to Earth system processes.  

How to cite: Chavez Rodriguez, L., Martens, R., and De Deyn, G.: Predicting Microbial Functional Diversity for Decomposition along an Aridity Gradient, EGU General Assembly 2026, Vienna, Austria, 3–8 May 2026, EGU26-3200, https://doi.org/10.5194/egusphere-egu26-3200, 2026.

EGU26-3996 | ECS | Orals | SSS4.3

Land-use driven microbial community legacy shapes soil functionality 

Harry T. Child, Nina L. Friggens, Cheryl Hook, Elizabeth L. Cressey, Lucy Wierzbicki, Gabrielle R. Joslin, John Dowdle, Ezekiel K. Bore, Kees Jan van Groenigen, Richard K. Tennant, and Iain P. Hartley

Microbial communities are central to soil ecosystem function. However, the extent to which functional diversity is conserved across communities, providing resilience to environmental change, remains uncertain. Here, we investigated how microbial legacy and soil properties shape community assembly and function, by cross-inoculating distinct microbial communities into sterilised soils from agricultural and semi-natural habitats within a 6 km radius. Over a 10-month incubation, the soil environment drove microbial community convergence at high taxonomic ranks, but fine-scale community composition and functional outcomes remained distinct. Distinct microbial communities showed a ‘home-field advantage’ in soil carbon use that increased cumulative respiration by 16-26% in agricultural soils and by 26-84% in semi-natural soils, demonstrating limited redundancy of broad ecological function between soil communities. Increased soil respiration in home-field soil communities was associated with significantly higher microbial diversity, indicating filtering selection driven by unfamiliar soil abiotic environments. Distinct communities also caused significant shifts in soil pH associated with contrasting inorganic nitrogen transformations, exposing limited conservation of specialised metabolic functions. In summary, microbial community legacy had a lasting influence on carbon and nitrogen cycling, and thus, the effects of anthropogenic land use change on soil microbial functional diversity will likely have substantial impacts on these key ecosystem processes. These findings have implications for the resilience of soil health and function under land use change and the potential for predicting the success of ecosystem restoration efforts, given the limited conservation in functional potential.

How to cite: Child, H. T., Friggens, N. L., Hook, C., Cressey, E. L., Wierzbicki, L., Joslin, G. R., Dowdle, J., Bore, E. K., van Groenigen, K. J., Tennant, R. K., and Hartley, I. P.: Land-use driven microbial community legacy shapes soil functionality, EGU General Assembly 2026, Vienna, Austria, 3–8 May 2026, EGU26-3996, https://doi.org/10.5194/egusphere-egu26-3996, 2026.

The Anthropocene exerts various pressures and influences on the stability and function of the Earth’s ecosystems. However, our understanding of how the microbiome responds in form and function to these disturbances is still limited, particularly when considering the phyllosphere, which represents one of the largest microbial reservoirs in the terrestrial ecosystem. In this study, we comprehensively characterized tree phyllosphere bacteria and associated nutrient-cycling genes in natural, rural, suburban, and urban habitats in China. Results revealed that phyllosphere bacterial community diversity, richness, stability, and composition heterogeneity were greatest at the most disturbed sites. Stochastic processes primarily governed the assembly of phyllosphere bacterial communities, although the role of deterministic processes (environmental selection) in shaping these communities gradually increased as we moved from rural to urban sites. Our findings also suggest that human disturbance is associated with the reduced influence of drift as increasingly layered environmental filters deterministically constrain phyllosphere bacterial communities. The intensification of human activity was mirrored in changes in functional gene expression within the phyllosphere microbiome, resulting in enhanced gene abundance, diversity, and compositional variation in highly human-driven disturbed environments. Furthermore, we found that while the relative proportion of core microbial taxa decreased in disturbed habitats, a core set of microbial taxa shaped the distributional characteristics of both microbiomes and functional genes at all levels of disturbance. In sum, this study offers valuable insights into how anthropogenic disturbance may influence phyllosphere microbial dynamics and improves our understanding of the intricate relationship between environmental stressors, microbial communities, and plant function within the Anthropocene

How to cite: Li, J.: From nature to urbanity: exploring phyllosphere microbiome and functional gene responses to the Anthropocene, EGU General Assembly 2026, Vienna, Austria, 3–8 May 2026, EGU26-4370, https://doi.org/10.5194/egusphere-egu26-4370, 2026.

EGU26-4768 | ECS | Posters on site | SSS4.3

Response of soil micro-food webs to climate change in karst ecosystems: A soil translocation experiment based on tiankeng 

Cong Jiang, Changchun Qiu, Caiqin Zhou, and Wei Shui

Karst tiankengs are established hotspots of biodiversity for macro-organisms. In contrast, the soil micro-food web, structured around microbes, protozoa, and nematodes, represents a critical yet understudied component of subsurface ecosystem diversity and functioning. Its patterns of diversity and underlying maintenance mechanisms remain largely unresolved. To address this, we conducted a three-year bidirectional soil translocation experiment between the interior and exterior of a tiankeng, assessing responses of the soil micro-food web and soil multifunctionality to these distinct habitats. We found that soil translocation significantly altered the diversity, composition, and structure of the micro-food web, with variation in responses across different trophic levels. These shifts were primarily driven by the contrasting environmental regimes, including temperature, humidity, and soil resource availability, between the tiankeng interior and the external environment. Specifically, outward translocation negatively impacted key attributes of the micro-food web. Enhanced competitive interactions between bacteria and fungi exerted bottom-up control, restructuring the entire network. Notably, the tiankeng interior sustained a more complex and stable soil micro-food web, supported higher levels of soil multifunctionality, and demonstrated that micro-food web complexity is pivotal in regulating multifunctionality. Our findings underscore the potential of tiankengs to act as climate refugia and biodiversity reservoirs under future climate change scenarios. Moreover, tiankengs can serve as natural open‑top laboratory models, offering a novel and powerful perspective for simulating the responses of subsurface ecosystems to climate change.

How to cite: Jiang, C., Qiu, C., Zhou, C., and Shui, W.: Response of soil micro-food webs to climate change in karst ecosystems: A soil translocation experiment based on tiankeng, EGU General Assembly 2026, Vienna, Austria, 3–8 May 2026, EGU26-4768, https://doi.org/10.5194/egusphere-egu26-4768, 2026.

EGU26-5381 | ECS | Posters on site | SSS4.3

Taking the heat: soil warming optimum of CH4 uptake in subarctic mineral soils 

Annelie Skov Nielsen, Klaus Steenberg Larsen, and Jesper Riis Christiansen

Atmospheric methane (CH4) uptake in subarctic and Arctic mineral soils is significant for the CH4 budget of high-latitude regions, but its response to warming is not well understood. The effect of soil warming on net CH4 uptake was studied in situ across a natural warming gradient (ambient to +  57.5 °C) in a geothermal area in Southwest Iceland. The study site represented a subarctic grassland on mineral soil with field measurements conducted in summer and fall 2021. Combined automatic and manual dynamic chamber CH4 flux measurements across the warming transect showed that net CH4 uptake increased with 0.26 nmol CH4 m−2 s−1 per 1 °C of soil warming from ambient soil temperature up to about + 4 °C of soil warming. Soil warming above + 4 °C resulted in a gradual decrease of net CH4 uptake corresponding to 0.1 nmol CH4 m−2 s−1 per 1 °C of soil warming up to + 13 °C. With further soil warming, in situ net CH4 fluxes were probably affected by geogenic emissions during the effective study period. These trends of enhanced in situ net CH4 uptake with mild soil warming followed by a decreasing uptake rate with further warming were confirmed in a laboratory incubation experiment showing that the in situ response to temperature <  + 13 °C was biogenic rather than geogenic. It is still not known whether the observed trends are due to adaptation of the community structure to temperature, differential regulation of activity or abundance. Our findings point to a window of future soil warming up to about + 4 °C where net CH4 uptake in subarctic grassland mineral soils is likely to increase, while further soil warming may result in a decrease of this important CH4 sink below ambient level. To expand the representativeness of these findings, we encourage future studies to include similar incubation experiments of the warming response for soils across the Arctic.

How to cite: Nielsen, A. S., Larsen, K. S., and Christiansen, J. R.: Taking the heat: soil warming optimum of CH4 uptake in subarctic mineral soils, EGU General Assembly 2026, Vienna, Austria, 3–8 May 2026, EGU26-5381, https://doi.org/10.5194/egusphere-egu26-5381, 2026.

Carbon use efficiency (CUE) of microbial communities in soil quantifies the proportion of organic carbon (C) taken up by microorganisms that is allocated to growing microbial biomass as well as used for reparation of cell components. This C amount in microbial biomass is subsequently involved in microbial turnover, partly leading to microbial necromass formation, which can be further stabilized in soil. To unravel the underlying regulatory factors and spatial patterns of CUE on a large scale and across biomes (forests, grasslands, croplands), we evaluated 670 individual CUE data obtained by three commonly used approaches: (i) tracing of a substrate C by 13C or 14C incorporation into microbial biomass and respired CO2 (hereafter 13C-substrate), (ii) incorporation of 18O from water into DNA (18O-water), and (iii) stoichiometric modelling based on the activities of enzymes responsible for C and nitrogen (N) cycles. The global mean of microbial CUE in soil depends on the approach: 0.59 for the 13C-substrate approach, and 0.34 for the stoichiometric modelling and for the 18O-water approaches. Across biomes, microbial CUE was highest in grassland soils, followed by cropland and forest soils. A power-law relationship was  identified between microbial CUE and growth rates, indicating that faster C utilization for growth corresponds to reduced C losses for maintenance and associated with mortality. Microbial growth rate increased with the content of soil organic C, total N, total phosphorus, and fungi/ bacteria ratio. Our results contribute to understanding the linkage between microbial growth rates and CUE, thereby offering insights into the impacts of climate change and ecosystem disturbances on microbial physiology with consequences for C cycling.

How to cite: Kuzyakov, Y. and Hu, J.: Microbial Carbon Use Efficiency and Growth Rates in Soil: Global Patterns and Drivers, EGU General Assembly 2026, Vienna, Austria, 3–8 May 2026, EGU26-7686, https://doi.org/10.5194/egusphere-egu26-7686, 2026.

Permafrost forests harbor vast, climate-sensitive carbon (C) reservoirs whose vulnerability largely depends on temperature sensitivity of microbial respiration (Q10). However, substantial uncertainties persist in predicting Q10 patterns due to complex interactions among multiple ecological factors. Here, we conducted a standardized field survey with controlled incubations across a regional gradient from continuous permafrost (CP) and discontinuous permafrost (Dis-CP, including sporadic and isolated one) in the Greater Khingan Mountains to quantify Q10 values and identify their main ecological controls. We found that the Q10 values were significantly higher in CP than Dis-CP forests, indicating a stronger microbial respiratory response to warming in the coldest permafrost regions. Statistical analysis revealed that the soil microbiome was the most important factor explaining Q10 values in CP forest (47.8%), whereas a distinct set of factors (plant production, fine texture, substrate quality, and mean annual ground temperature) explained the largest proportion (63.2%) of Q10 variation in Dis-CP forests. Our findings suggest that warming-induced permafrost degradation is likely shift the dominant controls for Q10 from microbial community to abiotic and plant-related factors, while enhancing greenhouse gas emissions from permafrost soils. 

How to cite: Huang, C. and Zhou, X.: Warming-induced carbon vulnerability in permafrost forests: a shift in Q10 from continuous to discontinuous zones, EGU General Assembly 2026, Vienna, Austria, 3–8 May 2026, EGU26-9333, https://doi.org/10.5194/egusphere-egu26-9333, 2026.

Plants and their soil microbial communities are connected by plant-root exudates that shape the soil microbiome. Monocultures of plants give a clearer plant-soil signal than mixtures of plant species, but the latter is what we deal with in natural systems. Grasses, herbs and legumes and their plant-root traits all have their own exudate types that alter plants and soil communities to cope with prolonged periods of drought and with repelling or attracting plant pathogens or symbionts. Having an insight in how plants shape soil microbiomes and how soil microbiomes shape plant communities are therefore crucial to sustain soil health and food security for the future but also important in the restoration of degraded soils. This talk will cover some possibilities to influence soil quality with plants steering the microbiome and how the microbiome steers the plant community in return. For the future of our planet it will be important to use plant-soil interactions to keep our soils healthy and resilient to ensure food security for the generations ahead. My current and past work focusses on plant-soil interactions and microbiome steering via plants to increase soil carbon stabilization. I pledge that fungi are superhero’s in this respect because they are very active in most soils even when low in biomass. Moreover, fungi have a high carbon use efficiency and if they are hyphal, their necromass tissue can be resilient against quick decomposition, and therefore can potentially contribute to stable carbon inputs.

How to cite: Morriën, E.: Using plant-soil-microbe interactions to retain soil functions under global change, EGU General Assembly 2026, Vienna, Austria, 3–8 May 2026, EGU26-11469, https://doi.org/10.5194/egusphere-egu26-11469, 2026.

EGU26-13033 | ECS | Posters on site | SSS4.3

Does flooding proliferate metal and antibiotic resistance genes in riverine floodplains? 

Mara Breit, Dominik Buob, Mathias Scholz, Anja Worrich, and E. Marie Muehe

Global change-driven floods1 not only reshape or destroy landscapes but may also create hotspots for antimicrobial resistance. During a flooding event, contaminants and nutrients are mobilized, redistributed, and deposited across flooded areas2. While antimicrobial substances, i.e. metals and antibiotics, naturally occur in low concentrations in the environment, their levels often increase through anthropogenic activities3. These contaminants contribute to the unprecedented loss in soil health affecting the soils’ microbiome and its ecosystem functions3. As a microbial adaptation, metal (MRGs) and antibiotic resistance genes (ARGs) proliferate in the environment. Microbial resistance may enhance soil resilience, yet the spread and proliferation of ARGs poses a major public health threat, contributing to the failure of medical treatments and millions of deaths annually6. ARGs and MRGs are often co-located on the same mobile genetic elements, and are thus co-proliferated together even in the absence of one of the contaminants7. By entering rivers through runoff, leaching and discharge8 contaminants can be transferred downstream and accumulate in flood-prone areas. Thus, riverine floodplains may likely be co-exposed to metals and antibiotics and function as reservoirs for resistance genes, potentially facilitating their transfer to humans.

To evaluate how resistance acquisition evolves after flooding, a mesocosm study with combined and single metal and antibiotic contamination of a floodplain grassland from the Elbe river was conducted. Environmentally relevant concentrations of metals, antibiotics, their combination, or uncontaminated water were applied in a single flooding event. Contaminant fate in porewater and microbial resistance in soil were traced over seven weeks.              

The added metal load was not detectable in the mobile phase of soil porewater one day after flooding, indicating adsorption to soil particles. Nevertheless, plants responded with a contaminant-dependent increase in the chlorophyll a/b ratio within two weeks after flooding. In addition, flooding induced microbial cell growth, with the magnitude and timing of growth peaks depending on the contamination treatment. The metal treatment induced a rapid increase in 16S rRNA gene copies as well as a slight increase of MRGs after two weeks, whereas antibiotics and the combined treatment resulted in a delayed response followed by a slower decrease in both gene abundances. Metals and antibiotics combined did not amplify but rather attenuated this microbial response. Subsequently, ARGs were correlated with MRG responses. Overall, even though the microbial community responded to the stressors, the magnitude and duration of effects indicate that the active and diverse community of floodplain soils could be able to buffer low contamination events.      
Increasing frequency of extreme weather events and ongoing contaminant accumulation can further challenge the resilience of microbial communities in flood-impacted soils, highlighting their role as flood protection and water filters but also their vulnerability.        

1 IPCC, 2023 
2 Crawford et al., J Hazard Mater, 2022
3 Cycoń et al., Front Microbiol, 2019
4 Lado et al., Geoderma, 2008
5 IPBES, 2018
6 Naghavi et al., Lancet, 2024
7 Imran et al., Chemosphere, 2019
8 Bailey et al., J Soils Sediments, 2015

How to cite: Breit, M., Buob, D., Scholz, M., Worrich, A., and Muehe, E. M.: Does flooding proliferate metal and antibiotic resistance genes in riverine floodplains?, EGU General Assembly 2026, Vienna, Austria, 3–8 May 2026, EGU26-13033, https://doi.org/10.5194/egusphere-egu26-13033, 2026.

Climate projections predict an increase of frequency and/or intensity of extreme precipitation and drought events in temperate agroecosystems, leading to more pronounced drying–rewetting cycles (DWC). These moisture fluctuations trigger pulses of CO2 emissions from soil microbial activity—the Birch effect—which may destabilize soil organic carbon (SOC) stocks. However, large variability in the magnitude of this effect persists across studies, suggesting a strong influence of soil properties and land management, as well as methodological differences (e.g. lack of continuous CO2 measurement, inconsistent controls).

We addressed this issue through a controlled incubation of undisturbed soil cores from three French agricultural sites with contrasting textures (sandy, loamy, clayey) and management (conventional cropping, organic farming, conservation agriculture, permanent grassland). Soils were subjected to (i) five successive temperate DWC (1 week drying, 1 week rewetting, 70 days), (ii) five successive semi-arid DWC (6 weeks drying, 1 week rewetting, 245 days) and (iii) a constant moisture control. For each texture and management, the water content of the control was set to the mean value calculated over the temperate DWC. CO2 fluxes were monitored continuously, including during drying phases, enabling unbiased comparison of cumulative SOC mineralization across moisture regimes.

For both temperate and semi-arid scenarios, all soils showed pronounced CO₂ pulses upon rewetting, with declining amplitudes across successive cycles and strong modulation by soil texture and management. Relative to the constant-moisture control over the 70-day incubation, temperate DWC increased cumulative SOC mineralization for loamy soils managed conventionally and organically, and in sandy soils under permanent grassland. These differences were primarily explained by soil texture and water retention properties, with management effects depending on their interaction with clay content. Prolonged drought did not systematically increase SOC mineralization, indicating a context-dependent saturation of the Birch effect. Microbial biomass generally declined under longer droughts, whereas the metabolic quotient—defined as the ratio of cumulative mineralization during the last rewetting to final microbial biomass—increased with drought duration, except in grassland soils.

These results indicate a buffering effect of finer-textured and structurally stable soils, consistent with a joint biotic–abiotic control of the Birch effect shaped by soil texture and its interaction with land management. Recurrent DWC may progressively deplete labile SOC and destabilize protected SOC pools, with implications for SOC persistence under future climates. More mechanistic understanding is needed to improve predictions across soils, land uses, and management systems, and to integrate these dynamics into SOC models.

Keywords Drying–rewetting cycles ; Birch effect ; Soil texture ; Land use ; Agricultural management; Carbon mineralization ; Soil organic carbon; Climate change.


How to cite: Plaçais, T.: Soil texture and management jointly control the Birch effect under repeated drying–rewetting cycles, EGU General Assembly 2026, Vienna, Austria, 3–8 May 2026, EGU26-13336, https://doi.org/10.5194/egusphere-egu26-13336, 2026.

EGU26-13381 | ECS | Posters on site | SSS4.3

What shapes nitrifiers in drylands? Global drivers of AOA and AOB abundance across microsites 

Norah Alghamdi, Mario Corrochano-Monsalve, and Fernando T. Maestre

Nitrifying microbes play a central role in soil N cycling by controlling N transformations and the potential for N losses (including the greenhouse gas N2O). Yet, the drivers of nitrifier communities remain poorly resolved across global drylands, which cover more than 40% of terrestrial surface. A mechanistic, global scale understanding of the controls on nitrifiers is thus critical for forecasting dryland N cycling and N loss pathways under climate change and land-use pressures. Using a standardized global dryland survey spanning 98 dryland rangelands in 25 countries, we quantified the abundance of ammonia-oxidizing bacteria (AOB), and ammonia-oxidizing archaea (AOA) across contrasting vegetated and bare microsites (a defining feature of dryland landscapes). We applied (structural/linear) equation modeling to assess climatic, edaphic, geographic, grazing, and vegetation controls. Controls on nitrifier abundance differed between microsites. Vegetated microsites were mainly driven by soil resources: ammonium showed a positive relationship with AOB and the total abundance of nitrifiers, whereas soil organic C had a consistent negative effect. Bare microsites showed stronger climatic control, with AOA and total nitrifiers exhibiting a U-shaped response to mean annual temperature. We didn’t see any effects of increased grazing pressure on total nitrifiers. Overall, these results highlight microsite context as a key regulator of nitrifier communities across global dryland rangelands. They indicate that changes in vegetation cover and patch structure through their effects on vegetated–bare soil balance and canopy buffering are likely to be a key pathway by which ongoing global change restructures nitrifier abundance and nitrogen cycling in drylands.

How to cite: Alghamdi, N., Corrochano-Monsalve, M., and T. Maestre, F.: What shapes nitrifiers in drylands? Global drivers of AOA and AOB abundance across microsites, EGU General Assembly 2026, Vienna, Austria, 3–8 May 2026, EGU26-13381, https://doi.org/10.5194/egusphere-egu26-13381, 2026.

EGU26-14751 | ECS | Posters on site | SSS4.3

Mechanistic Modelling of Wetland Methane Dynamics in the JULES Land Surface Model: Representing Redox-Driven Substrate Dynamics and Microbial Switching 

Yanxin Liu, Sofie Sjogersten, Eleanor Burke, Shaun Allingham, Sarah Chadburn, Juliette Bernard, Angela Gallego-Sala, Carolina Duran-Rojas, and Richard Betts

Wetlands, as the largest natural source of methane (CH₄) emissions, have received increasing attention in climate modelling. Recognising that methanogenesis is governed by anaerobic microbial processes, some models explicitly represent methanogen activity to simulate CH₄ emissions from permanently inundated wetlands. In such models, CH₄ emissions from seasonally flooded wetlands are usually estimated using an empirical oxidation factor to represent methanotrophic consumption. However, this approach neglects an additional important effect of atmospheric oxygen ingress during hydrological drawdown: the stimulation of organic matter decomposition upon rewetting, analogous to the Birch effect in seasonally dry ecosystems.

Despite the high annual methane emissions from permanently inundated sites, some of the highest intensity CH₄ emission spikes throughout the year are exhibited by seasonally inundated systems, such as freshwater marshes, floodplain wetlands and fens. Consequently, improved mechanistic representation of biogeochemical processes in seasonally inundated wetlands is needed to robustly assess global wetland greenhouse gas contribution.

This study presents a process-based wetland biogeochemical model that explicitly represents oxygen-stimulated substrate dynamics and microbial functional differentiation. Dissolved organic carbon (DOC) is partitioned into a “dry DOC” pool that accumulates during dry periods, and a “wet DOC” pool that is replenished upon rewetting. Microbial processes include distinct aerobic and anaerobic pools, whose activities are regulated by soil water content (SWC). Aerobic microbial activity follows a Gaussian response to SWC, reflecting optimal activity under intermediate moisture conditions. Water table depth (WTD), a relatively commonly measured wetland metric, is used to infer vertical SWC profiles in the soil column through a fitted van Genuchten soil water retention curve.

The microbial-DOC framework is coupled with the Joint UK Land Environment Simulator (JULES), a community land-surface model simulating the exchanges of energy, water and carbon between the land surface and the atmosphere, which can also be used as the land surface scheme of the UK Earth System Model (UKESM). JULES drives the microbial-DOC module by providing partitioned pools of litter, soil organic carbon, and root exudates, each characterised by distinct turnover kinetics. Temperature sensitivity is represented using Arrhenius kinetics, while substrate and microbial limitations are described using Michaelis–Menten formulations. Model parameters are constrained using methane and carbon dioxide flux measurements, alongside methanogen abundance data, from flooded hardwood and palm forests in Panama.

Resolving oxygen-mediated substrate priming and microbial responses, the framework moves beyond oxidation-only representations and improves estimates of wetland carbon source–sink dynamics under climate change.

How to cite: Liu, Y., Sjogersten, S., Burke, E., Allingham, S., Chadburn, S., Bernard, J., Gallego-Sala, A., Duran-Rojas, C., and Betts, R.: Mechanistic Modelling of Wetland Methane Dynamics in the JULES Land Surface Model: Representing Redox-Driven Substrate Dynamics and Microbial Switching, EGU General Assembly 2026, Vienna, Austria, 3–8 May 2026, EGU26-14751, https://doi.org/10.5194/egusphere-egu26-14751, 2026.

EGU26-14788 | Posters on site | SSS4.3

Decadal adaptation of methanotroph affinity to peatland water table manipulations 

Lukas Kohl, Nishadi Thalagahawatta Gam Acharige, Sumudu Ranasinghe, Mohadeseh Ramezanalaghehband, Maximilian King, Carlos Palacin, Dhiraj Paul, Anuliina Putkinen, Henri Siljanen, and Eeva-Stiina Tuittila

Peatland methanotrophs mitigate greenhouse gas emissions through oxidizing methane in shallow peat layers forming a filter that removes methane during diffusive transported towards the peat surface. Beside methanotrophs abundance, the effectiveness of this filter also depends on their affinity towards methane and oxygen, which might be affected by climate-driven changes in hydrology as wel as land management practices like drainage and restoration.

Here, we quantified the long-term effects of water-table depth (WTD) and WTD manipulation on the methanotroph affinity towards methane and oxygen. Samples were collected at the Lakkasuo peatland in central Finland. Within this site, we collected samples (10-20cm depth) from four sites along a hydrological gradient formed by long-running experiments (73 years drainage for forestry, 23 years experimental water table drawdown, undrained control) and natural in-site WTD variation (undrained lower water table). We quantified affinities (kM) and specific activities (a=vmax/kM) towards methane and oxygen in laboratory incubations with 50-50 000 ppm methane and 3-21% oxygen. At the same time, we surveyed the of the methanotroph communities at these sites through quantitative PCR of mmoX and pmoA subtypes as well as targeted metagenomics of the same genes.

Methane affinity increased from control (kM = 842 ppm, 90% central posterior distribution 702-1005ppm) to forestry drained (kM = 379 (268-506) ppm) and the low water table controls (527 (434-633) ppm), but decreased in response to experimental water table drawdown (1251 (988-1557) ppm). This indicates the establishment of relatively high affinity methanotrophs in foresty drained peat and under naturally lower WTD, but not in response to experimental water table drawdown. Substrate saturation toward oxygen was evident over 5-10% oxygen, but the precision was insufficient to identify differences along the gradient. Methanotroph composition showed a shift from pmoA II dominance at the control and undrained lower water table sites to pmoA Ia dominance in experimental water table drawdown and drainage for forestry.

Our results demonstrate that significant changes in methanotroph kinetics occur in response to WTD manipulations which may need to be considered in peatland methane models. Parameters derived from pristine peatlands may not be accurate immediately after rewetting when methanotroph communities are still adapted to low methane and high oxygen concentrations.

How to cite: Kohl, L., Acharige, N. T. G., Ranasinghe, S., Ramezanalaghehband, M., King, M., Palacin, C., Paul, D., Putkinen, A., Siljanen, H., and Tuittila, E.-S.: Decadal adaptation of methanotroph affinity to peatland water table manipulations, EGU General Assembly 2026, Vienna, Austria, 3–8 May 2026, EGU26-14788, https://doi.org/10.5194/egusphere-egu26-14788, 2026.

EGU26-16794 | ECS | Orals | SSS4.3

From microbial physiology to soil carbon stabilization: Controls across land use, management, and soil types 

Jarin Jose, Bruno Glaser, Klaus Kaiser, Akshda Mehrotra, Kezia Goldmann, Luis Daniel Prada Salcedo, Ingo Schoening, Marion Schrumpf, and Qing-fang Bi

Microbial growth and carbon use efficiency (CUE) play a central role in soil organic carbon (SOC) cycling by regulating microbial biomass production and subsequent necromass contributions to persistent SOC pools. Due to dynamic responses of CUE to environmental changes, it remains unclear how microbial physiological trade-offs translate into SOC stabilization via necromass retention. In this study, we investigated how microbial respiration, growth, and CUE are regulated by land-use type, management intensity, and soil properties across 300 grassland and forest plots in three regions of Germany. We aim to disentangle the abiotic and biotic drivers of microbial contribution to SOC accumulation along gradients of land-use intensity and biodiversity.
Grasslands exhibited higher microbial growth and respiration than forests (growth ≈ 0.35 vs 0.12 mg C kg⁻¹ h⁻¹, respiration ≈ 2.3 vs 1.0 mg C kg⁻¹ h⁻¹), while CUE did not differ between land-use types. In forests, tree species strongly influenced microbial physiology with higher growth and CUE in deciduous stands than in coniferous stands. Management intensity in grasslands, particularly nitrogen inputs, exerted positive indirect effects on microbial growth and CUE, whereas forest management had predominantly negative effects on CUE through direct and indirect changes in abiotic soil properties. Microbial biomass carbon and soil pH emerged as key drivers in forests, while grasslands showed more dynamic responses, likely driven by resource availability in soil.
To examine how microbial growth and carbon use efficiency (CUE) translate into necromass accumulation, we compared organic soils derived from degraded peat with mineral soils at different depths that differ fundamentally in substrate availability and soil properties. Mineral soils contained a higher proportion of microbial-derived carbon per unit SOC than organic soils, despite greater substrate availability and higher microbial activity in organic soils, consistent with stronger microbial necromass retention in mineral soils.
Together, these results show that microbial carbon dynamics and contributions to SOC are regulated by land use, management, and soil type through distinct controls on microbial growth, carbon use efficiency, and necromass retention, thereby influencing SOC persistence across managed ecosystems.


How to cite: Jose, J., Glaser, B., Kaiser, K., Mehrotra, A., Goldmann, K., Prada Salcedo, L. D., Schoening, I., Schrumpf, M., and Bi, Q.: From microbial physiology to soil carbon stabilization: Controls across land use, management, and soil types, EGU General Assembly 2026, Vienna, Austria, 3–8 May 2026, EGU26-16794, https://doi.org/10.5194/egusphere-egu26-16794, 2026.

EGU26-16997 | ECS | Posters on site | SSS4.3

Linking cell division and storage: seasonally intensifying drought shifts microbial C allocation towards storage, with relative fungal resistance 

Lisa Stein, Alberto Canarini, Lucia Fuchslueger, Hannes Schmidt, Victoria Marie Ritter, Michael Bahn, Andreas Schaumberger, and Andreas Richter

Microbial communities are central to soil biogeochemical cycling. They assimilate organic carbon and either allocate it to biomass or return to the atmosphere as CO₂. Assimilated carbon can support cell division (growth sensu stricto) and also the synthesis of storage compounds or osmolytes (growth sensu lato). Yet, microbial growth is commonly quantified solely based on cell division. Under steady-state conditions, the partitioning of carbon between replicative and non-replicative growth may remain relatively constant (balanced growth), but climate change likely alters microbial growth dynamics and C allocation to different processes (unbalanced growth).

In this study, we investigated responses of microbial growth and storage compound synthesis in a multifactorial climate change experiment (ClimGrass) that included 4 treatments: (i) future climate conditions (elevated temperatures, +3°C, and increased atmospheric CO₂ concentrations, +300 ppm), (ii) a twelve-week summer drought, and (iii) a combination of future climate conditions and drought, as well as (iv) an ambient control. For this study, samples were collected from May (at the onset of drought) to August to capture intensifying drought conditions. We measured deuterium incorporation from 2H-labelled water into PLFAs (phospholipid fatty acids) to quantify growth, and into NLFAs (neutral lipid fatty acids) and PHB (poly-3-hydroxybutyrate) to assess storage compound synthesis.

Over the progression of drought, bacterial mass-specific growth rates decreased more strongly than fungal growth rates, with fungi showing greater relative resistance to drought. Mass-specific NLFA production rates increased over the sampling period in all treatments, suggesting a seasonal increase in storage compound production that was not affected by drought or future climate conditions. However, the ratio of NLFA production to PLFA-derived growth indicated a shift in carbon allocation toward storage NLFA synthesis under drought. In contrast, PHB production rates exhibited no clear seasonal pattern. Yet, normalized to bacterial growth, PHB synthesis also significantly increased under drought in July and August.

In summary, although overall microbial activity declines, drought shifts C allocation from replicative growth to storage compound synthesis, consistent with microbes responding to prolonged summer droughts. This change in allocation of acquired carbon emphasizes the need to quantify both replicative (cell division) and non-replicative (storage) growth to interpret microbial responses and ecosystem feedbacks.

How to cite: Stein, L., Canarini, A., Fuchslueger, L., Schmidt, H., Ritter, V. M., Bahn, M., Schaumberger, A., and Richter, A.: Linking cell division and storage: seasonally intensifying drought shifts microbial C allocation towards storage, with relative fungal resistance, EGU General Assembly 2026, Vienna, Austria, 3–8 May 2026, EGU26-16997, https://doi.org/10.5194/egusphere-egu26-16997, 2026.

EGU26-17213 | Orals | SSS4.3

Microbes Persist: how soil moisture regimes shape the ecophysiology and C cycling of wild soil microbiomes 

Jennifer Pett-Ridge, Peter Chuckran, Linnea Hernandez, Petar Penev, Katerina Estera-Molina, Gareth Trubl, Jeff Kimbrel, Alexa Nicolas, Mary Firestone, Jillian Banfield, and Steven Blazewicz

Soil water availability is a key driver of microbial function and exerts influence on a variety of temporal scales—ranging from short-term pulse dynamics to long-term seasonal and annual precipitation patterns. Determining the impact of changing water dynamics on microbial growth and activity is crucial for assessing how changes in weather patterns may impact soil functionality. In Mediterranean grasslands, the first substantial annual rainfall after months of drought is a driver of substantial soil microbial activity and coincides with a pulse of CO2 emissions that can equal 10% of annual ecosystem productivity. To understand how altered precipitation regimes in semi-arid soils affect the microbial ecophysiological traits associated with soil carbon cycling, we use quantitative stable isotope probing (qSIP) to interrogate Who is where? and What are they doing? in wild soil communities collected during multiple points in the Mediterranean climate water-year. We also use multi-omics approaches, including metagenomics, metatranscriptomics, lipidomics, and metabolomics. Our qSIP results indicate only a fraction of the microbial community is actively growing at any moment or location; at the start of the growing season, the growing portion was 28%, 48% and 58% at wet, intermediate and dry sites. In a year-long study examining growth rates (measured with metagenomic qSIP) at three soil depths, we found distinct groups of actively growing organisms associated with seasonal changes in soil moisture. In a second study, we examined short-term pulse dynamics following the rewetting of dry soil. The first rain event after the dry season is a period of high growth and mortality where a large portion of annual carbon cycling occurs. To assess the impact of drought intensity on the rewetting response, soils were collected from two precipitation treatments in the field (50 or 100% mean annual precipitation) and rewet in a laboratory incubation. Wet-up triggered a rapid succession of bacterial populations, a large increase in the number of viruses (vOTUs), and strong indications of active viral lysis. We found that reduced precipitation influenced the composition of organic compounds in the soil—increasing tannin-like compounds and reducing the concentration of lipid-like compounds and changes the structure of trophic networks. Using metagenomics and 16S rRNA gene qSIP, we tracked growth and mortality following rewetting. We found that a history of limited moisture (50% precipitation) reduced both growth and mortality, demonstrating the interplay between annual/seasonal dynamics and short-term responses. Additionally, we found that growth after rewetting can be predicted from genomic traits such as genome size, codon bias, and GC content—indicating key features of fast-responding taxa to soil water pulse-dynamics. These results point to genome level traits that are predictive of microbial growth responses, and show how differences in legacy precipitation can influence microbial activities long after changes in soil moisture are no longer detectable.

How to cite: Pett-Ridge, J., Chuckran, P., Hernandez, L., Penev, P., Estera-Molina, K., Trubl, G., Kimbrel, J., Nicolas, A., Firestone, M., Banfield, J., and Blazewicz, S.: Microbes Persist: how soil moisture regimes shape the ecophysiology and C cycling of wild soil microbiomes, EGU General Assembly 2026, Vienna, Austria, 3–8 May 2026, EGU26-17213, https://doi.org/10.5194/egusphere-egu26-17213, 2026.

EGU26-17390 | ECS | Posters on site | SSS4.3

Recurrent drought imprints ecological memory on microbial carbon allocation 

Cornelia Rottensteiner, Valentin Waschulin, Dagmar Woebken, Michael Bahn, and Andreas Richter

Global warming increases the probability and frequency of droughts, with major consequences for soil carbon cycling. Soil microorganisms are particularly sensitive to drought because decreasing soil water content imposes osmotic stress and restricts the diffusion of substrates, enzymes, and metabolites. Previous studies have shown that drought reduced bacterial growth rates by more than half, whereas fungal and actinobacterial growth was comparatively resistant. However, in a future climate where droughts are projected to become more frequent, soils will be exposed to repeated drought events, and it remains unclear how drought history shapes microbial growth and carbon allocation during subsequent drought.

Here, we investigate how recurrent summer drought affects microbial growth, respiration, and storage compound synthesis in a unique long-term field experiment in an alpine grassland. Plots (n=4) have been exposed to 1, 3, 7, or 17 consecutive years of summer drought using rain-out shelters, with ambient plots as controls. We applied 2H-vapor-FAME-SIP (deuterium water-vapor stable isotope probing) to quantify microbial growth based on PLFAs (phospholipid fatty acids) and microbial carbon storage based on NLFA (neutral lipid fatty acid) and PHB (poly-3-hydroxybutyrate) production. Microbial respiration was determined by infrared gas analysis and microbial biomass by the chloroform-fumigation-extraction method.

Our results show that microbial respiration progressively declines with drought history. At peak drought, respiration was reduced by 44% after a single summer drought. This reduction intensified to 62%, 66%, and 75% after 3, 7, and 17 years of recurrent summer drought, respectively. This pattern indicates a strong drought legacy effect, consistent with the formation of ecological memory which increasingly constrains microbial activity. We will also present results from microbial growth and storage compound synthesis measurements and discuss how microbial carbon allocation patterns change with drought history.

By linking drought history to microbial growth, respiration, and storage compound synthesis, this study reveals how repeated drought alters carbon allocation of soil bacteria and fungi, with consequences for soil carbon persistence and carbon–climate feedbacks under global change.

This study is part of FWF COE7 “Microbiomes drive planetary health”.

How to cite: Rottensteiner, C., Waschulin, V., Woebken, D., Bahn, M., and Richter, A.: Recurrent drought imprints ecological memory on microbial carbon allocation, EGU General Assembly 2026, Vienna, Austria, 3–8 May 2026, EGU26-17390, https://doi.org/10.5194/egusphere-egu26-17390, 2026.

EGU26-18789 | ECS | Posters on site | SSS4.3

The role of bacteria in soil carbon dynamics of managed boreal forests 

Daniel Tajmel and Michael Gundale

Boreal forests are significant net carbon sinks and play an essential role in the global carbon cycle. However, such forests are often subject to management practices such as clear-cutting. After clear-cutting, most root-associated mycorrhizal fungi die along with their tree hosts, opening a niche for saprotrophic microorganisms, including soil bacteria. With the competition eliminated, soil bacterial activity is expected to increase. Conversely, as forests regrow, mycorrhizal fungi suppress soil saprotrophs, potentially decreasing soil organic matter decomposition.

In this study, we utilized two parallel chronosequences in Sweden, each consisting of 18 stands that varied in time since disturbance, representing forest rotational management and a natural reference, a wildfire chronosequence. In each forest stand, we trenched plots and removed vegetation to exclude mycorrhizal fungi. We then measured bacterial growth in soil samples across the chronosequences. We hypothesized that (1) bacterial growth would increase after clear-cutting and forest fire, then decrease as forests regrow due to suppression by mycorrhizal fungi; and (2) bacterial growth would be higher in trenched plots than in non-trenched plots at each forest stand due to the elimination of competition with mycorrhizal fungi.

Contrary to both hypotheses, bacterial growth was lowest following forest clear-cutting and wildfire. With forest regrowth, bacterial growth increased. Interestingly, following clear-cutting, bacterial growth peaked when forest productivity was highest (40–70 years post-clear-cutting). Trenching also decreased bacterial growth along both the rotational forest management and wildfire chronosequences. These unexpected results suggest that bacterial communities are negatively affected by plant removal, likely due to their strong dependence on readily available carbon from root exudates. 

How to cite: Tajmel, D. and Gundale, M.: The role of bacteria in soil carbon dynamics of managed boreal forests, EGU General Assembly 2026, Vienna, Austria, 3–8 May 2026, EGU26-18789, https://doi.org/10.5194/egusphere-egu26-18789, 2026.

EGU26-19325 | ECS | Posters on site | SSS4.3

From short- to long-term warming: microbial metabolic responses control soil carbon and nitrogen losses 

Ana Leticia Zevenhuizen Martínez, Andreas Richter, Jinyuan Yu, Niel Verbrigghe, Ivan A. Janssens, Niki Leblans, Bjarni D. Sigurdsson, and Sara Marañón-Jiménez

Although high-latitude soils are undergoing significant warming, with potential consequences for soil carbon (C) and nitrogen (N) cycling, the way in which warming duration modulates microbial physiological responses and associated changes in soil C and N pools is not well understood. Here, we used a natural geothermal gradient ranging from +0 to +12.3 °C to assess the effects of short-term (1 year), medium-term (5 to 9 years), and long-term (>50 years) soil warming on microbial biomass C, microbial physiology (mass-specific respiration and growth), carbon use efficiency (CUE), and soil C and N pools.

Across all warming durations, microbial biomass C and CUE decreased with increasing temperature. Warming consistently accelerated microbial metabolic rates, with mass-specific respiration increasing more than mass-specific growth, thereby explaining the observed reduction in CUE. Warming also reduced plant litter biomass while increasing its N concentration, suggesting accelerated litter decomposition under enhanced microbial activity. The magnitude of these physiological and functional responses was attenuated after nine years of warming, indicating a partial acclimation of microbial metabolism to sustained warming. While cumulative soil C and N losses were not yet detectable after one year of warming, they became evident after several years of exposure. This delayed emergence of C and N losses suggests that microbial communities gradually adjusted to the new thermal conditions, leading to partial acclimation once substrate availability had been substantially altered.

These results suggest that warming-induced changes in soil C and N dynamics are governed by the interaction between intrinsic microbial temperature sensitivity and progressive substrate depletion, as mediated by their effects on microbial biomass and physiology. Our findings improve the understanding of how microbial physiological responses shape soil C and N losses over time in a warming climate.

How to cite: Zevenhuizen Martínez, A. L., Richter, A., Yu, J., Verbrigghe, N., Janssens, I. A., Leblans, N., Sigurdsson, B. D., and Marañón-Jiménez, S.: From short- to long-term warming: microbial metabolic responses control soil carbon and nitrogen losses, EGU General Assembly 2026, Vienna, Austria, 3–8 May 2026, EGU26-19325, https://doi.org/10.5194/egusphere-egu26-19325, 2026.

EGU26-20019 | ECS | Posters on site | SSS4.3

The temperature dependence of the decomposition of soil organic matter is shaped by both microbial thermal traits and substrate quality 

Daniela Guasconi, Kodie Chontos Blockström, Albert Carles Brangarí, Honorine Dumontel, Lettice Hicks, Maja Siegenthaler, Rebecca Varney, Johannes Rousk, and Stefano Manzoni

The net effect of temperature variations on soil organic carbon (SOC) budgets depends on the balance of carbon (C) losses via respiration and C stabilization. Respiration increases monotonically with temperature, whereas the response of C stabilization to temperature is less clear. Microbial residues, formed via microbial growth, can get stabilized in soil and thus contribute to SOC accumulation. Here we test how the temperature dependence of the microbial SOC use for respiration (proxy for C losses) and growth (proxy for C stabilization) varies across climatic, edaphic, and substrate quality gradients, and how it responds to experimental warming. We hypothesized that the temperature dependence of microbial decomposition of organic matter is primarily governed by two factors: (i) the thermal traits of microbial communities, and (ii) SOC quality. To test these hypotheses, we collated more than 200 paired growth and respiration thermal response curves from over 20 published studies spanning a wide range of climates. Thermal traits of microbial communities (eg. minimal temperature, Tmin) were derived from microbial growth response curves, and temperature sensitivity was estimated as the ratio of microbial uptake rates at two reference temperatures offset by 10°C (Q10). Environmental temperatures at sampling sites were used as a proxy for climatic forcing, and C uptake per unit SOC (i.e., microbial assimilability) at a reference temperature as a proxy of SOC quality. Preliminary results indicate that warmer climates select for warm-shifted microbial thermal traits (i.e., higher Tmin values), and that temperature sensitivities are higher for lower-quality SOC. In addition, experimental warming alters microbial thermal responses in ways consistent with thermal adaptation. These findings allow us to describe the relative contributions of microbial thermal traits and of substrate quality in shaping the temperature dependence of SOC decomposition, thereby improving predictions of soil carbon fluxes under future climate scenarios.

How to cite: Guasconi, D., Chontos Blockström, K., Brangarí, A. C., Dumontel, H., Hicks, L., Siegenthaler, M., Varney, R., Rousk, J., and Manzoni, S.: The temperature dependence of the decomposition of soil organic matter is shaped by both microbial thermal traits and substrate quality, EGU General Assembly 2026, Vienna, Austria, 3–8 May 2026, EGU26-20019, https://doi.org/10.5194/egusphere-egu26-20019, 2026.

EGU26-20087 | ECS | Orals | SSS4.3

Warming enhances nitrogen priming of N20 emissions in subarctic soils under high nitrogen availability 

Jinyuan Yu, Ana Leticia Zevenhuizen, Martina Gonzalez Mateu, Stefania Mattana, Andreas Richter, and Sara Marañón-Jiménez

High-latitude soils store a disproportionate share of global soil carbon (C)  and nitrogen (N) and are expected to play a critical role in future greenhouse gas feedbacks to climate warming. Despite this importance, the mechanisms controlling N losses from subarctic soils under warming, particularly nitrous oxide (N₂O) emissions, remain poorly constrained, largely due to strong interactions between temperature and microbial resource availability. Here, we assessed how warming interacts with C and N availability to regulate microbial N₂O production and N priming in a subarctic grassland ecosystem.

Soils were collected from a subarctic grassland exposed to a natural geothermal warming gradient for two years and subsequently incubated in the laboratory at the same in situ temperatures (ambient, +2 °C, and +6 °C). We applied four substrate addition treatments (water control, glucose, ammonium nitrate, and combined glucose + ammonium nitrate) using highly 13C and 15N-enriched substrates, allowing isotopic partitioning of N2O sources and quantification of N priming.

Warming increased total N₂O emissions across treatments, but the magnitude and underlying mechanisms strongly depended on substrate availability. Nitrogen addition alone caused substantial accumulation of NH₄⁺ and NO₃⁻, stimulated N₂O emissions, and enhanced N₂O derived from native soil N, indicating strong positive N priming. This priming effect intensified with increasing temperature, consistent with accelerated microbial N turnover, and increased denitrification and nitrification rates under elevated inorganic N availability. In contrast, C addition reduced inorganic N accumulation and strongly suppressed N₂O emissions, indicating enhanced microbial N immobilization. Combined C and N addition reduced NH₄⁺ accumulation but not NO₃⁻ accumulation, moderated the temperature sensitivity of N₂O emissions, and shifted N₂O production toward substrate-derived N, suggesting tighter microbial coupling of C and N metabolism under balanced resource supply, reducing reliance on native soil N pools even under warming.

Together, these results show that warming-induced N₂O emissions from subarctic soils are highly contingent on microbial resource balance. Carbon availability can constrain N losses under warming, whereas excess N amplifies priming-driven emissions, with important implications for predicting high-latitude greenhouse gas feedbacks and soil N losses under climate change.

How to cite: Yu, J., Leticia Zevenhuizen, A., Gonzalez Mateu, M., Mattana, S., Richter, A., and Marañón-Jiménez, S.: Warming enhances nitrogen priming of N20 emissions in subarctic soils under high nitrogen availability, EGU General Assembly 2026, Vienna, Austria, 3–8 May 2026, EGU26-20087, https://doi.org/10.5194/egusphere-egu26-20087, 2026.

EGU26-20417 | ECS | Orals | SSS4.3

Microbial mechanisms controlling methane-temperature hysteresis in wetlands. 

Yngvild Bjørdal, Kathrin Marina Bender, Victoria Sophie Martin, Liabo Motleleng, Alena Didriksen, Bente Lindgård, Eva Marie Breines, Laureen Sarah Ahlers, Oliver Schmidt, Torben Røjle Christensen, Maria Scheel, Tilman Schmider, Andreas Richter, Andrea Söllinger, and Alexander Tøsdal Tveit

Methane (CH4)-temperature hysteresis, i.e., significantly higher CH₄ emissions in autumn compared to spring at equivalent temperatures, have been observed in wetlands globally. However, the biological basis for these seasonal changes in the effect of temperature on wetland CH₄ emissions remain unexplained.

Peat soil from four Arctic and sub-Arctic sites: Svalbard, Northern Norway, Arctic Canada, and Greenland, were collected for investigations of the mechanisms behind CH4-temperature hysteresis. In the laboratory, under anoxic condition, the peat soils were exposed to temperature changes in weekly 2 °C increments, from 2 °C to 10 °C and back to 2 °C, simulating an Arctic spring to autumn transition. Methane accumulation rates, methanogen substrate concentrations, total microbial and archaeal RNA and DNA content, and community composition and size were monitored throughout the experiments.

Three of the four examined soils (Svalbard, Northern Norway and Greenland) expressed significantly higher CH4 production rates during cooling compared to warming. This observation of CH4-temperature hysteresis under anoxic condition demonstrate that CH4-temperature hysteresis can result from anaerobic processes, while experiment replication demonstrated that CH4-temperature hysteresis, or the lack of it, were reproducible for the respective peatlands.

The timing and extent of accumulation and depletion of methanogenic substrates and the enhanced methane production rates during cooling in the three CH4 hysteresis-positive soils suggested that the methanogenic community itself, triggered by high substrate availability and a sufficient maximum temperature, is the major driver of CH4-temperature hysteresis. Furthermore, the observation that both soils dominated by acetoclastic (Svalbard and Greenland) and hydrogenotrophic (Northern Norway) methanogens can express CH4-temperature hysteresis, demonstrate that hysteresis is not restricted to one methanogenic pathway.

As only minor changes in the methanogenic community composition were observed during the experiments, CH4-temperature hysteresis was indicated to result from physiological responses of the existing methanogenic community. In the Svalbard soil, increased methanogen population sizes, as indicated by qPCR, suggested faster methanogen growth rates during cooling, potentially explaining hysteresis, but this effect was not observed in the remaining two hysteresis positive soils. Thus, other physiological rate-increasing mechanisms are also required to explain hysteresis. Correspondingly, increased expression of genes for rate-limiting enzymes in methanogenesis, as a response to temperature and substrate increase, were demonstrated in a separate heating experiment (2 °C to 10 °C) done on Svalbard peat soil.

We propose the following CH4-temperature hysteresis mechanism: Temperature induced imbalances between fermentation and methanogenesis at low temperatures and during heating leads to high methanogen substrate concentrations. The subsequent combination of excess substrate and reaching sufficiently high temperatures promote methanogen activity through faster growth and the buildup of rate-limiting enzyme pools for methanogenesis in the form of more new cells or larger enzyme stocks per cell. This expansion of the methane production bottleneck allows enhanced CH₄ production rates during subsequent cooling, until the depletion of substrate pools.

How to cite: Bjørdal, Y., Bender, K. M., Martin, V. S., Motleleng, L., Didriksen, A., Lindgård, B., Breines, E. M., Ahlers, L. S., Schmidt, O., Røjle Christensen, T., Scheel, M., Schmider, T., Richter, A., Söllinger, A., and Tøsdal Tveit, A.: Microbial mechanisms controlling methane-temperature hysteresis in wetlands., EGU General Assembly 2026, Vienna, Austria, 3–8 May 2026, EGU26-20417, https://doi.org/10.5194/egusphere-egu26-20417, 2026.

EGU26-21005 | ECS | Posters on site | SSS4.3

Nutrient Supply Shapes Microbial Assembly in Dryland Biocrusts: Taxon-Specific Responses and Network Reorganization 

Lina Zhao, Ning Chen, Bettina Weber, Shaobin Gu, and Xinrong Li

Biological soil crusts (biocrusts) cover ~30% of global drylands and regulate biogeochemical cycles through microbial metabolic activities. Although nutrient scarcity profoundly influences biocrust microbial communities, the general principles governing their nutrient response dynamics remain unclear. Here, we employed controlled microcosms to investigate how differential nutrient supply reshaped the community structure and interspecies interactions of both biocrust bacterial and fungal assemblages. Our findings revealed that increased nutrient supply drove a shift from K- to r-strategists in bacterial communities, while fungal assemblages exhibited distinct response patterns among abundant, intermediate, and rare taxa. Network analysis demonstrated that nutrient supply increased node number, link number, average degree, and negative correlations, indicating intensified interactions in both bacterial and fungal communities. Keystone taxa analysis identified three oligotrophic bacteria, three copiotrophic bacteria, and two fungal hub taxa consistently present across nutrient levels. Furthermore, both bacterial and fungal community structures, as well as their interaction networks, were strongly correlated with soil nutrient availability, particularly total phosphorus, available nitrogen, and available potassium. This study establishes a unified mechanistic framework for nutrient-driven microbial assembly in drylands, highlighting taxon-specific responses and interactions. The findings provide actionable strategies for ecological restoration through optimized nutrient management and targeted manipulation of keystone microbial taxa.

How to cite: Zhao, L., Chen, N., Weber, B., Gu, S., and Li, X.: Nutrient Supply Shapes Microbial Assembly in Dryland Biocrusts: Taxon-Specific Responses and Network Reorganization, EGU General Assembly 2026, Vienna, Austria, 3–8 May 2026, EGU26-21005, https://doi.org/10.5194/egusphere-egu26-21005, 2026.

EGU26-486 | ECS | Posters on site | SSS4.2

The legacy of long-term fertilization reshapes functional partitioning of the rhizosphere and hyphosphere through a plant-mediated cascade effect 

Cheng Peng, Thomas Reitz, Evgenia Blagodatskaya, Marie-Lara Bouffaud, and Mika Tarkka

The rhizosphere and hyphosphere are critical interfaces for plant-microbe interactions. However, the regulatory impact of long-term fertilization on the functional niche partitioning between these two compartments remains poorly understood. To address this, we conducted a pot experiment with wheat grown in preconditioned soils from a century-old fertilization trial. A 41-μm nylon mesh was used to physically separate the rhizosphere from the hyphosphere, enabling independent measurements of enzyme activities, microbial biomass, and available nutrient concentrations in each compartment. Our results showed that nitrogen (N) availability was the dominant factor among the fertilization regimes influencing plant performance, belowground C, nutrient dynamics, and prokaryote communities. Under N-limited conditions, plant–fungus cooperation was intensified, leading to a larger amount (24-41%) of dissolved organic C than in N-rich treatments. The dissolved organic C enrichment induced in the hyphosphere was 12-16% higher than that induced in the rhizosphere. This is evidenced by the strong positive correlation between arbuscular mycorrhizal fungal colonisation and hyphosphere dissolved organic C enrichment. In the fully mineral-fertilized NPK treatment, C-, N- and P-acquiring enzyme activities were 43-102% higher in the rhizosphere compared to the hyphosphere. Under combined manure and mineral fertilization, the highest overall levels of enzyme activities, nutrient availability, dissolved organic carbon, and microbial biomass carbon were observed in both compartments, but no differentiation between rhizosphere and hyphosphere was evident, reflecting the homogeneity of the microhabitats in these microbial functional traits. Linear discriminant analysis revealed that fertilization regimes significantly shaped microbial community composition, with combined manure and mineral fertilization consistently enriching Nitrososphaeria in both compartments. However, niche differentiation was evident between the two microhabitats: the rhizosphere uniquely recruited Planctomycetota under PK fertilization, whereas the hyphosphere was characterized by an enrichment of Chloroflexi under PK. This suggests that while fertilization drives broad taxonomic shifts, the rhizosphere imposes specific selective filters distinct from the hyphosphere. Together, these findings demonstrate that distinct fertilization regimes restructure the spatial partitioning of dissolved organic C dynamics and microbial functioning in the rhizosphere–hyphosphere by plant mediated cascading effect. Our results underscore the necessity of evaluating the rhizosphere and hyphosphere as distinct compartments to elucidate belowground C–N interactions under varying fertilization regimes. Accordingly, future research should examine these compartments separately to accurately capture fertilization-induced shifts in belowground C–N dynamics.

How to cite: Peng, C., Reitz, T., Blagodatskaya, E., Bouffaud, M.-L., and Tarkka, M.: The legacy of long-term fertilization reshapes functional partitioning of the rhizosphere and hyphosphere through a plant-mediated cascade effect, EGU General Assembly 2026, Vienna, Austria, 3–8 May 2026, EGU26-486, https://doi.org/10.5194/egusphere-egu26-486, 2026.

EGU26-517 | ECS | Posters on site | SSS4.2

Microbial community composition and functional potential changes along a century-scale geothermally warmed soil temperature gradient   

Anne Peter, Jana Kehr, Christopher Poeplau, and Damien Finn

Understanding changes in soil organic matter (SOM) dynamics in response to long-term warming is central to predicting carbon stocks under future climate-change scenarios. This study investigates how century-scale soil warming influences microbial community composition and functional potential using a subarctic deciduous forest located on a geothermal hotspring (Takhini Hot Springs, Yukon Territory, Canada) as a model system. The soils affected by this natural geothermal gradient, which has been documented as being active for at least 100 years, range between 0 and 5°C above ambient surface temperature, with 40 - 60 cm subsoils reaching up to +11°C. Previous analyses of SOM from the study site show a decline in C:N ratios with increasing soil temperature, while nitrogen stocks remain largely unchanged, suggesting long-term alterations in organic matter inputs and decomposition processes. This system provides a unique opportunity to study long-term warming effects under field conditions while avoiding artefacts associated with short-term manipulations.

Topsoil and subsoil microbial community population size, taxonomy and functional gene composition at topsoil mean annual temperatures of 3.5, 4.2 and 5.3 and 8.3°C were assessed using qPCR and whole-genome shotgun sequencing. As soil texture and humic acid content varied along the gradient (e.g., 8.5 % to 25.9 % clay), an adapted extraction protocol optimised for humic-rich soils was used for DNA extraction, together with the use of an internal whole-cell spike-in standard of Gram-positive and negative halophilic extremophiles in all qPCR assays to correct for differential extraction efficiency and PCR inhibition. Metagenomic data is used to characterise microbial community shifts and to identify functional genes related to carbon, nitrogen and phosphorus cycling, as well as traits linked to microbial metabolic strategies. Metagenomic analyses indicate that long-term warming restructures microbial communities in a depth-dependent manner, characterised by increased Actinobacteriota in warmer deep soils, reduced Planctomycetota and Chloroflexi with warming, and higher surface-layer abundance of Amorphea in cooler plots. PCA of phylum-level communities revealed clear depth stratification (p<0.001) and warming effects (p=0.003), with surface and subsoil samples clustering separately and warmer plots diverging along PC1.

By integrating microbial community data with soil physicochemical properties, this study aims to clarify how sustained warming alters microbial functional potential and SOM processing in subarctic soils.  Decreases in the relative abundance of eukaryotes (Amorphea) with increasing temperature, and a concomitant increase in Gram-positive Actinobacteriota associated with plant biomass cycling and secondary metabolite production in soils, suggests that temperature-dependent shifts in organisms responsible for SOM cycling may occur under soil warming of > 5 °C. The findings will contribute to improving predictions of climate-driven changes in soil biogeochemistry and the long-term stability of SOM under warming.

How to cite: Peter, A., Kehr, J., Poeplau, C., and Finn, D.: Microbial community composition and functional potential changes along a century-scale geothermally warmed soil temperature gradient  , EGU General Assembly 2026, Vienna, Austria, 3–8 May 2026, EGU26-517, https://doi.org/10.5194/egusphere-egu26-517, 2026.

EGU26-811 | ECS | Posters on site | SSS4.2

Microbe-Assisted Remediation Potential in Arsenic-Impacted Agricultural Soils of Laksar, Uttarakhand 

Shubha Dixit, Arpita Maurya, Rajesh Singh, Shruti Singh, and Manoj Kumar

Arsenic contamination in agricultural soils poses a major threat to environmental safety, food security, and sustainable farming systems across South Asia. This study investigates the extent of arsenic accumulation in agricultural soils of Haridwar district, Uttarakhand, and evaluates microbe-assisted remediation as a potential strategy to mitigate arsenic toxicity. Ten soil samples from arsenic-affected sites were analyzed for physicochemical, elemental, and microbial characteristics. The soils were predominantly sandy loam and exhibited moderate ionic strength (EC 316 µS/cm), neutral pH (7.2), reducing redox potential, and low moisture content. CHNS profiles (C/N = 8.83) and (C/H ratios =2.40) indicated nutrient-limited conditions that constrain microbial redox processes. Arsenic concentrations reached 11.4 ppm along with elevated levels of Cu, Zn, Fe, Mn, and Se. Strong positive correlations of As with pH (R2 = 0.904), iron (R2 = 0.808), and manganese (R2 = 0.797) suggested alkaline conditions and Fe–Mn redox cycling are key drivers of arsenic mobilization. High phosphate, calcium, and magnesium further contributed to competitive desorption and enhanced arsenic solubility. Microbial functional assessments using CLPP and enzyme assays revealed suppressed metabolic activity and reduced carbon utilization under metal stress, reflecting ecosystem perturbation. Overall, the findings demonstrate that the interplay of soil geochemistry and microbial activity drives arsenic behavior in agricultural systems. Microbe-assisted approaches focused on modulating redox conditions, stabilizing Fe–Mn phases, and improving nutrient balance offer a promising pathway for reducing arsenic bioavailability and restoring soil health in contaminated agricultural landscapes.

Keywords: Arsenic contamination, Agricultural soils, Soil geochemistry, Microbe-assisted remediation

How to cite: Dixit, S., Maurya, A., Singh, R., Singh, S., and Kumar, M.: Microbe-Assisted Remediation Potential in Arsenic-Impacted Agricultural Soils of Laksar, Uttarakhand, EGU General Assembly 2026, Vienna, Austria, 3–8 May 2026, EGU26-811, https://doi.org/10.5194/egusphere-egu26-811, 2026.

EGU26-1134 | ECS | Posters on site | SSS4.2

Generalized additive models confirm pH and emphasize electrical conductivity as key drivers of European soil bacterial diversity 

Patrik Heintze, Amirhossein Hassani, Dani Or, Panos Panagos, Alberto Orgiazzi, Maëva Labouyrie, Julia Köninger, Inma Lebron, David A. Robinson, and Nima Shokri

The soil microbiome provides indispensable ecosystem services, including nutrient and organic matter cycling, affecting exchange of energy, water, and carbon at the land-atmosphere interface, as well as provisioning an important environmental resilience layer through buffering natural and anthropogenic stressors. We applied generalized additive models (GAMs) to the largest methodologically consistent dataset of soil eDNA at continental scale. Based on colocated eDNA and soil parameter measurements from the LUCAS 2018 soil biodiversity dataset (Labouyrie et al., 2023; Orgiazzi et al., 2022) and ERA5-Land climate reanalysis data (Muñoz Sabater, 2019) for the 30-year period pre-dating sample collection (1988–2017), we (i) identify key drivers shaping the composition of soil bacterial communities, (ii) quantify changes in soil bacterial richness and diversity forced by soil properties, climatic effects, and anthropogenic pressures, and (iii) assess interaction effects between the different drivers. Multiple feature selection methodologies were employed and cross-checked to reduce the number of predictors without conceding prediction accuracy. A GAM including pH, electrical conductivity, and top layer bulk density (0–10 cm) as covariates can explain 73.3% of variance (adjusted R² = 0.727) in the Shannon entropy of samples. While land cover is commonly considered an important categorical determinant of soil bacterial diversity, our results suggest that land cover per se is no immediate factor, but instead land cover types constrain the physicochemical habitats on site, which are in turn the immediate drivers of bacterial diversity.


References

Labouyrie, M., Ballabio, C., Romero, F., Panagos, P., Jones, A., Schmid, M. W., Mikryukov, V., Dulya, O., Tedersoo, L., Bahram, M., Lugato, E., Van Der Heijden, M. G. A., & Orgiazzi, A. (2023). Patterns in soil microbial diversity across Europe. Nature Communications, 14(1), 3311. https://doi.org/10.1038/s41467-023-37937-4

Muñoz Sabater, J. (2019). ERA5-Land monthly averaged data from 1950 to present [Dataset]. Copernicus Climate Change Service (C3S) Climate Data Store (CDS). https://doi.org/10.24381/CDS.68D2BB30

Orgiazzi, A., Panagos, P., Fernández‐Ugalde, O., Wojda, P., Labouyrie, M., Ballabio, C., Franco, A., Pistocchi, A., Montanarella, L., & Jones, A. (2022). LUCAS Soil Biodiversity and LUCAS Soil Pesticides, new tools for research and policy development. European Journal of Soil Science, 73(5), e13299. https://doi.org/10.1111/ejss.13299

How to cite: Heintze, P., Hassani, A., Or, D., Panagos, P., Orgiazzi, A., Labouyrie, M., Köninger, J., Lebron, I., Robinson, D. A., and Shokri, N.: Generalized additive models confirm pH and emphasize electrical conductivity as key drivers of European soil bacterial diversity, EGU General Assembly 2026, Vienna, Austria, 3–8 May 2026, EGU26-1134, https://doi.org/10.5194/egusphere-egu26-1134, 2026.

EGU26-1229 | ECS | Posters on site | SSS4.2

Can the conversion to perennial cereal crops simultaneously promote SOC formation and stimulate microbial N-mining? 

Xiaojing Yang, Lettice Hicks, and Johannes Rousk

Enhancing soil carbon (C) storage is critical for climate mitigation, and perennial systems for cereal agriculture have emerged as a promising strategy due to their sustained root-derived C inputs. However, an increased supply of labile C may also lead to a higher demand for nitrogen (N), whereby microbes decompose existing soil organic matter (SOM) to acquire N, termed N-mining, potentially triggering a priming effect that offsets C storage. Whether perennial cropping primarily promotes microbial C assimilation and subsequent production of SOM or accelerates SOM mineralization remains uncertain. Moreover, the stand age of perennial crops can substantially modify root-exudate C, thereby altering microbial C availability and shifing microbial decomposition strategies. But how perennial stand age regulates these coupled plant-soil-microbe processes is still poorly understood.

Here, we examined how converting annual crops to perennial intermediate wheatgrass (Thinopyrum intermedium, Kernza®) influences microbial decomposition dynamics and N-mining. Soils were collected from the annual cropping system, the first-year Kernza stand, and the ninth-year stand. Root-exudate inputs were simulated by semi-continuous additions of ¹³C-glucose over 20 days, applied at the daily exudate-C level of the perennial crop and at a five-fold higher intensity. We quantified the real-time soil organic C mineralization, organic N mineralization with the 15N pool dilution method, and microbial growth and biomass to resolve the balance between C storage and SOC loss, N mining from SOM, and its microbial response underpinning the simulated rhizosphere. We hypothesized that the conversion to perennial crops would enhance microbial N-mining and priming effects, particularly in young stands, whereas older stands progressively shift toward more efficient microbial C utilization and higher SOM stabilization potential. Based on the results, we found that glucose applied at levels matching those in the perennial crop rhizosphere induced fast (within days) and sustained (for weeks) priming response. Across addition levels, young perennial crops exhibited consistently higher cumulative priming than older perennial crops. These temporal patterns best matched responses in bacterial growth, suggesting a bacterial control of the young perennial rhizosphere priming effect and indicating a greater need for bacteria to acquire organic N there.

How to cite: Yang, X., Hicks, L., and Rousk, J.: Can the conversion to perennial cereal crops simultaneously promote SOC formation and stimulate microbial N-mining?, EGU General Assembly 2026, Vienna, Austria, 3–8 May 2026, EGU26-1229, https://doi.org/10.5194/egusphere-egu26-1229, 2026.

EGU26-1350 | ECS | Posters on site | SSS4.2

What is the most effective treatment for maintaining soil microbial community structure during field sampling expeditions? 

Jason Bosch, Adam Olekšák, and Jana Voříšková

Microbial ecology is dependent upon environmental samples collected in the field. However, field trips in remote locations present a number of logistical problems which can compromise sample integrity and lead to unreliable conclusions. Microbial communities continue to live after sample collection and, now under different conditions, may shift their composition. In the laboratory environment, the microbial community can be held constant through techniques such as freezing which may not be available for several days during sampling trips. There are several treatments which claim to preserve samples without refrigeration but most are (1) not designed for soil communities and (2) have not been independently tested.

We compare five treatments—DNA/RNA Shield (Zymo Research), PowerProtect DNA/RNA (Qiagen), Phoenix Protect (Procomcure Biotech), DESS and silica gel packets—on the basis of ease-of-use, cost-effectiveness and preservation effectiveness to make a final recommendation of the best choice for preserving microbial soil communities during field trips. Soil samples were collected, treated with one of the five treatments and incubated at either 5 °C or 22 °C. DNA was isolated from controls at the beginning of the experiment and from the treated samples at 7, 14, 28 and 56 days after sampling. Amplicons of the bacterial 16S ribosomal gene and fungal ITS region were sequenced and analysed to compare how the microbial communities in different treatments changed over time in terms of their richness and overall beta diversity. In addition, we checked for differential abundance of individual taxa.

With this work, we hope to inform researchers about which microbial preservation treatments are most appropriate for soil samples and which taxa might still change despite their use. We hope that this will aid researchers better plan field trips into remote locations and will improve the quality of data produced from such trips.

How to cite: Bosch, J., Olekšák, A., and Voříšková, J.: What is the most effective treatment for maintaining soil microbial community structure during field sampling expeditions?, EGU General Assembly 2026, Vienna, Austria, 3–8 May 2026, EGU26-1350, https://doi.org/10.5194/egusphere-egu26-1350, 2026.

EGU26-3882 | ECS | Orals | SSS4.2

Microbial EPS as a relevant pathway for non-growth C investment: a study in two agricultural soils 

Rebeca Leme Oliva, Jens Dyckmans, and Rainer Georg Joergensen

Microorganisms drive soil C cycling, yet microbial metabolism is commonly conceptualized as a balance between growth (usually increase in biomass) and respiration. This simplified view neglects substantial microbial investments into non-growth pathways, such as the production of extracellular polymeric substances (EPS), which may strongly influence soil biogeochemical processes. EPS contribute to soil aggregation, resource acquisition, and microbial stress tolerance, but their role in microbial C allocation and soil C cycling remains poorly quantified. In this study, agricultural soils with different fertilization histories were incubated for 70 days with ¹³C-1-glucose and ¹⁵N-U-urea to trace substrate allocation among microbial biomass (MB), EPS, and CO₂ efflux. Our main hypothesis was that even though most substrate C and N would be allocated to MB, a significant portion would be incorporated into EPS. As results, we found that most added substrates were allocated to MB. However, 2 ~ 15% of added C and 10 ~ 15% of added N were recovered in EPS, corroborating our hypothesis that this non-growth pathway can account for a meaningful portion of microbial resource use. Further, we also observed that soil intrinsic characteristics, rather than their fertilization history, had the most significant effects over C and N partitioning in the studied sites. Microorganisms residing in clay-rich soils allocated more substrate to EPS than those in sandy soils. Finally, we also found that the incorporation of labelled C and N correlated positively in both MB and EPS. This supports the hypothesis of a coupled microbial C–N metabolism, in which EPS production accompanies growth rather than occurring independently of it. A larger set of soils is needed to incorporate non-growth C allocation pathways (other than EPS) into conceptual and quantitative models of soil biogeochemistry, in order to improve our understanding of microbial resource allocation for soil C and N stabilization.

How to cite: Leme Oliva, R., Dyckmans, J., and Georg Joergensen, R.: Microbial EPS as a relevant pathway for non-growth C investment: a study in two agricultural soils, EGU General Assembly 2026, Vienna, Austria, 3–8 May 2026, EGU26-3882, https://doi.org/10.5194/egusphere-egu26-3882, 2026.

EGU26-5208 | ECS | Orals | SSS4.2

Fungal decomposition of mineral-associated proteins through Fenton-based oxidation and enzymatic hydrolysis 

Bowen Zhang, François Maillard, Carl Troein, Michiel Op De Beeck, Minghua Zhou, Anders Tunlid, and Per Persson

A substantial fraction of nitrogen (N) in forest soils is present in mineral-associated proteinaceous compounds. The strong association between proteins and soil minerals protects these compounds from decomposition; however, previous studies have shown that ectomycorrhizal (ECM) fungi can acquire N via extracellular proteolytic enzymes acting on iron oxide mineral-associated proteins. Hydrolysis is accompanied by reductive dissolution of the iron oxides, creating conditions for Fenton chemistry and hence, generation of highly reactive hydroxyl radicals (HO). Yet, the specific mechanisms employed by ECM fungi to acquire N from these mineral-associated proteinaceous compounds remain largely unresolved. In situ IR spectroscopy was used to monitor the molecular-scale reactions of bovine serum albumin (BSA, as a model protein) with proteases and HO occurring at iron mineral interfaces. The decomposition of ferrihydrite-associated BSA by the ECM fungus Suillus luteus was followed using optical photothermal infrared (O-PTIR) microspectroscopy at the individual hyphal level. The effects and interplay between the oxidative and hydrolytic mechanisms in degrading and liberating N from mineral-associated BSA were examined using in vitro experiments. Proteolysis and oxidative mechanisms generated distinct, diagnostic IR spectral fingerprints of the mineral-adsorbed BSA. By correlating IR fingerprints with microspectroscopy of the fungal extracellular polymeric substance (EPS) region, we show that S. luteus decomposes mineral-associated proteins through sequentially deployed oxidative and hydrolytic mechanisms. BSA adsorbed on ferrihydrite is susceptible to HO generated in heterogeneous Fenton reactions, and carboxylates (e.g., oxalate) were generated that occupied adsorption sites on ferrihydrite, which can counteract the suppression of protease activity due to protease adsorption onto the mineral. Moreover, deamination and fragmentation were also observed during the Fenton reaction. Our findings underscore the previously overlooked role of extracellular oxidative chemistry in fungal acquisition of nitrogen from mineral-organic complexes.

How to cite: Zhang, B., Maillard, F., Troein, C., Op De Beeck, M., Zhou, M., Tunlid, A., and Persson, P.: Fungal decomposition of mineral-associated proteins through Fenton-based oxidation and enzymatic hydrolysis, EGU General Assembly 2026, Vienna, Austria, 3–8 May 2026, EGU26-5208, https://doi.org/10.5194/egusphere-egu26-5208, 2026.

EGU26-5487 | Orals | SSS4.2

Using fluorescence lifetime imaging to disentangle microbes from the heterogeneous soil matrix 

Sebastian Loeppmann, Yijie Shi, Alberto Andrino de la Fuente, Jens Boy, Georg Guggenberger, Andreas Fulterer, Martin Fritsch, and Sandra Spielvogel

Soil microbial communities drive most biogeochemical processes and create hotspots of nutrient cycling. However, spatial visualization of microorganisms in these soil hotspots at the microscopic scale remains challenging due to the intrinsic fluorescence and opacity of soil matrices. One promising approach to distinguish microbial cells from the heterogeneous soil background is fluorescence lifetime imaging microscopy (FLIM) combined with phasor plot analysis. This technique separates and visualizes distinct photon arrival times on a per-pixel basis, providing information independent of fluorescence intensity. As a result, FLIM overcomes limitations of intensity-based imaging caused by autofluorescence, limited resolution, and photobleaching artifacts associated with minerals and organic matter.

In this study, we determined characteristic fluorescence lifetime profiles of BacLight™ Green–stained Rhodotorula mucilaginosa and Bacillus subtilis using FLIM via confocal laser scanning fluorescence microscopy. Measurements were conducted in phosphate-buffered saline solution (PBS), water, and in natural, autoclaved, glucose-activated soils, as well as soil mineral particles. In pure cultures, fluorescence lifetimes were 1.20 ± 0.2 ns for R. mucilaginosa and 1.30 ± 0.1 ns for B. subtilis in both water and PBS. Fluorescence lifetimes within individual cells were spatially homogeneous for both species, indicating stable photon arrival times and only minor matrix effects under the tested conditions.

Using phasor plot analysis, we observed a clear separation between microbial fluorescence lifetimes (approximately 1 ns) and those of the surrounding soil matrix (0.2–0.7 ns and > 3.6 ns). These findings demonstrate the feasibility of using FLIM to discriminate microbial cells from complex soil backgrounds and suggest strong potential for extending this approach to other soil types and their associated microbiota.

How to cite: Loeppmann, S., Shi, Y., de la Fuente, A. A., Boy, J., Guggenberger, G., Fulterer, A., Fritsch, M., and Spielvogel, S.: Using fluorescence lifetime imaging to disentangle microbes from the heterogeneous soil matrix, EGU General Assembly 2026, Vienna, Austria, 3–8 May 2026, EGU26-5487, https://doi.org/10.5194/egusphere-egu26-5487, 2026.

Soil microorganisms decompose a wide range of organic sources to meet their carbon (C) and energy needs. They further require nutrients such as nitrogen (N) in appropriate stoichiometric ratios to C. Organic sources are often N-poor (high C/N) compared to microbial biomass (low C/N). The extent of this stoichiometric imbalance influences organic matter decomposability, microbial C and N turnover, and ultimately C and N stabilization in soil.

Here, we investigate how organic source C/N and system-specific conditions impact the fate of C and N across diverse microbe-plant-soil systems. We synthesized data from 14 published isotope-tracing studies that applied 13C- and 15N-enriched organic sources and quantified the recovery of C and N from these sources in microbial biomass and bulk soil. The applied organic sources included microbial necromass and various plant residues spanning C/N ratios from 4 to 42. Similarly, the soils used in the studies were diverse, with bulk soil C/N ranging from 8 to 35 and pH values from 3 to 13.

The relative recovery of source N generally exceeds that of source C in microbial biomass and bulk soil, following the expected greater losses of C through microbial respiration. Moreover, low source C/N resulted in higher relative recoveries of source C and N in microbial biomass and bulk soil, likely reflecting more efficient microbial processing of sources with a stoichiometry that closely matches microbial needs. In addition, system-specific conditions, such as bulk soil C/N, influence the fate of C and N.

In our contribution, we aim to provide insights into the joint microbial use of C and N related to organic source stoichiometry and discuss how system-specific conditions and experimental design shape the observed patterns across diverse microbe-plant-soil systems.

How to cite: Siegenthaler, M. and Manzoni, S.: Linking microbial carbon and nitrogen use to organic source stoichiometry and system-specific conditions, EGU General Assembly 2026, Vienna, Austria, 3–8 May 2026, EGU26-8185, https://doi.org/10.5194/egusphere-egu26-8185, 2026.

EGU26-11647 | ECS | Posters on site | SSS4.2

Land-use-dependent responses of soil antibiotic resistance to manure input under current and future climates 

Luis Daniel Prada Salcedo, Martin A. Fischer, and Anja Worrich

Antimicrobial resistance is on the rise and poses a global public health risk. Livestock manure serves as a primary source of antibiotic resistance in agricultural soils, where the specific agricultural management and climatic factors may influence antimicrobial resistance genes (ARG) levels and diversity. However, the compounded effects of climate change and shifts in land use on the spread of antibiotic resistance from livestock manure to soil microbiomes have not been studied. This study fills this knowledge gap by using soils from the “Global Change Experimental Facility” which investigates the consequences of climate change on ecosystem processes in different land-use types. Soils with four distinct land-use histories reflecting different agricultural management practices (conventional farming, organic farming, intensive grassland, and extensive grassland) were amended with cattle manure and incubated under current and future climate scenarios according to IPCC projections. The antimicrobial resistance genes (the resistome) and the mobile genetic elements (the mobilome) of the soil microbiomes were analyzed via metagenomics, while the abundance of clinically important resistance genes was quantified over time using real‑time quantitative PCR. The metagenomic approach indicates that 56% of the genes are shared among different land-use types, and a similar proportion of ARGs occurs in soils with or without manure additions. While the same ARG classes remain dominant across all treatments, the total ARG counts are consistently higher in grasslands than in croplands. Under conventional farming, future climatic conditions lead to an increase of unique ARGs, whereas organic farming maintains the same number of unique ARGs under both climatic scenarios. In intensive and extensive meadows, future climatic conditions show an increase of the unique ARGs compared to current ambient conditions. The temporal evaluation across all treatments revealed an overall decrease in the counts of the main ARG classes, such that, four months after manure addition, ARG abundances closely resembled the natural levels observed in soils without manure application and a similar ARGs composition. Overall, agricultural management was the main determinant of total ARG abundance, whereas future climatic conditions primarily influenced the occurrence of unique ARGs in a land-use-dependent manner.

How to cite: Prada Salcedo, L. D., Fischer, M. A., and Worrich, A.: Land-use-dependent responses of soil antibiotic resistance to manure input under current and future climates, EGU General Assembly 2026, Vienna, Austria, 3–8 May 2026, EGU26-11647, https://doi.org/10.5194/egusphere-egu26-11647, 2026.

EGU26-13248 | ECS | Posters on site | SSS4.2

Evaluating concentration-dependent effects of deuterated water to optimize its use as marker of metabolic activity in soil microbiomes 

Franziska Raab, Nico Jehmlich, Hryhoriy Stryhanyuk, and Anja Worrich

Deuterated water (2H2O) has been used to investigate changes in the metabolic activity of microorganisms. In contrast to, for example, 13C-labeled compounds, 2H2O acts as a general marker of biosynthetic activity, does not alter the available substrate pool and is more cost-effective than 18O-labeled water. These properties make 2H2O an attractive alternative for stable isotope labeling experiments, ranging from small-scale microcosm incubations with only a few grams of soil to larger-scale and more integrative experimental setups. However, high concentrations of deuterium (2H), introduced via 2H2O, can be toxic to cells, as kinetic isotope effects slow biochemical reaction rates and may therefore inhibit metabolic processes. Consequently, 2H2O-concentration-dependent effects on metabolic activity in the soil microbiome must be investigated to obtain reliable results. In this study, we conducted a microcosm experiment to analyze the effects of different 2H2O concentrations (0, 10, 20, 30, 40, 50, 60 at% of 2H) on nitrogen assimilation in the soil microbial community, using 15N-labeled ammonium sulfate as a tracer. Nanoscale Secondary Ion Mass Spectrometry will be used to derive the metabolic activity of single cells based on the amount of 15N tracer assimilated at the different 2H2O concentrations.  Furthermore, metagenomics and metaproteomics will reveal 2H2O-induced shifts in bacterial community composition and functional pathways. Together, these data will provide the range of 2H2O concentrations that ensure the non-inhibited metabolic activity in the soil microbiome, supporting its use as a marker in soil microbiome research.

How to cite: Raab, F., Jehmlich, N., Stryhanyuk, H., and Worrich, A.: Evaluating concentration-dependent effects of deuterated water to optimize its use as marker of metabolic activity in soil microbiomes, EGU General Assembly 2026, Vienna, Austria, 3–8 May 2026, EGU26-13248, https://doi.org/10.5194/egusphere-egu26-13248, 2026.

EGU26-13593 | Orals | SSS4.2

From Morphology to Metabolism: Trait‑Based Insights into Protist Diversity and Soil Biogeochemical Processes 

Michael Bonkowski, Jule Freudenthal, Hüsna Öztoprak, Martin Schlegel, and Kenneth Dumack

The assignment of functional traits to protistan sequence data has become central for understanding how these diverse microorganisms contribute to ecosystem processes, yet current schemes that reduce protists to “phototrophs,” “consumers,” or “parasites” vastly underrepresent their functional diversity and ecological strategies. Because traits directly reflect adaptations to environmental conditions, community‐level trait profiles offer more mechanistic insight into species interactions, niche partitioning, and responses to disturbance than taxonomy alone, especially in highly divergent protist lineages. Recently developed, ontology‑based trait frameworks for major soil protist groups now enable more detailed functional annotation and reveal striking differences in morphology and physiology among phyla such as Cercozoa/Endomyxa, Oomycota, Amoebozoa and testate amoebae, challenging the notion of a single, unified trait set for all protists.

I will first outline the breadth of morphological traits across soil protists and their implications for habitat use and trophic interactions, and then explore novel molecular methods to reveal expressed physiological traits using deeply sequenced transcriptomes of free-living Thecofilosea (Rhizaria: Cercozoa), including 12 Rhogostoma strains, Fisculla terrestris and Katarium polorum. A conserved core of orthogroups supported central carbohydrate and nucleotide metabolism, whereas amino acid and lipid pathways, particularly sterol and branched-chain amino acid metabolism, varied strongly even among closely related strains, indicating divergent resource demands and prey dependencies. Distinct orthogroup repertoires and expression profiles in two Rhogostoma clusters point to specialization in sensory, adhesion and biofilm-related functions that likely modulate interactions with bacterial prey and soil microhabitats. Together, these morphological and transcriptomic perspectives demonstrate that fine-scale trait variation among protists is essential for mechanistic links between microbial community composition and soil biogeochemical processes.

How to cite: Bonkowski, M., Freudenthal, J., Öztoprak, H., Schlegel, M., and Dumack, K.: From Morphology to Metabolism: Trait‑Based Insights into Protist Diversity and Soil Biogeochemical Processes, EGU General Assembly 2026, Vienna, Austria, 3–8 May 2026, EGU26-13593, https://doi.org/10.5194/egusphere-egu26-13593, 2026.

EGU26-16012 | ECS | Posters on site | SSS4.2

Identifying microbial predictors of soil nitrate pools across tropical land uses with machine learning 

Kavindra Yohan Kuhatheva Senaratna, Shu Harn Te, Simone Fatichi, and Karina Yew-Hoong Gin

Nitrification is a key control on soil nitrate (NO3) pools, and yet the dominant microbial taxa driving the process may vary with land use and land management practices. In this study we test whether dominant nitrifiers (eg: autotrophic vs heterotrophic; bacterial vs fungal) differ between heavily managed tropical soils (urban farms, golf courses) and natural tropical forests in Singapore,  using machine learning to identify the microbe groups most strongly associated with soil NO3- pools across sites.

We collected soils across multiple sites in each land-use and quantified soil NO3 using ion chromatography. To estimate taxon-level abundances, we combined qPCR-derived total bacterial and fungal abundances (16S/18S) with ribosomal DNA Amplicon sequencing relative abundances, using their product as a proxy for genus-level absolute abundance. We compiled a list of canonical ammonia oxidisers and microbes with reported heterotrophic nitrifying strains, and evaluated their ability to predict spatial variation of NO3 within each land-use type. This was done using three flexible models (generalised additive model, support-vector regression and random forest), where model performance was assessed using R² obtained from leave-one-out and repeated 5-fold cross-validation (200 repeats).

In managed soils, bacterial genera were consistently the strongest predictors of NO3(across all models), including the canonical AOB genus Nitrosomonas and bacteria with reported heterotrophic nitrifying strains (Paenibacillus, Rhodococcus). Predictive performance was high across all model types (R² ≈ 0.6–0.85). In forests, fungal genera (notably Aspergillus and Fusarium) ranked highest, but overall predictive performance was lower (R² ≈ 0.3–0.5), suggesting that functional groups not captured by the current candidate set (e.g., ammonia-oxidising archaea) might potentially be driving nitrification in these sites. Further analysis on this is currently in progress

Overall, our results suggest that contrasting nitrifier niches exist in different land uses with bacteria-dominated predictors in managed soils and fungal predictors in forests, which highlights how management may restructure microbial pathways that govern nitrate formation in tropical soils.

Acknowledgements

This research grant is funded by the Singapore National Research Foundation under its Competitive Funding for Water Research (CWR) initiative and administered by PUB, Singapore’s National Water Agency. We also acknowledge NParks, for providing us site access to conduct the measurements.


How to cite: Senaratna, K. Y. K., Te, S. H., Fatichi, S., and Gin, K. Y.-H.: Identifying microbial predictors of soil nitrate pools across tropical land uses with machine learning, EGU General Assembly 2026, Vienna, Austria, 3–8 May 2026, EGU26-16012, https://doi.org/10.5194/egusphere-egu26-16012, 2026.

EGU26-16725 | Posters on site | SSS4.2

Understanding the effects of Microplastics and persistent organic pollutants' on soil ecosystem services supply 

Paulo Pereira, Emoke Kovacs, Melinda Kovacs, Miguel Inacio, Eric Brevik, and Damia Barcelo

Anthropogenic activities are a significant source of pollutants that pose substantial risks to both the environment and human health. Among these, microplastics and persistent organic pollutants (POPs) are of particular concern due to their persistence and long-term impacts. While the environmental presence and effects of these pollutants are well documented, their specific implications for regulating, provisioning, and cultural ecosystem service (ES) supply remain underexplored. Further research on these topics is essential, as they are critical to human wellbeing. The impacts of microplastics and POPs on ES include negative effects on biogeochemical cycles, macro- and microbiological activity, and plant development. These disruptions contribute to soil degradation and initiate a cascade of adverse effects on ES by altering soil physical, chemical, and biological processes. Soil pollution leads to decreased plant cover and diminishes the capacity to regulate erosion, flooding, climate, pollination, and nutrient cycling. Declining soil fertility subsequently affects the provision of timber, medicinal plants, biomass, and water. Additionally, soil and vegetation degradation are associated with reduced landscape aesthetics and the loss of traditional landscapes, particularly in regions subjected to intensive agroforestry activities.

 Acknowledgements

This research was funded by the European Union NextGeneration EU through the National Recovery and Resilience Plan, Component 9. I8., grant number 760104/May 23, 2023, code CF 245/November 29, 2022. This work was supported by the project "Sensing, Mapping, Interconnecting: Tools for soil functions and services evaluation" supported by the Romanian Government, Ministry of the Innovation and Digitization through the National Recovery and Resilience Plan (PNRR) PNRR-III-C9-2022-I8, contract no. CF245/29.11.2022.      

How to cite: Pereira, P., Kovacs, E., Kovacs, M., Inacio, M., Brevik, E., and Barcelo, D.: Understanding the effects of Microplastics and persistent organic pollutants' on soil ecosystem services supply, EGU General Assembly 2026, Vienna, Austria, 3–8 May 2026, EGU26-16725, https://doi.org/10.5194/egusphere-egu26-16725, 2026.

EGU26-16750 | Posters on site | SSS4.2

Carbon and nitrogen control hyphae-mediated bacterial dispersal and partner recruitment in glacier forefield soils 

Christoph Keuschnig, Ramyani Biswas, Sanja Deinert, and Liane G. Benning

Bacteria can disperse along fungal hyphae, using them as “highways” to cross physical discontinuities in soil (e.g. air-filled pores) and potentially to traverse microsites with suboptimal conditions such as oxygen- or nutrient-limited zones. While laboratory studies have resolved mechanistic aspects of hypha-associated bacterial motility, the ecological and resource-dependent context of this interaction, and its relevance for soil C and N dynamics, remains poorly understood. We address this gap by combining (1) laboratory experiments manipulating carbon and nitrogen sources to test how nutrient regime shapes the dispersal of fungal–bacterial co-communities from mid-Arctic glacier forefield soils (Greenland), and (2) a one-year field colonization experiment in glacier forefields of Greenland, Iceland, and Austria, tracking colonization of initially barren sediments in specially designed columns across geologies and soil development stages.

In the laboratory, distinct C/N combinations promoted exploratory growth by different fungi, with communities dominated by Mucor, Actinomortierella, and Syncephalis. Co-dispersing bacterial communities also shifted with nutrient regime, dominated by Flavobacterium, Janthinobacterium and Pseudomonas. Bacterial diversity transported along hyphae increased under inorganic N supply (ammonium or nitrate) relative to cellulose amendment without added N, indicating that fungal nutritional status and N availability can modulate partner recruitment during dispersal. Field observations complemented these results by revealing how hypha-associated colonization unfolds under natural conditions across contrasting forefields.

Together, our findings show that fungal physiology and nutrient status structure hypha-associated bacterial partnerships and suggest that hypha-mediated translocation can influence microbial community assembly during early soil formation, with implications for C/N acquisition strategies in heterogeneous soils.

How to cite: Keuschnig, C., Biswas, R., Deinert, S., and Benning, L. G.: Carbon and nitrogen control hyphae-mediated bacterial dispersal and partner recruitment in glacier forefield soils, EGU General Assembly 2026, Vienna, Austria, 3–8 May 2026, EGU26-16750, https://doi.org/10.5194/egusphere-egu26-16750, 2026.

Peatlands store a disproportionally large fraction of global soil carbon, yet their stability is increasingly threatened by climate-driven drying and degradation. One underexplored consequence of peatland drying is the potential colonization of soil fauna, such as earthworms, which have historically been absent from waterlogged peat soils. However, the implications of earthworm colonization for peatland carbon dynamics and vertical soil functioning remain poorly understood. Here, we used intact peat soil columns from alpine peatlands to investigate how increasing earthworm densities affect carbon pools, nitrogen availability, and microbial processes across two soil depths (0–10 cm and 10–20 cm). Earthworm treatments included a low-density and a high-density combination of epigeic and endogeic species, reflecting realistic colonization scenarios under peatland degradation. Earthworm addition substantially altered the vertical distribution of soil carbon. In control soils, total carbon and dissolved organic carbon exhibited pronounced depth stratification, whereas earthworm presence weakened or even reversed these depth patterns. Moreover, earthworms increased dissolved nitrogen concentrations and modified extracellular enzyme activities, indicating changes in nutrient cycling and microbial decomposition pathways. Integrated carbon stability indices further suggested a shift toward more decomposable carbon pools under earthworm treatments. Together, our results demonstrate that earthworm colonization can fundamentally reorganize vertical carbon distribution and biogeochemical functioning in peat soils. These findings highlight soil fauna as an overlooked but potentially critical mediator of peatland carbon destabilization under climate-driven degradation.

How to cite: Zhang, H., Eisenhauer, N., and Chen, H.: Earthworm colonization weakens vertical carbon stratification in alpine peat soils under climate-relevant degradation scenarios, EGU General Assembly 2026, Vienna, Austria, 3–8 May 2026, EGU26-17970, https://doi.org/10.5194/egusphere-egu26-17970, 2026.

EGU26-18222 | ECS | Posters on site | SSS4.2

Exploring Establishment and Persistence of Enterococci in Agricultural Soils under Controlled Abiotic and Biotic Conditions 

Milan Borchert, Damien Finn, and Christoph Tebbe

Soil biodiversity is increasingly recognized as an important part of the One Health framework. It is known to be pivotal not only for sustaining agricultural productivity, but also as a biological barrier limiting the establishment and persistence of livestock-associated pathogens. While direct transmission pathways between animals and humans are well documented, the role of soil microbial communities in regulating pathogen survival outside hosts remains poorly understood.

We investigate how abiotic soil properties and native microbial biodiversity interact to constrain the environmental persistence of emerging zoonotic pathogens. Enterococci were used as a model for fecal-derived, opportunistic pathogens in agricultural systems. Combining field observations with controlled microcosm experiments, we studied soils from a free-range and a conventional pig farm representing contrasting management practices and soil textures. Enterococcal abundance was quantified using genus-specific qPCR, while bacterial community composition was assessed via 16S rRNA amplicon sequencing to characterize the ecological context of potential pathogen establishment.

Enterococcal DNA was detected across multiple management zones in freshly collected soils, with highest abundances in areas of recent pig activity. However, few viable cells were found across the samples. In sterile soil microcosms, Enterococcus lactis and E. sulfureus proliferated strongly in both sandy and silty soils, demonstrating that abiotic conditions alone do not prevent enterococcal growth. These results indicate that biotic interactions, rather than physicochemical constraints, are likely the dominant factor limiting enterococcal persistence in natural soils.

Ongoing experiments manipulate native microbial diversity gradients to disentangle mechanisms of biotic suppression, while integrated DNA/RNA analyses will distinguish active growth from residual necromass. By linking microbial community composition to pathogen exclusion, our work highlights soil biodiversity as a key ecosystem function contributing to “pathogen-resistant” soils. The experimental framework established here is broadly transferable to other soil-borne or fecal-associated pathogens, supporting risk assessment and sustainable soil management in agricultural landscapes.

How to cite: Borchert, M., Finn, D., and Tebbe, C.: Exploring Establishment and Persistence of Enterococci in Agricultural Soils under Controlled Abiotic and Biotic Conditions, EGU General Assembly 2026, Vienna, Austria, 3–8 May 2026, EGU26-18222, https://doi.org/10.5194/egusphere-egu26-18222, 2026.

EGU26-18324 | Orals | SSS4.2 | Highlight

Expanding toolbox for Microfluidic Soil Chips to study biophysicochemical interactions and microbial community dynamics 

Edith C. Hammer, Hanbang Zou, Carlos Arellano, Kristin Aleklett Kadish, and Milda Pucetaite

Soil is arguably the most complicated biomaterial on the planet. It is the largest terrestrial carbon sink, and the most species rich habitat on Earth. Microorganisms driving biogeochemical cycles live and interact in the soil’s intricate pore space labyrinth, but they are difficult to study in their realistic settings because of the soil’s opaqueness. Microfluidic Soil Chips allow us to study the impact of soil physical microstructures on microbes and vice versa, realistic microbial interactions, and microbial impact on biogeochemical cycles live and at the scale of their cells.


Chips can be tailored according to each research question, designing labyrinths or realistic image-based pore spaces, and also microchemical conditions can be varied in a controlled manner. We found that pore space geometry impacted the growth and degradation activity of the two microbial groups - bacteria and fungi - in synthetic communities in opposing ways: fungi were inhibited by increasing spatial complexity of the pore space, while bacteria and their enzymatic activity were enhanced in increasingly intricate pore spaces.


We can study bio-physical interactions throughout processes such as drying, freezing and soil aggregation, and can trace biochemical changes of cells and their environment, including metabolic rates of single fungal hyphae, via Raman microspectroscopy. Inoculating the chips with soil brings a large proportion of the natural microbial community into their inner microstructures, allowing us to study and manipulate interactions among species embedded in their complex food webs. We developed AI-based image analyses for soil bacteria, fungi and protists that aid counting, movement tracking and morphotyping biodiversity, which can complement molecular biodiversity measurements. The soil chips enable us to conduct complex ecological studies, such as testing the effect of predator removal on community composition and bacterial and fungal population and necromass dynamics.


Beyond the scientific potential, the image footage from soil chips can also bring soil ecosystems closer to people,aiming to increase appreciation of their beauty, and engagement in soil health conservation.

How to cite: Hammer, E. C., Zou, H., Arellano, C., Aleklett Kadish, K., and Pucetaite, M.: Expanding toolbox for Microfluidic Soil Chips to study biophysicochemical interactions and microbial community dynamics, EGU General Assembly 2026, Vienna, Austria, 3–8 May 2026, EGU26-18324, https://doi.org/10.5194/egusphere-egu26-18324, 2026.

EGU26-18561 | ECS | Posters on site | SSS4.2

Effects of mechanical weeding with lightweight autonomous field robots on soil biological indicators  

Lukas Thielemann and Kathrin Grahmann

Regulatory constraints on herbicide use and the spread of herbicide-resistant weeds have increased the interest in mechanical weed control in European agriculture. In this context, autonomous field robots, for which mechanical weeding is currently the dominant application, are receiving growing attention in research and practice.

Mechanical weeding generally affects the upper soil layers compared to conventional tillage. Nevertheless, its higher frequency and timing may impose additional pressures on soil biodiversity through regular habitat disruption, direct damage to soil fauna, or interactions with soil water. While the effects of conventional mechanical weeding on soil biology are sparsely studied, even less is known about the effects of mechanical weeding with autonomous field robots on soil biological parameters. Robotic weed control may affect soils differently from traditional mechanical weed control due to variations in driving speed, working width, and operational frequency.

To assess potential effects on soil fauna, we conducted several field experiments in 2024 and 2025, comparing mechanical weeding by different robots (NaioOZ, FarmDroid FD20, and FarmingGT) with chemical weed control or mechanical weeding using conventional machinery. The experiments were conducted at three sites in Germany and were cropped either with sugar beet (Beta vulgaris) or maize (Zea mays). The first site in Eastern Germany (landscape laboratory patchCROP) is sand dominated (Loamy sand), whereas the soils at the second site in Bavaria and the third site in central Germany have finer textured soils (Silty loams).

Several biological soil indicators were assessed depending on the experimental site, including feeding activity using Von Törne bait lamina sticks placed in consecutive periods starting directly after the last of several weeding operations, carabid beetle and spider abundance collected via pitfall traps in consecutive sampling intervals during and after weeding, and earthworm abundance determined by hand sorting in the autumn following robotic activity in summer. In addition, chemical and physical soil parameters were determined before and after weeding, including pH, soil organic carbon content, bulk density, and aggregate stability indices.

Preliminary results indicate trends towards reduced feeding activities, decreased earthworm biomass, and lower carabid abundance under mechanical weeding with autonomous field robots, highlighting the need for systematic assessment of biological soil responses to robotic field management. We will discuss implications for soil-smart robot implementation with respect to the frequency and intensity of robotic interventions and outline future research directions.

How to cite: Thielemann, L. and Grahmann, K.: Effects of mechanical weeding with lightweight autonomous field robots on soil biological indicators , EGU General Assembly 2026, Vienna, Austria, 3–8 May 2026, EGU26-18561, https://doi.org/10.5194/egusphere-egu26-18561, 2026.

EGU26-18765 | ECS | Posters on site | SSS4.2

Impacts of climate change related flooding on earthworm populations 

Ben Pile, Mark Hodson, Michael Berenbrink, Megan Klaar, Kristian Daly, and Qiuyu Zhu

Earthworms play important roles in maintaining soil structure and function, soil aeration, drainage, the moisture holding capacity of soils and the cycling of nutrients. The presence of earthworms in soil can lead to greater plant growth. Evidence suggests that earthworm abundance has been declining over the last several decades, which potentially negatively impacts soil function. Anthropogenic climate change means extreme weather events are becoming more frequent and intense; flooding is particularly relevant for earthworm populations, with increasing flood frequency and duration. Soils become rapidly anoxic when flooded, which threatens earthworm survival. We are investigating whether flooding is likely to change earthworm populations, through changes in abundance, diversity and distribution.


We carried out surveys to sample earthworms, collecting data on abundance and species distributions at field sites with twinned flooding and non-flooding areas and differing soil moistures and flooding histories. In laboratory experiments we have been working with common UK species, such as the lob worm Lumbricus terrestris, the green worm Allolobophora chlorotica, the grey worm Aporrectodea caliginosa, the blue-grey worm Octolasion cyaneum, and the European nightcrawler compost worm Dendrobaena veneta.


To determine moisture preferences of earthworm species we carried out choice chamber experiments, providing standard soils with a gradient of soil moisture contents. All species had similar, but soil specific, moisture preferences, choosing moist, but not waterlogged conditions.


Survival experiments were carried out, exposing earthworms to conditions of restricted oxygen, simulating flood conditions. Species commonly found in wetter or drier soils were found to survive for a similarly short duration of approximately 22 hours in oxygen-depleted water (0.25 mg l-1 dissolved oxygen). This is in contrast to our previous research in which A. chlorotica, a species that is able to aestivate, survived in oxygen-depleted water, whereas L. terrestris did not. Furthermore, A. chlorotica has more oxygen-carrying haemoglobin (0.22 vs 0.125 µmol Hb g-1), and its haemoglobin is more efficient at binding and retaining oxygen than the much larger L. terrestris (4.18 vs 11.47 mmHg P50), which suggests that A. chlorotica may be better adapted to survive in oxygen-depleted conditions resulting from flooding.


We are also monitoring the hatching success of earthworm cocoons exposed to 90 hours of oxygen depletion in simulated flood conditions. Cocoons were subjected to oxygenated conditions of 2 mg l-1 or a treatment restricted to 0.25 mg l-1 of dissolved oxygen for the duration. The majority of cocoons of A. chlorotica and D. veneta remain viable when subjected to reduced oxygen but suffer lower hatching success than those with unrestricted oxygen. A difference was found between species, D. veneta retained higher viability than A. chlorotica, time to hatching was found to be delayed in both species when exposed to low oxygen conditions.


The above evidence is consistent with an increasing frequency of flooding causing changes in earthworm population structure and potentially reducing earthworm abundance, with cocoons being a key component for the survival of earthworm populations after flood events. Our results highlight one possible consequence of climate change on earthworm populations and consequent impacts on soil functionality.

How to cite: Pile, B., Hodson, M., Berenbrink, M., Klaar, M., Daly, K., and Zhu, Q.: Impacts of climate change related flooding on earthworm populations, EGU General Assembly 2026, Vienna, Austria, 3–8 May 2026, EGU26-18765, https://doi.org/10.5194/egusphere-egu26-18765, 2026.

EGU26-19691 | ECS | Posters on site | SSS4.2

Biodiversity of soil microbial communities in conventional and organic agriculture in Southern Sweden 

Frank B. Lake, Christine D. Bacon, Romain Carrié, Johan Ekroos, and Edith C. Hammer

Soil microorganisms in agricultural fields are an important contributor to soil nutrient cycling. The soil microorganism abundance and diversity are affected by multiple factors, including physical and chemical soil characteristics as well as agricultural farming practices, all of which combine to affect crop growth and crop yield. As organic farming bans the use of synthetic chemical inputs, inducing changes in soil tillage and fertilization types, we expect positive effects on the soil microbial communities compared to conventional farming systems. To test this, soils from 30 farms of both conventional and organic systems were sampled, including small grain cereals (annual crops) and leys (improved sown grassland - perennial crops). Soil chips inoculated with these soils were used to determine microscopically the abundance of different microorganism groups. This was followed by conducting molecular identification of microbial diversity (bacteria, fungi and protists) for fresh soils, lab incubated soils and internal parts of the soil chips. Results showed variable abundances across the microbial groups for both crop types and the agricultural systems. Preliminary molecular results of fresh soils indicate comparable genetic diversity within and between crops and farming systems. Molecular results were compared to soil chip samples resulting in rather small microbial community shifts for lab incubated soils, but with stronger shifts in internal parts of the soil chip. Our results show that microbial group abundances via soil chip microscopy vary for crop type and farming practices, indicating possible effects by specific field treatments. On the other hand, preliminary molecular microbial biodiversity results show comparable microbial diversities for the fresh sampled soils, indicating a rather stable microbial diversity in agricultural soils.

How to cite: Lake, F. B., Bacon, C. D., Carrié, R., Ekroos, J., and Hammer, E. C.: Biodiversity of soil microbial communities in conventional and organic agriculture in Southern Sweden, EGU General Assembly 2026, Vienna, Austria, 3–8 May 2026, EGU26-19691, https://doi.org/10.5194/egusphere-egu26-19691, 2026.

EGU26-19745 | ECS | Orals | SSS4.2

In-vitro utilization of fungal necromass and plant litter by ectomycorrhizal fungi under contrasting mineral nitrogen availabilities 

Valentin B. Kurbel, Myrthe L. Detiger, Khatab Abdalla, Nicolas Tyborski, Alexander H. Frank, Ulrike Schwerdtner, and Johanna Pausch

Ectomycorrhizal (ECM) fungi represent major drivers of soil carbon (C) and nitrogen (N) cycling, as they liberate nutrients by decomposing soil organic matter (OM), especially when labile N is limited. However, in contrast to saprotrophic fungi, knowledge on the decomposition of OM of different origin by ECM fungi remains limited. Here, we investigated  the decomposition of fungal necromass and leaf litter by various ECM fungal species under different availabilities of mineral N, using in-vitro stable isotope tracing. We hypothesised that (I) the narrow C/N ratio of fungal necromass enhances decomposition and fungal growth compared to leaf litter, (II) N limitation increases the share of OM-N over mineral N in the fungal biomass, and (III) N limitation enhances respiration.

We grew four different ECM fungal species (Hebeloma cylindrosporum, Paxillus involutus, Laccaria bicolor, Suillus luteus) in the absence of OM, with Agaricus bisporus fungal necromass (C/N = 8) or with leaf litter of Ulmus laevis or Quercus alba (C/N = 29 and 60, respectively) on nutrient medium containing 13C-enriched glucose and two concentrations of 15N-enriched ammonium. We calculated the utilization of OM-C and OM-N for fungal growth and respiration after a minimum growth period of 45 days.

In accordance with hypothesis I, C from fungal necromass was more effectively utilized by ECM fungi (40% of the necromass-C) than C from leaf litter (around 5%). In contrast, the percentage utilization of OM-N was highest for the Q. alba leaf litter (40%). However, due to the narrow C/N of the necromass, this treatment still resulted in the highest absolute amount of OM-N being incorporated into ECM fungal biomass and consequently increased fungal growth. As expected in hypothesis II, the relative share of OM-N in the fungal biomass was higher under mineral N limitation, even if the absolute uptake of N from leaf litter was decreased. We did not find support for hypothesis III as mineral N limitation did not lead to an increased respiration. However, under N limitation, respiration of ECM fungi growing on leaf litter was increased while growth was reduced compared to the controls without OM, suggesting a shift in C and energy investment from growth to decomposition in the presence of OM. Interestingly, the patterns were surprisingly uniform across the tested species.

Our findings show that OM type and mineral N availability control ECM fungal C and N uptake, growth, and respiration across four tested species and highlight fungal necromass as an important source of organic N and C for ECM fungi.

How to cite: Kurbel, V. B., Detiger, M. L., Abdalla, K., Tyborski, N., Frank, A. H., Schwerdtner, U., and Pausch, J.: In-vitro utilization of fungal necromass and plant litter by ectomycorrhizal fungi under contrasting mineral nitrogen availabilities, EGU General Assembly 2026, Vienna, Austria, 3–8 May 2026, EGU26-19745, https://doi.org/10.5194/egusphere-egu26-19745, 2026.

EGU26-21008 | ECS | Orals | SSS4.2

Experimental warming reshapes soil microbial communities and mineral-associated organic matter formation dynamics in a subarctic mineral horizon 

Andrea Moravcová, Alice Gredeby, Bowen Zhang, Honorine Dumontel, Johannes Rousk, and François François Maillard

Arctic and subarctic regions are warming faster than the global average, yet carbon dynamics in mineral horizons remain comparatively understudied despite large stocks stabilized as mineral-associated organic matter (MAOM). Clarifying how warming alters mineral-associated carbon (C) and nutrient pools, and the soil microbial communities that mediate MAOM formation and destabilization, is therefore critical for predicting Arctic carbon–climate feedbacks. Here, we experimentally warmed subarctic birch forest soil in Abisko, Sweden, using distinct regimes: chronic (year-round) warming and seasonal warming (summer-only or winter-only). To quantify MAOM formation potential, we developed recoverable Mineral Interface Sampling Probes (MISP) consisting of thin films of Fe- and Al-(hydr)oxides (MISP-Fe and MISP-Al) and coupled them with surface-sensitive spectroscopy techniques (X-ray photoelectron spectroscopy, XPS; Fourier-transform infrared spectroscopy, FTIR). Bacterial and fungal community composition and richness were assessed by high-throughput amplicon sequencing (16S rRNA gene and ITS markers), while microbial abundances were quantified by quantitative PCR (qPCR) as marker-gene copy numbers. Warming increased bacterial and fungal gene copy numbers and the fungal-to-bacterial ratio, while reducing richness in both domains, consistent with a community shift toward fewer warming-tolerant taxa. MISPs showed mineral-type-dependent responses in mineral-associated C formation potential (Fe vs Al (hydr)oxides), whereas mineral-associated N formation potential increased consistently under warmed treatments, yielding newly formed MAOM with a lower C:N ratio. Both microbial community shifts and MISP responses were strongest under summer warming, with comparatively weak responses under chronic or winter warming. Overall, summer warming increased microbial abundance and produced newly formed MAOM with a lower C:N ratio, consistent with soil warming shifting MAOM formation toward a microbial necromass-mediated pathway, where organic matter is processed through microbial biomass before stabilization on mineral surfaces. These findings highlight the sensitivity of MAOM pools and microbial communities in subarctic mineral soil horizons to soil warming.

How to cite: Moravcová, A., Gredeby, A., Zhang, B., Dumontel, H., Rousk, J., and François Maillard, F.: Experimental warming reshapes soil microbial communities and mineral-associated organic matter formation dynamics in a subarctic mineral horizon, EGU General Assembly 2026, Vienna, Austria, 3–8 May 2026, EGU26-21008, https://doi.org/10.5194/egusphere-egu26-21008, 2026.

Fungal mycelia constitute a major structural component of soils and play a central role in carbon (C) cycling. Yet, despite their importance, we lack a mechanistic understanding of how variation in mycelial morphology translates into differences in soil C dynamics and stabilization. In particular, the role of intraspecific variation (i.e. the genetic and phenotypic diversity within a single fungal species) remains largely unexplored. This gap represents a critical barrier to predicting the formation and persistence of soil C pools under ongoing environmental change.

This project addresses this challenge by using the model filamentous fungus Neurospora crassa to test how intraspecific variation influences soil C partitioning and respiration. We quantify how morphologically distinct strains of N. crassa differ in their contributions to soil respiration and to the formation of particulate organic matter (POM) versus mineral-associated organic matter (MAOM). Controlled soil microcosm experiments will allow us to directly link fungal traits (e.g. hyphal density, branching architecture) to C fluxes and stabilization pathways.

By leveraging a model organism, this work enables a level of experimental resolution that is difficult to achieve in complex natural communities. This approach allows us to move beyond species-level averages and explicitly test how individual-level variation shapes ecosystem processes in soils. Ultimately, we aim to identify the fungal traits and underlying genetic mechanisms that promote long-term C stabilization in soils.

By uncovering the mechanistic links between fungal intraspecific diversity and soil C dynamics, this project advances a shift from descriptive to predictive soil ecology. The results will provide a foundation for incorporating fungal trait variation into soil C models, thereby improving predictions of soil C permanence and refining our understanding of fungi as precise, trait-driven regulators of the terrestrial carbon cycle.

How to cite: Nieminen, V. and Aguilar-Trigueros, C.: A model-system approach to disentangle the role of intraspecific fungal effects on soil carbon cycling, EGU General Assembly 2026, Vienna, Austria, 3–8 May 2026, EGU26-22604, https://doi.org/10.5194/egusphere-egu26-22604, 2026.

EGU26-679 | ECS | Posters on site | SSP3.11

Effect of Biochemical Parameters on Biomineral Formation and Soil Strength Development in Microbially Induced Calcite Precipitation 

Renu Joshi, Thapasimuthu Rajakumar Nikitha, and Dali Naidu Arnepalli

Microbially induced calcite precipitation (MICP) provides a low-carbon alternative to traditional soil stabilization methods. However, the coupled impact of key input biochemical parameters, namely biomass concentration, chemical reagent dosage, and initial pH, on this biocementation process remains largely unexplored, which in turn influences the precipitation pathway and crystal characteristics, such as quantity, size, and mineralogy, ultimately affecting the overall strength gain. The study conducts laboratory experiments using the Sporosarcina pasteurii bacterium with varying biomass concentrations, ranging from an optical density of 0.25 to 1.00, cementation reagent concentrations varying from 0.25 M to 1.00 M, and initial pH values changing from 7 to 9. This is followed by an optimization scheme aimed at achieving maximum strength gain. Urea hydrolysis and calcite precipitation were monitored through the release of ammonium amount and the concentration of dissolved calcium ions in the cementation solution, respectively. The precipitated biomineral was analyzed for microstructural and mineralogical attributes. Following this, soil biocementation experiments were conducted to arrive at optimized biochemical parameters using statistical regression analysis. Results show that higher biomass accelerates ureolysis, while final calcite quantity mainly depends on reagent availability. Yet, soil strength is not primarily dependent on biomineral quantity; instead, crystal size and morphology are decisive, which are strongly influenced by the coupled interaction of biochemical parameters. A lower biomass concentration, combined with an increased reagent amount, promotes crystal growth. However, an increase in the amount of cementation reagent becomes detrimental to crystal size at higher biomass levels. Moreover, lower pH provides some lag time to the reaction but can also accelerate bacterial growth, thereby altering the crystal size. Furthermore, stable calcite mineral is found to precipitate at lower biomass cementation due to the inhibition of bacterial enzymatic activity. Soil biocementation results revealed that larger crystals bridging the soil pores significantly increase strength, up to 10 MPa from 0.17 MPa, compared to abundant but small-sized crystals. Thus, reaction conditions that favour rapid precipitation can be mechanically ineffective without effective pore bridging, emphasizing that biocementation should focus not only on producing large amounts of biominerals but also on the size of the precipitated crystals. By identifying biochemical thresholds that promote stronger, more interlocked crystals, this work offers guidelines for achieving maximum strength gain with optimised biochemical parameters.

How to cite: Joshi, R., Nikitha, T. R., and Arnepalli, D. N.: Effect of Biochemical Parameters on Biomineral Formation and Soil Strength Development in Microbially Induced Calcite Precipitation, EGU General Assembly 2026, Vienna, Austria, 3–8 May 2026, EGU26-679, https://doi.org/10.5194/egusphere-egu26-679, 2026.

EGU26-1442 | ECS | Posters on site | SSP3.11

Siliceous deposition and hydrothermal contributions in the Lower Cambrian Yurtus Formation, Tarim Basin 

Jiaqi Li, Zhihong Kang, and Xuemei Zhang

The Lower Cambrian Yurtus Formation in the Tarim Basin preserves important evidence of hydrothermal activity, microbial processes, and seawater chemistry that affected silica deposition and organic matter enrichment during the Ediacaran–Cambrian transition. Using field observations, petrography, redox-sensitive geochemical data, and biomarkers, this study examines how silica formed and what environmental conditions controlled the accumulation of black shales. The Yurtus Formation was deposited on a passive continental margin that was affected by extensional tectonism and occasional hydrothermal discharge. Geochemical data indicate that bottom waters were saline, acidic, and mainly anoxic, and that reducing conditions increased at times when hydrothermal H₂S and other reduced fluids entered the basin.

The siliceous layers show several ways through which silica was added or precipitated. Hydrothermal fluids supplied dissolved silica, while upwelling brought silica-rich deep water and nutrients into the basin. Microbial activity also contributed to silica precipitation. The presence of amorphous silica, barite nodules, and chert–mud alternations, together with microbial mats, radiolarians, and sponge spicules, shows strong interactions between microbes and minerals and the influence of early diagenesis. Acidification caused by hydrothermal gases and microbial metabolism played an important role in forming SiO₂ quickly. Differences between the siliceous units relate to changes in the balance between hydrothermal input and upwelling. Layers rich in phosphate and barite suggest increased nutrient supply and fluid mixing. Continuous barite beds and chert–mud layers also indicate silica delivery from distant volcanic and hydrothermal sources.

Organic-rich shales in the upper Yurtus Formation contain Type I–II kerogen from plankton, algae, and bacteria. Their biomarker features match those of Bashituo oils, showing that the Yurtus Formation is an important regional source rock. These results show that hydrothermal fluids were the main source of silica, and that microbial processes and upwelling influenced how silica and organic matter were preserved.

How to cite: Li, J., Kang, Z., and Zhang, X.: Siliceous deposition and hydrothermal contributions in the Lower Cambrian Yurtus Formation, Tarim Basin, EGU General Assembly 2026, Vienna, Austria, 3–8 May 2026, EGU26-1442, https://doi.org/10.5194/egusphere-egu26-1442, 2026.

Ancient stromatolites have experienced substantial alterations in their structure over time due to diagenesis, creating challenges in interpreting these formations and understanding their role in the evolution of life on Earth. To shed some lights on this issue, we examined exceptionally preserved stromatolites from the early Miaolingian-aged (510⁓506 Ma) at Jinzhou Bay section of the Liaoning province, North China Platform. The uppermost part of the early Miaolingian Maozhuang Formation comprises small column-like stromatolites of open tidal-flat sedimentary facies with highstand limestone, distinguishing it from the Maozhuang Formation in the rest of the North China sections, where it predominantly comprises restricted tidal-flat facies i.e., highstand dolostone. The stromatolite matrix primarily comprises dark micrite laminae, along with occasional micrite clumps that indicate the presence of calcified sheaths of filamentous cyanobacteria (Girvanella). The abundance of filamentous cyanobacteria along with pyrite grains indicate the direct microbial evidence in the growth of columnar stromatolites. Furthermore, the matrix of stromatolites represents potential resurgence of stromatolites in a normal marine environment during Miaolingian, which was previously thought as the time interval with relatively low abundance of stromatolites. Further, Girvanella within matrix of columnar stromatolites provide new insights concerning the complex and diverse biological traits of cyanobacteria, including large cell diameters, motility, filamentous growth, sheath evolution, nitrogen fixation, and exact calcification known as a hard life, particularly during the Cambrian period. As a result, the studied stromatolites not only highlight the resurgence and cyanobacterial calcification event associated with the formation of stromatolite, but also distinctive from the lithified discrete stromatolite buildups in Shark Bay's Hamelin Pool, which is dominated by coccoid cyanobacteria and evolved in a low-energy environment.

How to cite: Riaz, M., Mei, M., and Liu, Z.: Girvanella Clumps in Columnar Stromatolites from the Cambrian (Early Miaolingian) of North China: Evidence for Microbial Calcification and a Marine Resurgence, EGU General Assembly 2026, Vienna, Austria, 3–8 May 2026, EGU26-1525, https://doi.org/10.5194/egusphere-egu26-1525, 2026.

EGU26-1894 | ECS | Posters on site | SSP3.11

Molybdenum-dependent nitrogen metabolism drives magnetite formation in magnetotactic bacterium AMB-1. 

Mélissa Garry, Emmanuelle Albalat, Mathieu Touboul, Agnès Dumont, Ramon Egli, Christophe Thomazo, Vincent Balter, Laurent Modolo, Gael Yvert, and Matthieu Amor

Magnetotactic bacteria have the ability to biomineralize intracellular magnetite (Fe3O4) nanoparticles. Resulting biomagnetite can be efficiently preserved in sedimentary rocks and represents past traces of biological activity that can be searched for paleontological and paleoenvironmental reconstructions. Recent work on trace-element incorporation into magnetite has shown that molybdenum exhibits a strong affinity for biomagnetite, with enrichments up to four orders of magnitude higher than in abiotic magnetite. This enrichment likely reflects molybdenum-dependent metabolic processes, such as nitrate reduction during denitrification, which support cellular energy production and contribute directly to magnetite biomineralization.

            Using a combination of molecular, chemical and magnetic approaches, we show that Mo availability directly stimulates growth and magnetite precipitation in the model microorganism Paramagnetospirillum (formerly Magnetospirillum) magneticum AMB-1 under environmental conditions favoring nitrate reduction. These findings demonstrate a functional link between molybdenum, nitrogen metabolism and biomineralization.

            Altogether, our results clarify the central metabolic role of molybdenum in magnetotactic bacteria and propose a mechanistic framework for interpreting the geochemical signatures of biomagnetite in ancient environments where nitrate-bearing oxidized species were present.

How to cite: Garry, M., Albalat, E., Touboul, M., Dumont, A., Egli, R., Thomazo, C., Balter, V., Modolo, L., Yvert, G., and Amor, M.: Molybdenum-dependent nitrogen metabolism drives magnetite formation in magnetotactic bacterium AMB-1., EGU General Assembly 2026, Vienna, Austria, 3–8 May 2026, EGU26-1894, https://doi.org/10.5194/egusphere-egu26-1894, 2026.

Gas chimneys within marine sediments function as preferential conduits for focused methane migration, significantly altering early diagenetic stratification and subsequent porewater geochemistry. A critical locus for these biogeochemical transformations is the sulfate–methane transition zone (SMTZ), where the anaerobic oxidation of methane is stoichiometrically coupled with sulfate reduction, regulating sedimentary carbon cycling. This study investigates the regulatory role of chimney-enhanced methane flux and gas hydrate dynamics on SMTZ depth and microbial community architecture within deep-sea sediments (water depths >2,000 m). We combined detailed porewater chemistry measurements, including hydrogen and oxygen isotope ratios of water, with DNA-based community profiling, and compared two chimney cores with a distal non-chimney core. The non-chimney core did not show a clearly defined SMTZ within the recovered interval. In contrast, the chimney cores showed a shallower and narrower SMTZ, consistent with stronger upward methane transport and tighter coupling between methane consumption and sulfate use. At one chimney site, a strong decrease in chlorinity together with shifts in water isotope ratios suggested gas-hydrate dissociation within the sediment. Microbial communities in hydrate-affected sediments were dominated by groups often associated with methane-rich and low-oxygen conditions, and additional increases in taxa linked to diverse carbon use suggest that high methane flow can broaden available energy and carbon pathways. Overall, these results support a feedback pattern in which focused methane transport and hydrate instability change the SMTZ and redox structure, which then shapes microbial community composition and, in turn, the chemical signals preserved in deep-sea sediment records.

How to cite: Han, D., Jang, K., and Kim, J.-H.: Chimney-associated methane migration and hydrate dynamics influence SMTZ structure and microbial communities in deep-sea sediments, EGU General Assembly 2026, Vienna, Austria, 3–8 May 2026, EGU26-2270, https://doi.org/10.5194/egusphere-egu26-2270, 2026.

EGU26-3977 | Orals | SSP3.11

DOM-Mn redox interactions promote metastable kutnahorite-dolomite carbonate frameworks  

Daniel Petrash, Astolfo Valero, Or Bialik, Yihang Fang, Maartje Hamers, Travis Meador, Oliver Plümper, Tomaso Bontognali, and Michael Ernst Böttcher

The intersection of organic geochemistry and mineralogy offers a critical research niche for understanding the preservation of dissolved organic matter (DOM) in marine depositional systems. While reactive metal oxides are recognized for stabilizing organic carbon against remineralization, the mechanisms by which ligands template the conversion of this organic matter into carbonate minerals remain elusive. While pH and redox coupling govern metal speciation and ligand availability, the specific role of carboxyl-rich polysaccharides in catalyzing manganese-mediated carbonate mineralization remains under-constrained. Here, we isolate the role of alginate—a model for carboxylated EPS. To simulate diagenetic redox oscillations, cyclic voltammetry was employed to target the Mn(III)/Mn(II) couple within alginate-bearing Mn-Mg-Ca electrolytes. This electrochemical framework evaluated manganese-driven proton exchange as a mechanism to lower kinetic barriers via stereochemical templating. Rather than functioning as a passive substrate, alginate actively directs a heterogeneous mineralization pathway: it promotes the crystallization of metastable magnesian kutnahorite, bypassing the high kinetic barriers of direct dolomite precipitation. Microstructural analysis (STEM-HAADF/EDS, SAED) reveals that organic-mediated Mn-rich cores template the subsequent epitaxial growth of disordered Mg-Ca carbonate (protodolomite) cortices within just 20 minutes. This "electrochemical Mn-pump" mechanism relies heavily on the specific coordination chemistry of the alginate’s carboxyl groups, which effectively shed the rigid hydration shell of metal cations (specifically Mg2+) via ligand-mineral surface proton exchange. These findings delineate a critical mechanism of organic-mineral interaction, showing that specific (carboxylated) DOM fractions can dictate mineralogical outcomes in low-temperature systems. This work specifically highlights how organic templates may serve as archives of paleo-environmental conditions by locking biogeochemical signatures into fabric-preserving carbonate mineral phases. By establishing a reproducible protocol for generating synthetic organic-carbonate frameworks, this study provides a baseline for future investigations into the stable isotope fractionation that occurs during ligand-mineral interactions in Mn-enriched precipitation environments supersaturated with respect to dolomite and metastable Mn-Ca carbonates, akin to the episodic precipitation events in the Baltic Sea deeps. 

How to cite: Petrash, D., Valero, A., Bialik, O., Fang, Y., Hamers, M., Meador, T., Plümper, O., Bontognali, T., and Böttcher, M. E.: DOM-Mn redox interactions promote metastable kutnahorite-dolomite carbonate frameworks , EGU General Assembly 2026, Vienna, Austria, 3–8 May 2026, EGU26-3977, https://doi.org/10.5194/egusphere-egu26-3977, 2026.

EGU26-4853 | Posters on site | SSP3.11

How life affects mineral formation: a reappraisal of concepts and terminology 

Patrick H. Meister and Nereo Preto

Numerous biological factors have been proposed to influence the formation of minerals under Earth-surface conditions, but the underlying concepts are often confused due to inconsistent terminology. The current systematics has largely developed historically, yet remains unclear because several terms have contrasting definitions or are not self-explanatory. Over time, the variety of processes proposed to explain biological effects on mineral formation has expanded, but the mechanisms often remain far from fully resolved and sometimes lack a proof of concept.

Here, a systematic framework of terms is proposed, requiring only slight modifications of the established terminology, primarily by removing some of the non-self-explanatory connotations. For example, the term ‘biologically influenced’ mineral formation better should represent a general ‘influence’ rather than a specific mechanism. In turn, ‘biologically induced’ should be used in its original meaning as ‘driven by supersaturation’. New terms such as ‘biologically nucleated’ and ‘biologically mediated’ precipitation would more precisely describe the specific mechanisms where organisms or biogenic organic substances act as a nucleation substrate or as a catalyst facilitating mineral growth from already supersaturated solution.

The proposed scheme would necessitate minimal intervention into existing terminology and at the same time become more user friendly for broad application in sedimentology and biogeosciences. Establishing a coherent and canonical terminology will not only improve clarity but also provide a common ground for future research on how biological and abiotic factors influence mineral formation under Earth-surface conditions.

How to cite: Meister, P. H. and Preto, N.: How life affects mineral formation: a reappraisal of concepts and terminology, EGU General Assembly 2026, Vienna, Austria, 3–8 May 2026, EGU26-4853, https://doi.org/10.5194/egusphere-egu26-4853, 2026.

EGU26-9549 | Orals | SSP3.11

Post-glacial development of marine conditions on the Scotian Shelf inferred from pore water profiles and reaction-transport modeling 

Mark Zindorf, Andrew Dale, Henriette Kolling, Sophie Paul, Paula Luiza Fraga Ferreira, and Florian Scholz

The Scotian Shelf on the northwest Atlantic Margin is located at the confluence of two important components of the Atlantic Meridional Overturning Circulation (AMOC). The southward flowing Labrador Current supplies cold, oxygen rich waters and the northward flowing Gulf Stream delivers warm, nutrient rich waters low in O2. Their mixing allows the establishment of a productive marine ecosystem. The relative influence of the current systems is governed by northern hemispheric climate patterns, such as the overall AMOC strength and the North Atlantic Oscillation mode. However, the exact atmospheric and oceanographic mechanisms are still under debate. Due to this knowledge gap regarding the climate-bioproductivity feedback, a deeper insight into the biogeochemical evolution of the region since the Holocene is an important aspect for understanding North Atlantic climate and circulation.

On the Scotian Shelf, glacially eroded basins are separated from the open ocean by shallower sills on the outer shelf. Using solid phase and pore water geochemical data from three eight- to twelve-metre-long sediment cores, in combination with reaction-transport modelling, we reconstructed carbon and sulfur cycling at the seafloor along the Scotian Shelf since the last deglaciation. Chloride profiles imply that the basins were filled with freshwater during the earliest phase of the deglaciation. Due to the absence of sulfate reduction in freshwater sediments, reactive Fe oxides escaped pyritization during deposition of the deepest sediment layers. Between 14 and 8 ka BP, a combination of eustatic sea-level rise and isostatic adjustment led to marine transgression and the establishment of fully marine conditions on the shelf, accompanied by increased organic matter deposition and burial. Modelled anaerobic oxidation of methane coupled to reduction of iron oxide minerals in deeper sediment layers in the present day alludes to a geochemical fingerprint of the formerly prevailing freshwater conditions in the shelf basins.  

Our data and model outcomes allow us to pinpoint the timing of marine transgression for three individual basins along the Scotian Shelf and reconstruct the corresponding evolution of contemporary biogeochemical conditions. We conclude that the diagenetic conditions in Scotia Shelf sediments evolved in a similar manner to those described previously for marginal seas with restricted exchange with the open ocean, such as the Baltic Sea.

How to cite: Zindorf, M., Dale, A., Kolling, H., Paul, S., Fraga Ferreira, P. L., and Scholz, F.: Post-glacial development of marine conditions on the Scotian Shelf inferred from pore water profiles and reaction-transport modeling, EGU General Assembly 2026, Vienna, Austria, 3–8 May 2026, EGU26-9549, https://doi.org/10.5194/egusphere-egu26-9549, 2026.

EGU26-9849 | ECS | Posters on site | SSP3.11

Diagenetic processes in fjord sediments of Southern Iceland – A complex interplay of organic matter respiration and submarine silicate weathering 

Katrin Wagner, Christian März, Sebastiaan J. van de Velde, Astrid Hylén, Sandra Arndt, Per O. J. Hall, Silvia Hidalgo-Martinez, Mikhail Kononets, Filip J. R. Meysman, Piet Reyniers, Lotte Verweirder, and Katharine R. Hendry

The chemical weathering of mafic magmatic rocks (e.g., basalt) is known to remove CO2 from the atmosphere, transforming it into dissolved or solid inorganic carbon phases. Natural marine sediments contain a wide variety of organic and inorganic phases as well as microbial communities impacting the “submarine weathering engine”, e.g., increasing weathering potential by lowering ambient pH, or decreasing the CO2 removal potential by forming authigenic clay minerals. Environments rich in reactive organic matter, mafic silicate minerals, and amorphous silica (e.g., ash, biogenic opal) reflect this natural complexity, and can serve as natural laboratories for understanding what controls submarine silicate weathering. Icelandic fjords with their high primary productivity and their mafic hinterland can serve as examples for these complex conditions. We present geochemical sediment and pore water data down to 5 m sediment depth from Hvalfjörður (SW Iceland) and Reyðarfjörður (SE Iceland) taken during the 2023 DEHEAT research cruise onboard RV Belgica. Our data show intense diagenesis that is both related to organic matter degradation and to submarine silicate weathering. The relatively uniform sedimentary material is fine-grained and particularly rich in iron, titanium and magnesium compared to average shale. Tentative sedimentation rates of about 0.5 cm/yr and organic carbon ranging between ~0.5 and 2.5 wt% with a dominantly marine origin based on TOC/TN ratios indicate an accumulation environment providing large amounts of highly reactive organic matter. Sulphate-methane transition zones are established at 75-100 cm sediment depth, but pore water alkalinity and DIC linearly increase to, and probably beyond, the deepest samples. Below the SMTZ, Ikaite crystals are found at various depths throughout the sediments of both fjords. Pore water profiles e.g. of dissolved silica and lithium show undulating downcore structures hinting both at silicate dissolution, but also at clay mineral formation. The data altogether provides insight into a complex interplay of dissolution and precipitation processes tied to the geology of the area, accumulation characteristics and the availability and respiration of organic matter.

How to cite: Wagner, K., März, C., van de Velde, S. J., Hylén, A., Arndt, S., Hall, P. O. J., Hidalgo-Martinez, S., Kononets, M., Meysman, F. J. R., Reyniers, P., Verweirder, L., and Hendry, K. R.: Diagenetic processes in fjord sediments of Southern Iceland – A complex interplay of organic matter respiration and submarine silicate weathering, EGU General Assembly 2026, Vienna, Austria, 3–8 May 2026, EGU26-9849, https://doi.org/10.5194/egusphere-egu26-9849, 2026.

EGU26-10930 | Posters on site | SSP3.11

Barite precipitation in freshwater limnic sediments: a proxy for salinization 

Patricia Roeser, Michael E. Böttcher, Laura Lapham, Stan Halas, Chloé Pretet, Thomas F. Nägler, Manolo Prieto, Ulrich Struck, and Hermann Huckriede

The diagenetic precipitation of barite (BaSO4) in sediments requires the mobilisation and sources of dissolved barium and sulfate, the latter often limited in the sulfur cycling of lacustrine systems. In this study, we investigate the origin and proxy potential of barite that has crystallised in freshwater sediments of the Baltic Sea. Barite nodules with up to millimetre-scale grain sizes are found in the glacial varved clays of the limnic Baltic Ice Lake phase (>16 to 11.7 ka BP), underlying brackish Holocene muds. We have comprehensively analysed the solid phase of the host sediments and the barite, and the porewaters in the respective sediments, both, geochemically and isotopically for the signatures of sulphur, barium, oxygen, and also the related carbon cycling. The sulphur isotope signatures preserved in the barites display a remarkable downward gradient from the lithological boundary between the brackish Holocene sediments and the preceding limnic varved clay deposits. The sulphur isotope signature of different mineral components (marcasite, pyrite and barite) shows that the porewater sulphur reservoir was initially affected by microbial sulphate reduction. Aside from the smaller importance of bacterial activity in the glacial clays, the observed trend sustains an isotope discrimination upon solid phase formation, or minor fractions of isotopically light sulphur that may have been incorporated upon crystallisation at depth. It had been hypothesised that sulphate for barite precipitation originated from the postglacial connection of the Baltic Sea with the Atlantic Sea, that has led to brackish waters flowing into the different Baltic Sea basins and downward diffusion of sulphate and other dissolved constituents through the sediment column. Taken together, the observed changes in barite surface texture and Sr composition, as well as isotope signatures (Ba, S, O isotopes), indicate changes in the supersaturation and composition of the paleo-porewater fluids and the crystal growth rate, supporting the concept of a paleo-salinisation gradient that is geochemically imprinted in the barites up to date. Moreover, we explore the oxygen isotope signature in the barite as a proxy for the parent porewater fluids, and show that the pore waters at this site with low sedimentation rates have been completely modified to date by diffusional processes, in contrast to sites with higher sedimentation rates (IODP cores) that still retain the original porewater signature.

This investigation outlines that diagenetic barites in limnic sediments can evidence past salinization events, and furthermore, how the isotope signature of individual barite constituents can be used infer the parental fluid composition. This abstract summarises a detailed investigation recently published in a Special Publication (Roeser et al., 2025).

Roeser P., Böttcher M.E., Lapham L.L., Halas S., Pretet C., Nägler T., Prieto M., Struck U., Huckriede H. (2025) Barite in Baltic freshwater sediments crystallises in a diffusive salinisation gradient, 370-395; In: Nucleation and Growth of Sedimentary Minerals (Eds P.H. Meister, C. Fischer and N. Preto), International Association of Sedimentology, Special Publication, 50

How to cite: Roeser, P., Böttcher, M. E., Lapham, L., Halas, S., Pretet, C., Nägler, T. F., Prieto, M., Struck, U., and Huckriede, H.: Barite precipitation in freshwater limnic sediments: a proxy for salinization, EGU General Assembly 2026, Vienna, Austria, 3–8 May 2026, EGU26-10930, https://doi.org/10.5194/egusphere-egu26-10930, 2026.

Soft, unlithified sediments recovered from modern lakes rarely offer clear evidence of diagenetic alterations. Recent work has documented products of early diagenesis in the deep lacustrine setting of Lake Van. Lake Van, cored in 2010 in the frame of the ICDP PALEOVAN project, is a terminal, alkaline lake in Eastern Anatolia, Turkey (McCormack & Kwiecien, 2021). The lake carbonate inventory consists of (1) primary phases: inorganic calcite and aragonite precipitating in surface water, and low-Mg calcite ostracod valves formed at the sediment-water interface; and (2) secondary phases: early diagenetic dolomite forming in the sediment pores and aragonite encrustation of ostracod valves and organic remains.  Here we focus on aragonite encrustations.

Encrusted grains appear episodically in Lake Van sediments younger than 270 ka, and their occurrence is restricted to two lithologies; homogenous and banded muds, representing lake low-stands, reduced primary productivity/preservation and a well-ventilated water column. Although lake level changes occurred in the past, the water depth of the coring site – today at 350 m – unlikely fell below 200 m.

SEM and thin section analyses of the as yet enigmatic encrustations show two generations of aragonite crystals; larger (10 – 20 μm), columnar to blocky ones (inside the closed valves) and a magnitude smaller (1 – 2 μm), columnar ones (outside the valves) intercalated with clay minerals and probably organic matter. The isotopic composition of encrusted valves contrasts with that of inorganic carbonates precipitating in the water column; higher δ18O values support a formation in cold bottom water, higher δ13C values are likely related to microbial activity, however, the nature of this relation is yet unclear. Encrusted valves are often articulated but display different stages of opening. As ostracod valves usually disarticulate within hours to days after the animal’s demise, semi-open valves suggest that the early diagenetic process was – in geological terms – extremely rapid.

Our finding calls for care and attention analyzing even sub-recent biogenic carbonates. The episodic and facies-bound occurrence suggests that encrustation is ultimately controlled by environmental factors, yet so far, we were unable to pinpoint these factors or a mechanism responsible for this process. If you are intrigued just like us, do get in touch!  


References

McCormack & Kwiecien, 2021. Coeval primary and diagenetic carbonates in lacustrine sediments challenge palaeoclimate interpretations. Scientific Reports    

How to cite: Kwiecien, O. and McCormack, J.:  Did you say ‘fast’? Mysterious early diagenesis in sub-recent lacustrine sediments of Lake Van, EGU General Assembly 2026, Vienna, Austria, 3–8 May 2026, EGU26-13965, https://doi.org/10.5194/egusphere-egu26-13965, 2026.

EGU26-14720 | ECS | Orals | SSP3.11

Microbialite morphogenesis controls arsenic incorporation as a chemical biosignature 

Clément G.L. Pollier, R. Pamela Reid, Erica P. Suosaari, Brooke E. Vitek, Christophe Dupraz, and Amanda M. Oehlert

Arsenic enrichment patterns are recognized as chemical biosignatures in microbialites, reflecting biologically mediated trace element cycling that can persist in the geological record. However, microbialites are not a uniform archive for chemical biosignatures because they exhibit a wide range of morphologies, internal fabrics, and accretion mechanisms, even within the same depositional system. How this variability in initial microbialite morphogenesis influences microbially influenced trace element incorporation and long-term preservation of associated chemical biosignatures remains largely unconstrained, limiting our ability to interpret arsenic enrichments in both modern and ancient microbialites.

Here, we investigated how microbialite morphogenesis controls arsenic enrichment patterns using actively accreting microbialites from Hamelin Pool, Shark Bay, Western Australia. We integrated petrographic characterization with sequential leaching experiments and elemental analyses to quantify arsenic concentrations of organic matter, micrite, and trapped-and-bound sedimentary fractions among microbialites with contrasting morphologies (sheet mats versus discrete buildups), fabrics (laminated versus clotted), and accretion mechanisms (micritic versus agglutinated). Our results show that arsenic enrichment patterns vary systematically with aspects of microbialite morphogenesis1. Specific trends in arsenic enrichment patterns arise from variable contributions of microbial activity, sedimentary inputs, and seawater chemistry, the relative importance of which is controlled by microbialite morphology, fabric, and accretion mechanism.

Consequently, arsenic enrichment patterns are not universal chemical biosignatures, but context-dependent archives of biological activity shaped by microbialite morphogenesis. By explicitly linking morphology, fabric, and accretion mechanism to arsenic incorporation pathways, this study provides a framework for interpreting arsenic enrichments in modern and ancient microbialites, and for distinguishing biological signals from environmental and sedimentary contributions. More broadly, because microbialite morphogenesis governs the relative contributions of organic matter, authigenic carbonate, and trapped sediment, the same architectural controls are likely to influence the incorporation and preservation of other trace elements commonly used as chemical biosignatures through geological time.

1. Pollier, C. G. L. et al. Arsenic enrichment patterns are defined by microbialite morphology, fabric, and accretion mechanism. Nature Communications 16, 10218 (2025).

How to cite: Pollier, C. G. L., Reid, R. P., Suosaari, E. P., Vitek, B. E., Dupraz, C., and Oehlert, A. M.: Microbialite morphogenesis controls arsenic incorporation as a chemical biosignature, EGU General Assembly 2026, Vienna, Austria, 3–8 May 2026, EGU26-14720, https://doi.org/10.5194/egusphere-egu26-14720, 2026.

Neoproterozoic Oxygenation Event (NOE) is significant oxidation of surface Earth environment on the eve of the origin of metazoan. Marine oxygenation of NOE, supported by multiple redox-sensitive proxies, is suggested to start in the interglacial period of Cryogenian snowball Earth ice ages. Paleoenvironmental conditions before Neoproterozoic Oxygenation Event were recorded in marine deposits in late Tonian ocean. We investigated marine authigenic mineral assemblages in fine-grained siliciclastic successions (<758 Ma), below Sturtian-age Chang’an diamictite (i.e., >720 Ma), deposited in deep-water basin, in South China. The authigenic mineral assemblages, occur as lenticular concretion, consist of sparry calcite, equant Fe-Mn-dolomite, and radial barite fans. There is sharp contact between Fe-rich zone and Mg-rich zone in the equant dolomites. The carbonate isotopes of authigenic carbonate minerals yield a highly 13C-depleted variation range from -15‰ to -20‰ (relative to V-PDB). In addition, there is scarce pyrite in concretion and host rock of siltstone whereas radial barite fans exist closely with dolomite. The barites yield consistent δ34S values of ~+27.5‰ (relative to V-CDT). The results suggest that there was possibly significant Fe-Mn reduction-driven organic oxidation in early-diagenetic sediment under a bottom-water condition beneficial to the formation of manganese and iron oxidant/hydroxide. Moreover, the occurrence of authigenic sulfate with modern seawater-like δ34S is interpreted as the consequence of widespread sulfide re-oxidation at late-Tonian seafloor. We link authigenic mineral assemblage with sporadic seafloor oxidation in deep-water basin before Neoproterozoic Oxygenation Event.

How to cite: Wang, Z., Liu, C., and Yang, J.: Pre-NOE seafloor oxidation archived in authigenic mineral assemblage in late Tonian marine sediments, South China, EGU General Assembly 2026, Vienna, Austria, 3–8 May 2026, EGU26-16678, https://doi.org/10.5194/egusphere-egu26-16678, 2026.

EGU26-20427 | Posters on site | SSP3.11

Biofilm and carbonate trace metals as biomarkers : tentatively tracking enzymatic pathways in geobiological objects  

Daniel Ariztegui, Camille Thomas, Christophe Thomazo, Johanna Marin-Carbonne, Julien Alleon, Amotz Agnon, Nuphar Gedulter, Kadda Medjoubi, Stephanie Sorieul, and Caroline Thaler

The redox evolution of Earth and the evolution of life are tightly coupled through the progressive bioavailability of transition metals. As microbial metabolisms emerged and diversified, newly available metals were incorporated into oxydoreductase enzymes, reshaping global biogeochemical cycles and the redox state of the atmosphere and oceans. This evolutionary history is preserved in microbial metallomes, which record the metals integrated into metabolic nanomachinery over geological time and thus provide potential proxies for paleo-metabolic reconstructions.

Here, we imaged trace-metal distributions in commercial enzymes, modern carbonate spherules from microbial mats of the Dead Sea shores, and Archean mineralized biofilms from the 2.72 Ga Tumbiana formation using synchrotron-based XRF and particle-induced X-ray emission (PIXE), and integrate sedimentological, mineralogical, and geochemical constraints to infer the nature of the microbial metabolisms involved. Beyond this comparative approach, we aim to assess whether mineralized microbial systems retain diagnostic signatures of ancient metabolic pathways and redox conditions.

In practice, trace-metal measurements in enzymes are feasible, as demonstrated by our synchrotron-based analyses of carbonic anhydrase and associated calcium carbonate, which show systematic Zn enrichment. In modern arsenic-rich microbial mats from the Dead Sea, carbonate (aragonite) spherules and needles are enriched in Sr and Ni, likely linking carbonate precipitation to urease activity, which contains two Ni²⁺ ions per active site. Despite strong arsenic enrichment in the extracellular polymeric substances (EPS) driven by seasonal arsenic pulses in spring waters (Thomas et al., 2024), arsenic is excluded from the carbonate crystal lattice. In arsenic-rich Tumbiana stromatolitic laminae, PIXE analyses of layers containing nanopyrite and carbonaceous matter reveal complex but potentially syngenetic metal distributions. Multivariate discrimination identifies metal signatures in carbonaceous horizons dominated by As, Cu, and Mo. Taking into account both passive abiotic metal enrichment and previous interpreted metabolic signatures inferred for  the Tumbiana Formation stromatolites (i.e.  arsenic reduction and oxidation, nitrification and denitrification, sulfate reduction, anaerobic oxidation of methane ; Marin-Carbonne et al., 2018; Sforna et al., 2014; Thomazo et al., 2011) metallomic signatures may be in agreement with microbial arsenic and nitrogen cycling (Sforna et al., 2014). Given the complexity and different nature of metal accumulation in those enzymes, carbonates or modern and fossilized biofilms, extracting a metabolic signature associated to a metallome remains elusive without integrating lab-based approaches. Further work is therefore needed to constrain metal circulation and immobilization in organic matter (EPS, biofilm) and mineralizing phases to better assess biosignatures associated to metals and their isotopes in such objects.

Marin-Carbonne et al. (2018). Sulfur isotope’s signal of nanopyrites enclosed in 2.7 Ga stromatolitic organic remains reveal microbial sulfate reduction. Geobiology, 16(2), 121–138. 

Sforna et al. (2014). Evidence for arsenic metabolism and cycling by microorganisms 2.7 billion years ago. Nature Geoscience, 7(11), 811–815. 

Thomas et al. (2024). Combined Genomic and Imaging Techniques Show Intense Arsenic Enrichment Caused by Detoxification in a Microbial Mat of the Dead Sea Shore. Geochemistry, Geophysics, Geosystems, 25(3), e2023GC011239. 

Thomazo et al., (2011). Extreme 15N-enrichments in 2.72-Gyr-old sediments: Evidence for a turning point in the nitrogen cycle. Geobiology, 9(2), 107–120.


How to cite: Ariztegui, D., Thomas, C., Thomazo, C., Marin-Carbonne, J., Alleon, J., Agnon, A., Gedulter, N., Medjoubi, K., Sorieul, S., and Thaler, C.: Biofilm and carbonate trace metals as biomarkers : tentatively tracking enzymatic pathways in geobiological objects , EGU General Assembly 2026, Vienna, Austria, 3–8 May 2026, EGU26-20427, https://doi.org/10.5194/egusphere-egu26-20427, 2026.

EGU26-20592 | ECS | Orals | SSP3.11

Early diagenetic evolution of shelly phosphorites: REE signatures traced by LA-ICP-MS mapping 

Sophie Graul, Vincent Monchal, Paul Guyett, Rémi Rateau, Andre Gregor, Nata-Ly Pantšenko, and Rutt Hints

Sedimentary phosphorites are the primary sources of nitrogen-phosphorus-potassium fertilisers, and they have recently been highlighted as a potential economic source of rare earth elements (REE). The growing need for clean technologies strongly influences the demand for REE, and in Europe, most deposits have not been investigated in detail since the 1970-1980s.

Lower-Ordovician shelly phosphorites in Estonia are among Europe's most extensive phosphate rock reserves, with a tonnage of approximately three billion tons. The ore consists of sandstone rich in phosphatic brachiopod fragments deposited in a shallow marine peritidal environment of the Baltic Paleobasin. Mineralisation is carried out carbonate fluorapatite (CFA), an apatite with a highly diverse chemical composition [Ca10-a-bNaaMgb(PO4)6-x(CO3)x-y-z(CO3⋅F)x-y-z(SO4)zF2]. The shells themselves are complex objects, with apatite originating from the crystallisation of organic tissues and the precipitation of secondary phosphate during sediment burial. The partitioning and uptake of the individual REEs in them depend on many factors, including input from marine sources, the oxygenation state of the sedimentary column, and the precursors carriers phases of REEs that may have different affinities for each rare earth.

In the REMHub project, investigations were conducted on three deposits: Toolse, Aseri, and Ülgase; representing a dataset of 630 ablations up to date. The LA-ICP-MS imaging technique developed by Drost (2018), addressed elemental distribution as raster maps, allowing identification and discrimination by integrating semi-quantitative data through elements' stepwise distribution. Diagenetic stages and compositions were evaluated using the following pathfinders as pooling channels. Sr, U, and Ce. 

On average, apatites present homogeneous REE patterns, MREE-enriched up to 15-folds compared to PAAS, with Y-Ce anomalies indicative of early-digenetic overprinting.  However, the degree of overprint varied. In Ülgase, authigenic concretions and shells presented depleted REE signals, close to coastal signature. However, concretions showed a lower enrichment (∑REE 400-800ppm) compared to shells (REE 1500-3000 ppm). In Toolse, shells presented intermediate recrystallised textures, with Sr-U-depleted stages allowing the tracing of pristine signals, and U-rich stages presenting marked Gd-U and La anomalies. The average REE grade is 1966ppm. In Aseri, U-sorting reveals a second, alteration-driven enrichment in which the fragment edges present a ΣREE up to 12 754ppm (120 folds).

Overall, investigations demonstrated a progressive evolution of REE signals during early diagenesis, highly influenced by redox cycles in shallow sediments, authigenic recrystallisation, organic matter decomposition within the shells, and possibly late distal alteration fluids.


How to cite: Graul, S., Monchal, V., Guyett, P., Rateau, R., Gregor, A., Pantšenko, N.-L., and Hints, R.: Early diagenetic evolution of shelly phosphorites: REE signatures traced by LA-ICP-MS mapping, EGU General Assembly 2026, Vienna, Austria, 3–8 May 2026, EGU26-20592, https://doi.org/10.5194/egusphere-egu26-20592, 2026.

Mineral surfaces can be considered fascinating records of geochemical environments. Microscopic surface features, such as growth spirals, etch pits, macrosteps, twinning, and intergrowths, reveal the history of their formation and alteration. Nanoparticles and micro-size particles can often have diverse and rich morphology in some cases resembling living organisms. Bacteria and other organisms often leave morphological signatures of their presence as etch pits, incrusting precipitates, stromatolites, or other fossilized forms. In order to understand which structures can be read as biogenic or abiotic, it is necessary to consider different molecular-scale scenarios leading to their development.

Kinetic modelling of mineral-water interaction provides important insights into the mechanistic relationships between mineral structure, water chemical composition, and morphological surface features. In this talk, I will show mechanisms and pathways for etch pit formation, crystal and biomorph growth, derived from my kinetic Monte Carlo and Cellular Automata simulations. I will also discuss bacterial etch pit tracers and their formation mechanisms.

References:

 Kurganskaya, I., 2024. Dissolution Mechanisms and Surface Charge of Clay Mineral Nanoparticles: Insights from Kinetic Monte Carlo Simulations. Minerals 14, 900. https://doi.org/10.3390/min14090900

Kurganskaya, I., Churakov, S.V., 2018. Carbonate Dissolution Mechanisms in the Presence of Electrolytes Revealed by Grand Canonical and Kinetic Monte Carlo Modeling. J. Phys. Chem. C 122, 29285–29297. https://doi.org/10.1021/acs.jpcc.8b08986

Kurganskaya, I., Luttge, A., 2021. Mineral Dissolution Kinetics: Pathways to Equilibrium. ACS Earth Space Chem. 5, 1657–1673. https://doi.org/10.1021/acsearthspacechem.1c00017

Kurganskaya, I., Luttge, A., 2013a. Kinetic Monte Carlo Simulations of Silicate Dissolution: Model Complexity and Parametrization. J. Phys. Chem. C 117, 24894–24906. https://doi.org/10.1021/jp408845m

Kurganskaya, I., Luttge, A., 2013b. A comprehensive stochastic model of phyllosilicate dissolution: Structure and kinematics of etch pits formed on muscovite basal face. Geochimica et Cosmochimica Acta 120, 545–560. https://doi.org/10.1016/j.gca.2013.06.038

García-Ruiz, J.M., 2023. Biomorphs, in: Encyclopedia of Astrobiology. Springer, Berlin, Heidelberg, pp. 395–399. https://doi.org/10.1007/978-3-662-65093-6_5464

García-Ruiz, J.M., Nakouzi, E., Kotopoulou, E., Tamborrino, L., Steinbock, O., 2017. Biomimetic mineral self-organization from silica-rich spring waters. Science Advances 3, e1602285. https://doi.org/10.1126/sciadv.1602285


How to cite: Kurganskaya, I.: Kinetic modelling of mineral dissolution and growth: biomorph formation, surface morphologies, and bacterial tracers, EGU General Assembly 2026, Vienna, Austria, 3–8 May 2026, EGU26-20837, https://doi.org/10.5194/egusphere-egu26-20837, 2026.

EGU26-21542 | Posters on site | SSP3.11

  Iron oxidation and associated structural alterations in K-bearing minerals: How do they impact K phytoavailability in soils? 

Atsushi Nakao, Ayano Nakajima, Toshihiro Kogure, and Junta Yanai

Potassium (K) is ubiquitous in soils and has therefore received much less attention in modern edaphology compared with nitrogen (N) and phosphorus (P). However, the need to elucidate the phytoavailability of native soil K has recently been re-emphasized due to the rising cost of K fertilizers. Although native soil K largely occurs in minerals in immobile forms, biotite—a trioctahedral mica containing iron (Fe) and magnesium (Mg) in the octahedral sheet—can release K more rapidly than other K-bearing minerals. Octahedral Fe in biotite, originally present as ferrous iron (Fe²+), is oxidized to ferric iron (Fe³+). This Fe oxidation is hypothesized to cause two opposing effects on K retention. If the oxidized Fe³+ remains in the trioctahedral structure, the reduced layer charge may weaken K retention in the interlayer. Conversely, if part of the oxidized Fe³+ is released from the octahedral sheet, the structure shifts from a trioctahedral to a dioctahedral type, which may strengthen interlayer K retention. Although both mechanisms have been proposed, no direct evidence has been provided to date. The objective of this study was to determine how Fe oxidation in biotite influences K retention in the interlayer.

Biotite (2–50 µm) was first treated with sodium (Na) tetraphenylborate solution to replace most interlayer K with Na. The Na-biotite was then reacted with H2O2 at molar ratios of 0, 0.1, 0.5, and 10 relative to structural Fe, resulting in Fe³⁺ proportions of 6%, 30%, 69%, and 92%, respectively. These oxidized Na-biotite samples were subsequently washed several times with KCl solution to refill the interlayer with K, yielding biotite samples with varying degrees of Fe oxidation. Their atomic arrangements were characterized by X-ray diffraction (XRD), Fourier-transform infrared spectroscopy (FTIR), and transmission electron microscopy (TEM). Iron speciation was examined using selective dissolution analysis and Mössbauer spectroscopy. The release rate of interlayer K from biotite was evaluated using a resin extraction method.

XRD 060 reflections clearly showed a gradual shift from tri- to dioctahedral structures with increasing Fe³+ proportions, which was also supported by shifts in the OH absorption bands in the FTIR spectra. Although we initially assumed that this alteration would strengthen interlayer K retention, the oxidized and dioctahedral biotite released K more rapidly than the less oxidized samples. The weaker K retention after Fe oxidation could not be explained solely by changes in the octahedral sheet structure. TEM analysis revealed that highly oxidized biotite exhibited partially expanded interlayer spaces, which were likely filled with Fe hydroxides.

We concluded that Fe oxidation not only modifies the octahedral sheet structure but also promotes the formation of Fe hydroxides within the interlayer, leading to weakened K retention and enhanced K release from biotite.

How to cite: Nakao, A., Nakajima, A., Kogure, T., and Yanai, J.:   Iron oxidation and associated structural alterations in K-bearing minerals: How do they impact K phytoavailability in soils?, EGU General Assembly 2026, Vienna, Austria, 3–8 May 2026, EGU26-21542, https://doi.org/10.5194/egusphere-egu26-21542, 2026.

The precipitate dolomite under Earth surface conditions has been a longstanding problem in geology. Many experiments have been performed under different conditions using a wide range of additives, including different precursor minerals, such as aragonite, organic matter, bacteria, and more recently also sulphide, microbial expopolymeric substances, or clay minerals. At the same time, a study by Gregg et al. (2015) revealed that many of these experiments exhibit no ordering peaks (c-reflections) characteristic of ordered dolomite. The c-reflections are specific for the R-3 symmetry of dolomite showing cation ordering. If the ordering reflections are missing, the mineral exhibits an R-3c symmetry typical of calcite, even if the cations Ca2+ and Mg2+ occur in a near to 1:1 stoichiometric ratio – this mineral is informally called “Very high Mg-calcite” or “protodolomite”. Gregg et al. (2015) revealed that the ordering peaks have been misinterpreted in several experimental studies, and that they may in fact represent peaks of other phases, such as phosphates. Here we revisit the discussion initiated by Gregg et al. (2015), suggesting an alternative origin for the reflection at 34.7° 2theta, i.e. at the position where the 015-ordering reflection of dolomite would be expected.

A diffraction peak occurs around 34.6° 2theta in a wide range of clay minerals, such as illite, smectites, and kaolinite. While clay minerals usually exhibit only very broad baseline elevations rather than distinct peaks at higher 2theta angles, the peak seems to amplify by superposition of diffraction patterns if multiple clay minerals are present, giving rise to a sharp peak. This has been recognised in natural shale samples from Pierre Shale (South Dakota, USA; Schultz, 1964) containing a variety of different clay minerals.

In conclusion, caution must be taken in dolomite precipitation experiments if clay-rich sediment is added as a carbonate-free matrix or nucleation substrate, where the XRD reflections of clay minerals may indeed mimic the 015-ordering reflection of dolomite within 0.1° 2theta. This essentially would leave the finding of ordered dolomite unconfirmed.

Gregg, J.M., Bish, D.L., Kaczmarek, S.E. and Machel, H.G. (2015) Mineralogy, nucleation and growth of dolomite in the laboratory and sedimentary environment: a review. Sedimentology, 62, 1749–1769.

Schultz, L.G. (1964) Quantitative interpretation of mineralogical composition from x-ray and chemical data for the pierre shale. Geological Survey Professional Paper 391-C. U.S. Government Printing Office, Washington, D.C. 20402.

How to cite: Gier, S. and Meister, P.: An X-ray diffraction signal common to a wide range of clay minerals can mimic the 015-ordering reflection of dolomite, EGU General Assembly 2026, Vienna, Austria, 3–8 May 2026, EGU26-22356, https://doi.org/10.5194/egusphere-egu26-22356, 2026.

BG7 – Extraterrestrial and Extreme Environment Biogeosciences

EGU26-3227 | ECS | Orals | BG7.1

Anomalous high geomagnetic reversal frequency at the end-Permian 

Min Zhang, Huafeng Qin, Chenglong Deng, Shu-zhong Shen, Rixiang Zhu, and Yongxin Pan

High-resolution geomagnetic record at the end Permian is essential for probing the Earth’s core dynamics, stratigraphic dating, correlation of continental strata with marine ones, as well as linkage between biosphere variation and geomagnetic field. Here, we report a high-resolution geomagnetic polarity sequence across the Permian Guadalupian-Lopingian boundary (GLB, ~260 million year) from South China. This record reveals an episode of exceptionally high polarity reversal rate. Notably, fluctuations in the geomagnetic polarity reversal coincide with major global changes - including Pangea configuration shift, widespread volcanism, and Paleozoic sea-level lowstand and biodiversity perturbations. Cross-correlations indicate that moderate environmental stress may enhance biodiversity, whereas exceeding tolerance thresholds drives the biodiversity declines and potential extinction events. These findings highlight that geodynamic forcing as an essential control on the long-term stability and habitability of biosphere.

How to cite: Zhang, M., Qin, H., Deng, C., Shen, S., Zhu, R., and Pan, Y.: Anomalous high geomagnetic reversal frequency at the end-Permian, EGU General Assembly 2026, Vienna, Austria, 3–8 May 2026, EGU26-3227, https://doi.org/10.5194/egusphere-egu26-3227, 2026.

EGU26-6920 | ECS | Orals | BG7.1

Non-dipole features of the geomagnetic field on the 100 kyr timescale 

Pengfei Liu, Sanja Panovska, Keke Zhang, and Ann Hirt

Sedimentary paleomagnetic records provide valuable insights into the behavior of Earth’s magnetic field on millennial to multi-millennial timescales. Directional scatter produced by paleosecular variation (PSV) tends to be elongated along the north–south axis of the magnetic meridian, and the magnitude of this effect depends on site latitude. In contrast, inclination shallowing generates an elongation that is oriented east–west, perpendicular to the magnetic meridian. One of the major issues in the PSV studies is whether such archives have undergone inclination flattening, caused by sediment compaction, which distorts the primary direction of remanence. Moreover, it is necessary to distinguish the non-dipole component of the geomagnetic field with inclination shallowing in the recording signal.

To address this, we applied the recently developed SVEI method (based on the THG24 model) to examine 82 lacustrine and marine records spanning the past 100 kyr for inclination flattening, and found evidence in only one case. However, the traditional E/I approach, based on the TK03.GAD, suggests flattening at 27 mid-latitude sites. When correction inclinations were utilized to construct the model, the comparison result reveals that octupole terms were most affected, underscoring the sensitivity of these higher-order components to inclination flattening. The THG24 model extends beyond the geocentric axial dipole (GAD) representation, employed in TK03.GAD, by incorporating additional axial quadrupole and octupole contributions to the geomagnetic field. This implies that mid-latitude “flattening” signals are non‑dipole contributions rather than by compaction, highlighting that the non-dipole features remain a significant component of the geomagnetic field over the past 100 kyr.

How to cite: Liu, P., Panovska, S., Zhang, K., and Hirt, A.: Non-dipole features of the geomagnetic field on the 100 kyr timescale, EGU General Assembly 2026, Vienna, Austria, 3–8 May 2026, EGU26-6920, https://doi.org/10.5194/egusphere-egu26-6920, 2026.

EGU26-7258 | ECS | Posters on site | BG7.1

Possible biological effects of geomagnetic perturbations in the South Atlantic Anomaly 

Jianxun Shen, Yaochen Yue, Zhaojin Rong, Wei Lin, Yong Wei, and Yongxin Pan

The South Atlantic Anomaly (SAA), characterized by a significantly weakened geomagnetic field, provides a unique natural laboratory to study the biological and ecological consequences of altered magnetic shielding. This region exhibits a large magnetic potential gradient between its central depression (where surface intensity can be 47.8% weaker than the global average according to the CHAOS-8.2 model). Following geomagnetic storms, the SAA experiences enhanced particle precipitation, leading to pronounced atmospheric disturbances. These include prolonged ozone depletion and potential impacts on cloud microphysics and regional climate patterns. Furthermore, the anomalous magnetic environment may directly affect biology by disrupting magnetoreception in migratory species and influencing physiological processes. This synthesis highlights the critical interplay between geomagnetic activity, the distinct magnetic landscape of the SAA, and its multifaceted effects on ecosystems, offering insights into planetary habitability under evolving magnetic conditions.

How to cite: Shen, J., Yue, Y., Rong, Z., Lin, W., Wei, Y., and Pan, Y.: Possible biological effects of geomagnetic perturbations in the South Atlantic Anomaly, EGU General Assembly 2026, Vienna, Austria, 3–8 May 2026, EGU26-7258, https://doi.org/10.5194/egusphere-egu26-7258, 2026.

EGU26-7291 | ECS | Posters on site | BG7.1

Physics-informed neural networks for geomagnetic data assimilation 

Jinfeng Li and Keke Zhang

We present a physics-informed neural network (PINN) framework for geomagnetic data assimilation, aimed at reconstructing the time-dependent state of the Earth’s outer core, consistent with both geomagnetic observations and the governing equations of the geodynamo. The method incorporates the quasi-geostrophic magneto–Archimedean–Coriolis (QG–MAC) balance, together with the magnetic induction and thermal diffusion equations, as embedded physical constraints within the neural network training. Flow, magnetic, and temperature fields are represented using a poloidal–toroidal spectral decomposition, enabling an efficient description of large-scale core dynamics in a rotating spherical shell.

Synthetic assimilation experiments based on benchmark dynamo models demonstrate that the proposed framework can successfully recover the temporal evolution of the core state from magnetic field observations, with the reconstructed flow and magnetic fields reproducing the main characteristics of the reference solutions. The results further indicate that the method is capable of recovering small-scale magnetic field features at the core–mantle boundary. The framework is subsequently applied to geomagnetic data assimilation using observations from the COV-OBS geomagnetic field model. Using approximately 180 years of historical geomagnetic observations, we reconstruct the structure of the Earth’s core state and perform short-term (20 years) predictions of the magnetic field evolution.

How to cite: Li, J. and Zhang, K.: Physics-informed neural networks for geomagnetic data assimilation, EGU General Assembly 2026, Vienna, Austria, 3–8 May 2026, EGU26-7291, https://doi.org/10.5194/egusphere-egu26-7291, 2026.

Biogenic magnetite nanoparticles produced by microorganisms are ubiquitous in modern environments and are also thought to be abundant in ancient sediments such as banded iron formations and paleosols, given the early emergence of iron-metabolizing microbes. Magnetite can form intracellularly within magnetotactic bacteria (MTB) or extracellularly through dissimilatory iron-reducing bacteria (DIRB). While MTB-derived magnetite exhibits distinctive morphological, chemical, and magnetic biosignatures, identifying DIRB-produced magnetite in ancient sediments remains challenging because its nanometer-sized, aggregated, and often superparamagnetic nature overlaps strongly with abiotic magnetite. In this study, we systematically investigate the behavior of 21 trace elements in biogenic magnetite and abiotic magnetite formed via the transformation of ferrihydrite substrates coprecipitated with different trace-element concentrations. Biogenic magnetite was produced by the DIRB Shewanella oneidensis MR-1, while abiotic magnetite was generated using dissolved Fe²⁺ under comparable conditions. Notably, biogenic magnetite particles were consistently smaller than their abiotic counterparts under same conditions, suggesting that microbial processes impose additional constraints on crystal growth. Additionally, ICP-MS results reveal that most trace elements are preferentially enriched in abiotic magnetite, whereas cobalt (Co) and cadmium (Cd) are consistently enriched in biogenic magnetite, independent of initial trace-element concentrations or washing treatment. In contrast, magnesium (Mg) shows preferential incorporation into abiotic magnetite. The observed differences in trace-element signatures, particularly Co–Cd enrichment in biogenic magnetite and Mg enrichment in abiotic magnetite, provide a promising geochemical indicator for identifying DIRB activity in ancient iron-rich sediments and reconstructing microbial iron cycling in early oceans.

How to cite: Han, X., Lin, W., and Pan, Y.: Trace Element Partitioning as a Geochemical Biosignature of Biogenic Magnetite Formed by Iron-Reducing Bacteria, EGU General Assembly 2026, Vienna, Austria, 3–8 May 2026, EGU26-8690, https://doi.org/10.5194/egusphere-egu26-8690, 2026.

EGU26-8883 | Orals | BG7.1

Stratified niche partitioning of magnetotactic bacteria near a simulated oxic–anoxic transition zone 

Juan Wan, Jiaqi Zheng, Runjia Ji, Sheng Yu, Rixiang Zhu, and Wei Lin

Magnetotactic bacteria (MTB) are a unique group of microorganisms that biomineralize membrane-bound magnetic nanoparticles, termed magnetosomes. These magnetosomes are generally arranged into chains, enabling MTB to sense and navigate along the geomagnetic field lines and efficiently locate their preferred living zone, most commonly the oxic–anoxic transition zone (OATZ). MTB show remarkable morphological and taxonomic diversity and are widely distributed in freshwater, marine, and extreme environments, where they play important roles in the cycling of Fe, C, P, S. However, the in situ niches and spatiotemporal distribution patterns of different MTB lineages remain poorly understood. In this study, MTB cells were first isolated and enriched from a freshwater lake in Beijing, China, and then cultivated under simulated OATZ conditions in glass tubes. Transmission electron microscopy (TEM) observations revealed three representative MTB lineages: magnetotactic cocci (belonging to the class Magnetococcia) producing prismatic-shaped magnetite, magnetotactic spirilla (Alphaproteobacteria) forming cuboctahedral-shaped magnetite, and magnetotactic curved-rods (Desulfovibrionia) producing bullet-shaped crystals. During incubation, the initially formed microbial band in the OATZ developed a clear vertical stratification, with microaerobic conditions in the upper and middle layers and anaerobic conditions in the lower layer. TEM observations and metagenomic quantification demonstrated that magnetotactic cocci dominated the upper layer, magnetotactic spirilla were most abundant in the middle layer, and magnetotactic curved-rods were largely confined to the lower layer. Finally, metabolic reconstruction based on genomic data indicates that differences in oxygen-related metabolic pathways may be responsible for this vertical segregation. Collectively, our results demonstrate oxygen-driven niche partitioning among MTB lineages within the OATZ, highlighting their distinct metabolic adaptations and ecological roles.

How to cite: Wan, J., Zheng, J., Ji, R., Yu, S., Zhu, R., and Lin, W.: Stratified niche partitioning of magnetotactic bacteria near a simulated oxic–anoxic transition zone, EGU General Assembly 2026, Vienna, Austria, 3–8 May 2026, EGU26-8883, https://doi.org/10.5194/egusphere-egu26-8883, 2026.

EGU26-8908 | ECS | Orals | BG7.1

Magnetic Field Effects on Chiral Selection in Peptide Formation Mediated by N-aa-AMP 

Min Zhang, Xiangxiao Zheng, Jianjia Chen, Shuang Xie, Yufen Zhao, and Jianxi Ying

Peptide synthesis in modern biology proceeds via aminoacyl adenylates (5′-aa-AMP), which are central to both peptide bond formation and chiral recognition. Inspired by this mechanism, our previous work showed that amino acids, adenosine, and trimetaphosphate can spontaneously form N-aminoacyl adenylates (N-aa-AMP) under aqueous conditions, suggesting N-aa-AMP as a plausible prebiotic precursor of 5′-aa-AMP. Importantly, N-aa-AMP formation exhibits intrinsic chiral selectivity, with L-amino acids preferentially pairing with D-nucleosides and vice versa, raising the question of whether such selectivity persists during peptide synthesis.

We previously investigated peptide formation between N-Phe-F-AMP and racemic amino acids at pH 9 and 37 °C. N-L-Phe-F-AMP preferentially reacts with L-amino acids, promoting homochiral dipeptide formation, while N-D-Phe-F-AMP shows the corresponding mirror selectivity. This behavior is consistent across several amino acids (Ile, Leu, Ala, Val, and Pro), with homochiral excesses ranging from 12.04% to 67.84%, demonstrating that N-aa-AMP intrinsically directs chiral selection during peptide formation. Here, we investigated the effect of magnetic fields on this process. Compared with moderate magnetic fields (MMF), geomagnetic (GMF) and hypo-magnetic (HMF) conditions significantly enhance chiral selectivity, with the strongest amplification observed under HMF. These results suggest that the weak magnetic environment of early Earth may have influenced reaction dynamics and intermolecular interactions, thereby facilitating chiral amplification during prebiotic peptide synthesis.

Overall, our findings indicate that N-aa-AMP can promote homochiral peptide formation under enzyme-free and metal-free prebiotic conditions, while magnetic fields may serve as an additional physical factor modulating chiral selection. This work introduces magnetic effects into prebiotic reaction networks and provides new insights into the emergence of biological homochirality.

How to cite: Zhang, M., Zheng, X., Chen, J., Xie, S., Zhao, Y., and Ying, J.: Magnetic Field Effects on Chiral Selection in Peptide Formation Mediated by N-aa-AMP, EGU General Assembly 2026, Vienna, Austria, 3–8 May 2026, EGU26-8908, https://doi.org/10.5194/egusphere-egu26-8908, 2026.

EGU26-8909 | ECS | Orals | BG7.1

Geomagnetic Field Modulation of Prebiotic N-Carbamoylation 

Fude Chen, Xiangxiao Zheng, Shichao Yu, Shuang Xie, Yufen Zhao, and Jianxi Ying

The search for extraterrestrial life requires rigorous criteria to distinguish between abiotic chemical networks and authentic biosignatures. The evolution of complex macromolecules from simple precursors is a pivotal event in the origin of life. Pathways such as the Strecker synthesis and cyanate polymerization reactions elucidate the availability of building blocks. The role of the geomagnetic field (GMF) in shaping prebiotic chemical evolution has mainly remained underexplored. Here, we investigate the GMF as a potential regulator of the urea-mediated N-carbamoylation of amino acids, a crucial thermodynamic pathway for the formation of prebiotic peptides.

By simulating primordial planetary conditions, we systematically evaluated the reaction efficiency of all proteinogenic amino acids under GMF (~50 µT) and hypo-magnetic field (HMF, <20 nT) conditions. The yield of CAA production from most amino acids (14/20) is significantly higher under GMF. These results revealed a nuanced landscape of magnetic sensitivity. While statistically significant yield variations were observed between GMF and HMF environments, no uniform directional trend was evident across the amino acid spectrum. Instead, magnetic field effects were heterogeneous and contingent on specific side-chain characteristics.

These findings suggest that the GMF functions not as a dominant driver but as a subtle modulator of prebiotic synthesis. We hypothesize that the GMF likely influenced the distribution of early peptides, acting as an auxiliary variable that contributes to the complexity of prebiotic chemical evolution on Earth and potentially habitable exoplanets.

How to cite: Chen, F., Zheng, X., Yu, S., Xie, S., Zhao, Y., and Ying, J.: Geomagnetic Field Modulation of Prebiotic N-Carbamoylation, EGU General Assembly 2026, Vienna, Austria, 3–8 May 2026, EGU26-8909, https://doi.org/10.5194/egusphere-egu26-8909, 2026.

EGU26-11432 | ECS | Posters on site | BG7.1

GdbMTB: A Curated Genomic Database of Magnetotactic Bacteria 

Runjia Ji, Yongxin Pan, and Wei Lin

Magnetotactic bacteria (MTB) are microorganisms that navigate Earth's geomagnetic field by biomineralizing intracellular, membrane-bound nanocrystals of magnetite (Fe3O4) and/or greigite (Fe3S4), known as magnetosomes. These bacteria are important models for studying magnetoreception and biomineralization, with broad implications for astrobiology, paleoenvironmental reconstruction, sedimentary magnetism, and biomedical applications. Although, MTB have been identified across at least 16 bacterial phyla, their study has been hampered by challenges in cultivation. Genome-resolved metagenomics has thus become essential for elucidating their metabolic diversity, ecological adaptations, and evolutionary history. Despite the rapid accumulation of MTB genomes, these data are scattered across different databases, often with inconsistent quality assessments and incomplete metadata, which hinder comprehensive comparative and interdisciplinary analyses.

To address this, we developed the Genomic Database of Magnetotactic Bacteria (GdbMTB, https://www.gdbmtb.cn/), a curated genomic resource dedicated to MTB research. GdbMTB integrates publicly available MTB genomes and associated metadata, and applies a standardized bioinformatics workflow to provide uniform quality assessment, taxonomic classification, and annotations of magnetosome-related genes. Each genome is accompanied by environmental and publication metadata, offering context and traceability to original studies. With an interactive, user-friendly interface and direct links to external genomic databases, GdbMTB facilitates intuitive data exploration and cross-database navigation.

By consolidating high-quality MTB genomic resources with comprehensive metadata, GdbMTB establishes a foundation for large-scale, interdisciplinary studies on the ecology, evolution, and environmental significance of magnetotactic bacteria.

How to cite: Ji, R., Pan, Y., and Lin, W.: GdbMTB: A Curated Genomic Database of Magnetotactic Bacteria, EGU General Assembly 2026, Vienna, Austria, 3–8 May 2026, EGU26-11432, https://doi.org/10.5194/egusphere-egu26-11432, 2026.

EGU26-15577 | ECS | Posters on site | BG7.1

The Effects of Extremely Low Geomagnetic Field Intensity on the Mammalian Central Nervous System 

Jie Ren, Yukai Luo, Bingfang Zhang, Lanxiang Tian, Weixiang Guo, and Yongxin Pan

Accumulating evidence has shown that exposure to an extremely low magnetic field (hypomagnetic field, HMF, <5 µT) for extended periods has detrimental effects on the function of multiple systems in animals. In the adult mammalian brain, neural stem cells are present in the subventriclular zone and the dentate gyrus. These cells continually generate new neurons, which support learning and memory. This process of adult neurogenesis is highly sensitive to external environmental stimuli. We have experimentally revealed that, after long-term exposure to HMF, mice showed defective adult neurogenesis and cognitive dysfunction. Mechanistically, HMF exposure directly inhibits adult neurogenesis by suppressing mitochondrial oxidative phosphorylation and reducing the levels of endogenous reactive oxygen species (ROS) in neural stem cells. Additionally, HMF exposure increases the global ROS levels in the hippocampus. This ROS increase triggers oxidative stress and activates downstream inflammatory pathways, ultimately leading to chronic neuroinflammation. These findings indicate the essential role of the ambient geomagnetic field (GMF) in maintaining adult neurogenesis and cognitive function in mice and provide valuable hints for assessing the potential risks extremely weak magnetic field exposure in future manned deep-space missions.

How to cite: Ren, J., Luo, Y., Zhang, B., Tian, L., Guo, W., and Pan, Y.: The Effects of Extremely Low Geomagnetic Field Intensity on the Mammalian Central Nervous System, EGU General Assembly 2026, Vienna, Austria, 3–8 May 2026, EGU26-15577, https://doi.org/10.5194/egusphere-egu26-15577, 2026.

EGU26-16252 | Posters on site | BG7.1 | Highlight

A NSFC Project: The Geomagnetic Field and Life 

Yongxin Pan, Yufen Zhao, Yong Wei, Jianli Li, Wei Lin, Sheng Yu, and Rixiang Zhu

The geomagnetic field (GMF) and life both emerged in the early Earth and have co-evolved to the present day. The spatial and temporal variations of the GMF have profoundly influenced the environment and biosphere. The NSFC’s Outstanding Research Group Project "The Geomagnetic Field and Life" is dedicated to exploring this fundamental relationship through interdisciplinary research. We bring together leading experts from China in Earth sciences, biology, chemistry, and information science. Our integrated approach focuses on developing high-sensitivity magnetic instrumentation to conduct systematic, multi-scale studies. Core research objectives include: 1) correlating spatiotemporal geomagnetic variations with major events in the history of life, 2) characterizing changes in the palaeomagnetic field, 3) investigating the biological effects of magnetic fields, and 4) elucidating the cellular and molecular mechanisms of magnetoreception. This project aims to establish a theoretical framework for understanding how geomagnetic field variations have shaped Earth's habitable conditions and the evolution of life. It also seeks to advance applications of biomagnetic effects and biogenic magnetic nanomaterials. Ultimately, this project will provide new insights into the co-evolution of life and the geomagnetic environment.

How to cite: Pan, Y., Zhao, Y., Wei, Y., Li, J., Lin, W., Yu, S., and Zhu, R.: A NSFC Project: The Geomagnetic Field and Life, EGU General Assembly 2026, Vienna, Austria, 3–8 May 2026, EGU26-16252, https://doi.org/10.5194/egusphere-egu26-16252, 2026.

EGU26-16551 | Posters on site | BG7.1

30 million years of biofilm preservation in Rio Tinto's acidic iron-sulfate system 

Yan Shen and David Fernandez-Remolar

The Río Tinto system (SW Spain) provides a unique natural archive for evaluating long-term preservation of complex microbial biofilms under extreme acidic and oxidizing conditions. Here we demonstrate that mineralized biofilms preserved over ~30 million years retain not only molecular biosignatures, but also the ecological diversity characteristic of modern Río Tinto biofilm communities. Using high-resolution Time-of-Flight Secondary Ion Mass Spectrometry (ToF-SIMS), we analyze iron–sulfate deposits from the Upper Gossan (~30 Ma), Upper Terrace (~2.1 Ma), and Intermediate Terrace (~7.5 ka). Upper Gossan deposits preserve spatially coherent fungal- and algal-derived lipid assemblages, including ceramides, diacylglycerides, wax esters, polyunsaturated fatty acids, and sulfated sterols, directly mirroring biofilm architectures and taxonomic compositions observed in the modern river. Terrace deposits record progressively reduced molecular fidelity linked to seasonal hydrology, while Intermediate Terrace materials show near-complete lipid loss. These results demonstrate that under hyperacidic conditions, iron–sulfate mineralization can preserve biofilm diversity and community structure over geological timescales, providing a powerful analog for biosignature preservation on early Earth and Mars.  

How to cite: Shen, Y. and Fernandez-Remolar, D.: 30 million years of biofilm preservation in Rio Tinto's acidic iron-sulfate system, EGU General Assembly 2026, Vienna, Austria, 3–8 May 2026, EGU26-16551, https://doi.org/10.5194/egusphere-egu26-16551, 2026.

EGU26-16582 | Orals | BG7.1

Magnetofossils in the Northern Indian Ocean 

Firoz Badesab, Nitin Kadam, and Omkar Sagavekar

Magnetofossils are potential recorder of paleoenvironmental conditions that control the abundance and diversity of magnetotactic bacteria and giant iron biomineralizing organisms in marine sediments. In this study, we conducted suite of rock magnetic and transmission electron microscope analyses on marine (modern, fossil) sediments deposited during different climatic events to characterize the magnetofossil contribution and establish the magnetofossil records in the diverse regions of the northern Indian Ocean. First-order reversal curve diagrams of the representative samples confirmed the presence of non-interacting single domain magnetofossils. High-resolution electron microscope observations results indicate that conventional and giant type magnetofossils are more abundant, widespread, and spatially distributed within northern Indian Ocean. Electron diffraction and energy dispersive spectrometry confirmed their distinctive morphologies and magnetite crystal structure. Magnetic hysteresis and isothermal remanent magnetization curves, first-order reversal curve diagrams, and low-temperature magnetic measurements revealed large variations in magnetic properties of magnetofossils (conventional and giant), which mainly relate to the specific region, climatic events, and time periods. Our findings on the existence of conventional and giant magnetofossils, their abundance, morphological signatures and bulk magnetic measurements expands our understanding of modern and paleoenvironmental conditions (oxygenation, productivity, weathering and sedimentation patterns, nutrient supply, `influx of reactive iron, organic carbon content) that controlled the growth and preservation of magnetofossils in the modern and ancient sediments in the northern Indian Ocean.

How to cite: Badesab, F., Kadam, N., and Sagavekar, O.: Magnetofossils in the Northern Indian Ocean, EGU General Assembly 2026, Vienna, Austria, 3–8 May 2026, EGU26-16582, https://doi.org/10.5194/egusphere-egu26-16582, 2026.

EGU26-18096 | ECS | Posters on site | BG7.1

MCD Reveals a Magnetic Field-Sensitive Pathway for Life’s Choice of α-Amino Acids 

Chao Zhang, Bhat Showkat Ahmad, Yufen Zhao, and Hua Zhao

Amino acids serve as the fundamental building blocks of proteins and perform indispensable biological functions in living systems. During chemical evolution, α-amino acids played a crucial role as key structural modules in the assembly of primitive proteins and the formation of early metabolic networks. However, why life selected α-amino acids, rather than other structural types of amino acids, as the core components of protein backbones remains a fundamental question in origins-of-life research: Is this a result of life systems screening a pre-existing molecular library in the prebiotic environment, or does it stem from the unique physicochemical properties and reaction kinetics advantages of α-amino acids? Phosphorus, an essential element constituting nucleic acid backbones and participating in cellular energy metabolism, may have profoundly influenced this selection process through phosphorylation reactions driven under prebiotic chemical conditions.
This study utilized magnetic circular dichroism (MCD) spectroscopy to systematically compare the spectral behaviors of N-phosphorylated α-, β-, and γ-alanines in an aqueous environment. The results revealed that only the α-phosphorylated alanine exhibited a characteristic MCD signal under a magnetic field, which is attributed to a high-energy intermediate formed via an intramolecular five-membered ring transition state. Further experiments demonstrated that under a relatively strong external magnetic field, the rates of prebiotic reactions involving N-phosphorylalanine, such as hydrolysis and peptide bond formation, were significantly enhanced .
Based on these findings, we propose that magnetic fields can modulate the spatial orientation of functional groups within phosphorylated amino acid molecules, effectively stabilizing key reaction intermediates and reducing the reaction energy barrier. This mechanism provides important experimental evidence for understanding how life specifically selected the phosphorus metabolic pathway and α-amino acids in the early Earth environment. It also reveals, from a physicochemical perspective, that the selection of biochemical molecular structures may originate from their intrinsic properties and their reactivity adaptability within the Earth's magnetic field.

How to cite: Zhang, C., Showkat Ahmad, B., Zhao, Y., and Zhao, H.: MCD Reveals a Magnetic Field-Sensitive Pathway for Life’s Choice of α-Amino Acids, EGU General Assembly 2026, Vienna, Austria, 3–8 May 2026, EGU26-18096, https://doi.org/10.5194/egusphere-egu26-18096, 2026.

EGU26-20833 | ECS | Orals | BG7.1

The Role of the Geomagnetic Field in ATP Hydrolysis under Prebiotic Earth Conditions 

Caipeng Xu, Yihui Shi, Yu Guo, Yufen Zhao, and Songsen Fu

The geomagnetic field (GMF), as one of Earth’s fundamental environmental physical fields, remains underexplored in terms of its potential regulatory role in prebiotic chemical processes. Investigating its influence on key chemical reactions related to the origin of life can help elucidate how early Earth conditions shaped the formation and evolution of primordial biomolecules. ATP, as a central energy currency, undergoes non-enzymatic hydrolysis that is crucial for early energy metabolism, and the synergistic effects of metal ions and simple molecules such as amino acids may serve as important drivers of this process. This study focuses on the regulatory effect of the GMF on the metal–amino acid cooperative catalysis of ATP hydrolysis.

Integrating bioinformatics analysis with chemical experiments simulating primitive planetary conditions, we systematically investigated the synergistic effects of Mg2+, Mn2+, and Ca2+ combined with representative amino acids on ATP hydrolysis under different magnetic field environments. The results indicate that metal ion together with acidic/polar amino acids (e.g., Asp, Thr) can significantly accelerate ATP hydrolysis under a hypomagnetic field (HMF) compared to the contemporary GMF environment. Further mechanistic studies suggest that this process may be associated with a metal-dependent radical pathway.

These findings imply that the GMF may act as a subtle modulator, influencing the chemical behavior of metal ions and radical reaction pathways, thereby participating in the regulation of early ATP hydrolysis and related energy metabolism networks. This research provides a new experimental perspective and chemical model for understanding the potential role of the GMF in prebiotic chemical environments, and also offers new criteria for assessing potential pathways of chemical evolution toward life on other planets.

How to cite: Xu, C., Shi, Y., Guo, Y., Zhao, Y., and Fu, S.: The Role of the Geomagnetic Field in ATP Hydrolysis under Prebiotic Earth Conditions, EGU General Assembly 2026, Vienna, Austria, 3–8 May 2026, EGU26-20833, https://doi.org/10.5194/egusphere-egu26-20833, 2026.

EGU26-22536 | Posters on site | BG7.1

Robust magnetic shielding and the onset of plate tectonics assisted Neoarchean evolution 

Rory D. Cottrell and John A. Tarduno

Plate tectonics is central to the long-term release of heat from Earth’s deep interior, which ultimately maintains habitability, as well as nutrient cycling on the surface important for evolution. A strong magnetic field can further assist evolution by shielding life from harmful cosmic radiation. Paleomagnetic data indicate a strong magnetic field in the Late Paleoarchean through the Proterozoic (Tarduno et al., Nat Sci Rev, 2025), but the onset of plate tectonics has been unclear. Recent paleomagnetic analyses indicate that rocks from the Pilbara craton, once thought to record early plate tectonic motion, have been magnetically reset. Instead, paleomagnetic analyses indicate a Neoarchean start for latitudinal motions similar to modern plate tectonics.  This late start of plate tectonics coincides with the evolution of PMI and PMII photosystems and crown group cyanobacteria. Increased nutrient cycling and sedimentary basin environments associated with a Neoarchean onset of plate tectonics, together with robust magnetic shielding provided by a strong magnetic field, may have aided cyanobacteria evolution, accelerating oxygenation of the atmosphere. 

How to cite: Cottrell, R. D. and Tarduno, J. A.: Robust magnetic shielding and the onset of plate tectonics assisted Neoarchean evolution, EGU General Assembly 2026, Vienna, Austria, 3–8 May 2026, EGU26-22536, https://doi.org/10.5194/egusphere-egu26-22536, 2026.

EGU26-22550 | Orals | BG7.1

Advanced TMR Sensor-Based Magnetrodes for High-Sensitivity Biomagnetic Field Detection 

Jiamin Chen, Yi Wang, Zhaojie Xu, Jiahui Luo, Chenglong Zhang, Zhenhu Jin, Mixia Wang, and Xinxia Cai

The detection and interpretation of brain magnetic signals are crucial for biomagnetism and advancing brain-computer interface (BCI) technologies. Local field potential (LFP) signals, reflecting synchronized neuronal ensemble activity, offer insights into coordinated neural function. Due to their compact size and exceptional sensitivity at room temperature, magnetoresistance (MR) sensors have garnered considerable interest in numerous fields, particularly in the detection of weak magnetic signals in biological systems. The “magnetrodes”, integrating MR sensors with needle-shaped Si-based substrates, are designed to be inserted into the brain for local magnetic field detection. In this study, we develop a miniaturized tunneling magnetoresistance (TMR)-based neural magnetrode optimized for in vivo LFP magnetic recording. The magnetrode achieves a magnetoresistance ratio (145%) and low-field sensitivity (16.59 mT/%), while maintaining low detection limits of 4.8 nT/√Hz at 1 Hz and 140 pT/√Hz at 1 kHz. Noise analysis revealed that reducing bias current and applying high-frequency AC excitation significantly suppresses low-frequency 1/f noise. In vitro simulations validate LFP reconstruction capability, and in vivo experiments demonstrate a strong correlation (r = 0.857 ± 0.031, p < 0.01) between magnetic and electrical LFPs. Furthermore, in vitro durability tests in artificial cerebrospinal fluid demonstrated exceptional stability, with negligible signal drift (< 0.4% variation in TMR ratio) over a 7-day period. This work establishes that the TMR-based magnetrode emerges as a new potential tool for neural interface technologies, with implications for real-time BCI and neuropathology research.

How to cite: Chen, J., Wang, Y., Xu, Z., Luo, J., Zhang, C., Jin, Z., Wang, M., and Cai, X.: Advanced TMR Sensor-Based Magnetrodes for High-Sensitivity Biomagnetic Field Detection, EGU General Assembly 2026, Vienna, Austria, 3–8 May 2026, EGU26-22550, https://doi.org/10.5194/egusphere-egu26-22550, 2026.

EGU26-22579 | Posters on site | BG7.1

Deep-living magnetotactic bacteria in hydrothermally bottom-up oxygenated sediments: a case for a mirror world 

Michael Winklhofer, Adrian Felix Höfken, Tilo von Dobeneck, Thomas Kuhn, and Sabine Kasten
Low-temperature hydrothermal fluids circulating through crustal rocks of the Clarion–Clipperton Zone (East Pacific) introduce dissolved oxygen into the overlying sediments from below, generating an inverse oxygen gradient within the sediments. The resulting oxic–suboxic transition zone may create favorable conditions for a deep, mirrored habitat for microaerophilic magnetotactic bacteria (MTB), which have previously been observed only in the shallow oxygen gradient zone beneath the sediment–water interface. Until now, the existence of such deep-dwelling MTB had been inferred solely from paleo- and rock-magnetic proxies. In this study, however, their presence is directly demonstrated by electron microscopy revealing intact, multi-stranded, large magnetofossil chains (>120 nm in diameter) originating from the former deep oxic–suboxic transition zone. Magnetic properties of the sediments further identify localized accumulations of biogenic magnetite, supporting the presence of living MTB at approximately 8 m sediment depth. These results provide the first direct evidence of MTB inhabiting bottom-up oxygenated sediments near the sediment–crust interface.

How to cite: Winklhofer, M., Höfken, A. F., von Dobeneck, T., Kuhn, T., and Kasten, S.: Deep-living magnetotactic bacteria in hydrothermally bottom-up oxygenated sediments: a case for a mirror world, EGU General Assembly 2026, Vienna, Austria, 3–8 May 2026, EGU26-22579, https://doi.org/10.5194/egusphere-egu26-22579, 2026.

The geomagnetic field (GMF) is a pervasive yet poorly understood environmental factor for plant growth and development. Here, we reveal that near-zero magnetic field (NZMF) significantly delays seed germination in Arabidopsis thaliana. Time-resolved transcriptomic analyses showed a subtle but coordinated transcriptional shift under NZMF, characterized by downregulation of growth-promoting genes and upregulation of defense-related pathways. This transcriptional reprogramming coincided with moderate accumulation of reactive oxygen species (ROS), linking redox signaling to the germination delay. Consistently, scavenging ROS partially restored germination rates and reversed differential expression of a subset of stress-responsive genes, confirming the central role of ROS in the NZMF-induced transcriptional reprogramming. Genetic analysis using cry1cry2 mutants further indicated that NZMF delays seed germination via both CRY-dependent and -independent pathways. Taken together, our findings suggest that the GMF acts as an environmental cue that fine tunes the balance between growth and defense during plant early development, likely through a redox-dependent mechanism underlying plant responses to magnetic field perturbations. These results provide a possible mechanistic insights into how paleomagnetic variations may have imposed selective pressures on the biosphere and offer a framework for assessing plant habitability in extraterrestrial environments with weak magnetic fields.

How to cite: Xu, X. and Huang, J.: Near-zero magnetic field inhibits seed germination via ROS signaling and reprogramming transcriptome in Arabidopsis thaliana, EGU General Assembly 2026, Vienna, Austria, 3–8 May 2026, EGU26-22850, https://doi.org/10.5194/egusphere-egu26-22850, 2026.

First-time petrological and mineral-chemical studies of L6 chondrites from Bursa (Turkey) were done, and the conditions of shock metamorphism were justified. A new age of the zircon-reidite was determined at 4.2 Ga (U-Pb (TIMS)).

Gray gneisses, TTG, enderbate rocks, and amphibolites from Murmansk and Central Kola megablocks of the N-W part of the Fennoscandian Shield were dated using SHRIMP and U-Pb (TIMS) on zircon, with ages ranging 3.7-3.2 Ga.

Protoliths of country rocks, based on Sm-Nd data, reflect TDM values 3.0 to 3.5 Ga, with ɛNd values ranging from +2 to -3.

Concentrations of PGE and Ir anomalies were studied for the basement rocks of the continental crust using ICP-MS, reflecting an extraterrestrial (impact) contribution during the early formation stages of the two megablocks of the N-W part of the Fennoscandian Shield.

Additionally, the basement rocks show high concentrations of ore metals (ICP-MS data) such as Fe, Pt, Pd, Ni and other elements unusual for Earth rocks (Koeberl et.al, 2024; Treatise on Geochemistry, 2003; Van Kranendonk et.al, 2019). 

This research was carried out in accordance with the research topics outlined in Scientific Research Contracts FMEZ-2024-0004. Many thanks to A.N. Larionov for the U-Pb (SHRIMP) analysis. Devoted to memory of the outstanding geochemistry Derald Wasserbourg from USA for artificial spike 205 Pb for U-Pb (TIMS) measurements single grains baddeleyite and zircon.

How to cite: Bayanova, T., Kaygısız, E., Drogobuzhskaya, S., Dokukina, K., and Kunakkuzin, E.: Bursa chondrite ( L6) about 4.2 Ga  by U- Pb (TIMS ) the oldest (3.7 Ga) age of zircon (SHRIMP) and ICP-MS data on Ir anomaly (impact) for the continental crust of the N-W part of Fennoscandian Shield (Arctic region), EGU General Assembly 2026, Vienna, Austria, 3–8 May 2026, EGU26-2328, https://doi.org/10.5194/egusphere-egu26-2328, 2026.

EGU26-5048 | Posters on site | PS6.3

Anatomy of a marine-target impact structure by a “rubble-pile” asteroid in field observations, impact experiments, and numerical simulation. 

Jens Ormö, Erik Sturkell, Patricia Solana Gonzalez, Isabel Herreros, Vinamra Agrawal, and David T. King, Jr.

The Lockne crater (7–12 km) and its smaller companion Målingen (0.7 km) formed simultaneously at 458 Ma in a shallow sea, resulting in exceptional preservation of crater fill and near-field ejecta. Their paired formation constitutes the only confirmed terrestrial impact by a binary asteroid. The event is linked to a major Middle Ordovician breakup in the Main Asteroid Belt (~470 Ma), implying that the impacting bodies were rubble-pile aggregates. The marine setting, with seawater and sedimentary strata overlying a flat crystalline basement, represents an extreme case of layering with strong property-contrasts, known to influence crater morphology and produce concentric structures. Such effects also have relevance for Mars, where concentric craters can indicate sedimentary rock and former habitable environments.

At Lockne, an inner 7.5 km wide basement crater is surrounded by a shallow ~12 km outer crater recorded in the sedimentary target rocks. It formed by a shallow excavation flow prior to deposition of basement crater ejecta, and is offset downrange due to oblique impact. At Målingen, the 0.7 km basement crater’s ejecta distribution indicates a wider but poorly preserved outer crater. Lockne subsurface geology is known from 11 shallow cores to ~335 m depth, but this is estimated to represent only a third of the crater’s true depth.

Binary asteroids are commonly rubble-piles, and although ~16% of asteroids are observed to be binary, the fraction of rubble-piles is likely much higher because original companions may have been lost. Several aspects of the Lockne morphology, notably an abnormally wide shallow outer crater surrounding the basement crater, are interpreted as consequences of a rubble-pile impact in the stratified target.

Previous 3-D simulations of the Lockne impact used a monolithic impactor. For an impact at 45° and 15 km/s, these models indicate a ~600 m projectile and target water depth slightly less than the projectile diameter, producing a ~5 km transient basement crater. Målingen was estimated at ~150 m if massive. However, rubble-piles of this size may fragment during atmospheric entry forming a “pancake-like” cluster significantly wider than the original body. Such clustered impacts distribute more energy near the surface producing shallower, wider craters. Obliquity increases breakup, enhances near-surface energy release, and intensifies downrange asymmetry. Thus, a rubble-pile could produce a wider crater than a monolithic equivalent and potentially influence basement crater depth.

To investigate crater formation mechanisms, we performed impact experiments and numerical simulations of clustered impactors. Experiments were carried out with the EPIC single stage gas gun at CAB CSIC-INTA, Spain, to launch Delrin projectiles up to ~400 m/s. Clustered projectiles were made from weakly bonded 2 mm spheres to obtain equal mass to 20 mm solid reference projectiles, and high-speed cameras recorded both half-space and quarter-space impacts. Numerical modeling in iSALE-2D is ongoing, testing several rubble-pile configurations.

Acknowledgements: This work was supported by grant PID2021-125883NB-C22 by the Spanish Ministry of Science and Innovation/State Agency of Research MCIN/AEI/10.13039/501100011033 and by ‘ERDF A way of making Europe’, and the Spanish Research Council (CSIC) support for international cooperation I-LINK (#ILINK22061).

How to cite: Ormö, J., Sturkell, E., Solana Gonzalez, P., Herreros, I., Agrawal, V., and T. King, Jr., D.: Anatomy of a marine-target impact structure by a “rubble-pile” asteroid in field observations, impact experiments, and numerical simulation., EGU General Assembly 2026, Vienna, Austria, 3–8 May 2026, EGU26-5048, https://doi.org/10.5194/egusphere-egu26-5048, 2026.

Introduction: Paleochannels have been identified,which are interpreted to be the result of melting of ice. A 30 km diameter impact basin in the Aeolis/Zephyria region near the dichotomy boundary is characterized by small valley networks (Fig. 1) that are partly located radial to the crater rim. Large glacial deposits, interpreted to be the remains of debris covered glaciers, have been identified in the area surrounding the crater. The spatial association between the crater and the paleochannels suggest that the impact was responsible for their formation.
Ejecta deposit: The release of water is initiated by the melting of ice from the deposition of hot ejecta deposits over its surface. Such a mechanism would generate fluvial features in the absence of a climatic regime favorable for fluvial activity.
Conclusions: I propose that the valley networks originated from the release of water due to the deposition of hot ejecta over ice deposits present in the area during the impact event. Glacial deposits have been identified elsewhere on Mars [1-6]. Water sources originate from the melting of
snow/ice deposits, extensive fluvial features in close proximity to the large crater in a region interpreted to have experienced significant glacial activity. The spatial relationship between the valleys and the main crater suggest, that they are related. The hot ejecta deposit associated with the impact provides an explanation for the melting of ice deposits that were present on
the plateau at the time of impact.

Fig. 1: Themis Image V05875001(left) and terrestrial analog (right, glacier and drainage 
system, Svalbard, adapted from [7]), suggesting the action of glacial meltwater as a water 
source for fluvial channels.

References: [1] Christensen, P. R. (2003) Nature 422, 45–48. [2] Dickson, J. L. et al. (2008) Geology36(5),  411–415 [3] Head, J. W. et al. (2006) Geophys.Res. Lett. 33, doi:10.1029/2005GL024360. L08S03.[4] Levy, J. S. et al. (2007) J. Geophys. Res. 112, doi:10.1029/2006JE002852.  E08004. [5] Newsom, H.E. (1980) Icarus 44, 207–216. [6] Shean, D. E. et al.(2007) J. Geophys. Res. doi:10.1029/112,2006JE002761. E03004. [7] Evans, D. (2005), Hodder  Arnold, 544pp.

How to cite: Nussbaumer, J.: Evidence for impact into ice-rich terrain and melting to produce glaciation in the Aeolis/Zephyria region, Mars., EGU General Assembly 2026, Vienna, Austria, 3–8 May 2026, EGU26-5988, https://doi.org/10.5194/egusphere-egu26-5988, 2026.

EGU26-8876 | ECS | Posters on site | PS6.3

A New Impact Model for The Norian, Late Triassic Manicouagan Crater 

Sarah Salem, Aisha Al-Suwaidi, and Mohamed El-Maarry

Abstract

Meteorite impacts can lead to significant disruptions of Earth’s systems, potentially affecting the planet's climate, ecosystems, and environment. The Manicouagan impact event is recorded by one of the largest impact craters of the Phanerozoic era, located in Quebec, Canada in the Grenville Province of the Canadian Shield, with a rim-to-rim diameter of 85–100 km. It has a precise age of 215.40 ± 0.16 Ma, yet its environmental aftermath remains poorly constrained, particularly any robust link to the Norian, Late Triassic extinction pulses or carbon-cycle perturbations. Here we present a new impact-Simplified Arbitrary Lagrangian-Eulerian (iSALE) hydrocode simulation against the Manicouagan’s target lithologies to constrain the most plausible impactor diameters and velocities that would reproduce the observed crater morphology. Three best-fit models of crater diameters and velocities of 7.2 km at 20 km s-1, 8.8 km at 15 km s-1, and 10.4 km at 12 km s-1 reproduced crater diameters of 90, 95, and 100 km, respectively. We calculated the kinetic energy delivered by each projectile, which is on the order of 1.17–1.27x10²³ J. The calculated energy is sufficient to vaporize the entire projectile and a considerable amount of the upper target lithologies, and melt large volumes of the target rocks. We then estimated the mass of vapor released into the atmosphere by using scaling relations and assessed the potential post-initial settling of the vapor mass after condensation and re-entry to be ~5x10¹⁷ g. This exceeds the ~1016 g blackout threshold required to cause global cessation of photosynthesis, darkness, and cooling. Our results provide numerical assessments of the environmental consequences of the Manicouagan impact event and a framework for reassessing its potential role in Late Triassic biotic and climatic events.

Keywords

Manicouagan Impact Event, Hydrocode modeling, iSALE simulations, Late Triassic, Environmental consequences.

How to cite: Salem, S., Al-Suwaidi, A., and El-Maarry, M.: A New Impact Model for The Norian, Late Triassic Manicouagan Crater, EGU General Assembly 2026, Vienna, Austria, 3–8 May 2026, EGU26-8876, https://doi.org/10.5194/egusphere-egu26-8876, 2026.

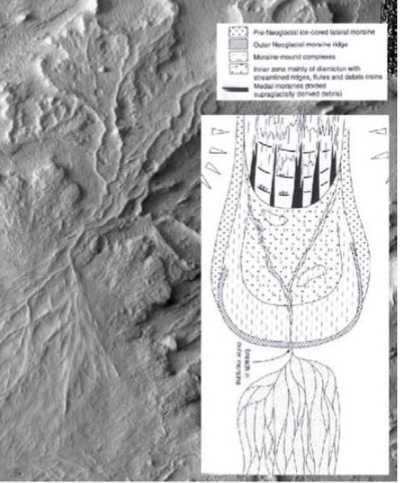
EGU26-11758 | Posters on site | PS6.3 | Highlight

Quantifying Habitability of the Hadean Earth: Impacts, Hydrothermal Systems, and Windows for Life's Emergence 

Oleg Abramov, Anna Medvegy, and Stephen J. Mojzsis

Impacts during the Hadean heavy bombardment profoundly influenced Earth's early habitability, both frustrating and fostering conditions for life's origin through sterilization events and the creation of hydrothermal habitats. This study quantifies probabilistic "sweet-spot" windows for prebiotic chemistry and life's emergence, integrating impact-induced thermal perturbations with biochemical stability constraints in a comprehensive modeling framework.

We employ a well-tested three-dimensional numerical thermal model to simulate heat delivery to Earth's crust from asteroid impacts during late accretion (4.5–3.5 Ga). Simulations incorporate initial magma ocean scenarios, evolving crustal formation, and decreasing geothermal gradients. Bombardment parameters, including mass flux and size distributions, are derived from recent dynamical models informed by geochronology and geochemistry. Model outputs are validated against the Hadean zircon age spectra, providing constraints on impact flux and thermal history.

From these simulations, we calculate global habitable volumes, delineate coherent hydrothermal zones with steep thermal gradients conducive to prebiotic synthesis, quantify impact-driven localized sterilization, and apply Bayesian optimization for probabilistic "sweet-spot" analysis. Integrating hydrothermal activity, sterilization statistics, and thermal limits for biomolecule stability (e.g., RNA, proteins), we identify an optimal window for life's origin between approximately 4.4 and 4.3 Ga, postdating peak bombardment yet leveraging impact-generated habitats.

These findings highlight impacts' dual role in delaying yet enabling early life, align with emerging evidence for hydrothermal vents as cradles of biogenesis and recent molecular biology estimates placing the microbial community of the Last Universal Common Ancestor (LUCA) at ca. 4.2 Ga (4.09 - 4.33 Ga), and offer new insights into habitability of the Hadean Earth.

How to cite: Abramov, O., Medvegy, A., and Mojzsis, S. J.: Quantifying Habitability of the Hadean Earth: Impacts, Hydrothermal Systems, and Windows for Life's Emergence, EGU General Assembly 2026, Vienna, Austria, 3–8 May 2026, EGU26-11758, https://doi.org/10.5194/egusphere-egu26-11758, 2026.

EGU26-14285 | Posters on site | PS6.3

Characterization of recent impact craters on the Moon by the upcoming MANI mission.  

Anna Losiak and the MANI team


The surface of the Moon is shaped by the impact processes, with new ones being formed as we watch (Robinson et al., 2015, Speyerer et al. 2016, Fairweather et al. 2022, Rizos et al. 2026). Understanding the current impact rate is crucial for the safety of the future lunar missions, determining the rate of foreign material delivery, defining the space weathering rates, and better understanding the shallow seismic sources before new seismometers will be deployed there to probe the lunar crust (Yamada et al., 2011). Impacts of particles larger than a gram can sometimes be observed as lunar flashes (Ortiz et al., 2000) that are formed because a small fraction (<0.5%) of the impact energy is released as a flash of light.

Over 600 lunar flashes has been observed up to this point (Sheward et al., 2023). Those events last ∼10 ms to a ∼1 s (Bouley et al., 2012). To better determine the properties of the impactor, it is necessary to better constrain the energy partitioning during the observed impact flashes. This can be done by identifying and characterizing the craters formed because of such an event. Because those craters are in the order of meters, most of those craters are still unknown. In fact, only a couple of craters were unequivocally linked with a newly formed crater, e.g., an event on 17th March 2013 was shown to be associated with an 18.8 m diameter crater (Mark S. Robinson et al., 2015). Hundreds of recent craters were also identified based on pre- and post- impact pairs of LRO images (Speyerer et al. 2016).

Efforts to study these craters were limited by the absence of high-resolution, specifically targeted images.  For example, LRO’s NAC with a ~0.5 m/px resolution at 50 km altitude only allows the identification of craters larger than a couple of meters in diameter, and to properly measure the properties of the craters, they need to be at least >>10 meters in diameter (Sheward et al., 2022). Unfortunately, there are only a couple of craters of this size.

MANI MISSION, approved in December 2025 for A/B1 mission stage by ESA, will map the lunar surface using high-resolution imagery and create detailed 3D maps of the Moon’s terrain with resolution of ~20 cm /px. It will be accomplished by employing a targeted multi-angular photoclinometric mapping approach to chart the Moon’s key regions of interest. Its goal is to acquire orbital images of the lunar surface, including the polar regions, at the highest possible resolution across a wide range of observation geometries. From these images, Máni will produce detailed maps of topography and reflectance properties at a resolution comparable to that of the images themselves.

This new dataset will allow us to characterize in 3D craters only a couple meters in diameter, and thus substantially improve our ability to understand the current impact rate on the Moon, the energy partitioning on airless bodies as well as use crater properties to back-engineer the properties of target rocks all over the Moon.

How to cite: Losiak, A. and the MANI team: Characterization of recent impact craters on the Moon by the upcoming MANI mission. , EGU General Assembly 2026, Vienna, Austria, 3–8 May 2026, EGU26-14285, https://doi.org/10.5194/egusphere-egu26-14285, 2026.

EGU26-14985 | ECS | Posters on site | PS6.3

A rapid route for even big planets to get big moons 

Jacob Kegerreis, Vincent Eke, Thomas Sandnes, and Harrison Davies

Earth’s Moon is really big. Both the satellite and the giant impact that created it have played key roles in our planet’s evolution into a life-supporting world; stabilising the planet’s spin for a consistent climate, and driving the ocean tides that could stimulate prebiotic chemistry. Giant impacts are common across planet formation. So, as observational techniques improve, we might expect to find large moons among the now thousands of detected exoplanets, many of which are more massive than Earth. A barrier to this is that giant impacts onto larger planets create hotter debris disks of mostly vapour, especially for ice-rich worlds. This gas would drag any small growing moonlets to rapidly spiral down to the planet, prohibiting any large moons from forming out of the disk.

However, using high-resolution 3D smoothed particle hydrodynamics (SPH) simulations of giant impacts, we find that big moons can be immediately placed onto wide orbits, safely outside the thick, dragging disk. This could allow large rocky and even large icy worlds to gain a big moon.

This impact scenario had previously been demonstrated as an option for forming Earth’s Moon, for a limited range of tested parameters. Here we identify multiple regions of parameter space across which large immediate satellites can form (of order 1% the mass of the planet), for target planets ranging from 0.5 to 10 Earth masses, inclusive. We also confirm consistent results using the new SPH scheme REMIX, designed to improve the treatment of mixing and discontinuities in impact simulations. Furthermore, the rate of increase of the vapour mass-fraction with the system mass depends on the impact scenario, such that the post-impact disks of even the largest of these planets may not be fully vaporised.

Large moons may still be uncommon in general, but giant impacts offer a pathway for Super-Earths and even mini-Neptunes to gain fractionally massive satellites and the potential benefits of one for life.

How to cite: Kegerreis, J., Eke, V., Sandnes, T., and Davies, H.: A rapid route for even big planets to get big moons, EGU General Assembly 2026, Vienna, Austria, 3–8 May 2026, EGU26-14985, https://doi.org/10.5194/egusphere-egu26-14985, 2026.

EGU26-20750 | ECS | Posters on site | PS6.3

When Does Strength Matter? Assessing the Role of Material Strength in Planetary Impacts 

Harrison Davies, Jacob Kegerreis, and Gareth Collins

Impact processes spanning in scale from cratering to that of catastrophic disruption determine both the development and ultimate habitability of terrestrial planets. Numerical simulations have played a key role in our understanding of these processes, demonstrating how impacts drive growth [1], deliver water [2], and lead to moon formation following giant impacts [3].

Most of these impact studies adopt the simplifying assumption that these collisions occur in the gravity-dominated regime, where material strength is relatively weak and so often simplified or neglected entirely. These approaches are motivated by a desire to limit the computational cost of simulations and hence maximise the number and resolution of simulations that can be performed. However, little work has been done to test this assumption and assess when the effects of material strength are important or negligible. Using the recent addition of strength models to the smooth particle hydrodynamics (SPH) code SWIFT [4], we can test the limits of these assumptions at high resolutions across a broad range of length scales.

We will present results from a suite of these simulations, comparing leading strength models [5] in this field with strengthless SPH, to provide detailed predictions for where scientific conclusions might be sensitive to the choice of strength model. We will investigate collisional outcomes such as the extent of melting in giant impacts and the catastrophic disruption threshold, assessing the scaling law relations commonly applied in planetary accretion models with implications for planetary habitability.

References:
[1] Crespi, S., et al., 2024, Protoplanet collisions: New scaling laws from smooth particle hydrodynamics simulations, Astronomy & Astrophysics, 685, A86
[2] Burger, C., et al., 2020, Realistic collisional water transport during terrestrial planet formation, Astronomy & Astrophysics, 634, A76
[3] Canup, R., 2004, Simulations of a late lunar-forming impact, Icarus, 168, 433-456
[4] Schaller, M., et al., 2024, Swift: a modern highly parallel gravity and smoothed particle hydrodynamics solver for astrophysical and cosmological applications, Monthly Notices of the Royal Astronomical Society, 530, 2378-2419
[5] Collins, G., et al., 2004, Modeling damage and deformation in impact simulations, Meteoritics & Planetary Science, 39, 217-231

How to cite: Davies, H., Kegerreis, J., and Collins, G.: When Does Strength Matter? Assessing the Role of Material Strength in Planetary Impacts, EGU General Assembly 2026, Vienna, Austria, 3–8 May 2026, EGU26-20750, https://doi.org/10.5194/egusphere-egu26-20750, 2026.

BG8 – Biogeosciences, Policy and Society

Continental-scale research infrastructures and flux networks, alongside smaller networks and individual sites, directly measure evaporative water loss, as well as heat, CO2, CH4, and other gas exchange between the surface and the atmosphere. Over four decades, such flux stations covered 2100+ stationary measurement points and various campaign sites.

Despite such major advantages as extremely high-resolution, real-time results, continuous and direct nature of flux measurements, their applications are only now and rather slowly entering fields beyond academia due to the perceived method complexity, actual complexity and cost of traditional instrumentation and site operation, lack of broad geographic data coverage, and absence of a comprehensive approach focused on direct flux measurements specifically tailored for bringing immediate societal benefits.

This presentation continues to address these challenges by simplifying explanations, offering detailed guides for practicing the method, presenting the latest lower-cost simple automated instrumentation and novel computing tools, facilitating peer-to-peer cross-sharing to increase data coverage and reduce station setup costs, and providing professional services for experiment design and execution.

One example of the most recent developments is the 2025 publication of three new plain-language guides/protocols on direct dMRV/aMRV/MMRV (Figure below). These aim to fundamentally change carbon markets by providing a direct, defensible, traceable, repeatable, real-time, evidence-based approach to quantify sequestration and emission in application beyond academia.

The ultimate goal of this presentation is to ignite discussions on utilizing flux measurements for practical decision-making applications to benefit society and to identify current needs, ideas, and examples for leveraging flux data in everyday decision contexts.


How to cite: Burba, G.: Latest Tools and Protocols for Using Direct Flux Measurement outside Academia, EGU General Assembly 2026, Vienna, Austria, 3–8 May 2026, EGU26-67, https://doi.org/10.5194/egusphere-egu26-67, 2026.

  Mitigating climate change and managing land sustainably depends on understanding and quantifying carbon dynamics in ecosystems. Here we present a framework to integrate advanced direct carbon flux measurement techniques (e.g., eddy covariance and chamber methods) with spatially explicit ecosystem service modeling through the invest (Integrated Valuation of Ecosystem Services and Tradeoffs) framework, which can be applied across a diversity of ecosystems (e.g., coastal wetlands, mangroves, seagrass, forests, grasslands) to increase the spatial and temporal precision and meaningfulness of ecosystem carbon accounting and valuation.

The methodology presented makes use of high-resolution land use and land cover (LULC) data and field-measured carbon pool parameters (i.e., aboveground biomass, belowground biomass, soil organic carbon, litter pools), as well as direct flux data from eddy covariance systems, in two ways: as direct empirical inputs quantifying net ecosystem exchange (NEE) that are site- and time-specific rates of carbon accumulation or emission, and as necessary standards for comprehensive model calibration and validation. The twofold utility of direct flux data reduces errors associated with prevalent generalized carbon stock assumptions and allows full representation of variability in carbon flux under different land-management and disturbance regimes.

We apply this integrated framework to simulate carbon stock dynamics and annual carbon sequestration rates under various land-use change and ecological restoration scenarios. The spatially explicit outputs include detailed ecosystem maps of carbon storage, flux rates, and net carbon budgets that can inform targeted conservation and sustainable use strategies. Merging these adaptations to biophysical outputs with economic valuation problems that incorporate current pricing schemes in carbon markets and the social cost of carbon will allow stakeholders and policy makers to efficiently evaluate trade-offs among ecosystem services, economic returns, and climate benefits.

Our approach is scalable and adaptable, allowing decision-making to occur over a range of biological contexts from dynamic coastal ecosystems that are subject to anthropogenic disturbance to more stable terrestrial biomes. This combination of research will allow for climate change initiatives to be implemented with vigorous due assessment of data-driven evaluation tools that will further the advancement of the dual goals of carbon neutrality and resilience of existing ecosystems to degrading events. These systems allow for direct measurements of relevant fluxes within complex models that engage ecosystem services and make them viable, filling important gaps in the understanding of empirical data relevant to ecology, biogeochemical modeling, and realistically set policy guidelines.

Keywords: Carbon Flux, Coastal Ecosystem, Eddy Covariance, Ecosystem Service Modeling, Climate Mitigation, Carbon Market Valuation.


How to cite: Hosseinipour, S. and Mehdinia, A.: Integration of Direct Carbon Flux Measurements with Ecosystem Service Modeling: A Scalable Approach for Coastal and Terrestrial Systems, EGU General Assembly 2026, Vienna, Austria, 3–8 May 2026, EGU26-72, https://doi.org/10.5194/egusphere-egu26-72, 2026.

EGU26-241 | Orals | BG8.3

Assessing  micro-meteorological flux network data quality: implications for water and energy flux modelling 

Ivan Vorobevskii, Rico Kronenberg, Thomas Grünwald, and Matthias Mauder

Robust climate-impact and (eco)hydrological modelling as well as reproducible research practices rely on (micro)meteorological forcing data that are both physically consistent and stable across dataset versions — conditions that are often difficult to meet within long-term micrometeorological networks. Continuous reprocessing of raw measurements, as implemented in ICOS and FLUXNET, can unintentionally reshape subdaily time series and thereby alter simulations of water and energy balance components. In our research, we identified two major post-processing error sources: dataset versioning and gap-filling. To evaluate how these transformations propagate into process-based modelling, we used the ICOS DE-Tha old-spruce forest site in Saxony (Germany) as a representative case study and applied the subdaily, physically based 1D ecohydrological model BROOK90 to perturbed forcing datasets.

Successive ICOS dataset versions introduced substantial corrections to air temperature, solar radiation, precipitation, wind speed, and vapor pressure, which in turn noticeably altered simulated interception, transpiration, and soil evaporation. Standard ICOS gap-filling procedures (MDS and ERA-I) were also found to generate implausible values, particularly where outputs from different algorithms occurred in close succession, producing artificial spikes such as 10 °C temperature jumps within a 30-minute interval. Artificial gap-filling experiments using ERA-I demonstrated that uncertainties in modeled water and energy balance components increase systematically with both the proportion (1-50%) and the block-length (30 min - 30 days) of substituted subdaily meteorological data. Precipitation and solar radiation replacements induced the strongest single-variate deviations, and multivariate gap-filling resulted in substantially larger uncertainties than single-variable substitutions—approaching 25% overestimation for latent heat (LE) and more than 40% underestimation for sensible heat (H) at 50% substitution using 30-minute blocks. Evapotranspiration partitioning revealed consistent bias patterns under multivariate substitutions, including reduced transpiration and strong overestimation of interception and soil evaporation. Although BROOK90 remained numerically stable across all tested perturbation scenarios, inconsistencies in subdaily forcing propagated into physically implausible process representations.

Importantly, similar inconsistencies and artifacts have been found across many ICOS and FLUXNET sites worldwide, indicating that these issues are systemic rather than site-specific. Our findings highlight that reproducibility and reliability in long-term flux-network modelling depends critically on transparent dataset versioning, rigorous anomaly detection, and harmonized multivariate gap-filling practices. Strengthening these components will enhance the scientific value of flux networks by ensuring that impact-based ecosystem modelling is grounded in trustworthy subdaily forcing data.

How to cite: Vorobevskii, I., Kronenberg, R., Grünwald, T., and Mauder, M.: Assessing  micro-meteorological flux network data quality: implications for water and energy flux modelling, EGU General Assembly 2026, Vienna, Austria, 3–8 May 2026, EGU26-241, https://doi.org/10.5194/egusphere-egu26-241, 2026.

EGU26-330 | ECS | Orals | BG8.3

Biosphere-Atmosphere Exchanges of Carbon, Water, and Energy in India: Synthesis from Eddy Covariance Measurements for Enabling Socioeconomic Benefits 

Pramit Kumar Deb Burman, Gs Bhat, Yogesh Tiwari, Ross Morrison, Suraj Reddy Rodda, Sandipan Mukherjee, Vk Dadhwal, Andrew Turner, Pulakesh Das, Geetika Agarwal, Dipankar Sarma, Praveen Mutyala, Nirmali Gogoi, Palingamoorthy Gnanamoorthy, Sreenath Paleri, and Devansh Desai

Hosting the largest population in the world and one of the major growing economies, the greenhouse gas emissions from India remain significant. This is also largely contributed to by the vast agricultural tracts in this country, which occupy more than half of its landmass. However, India is committed to the Paris Climate Accord, and the biodiverse forests, mangroves, and grasslands in this region occupy almost 40% of the landmass, which stores potentially a large amount of carbon. In the context of a changing climate, it is also crucial to understand the ecohydrology of these ecosystems, as it is intricately linked to their carbon cycle. The coupling between these two is a crucial factor in ensuring sustainable development, as land and water remain two resources constrained by various developmental and mitigation activities. However, the magnitude and spatiotemporal variabilities of carbon, water, and energy exchanges between terrestrial ecosystems and the atmosphere are not well understood in India, primarily due to a lack of coordinated efforts in measuring these using Eddy Covariance (EC) techniques. This lacuna has hindered the development of remote sensing-based biophysical products and ecosystem models, leading to uncertainties in the national, regional, and global carbon budgets. In this study, the EC flux observations in India, across the dominant land use and land cover types in 12 locations, are systematically reviewed using a standard methodology. The assessment shows that cropland absorbs the maximum carbon during the Indian monsoon, although this is not generally true for all agro-climatic regions. Some forests, croplands, and mangroves function as well-watered ecosystems, while others oscillate between well-watered and water-stressed conditions, depending on the temperature and moisture availability. Mangroves sequester a large amount of carbon; however, their ability to sequester carbon is restricted by the salinity of the surrounding basin. Water-limited ecosystems demonstrate the highest water-use efficiency (WUE); irrigated croplands exhibit the lowest. Indian forests, which are mainly tropical and subtropical, register a lower WUE than the temperate and boreal forests. The global and regional flux networks, such as FLUXNET, AmeriFlux, AsiaFlux, ICOS, and OzFlux, have greatly improved our understanding of terrestrial ecosystem functioning and ecosystem-atmosphere exchanges, whereas our data review and systematic analysis are the first of their kind in India. These will be useful to the research community, planners, and policymakers alike, aiding in improved decision-making and the just allocation of resources to benefit all stakeholders.

How to cite: Deb Burman, P. K., Bhat, G., Tiwari, Y., Morrison, R., Rodda, S. R., Mukherjee, S., Dadhwal, V., Turner, A., Das, P., Agarwal, G., Sarma, D., Mutyala, P., Gogoi, N., Gnanamoorthy, P., Paleri, S., and Desai, D.: Biosphere-Atmosphere Exchanges of Carbon, Water, and Energy in India: Synthesis from Eddy Covariance Measurements for Enabling Socioeconomic Benefits, EGU General Assembly 2026, Vienna, Austria, 3–8 May 2026, EGU26-330, https://doi.org/10.5194/egusphere-egu26-330, 2026.

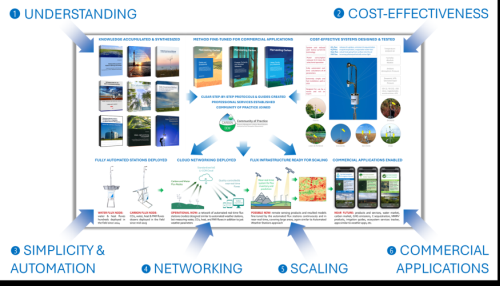
EGU26-2333 | Posters on site | BG8.3

Expanding direct evapotranspiration (ET) measurements with accessible and low-cost Variance Bowen Ratio instruments 

Daniel Beverly, Colin Campbell, Doug Cobos, Gaylon Campbell, and Meetpal Kukal

Evapotranspiration (ET) is the largest terrestrial water loss, accounting for 60% of precipitation and driving the regional and global water cycle. Land-use modifications, agricultural practices, and atmospheric warming can intensify ET demand, thereby presenting novel societal challenges and necessitating policies to conserve, monitor, and penalize overconsumption of freshwater. Unfortunately, the spatially and temporally aligned ET data products needed for operational policy practices, including precision agriculture and municipal water conservation efforts, are generally inaccessible due to the high costs of infrastructure and instruments, as well as the level of expertise required to operate these systems. Thus, practitioners are often limited to coarse spatially interpolated ET products, reference ET estimates, or alternative proxies to generate protocols for water-use applications.

Here, we introduce a new direct ET measurement sensor, the ATMOS 51 Variance Bowen Ratio (VBR) Direct ET Sensor, that leverages the Variance Bowen Ratio and energy-balance closure methods. This technology employs high-frequency temperature and specific humidity measurements to compute the Bowen ratio and ET from measured and modeled energy fluxes within the sensor footprint. The VBR technique, in general, and the implementation in the ATMOS 51 specifically, provides a compact design that allows for quick deployment, minutes compared to days, owing to the minimal infrastructure requirements. Moreover, its low power requirements make it ideal for field logging and seamless integration into cloud-based installations. Thus, providing a user-friendly experience and reducing the barrier to applying ET measurements to operational irrigation and water management decisions.

In 2025, we conducted extensive intercomparisons of the ATMOS 51 VBR Direct ET Sensor against field-standard measurements, namely eddy covariance towers and weighing lysimeters. The intercomparisons spanned numerous agroecological systems (e.g., potatoes, beets, barley, pasture, deciduous hardwood forest, desert shrubland) to characterize the best sensor application and practices.

Across the spectrum of agroecological systems, the ATMOS 51-measured ET closely matched the eddy covariance-derived ET fluxes, with a root-mean-square error (RMSE) among half-hourly measurements ranging from 0.02 to 0.07 mm. As expected, the ET measured by ATMOS 51 was 6-10% higher than that from the eddy covariance, attributed to the differences between the open- and closed-energy-balance approaches. Due to the reliance on energy-closure-based methods, the Variance Bowen Ratio method and ATMOS 51 perform best in systems with moderate-to-high ET rates and homogeneous footprints. More xeric locations, which exhibit higher sensible heat fluxes, will likely require more deliberate constraints on the energy balance terms, including soil heat flux, to optimize ET estimates.  

How to cite: Beverly, D., Campbell, C., Cobos, D., Campbell, G., and Kukal, M.: Expanding direct evapotranspiration (ET) measurements with accessible and low-cost Variance Bowen Ratio instruments, EGU General Assembly 2026, Vienna, Austria, 3–8 May 2026, EGU26-2333, https://doi.org/10.5194/egusphere-egu26-2333, 2026.

EGU26-6090 | Posters on site | BG8.3

Declining Atmospheric Phosphorus Wet Deposition in China 

Qiufeng Wang, Zihan Tai, Jianxing Zhu, Yue Xi, Yanran Chen, Quanhong Lin, Chenxu Wang, and Guirui Yu

Atmospheric phosphorus (P) deposition has become a significant external P source for terrestrial and aquatic ecosystems, influencing functions such as productivity by altering P bioavailability. However, systematic quantification of atmospheric P deposition in China is still lacking. Based on data from the China Wet Deposition Observation Network (ChinaWD) from 2014 to 2022, we explored the wet deposition fluxes, spatiotemporal patterns, and influencing factors of various atmospheric P components. The annual average wet deposition fluxes of total P (TP), dissolved total P (DTP), and total particulate P (TPP) in China were 0.63 ± 0.44, 0.34 ± 0.19 and 0.29 ± 0.26 kg P ha − 1 yr − 1 , respectively, with total deposition amounts of 0.60, 0.33 and 0.28 Tg P yr − 1 . Over 9 years, TP deposition flux declined at a rate of approximately 0.085 ± 0.022 kg P ha − 1 yr − 1 per year, potentially reflecting the sustained efforts of China in forest fire prevention and air quality management. This is the first network‐based, long‐term quantification of wet P deposition patterns across China, laying a foundation for assessing its ecological impacts.

How to cite: Wang, Q., Tai, Z., Zhu, J., Xi, Y., Chen, Y., Lin, Q., Wang, C., and Yu, G.: Declining Atmospheric Phosphorus Wet Deposition in China, EGU General Assembly 2026, Vienna, Austria, 3–8 May 2026, EGU26-6090, https://doi.org/10.5194/egusphere-egu26-6090, 2026.

EGU26-6292 | Orals | BG8.3

Trends in Long-Term CO₂ Fluxes in Relation to Weather and Tree Growth in a Mixed Hemiboreal Forest 

Anders Lindroth, Johannes Edvardsson, Jutta Holst, Maj-Lena Linderson, and Meelis Mölder

In ICOS site Norunda, Sweden, CO2 fluxes and meteorology have been measured since 1994 in a mixed pine/spruce forest. Tree cores were collected in 2020 and ring widths were used to estimate annual above and below ground increment using allometric functions. Weather data during 1995 to 2022 showed increases in air temperature (0.044 K/yr), short-wave radiation (0.44 W/m2/yr) and vapour pressure deficit (0.092 kPa/yr) while precipitation did not show any trend. The earlier start of the growing season caused the season length to increase with 0.86 days/yr. Net ecosystem exchange showed a weakening (more positive) trend while no trends were detected in GPP and RECO. Tree growth showed a decreasing trend with time but no correlation with GPP and RECO. Carbon use efficiency defined as tree growth divided by GPP showed a decreasing trend with time.

How to cite: Lindroth, A., Edvardsson, J., Holst, J., Linderson, M.-L., and Mölder, M.: Trends in Long-Term CO₂ Fluxes in Relation to Weather and Tree Growth in a Mixed Hemiboreal Forest, EGU General Assembly 2026, Vienna, Austria, 3–8 May 2026, EGU26-6292, https://doi.org/10.5194/egusphere-egu26-6292, 2026.

EGU26-8239 | Posters on site | BG8.3

Response of CO₂ and H₂O fluxes to the adoption of regenerative practices in Brazilian subtropical agroecosystems monitored by Eddy Covariance 

Debora Regina Roberti, Alecsander Mergen, Richard Lobato, Eberton de Souza, Cristiano Maboni, Tamires Zimmer, Maria Eduarda Oliveira, and Rodrigo J. S. Jacques

Regenerative agriculture is recognized as a promising strategy for mitigating greenhouse gas emissions through the adoption of practices that improve soil quality and modulate biogeochemical cycles. Southern Brazil is characterized by a subtropical climate and intensive agricultural systems with a high potential for carbon sequestration. However, quantifying the effects of regenerative practices on CO₂ fluxes and defining reliable emission and uptake factors remain significant scientific challenges. This study presents multiyear time series of carbon dioxide (CO₂) fluxes and evapotranspiration (ET) obtained from eddy covariance flux towers installed in representative conventional and regenerative agricultural systems of the region, including wheat–soybean–maize succession, flooded rice cultivation, and cattle grazing on native grasslands of the Pampa biome. The regenerative practices evaluated included the introduction of cover crops during fallow periods, thereby eliminating bare-soil phases in the wheat–soybean–maize system. In rice systems, winter forage crops and summer rotation with soybean were implemented. In native grasslands, winter forage species were introduced without soil disturbance. The results consistently show that regenerative systems exhibit greater net CO₂ uptake across different agricultural years compared to conventional systems. Reducing fallow periods in the wheat–soybean–maize succession and introducing winter forages in native Pampa grasslands increased carbon uptake, making agroecosystems in southern Brazil important sinks of CO₂-eq. Flooded areas used for irrigated rice cultivation, although not becoming net CO₂-eq sinks with the introduction of soybean rotation or pasture, showed a substantial reduction in CO₂-eq emissions. Interannual analyses demonstrated that the magnitude of CO₂ and H₂O fluxes is strongly modulated by climatic variability, particularly differences in precipitation regimes, temperature, and crop cycle duration. These findings highlight the importance of continuous, long-term measurements to capture the uncertainty range associated with climate variability and agricultural management, thereby enabling the development of more robust and representative emission and uptake factors. Based on strong observational evidence, this study contributes to improving the scientific basis for assessing agroecosystem sustainability, supporting public policies, and advancing carbon certification mechanisms.

How to cite: Roberti, D. R., Mergen, A., Lobato, R., de Souza, E., Maboni, C., Zimmer, T., Oliveira, M. E., and Jacques, R. J. S.: Response of CO₂ and H₂O fluxes to the adoption of regenerative practices in Brazilian subtropical agroecosystems monitored by Eddy Covariance, EGU General Assembly 2026, Vienna, Austria, 3–8 May 2026, EGU26-8239, https://doi.org/10.5194/egusphere-egu26-8239, 2026.

Accurate quantification of greenhouse gas (GHG) emissions from coal mining activities is crucial for developing effective mitigation strategies and achieving carbon neutrality goals. This study presents a multi-month (starting August 2025) experimental campaign conducted in a prominent coal mining cluster. We deployed a high-precision ground-based observation tower (70m a.g.l) to monitor continuous atmospheric concentrations and calculate fluxes of CH4, CO2 at DaBuTou station (36.07˚N, 112.88˚E, hereafter DBT). The DBT station is located in Zhangzi, Changzhi, Shanxi Province, and has several coal mines within a 10-km radius in all directions of the observation site. An LI-7700 Open-Path CH4 Gas Analyzer (LI-COR, Inc.) was mounted at a 65.2 m height on the tower, along with an Integrated CO2/H2O Open-Path Gas Analyzer and 3D Sonic Anemometer (IRGASON, Campbell Scientific, Inc.). To bridge the gap between observed concentrations and source strengths, the Weather Research and Forecasting (WRF) model coupled with the Stochastic Time-Inverted Lagrangian Transport (STILT) model was employed. The WRF-STILT framework was used to generate high-resolution footprints, characterizing the sensitive source areas contributing to the tower flux and concentration measurements.

Preliminary results reveal significant diurnal variations in methane footprints, driven by complex terrain and fluctuating operational intensities within the coal-mining cluster. Height selection fundamentally dictates the spatial representativeness of specific mining activities within the cluster, providing a critical benchmark for optimizing emission estimate model’s parameters to ensure that flux measurements are strategically weighted toward key industrial emitters. We note some interesting conclusions: first that it is possible to separate some of the various coal mine sources from each other using a sufficiently long dataset; and second that observational uncertainty spans both concentration and wind observations in tandem, meaning that simple approaches for emissions estimation are insufficient; and finally that a very small number of days have a substantial difference in terms of emissions from the other days, requiring that observations be conducted very long-term before annual or other types of climatological conditions can be established.

In conclusion, this research provides a robust framework for utilizing direct CH4 flux measurements to characterize fugitive emissions in coal-mining clusters. Our findings establish a verifiable 'ground-truth' framework that not only refines regional emission inventories but also serves as a critical diagnostic tool for industrial stakeholders and regulatory agencies to implement verifiable GHG reduction pathways and advance toward net-zero climate goals.

How to cite: Hu, W., Cohen, J. B., Liu, Y., Zheng, B., and Qin, K.: Coupling Long-Term Ground-Based Flux Measurements with a Lagrangian Transport Model to Quantify and Attribute Emissions in a Coal Mining Cluster, EGU General Assembly 2026, Vienna, Austria, 3–8 May 2026, EGU26-8987, https://doi.org/10.5194/egusphere-egu26-8987, 2026.

EGU26-9166 | Posters on site | BG8.3

Increase of fractional vegetation coverage enhancing rise of water use efficiency over globe from 1982 to 2021 

Xiaojun Dou, Guirui Yu, Zhi Chen, and Yucui Zhang

Ecosystem water use efficiency (WUE), defined as the amount of carbon sequestration per unit of water consumed, is significantly influenced by various factors, including elevated atmospheric CO2, changing climate, vegetation growth, nitrogen deposition, and so on. However, the response of the water and carbon coupled cycles to global change and the underlying comprehensive driving mechanisms of multiple factors remain unclear. Based on global 475 situ eddy covariance fluxes sites data released by FLUXNET, AmeriFLUX, ICOS, OzFlux and ChinaFLUX, and integrated with multiple satellite remote sensing products, we upscaled global ecosystem WUE from 1982 to 2021 by using an ensemble of 27 machine learning models. Importantly, our findings suggest, largely attributed to the increase in fractional vegetation coverage (FVC), that the rapid increase in global WUE after 2012, while CO2 fertilization effect is not significant. Notably, FVC enhances gross primary productivity (GPP) but also limits evapotranspiration (ET) to some extent. This asynchronous effect doesn’t lead to a proportional increase in water consumption costs as carbon sinks rise. This study systematically elucidates the mechanisms through which WUE responds to climate change, thereby providing a more accurate prediction of the future water-carbon coupling cycle.

How to cite: Dou, X., Yu, G., Chen, Z., and Zhang, Y.: Increase of fractional vegetation coverage enhancing rise of water use efficiency over globe from 1982 to 2021, EGU General Assembly 2026, Vienna, Austria, 3–8 May 2026, EGU26-9166, https://doi.org/10.5194/egusphere-egu26-9166, 2026.

EGU26-9210 | ECS | Orals | BG8.3

Quantifying CO₂ emissions from ground-mounted solar parks in temperate climates and the potential mitigating role of surface vegetation 

Emma Lopez, Jean-Christophe Domec, Denis Loustau, Christophe Chipeaux, Cyriane Garrigou, Jean-Marie Côme, and Virginie Moreaux

In the context of the environmental crisis and steadily increasing energy demand, diversifying energy sources has driven the deployment of renewable energies, particularly photovoltaics. Photovoltaic energy is generally considered a low-carbon alternative to fossil fuels due to the absence of direct emissions during electricity generation. However, beyond these debated considerations, gaps remain in post-installation assessments of surface areas. Photovoltaic panels alter the surrounding microclimate, and these changes can affect soil and vegetation, which are major controls on how carbon is released to or absorbed from the atmosphere. To our knowledge, no study in temperate regions has yet quantified the CO₂ fluxes directly resulting from post-installation land surface changes.

Between 2022 and 2024, we measured CO₂ fluxes at two solar parks in France. The first, located in northwest France (Normandy), covers 19 ha of former industrial land with partly impermeable soils and sparse vegetation. The second, in southwest France (Gironde), spans 127 ha on a former maritime pine plantation within a predominantly forested landscape and is characterized by wet heathland soils.

In 2024, both sites exhibited neutral to positive annual NEE balances (carbon sources), with values of 20 ± 9 gC/m² in Normandy and 184 ± 55 gC/m² in Gironde. Although biomass was greater at the Gironde site, annual GPP in 2024 was 654 ± 27 gC/m² compared with 842 ± 53 gC/m² in Normandy, where the growing season was significantly longer, partly explaining the differences in annual NEE. Total respiration was 838 ± 16 gC/m² in Gironde and 862 ± 56 gC/m², in Normandy. Differences between sites in the sensitivity of vegetation cover and its ecophysiological processes to climate and soil conditions, as well as in their efficiency in using light and water, partly explained the overall patterns and seasonal partitioning of carbon fluxes. Vegetation and land management also played an important role in regulating emissions. In Gironde, practices such as mowing and grazing contributed to the low GPP. These results highlight the key role of the vegetation cover in regulating carbon fluxes and its potential to mitigate emissions under suitable conditions and management in photovoltaic ecosystems.

How to cite: Lopez, E., Domec, J.-C., Loustau, D., Chipeaux, C., Garrigou, C., Côme, J.-M., and Moreaux, V.: Quantifying CO₂ emissions from ground-mounted solar parks in temperate climates and the potential mitigating role of surface vegetation, EGU General Assembly 2026, Vienna, Austria, 3–8 May 2026, EGU26-9210, https://doi.org/10.5194/egusphere-egu26-9210, 2026.

EGU26-9327 | Posters on site | BG8.3

Data-driven prediction of urban vegetation cooling effects using machine learning and field observations 

Terenzio Zenone, Gabriele Guidolotti, Theodore Endreny, Teresa Bertolini, Marco Ciolfi, Michele Mattioni, Emanuele Pallozzi, and Carlo Calfapietra

The rapid expansion of urban populations, coupled with growing epidemiological evidence that associates extreme temperature events with adverse health outcomes and elevated mortality rates underscores the critical role of Urban Green Areas (UGAs) in delivering ecosystem services that enhance human well-being. Among these services, the air temperature cooling potential (ΔT°C) driven by ecosystem evapotranspiration (ET) represents a key mechanism for mitigating heat-related health risks.

This study investigates the capacity of various Machine Learning (ML) algorithms to predict the ΔT°C of UGAs, thereby supporting thermal regulation through ET and highlighting their importance in sustainable urban planning and climate adaptation strategies. We used multiple years of experimental Eddy Covariance (EC) observations of the ET the to train and validate a series of ML algorithms with the objective to simulate the cooling effect of the urban vegetation. A preliminary analysis of predictor variables was conducted to identify and rank their importance using the mean absolute Shapley (Sh) values. Results indicate that incoming shortwave solar radiation (Rg) was the most influential predictor (Sh = 0.45), followed by vapor pressure deficit (VPD, Sh = 0.20), relative humidity (RH, Sh = 0.075), air temperature (AirT, Sh = 0.065), friction velocity (u*, Sh = 0.02), and wind speed (WS, Sh = 0.01). The application of ML algorithms revealed that Bootstrap Aggregation (Bagging) and Least-Squares Boosting (LSBoost) performed best, achieving R² values of 0.89 and 0.83, respectively, during the training phase compared to observed data. Other algorithms, including Neural Networks (NN), Gaussian Process Regression (GPR), and Support Vector Machines (SVM), showed also similar, but slightly lower r2 , with values ranging from 0.80 (NN) to 0.79 (SVM). Ten-fold cross-validation confirmed robust generalization, as model performance remained consistent regardless of the data subset used to compute R² between modeled and observed values. Further evaluation using Taylor diagrams showed that the average normalized standard deviation (σn) and Pearson correlation coefficient of the models were 0.89 (±0.02) and 0.90 (±0.02), respectively, closely matching the observed data.

During the testing phase we observed, as expected, a clear reduction of the ML performance compared to the training phase: however, over the three years of the testing phase, RG bagging and LSBOOST have confirmed their superiority, compared to the other algorithms, with an average r2 between observed and simulated data of 0.66 and 0.67 respectively. Discrepancies between predicted and observed ΔT°C during testing were most evident during midday hours, with an average overestimation of 0.31°C (±0.2).

Overall, the investigated UGAs demonstrated an average capacity to reduce ambient air temperature during summer by approximately 2°C to 4°C.


How to cite: Zenone, T., Guidolotti, G., Endreny, T., Bertolini, T., Ciolfi, M., Mattioni, M., Pallozzi, E., and Calfapietra, C.: Data-driven prediction of urban vegetation cooling effects using machine learning and field observations, EGU General Assembly 2026, Vienna, Austria, 3–8 May 2026, EGU26-9327, https://doi.org/10.5194/egusphere-egu26-9327, 2026.

EGU26-10299 | Posters on site | BG8.3

A regional evapotranspiration network for climate-resilient water management in mountain agro-ecosystems 

Marta Galvagno, Sofia Koliopoulos, Chiara Guarnieri, Gianluca Filippa, Francesco Avanzi, Daria Ferraris, Federico Tagliaferro, Denise Chabloz, Edoardo Cremonese, Stefano Ferraris, Martina Lodigiani, Andrea Mainetti, Maddalena Nicora, and Paolo Pogliotti

Accurate quantification of evapotranspiration (ET) is a key challenge for understanding land–atmosphere interactions and optimizing water use in agriculture. Under ongoing climate change, reliable estimates of actual ET are critical in mountain regions such as in the Alps, where changes in temperature, precipitation, and snow dynamics strongly influence water availability and ecosystem functioning. While distributed information on ET is commonly derived through models based on remote sensing, meteorological variables, and crop coefficients, this study highlights the added value of direct ET observations. Indeed, model-based approaches, while useful for large-scale estimates, often fail to capture the strong spatial variability associated with heterogeneous landscapes and the complex response of ET to climatic drivers. Direct ET measurements, obtained through eddy covariance, are more reliable under stress conditions because they capture actual increases in ET during drought, driven by elevated atmospheric demand and sustained water supply from deep soil reservoirs. These mechanisms are commonly underrepresented by models due to simplifications in plant, soil, and hydraulic parameterizations.

Direct observations of actual ET are therefore essential for improving irrigation water requirement (IWR) assessments and supporting water management in agriculture. During 2025, within the Agile Arvier project (Next Generation EU), we implemented a regional network for direct ET measurements across the Aosta Valley region (north-western Italian Alps). Seven LI-710 evapotranspiration sensors (LI-COR) were installed across representative agricultural systems in the area. To further strengthen the observational network, these measurements have been integrated with long-term ET datasets from two ICOS-associated sites in the region (IT-Tor, IT-TrF), providing decadal-scale context, and with three additional LI-710 already present in the same territory. The final network totalizes twelve monitoring sites, including a vineyard, an apple orchard, six meadows and pastures, a European larch forest, an abandoned pasture, a wetland, and a high-altitude rocky environment, distributed along an altitudinal gradient from approximately 500 to 3100 m a.s.l. 

Results will include site-specific comparison between observed ET and estimates derived from regional IWR datasets, to refine irrigation requirement estimates based on observations. This comparison is expected to improve the reliability of irrigation planning tools and to support the Regional Agricultural Department in developing more efficient and adaptive water management strategies. Finally, the release of an online, open-access ET database will be presented, allowing to researchers, land owners, sector experts, and policymakers to access and download data, thereby contributing to transparent, evidence-based decision-making.

How to cite: Galvagno, M., Koliopoulos, S., Guarnieri, C., Filippa, G., Avanzi, F., Ferraris, D., Tagliaferro, F., Chabloz, D., Cremonese, E., Ferraris, S., Lodigiani, M., Mainetti, A., Nicora, M., and Pogliotti, P.: A regional evapotranspiration network for climate-resilient water management in mountain agro-ecosystems, EGU General Assembly 2026, Vienna, Austria, 3–8 May 2026, EGU26-10299, https://doi.org/10.5194/egusphere-egu26-10299, 2026.

EGU26-10984 | Orals | BG8.3

Long-term flux observation network development in South Africa – national platforms to support environmental research and evidence-based decision making  

Gregor Feig, Ryan Blanchard, Abri De Buys, Siphesihle Faltein, Warren Joubert, Helga Knoetze, Amukelani Maluleke, Jeremy Moonsamy, Nolusindiso Ndara, Sylvester Selala, Felix Skhosana, Kathleen Smart, and Michele Toucher

South Africa is developing a network of flux observations to support studies on coupled ecological and social systems. Currently, eight flux measurement sites are operated by the South African Environmental Observation Network (SAEON) and the Council for Scientific and Industrial Research (CSIR). Data from these observations are openly available online in near real-time, following standardised quality control and FAIR data principles. Each of the flux observations forms part of a landscape-scale research infrastructure (RI) co-designed with researchers, land managers and policy stakeholders to ensure long-term relevance for both science and decision making. Landscape RI sites include suites of standard continuous meteorological, hydrological, and repeated manual measurements covering biodiversity, productivity, ecosystem condition, and ecosystem service provision and use. These landscapes encompass a diverse suite of biomes across South Africa, including arid shrubland, subtropical savanna, tropical grassland, high-altitude mesic grassland, Afromontane forests, and fynbos, with a range of land-use types and tenure systems represented. These long-term research infrastructure platforms have been utilised in numerous national and international projects supporting scientific development and informed societal decision-making. This presentation will focus on infrastructure co-design and development with broad stakeholder groups and showcase results highlighting activities in the RI, outputs, lessons learned, and future priorities

How to cite: Feig, G., Blanchard, R., De Buys, A., Faltein, S., Joubert, W., Knoetze, H., Maluleke, A., Moonsamy, J., Ndara, N., Selala, S., Skhosana, F., Smart, K., and Toucher, M.: Long-term flux observation network development in South Africa – national platforms to support environmental research and evidence-based decision making , EGU General Assembly 2026, Vienna, Austria, 3–8 May 2026, EGU26-10984, https://doi.org/10.5194/egusphere-egu26-10984, 2026.

EGU26-11934 | Posters on site | BG8.3

Advanced Research Data Management to Enhance Reuse and Societal Impact of Flux Data 

Yusri Yusup, Andreas Rauber, Ehsan Jolous Jamshidi, Japareng Lalung, and Martin Weise

Flux measurements play a critical role in informing climate mitigation, ecosystem management, and land–atmosphere interaction studies. However, their broader societal impact is often limited by fragmented data management, insufficient metadata, and unclear version histories that hinder reproducibility, citation, and effective reuse. Here, we demonstrate how the DBRepo data repository system can be used to operationalize principles, dataset versioning, precise identification of arbitrary subsets, and citation practices for flux data, while maintaining alignment with established standards such as those used by FLUXNET. Using flux datasets deposited in DBRepo, we illustrate how explicit versioning and persistent identifiers enable users to track updates, assess the impact of data revisions on analytical outcomes, and ensure that derived results remain interpretable and citable over time. This is particularly relevant for educational and applied contexts, where students, researchers, and non-academic stakeholders require clarity on which data version underpins a given conclusion. Mapping the data representations to established ontologies and FLUXNET conventions, to capture their semantics and units of measurements, further enhances interoperability and lowers the barrier for integrating locally managed flux datasets into broader analysis workflows. By framing versioned, FAIR flux data as a learning and decision-support resource rather than static research output, this work highlights how data infrastructure can directly enhance data literacy, analytical skills, and trust in flux-based evidence. Such practices are essential for translating flux observations into robust, actionable insights with immediate societal benefits.

How to cite: Yusup, Y., Rauber, A., Jamshidi, E. J., Lalung, J., and Weise, M.: Advanced Research Data Management to Enhance Reuse and Societal Impact of Flux Data, EGU General Assembly 2026, Vienna, Austria, 3–8 May 2026, EGU26-11934, https://doi.org/10.5194/egusphere-egu26-11934, 2026.

Direct measurements and satellite-derived estimates of Net Ecosystem Exchange (NEE) provide a robust, ecosystem-scale view of land–atmosphere CO₂ dynamics, yet they are rarely connected to product-level carbon accounting frameworks used in policy and markets. This contribution presents a practical, ISO-aligned methodology for integrating NEE into Life Cycle Assessment (LCA) and Product Carbon Footprints, bridging land-based flux measurements with product-based MRV.

The approach replaces generic cultivation-stage emission factors with site-specific NEE data, while preserving full compliance with ISO 14040/44 and ISO 14067. A core boundary-based decision rule ensures carbon mass balance and prevents double counting by explicitly accounting for the fate of harvested biomass carbon. The method is demonstrated across multiple real-world case studies, including oil palm, livestock feed systems, and tobacco production, using both satellite-based and multi-year averaged NEE data.

Results show that integrating NEE substantially improves the climate relevance of product footprints, enabling year-on-year tracking of land management performance and revealing carbon footprint reductions of 19–47% relative to conventional LCAs. Beyond accounting, the framework enables direct translation of flux measurements into decision-relevant indicators for insetting, land management optimization, and supply-chain MRV. The work illustrates how flux science can move from research contexts into scalable, auditable applications with clear societal and market benefits. 

How to cite: Toth, G.: From Fluxes to Footprints: Integrating Net Ecosystem Exchange into Product Carbon MRV, EGU General Assembly 2026, Vienna, Austria, 3–8 May 2026, EGU26-17104, https://doi.org/10.5194/egusphere-egu26-17104, 2026.

EGU26-17755 | Orals | BG8.3

The CARBONIQUE project: Carbon cycling in Quebec's wetlands 

Michelle Garneau, Paul del Giorgio, Scott Davidson, Sara Knox, Oliver Sonnentag, Vincent Maire, Alexandre Roy, Evelyne Thiffault, Marc-André Bourgault, Martina Schlaipfer, Léonie Perrier, David Trejo Cancino, Michaela Ladeira de Melo, Laurent Lessard, Jean-Benoît Leblond Chouinard, and Zoran Nesic

Funded by the Quebec Government, the CARBONIQUE  project seeks to better understand the carbon storage capacity of the main wetland types in southern Quebec - open and treed peatlands, coastal freshwater marshes and swamps. By quantifying their contributions, the project highlights the role these ecosystems can play within a broader portfolio of approaches for addressing climate change. This focus is particularly important in southern Quebec, where wetlands are under the greatest anthropogenic pressure and where informed management decisions can have the largest impact.

To  achieve this, the project will quantify both the carbon and water cycles at paired natural (intact) and disturbed sites for each wetland type (alongside one restored marsh site) and examine how these two cycles interact. Atmospheric carbon exchange will be measured using eddy covariance flux towers and integrated with measurements of above and belowground carbon stocks, lateral carbon fluxes and hydrological processes. As of spring 2026, six sites have been equipped with an eddy covariance flux tower. Three additional sites will be instrumented in summer 2026, expanding the network and enabling robust comparisons across all wetland types and disturbance regimes.

The project will provide crucial predictive understanding to inform policy, guide wetland conservation and management, and support the design of effective climate change mitigation strategies across multiple levels of government.

How to cite: Garneau, M., del Giorgio, P., Davidson, S., Knox, S., Sonnentag, O., Maire, V., Roy, A., Thiffault, E., Bourgault, M.-A., Schlaipfer, M., Perrier, L., Trejo Cancino, D., Ladeira de Melo, M., Lessard, L., Leblond Chouinard, J.-B., and Nesic, Z.: The CARBONIQUE project: Carbon cycling in Quebec's wetlands, EGU General Assembly 2026, Vienna, Austria, 3–8 May 2026, EGU26-17755, https://doi.org/10.5194/egusphere-egu26-17755, 2026.

EGU26-20225 | ECS | Posters on site | BG8.3

A modelling approach to estimate the friction velocity threshold for Eddy Covariance measurements in urban areas 

Luca Di Fiore, Simone Sabbatini, Giacomo Nicolini, and Dario Papale

The Eddy Covariance (EC) technique has been widely used to quantify gas exchanges between ecosystems and the atmosphere. Recently, the application of this method in urban areas has gained attention within the scientific community, aiming to understand, measure, and track the gas exchanges in densely populated areas. Among all the EC-related parameters, friction velocity (u*) is commonly used to identify non-turbulent (and thus unreliable) fluxes, calculating a threshold for filtering the data. However, standard approaches to calculate the u* threshold in urban areas cannot be applied.

Taking advantage of the data available from the FLUXNET Data System, we developed a modelling approach to estimate the u* threshold in urban sites. A set of predictive variables related to site physical and meteorological characteristics, u* values, and distribution indices (kurtosis, skewness) were tested within a multiple linear regression on non-urban sites. The relation was then applied to urban sites, calculating “synthetic” u* threshold values.  

Preliminary results show that u* has the highest predictive capacity, while the other variables add only a relatively small contribution in improving the model accuracy. In addition, the choice of site-related physical characteristics should be carefully evaluated according to their different behaviour in urban and non-urban sites. Since it is not possible to retrieve reference u* threshold values for urban sites, model validation is implemented only for non-urban sites.

Although without performing a calibration directly on urban sites, the proposed modelling approach represents a precious refinement in estimating EC fluxes in urban areas, allowing to generate u* threshold values where not possible with standard approaches. Moreover, the new FLUXNET Data System launched in December 2025 ensures a robust model calibration, providing a larger dataset compared to the previous data release. 

How to cite: Di Fiore, L., Sabbatini, S., Nicolini, G., and Papale, D.: A modelling approach to estimate the friction velocity threshold for Eddy Covariance measurements in urban areas, EGU General Assembly 2026, Vienna, Austria, 3–8 May 2026, EGU26-20225, https://doi.org/10.5194/egusphere-egu26-20225, 2026.

EGU26-20887 | Orals | BG8.3 | Highlight

The FLUXNET (r)evolution: a coordinated, global effort for longer, more representative and more accessible flux tower datasets 

Simone Sabbatini, Adriana Mariotti, Eleonora Canfora, Carlo Trotta, Luca Di Fiore, Gilberto Pastorello, David Joseph Moore, Margaret Torn, Kimberly Ann Novick, Trevor Keenan, Peter Isaac, Cacilia Ewenz, and Dario Papale

The FLUXNET2015 release of flux tower data represents a milestone in the global landscape of eddy covariance based monitoring of CO2 and other greenhouse gas (GHG) land-atmosphere exchanges. For the first time more than 200 stations across the globe joined forces towards a standardized product, facilitated by a centralized processing and a unique software (OneFLUX, Pastorello et al. 2020). This paved the way for a deeper understanding of ecosystem responses to climate change and other stressors, as well as for improved performances of satellite products via better calibration and validation data, together with better upscaling and mapping efforts. However, the complexity of such an effort made it impossible to replicate it in a short timeframe for a fully comprehensive new release. Still in 2015, the “birth” of the ICOS ERIC, the European monitoring network of GHG land-atmosphere exchanges, represented another game-changer. The collaboration between ICOS and its American and Australian counterparts, AmeriFlux and OzFlux, led to the launch in December 2025 of the FLUXNET Data System Initiative, characterized by a new, continuously updated approach. With the present contribution we intend to describe the main features of the new system and the benefits we expect it will deliver to the flux, satellite and modeling communities and other stakeholders. By decentralizing the processing and the communication with the smaller regional networks to the three data hubs (ICOS, AmeriFlux and OZFlux), we were able to: (i) extend the data coverage in time and space, including historically under-represented areas and biomes; (ii) building a new API-based tool for the accessibility of the datasets, the FLUXNET Shuttle (Papale et al., 2020), allowing a quasi-continuous update of the datasets, thus suppressing the need for “static” new releases in the future; (iii) increasing the efficiency of the OneFLUX software, in particular in the case of long gaps and for ecosystems in special conditions. This effort constituted also an occasion to define a strategy for handling the legacy of long-term timeseries, and an opportunity for the study and construction of new solutions for peculiar cases, like the synthetic ustar threshold for urban flux towers.

How to cite: Sabbatini, S., Mariotti, A., Canfora, E., Trotta, C., Di Fiore, L., Pastorello, G., Moore, D. J., Torn, M., Novick, K. A., Keenan, T., Isaac, P., Ewenz, C., and Papale, D.: The FLUXNET (r)evolution: a coordinated, global effort for longer, more representative and more accessible flux tower datasets, EGU General Assembly 2026, Vienna, Austria, 3–8 May 2026, EGU26-20887, https://doi.org/10.5194/egusphere-egu26-20887, 2026.

EGU26-20962 | Posters on site | BG8.3

Harmonizing Legacy Eddy Covariance Data within the ICOS and FLUXNET Networks: Methodological Insights from Long-Term Observations 

Adriana Mariotti, Carlo Trotta, Simone Sabbatini, Eleonora Canfora, and Dario Papale

Long-term observations of carbon, water, and energy exchanges, together with meteorological measurements, are essential for quantifying climate variability and change and for supporting ecosystem and climate model development. Eddy covariance networks provide unique multi-decadal datasets. However, their legacy data, historical observations collected prior to or during the evolution of standardized protocols, represent a critical resource. These datasets are frequently fragmented and may suffer from inconsistent formats and incomplete or missing metadata describing: how, when, and where data were collected, processed, and analyzed. Without systematic curation and harmonization, such data remain difficult to interpret, compare, and reuse. 

A metadata-driven approach was applied to long-term datasets from nineteen ICOS Network stations in order to integrate legacy eddy covariance data into standardized data infrastructures. These long-term datasets are released through the FLUXNET Data System, a continuously updated, open-access platform that provides harmonized flux and meteorological observations, complemented by comprehensive metadata. In this contribution, we focus on a representative subset of these datasets to examine key methodological and practical aspects that are critical for effective long-term data integration. We demonstrate how detailed and structured metadata enable the identification and resolution of inconsistencies arising from changes in instrumentation, sensor characteristics, spatial representativeness, and data processing methodologies, over multi-decadal periods.

A systematic metadata cross-walking procedure is used to document and reconcile historical site-specific changes, ensuring temporal continuity, data comparability, and transparency. This case study highlights the central role of metadata in bridging legacy datasets with contemporary standards, supporting FAIR data principles, and enabling the construction of interoperable long-term observational datasets. The proposed approach enhances data quality, interpretability, and reusability, thereby maximizing the scientific value of long-term eddy covariance observations for climate and ecosystem research.

How to cite: Mariotti, A., Trotta, C., Sabbatini, S., Canfora, E., and Papale, D.: Harmonizing Legacy Eddy Covariance Data within the ICOS and FLUXNET Networks: Methodological Insights from Long-Term Observations, EGU General Assembly 2026, Vienna, Austria, 3–8 May 2026, EGU26-20962, https://doi.org/10.5194/egusphere-egu26-20962, 2026.

EGU26-21220 | Posters on site | BG8.3

FloraFlux: Automated plant identification for understanding ecosystem functioning across global flux tower sites 

Susanne Tautenhahn, Martin Jung, Jana Wäldchen, Ladislav Šigut, Sung Ching Lee, Markus Reichstein, Dario Papale, Jacob Nelson, Sophia Walther, Flavian Tschurr, Nina Buchmann, Jens Kattge, Florian Jansen, Jürgen Dengler, and Gabriele Midolo and the FloraFlux community

Understanding why ecosystems respond differently to environmental drivers, and how vegetation mediates land–atmosphere fluxes of matter and energy, remains a central challenge in ecosystem functioning research. Lacking information on biodiversity—spanning species composition, plant functional traits, bioindication, understory vegetation, and vegetation dynamics— may have prevented significant progress here. FloraFlux enables the collection of this complementary “biodiversity layer” to unlock new opportunities for interpreting and modelling ecosystem fluxes and functions across flux tower sites.

FloraFlux is a community-driven initiative to collect plant species occurrence data at eddy covariance flux sites worldwide. Integrated as a flux tower–specific project into the Flora Incognita app for automated plant identification, FloraFlux enables participants to document and share spatially and temporally explicit plant species occurrence information within tower footprints seamlessly with only a smartphone. Participation is simple and inclusive, requires no botanical expertise, and supports open data sharing within the flux tower community. 

Data processing pipelines linking FloraFlux observations to existing biodiversity and ecosystem research infrastructures are already in place, including: (1) pan-European bio-indication systems such as EIVE for local climate and soil conditions, (2) the European Disturbance Indicator Values for disturbance and management, and (3) the global plant trait data from the TRY Plant Trait Database.

The first FloraFlux field season in 2025 already yielded >1,500 plant observations from >30 flux tower sites in Europe. ~40 participants contributed data, and > 50 newsletter subscribers prove the feasibility and acceptance of this collaborative effort. A Shiny web application will provide a map and site-level summaries of plant traits and bio-indicators (QR code on poster).

We are starting to explore key questions, such as:

  • How can plant functional traits and bio-indicator values help us understand ecosystem functional properties and spatial variation in fluxes?

  • How do ecosystems with different biodiversity and local site conditions respond to environmental drivers such as drought, pests, or management interventions?

  • What is the role of understory and herb-layer vegetation in modulating flux variability?

  • How does functional diversity influence ecosystem resilience, for example in terms of recovery after drought or extreme events?

  • How can integrating species-level traits and bio-indicators complement or refine traditional plant functional type classifications?

First exploratory analyses show a strong relationship between maximum NEP and plant indicator values for soil nitrogen (R² = 0.45, rising to >0.9 when including further traits and bio-indicators) derived from species observations. These initial findings underscore the potential of FloraFlux to contribute the “missing biodiversity link” to long-term flux research and strengthen the scientific and societal value of networks such as ICOS or FLUXNET.

All flux tower teams worldwide are invited to the 2026 FloraFlux season. Join us with your smartphone at the poster for assistance. More participants and observations enhance our collective understanding of biodiversity’s role in ecosystem functioning.

Join FloraFlux and contribute to biodiversity–ecosystem functioning research effortlessly!

How to cite: Tautenhahn, S., Jung, M., Wäldchen, J., Šigut, L., Lee, S. C., Reichstein, M., Papale, D., Nelson, J., Walther, S., Tschurr, F., Buchmann, N., Kattge, J., Jansen, F., Dengler, J., and Midolo, G. and the FloraFlux community: FloraFlux: Automated plant identification for understanding ecosystem functioning across global flux tower sites, EGU General Assembly 2026, Vienna, Austria, 3–8 May 2026, EGU26-21220, https://doi.org/10.5194/egusphere-egu26-21220, 2026.

EGU26-21377 | Posters on site | BG8.3

Phenological behavior of  a cultivated savannah and an open clear forest in a tropical humid climate in West Africa derived Eddycovariance fluxes. 

Jean-Martial Cohard, Ossenatou Mamadou, Miriam Hounsinou, and Renaud Koukoui

CO2 fluxes observations and associated annual budgets are essential to understand the functioning of ecosystems and the sequestration capacities of continental areas. On a global scale, scarcity of carbon fluxes and stocks on the African continent has been identified by the carbon community as a source of uncertainty for climate models. At the local scale, ecosystem/atmosphere exchanges in terms of water and carbon are poorly documented in the equatorial belt, making it difficult to implement sustainable strategies for land use planning and agricultural systems, which are necessary for adaptation to global changes.

We present one of the largest CO2 measurement series for two tropical ecosystems in Benin, under a Sudanese climate: a light forest and an agricultural area. The series cover the period 2008-2024. Processing these data has revealed specificities in terms of qualification, selection, and gap-filling procedures. In particular, temperature models are inefficient for calculating respiration due to the low seasonal variability of daily temperatures. Ecophysiological parameters (dark respiration, quantum light efficiency, maximum CO2 assimilation rate) show more intense activity for the forest than for the agricultural area. The seasonality of phenology also contrasts between the two sites, with a rapid increase in Amax associated with leafing before the rainy season for the forest and a steady increase with the onset of the rainy season for the agricultural area.

These measurements, carried out as part of the AMMA-CATCH observatory, contribute to a regional dynamic led by the WAF-Net collective, which brings together scientist involved in measuring carbon and water flows in West Africa.

How to cite: Cohard, J.-M., Mamadou, O., Hounsinou, M., and Koukoui, R.: Phenological behavior of  a cultivated savannah and an open clear forest in a tropical humid climate in West Africa derived Eddycovariance fluxes., EGU General Assembly 2026, Vienna, Austria, 3–8 May 2026, EGU26-21377, https://doi.org/10.5194/egusphere-egu26-21377, 2026.

Although the relationship between biodiversity and ecosystem functioning (BEF) has been extensively studied, the mechanisms by which species mixing ratios in mixed forests regulate community productivity and tree responses to climatic stress through interspecific interactions remain poorly understood. In this study, we systematically investigated how different species mixing ratios influence ecosystem functioning in temperate Pine–Oak mixed forests.

First, using dendrochronological methods, we assessed tree climate sensitivity as well as resistance (Rt), recovery (Rc), and resilience (Rs) under both short-term and long-term drought conditions. We found that species mixing does not universally reduce climate sensitivity or enhance drought resistance; rather, only moderate mixing ratios optimize drought resistance and recovery, especially for oak. In contrast, pine shows reduced drought resistance when the proportion of oak is high, suggesting that the biodiversity effect may be asymmetric among different species.

In addition, from the perspective of spatial and phenological niche differentiation in resource use, we revealed the mechanisms by which mixing ratios regulate community productivity across multiple temporal scales (yearly, monthly, and daily). Tree-ring width served as a proxy for productivity, providing five-year average annual values, while microcore techniques captured monthly and daily dynamics of growth. Monthly changes in leaf area index (LAI) and community-weighted mean photosynthetic capacity (CMW-Pn) were monitored, and stable isotope tracers, hydraulic traits, and soil nutrients were used to evaluate water and nutrient niches. Our results demonstrate that complementary use of light resources among different tree species is the primary mechanism driving increased productivity in mixed forests, exerting a much stronger influence than water or nutrient factors. Specifically, the key determinant of productivity lies in community-level light interception capacity rather than photosynthetic capacity alone. In addition, phenological niche differentiation plays a crucial role in enhancing productivity. Through daily-scale growth monitoring, we quantified this mechanism for the first time: asynchronous growth phenology among species substantially reduced interspecific competition and strengthened temporal resource complementarity, ultimately increasing overall community productivity by approximately 15%.
These findings provide new mechanistic insights into enhancing and sustaining productivity in mixed forests under climate change.

How to cite: Wang, X.: Mechanisms of mixed forests enhancing community productivity and their effects on climate response, EGU General Assembly 2026, Vienna, Austria, 3–8 May 2026, EGU26-686, https://doi.org/10.5194/egusphere-egu26-686, 2026.

Forest productivity often increases with tree species mixing. However, the structural mechanisms through which species mixing reorganizes stand structure across hierarchical levels and thereby regulates forest productivity and carbon storage remain unresolved. Here, we combined high-resolution UAV-LiDAR surveys with Dagum Gini decomposition in a subtropical evergreen broad-leaved forest to partition stand structural heterogeneity into inter- and intra-specific components. We found that species mixing generated contrasting structural responses across hierarchical levels, amplifying size differentiation among species while reducing size variation within species. The resulting increase in inter-specific heterogeneity was the dominant pathway promoting aboveground carbon accumulation, consistent with realized niche complementarity and more efficient space use. By contrast, intra-specific structural convergence exerted a negative effect on carbon storage, likely reflecting growth suppression under intensified neighborhood competition. Overall, species mixing enhanced aboveground biomass because the benefits of species-level structural stratification outweighed the costs of population-level homogenization. Our results highlight hierarchical structural reorganization as a key mechanism linking biodiversity to forest productivity.

How to cite: Zhou, Z.: Species mixing enhances aboveground biomass via structural heterogeneity in a subtropical forest, EGU General Assembly 2026, Vienna, Austria, 3–8 May 2026, EGU26-1895, https://doi.org/10.5194/egusphere-egu26-1895, 2026.

EGU26-2897 | ECS | Orals | BG8.5

Incorporating site suitability and carbon sequestration of tree species into China’s climate-adaptive forestation 

Meinan Zhang, Shirong Liu, Xiangzhong Luo, Trevor F. Keenan, Liyong Fu, Chiwei Xiao, Yao Zhang, and Peng Gong

Strategic selection and precise matching of climate-resilient tree species are pivotal for climate-adaptive forestry in terms of forest-based climate change mitigation and adaptation to maximize its full potential. Current forestation plans often fail to account for environmental shifts, particularly at individual species resolution, jeopardizing suboptimal carbon sequestration over the long term. Here we developed a climate-adaptive optimization framework to guide tree species selection and planting in China based on projections of species-specific habitat viability and range redistribution under future climate scenarios. Leveraging over 200,000 tree samples from National Forest Inventories spanning 1999-2018, we quantified habitat viability declines of 12.1-42.9% by 2060 for currently dominant plantation species due to climate threats. Through optimized species-site matching and strategic timber harvesting at peak carbon uptake, we identified 43.2 million hectares sustaining climate-resilient forestation during 2025-2060 - planting approximately 46 billion climate-adapted trees with a total sequestration potential of 3,822.6 Tg of carbon, representing a 28.7% increase compared to unmanaged scenarios. Our study underscores the critical role of optimized adaptive forestation under future climate change scenarios in ensuring carbon mitigation while delivering technical guidance for climate-adaptive forest management plans supporting China’s net-zero aligned goals.

How to cite: Zhang, M., Liu, S., Luo, X., Keenan, T. F., Fu, L., Xiao, C., Zhang, Y., and Gong, P.: Incorporating site suitability and carbon sequestration of tree species into China’s climate-adaptive forestation, EGU General Assembly 2026, Vienna, Austria, 3–8 May 2026, EGU26-2897, https://doi.org/10.5194/egusphere-egu26-2897, 2026.

European forests deliver diverse ecosystem services, yet increasing human pressures and intensified wood harvest to meet climate and bioeconomy goals risk undermining their multifunctionality. Within the EU-funded ForestNavigator project, we examine how citizens across five EU countries (Czech Republic, Ireland, Italy, Spain, and Sweden) perceive trade-offs among forest ecosystem services , with particular attention to cultural and recreational values. These services are typically undervalued due to the absence of market prices and remain underrepresented in analyses, despite EU forest policy objectives that explicitly call for a more balanced consideration of multiple services within sustainable forest management.

We implemented a harmonized multi-country choice experiment (CE) survey with ~5,700 representative respondents, capturing willingness-to-pay (WTP) for forest management scenarios varying in wood harvest, mitigation potentials, protected areas, landscape amenities, and recreational infrastructure.

Key findings on more traditional ecosystem services reveal strong public support for climate mitigation via forest management, with greater WTP for a target more stringent than the EU2030 (€39–€64). Intensive harvesting - especially at 100% of forest regrowth - is broadly disapproved, even at 75% levels. Ambitious conservation, notably strict forest protection at 30%, receives substantial backing (up to +€28 in Ireland and +€26 in Sweden).

Focusing on cultural ecosystem services, nature-oriented recreation links with high value across countries (+€24 to +€29), contrasting with weaker and more variable support for resource-intensive recreation. Preferences for landscape diversity are nuanced; medium diversity often ranks higher than high diversity, with significant appreciation for high diversity in Ireland and the Czech Republic.

WTP varies significantly across demographic groups, with younger, more educated, employed, and higher-income individuals living near forests or urban areas showing higher values. These insights underscore the need for targeted policy communication and investment strategies in forest management.

Our results contribute to integrating cultural ecosystem service values into policy frameworks, integrated and land-use models, enhancing recognition of non-market forest services and informing sustainable forest management that balances climate goals, conservation, and public preferences.

How to cite: Michetti, M. and Eboli, F.: Assessing Preferences for Forest Ecosystem Services Across Europe: Emphasizing Cultural and Recreational Values, EGU General Assembly 2026, Vienna, Austria, 3–8 May 2026, EGU26-4060, https://doi.org/10.5194/egusphere-egu26-4060, 2026.

Restoration based on reference ecosystems offers essential benchmarks for achieving Sustainable Development Goals. Yet, existing quantitative research often fails to account for the spatial heterogeneity of these references. This study proposes a regionalized framework combining zoning logic with key indicators to assess restoration goals and potential fairly. Using the northern Qinling Mountains as a case area, the research applies a dual-indicator approach: first, using eco-geological metrics to map resource distribution; and second, utilizing landscape integrity, NDVI, and NPP to set site-specific restoration targets. Reference ecosystems were defined via protected area data and human footprint thresholds. By tracking the spatio-temporal evolution of these systems, the study evaluates previous restoration efforts and identifies priority zones for future intervention. This approach provides a scientifically grounded blueprint for regional ecological protection and repair.

How to cite: Hao, Y.: Towards a spatiotemporal framework for ecological restoration management based on geo-ecological zoning and reference states, EGU General Assembly 2026, Vienna, Austria, 3–8 May 2026, EGU26-4624, https://doi.org/10.5194/egusphere-egu26-4624, 2026.

EGU26-5398 | ECS | Orals | BG8.5

Underestimated Short- and Long-Term Impact of Clear-Cutting on Volatile Organic Compounds in a Boreal Forest 

Yiwei Gong, Cheng Wu, Radovan Krejci, Ross Petersen, Michael Bauer, Thomas Holst, Janne Rinne, Irene Lehner, Yvette Gramlich, Mattias Hallquist, Jay Slowik, André Prévôt, and Claudia Mohr

Boreal forests are a major source of biogenic volatile organic compounds (BVOCs), which undergo atmospheric oxidation and contribute to the formation of secondary organic aerosol (SOA) and cloud condensation nuclei. Clear-cutting, a common forest management practice involving the uniform removal of most or all trees within a designated area, can substantially alter biosphere–atmosphere interactions. In Sweden, approximately 2% of the managed forest area is harvested annually.

Here we present results from continuous observations conducted from 2020 to the present at the Norunda ACTRIS and ICOS research station in the Swedish boreal forest, where a clear-cutting event occurred in 2022 surrounding the main measurement tower. This event provided a unique opportunity to investigate the short- and long-term impacts of forest clear-cutting on atmospheric composition.

Our results show that clear-cutting significantly altered BVOC concentrations. While enhanced emissions of terpenes were expected, we also observed unexpectedly elevated concentrations of aromatic compounds, indicating that stressed boreal forests may represent an important source of aromatics. Source apportionment analysis reveals the emergence of new VOC sources during and after cutting, highlighting a more complex response of VOC emissions to forest management than previously recognized. Post-cutting factors further suggest a persistent, long-term influence on atmospheric composition. In addition, a chemical box model is used to simulate VOC oxidation processes under different clear-cutting scenarios, providing further insight into the underlying chemical mechanisms.

How to cite: Gong, Y., Wu, C., Krejci, R., Petersen, R., Bauer, M., Holst, T., Rinne, J., Lehner, I., Gramlich, Y., Hallquist, M., Slowik, J., Prévôt, A., and Mohr, C.: Underestimated Short- and Long-Term Impact of Clear-Cutting on Volatile Organic Compounds in a Boreal Forest, EGU General Assembly 2026, Vienna, Austria, 3–8 May 2026, EGU26-5398, https://doi.org/10.5194/egusphere-egu26-5398, 2026.

EGU26-6829 | Posters on site | BG8.5

Forest-based climate mitigation: a systems perspective focused on bio-energy and carbon 

Stefan Dekker, Hugo de Boer, Maria Santos, Steef Hanssen, and Hans de Kroon

Forests are currently estimated to store 861 GtC globally, and have absorbed nearly 200 GtC over the past 150 years, half of all fossil fuel emissions. Their essential role in the terrestrial carbon cycle makes forests central to climate mitigation. For example, through maintaining natural carbon stores, replacing fossil carbon-based building materials with timber-based materials, and bio-energy production without or with Carbon Capture and Storage (BECCS). Debates around forest-based bio-energy are highly contentious and often lack a systems perspective, omitting crucial processes required for holistic analysis of climate-relevant impacts. A systems perspective enables to quantify when and where, and the bounding conditions for carbon neutrality, moving towards transient and uncertainty-aware rather than static calculations of atmospheric CO2 concentration. By using a systems perspective, a better understanding will better define and constrain the fate of carbon. Three fundamental debates surround forest-based bio-energy:

  •  Is wood harvesting carbon-neutral A simple question, but the answer depends on the definition of carbon-neutrality used. We reviewed the literature to seven definitions, herein we focus on: i) IPCC: Harvesting counts as carbon loss, and there is an assumption that burning wood is carbon-neutral; further carbon credits and debts should be linked to the carbon cycle, ii) Carbon payback: Emissions must be reabsorbed by new growth, and assume to take 40 years.
  • What are the uncertainties associated with predictions of forest climate mitigation potential? Earth observations and models have shown that the is slowing down, and sinks have reversed to sources. Causes are multiple, including heat waves, droughts, fires and disease. Old growth forests’ role has become clarified, with increasing evidence that they continue to take up carbon, especially under carbon and nitrogen fertilization. Yet, effectivity of bio-energy options should consider both the role of old growth forests and the slow carbon cycle, failing to re-introduce carbon back over decadal to centennial timeframes.
  • What are the land area requirements of forest-based energy demands?. Globally, only 3% of our current forests are plantations, an area far from that needed to meet energy needs. Plantation forests have limited potential for climate mitigation due to their assimilation rates, harvesting regimes, and heightened fire risk, among others. Multiple future scenarios use abondoned land for expanding energy crops, yet without an examination of the efficiency of photosynthesis versus that of photovoltaic solar panels (0.1% versus 20%).

With our systems perspective, we compare the carbon balance between forests that are managed for bioenergy and that of forests that remain intact. In this presentation we only focus on carbon with a focus on residual flows. Our results question if the promotion of bioenergy from forests through the Renewable Energy Directive can level off all trade-offs. While forests are crucial for climate adaptation and restoration such as climate-smart forestry, biodiversity-friendly afforestation, nature-based climate solutions, a one-size fits all approach may be detrimental especially in the long run. 

How to cite: Dekker, S., de Boer, H., Santos, M., Hanssen, S., and de Kroon, H.: Forest-based climate mitigation: a systems perspective focused on bio-energy and carbon, EGU General Assembly 2026, Vienna, Austria, 3–8 May 2026, EGU26-6829, https://doi.org/10.5194/egusphere-egu26-6829, 2026.

EGU26-7060 | Posters on site | BG8.5

How Forest Structure and Management Impact on Forest Behavior 

Holger Lange, Jaana Bäck, Anke Hildebrandt, Thomas Holst, Georg Jocher, Julia Kelly, Natascha Kljun, Anne Klosterhalfen, Alexander Knohl, Natalia Kowalska, Adam Kristensson, Luna Morcillo, Teresa Sauras-Yera, Tim Philipp Schacherl, and Alberto Vilagrosa

Forests are increasingly exposed to extreme events and disturbances like droughts, storms, fires, pathogens, and others. At the same time, forests are expected to act as important carbon sinks with the corresponding climate change mitigation capacity. What are the links between forest structure and ecosystem functional properties and the resilience against disturbances and extreme events? What are the options for forest management in this context?

Using data from flux towers and field experiments from 90 sites in 16 countries, mostly in Europe, and remote sensing observations, we investigate the role of forest structure as buffer of climate extremes; link light-use efficiency to stand characteristics and management; elucidate the role of climate effects of short-lived climate forcers and their feedback due to a warming climate, stress and disturbances, and evaluate the impact of extreme drought, fire disturbances and forest management on soil organic carbon (SOC) and nitrogen dynamics.

Combining GAMs with bootstrap-based variable importance analysis, we could show that there are associations between the means of selected Ecosystem Functional Properties of boreal and temperate forests, like photosynthetic capacity (NEPsat) or underlying water-use efficiency (uWUE), and structural complexity metrics, like Leaf Area Index or Near-Infrared Reflectance of Vegetation. With increasing drought stress, higher canopies, LAI and species number stabilizes the forest response both for NEPsat and uWUE.

Work on entangling the climate effects of short-lived climate forcers (SLCFs) is progressing with measurements of terpene concentrations and emissions and aerosol particle dynamics process modelling. Model evaluation of the climate effect from afforestation in the Nordic countries with coniferous trees on previous grassland shows that the climate cooling effect of increased terpene emissions and aerosol formation outweighs the warming effect due to the filtering of aerosol particles by trees.

Field experiments on Spanish sites indicate that drought (induced through precipitation exclusion) significantly reduces the litter decomposition rate, and that thinning increases SOC content; however, differences in SOC between management regimes are often masked by high spatial variability.

The work presented has emerged within the Work Package “Data assessment of processes and their impacts on biodiversity and climate effects on forests” of the CLIMB-FOREST H2020 EU project.

How to cite: Lange, H., Bäck, J., Hildebrandt, A., Holst, T., Jocher, G., Kelly, J., Kljun, N., Klosterhalfen, A., Knohl, A., Kowalska, N., Kristensson, A., Morcillo, L., Sauras-Yera, T., Schacherl, T. P., and Vilagrosa, A.: How Forest Structure and Management Impact on Forest Behavior, EGU General Assembly 2026, Vienna, Austria, 3–8 May 2026, EGU26-7060, https://doi.org/10.5194/egusphere-egu26-7060, 2026.

EGU26-7600 | Orals | BG8.5

Deriving climate-smart forestry strategies under uncertain future climate 

Konstantin Gregor, Christopher Reyer, Benjamin Meyer, Thomas Knoke, Andreas Krause, Mats Lindeskog, and Anja Rammig

Multi-functional forestry is a central objective of recent European policy frameworks, such as the New EU Forest Strategy for 2030 and the EU Biodiversity Strategy for 2030. These strategies, together with the LULUCF regulation, aim to ensure the continued provision of multiple forest ecosystem services under climate change, such as timber production, biodiversity conservation, and climate regulation.

These expectations arise alongside increasing demands for wood products, leading to partially conflicting objectives. The uncertainty of future climate changes further complicates the development of multi-functional forestry strategies.

Here, we demonstrate our recent work addressing these issues. We used process-based ecosystem modeling combined with robust multi-criteria optimization to derive forest management portfolios for climate-smart forestry under climate uncertainty. Using simplified management options and simulations across four RCPs, we show that regionally optimized portfolios can support the provision of multiple ecosystem services across a wide range of future climates. In particular, higher shares of broad-leaved and unmanaged forests were beneficial for biodiversity and other regulating services, but entailed clear trade-offs with timber provision.

We further examined the effects of additional constraints, such as maintaining stable harvest levels and enforcing strict protection on 10% of the land area. These constraints substantially reduced management flexibility and made inter-regional compensation between wood production and forest protection necessary, often at the expense of multi-functionality within regions. Overall, our results highlight the difficulty of fulfilling all demands simultaneously under climate uncertainty. Nonetheless, they illustrate how the methodology can be helpful to derive forward-looking climate-smart strategies.

How to cite: Gregor, K., Reyer, C., Meyer, B., Knoke, T., Krause, A., Lindeskog, M., and Rammig, A.: Deriving climate-smart forestry strategies under uncertain future climate, EGU General Assembly 2026, Vienna, Austria, 3–8 May 2026, EGU26-7600, https://doi.org/10.5194/egusphere-egu26-7600, 2026.

EGU26-8020 | ECS | Orals | BG8.5

Stress‑Testing Forest Policy Pathways for Climate and Biodiversity outcomes 

Joanna Raymond, Mohamed Byari, Alma Galicia Cruz, Eva Lieberherr, Tamaki Ohmura, Yongchao Zeng, and Mark Rounsevell

European forests face increasing climate extremes and disturbance pressures while being expected to deliver climate mitigation, biodiversity conservation, and multiple ecosystem services. Simultaneously, the European Union’s (EU) Green Deal aims at climate neutrality, with a growing number of EU forest-related policy targets spanning multiple sectors and including both overlapping and competing objectives. This creates uncertainty about how policy priorities translate into forest management and land-use outcomes across the EU. We thus analyse how these EU forest-related policy target portfolios, together with the institutional processes that implement them, shape climate, biodiversity, and ecosystem-service outcomes in European forests, and identify robust policy pathways under uncertain climate and socio-economic futures.

We develop and apply InsNet-CRAFTY, which couples a multi–large language model (LLM) institutional network to the agent-based land-use model CRAFTY-EU. The framework represents key features of policy processes, including bounded rationality, incremental decision-making, and unstructured information exchange, while capturing competing mandates within polycentric governance. We operationalise four interacting institutional agents representing core ministerial portfolios: Agriculture (land-use and production), Environment (biodiversity and conservation), Bioeconomy (forest-based bioeconomy innovations), and Climate (mitigation and adaptation). These agents operate in parallel, negotiate their priorities, and adjust policy instrument mixes under budget and feasibility constraints. To reflect heterogeneity across Europe, we parameterise member-state differences in institutional influence and policy prioritisation based on country-specific forest policy orientations regarding utilisation and conservation.

Institutional agents translate targets into policy instrument choices and calibrations, explicitly accounting for synergies and conflicts among instruments. We simulate policy pathways at short- (2030), medium- (2050), and long-term (2100) horizons, and evaluate outcomes using indicators of forest area and types, management strategies, carbon sequestration, biodiversity impacts, and a broad set of ecosystem services. Pathways are then stress-tested across a range of climate and socio-economic scenarios to identify when interventions trigger unintended trade-offs, or require adaptation to avoid maladaptation. The results provide a comparative assessment of pathway robustness, highlighting leverage points in instrument design, regional sensitivities, and policy mixes that maximise co-benefits for climate, biodiversity, and forest resilience under deep uncertainty.

How to cite: Raymond, J., Byari, M., Galicia Cruz, A., Lieberherr, E., Ohmura, T., Zeng, Y., and Rounsevell, M.: Stress‑Testing Forest Policy Pathways for Climate and Biodiversity outcomes, EGU General Assembly 2026, Vienna, Austria, 3–8 May 2026, EGU26-8020, https://doi.org/10.5194/egusphere-egu26-8020, 2026.

EGU26-10380 | ECS | Orals | BG8.5

Reassessing Global Afforestation and Reforestation Potentials under Climate Change Scenarios 

Tomke Honkomp and Julia Tandetzki

Afforestation and reforestation (A&R) are central components of current climate mitigation strategies and hold substantial potential for supplying biomass. However, large uncertainties remain regarding their actual mitigation potential, with considerable variation across global estimates, partly due to methodological differences. This study refines existing estimates of A&R potential by integrating temporal dynamics, climate change impacts, and land-use competition within a deliberately conservative framework.

We combine climate-sensitive forest biome projections with current land-use cover data to assess global A&R potentials under three representative concentration pathways (RCP 2.6, 4.5, and 8.5) up to 2080 at a spatial resolution of 1 × 1 km. To account for land-use competition, A&R is restricted to non-managed pastureland. Potential biomass production and associated carbon sequestration are estimated using region-specific growth data in accordance with IPCC guidelines.

Across all RCPs, we identify 731 million hectares globally as suitable for A&R through 2080. Relative to the historical baseline, climate change scenarios lead to a a net reduction of up to 24 million hectares of potential A&R area. While global potentials decline, regional patterns diverge markedly: boreal regions experience an increase in suitable area (+34 million hectares), whereas tropical and temperate regions exhibit substantial reductions (–33 and -18 million hectares, respectively). The A&R potentials presented here are intentionally conservative with respect to climate uncertainty, land-use competition, and long-term viability. Integrating these estimates with complementary scientific assessments is essential to underpin the feasibility of current climate policy targets and to support robust projections of biomass availability for scaling up the bioeconomy.

If implemented in accordance with local ecological conditions, the identified A&R potentials can inform policy responses to climate-related risks and may contribute to climate mitigation while supporting a biomass supply as a substitute for fossil-based products. However, successful implementation requires careful consideration of resource constraints (e.g., water availability) and future abiotic and biotic risks.

How to cite: Honkomp, T. and Tandetzki, J.: Reassessing Global Afforestation and Reforestation Potentials under Climate Change Scenarios, EGU General Assembly 2026, Vienna, Austria, 3–8 May 2026, EGU26-10380, https://doi.org/10.5194/egusphere-egu26-10380, 2026.

EGU26-10441 | ECS | Posters on site | BG8.5

Mapping forest restoration costs using a spatial–economic framework for fractal deforestation patterns 

Andrea Urgilez-Clavijo, David Andrés Rivas-Tabares, Raffaella Ansaloni, Emanuel Martínez, Ma. Elena Castro-Rivera, and Dionisio Pérez-Blanco

This work addresses a fundamental limitation in current forest restoration strategies: degraded landscapes are highly fragmented, yet investment decisions are rarely guided by spatially explicit economic indicators. As a result, restoration efforts often depend on voluntary actions and fail to alter the spatial configurations that allow deforestation to persist and spread. We present a framework that integrates fractal theory1, landscape topology2, and economic reasoning to convert the geometry of deforested areas into measurable restoration costs at the pixel level.

Using ecological skeletons2 and critical thresholds of natural capital, we derive a spatial–economic metric that assigns an intervention cost to every degraded patch. This leads to investment and priority maps that explicitly show where action should be taken, the expected financial effort required, and the order in which patches should be restored. By turning sophisticated fractal diagnostics into practical decision-support tools, this work provides a quantitative foundation for allocating public and private funds to restoration actions that maximize impact per unit of investment.

1 Urgilez-Clavijo, A., Rivas-Tabares, D. A., Martín-Sotoca, J. J., & Tarquis Alfonso, A. M. (2021). Local fractal connections to characterize the spatial processes of deforestation in the Ecuadorian Amazon. Entropy23(6), 748.

2 Urgilez-Clavijo, A., Rivas-Tabares, D. A., Gobin, A., Tarquis Alfonso, A. M., & de la Riva Fernández, J. (2025). Understanding local connectivity and complexity in the skeleton of deforestation. Scientific Reports15(1), 18192.

How to cite: Urgilez-Clavijo, A., Rivas-Tabares, D. A., Ansaloni, R., Martínez, E., Castro-Rivera, Ma. E., and Pérez-Blanco, D.: Mapping forest restoration costs using a spatial–economic framework for fractal deforestation patterns, EGU General Assembly 2026, Vienna, Austria, 3–8 May 2026, EGU26-10441, https://doi.org/10.5194/egusphere-egu26-10441, 2026.

EGU26-12135 | ECS | Posters on site | BG8.5

Influence of different scales of forest structural complexity on ecosystem stability 

Tim Schacherl, Julia Kelly, Natascha Kljun, Alexander Knohl, Holger Lange, and Anne Klosterhalfen

Disturbances such as extreme drought stress are becoming more frequent globally and pose a critical threat to boreal and temperate forests. Forest resistance to disturbances is influenced by multiple factors, including soil, climate, and structural complexity. Since a substantial portion of ecosystem functioning variability is related to maximum ecosystem productivity and water-use strategies, as part of WP2 of the CLIMB-FOREST EU project we calculated ecosystem functional properties (EFPs) that reflect these processes. Specifically, we used eddy covariance flux data to quantify photosynthetic capacity (NEPsat), underlying water-use efficiency (uWUE), and evaporative fraction (EFrac) for 71 forest sites across boreal and temperate regions of Europe and North America. To describe functional stability, we analyzed both mean EFPs and their inter-annual variability for each site. To examine which scales of structural complexity are associated with EFP stability, we used satellite-based indices describing vegetation structure and heterogeneity, including Rao’s Q of the Enhanced Vegetation Index (EVIRao), normalized near-infrared reflectance of vegetation (NIRvN), near-infrared entropy (NIRent), and maximum leaf area index (LAI). We applied generalized additive models (GAMs) combined with bootstrap-based variable importance analysis to evaluate associations between EFPs and structural complexity.

We found that associations between EFPs and structural complexity metrics varied among ecosystem properties, with predictors more frequently meeting bootstrap-based importance criteria for mean EFPs than for their inter-annual variability. Maximum LAI and NIRvN were consistently retained as important predictors for mean NEPsat and mean EFrac, whereas no structural complexity metrics met the importance criteria for uWUE or for most variability metrics. Smooth-term estimates indicated directional partial associations, with higher LAI and NIRvN corresponding to higher modelled values of NEPsat and EFrac, while EVIRao and NIRent showed weaker or inconsistent partial trends. Overall, the results suggest that quantity of leaves and their spatial arrangement might be more important for EFPs than horizontal heterogeneity. Forests with denser and more organized canopies tended to function at higher levels of productivity and evaporation, without showing stronger inter-annual variability. 

How to cite: Schacherl, T., Kelly, J., Kljun, N., Knohl, A., Lange, H., and Klosterhalfen, A.: Influence of different scales of forest structural complexity on ecosystem stability, EGU General Assembly 2026, Vienna, Austria, 3–8 May 2026, EGU26-12135, https://doi.org/10.5194/egusphere-egu26-12135, 2026.

EGU26-12332 | Posters on site | BG8.5

Introduction to the CLIMB-FOREST project: Climate Mitigation and Bioeconomy Pathways for Sustainable Forestry 

Adam Kristensson, Anders Ahlström, Paloma Ruiz-Benito, Holger Lange, Mark Rounsevell, Svein Solberg, and Paul Miller

The CLIMB-FOREST Horizon Europe project (101059888) addresses a need to strengthen the role of European forests in mitigating climate change while maintaining biodiversity, ecosystem services and old-growth forests. By integrating empirical data, advanced modelling and a multi-actor approach, CLIMB-FOREST generates science-based socio-economic pathways for future climate-smart forest management across Europe.

WP1: Mapping Current Forests and Management Patterns
The first work package provides a pan-European mapping of forest status and managament, and specific fieldwork within primary forests. We produced pan-European forest age, structure, carbon storage and management regimes from national forest inventory data. Through paired site comparisons of primary and managed forests, the project quantifies how forestry practices influence carbon sequestration. These maps form the empirical backbone for later modelling and scenario analyses.

WP2: Process Understanding at Field Sites
CLIMB-FOREST quantifies biogeochemical and biophysical processes at long-term monitoring sites across climatic gradients in Europe. Using field measurements and satellite observations, WP2 assesses carbon uptake, disturbance responses, and other climate-relevant processes in forest ecosystems including short-lived climate forcers (SLCFs). A database of over 80 contributing sites, with linked carbon stocks and ecosystem function data improves the understanding of forest climate effects.

WP3: Bioeconomy and Wood Product Preferences
WP3 explores the socio-economic dimensions of forest-based mitigation. This work package quantifies the role of forest products, especially long-lived ones in climate mitigation and for the bioeconomy. Interviews and surveys with forest owners, industry actors and end-users capture preferences, perceived barriers, and incentives for adopting alternative wood products and management practices.

WP4: Pan-European Integrated Modelling
WP4 brings together data from WP1 – WP3 and management recommendations from WP5 into advanced, integrated modelling frameworks. These models simulate different management and socio-economic pathway scenarios for the future, and simulate how climate, associated disturbances and management alternatives in each pathway influence biodiversity and forest states and function over the whole of Europe, as well as trade-offs between targeted policies and desired environmental benefits.

WP5: Stakeholder Engagement and Adaptation
This work package actively engages with forest owners, wood industries and civil society through field visits and workshops in representative forest regions. Stakeholders identify and refine optimal management strategies that enhance resilience to climate change while delivering biodiversity and ecosystem services. These participatory activities ensure that project outputs are grounded in real-world needs and concrete adaptation.

We are 3 years into the project, and well on the way to provide suggestions for forest management pathways in Europe that are scientifically sound, sustainable and climate-mitigating. The modelling outcomes already point to a clear trade-off between high volume of timber produced in highly productive and greenhouse gas intensive socio-economic scenarios and more environmentally sustainable scenarios.

How to cite: Kristensson, A., Ahlström, A., Ruiz-Benito, P., Lange, H., Rounsevell, M., Solberg, S., and Miller, P.: Introduction to the CLIMB-FOREST project: Climate Mitigation and Bioeconomy Pathways for Sustainable Forestry, EGU General Assembly 2026, Vienna, Austria, 3–8 May 2026, EGU26-12332, https://doi.org/10.5194/egusphere-egu26-12332, 2026.

Natural climate solutions (NCS) are often promoted as cost-effective and readily available mitigation measures to slow down global warming. The largest emission reduction potentials are estimated for forest-based NCS such as reforestation, avoided deforestation, and improved forest management. Yet, uncertainties are high regarding the magnitude and permanence of negative or avoided emissions, given i.a. uncertainties in implementation and governance of these measures, extrapolating global potentials from limited case study data, and effects of climate change on forest carbon stocks.

We set out to better constrain the biophysical potential of forest-based NCS using the dynamic global vegetation model LPJmL. The model has a long track record of simulating the effects of climate and climate change on the carbon, water and nitrogen cycle of forests and other terrestrial ecosystems. Whereas the management of agricultural systems was already well-represented, the model so far had no explicit representation of any forest management.

We implemented forest harvest, but more importantly replaced the use of a single average individual representing all trees in a grid-cell with an explicit representation of age classes in order to improve simulation of forest (re-)growth after management (harvest or land-use abandonment) and after natural disturbance events (e.g. fire, drought).

We show results for the historical period and future scenarios contrasting simulations with and without forest harvest and demonstrate the importance of including age classes.

How to cite: Ostberg, S. and Müller, C.: Implementing forest-based natural climate solutions (NCS) in a global vegetation model to better constrain global potentials, EGU General Assembly 2026, Vienna, Austria, 3–8 May 2026, EGU26-12351, https://doi.org/10.5194/egusphere-egu26-12351, 2026.

EGU26-12998 | Posters on site | BG8.5

Growth-driven heartwood formation in oak: evidence across monocultures and mixed-species plantations 

Bruno Barcante Ladvocat Cintra, Harvey Blowfield, Oren Anderson, and Jo Bradwell

Heartwood formation represents a major physiological transition in tree development, converting hydraulically active sapwood into structurally and chemically resistant tissue. This process has important implications for tree longevity, hydraulic regulation, and long-term carbon storage, yet the drivers of variation in heartwood formation among conspecific trees remain poorly quantified. In particular, it is unclear how accelerated growth, management interventions, and short-term stress interact to influence heartwood development in temperate hardwood species within forestry systems designed to enhance carbon sequestration and resilience. Here, we assess the combined effects of tree size, age, growth rates, and growth suppression on heartwood formation in Quercus robur across a network of planted stands of contrasting ages and species compositions in central England. These include young (14-year-old) intimate mixture plantations comprising up to 27 tree species, established with the explicit aim of improving carbon storage and forest resilience, alongside older planted stands and managed trees subjected to canopy pollarding. We measured heartwood and sapwood areas in 183 trees spanning ages from 11 to 120 years, using full stem cross-sections and increment cores. Heartwood boundaries were validated using ferrous sulphate staining and tylosis detection. Growth histories were reconstructed using tree-ring analysis, allowing estimation of lifetime mean growth rates, size-independent instantaneous growth rates, and post-disturbance growth resilience following the 2018 drought. Statistical analyses combined nonlinear allometric models, generalized additive models, and mixed-effects approaches to disentangle the roles of size, age, growth, management, and stress. Heartwood area increased strongly with stem diameter, explaining most of the variation among individual trees (R² ≈ 0.98), while age exerted an additional but secondary influence. For trees of similar diameter, older individuals consistently contained more heartwood, indicating that heartwood formation is not solely a function of size. Heartwood onset occurred early, with a 50% probability at a diameter of 8.5 ± 0.8 cm. Following onset, heartwood expansion accounted for an increasing fraction of total basal area increment, rising from approximately 40% in small trees to over 80% in large trees. Despite declining sapwood proportion with size, absolute sapwood area continued to increase, indicating sustained canopy development even in large trees. Both lifetime mean and size-independent instantaneous growth rates were positively associated with heartwood expansion, demonstrating that faster-growing trees consistently allocate more biomass to heartwood formation. In contrast, short-term growth suppression following drought or canopy pollarding did not reduce heartwood development. Trees with lower post-drought growth resilience and pollarded trees that had already initiated heartwood formation exhibited equal or greater heartwood proportions, suggesting a shift in allocation towards durable tissues under stress. Our results support a sapwood homeostasis mechanism linking growth, canopy function, and heartwood formation in Q. robur. Importantly, accelerated growth in mixed-species plantations does not compromise heartwood development and may enhance long-term carbon residence times through earlier and greater heartwood accumulation. These findings provide mechanistic evidence that climate- and biodiversity-smart forestry strategies based on species mixtures and productivity gains can simultaneously support resilience and long-term carbon storage in temperate hardwood systems.

How to cite: Barcante Ladvocat Cintra, B., Blowfield, H., Anderson, O., and Bradwell, J.: Growth-driven heartwood formation in oak: evidence across monocultures and mixed-species plantations, EGU General Assembly 2026, Vienna, Austria, 3–8 May 2026, EGU26-12998, https://doi.org/10.5194/egusphere-egu26-12998, 2026.

EGU26-15546 | ECS | Posters on site | BG8.5

Macrofungal Diversity in the Proposed Taiwan Red Cypress Conservation Area: New Records and a Baseline for Conservation Assessment 

Wen-wei Hsiao, Yuan-Cheng Xu, Cheng-Che Wen, and Chieh-Yin Chen

Biodiversity preservation is a critical component of the Sustainable Development Goals (SDGs), especially in the face of accelerating climate change and its impacts on forest ecosystems. Macrofungi, particularly ectomycorrhizal species, play essential ecological roles in nutrient cycling, carbon sequestration, and maintaining forest health. This study surveyed macrofungal diversity from May to November 2025 in the proposed Taiwan Red Cypress Ecological Conservation Area. The sampling site was located near the Lulin Formosan Cypress, along the Alishan Road. This area is a natural high-elevation forest dominated by Chamaecyparis formosensis, Quercus tatakaensis, Pasania kawakamii, Prunus campanulata, and Phellodendron amurense var. wilsonii. Fungal identification was based on morphological characteristics and molecular analyses, including sequencing of the internal transcribed spacer (ITS) and large subunit (LSU) regions. For selected taxa, additional gene loci such as rpb2 and tef1-α were sequenced to perform multi-locus phylogenetic analysis. In total, 100 fungal taxa were identified, comprising 22 Ascomycetes and 78 Basidiomycetes. Among these, 94 macrofungal species were newly recorded for the conservation area, and 8 were new records for Taiwan, indicating high fungal diversity and ecological significance. Many of the recorded taxa are ectomycorrhizal fungi associated with dominant tree species in the area. The results provide valuable baseline data for understanding the responses of fungal communities to environmental changes and support long-term monitoring and conservation planning in high-elevation Taiwanese forests.

How to cite: Hsiao, W., Xu, Y.-C., Wen, C.-C., and Chen, C.-Y.: Macrofungal Diversity in the Proposed Taiwan Red Cypress Conservation Area: New Records and a Baseline for Conservation Assessment, EGU General Assembly 2026, Vienna, Austria, 3–8 May 2026, EGU26-15546, https://doi.org/10.5194/egusphere-egu26-15546, 2026.

Climate change transforms national park ecosystems, affecting wildlife and visitors alike. Systematic and flexible management strategies are needed to address varying climate impacts. This study established two conservation objectives—biodiversity conservation and forest hazard management—for climate adaptation in Palgongsan National Park, Daegu, South Korea, applying the RAD(Resist-Accept-Direct) framework.

We identified actionable measures: biodiversity conservation through "habitat refugia establishment and management" and "structural diversity enhancement"; forest hazard management via "fuelbreaks establishment," "thinning and pruning," and "trail relocation". Spatial machine learning models identified biodiversity priority zones and fire-vulnerable areas. RAD adaptation levels were assigned to each zone, visualizing intervention outcomes.

Spatial analysis identified priority zones for adaptation measures. Single intervention-single adaptation level suits some areas, while multiple interventions-multiple adaptation levels are optimal elsewhere. This demonstrates that intervention types and combinations vary systematically by conservation objectives and local characteristics.

The RAD framework proves effective for national park climate adaptation strategy development. Proposed spatial priorities and intervention combinations provide a scientific basis to enhance existing management plans. Continuous monitoring and stakeholder collaboration are essential post-implementation.

How to cite: Lee, J., Mo, Y., and Jeong, G.: Developing Climate Change Adaptation Pathways Considering Biodiversity and Forest Hazards: A Case Study of Palgongsan National Park, EGU General Assembly 2026, Vienna, Austria, 3–8 May 2026, EGU26-16504, https://doi.org/10.5194/egusphere-egu26-16504, 2026.

EGU26-16616 | ECS | Orals | BG8.5

Soil respiration across a managed forest chronosequence in southern Sweden 

Erica Jaakkola, Tobias Biermann, Lena Ström, Patrik Vestin, and Anders Lindroth

Soil respiration is a major pathway by which terrestrial carbon returns to the atmosphere, although knowledge about its variation across forest stand age classes is limited. Forest stand age is considered a key factor influencing forest-floor CO2 fluxes, however, previous studies report contrasting patterns for heterotrophic respiration – ranging from no effect to increases with age. Improving our understanding of these dynamics is essential for reducing uncertainties in forest carbon balance and informing sustainable management strategies.

We present ongoing work based on manual chamber measurements of CO₂ efflux across ten managed Norway spruce forest stands in northeastern Skåne, Sweden, spanning a chronosequence from recent clear-cut to mature stands (0 to ~120 years). Monthly measurements began in summer 2024 to capture seasonal cycles across all stands, providing a unique dataset to explore how forest development influences soil respiration. Each stand includes untreated reference plots and root-exclusion treatments, enabling future partitioning of autotrophic and heterotrophic respiration. Preliminary results indicate differences among age classes, with younger stands exhibiting higher summer CO2 fluxes compared to older stands, although variability remains high. These patterns may reflect differences in root contribution, soil organic matter pools and microclimatic conditions across the chronosequence.

This study is part of a larger research effort aimed at identifying the stand age at which optimum carbon uptake occurs and evaluating rotation forestry against alternative management practices, such as continuous cover forestry. By contributing empirical observations from a managed forest landscape, this study also aims to reduce uncertainties in carbon flux estimates and support improved parameterization of vegetation models. Ultimately, these findings will inform assessments of forest carbon balance and, in turn, support policy and climate mitigation strategies and offer insights relevant to harvest planning and stand rotation decisions.

How to cite: Jaakkola, E., Biermann, T., Ström, L., Vestin, P., and Lindroth, A.: Soil respiration across a managed forest chronosequence in southern Sweden, EGU General Assembly 2026, Vienna, Austria, 3–8 May 2026, EGU26-16616, https://doi.org/10.5194/egusphere-egu26-16616, 2026.

EGU26-17473 | ECS | Posters on site | BG8.5

Upwind moisture sources shape drought vulnerability of major forest carbon stocks 

Lisa Grof, Lucie Bakels, Davide Zanchettin, Arie Staal, and Lan Wang-Erlandsson

Forest-based climate mitigation depends on the long-term stability of forest carbon uptake, yet resilience under shifting hydroclimatic conditions remains uncertain. While forest management and reporting largely operate within national borders, forest water supply is regulated by atmospheric moisture transport across large and often transboundary source regions. This creates a scale mismatch between governance structures and the physical processes that sustain carbon sequestration.

We develop a global framework linking (i) governance-relevant sink units (countries) with (ii) physically defined upwind moisture source regions to assess the hydroclimatic vulnerability of major forest carbon stocks. Large forest carbon stocks are mapped from satellite-based aboveground biomass products, and hydroclimatic stress is quantified using drought indices alongside carbon-uptake proxies. Areas are classified as vulnerable where increasing drought stress co-occurs with weakening carbon uptake signals over recent decades.

Using an Eulerian atmospheric moisture tracking model (WAM2layers), we quantify each sink region’s seasonal dependence on terrestrial versus oceanic upwind moisture sources and the spatial concentration of key source areas. Initial results indicate strong geographic and seasonal variation in upwind moisture dependence, showing that atmospheric teleconnections can influence drought exposure of forest carbon sinks beyond national boundaries.

How to cite: Grof, L., Bakels, L., Zanchettin, D., Staal, A., and Wang-Erlandsson, L.: Upwind moisture sources shape drought vulnerability of major forest carbon stocks, EGU General Assembly 2026, Vienna, Austria, 3–8 May 2026, EGU26-17473, https://doi.org/10.5194/egusphere-egu26-17473, 2026.

EGU26-18800 | ECS | Posters on site | BG8.5

Understanding Forest Resilience to Drought through Resilience Principles 

Sara Anamaghi, Massoud Behboudian, and Zahra Kalantari

With the intensification of climate change and anthropogenic activities, water scarcity and drought have become critical challenges around the world, threatening various ecosystems, particularly forests. Forests are social-ecological systems that provide numerous services to humans, who, in return, alter them. While it is impossible to prevent droughts, understanding the attributes of forests, particularly their resilience, may facilitate the mitigation of drought-related adverse consequences. Resilience is a multifaceted concept that has been interpreted through various lenses in the literature, with engineering resilience emphasizing system recovery, ecological resilience investigating the adaptive capacity of forests, and social-ecological resilience highlighting the interconnectedness of human and natural systems in resilience assessment.

Building on these conceptual foundations, seven principles of resilience, maintaining diversity and redundancy (P1), managing connectivity (P2), managing slow variables and feedback (P3), fostering complex adaptive system thinking (P4), encouraging learning and experimentation (P5), broadening participation (P6), and promoting polycentric governance (P7) offer a comprehensive approach to building, evaluating, and enhancing resilience. This review aims to investigate the extent to which resilience principles have been integrated into the discourse of forest resilience to drought in the literature.

Searching the Web of Science database for studies on forest resilience from 1998 to 2024 resulted in 47 papers. Among the reviewed studies, 51% investigated resilience through the lens of ecological resilience, 30% utilized the social-ecological concept, and 19% employed engineering resilience. P4 is frequently examined using tree ring data and drought severity indices (e.g., SPEI). Species richness and composition have often been considered to evaluate P1. A close examination of the methodologies of the reviewed studies revealed that 34% are evidence-based or conceptual studies aimed at understanding the mechanisms contributing to resilience, and 21% are experimental and field studies, which often involve the use of collected field data, such as tree ring width, vegetation growth rate, to explore the response of forest systems to natural or experimentally induced drought events.

The limited use of modeling, specifically landscape or ecosystem services models, in studying forest resilience to drought is evident, with only three studies conducted on this topic. Furthermore, the case studies are nearly evenly distributed across Africa, Europe, North America, and Asia, with 7, 10, 10, and 8 studies, respectively. Four studies investigated the resilience of forests in South America, and another four focused on a global scale. A closer exploration of the reviewed studies revealed that no studies have attempted to consider all seven resilience principles jointly, highlighting a significant research gap in this area and emphasizing the need for more studies to tackle the intricate relationships between ecosystems and human communities and societies.

How to cite: Anamaghi, S., Behboudian, M., and Kalantari, Z.: Understanding Forest Resilience to Drought through Resilience Principles, EGU General Assembly 2026, Vienna, Austria, 3–8 May 2026, EGU26-18800, https://doi.org/10.5194/egusphere-egu26-18800, 2026.

EGU26-20201 | ECS | Posters on site | BG8.5

Estimating wildfire-driven forest carbon losses using dynamic fuels under managed and afforested forests in Europe 

Johanna San Pedro, Hyun-Woo Jo, Eunbeen Park, Andrey Krasovskiy, and Florian Kraxner

Wildfire projections for Europe depend not only on future climatic conditions, but also on how fuels evolve as forests age, are managed, and expand through afforestation. This study focuses on the dynamic fuel representation in FLAM by linking it with the forest model G4M in a coupled framework for EU27+UK. The coupling provides scenario-consistent, annually updated fuels (from live biomass, deadwood, and litter) from G4M to FLAM, and FLAM returns burned area used to update forest carbon trajectories and fuels in G4M in the following year.

FLAM runs on a 0.5° grid with daily time steps and simulates ignition, spread, and burned area as a function of climate, fuel loads, vegetation type, and human influence. Daily temperature, precipitation, relative humidity, and wind speed are taken from ISIMIP3b bias-adjusted CMIP6 forcings (UKESM1-0-LL and GFDL-ESM4). Fuels from G4M are divided into “old” fuels (pre-2000 managed forests) and “new” fuels (post-2000 afforested forests). The combined fuel load in each grid cell is updated dynamically using the effective burned ratio, so cells with higher burned ratios increasingly draw fuel from unburned stands, while low burned-ratio cells remain dominated by managed forest fuels.

To limit repeated burning within grid cells, an annual burned ratio approach is used to reduce the effective burnable fraction where only the remaining unburned forest area can burn. To avoid unrealistic permanent fuel depletion, a recovery function reduces the effective burned ratio toward zero (parameterized with a = 0.65 over b = 25 years), implying roughly 4% of the remaining burned ratio is removed annually, consistent with multi-decadal stand recovery times and typical rotation lengths in European managed forests. Assumptions include successful regeneration after stand-replacing fires and no change in species composition.

FLAM is calibrated and validated with historical forest burned area observations showing moderate correlation (monthly correlation r ≈ 0.63; annual r ≈ 0.59). Projections for SSP1-2.6, SSP2-4.5, SSP3-7.0 show cumulative burned area of roughly ~27–35 Mha and wildfire-driven biomass carbon losses of ~290–360 Mt C. The presentation will show how this dynamic fuel coupling changes projected wildfire outcomes and what it implies for forest carbon and biomass supply.


How to cite: San Pedro, J., Jo, H.-W., Park, E., Krasovskiy, A., and Kraxner, F.: Estimating wildfire-driven forest carbon losses using dynamic fuels under managed and afforested forests in Europe, EGU General Assembly 2026, Vienna, Austria, 3–8 May 2026, EGU26-20201, https://doi.org/10.5194/egusphere-egu26-20201, 2026.

EGU26-21208 | Orals | BG8.5

Involving stakeholders in forest management decisions 

Svein Solberg, Benoit de Guerry, Barry Gardiner, Jan Krejza, Luna Morcello, Jarosław Socha, Luiza Tymińska-Czabańska, Alberto Vilagrosa, and Merlin Morgane

Forests are providing a wide range of ecosystem services, including timber production, sequestration and storage of carbon. The need to balance timber production goals against the maintenance of the other ecosystem services requires careful selection of forest management strategies. In addition, the management needs to ensure forest resilience, because extreme storms, prolonged droughts, pest outbreaks and wildfires may increasingly  affect forest productivity and stability across Europe, challenging the suitability of traditional management approaches.

However, forests are multifunctional socio-ecological systems and management decisions are not solely based on science. They need to consider preferences, values and politics of diverse actors such as public administrations, forest owners and managers, and environmental organizations. In the European research project ClimbForest, WP5, we have sought to achieve this by involving stakeholders in five categories: forest owners, forest industry, forest biodiversity, forest protection recreation and public forest officers. To capture the ranges in biogeography, forest types, management traditions, socio-ecological diversity and as well climate-related challenges such as drought, wildfire, storm and pests in Europe, we established such groups over a north–south and inland-coast gradients by having one group from each of the countries Spain, France, Czechia, Poland, and Norway.

We have activated the stakeholders by structured questionnaires and in situ field visits. The stakeholders have travelled together with the WP5 researchers visiting predefined forest sites in their five countries.  In each site, local foresters and other experts familiar with local conditions gave an overview of local forest conditions. In each site, we activated the stakeholders by asking them to come up with their recommended forest management. This was first done within each stakeholder category, followed by plenary discussions where the groups might want to adjust their recommendations and possibly end up with consensus solutions across groups. The recommendations should include the main options: tree species and forest management type, i.e. rotation or continuous cover (CCF). If they recommend rotation forestry, they needed to specify initial stand density (after pre-commercial thinning), number, type and strength of thinning, final stand density and type of final felling (clear cut, retention harvesting, seed tree harvesting or shelterwood logging). If they recommend CCF, they should specify frequency (years) and specification of logging strength. For this work we provided them with paper forms containing these options, i.e. the “forest management toolbox”. 

We supplement the recommendations on forest management from the stakeholder by running simulation of long-term forest development. This includes forest growth and the probability of certain forest damage. The models are process-based, empirical forest models, i.e. mainly the LPJ-Guess model followed by calculation of certain ecosystem service indicators. This provides understanding of the performance of the recommendations about a range of ecosystem services and as well the vulnerability towards major forest disturbance, and context-specific trade-offs between productivity, conservation, and risk reduction. When these simulations are completed, we will gather the stakeholders and give them the option to reassess and possibly change their recommendations.

Overall, our work combines participatory approaches with model-based simulations to identify future forest management.

How to cite: Solberg, S., de Guerry, B., Gardiner, B., Krejza, J., Morcello, L., Socha, J., Tymińska-Czabańska, L., Vilagrosa, A., and Morgane, M.: Involving stakeholders in forest management decisions, EGU General Assembly 2026, Vienna, Austria, 3–8 May 2026, EGU26-21208, https://doi.org/10.5194/egusphere-egu26-21208, 2026.

EGU26-21839 | Posters on site | BG8.5

Exploring ecosystem-based adaptation under climate change in different European forests 

Maximiliano Costa, Marc Djahangard, Martin Vollmer, Cosmin Coșofreț, Goran Krsnik, Lana Kukobat, Liang Chen, and Harald Bugmann

Sustainable forest management and ecosystem-based adaptation are essential for maintaining ecosystem service (ES) functionality under climate change. We apply the spatially explicit, process-based dynamic model LandClim, which incorporates the effects of major natural disturbances (e.g., wind, fire and bark beetle outbreaks), to assess how different climate change scenarios (e.g., RCP 4.5 vs. RCP 8.5) and forest management strategies influence the future provision of ecosystem services in multiple and climatically as well as ecologically different European forests. Simulations are initialized using detailed forest inventory data. The study is conducted across six European Living Labs, where simulation scenarios and management strategies are co-developed in close collaboration with local stakeholders. We investigate how alternative management strategies can balance ecosystem service provision as forest dynamics evolve under changing climatic conditions. Natural disturbances and their shifting regimes are explicitly accounted for in the analysis. This study supports the development of more resilient forest management strategies, enhancing the sustainability of ES provision and facilitating adaptation to climate change.

How to cite: Costa, M., Djahangard, M., Vollmer, M., Coșofreț, C., Krsnik, G., Kukobat, L., Chen, L., and Bugmann, H.: Exploring ecosystem-based adaptation under climate change in different European forests, EGU General Assembly 2026, Vienna, Austria, 3–8 May 2026, EGU26-21839, https://doi.org/10.5194/egusphere-egu26-21839, 2026.

EGU26-21852 | ECS | Posters on site | BG8.5

Predicting forest loss risk for deforestation regulation using Convolutional Neural Networks 

Nielja Knecht, Ingo Fetzer, and Juan Rocha

The EU Deforestation Regulation (EUDR) aims to reduce embedded deforestation in certain commodities imported into the European Union by requiring companies to prove that products are deforestation-free. Here, the level of due diligence obligations required is based on the overall risk score assigned to a specific country of origin. The first version of these risk scores, published last year, aims to reflect past deforestation rates and governance risks. However, the scores have been widely criticized by political and environmental advocacy groups for being politically motivated rather than representative of real deforestation risks, and for being too coarse in their national scale and commodity-invariant design. Hence, we here provide an additional, high-resolution, spatially explicit perspective on deforestation risk for the upcoming year. Using Convolutional Neural Networks (CNNs) and spatiotemporal data on past forest losses, landscape characteristics, and human development, we compute global risk maps for different drivers of forest loss, including deforestation for different commodities. With this analysis, we aim to complement the existing EUDR risk scores by highlighting sub-national variation and driver-specific risk patterns. We aim to contribute a transparent, data-driven perspective to ongoing discussions on deforestation risk in international policy processes.

How to cite: Knecht, N., Fetzer, I., and Rocha, J.: Predicting forest loss risk for deforestation regulation using Convolutional Neural Networks, EGU General Assembly 2026, Vienna, Austria, 3–8 May 2026, EGU26-21852, https://doi.org/10.5194/egusphere-egu26-21852, 2026.

Emerging contaminants, such as pharmaceutical residues, in aqueous environments provide serious threats to public health, aquatic life, and deteriorate water quality, demanding long-term and economical remediation techniques. These drugs are frequently used all around the world, and high residual concentrations are reported in wastewater across continents, including Asia. Biochar has drawn more attention as an adsorbent due to its high stability, surface functional groups, and potential for surface modification. In this study, biochar derived from rice husk was modified using the co-precipitation method to enhance acetaminophen and trimethoprim adsorption. Engineered biochar (surface area = 419 m2/g) easily adsorbed aqueous acetaminophen and trimethoprim (∼8 h equilibrium time) with adsorption capacities of 69.7–137.4 mg/g and 54.2–269 mg/g, respectively, vs. pristine biochar (surface area = 182 m2/g). The Elovich kinetic model (R2 = 0.90-0.99) showed the best correlation for both acetaminophen and trimethoprim. All isotherm models gave R2 > 0.95, suggesting simultaneous sorption processes (monolayer/multilayer and homogeneous/heterogeneous) are taking place. Mg or Al leaching from the adsorbent is well within the drinking water limit and not a concern. Spent adsorbent was regenerated using EDTA, HCl, H₂SO₄, ethanol, and methanol. Potential sorption interactions were hydrogen bonding, pore diffusion, π-π interaction, and electrostatic interactions. These findings demonstrate the potential of engineered biochar as a versatile and sustainable water treatment. The study contributes to advancing green materials for environmental remediation and provides insights for scaling biochar technologies within circular-economy frameworks.

How to cite: Chaubey, A. K. and Mohan, D.: Valorization of Rice Husk into MgO/Al₂O₃-Modified Biochar for Remediating Aqueous Emerging Contaminants , EGU General Assembly 2026, Vienna, Austria, 3–8 May 2026, EGU26-2048, https://doi.org/10.5194/egusphere-egu26-2048, 2026.

EGU26-8744 | ECS | PICO | BG8.7

Development of an extended ASM framework integrating rotifer–ciliate ecological mechanisms for predicting sludge reduction in septic tank systems 

Dongjun Seo, Jaechul Yi, Jaeyun Jung, Hyejoo Yoon, Jiyoun Kim, Gi Seok Kwon, and Hee Deung Park

Abstract

Continuous accumulation of sludge in septic tank systems causes reduced treatment efficiency and increased maintenance costs. However, existing Activated Sludge Models (ASM) are limited to bacterial trophic levels, failing to quantitatively explain sludge reduction mechanisms driven by higher-level predators. This study proposes a novel extended model integrating the ecological dynamics of rotifers and ciliates, based on the Storage-Growth framework of ASM3. The model functionally divides the bacterial community into Bacteria Biomass (XB) and Filamentous Biomass (XFB), and incorporates ciliates (XP) and rotifers (XR) that selectively graze on them, comprising a total of 16 state variables and 13 processes. Specifically, the model mathematically structures predator grazing not merely as biomass conversion, but as a process mediated by internal storage products (XSTO) involving respiration and maintenance metabolism during famine conditions. Differential analysis of Total Suspended Solids (XSS) demonstrated that, in addition to conventional endogenous respiration, the additional carbon mineralization occuring at the predation stage is a key mechanism for sludge reduction. Furthermore, the model suggests the potential for controlling sludge bulking through rotifer predation on filamentous bacteria. By introducing ecological interactions into process modeling, this study provides an advanced quantitative framework capable of simultaneously predicting sludge reduction efficiency and operational stability in septic tanks.

Acknowledgements

Following are results of a study on the "Convergence and Open Sharing System" Project, supported by the Ministry of Education and National Research Foundation of Korea

How to cite: Seo, D., Yi, J., Jung, J., Yoon, H., Kim, J., Kwon, G. S., and Park, H. D.: Development of an extended ASM framework integrating rotifer–ciliate ecological mechanisms for predicting sludge reduction in septic tank systems, EGU General Assembly 2026, Vienna, Austria, 3–8 May 2026, EGU26-8744, https://doi.org/10.5194/egusphere-egu26-8744, 2026.

EGU26-9302 | ECS | PICO | BG8.7

Nutrient Removal in Algal-Bacterial Consortia Treating Secondary Effluent During Light-Dark Cycles 

Styliani Biliani and Ioannis Manariotis

The scope of this study was to evaluate different environmental factors that affect the ability of algal-bacteria consortia to remove nutrients. The dark-cycle nitrogen removal process was investigated, providing valuable insights for improving wastewater treatment systems. The behavior of the consortia was examined under various illumination regimes (continuous 24-h light and a 12:12 h light-dark cycle) and varying aeration conditions (0 to 12 h and 0 to 24 h of air supply). Continuous light exposure combined with continuous aeration resulted in the highest nitrate and phosphorus removal. The results indicated that light duration had a greater effect on nutrient removal than air supply. When light and aeration were stopped after 12 hours, the zero‑order removal rate constants during the dark period decreased by 36% for nitrates and 55% for phosphorus compared with the 24‑hour light and aeration condition. Nitrate removal occurred more rapidly than phosphorus removal in the light and slightly faster in the dark. Although nutrient removal during the dark phase decreased approximately 58% for nitrates and 45% for phosphorus relative to the light phase, it did not cease entirely, even when the culture was refed without additional aeration. These findings demonstrate that algal-bacteria consortia can efficiently remove nitrates and phosphorus from wastewater, even in the absence of light, offering important information for the design and optimization of outdoor algal-based wastewater treatment systems.

How to cite: Biliani, S. and Manariotis, I.: Nutrient Removal in Algal-Bacterial Consortia Treating Secondary Effluent During Light-Dark Cycles, EGU General Assembly 2026, Vienna, Austria, 3–8 May 2026, EGU26-9302, https://doi.org/10.5194/egusphere-egu26-9302, 2026.

EGU26-13324 | ECS | PICO | BG8.7

Evaluation of the effectiveness of nature-based solutions to reduce the impact on water quality of farmyard runoff  

Fulu Zhuang, Simon Harrison, Martha Gosch, and William Burchill

Point source pollution from farmyard runoff can be a significant pressure on surface water quality in agricultural catchments with large uncertainty around the extent of these losses between farms and across seasons. Targeted natural-based solutions, such as willow filter beds and bunded drain systems, are currently being funded and deployed on Irish farms to intercept contaminated farmyard runoff before it enters receiving waters. However, field-based evidence of their effectiveness under variable farm management and hydrological conditions is limited.

This study presents an ongoing monitoring program aimed at (1) characterizing the physio-chemical characteristics of farmyard runoff across different farms and seasons and (2) evaluating the mitigation performance of small-scale willow filter beds (n = 6) and bunded drains (n = 2) installed on Irish farms in 2025. Water sampling consisted of monthly grab samples collected at the mitigation system inlets, internal treatment cells, and outlets, and was analyzed for pH, electrical conductivity (EC), dissolved oxygen (DO), total suspended solids (TSS), and nitrogen and phosphorus species. Sampling at the inlets allowed for the determination of physio-chemical parameters of farmyard runoff, which were also compared to the outlet values to determine the effectiveness of the mitigation systems. This abstract focuses on pH, EC, DO, and TSS data collected during the initial monitoring period from October to December 2025. Initial nitrogen and phosphorus concentration samples are currently under analysis and will be presented at the conference.

Preliminary observations indicate pronounced temporal variability in the composition of farmyard runoff, particularly in response to variability in farmyard runoff flow rates. Across the monitored farms and three sampling dates, inlet water quality exhibited substantial variability, with mean (Min-Max) TSS concentrations of approximately 120 mg L-1 (4-320 mg L-1), pH of 7.2 ( 5.3-9.2), EC of 900 µS cm-1 ( 40-1860 µS cm-1), and DO concentrations of 6 mg L-1 ( 0.2-11.3 mg L-1).

Early-stage analysis suggests attenuation of suspended sediment across the mitigation systems, with mean (Min-Max) outlet TSS concentrations of 60 mg L-1 ( 0.4-174 mg L-1), generally lower than those observed at the inlets. This reduction is accompanied by a reduction of the EC at the outlets to a mean (Min-Max) of 450 µS cm-1 (118-1074 µS cm-1). These patterns were most apparent during periods when flow conditions were sufficient to generate outlet discharge, enabling the comparison between inlets and outlets.

This study will continue for two years to encompass a wider range of seasonal dynamics, farmyard management conditions and additional water quality parameters, enabling a more comprehensive evaluation of farmyard runoff composition and mitigation effectiveness of these nature-based solutions as they mature.

How to cite: Zhuang, F., Harrison, S., Gosch, M., and Burchill, W.: Evaluation of the effectiveness of nature-based solutions to reduce the impact on water quality of farmyard runoff , EGU General Assembly 2026, Vienna, Austria, 3–8 May 2026, EGU26-13324, https://doi.org/10.5194/egusphere-egu26-13324, 2026.

EGU26-14095 | ECS | PICO | BG8.7

Evaluating the efficacy of short rotation willow coppice in attenuating phosphorus from small-scale wastewater treatment works’ effluent 

Suman Acharya, Raymond Wilson, Gabriel Gaffney, Chris Johnston, and Phil Jordan

Phosphorus (P) discharge from sewage treatment works remains a significant source of P pollution in freshwater systems. While a wide range of P-removal technologies have been successfully implemented at large wastewater treatment works (WWTWs), their application in small-scale systems is often constrained by high capital and operational costs, technical complexity, and highly variable influent flows. Consequently, P releases from small treatment works can have disproportionate and localised impacts on receiving freshwaters, leading to severe ecological degradation. These impacts are likely to intensify under climate change, particularly during prolonged dry periods associated with low or zero-flow conditions given reduced or zero discharge dilution. Nature-based solutions offer a potential treatment option for P removal in small-scale systems while delivering additional environmental benefits. However, the suitability of these approaches has not yet been extensively studied. Therefore, this study evaluated the performance and applicability of zero-discharge willow biofiltration system for attenuating P discharged from two small-scale WWTWs in Ireland. The experimental design comprised approximately 1.5 ha of mixed variety willow plantation at each site, irrigated with primary-treated wastewater using automated, sequential time-dosed irrigation systems. Using a before-after approach, stream P concentrations, measured as soluble reactive phosphorus (SRP), were monitored upstream and downstream of WWTW discharge points using automated samplers with hourly sampling over a period of 24 hours. Sampling was conducted following three rain-free days each month between March and November over different years. The results showed that, prior to wastewater diversion to irrigate the willow plantation, downstream SRP concentrations were substantially higher than upstream concentrations at both sites, with the highest concentrations observed during the summer months. Following the diversion of wastewater, the difference in SRP concentrations between upstream and downstream sites became negligible, indicating more than 95% of P attenuated through the willow biofiltration system. Ongoing work includes studying the fate of irrigated P to evaluate soil P saturation and P uptake in biomass.   


Keywords: Short rotation willow coppice, Effluent, Phosphorus, Wastewater treatment works

How to cite: Acharya, S., Wilson, R., Gaffney, G., Johnston, C., and Jordan, P.: Evaluating the efficacy of short rotation willow coppice in attenuating phosphorus from small-scale wastewater treatment works’ effluent, EGU General Assembly 2026, Vienna, Austria, 3–8 May 2026, EGU26-14095, https://doi.org/10.5194/egusphere-egu26-14095, 2026.

EGU26-14890 | PICO | BG8.7

Wetland restoration for water and wallets 

Nandita Basu and Kim Van Meter

Accelerated nitrogen and phosphorus losses from agricultural landscapes have driven widespread degradation of water quality, yet decades of nutrient reduction efforts have delivered limited progress. Wetland restoration offers one of the few strategies capable of addressing both legacy and ongoing nutrient pollution, while providing co-benefits for climate mitigation, biodiversity, and flood regulation. However, most restoration efforts remain ad hoc, prioritizing area-based targets over strategic placement and economic viability.

Here, we argue that the central challenge is not whether to restore wetlands, but how to restore them effectively. We introduce the concept of the wetlandscape: a landscape-scale network of wetlands whose size distribution, spatial arrangement, connectivity, and history collectively govern nutrient retention. Drawing on global empirical evidence and modeling studies, we outline six guiding principles for targeted wetland restoration that integrate hydrologic function, nutrient removal efficiency, and economic considerations. These principles highlight why small wetlands often outperform larger ones, why restoration in high-nutrient agricultural landscapes yields disproportionate benefits, and how historical drainage patterns should guide restoration priorities. We further show that when restoration targets chronically unprofitable farmed depressions, wetlands can improve water quality without sacrificing farm income

Together, these principles provide a roadmap for designing wetlandscapes that deliver measurable water quality improvements while supporting agricultural resilience. By aligning ecological design with economic realities and advancing open data and modeling innovations, wetland restoration can become a key element of sustainable food, water, and climate policy.

How to cite: Basu, N. and Van Meter, K.: Wetland restoration for water and wallets, EGU General Assembly 2026, Vienna, Austria, 3–8 May 2026, EGU26-14890, https://doi.org/10.5194/egusphere-egu26-14890, 2026.

EGU26-15234 | PICO | BG8.7

Evaluating fungal-based nature-based solutions for agricultural drainage treatment 

Lipe Renato Dantas Mendes, Hannah Walling, Philip Schuler, Lucy Crockford, Paul Quinn, Stephanie Terreni-brown, Toby Parkes, Ellie Morris, Mark Wilkinson, and Marc Stutter

Diffuse nutrient pollution from agricultural runoff remains a major pressure on freshwater systems, contributing to eutrophication and downstream ecosystem degradation. Nature-based solutions (NbS) that can be deployed close to source are increasingly sought as cost-effective and multifunctional alternatives to conventional treatment approaches. Mycoremediation, using fungi to transform or retain contaminants, has potential but remains largely untested for promoting nutrient concentration and load reductions in agricultural drainage waters. Through a tiered experimental framework, we evaluate fungal-based filter matrices designed to treat agricultural runoff, with a primary focus on nitrate (NO₃⁻) and phosphate (PO₄³⁻) removal. This presentation focuses on the design, comparative performance, and field evaluation of fungal-based NbS for agricultural drainage treatment.

Filters combine organic and inorganic substrates selected to promote fungal colonisation and sustained biogeochemical activity. Saprotrophic fungal strains originating from England and Scotland were isolated, genetically confirmed, and screened under laboratory conditions to assess nutrient uptake performance. Column experiments enabled the shortlisting of substrate–fungal combinations with the strongest nutrient removal potential. Selected combinations were then tested in channel-scale experiments simulating agricultural drainage conditions using water enriched with NO₃⁻ and PO₄³⁻. We quantify upstream and downstream nutrient concentrations, dissolved oxygen dynamics, and redox potential within the filter media to assess conditions conducive to denitrification and nutrient retention. In parallel, continuous water quality monitoring is being used to assess filter performance under real-world hydrological and chemical variability across multiple agricultural sites in England and Scotland.

Data collection is ongoing and results are not yet conclusive; however, the combined laboratory, mesocosm, and field datasets will provide a robust evaluation of mycoremediation filters as scalable NbS for mitigating diffuse agricultural nutrient pollution.

How to cite: Dantas Mendes, L. R., Walling, H., Schuler, P., Crockford, L., Quinn, P., Terreni-brown, S., Parkes, T., Morris, E., Wilkinson, M., and Stutter, M.: Evaluating fungal-based nature-based solutions for agricultural drainage treatment, EGU General Assembly 2026, Vienna, Austria, 3–8 May 2026, EGU26-15234, https://doi.org/10.5194/egusphere-egu26-15234, 2026.

EGU26-16103 | ECS | PICO | BG8.7

When Wastewater Is a Social Dilemma: Individual and Collective Choices in Technology Adoption 

Kyra Selina Hagge, Poonam Arora, Gregory Howard, and Stephen Moysey

In many human–environment systems, individual actions influence community behavior and environmental outcomes and can be characterized as social dilemmas. In regional wastewater management, decisions made at the household level, such as the choice between individual septic systems and community-scale treatment options like cluster septic systems, collectively shape water quality outcomes at the watershed scale. While innovative wastewater technologies can reduce nutrient and contaminant loads, their effectiveness ultimately depends on adoption and appropriate use by households and communities.

Using a large-scale survey that includes a stated preference experiment conducted in the United States, with a focus on North Carolina (N = 2,068), we examine how willingness to pay (WTP) for improved wastewater treatment technologies varies depending on how individuals conceptualize the underlying interdependent decision context. We classify respondents’ decision-making into four archetypal mixed-motive games: Maximum Difference, Assurance, Chicken, and Prisoner’s Dilemma, and analyze differences in WTP across these mental representations. Results show that respondents, on average, favor individual solutions (advanced septic systems) over collective solutions (cluster septic systems) and are willing to pay a premium for the individual option. We interpret this premium as the cost of cooperation, reflecting perceived risks and governance challenges associated with collective wastewater management. As nature-based technologies and other alternative approaches rely on human cooperation on multiple levels, our findings provide valuable behavioral context for design and implementation of innovative water quality interventions. 

How to cite: Hagge, K. S., Arora, P., Howard, G., and Moysey, S.: When Wastewater Is a Social Dilemma: Individual and Collective Choices in Technology Adoption, EGU General Assembly 2026, Vienna, Austria, 3–8 May 2026, EGU26-16103, https://doi.org/10.5194/egusphere-egu26-16103, 2026.

EGU26-19236 | ECS | PICO | BG8.7

An Integrated Computational Framework for the Advanced Design of Vegetated Filter Strips in Agricultural Landscapes 

Iñigo Barberena, Rafael Muñoz-Carpena, Miguel Ángel Campo-Bescós, and Javier Casalí

Effective management of agricultural runoff is essential to safeguard water quality and promote sustainable land use. Vegetative filter strips (VFS), areas of dense vegetation established between pollution sources and receiving surface waters, are widely implemented as a nature-based solution to mitigate nutrient and sediment export from agricultural fields. Their performance is commonly assessed using established computer models such as VFSMOD. While VFSMOD provides a robust, physically-based representation of VFS performance, its conventional application is largely deterministic, limiting its ability to address the intrinsic environmental variability and uncertainty on VFS design for environmental management.

This work presents a new computational tool consisting of a graphical user interface built upon VFSMOD, specifically developed to enhance the design and assessment of vegetative filter strips under variable conditions. The cross-platform tool extends VFSMOD by incorporating a hypothesis-testing framework for model calibration based on observational data. Once calibration is achieved, the tool supports an advanced VFS design phase in which input uncertainty is considered and mitigation performance in terms of both efficiency and reliability.

The methodology was applied to a real-world agricultural setting. The case study demonstrates how the proposed tool facilitates robust VFS design while explicitly accounting for input uncertainty. Results indicate improved decision support compared with the previous user interface used to run VFSMOD.


How to cite: Barberena, I., Muñoz-Carpena, R., Campo-Bescós, M. Á., and Casalí, J.: An Integrated Computational Framework for the Advanced Design of Vegetated Filter Strips in Agricultural Landscapes, EGU General Assembly 2026, Vienna, Austria, 3–8 May 2026, EGU26-19236, https://doi.org/10.5194/egusphere-egu26-19236, 2026.

EGU26-20597 | ECS | PICO | BG8.7

Nitrogen dynamics and removal within a riparian zone used as a nature-based solution for secondary-treated wastewater 

Laura Escarmena, Núria Roca, Sílvia Poblador, Stefania Mattana, Àngela Ribas, Santi Sabaté, Teresa Sauras-Yera, Jenny Solís-Llerena, and Francesc Sabater

Wastewater treatment plant (WWTP) effluent discharge is one of the main pressures in Mediterranean non-perennial streams because of their low dilution capacity. The concentration of nutrients present in effluents leads to the aggravation of the quality of those ecosystems. As an alternative discharge approach, a Mediterranean riparian zone has been used as a nature-based solution (NbS) to remove nitrogen from NH4-rich effluents (3 mg/L). The effluent was discharged through an intermittent horizontal subsurface flow across a 250 m2 riparian soil area located in a Mediterranean basin. The system operated during spring and summer of 2021 and 2023. Effluent application periods (wet conditions) alternated with drainage periods (dry conditions) at a 1:1 ratio.

We conducted sampling campaigns under both conditions and compared them with a control zone. We assessed the removal efficiency of NH4 and NO3 and the impact of the discharge on their concentrations in soil and groundwater. We also measured the N2O soil emissions along with the expression (mRNA) of key microbial functional genes related to nitrification (archaeal and bacterial amoA) and denitrification (nirK and nosZ).

We found mean removal efficiencies of 50% for NH4 and 23% for NO3, similar to those reported for other NbS such as constructed wetlands. As expected, NH4 increased in both groundwater and soil, while NO3 decreased, with concentrations varying between wet and dry periods. Effluent application triggered a significant increase in N2O emissions, also showed a spatial pattern across the riparian zone. The hillslope zone -where the NH4 rich effluent was applied- presented the highest emissions mainly linked to nitrification. The near‑stream zone, characterized by higher soil moisture, had the lowest emissions, consistent with conditions favoring denitrification. Gene expression patterns confirmed the coupling between both processes. Under wet conditions, we found significant positive correlations between N2O and archaeal amoA expression, as well as with nitrifiers/denitrifiers ratio, suggesting that N2O production was more strongly influenced by nitrification. Moreover, we found positive correlations between amoA and nirK genes. The negative correlation between N2O and nosZ/nirK ratio, in addition to high nosZ/nirK ratio values, indicated that wetter conditions favored complete denitrification. Nevertheless, resulting emissions were generally one order of magnitude lower than those of other NbS and like those of riparian zones.

Overall, the biogeochemical heterogeneity of riparian soils, combined with flow intermittency and the NH4 load from wastewater, enhanced both nitrification and denitrification. This resulted in an effective system for nitrogen removal.

How to cite: Escarmena, L., Roca, N., Poblador, S., Mattana, S., Ribas, À., Sabaté, S., Sauras-Yera, T., Solís-Llerena, J., and Sabater, F.: Nitrogen dynamics and removal within a riparian zone used as a nature-based solution for secondary-treated wastewater, EGU General Assembly 2026, Vienna, Austria, 3–8 May 2026, EGU26-20597, https://doi.org/10.5194/egusphere-egu26-20597, 2026.

EGU26-21152 | ECS | PICO | BG8.7 | Highlight

Integrating social and environmental evidence to support the development of effective fungal-based filters for agricultural water remediation 

Hannah Walling, Lipe Renato Dantas Mendes, Lucy Crockford, Ellie Morris, Toby Parkes, Philip Schuler, Marc Stutter, Mark Wilkinson, and Stephanie Terreni-Brown

Water quality management in agricultural catchments remains a critical environmental and societal challenge. Whilst nature-based solutions (NbS), such as mycoremediation (the use of fungi to remediate contamination and remove pollutants) offer potentially resilient alternatives to conventional approaches, their widespread adoption is often constrained by social, practical and governance barriers. 


This presentation explores the role of stakeholder engagement in shaping the design, implementation, and upscaling of fungal-based filtration systems developed to intercept agricultural runoff at source. Building on ongoing field trials of mycoremediation filters, primarily targeting nitrate (NO₃⁻) and phosphate (PO₄³⁻) removal, we employed mixed-methods engagement framework to compliment practical results found in the field. Participants included a range of experienced practitioners, including farmers, land managers and regulators. 


Engagement activities helped identify perceived benefits and risks of filter deployment, practical constraints related to land use, regulations, maintenance and costs, and opportunities for interaction with existing farm infrastructure and agri-environmental schemes. Coupling stakeholder-derived insights and iterative in-field testing of filter design is refining the research to prioritise environmentally effective and operationally feasible solutions. This work demonstrates how integrating social and environmental evidence can support the transition of NbS from experimental trials, to scalable, catchment-scale interventions, contributing to more inclusive and sustainable water quality management. 


How to cite: Walling, H., Renato Dantas Mendes, L., Crockford, L., Morris, E., Parkes, T., Schuler, P., Stutter, M., Wilkinson, M., and Terreni-Brown, S.: Integrating social and environmental evidence to support the development of effective fungal-based filters for agricultural water remediation, EGU General Assembly 2026, Vienna, Austria, 3–8 May 2026, EGU26-21152, https://doi.org/10.5194/egusphere-egu26-21152, 2026.

Dissolved organic matter (DOM) is found across all freshwater systems and originates from soils, leaf litter and leachate from plant material and the decomposition processes. However, as a consequence of a combination of changes in both land use practices and climate change there has been a recorded increase in DOM export in freshwater systems over the last number of years. High concentrations of Dissolved Organic Matter (DOM) in water react with chlorine during treatment, forming harmful disinfection by-products (DBPs) such as trihalomethanes (THMs) and chloroform. There are numerous options available to mitigate and treat DBPs as part of the water treatment process, including a range of technologies and management procedures which aim to reduce contact between DOM precursors and disinfectants. Nevertheless, protection of the water at source represents an alternative and likely additional activity which could act to reduce DBP formation in drinking water in a more cost effective and efficient way.

Source Water Protection (SWP) through the use of Nature Based Solutions and other methodologies has been widely implemented in many regions of the world to improve raw water quality. However, compared with other potential contaminants such as microbial pathogens, very little work has specifically focused on the reduction of DOM input to water treatment plants. This study examines the potential effectiveness of SWP measures at reducing organic matter with the aim of minimising human exposure to DBPs in drinking water. A review was undertaken to identify SWP measures considered most likely to mitigate against DOM, pinpointing five key land use categories linked to DOM loading: forestry, peatland, agriculture, lakes/reservoirs, and wastewater treatment. Measures were assessed based on their proven effectiveness at reducing DOM or other relevant pollutants. Input was gathered from the Irish water sector via a focus group and survey to evaluate the feasibility of implementing these measures at catchment scale. The findings suggest there is a potential role for SWP for the mitigation of DOM in source water leading to improved DBP management in conjunction with treatment plant improvements and upgrades. However, there is currently a lack of evidence-based research demonstrating the effectiveness of SWP measures in mitigating against DOM and DBP formation which is a significant barrier to the uptake and implementation of such measures. In addition, active and participatory approaches to education and support in this area will encourage stakeholders to shift their perception from an end of pipe only solution to a multi-barrier approach to reduce the overall risk of DBP contamination of drinking water.


How to cite: Molloy, K. and McCarthy, V.: Potential source water protection measures to mitigate against organic matter based on its pathway and process of contamination using Ireland as a case study., EGU General Assembly 2026, Vienna, Austria, 3–8 May 2026, EGU26-21826, https://doi.org/10.5194/egusphere-egu26-21826, 2026.

EGU26-22099 | ECS | PICO | BG8.7

Resource-oriented sanitation and the SDGs: a target-level interaction assessment in the Austrian context 

Tamara Vobruba, Marco Hartl, Cecilia Delgado, Günter Langergraber, Verena Germann, and Ines Costa- Pereirae

Resource-oriented sanitation (ROS) is increasingly discussed as an innovative approach for circular resource use, yet its cross-sectoral sustainability implications are rarely assessed at the level of specific Sustainable Development Goal (SDG) targets. An expert-based scoring approach adapted from Nilsson et al. (2016) was applied within the Austrian UniNEtZ project to assess interactions between ROS and 123 SDG targets. The analysis identified 42 non-neutral interactions, particularly related to water management, nutrient cycling, food production, resource efficiency, health, innovation, and governance. ROS has the potential to improve water quality and reduce pollution loads through direct sanitation pathways as well as indirect effects linked to the reuse of reclaimed water and nutrients, with decentralised and nature-based solutions representing important implementation pathways. The identified interactions were contextualised through a food-system perspective to examine cross-sectoral pathways relevant for integrated governance and policy-relevant sustainability assessment in infrastructure-mature contexts.

How to cite: Vobruba, T., Hartl, M., Delgado, C., Langergraber, G., Germann, V., and Costa- Pereirae, I.: Resource-oriented sanitation and the SDGs: a target-level interaction assessment in the Austrian context, EGU General Assembly 2026, Vienna, Austria, 3–8 May 2026, EGU26-22099, https://doi.org/10.5194/egusphere-egu26-22099, 2026.

In recent decades, eutrophication, caused by the enrichment of nutrients in the water bodies
(mostly due to N and P), has emerged as a global environmental challenge with far-reaching
consequences for aquatic ecosystems health. ZeoPhos, an innovative eco-friendly clay-based
material, promises to simultaneously adsorb ammonium and orthophosphate ions, causing
eutrophication, from natural freshwaters. ZeoPhos consists of natural zeolite with a synergistic
combination of iron, calcium, and humic ions to enhance nutrient-binding affinity. Material
characterisation analysis (such as SEM/EDS and TEM) confirms that ZeoPhos successfully
altered the surface morphology and elemental composition, creating a more reactive surface for
adsorption. Batch adsorption kinetic experiments demonstrated high efficiency at achieving
removal rates of 78% and 70% for ammonium and orthophosphate ions, respectively. Pseudo-
second-order model of the kinetic studies suggests that the removal process is governed by
chemisorption, while the Langmuir model of isotherm studies indicate monolayer adsorption
onto a finite number of sites. The maximum adsorption capacities were 28.61mg/g and
27.13mg/g for ammonium and orthophosphate ions, respectively. ZeoPhos is an innovative,
economic and eco-friendly adsorbent material of high-capacity, capable of dual-nutrient
adsorption and ultimately promising to mitigate eutrophication in freshwater bodies.

How to cite: Biliani, I. and Zacharias, I.: Dual-nutrient removal from eutrophic freshwater using ZeoPhos: Synthesis, characterization, and adsorption mechanisms of a multi-ion modified zeolite., EGU General Assembly 2026, Vienna, Austria, 3–8 May 2026, EGU26-23225, https://doi.org/10.5194/egusphere-egu26-23225, 2026.

EGU26-671 | ECS | Orals | AS3.38

High-resolution measurement-based methane quantification from beef cattle feedlots to improve agricultural GHG inventories 

Sushree Sangita Dash, Trevor W. Coates, and Chandra A. Madramootoo

Methane (CH4) emissions from livestock production remain one of the largest and most uncertain components of national greenhouse gas inventories, largely because direct measurements at operational facilities are limited. This measurement gap constrains the accuracy of agricultural CH4 estimates and the development of effective mitigation strategies. Strengthening the empirical basis for these inventories is therefore essential. Emerging close-range tools, such as uncrewed aerial vehicle (UAV) plume-sampling systems, can enhance monitoring, reporting, and verification (MRV) by providing high-resolution, facility-level observations.

To evaluate this approach, this study conducted a five-day field campaign at a commercial cattle feedlot in southern Alberta, Canada, housing approximately 28,000 cattle. UAV plume sampling was deployed alongside continuous CH4 measurements from an open-path laser (OPL) to estimate CH4 emission rate downwind of the facility. For both techniques, emission rates were derived using inverse dispersion modeling, for a direct comparison of performance and assessing the extent to which UAV-based sampling can complement established ground-based flux measurements.

Uncrewed aerial vehicle-derived CH4 emission rates varied from 149 to 392 g head-1 day-1 (mean ± SE: 280 ± 22), in near-perfect agreement with OPL-derived emissions of 152-438 g head-1 day-1 (280 ± 22). Daily mean emissions differed by only 0.08% during overlapping sampling periods, and statistical distributions were highly consistent across methods. Hour-to-hour variability reflected transient atmospheric dynamics and associated changes in plume dispersion, rather than methodological bias. UAV flights also revealed spatial plume gradients not captured by the fixed OPL geometry, and consistent hourly emission estimates were found when UAV flights collected at least four usable plume samples per hour. Performance declined under very low-wind or highly turbulent conditions, clarifying key operational constraints for future deployments.

Overall, these findings demonstrate that UAV-based plume sampling can provide CH4 emission estimates consistent with established ground-based systems, providing a validated pathway for quantifying emissions from commercial feedlots. The approach aligns with the Integrated Global Greenhouse Gas Information System (IG3IS) good-practice principles and provides empirical information that can improve IPCC Tier 2 emission factors for open-lot beef operations.

How to cite: Dash, S. S., Coates, T. W., and Madramootoo, C. A.: High-resolution measurement-based methane quantification from beef cattle feedlots to improve agricultural GHG inventories, EGU General Assembly 2026, Vienna, Austria, 3–8 May 2026, EGU26-671, https://doi.org/10.5194/egusphere-egu26-671, 2026.

EGU26-2527 | ECS | Orals | AS3.38

Investigating Regional Halocarbon Emissions: The Seoul Tracer Release Experiment 

Michelle Jessy Müller, Martin K. Vollmer, Stephan Henne, Jaegeun Yun, Haklim Choi, Sunyoung Park, Lukas Emmenegger, and Stefan Reimann

Hydrofluorocarbons (HFCs) are used as refrigerants, propellants or insulating foams. They don’t deplete the ozone layer like their predecessors, (hydro)chlorofluorocarbons ((H)CFCs). However, HFCs are still potent greenhouse gases and are regulated under the Kyoto Protocol (1997) and, more recently, the Kigali Amendment to the Montreal Protocol. The Kigali amendment targets reductions in HFC production and consumption over the coming decades.1, 2 Observing halogenated substances in the atmosphere provides an independent means to verify compliance with these international treaties. From these observations, regional and global emission estimates can be obtained by combining them with atmospheric modelling or using a reference tracer with known emissions.3, 4 Due to rapid industrialization and high demand for refrigeration and air conditioning, the eastern Asian region contributes significantly to global HFC emissions. Therefore, it is crucial to understand the emission patterns in this region to assess global compliance.

We have conducted a large-scale controlled-release tracer experiment to estimate regional halocarbon emissions of the greater Seoul metropolitan area (South Korea). Ethyl fluoride (HFC-161)5 and hexafluorobutane (HFO-1336mzzE), which are virtually absent in the background atmosphere, were released at one location in the City of Seoul. Release times were selected to align with favorable meteorological conditions that allowed air masses to reach the AGAGE station Gosan (Jeju Island, 490 km south of Seoul). The site is equipped with an instrument for in-situ halocarbon measurements. Intermediately located along the path of air mass transport, sites at the Global Atmosphere Watch (GAW) Observatory Anmyeondo and Mokpo National University (138 km and 320 km from Seoul, respectively) were used for additional flask sampling. The atmospheric transport model FLEXPART6 was used to forecast the tracer plume's trajectory and dispersion, and the release and sampling times were adjusted accordingly.

During two releases in November 2024 and April 2025, both tracers were detected at the flask sampling sites Anmyeondo GAW Observatory and Mokpo National University, as well as at Gosan station. The measurements show a strong correlation of our tracer substances with various HFCs. Preliminary emission estimates for the greater Seoul metropolitan area are derived using the tracer ratio method, and its limitations are discussed. Finally, a comparison to a full regional inversion, based on the continuous observations at Gosan, is conducted.

References

[1] Kyoto Protocol to the United Nations Framework Convention on Climate Change. adopted on December 11th, 1997; Kyoto, 1998, 1-22.

[2] Kigali Amendment to the Montreal Protocol on Substances that Deplete the Ozone Layer. adopted on October 15th, 2016; United Nations, Kigali.

[3] Matt Rigby, Sunyoung Park, Takuya Saito, Luke M. Western, Alison L. Redington, et al., Nature, 2019, 569 (7757), 546-550.

[4] Peter G. Simmonds, Matthew Rigby, Alistair J. Manning, Sunyoung Park, Kieran M. Stanley, et al., Atmospheric Chemistry and Physics 2020, 20 (12), 7271-7290.

[5] Dominique Rust, Martin K. Vollmer, Stephan Henne, Arnoud Frumau, Pim van den Bulk, et al., Nature, 2024, 633, 96-100.

[6] Ignacio Pisso, Espen Sollum, Henrik Grythe, Nina I. Kristiansen, Massimo Cassiani, et al., Geoscientific Model Development, 2019, 12 (12), 4955-4997.

How to cite: Müller, M. J., Vollmer, M. K., Henne, S., Yun, J., Choi, H., Park, S., Emmenegger, L., and Reimann, S.: Investigating Regional Halocarbon Emissions: The Seoul Tracer Release Experiment, EGU General Assembly 2026, Vienna, Austria, 3–8 May 2026, EGU26-2527, https://doi.org/10.5194/egusphere-egu26-2527, 2026.

EGU26-2643 | Orals | AS3.38

Unveiling Carbon Sequestration Dynamics in Bamboo Forests, China: An Observation-Based Approach Using Atmospheric Tracers 

Shuangxi Fang, Oksana Tarasova, Yanxia Li, Jocelyn Turnbull, Yi Lin, Gordon Brailsford, and Sara Mikaloff-Fletcher

Bamboo, a perennial grass species, exhibits rapid growth rates surpassing many native trees, offering substantial potential for atmospheric carbon capture and subsequent sequestration into durable products. Despite this promise, the carbon sequestration capacity of bamboo forests and its variability under different land management practices and environmental conditions remain underexplored. This study examines carbon sequestration in a representative bamboo forest in Anji, eastern China, employing a novel observation-based approach utilizing multiple atmospheric tracers (CO₂, CO, and ¹⁴C-CO₂) measurements to attribute fluxes accurately. The study also includes regular biomass inventory to be able to compare CO2 fluxes between two approaches. Departing from conventional inventory-based estimates of carbon emissions and uptakes, observations-based method yields detailed insights into individual carbon-cycle processes within bamboo ecosystems and identifies the most effective tracers for quantifying regional CO₂ fluxes. Leveraging high-resolution atmospheric CO₂ observations, coupled with advanced modeling systems and analytical tools—including machine learning techniques to reconstruct and correct prior Net Ecosystem Exchange (NEE) fluxes for the bamboo forest—we derive carbon fluxes while accounting for variations in management strategies and environmental factors. These findings enhance our understanding of bamboo's role in global carbon mitigation, informing sustainable forestry practices and climate policy. This work highlights the transformative potential of tracer-based methodologies for precise, scalable carbon flux assessments in managed ecosystems.

The study is supported by the Quadrature Climate Foundation (Grant No. 01-21-000133).

How to cite: Fang, S., Tarasova, O., Li, Y., Turnbull, J., Lin, Y., Brailsford, G., and Mikaloff-Fletcher, S.: Unveiling Carbon Sequestration Dynamics in Bamboo Forests, China: An Observation-Based Approach Using Atmospheric Tracers, EGU General Assembly 2026, Vienna, Austria, 3–8 May 2026, EGU26-2643, https://doi.org/10.5194/egusphere-egu26-2643, 2026.

EGU26-2748 | Orals | AS3.38

Design, operation, and insights from Zurich’s mid- and low-cost ICOS Cities CO2 sensor network 

Lukas Emmenegger, Luce Creman, Andrea Fischer, Stuart K. Grange, Christoph Hüglin, Pascal Rubli, and Dominik Brunner

Zurich aims for net-zero direct greenhouse gas emissions by 2040, a target supported by 75 % of voters. Progress is tracked through a detailed CO2 inventory covering energy, transport, industry, and waste. Under the European ICOS Cities project, a monitoring program was launched using two approaches: (i) a network of mid- and low-cost CO2 sensors combined with atmospheric inverse modeling, and (ii) CO2 flux measurements from an eddy-covariance system on a city-center high-rise building, paired with footprint modeling.

Here, we focus on the mid-cost (ZiCOS-M) and low-cost (ZiCOS-L) NDIR (nondispersive infrared) CO2 networks, which were both operational for at least 3 years since 2022.

ZiCOS-M consists of 26 monitoring sites, 21 in the city and 5 outside the urban area. Daily calibrations using two reference gas cylinders, and corrections of the sensors’ spectroscopic response to water vapour were performed. The hourly mean root mean squared error (RMSE) was 0.98 ppm (0.46 - 1.5 ppm) and the mean bias ranged between 0.72 and 0.66 ppm compared to parallel measurements with a high-precision reference gas analyser for a period of 2 weeks or more. CO2 concentrations in the city were highly variable with site means ranging from 434 to 460 ppm, and Zurich’s mean urban CO2 increment was 15.4 ppm above the regional background.

ZiCOS-L consists of 56 sites with paired sensors. The sensors require in-field training for model calibration before deployment and further post-processing steps to account for drift and outliers. After data processing, the hourly RMSE was 13.6±1.4 ppm, and the mean bias 0.75±1.67 ppm when validated against parallel reference measurements from ZiCOS-M. CO2 concentrations were highly variable with site means in Zurich ranging from 438 to 465 ppm, reflecting mainly the influence of sources in the nearby surroundings. Vegetation (mainly grassland) amplified the morning concentration on average in summer by up to 20 ppm due to ecosystem respiration, while heavy traffic increased the morning rush hour concentration by 15 ppm. Despite its lower measurement accuracy, the ZiCOS-L network enables the study of concentration dynamics at a spatial and temporal scale that is not accessible by any other means.

The ZiCOS-M data was extensively used to derive top-down CO2 emissions. Similar modelling activities are currently ongoing with the ZiCOS-L data, and both are compared to emissions derived from the eddy covariance system and to the city's emission inventory.


Grange SK, … Emmenegger L, The ZiCOS-M CO2 sensor network: measurement performance and CO2 variability across Zurich. https://doi.org/10.5194/acp-25-2781-2025.

Creman L, … Bernet L, The Zurich Low-cost CO2 sensor network (ZiCOS-L): data processing, performance assessment and analysis of spatial and temporal CO2 dynamics. https://doi.org/10.5194/egusphere-2025-3425

Brunner D, … Emmenegger L, Building-resolving simulations of anthropogenic and biospheric CO2 in the city of Zurich with GRAMM/GRAL. https://doi.org/10.5194/acp-25-14279-2025.

Hilland R, … Christen A, Sectoral attribution of greenhouse gas and pollutant emissions using multi-species eddy covariance on a tall tower in Zurich, Switzerland. https://doi.org/10.5194/acp-25-14279-2025.

Ponomarev N, … Brunner D, Estimation of CO2 fluxes in the cities of Zurich and Paris using the ICON-ART CTDAS inverse modelling framework. https://doi.org/10.5194/egusphere-2025-3668.

How to cite: Emmenegger, L., Creman, L., Fischer, A., Grange, S. K., Hüglin, C., Rubli, P., and Brunner, D.: Design, operation, and insights from Zurich’s mid- and low-cost ICOS Cities CO2 sensor network, EGU General Assembly 2026, Vienna, Austria, 3–8 May 2026, EGU26-2748, https://doi.org/10.5194/egusphere-egu26-2748, 2026.

EGU26-2817 | ECS | Orals | AS3.38

Concurrent data assimilation of methane concentrations and fluxes  

Niklas Becker, Niels Heinrich Keil, Valentin Bruch, and Andrea Kaiser-Weiss

We use atmospheric inverse modelling to provide observation-based estimates of methane emissions at the national scale in Europe. We apply the numerical weather prediction model ICON-ART to obtain an ensemble of methane concentrations by varying the meteorology, the lateral boundary conditions and emission fields. By comparing to ground based observations of the ICOS network, we employ a 4D LETKF to assimilate both the concentrations and emissions concurrently. We create an ensemble of emissions in two ways: We can perturb the underlying emission field with a gaussian random field, or we can separate it into regions and economic sectors and scale these. We compare the two approaches and the resulting emission estimates to national greenhouse gas inventories and synthesis inversion results with a focus on Germany. The first results are presented for 2021 and we identify a considerable mismatch with the reported emissions in central Europe.

How to cite: Becker, N., Keil, N. H., Bruch, V., and Kaiser-Weiss, A.: Concurrent data assimilation of methane concentrations and fluxes , EGU General Assembly 2026, Vienna, Austria, 3–8 May 2026, EGU26-2817, https://doi.org/10.5194/egusphere-egu26-2817, 2026.

EGU26-3366 | Posters on site | AS3.38

Characteristics of CO2 and CH4 from different emission sources using mobile measurements and stable carbon isotope analysis 

Hyeongseok Choi, Jongbyeok Jun, Sunran Lee, Sumin Kim, and Yongjoo Choi

Achieving effective greenhouse gases (GHGs) mitigation policy requires accurate quantification of contribution from each emission source based on in-situ measurements. In this study, we investigated the spatial distribution of CO2 and CH4 emitted from different emission sources by conducting mobile measurements using a GLA331-GGA analyzer (ABB–LGR Inc.) mounted on a vehicle. We conducted seven mobile measurements in spring (N = 3), summer (N = 2), and fall (N = 2) over Seoul Metropolitan Area (SMA) in 2025. By comparing the correlation between two GHGs from various emission sources, we selected representative sites including livestock facilities (cattle and swine barns), industrial complexes, urban, wastewater treatment plants, LNG power plants, rural areas. Background GHGs concentrations were defined as the daily 5th percentile for each measurement day, and correlations between enhancements (ΔCO2 and ΔCH4) were assessed. Along with real time measurements, stable carbon isotopes samplings were also conducted to provide complementary constraints on concentration variability and the contributions of end-member of each emission source. For stable isotope measurements, two ambient air samples were collected per site using canisters (Entech, Simi Valley, CA, USA) and analyzed with Picarro G2131-i for δ13C–CO213C) and Picarro G2132-i for δ13C–CH413CH4). Strong co-variability between the two GHGs was observed at several emission sources and seasons, including springtime cattle barns (R = 0.75), LNG power plants (R = 0.83), industrial complexes (R = 0.74), and swine barns (R = 0.64); summertime cattle barns (R = 0.66) and LNG power plants (R = 0.67); and fall industrial complexes (R = 0.70) and cattle barns (R = 0.97). These correlations suggested that CO2 and CH4 were likely emitted concurrently from shared sources or similar emission activities in SMA region. The observed δ13C values ranged from −8.2‰ to −12.5‰, while δ13CH4 ranged from −47.2‰ to −48.6‰. Seasonal mean δ13C values were −11.2‰ in spring, −9.2‰ in summer, and −10.1‰ in fall, consistent with a summertime influence from enhanced biospheric respiration, with the most depleted values occurring in spring. In contrast, δ13CH4 exhibited relatively small seasonal variability, as indicated by the coefficient of variation (sd/mean; 0.004 in spring, 0.013 in summer, and 0.012 in fall), but still provided useful constraints on source attribution. In addition, a Bayesian isotope mixing model (the ‘simmr’ package in R) was applied to quantify relative source contributions indicating that coal combustion contributed most strongly to δ13C, whereas wastewater treatment and natural gas were the dominant contributors to δ13CH4.

How to cite: Choi, H., Jun, J., Lee, S., Kim, S., and Choi, Y.: Characteristics of CO2 and CH4 from different emission sources using mobile measurements and stable carbon isotope analysis, EGU General Assembly 2026, Vienna, Austria, 3–8 May 2026, EGU26-3366, https://doi.org/10.5194/egusphere-egu26-3366, 2026.

EGU26-3437 | ECS | Orals | AS3.38

Development of an Ensemble-Based Data-Assimilation System for CO2 Fluxes Using ICON-ART 

Jakob Böttcher, Niklas Becker, Andrea Kaiser-Weiss, and Maya Harms

Observation based quantification of surface CO2 fluxes relies on the consistent integration of atmospheric observations with numerical transport models. We present the development and demonstration of an ensemble-based data assimilation system that couples atmospheric CO2 observations to the ICON-ART modeling framework using a Local Ensemble Transform Kalman Filter (LETKF).


Starting with a flux estimate provided by CarbonTracker Europe High-Resolution we start with a dynamic model with hourly resolution with a focus on fluxes in Europe for 2021. We then create an ensemble of perturbed prior fluxes within assumed uncertainties using prescribed spatial and temporal correlation structures. We simulate the transport of these ensemble members in ICON-ART in limited area mode, while varying the meteorological conditions to represent meteorological uncertainties. Subsequently, we use the LETKF to update the state vector of concentrations and CO2 fluxes daily, resulting in an posterior estimate of surface CO2 fluxes over Europe. 


This work provides the foundation for an ICON-ART-based CO2 flux assimilation system and establishes a technical basis for future extensions toward longer assimilation periods, refined error modeling, and the assimilation of anthropogenic emission signals.

How to cite: Böttcher, J., Becker, N., Kaiser-Weiss, A., and Harms, M.: Development of an Ensemble-Based Data-Assimilation System for CO2 Fluxes Using ICON-ART, EGU General Assembly 2026, Vienna, Austria, 3–8 May 2026, EGU26-3437, https://doi.org/10.5194/egusphere-egu26-3437, 2026.

In this research, we propose a simple and effective method for gas analysis of semiconductor and display industries. To achieve this, residual gas analyzer (RGA) was adopted and two high-global warming potential (GWP) gases such as CF4 and NF3 commonly used in industrial application were focused. The experiment was conducted in four key steps: identifying gas species using optical emission spectroscopy (OES), calibrating RGA with a quadrupole mass spectrometer (QMS), constructing a five-point calibration graph to correlate RGA and Fourier-transform infrared spectroscopy (FT-IR) data, and estimating the concentration of unknown samples using the calibration graph. The results under plasma-on conditions demonstrated correlation and accuracy, confirming the reliability of our approach. In other words, the method effectively captured the relationship between RGA intensity and gas concentration, providing valuable insights into concentration trends. Thus, our approach serves as a useful tool for estimating gas concentrations and understanding the correlation between RGA intensity and gas composition.


Reference

[1] B. G. Jeong, S. H. Park, D. H. Goh, and B. J. Lee, Metrology 5 (2025) 60

How to cite: Jeong, B. G.: Real-Time Monitoring and Quantification of Fluorinated Greenhouse Gases in Semiconductor/Display Manufacturing, EGU General Assembly 2026, Vienna, Austria, 3–8 May 2026, EGU26-4566, https://doi.org/10.5194/egusphere-egu26-4566, 2026.

The semiconductor and display industries are significant sources of fluorinated greenhouse gas (F-GHG) emissions in the electronics, making accurate emission estimation essential for addressing climate change. The Republic of Korea, a leading country in the semiconductor and display industries, requires precise evaluation of the environmental impact of these industries due to its global competitiveness. Currently, The Republic of Korea relies on default emission factors provided by the 2006 IPCC guidelines for estimating F-GHG emissions. However, this approach does not account for the latest mitigation technologies implemented in Republic of Korea, resulting in a conservative overestimation of actual F-GHG emissions. To address this issue, this study conducted direct measurements of F-GHG emissions from semiconductor manufacturing processes in facilities equipped with advanced mitigation technologies. By employing state-of-the-art measurement methods, the study evaluated the use rate of gas (Ui) and generation rate of by-product gas (Bbyproduct, Bi) and compared the results with the default emission factors provided by IPCC G/L (2006 and 2019). Moreover, based on derived country-specific emission factors (Tier 3b), GHG emissions were estimated and compared with tier-based methodologies using 2006 and 2019 IPCC G/L default factors (Tier 2a, 2b, 2c and 3a). The finding highlights the need for developing country-specific emission factors and contribute to the establishment of precise, data-driven policies for reducing GHG emissions in Republic of Korea’s electronics industry. Furthermore, this research serves as valuable reference for other countries aiming to refine their emission estimates with country-specific data and technological advancements, ultimately contributing to global efforts towards carbon neutrality.

How to cite: Inkwon, J. and Bong-Jae, L.: Comparative Analysis of F-GHGs Emission Estimates between IPCC Default Factors and Measurement-based Korea-specific Emission Factors in Semiconductor Manufacturing, EGU General Assembly 2026, Vienna, Austria, 3–8 May 2026, EGU26-4570, https://doi.org/10.5194/egusphere-egu26-4570, 2026.

EGU26-5198 | ECS | Orals | AS3.38

Monitoring urban atmospheric CO2 plumes from space: sensitivity to urban physics and scale effects over Paris 

Alohotsy Rafalimanana, Thomas Lauvaux, Charbel Abdallah, Mali Chariot, Michel Ramonet, Josselin Doc, Olivier Laurent, Morgan Lopez, Anja Raznjevic, Maarten Krol, Leena Järvi, Leslie David, Olivier Sanchez, Andreas Christen, Dana Looschelders, Laura Bignotti, Benjamin Loubet, Sue Grimmond, and William Morrison

Quantifying urban CO2 emissions from space can be approached using different methodologies, including direct plume-based analyses, but combining satellite observations with atmospheric transport models requires the ability to realistically reproduce fine-scale spatial gradients over cities. Using the Grand Paris area as a testbed, we investigate the sensitivity of simulated near-surface CO2 concentrations to urban physics parameterization and horizontal resolution within the WRF-Chem modeling framework coupled to a high-resolution fossil fuel emission inventory. At mesoscale resolution (900 m), a hierarchy of urban representations ranging from simulations without urban physics to multi-layer urban canopy models is evaluated, showing that the Building Energy Model (BEM) provides the most physically consistent simulation of surface energy fluxes, boundary-layer development, and near-surface CO2 variability. Building on this configuration, we compare mesoscale simulations with Large-Eddy Simulation (LES) runs at 300 m and 100 m resolution. Model results are evaluated against dense urban CO2 observations from the high-precision Picarro network, a complementary mid-cost sensor network from ICOS-Cities, and surface sensible and latent heat flux observations from the ICOS ETC Level-2 fluxes data product. An extensive urban observation network including wind lidars and ceilometers from Urbisphere project provides an exceptional constraint for the evaluation of boundary-layer structure and vertical mixing at fine scales. The LES simulations substantially enhance the representation of spatial heterogeneity and localized CO2 enhancements associated with major emission sources, which are smoothed or underestimated at mesoscale resolution. However, increased resolution also amplifies sensitivity to local wind fields and emission inventory uncertainties. These results highlight that both urban physics and model resolution critically shape the ability of transport models to reproduce observed urban CO2 gradients.

How to cite: Rafalimanana, A., Lauvaux, T., Abdallah, C., Chariot, M., Ramonet, M., Doc, J., Laurent, O., Lopez, M., Raznjevic, A., Krol, M., Järvi, L., David, L., Sanchez, O., Christen, A., Looschelders, D., Bignotti, L., Loubet, B., Grimmond, S., and Morrison, W.: Monitoring urban atmospheric CO2 plumes from space: sensitivity to urban physics and scale effects over Paris, EGU General Assembly 2026, Vienna, Austria, 3–8 May 2026, EGU26-5198, https://doi.org/10.5194/egusphere-egu26-5198, 2026.

EGU26-5426 | ECS | Orals | AS3.38

Quantifying Agricultural Methane Emissions Using Satellite Observations 

Mengyao Liu, Ronald van der A, Michiel van Weele, Elefttherios Ioannidis, Ruoqi Liu, Zichong Chen, and Jieying Ding

Methane (CH₄) is the second most important greenhouse gas after CO₂, and its emissions from the agricultural sector, particularly rice paddies and dairy farms, remain highly uncertain and challenging to quantify. While recent advancements in satellite technology, such as high spatial resolution instruments, have enabled the detection of methane sources from global to facility scales, agricultural emissions still pose challenges. These emissions are typically diffuse and area-like, making them less detectable by targeted satellites like GHGSat and EMIT, which are better suited for isolated point sources such as oil/gas facilities or landfills. Additionally, agricultural emissions exhibit significant spatiotemporal variability driven by climate conditions, water management practices in rice paddies, and differences in farm types.

In the AGATE project of ESA, we apply an improved divergence method to estimate monthly methane emissions using TROPOspheric Monitoring Instrument (TROPOMI) satellite observations at a 0.1° grid resolution. We focus on major agricultural regions, including the Po Valley in Italy, as well as India and Bangladesh, over the period 2019-2022. To better isolate agricultural emissions, we separate area-like sources (e.g., rice paddies) from isolated point sources. The locations of identified big emitters are cross-validated using bottom-up emission inventories and targeted satellite observations (e.g., EMIT, Carbon Mapper) to minimize the influence of non-agricultural sources. Furthermore, to better understand the seasonality of methane emissions, we analyze the correlations between methane emission variations and auxiliary datasets, such as rice paddy maps and ammonia emissions derived from satellites.

How to cite: Liu, M., van der A, R., van Weele, M., Ioannidis, E., Liu, R., Chen, Z., and Ding, J.: Quantifying Agricultural Methane Emissions Using Satellite Observations, EGU General Assembly 2026, Vienna, Austria, 3–8 May 2026, EGU26-5426, https://doi.org/10.5194/egusphere-egu26-5426, 2026.

EGU26-5912 | ECS | Posters on site | AS3.38

Investigating Germany’s progress in decoupling air pollution emissions from economic activity using satellite-based measurements of NO₂. 

Erika Remy, Rosina Engert, Laurenz Werner, and Michael Bittner

In efforts to mitigate the effects of global climate change several prominent policies and guidelines which emphasize the importance of sustainable growth have been introduced in recent years. Examples include the 2019 European Green Deal, and the subsequent Clean Industrial Deal in 2025. A key aspect of these goals is the reduction of air pollutant emissions, particularly from fossil fuel combustion, without sacrificing economic growth. The Green Deal commits to an EU wide emission reduction of at least 55% by 2030, as compared to 1990 levels. Remote sensing offers many advantages for tracking progress towards reduction of pollutant emissions. In particular, the global coverage allows for analysis of regions which do not have sufficient ground-based measurement networks. This study presents a method of using spectral analysis with tropospheric NO2 column density and the gross domestic product (GDP) to track and compare progress of the German federal states towards decoupling emissions from economic growth. Most studies evaluating economic decoupling focus on CO2, or CO2 equivalences. There is a current lack of studies which investigate other key combustion products. This study focuses on NO2 as a proxy for emissions related to economic activity. NO2 originates primarily from anthropogenic combustion sources, andhas a short tropospheric lifetime, making it suitable to represent localized fossil fuel emissions.  Measurements of NO2 used in this study are obtained from the Ozone Monitoring Instrument (OMI) launched aboard the NASA Aura satellite in 2004. The application of spectral analysis techniques, such as the wavelet analysis, gives additional insight into temporal variability of NO2, to better observe the path of decoupling for each region. Decoupling between GDP and NO2 variability is observed for all regions of Germany in the period between the two most recent global economic recessions (the 2008 financial crisis, and the Covid-19 pandemic). Similar decreasing trends are observed for both the yearly average tropospheric column density and the calculated yearly variability. The variability obtained from the wavelet analysis shows greater sensitivity to changes in NO2 emissions than the absolute tropospheric column density. Further regional differences such as the main economic sectors and types of emission regulations in place are discussed to contextualize the differences present in decoupling processes between the federal states. Overall, NO2 variability is found to be a sensitive and effective indicator for tracking and comparing decoupling progress across different administrative regions.

How to cite: Remy, E., Engert, R., Werner, L., and Bittner, M.: Investigating Germany’s progress in decoupling air pollution emissions from economic activity using satellite-based measurements of NO₂., EGU General Assembly 2026, Vienna, Austria, 3–8 May 2026, EGU26-5912, https://doi.org/10.5194/egusphere-egu26-5912, 2026.

EGU26-7798 | ECS | Posters on site | AS3.38

Low latency and high resolution GHG emission estimates to support monitoring and modelling activities in Spain 

Oliver Legarreta, Paula Castesana, Ivan Lombardich, Carles Tena, Carmen Piñero-Megías, Artur Viñas, Johanna Gehlen, Luca Rizza, Carlos Pérez García-Pando, and Marc Guevara Vilardel

Reliable and timely information on greenhouse gas (GHG) emissions is essential for evaluating mitigation policies and supporting data assimilation and verification modelling frameworks. In this contribution, we present the sPanisH EmissioN mOnitoring systeM for grEeNhouse gAses (PHENOMENA), a low-latency GHG modelling framework developed within the RESPIRE-CLIMATE Spanish national project, which received formal endorsement from the WMO-IG3IS initiative.

PHENOMENA provides harmonised daily and high spatial resolution (up to 1 km × 1 km) CO2 and CH4 emissions for the main combustion-related sectors, including electricity generation, manufacturing industry (cement and iron and steel), residential and commercial combustion, road transport, shipping and aviation. The system estimates CO2 and CH4 emissions by combining low latency activity data and fuel- and process-dependent emission factors through bottom-up and downscaling approaches. The data collected and pre-processed includes hourly near-real-time traffic counts from the national road network, hourly electricity production data reported by individual power plants, daily Copernicus ERA5-Land surface temperature, monthly industrial production statistics and AIS (Automatic Identification System) data, among others.

PHENOMENA produces multiple GHG emission products, including high resolution maps of daily emissions per sector, as well as daily summaries of emissions aggregated at different regional levels and for the main Spanish metropolitan regions. The emissions computed with PHENOMENA allows representing the intra-weekly and seasonal variability of GHG emissions as well as changes in their spatial patterns, which can be linked to specific policy, socioeconomic, and weather impacts.

The results produced with PHENOMENA are compared to official GHG emission inventories as well as to other state-of-the-art low latency GHG emission datasets, such as the ones produced by the CAMS Carbon Monitor initiative. Overall, these developments demonstrate the capability of PHENOMENA to deliver consistent, multisector and near-real-time GHG emission estimates, supporting national monitoring, policy evaluation and future verification and data-assimilation efforts.

How to cite: Legarreta, O., Castesana, P., Lombardich, I., Tena, C., Piñero-Megías, C., Viñas, A., Gehlen, J., Rizza, L., Pérez García-Pando, C., and Guevara Vilardel, M.: Low latency and high resolution GHG emission estimates to support monitoring and modelling activities in Spain, EGU General Assembly 2026, Vienna, Austria, 3–8 May 2026, EGU26-7798, https://doi.org/10.5194/egusphere-egu26-7798, 2026.

EGU26-7927 | Orals | AS3.38

Using point source imaging satellite observations to guide landfill methane model improvements at the national and sub-national scale 

Tia Scarpelli, Daniel Cusworth, Jinsol Kim, Kelly O'Neill, Riley Duren, and Katherine Howell

As national and sub-national governments, companies, and communities plan methane mitigation action, there is a need for robust emissions tracking systems, especially for major sectors like waste where countries have made commitments to reduce emissions. Landfills are a major source of methane emissions in many jurisdictions spread across the world, so there is a need in the waste sector for monitoring frameworks that are applicable at scale but also provide facility-level insights to guide decision making. 


Given the complexity of landfill emissions both in terms of variability and underlying causes, models are a common tool used for planning and tracking landfill methane mitigation, but past studies show potential biases in models and inventories compared to observations. In this work, we bring together both process-level insights as provided in bottom-up models and our top-down observations from the Tanager-1 satellite by (1) improving the accuracy and consistency of satellite-derived annual average emission rates and (2) developing methodologies for reconciling the two unique datasets. The goal of this work is to use satellite methane observations to identify improved bottom-up model parameters, focusing on the modeling frameworks used by national and sub-national jurisdictions.


As a point source imaging satellite, Tanager-1 is well suited for tracking emissions at landfills as it provides facility-scale methane emissions data, but existing algorithms and workflows for creating the emissions data have been primarily validated based on controlled release experiments which mimic environments more similar to the oil and gas sector than landfills. We identify methods that are robust and best suited to landfills by performing sensitivity tests for our quantification methods, testing algorithms and parameters, and identifying causes of bias unique to landfill environments (e.g., albedo, topography). The next step is translating our Tanager-1 observations to annual averages. We present a new methodology for temporally averaging satellite observations that accounts for null detects through scene-specific probability of detection limits. Finally, we compare our annual average satellite-based emission estimates to bottom-up models typically used by jurisdictions for official reporting (e.g., IPCC, LandGEM, US GHGRP), focusing on select countries where there is sufficient spatiotemporal coverage with Tanager-1. We use statistical methods to adjust parameters in the bottom-up models to reconcile the model estimates with observed emissions, allowing region-specific model parameter adjustments to account for potential climatic and meteorological factors. Finally, we discuss the implications of our initial results in terms of improvements to official national reporting and compare to inverse modeling results.

How to cite: Scarpelli, T., Cusworth, D., Kim, J., O'Neill, K., Duren, R., and Howell, K.: Using point source imaging satellite observations to guide landfill methane model improvements at the national and sub-national scale, EGU General Assembly 2026, Vienna, Austria, 3–8 May 2026, EGU26-7927, https://doi.org/10.5194/egusphere-egu26-7927, 2026.

EGU26-8459 | Posters on site | AS3.38

Validating environmental reporting of carbon emissions 

Lee Stokes, Aleksandra Przydrozna, and Valerie Livina

ESG (Environmental, Social, Governance) reporting is essential for industry as it helps secure investment for companies’ development. While Scope 1 are direct emissions and Scope 2 are indirect emissions, most of the industrial players report Scope 2 emissions from the use of energy (electricity and gas): these are carbon emissions that are emitted in the power station that uses fossil fuels (oil, coal, gas, biomass, etc.), see [1].

Conventional way to report company’s carbon emissions of Scope 2 is to obtain electrical meter readings and multiply them by the average carbon intensity of the electric grid that supplies electricity. In the UK, such carbon factors were previously published (annually) by the Department for Environment, Food, and Rural Affairs (Defra), then more recently by the Department for Energy Security and Net Zero (DESNZ). These average annual factors are approximate, and actual fuel mix of the electrical grid varies within a few minutes, depending on the operating power generators.

In some cases, the annual carbon intensity may underestimate the actual intensity of the grid. This usually happens in Europe in winter, when a large number of gas-fuelled generators are active to provide sufficient heating, and at the same time wind conditions are placid, providing little of renewable energy. In other cases, when there is lots of wind-generated energy and less gas-generated energy (for example, on a windy summer day), the average carbon factor may overestimate actual carbon intensity of the grid.

In several case studies, we demonstrate that such discrepancies may reach 10-15% of the total carbon emissions, as they are presented in quarterly or annual ESG reports. The results suggest that the current way of reporting carbon emissions should be revised, so that actual state of the dynamical energy grid would be taken into account for improvement of ESG reporting. Subsequently, this will impact their ESG standing and potential investment, which is crucial for European business as well as for the correct accounting of the impact of European carbon emissions [2].

References

[1] Livina et al, International Journal of Metrology and Quality Engineering, in revision.

[2] Livina et al, in preparation.

How to cite: Stokes, L., Przydrozna, A., and Livina, V.: Validating environmental reporting of carbon emissions, EGU General Assembly 2026, Vienna, Austria, 3–8 May 2026, EGU26-8459, https://doi.org/10.5194/egusphere-egu26-8459, 2026.

Reducing methane (CH4​) emissions through environmentally friendly agriculture, such as Alternate Wetting and Drying (AWD), is a critical strategy for climate change mitigation in rice production. To effectively implement and evaluate these mitigation measures, it is essential to monitor agricultural practices and environmental variables at a high spatial resolution. This study develops a standardized data-processing protocol, which leverages Google Earth Engine (GEE) to generate high-resolution remote sensing features necessary for quantifying CH4​ emissions.

The protocol integrates multi-sensor satellite data to capture the spatio-temporal dynamics of sustainable rice farming. Central to this protocol is the use of Sentinel-1 Synthetic Aperture Radar (SAR) data to classify water management regimes, specifically distinguishing between continuous flooding (CF) and AWD at the pixel level. Additionally, Sentinel-2 optical imagery is processed to extract key vegetation indices (e.g., NDVI, GRVI) to monitor crop growth. To address environmental factors, coarse-resolution soil moisture data from SMAP is downscaled to resolution by incorporating Sentinel-2 and Digital Elevation Model (DEM) data.

By synthesizing these multi-sensor inputs, the protocol provides the necessary foundation for mapping methane emission hotspots and assessing the impact of environmentally friendly management practices. This high-resolution approach supports the design of region-specific mitigation strategies and the advancement of climate-smart agriculture.

As for future research plans, we will apply the constructed model with the field-measured validation data to the extensive rice paddies in southern Ibaraki Prefecture in Japan to estimate methane emissions on a pixel-by-pixel basis and create hotspot maps. This enables the upscaling of a single-point observation model to a broader area while reflecting regional characteristics. This methodology is expected to serve as a powerful tool for examining highly effective methane reduction measures (such as utilization under the J-Credit system) based on each region's agricultural practices and environmental conditions.

How to cite: Shoyama, K., Hirai, C., and Den, H.: Monitoring Environmentally Friendly Agriculture for Methane Emission Reduction: A High-Resolution Multi-Sensor Remote Sensing Protocol on Google Earth Engine, EGU General Assembly 2026, Vienna, Austria, 3–8 May 2026, EGU26-8591, https://doi.org/10.5194/egusphere-egu26-8591, 2026.

EGU26-9177 | Posters on site | AS3.38

Transport model error in inverse modelling: Developments within the ITMS project 

Christoph Gerbig, Michal Galkowski, Frank-Thomas Koch, Lena Danyeli, Fabian Maier, Saqr Munassar, Yang Xu, and Christian Rödenbeck

Inverse modelling of CO2 and CH4 using atmospheric in-situ data relies on simulations of atmospheric transport that arederived from models used in numerical weather prediction. The relevant time scales for inversions range from hours to decades, which is far beyond the time scales of a few weeks for which NWP models are designed. The strong diurnal and seasonal variations in surface to atmosphere fluxes of CO2 covary with atmospheric mixing in the boundary layer, as both are solar radiation driven. This way slight seasonal or diurnal biases in the representation of mixing can be amplified. In addition, different atmospheric models show differences in vertical mixing through turbulent mixing and through moist convection, and thus in the representation of vertical gradients in tracers, which results strong differences in flux estimates from inverse modelling. These facts have been known since several decades by now, but progress in addressing these issues has been slow. Within the atmospheric network of ICOS (Integrated Carbon Observation System) additional meteorological observations are available that provide information on atmospheric mixing heights. Also, IAGOS (In-service Aircraft for a Global Observing System) provides information on vertical gradients which can be related to mixing through turbulence and convection.

ITMS, the Integrated Greenhouse gas Monitoring system for Germany, is implemented in multiple development phases: a first phase with the development of a demonstrator system, followed by the second phase, the development of a first-generation system, and a third and last phase, the transfer to operations. With each phase lasting about four years, the project provides a medium-term framework that allows also addressing some of the longer lasting problems such as transport uncertainty. Within ITMS the CarboScope Regional inversion system (CSR) is used as a reference system for CO2 and CH4 inversions, but also as a testbed for model developments. The presentation will provide an overview of recent results obtained within ITMS. This includes evaluating vertical mixing by using additional meteorological profile data or mixing height information, using additional tracers in inversions such as Radon, and confronting vertical profiles from airborne observations with model equivalents. 

How to cite: Gerbig, C., Galkowski, M., Koch, F.-T., Danyeli, L., Maier, F., Munassar, S., Xu, Y., and Rödenbeck, C.: Transport model error in inverse modelling: Developments within the ITMS project, EGU General Assembly 2026, Vienna, Austria, 3–8 May 2026, EGU26-9177, https://doi.org/10.5194/egusphere-egu26-9177, 2026.

EGU26-9574 | ECS | Orals | AS3.38

A global coal mine methane tracker to highlight inventory gaps and target mitigation 

Rebekah Horner, Sabina Assan, and Adomas Liepa

Methane (CH4) is a key short-lived climate forcer, yet robust monitoring of its anthropogenic sources remains limited by inconsistent national reporting and incomplete inventories, especially from coal mining. Global anthropogenic CH4 emissions are about 369 million tonnes per year, of which coal mine methane (CMM) contributes roughly 40 million tonnes per year, which is comparable to emissions from the gas sector. In 2023 only 15% of coal production reported annual CMM emissions in national greenhouse gas inventories and this limits the scientific basis for monitoring and verification of progress towards the Global Methane Pledge and the Paris Climate Agreement.

We present Ember’s Coal Mine Methane Data Tracker as a new open, global, evidence based dataset for understanding CMM emissions, reporting quality and methane targets. The Data Tracker compiles and harmonises national greenhouse gas inventory submissions to the United Nations Framework Convention on Climate Change (UNFCCC). It integrates these data with historic coal production statistics from the US Energy Information Administration (EIA), International Energy Agency (IEA) coal production forecasts and independent emission estimates (IEA Methane Tracker, Global Energy Monitor (GEM) Global Coal Mine Tracker).

To reconstruct national emissions from 1990 onwards, we calculate country and year specific CH4 emission intensities wherever both reported emissions and coal production exist. Emission intensity is defined as CH4 emissions (in kilotonnes) per million tonnes of coal produced. This approach also enables consistent comparison of reported emissions across countries and over time.

We fill gaps in the intensity time series using values from neighbouring years so that each country has a continuous record. We then multiply these completed intensity series by observed production to estimate unreported emissions. Ember’s gap filled series indicates that global active CMM emissions exceeded 34 million tonnes in 2023, whereas official UNFCCC inventories reported only 4.62 million tonnes, less than 14% of the inferred total. For 2024, the latest compilation of submissions implies 34.5 million tonnes of reported CMM, with underreporting of up to 21.2 million tonnes when compared with independent datasets.

We introduce a quantitative confidence score from 0 to 6 for each country’s reported CMM emissions, combining recency of UNFCCC reporting, consistency with independent estimates from both top down and bottom up approaches, and methodological robustness. Applied to major producers, this score shows that most large coal producing countries fall in the low-to-moderate confidence range, with only a small number, such as Poland (score 5), achieving higher confidence in their reported CMM inventories. 

By providing a transparent, harmonised framework for CMM monitoring, we demonstrate that systematic underreporting pervades national inventories. This gap is driven by widespread reliance on low tier IPCC methods, with 86% of reported CMM emissions relying on emission factors rather than direct measurement. Our quantitative confidence score (ranging from 0 to 6) highlights this reliance, showing that low scoring countries correlate directly with significant underestimation. This evidence necessitates the need for transparent, measurement based Monitoring, Reporting and Verification (MRV) frameworks to establish the rigorous CH4 accounting required by global climate commitments.

How to cite: Horner, R., Assan, S., and Liepa, A.: A global coal mine methane tracker to highlight inventory gaps and target mitigation, EGU General Assembly 2026, Vienna, Austria, 3–8 May 2026, EGU26-9574, https://doi.org/10.5194/egusphere-egu26-9574, 2026.

EGU26-10112 | ECS | Posters on site | AS3.38

Urban greenhouse gas monitoring across the Barcelona Metropolitan Area 

Vanessa Monteiro, Gara Villalba Mendez, Qing Luo, and Roger Curcoll Masanes

An urban greenhouse gas (GHG) monitoring network has been established in the Barcelona Metropolitan Area to support the evaluation of GHG mitigation strategies. The network currently consists of five measurement sites equipped with high-precision Picarro analysers providing continuous observations of carbon dioxide (CO2) and methane (CH4). These measurements, in combination with atmospheric modelling will be used to investigate spatial and temporal variability in urban GHG concentrations.

The five sites (Fabra, ICM, ICTA, IDAEA, and UPC-Agropolis) were strategically selected to represent a range of urban and peri-urban environments, including a natural forest, an urban coastal site, a traffic-influenced highway location on the outskirts of the city, an urban park embedded within a densely built area, and a peri-urban agricultural region. This configuration enables the assessment of how different landuse types and emission sources influence observed GHG mole fractions across the metropolitan area.

Hourly averaged CO2 mole fractions show pronounced differences between sites. Lower values are observed at the forested Fabra site, while the ICTA site, located near a major highway, exhibits the highest mole fractions and the largest variability. These spatial contrasts are consistent with results from previous multi-site measurement campaigns in Barcelona, which indicated that densely urbanized, impermeable landscapes are associated with enhanced CO2 concentrations compared to greener areas, particularly during morning hours dominated by traffic emissions.

Maintaining a continuous urban monitoring network is essential for capturing both spatial and temporal variability in GHG concentrations and for improving our understanding of urban atmospheric processes. Such observations are also critical for constraining and validating atmospheric models and for quantifying changes in emissions over time. Here, we present recent observations from the Barcelona Metropolitan Area GHG network and illustrate their application to the study of greenhouse gas variability in complex urban environments.

How to cite: Monteiro, V., Villalba Mendez, G., Luo, Q., and Curcoll Masanes, R.: Urban greenhouse gas monitoring across the Barcelona Metropolitan Area, EGU General Assembly 2026, Vienna, Austria, 3–8 May 2026, EGU26-10112, https://doi.org/10.5194/egusphere-egu26-10112, 2026.

EGU26-10768 | ECS | Posters on site | AS3.38

Forward modelling of SF6 with ICON-ART 

Maya Harms, Katharina Meixner, Tanja Schuck, Thomas Wagenhäuser, Sascha Alber, Kieran Stanley, Andreas Engel, Valentin Bruch, Thomas Rösch, Martin Steil, and Andrea Kaiser-Weiss

Sulfur hexafluoride (SF6) is a highly potent greenhouse gas (GHG). Despite its high global warming potential (GWP), it continues to be produced and used in Germany. The reported emission estimates can be used to calculate expected concentrations at measurements sites. Within the PARIS (Process Attribution of Regional Emissions) project we used the operational numerical weather prediction model ICON (ICOsahedral Nonhydrostatic) and its extension module for aerosol and trace gases (ART) as an Eulerian forward model to calculate the expected mixing concentrations response of Germany's largest point source of SF6. We compared the modelled concentration peaks that occur when the modelled plume crosses the measurement site of the Taunus observatory (TOB) with the respective observed signals (requiring background subtraction). The 4-year period of 2020-2023 was covered, and the uncertainty of the meteorological transport was estimated using a 20-member ensemble in our limited area model for Europe, which was run with a horizontal grid resolution of 6.5 km and 74 vertical levels.The model predicts well when peaks are measured but weWe found that most observed peaks at TOB are considerably higher than in the model, suggesting that prior emissions estimates were too low. 
This indicates that the independent, observation-based emission estimate of our ICON-ART based system is in the range of double-digit tons, which is considerably higher than the self-reported SF6 emission estimate for this point source, also if the model uncertainties are taken into account. 

How to cite: Harms, M., Meixner, K., Schuck, T., Wagenhäuser, T., Alber, S., Stanley, K., Engel, A., Bruch, V., Rösch, T., Steil, M., and Kaiser-Weiss, A.: Forward modelling of SF6 with ICON-ART, EGU General Assembly 2026, Vienna, Austria, 3–8 May 2026, EGU26-10768, https://doi.org/10.5194/egusphere-egu26-10768, 2026.

EGU26-11447 | ECS | Posters on site | AS3.38

Satellite-Based Estimation of Nitrous Oxide Concentration and Emission in a Large Estuary 

Wenjie Fan and Zhihao Xu

Estuaries are nitrous oxide (N2O) emission hotspots and play an important role in the global N2O budget. However, the large spatiotemporal variability of emission in complex estuary environments is challenging for large-scale monitoring and budget quantification. This study retrieved water environmental variables associated with N2O cycling based on satellite imagery and developed a machine learning model for N2O concentration estimations. The model was adopted in China’s Pearl River Estuary to assess spatiotemporal N2O dynamics as well as annual total diffusive emissions between 2003 and 2022. Results showed significant variability in spatiotemporal N2O concentrations and emissions. The annual total diffusive emission ranged from 0.76 to 1.09 Gg (0.95 Gg average) over the past two decades. Additionally, results showed significant seasonal variability with the highest contribution during spring (31 ± 3%) and lowest contribution during autumn (21 ± 1%). Meanwhile, emissions peaked at river outlets and decreased in an outward direction. Spatial hotspots contributed 43% of the total emission while covering 20% of the total area. Finally, SHapley Additive exPlanations (SHAP) was adopted, which showed that temperature and salinity, followed by dissolved inorganic nitrogen, were key input features influencing estuarine N2O estimations. This study demonstrates the potential of remote sensing for the estimation of estuarine emission estimations.

How to cite: Fan, W. and Xu, Z.: Satellite-Based Estimation of Nitrous Oxide Concentration and Emission in a Large Estuary, EGU General Assembly 2026, Vienna, Austria, 3–8 May 2026, EGU26-11447, https://doi.org/10.5194/egusphere-egu26-11447, 2026.

EGU26-11719 | ECS | Posters on site | AS3.38

Using atmospheric observations to identify point sources of halogenated trace gases 

Katharina Meixner, Dominique Rust, Tanja J. Schuck, Thomas Wagenhäuser, Fides Gad, Cedric Couret, Armin Jordan, Martin Vojta, Andreas Stohl, and Andreas Engel and the PARIS project

Measurement-based emission estimates derived from atmospheric observations provide an independent and important approach for identifying emission sources, quantifying emissions and verifying reported inventories. This is particularly relevant for halogenated gases, which due to their role as ozone depleting substances and potent greenhouse gases are regulated under various international and national frameworks. Here, we present two studies highlighting the urgency and the challenges of the measurement-based emission estimates of sulfur hexafluoride (SF6) and fluoroform (HFC-23) with a particular focus on the influence of point sources.

SF6 and HFC-23 are two of the most potent greenhouse gases with a GWP100 of approximately 24,000 and 14,700, respectively. Previous studies consistently showed a dominant emission source in southern Germany contributing to a large share of European SF6 emissions. Meixner et al., 2025 analysed emission estimates based on 22 European measurement sites revealing an underestimated SF6 emission point source in southern Germany in contrast to the national inventory reports.

Recent studies highlighted major challenges in quantifying HFC-23 emissions (Adam et al., 2024; Rust et al., 2024). We investigate the effects of intermittency in emissions and explore different possibilities based on a priori assumptions about specific emission sources. Forward calculations from these potential emission sources are used to derive expected time series at observational sites. These are compared to observations from different European stations situated in the regions influenced by the potential point sources. We present different approaches based on European atmospheric measurements combined with multiple model approaches, including ICON-ART, FLEXPART and NAME.

Adam, B., Western, L.M., Mühle, J., Choi, H., Krummel, P.B., O’Doherty, S., Young, D., Stanley, K.M., Fraser, P.J., Harth, C.M., Salameh, P.K., Weiss, R.F., Prinn, R.G., Kim, J., Park, H., Park, S., Rigby, M., 2024. Emissions of HFC-23 do not reflect commitments made under the Kigali Amendment. Commun. Earth Environ. 5, 783. https://doi.org/10.1038/s43247-024-01946-y

Meixner, K., Wagenhäuser, T., Schuck, T.J., Alber, S., Manning, A.J., Redington, A.L., Stanley, K.M., O’Doherty, S., Young, D., Pitt, J., Wenger, A., Frumau, A., Stavert, A.R., Rennick, C., Vollmer, M.K., Maione, M., Arduini, J., Lunder, C.R., Couret, C., Jordan, A., Gutiérrez, X.G., Kubistin, D., Müller-Williams, J., Lindauer, M., Vojta, M., Stohl, A., Engel, A., 2025. Characterization of German SF6 Emissions. ACS EST Air 2, 2889–2899. https://doi.org/10.1021/acsestair.5c00234

Rust, D., Vollmer, M.K., Henne, S., Frumau, A., van den Bulk, P., Hensen, A., Stanley, K.M., Zenobi, R., Emmenegger, L., Reimann, S., 2024. Effective realization of abatement measures can reduce HFC-23 emissions. Nature 633, 96–100. https://doi.org/10.1038/s41586-024-07833-y

How to cite: Meixner, K., Rust, D., Schuck, T. J., Wagenhäuser, T., Gad, F., Couret, C., Jordan, A., Vojta, M., Stohl, A., and Engel, A. and the PARIS project: Using atmospheric observations to identify point sources of halogenated trace gases, EGU General Assembly 2026, Vienna, Austria, 3–8 May 2026, EGU26-11719, https://doi.org/10.5194/egusphere-egu26-11719, 2026.

EGU26-11963 | Posters on site | AS3.38

 Bridging Science and National GHG Inventories: Insights from the PARIS Project – Process Attribution of Regional Emissions 

Sylvia Walter, Alistair Manning, Thomas Röckmann, and Anita Ganesan and the PARIS Team

Strengthening the link between scientific research and official greenhouse gas (GHG) reporting is an important step under the Paris Agreement’s Enhanced Transparency Framework. The PARIS Project, funded by Horizon Europe, is working with eight European countries to develop practical tools for this purpose.

A central innovation of PARIS is the development of draft annexes to National Inventory Documents (NIDs). These annexes provide a structured and transparent interface between official bottom-up inventories and top-down atmospheric estimates. They do not alter formal reporting rules; instead, they document how independent scientific assessments compare with inventory estimates, identify consistencies and discrepancies, and highlight where further investigation or methodological development is warranted. In this way, the annexes enable inventory compilers, policymakers, and scientists to interpret atmospheric results within the legal and institutional framework of national reporting.

The annexes are underpinned by major advances in PARIS observation and modelling capacity. Expanded and harmonised networks for CH₄, N₂O, F-gases, and aerosols, together with multi-model inverse systems and common data standards publicly available on the ICOS Carbon Portal, provide robust, traceable estimates of regional emissions and their sectoral drivers. These scientific outputs are synthesised in the annexes in a form that is directly usable by inventory agencies.

Through close engagement with national inventory teams in the UK, Switzerland, Germany, Ireland and other focus countries, PARIS has co-developed annex templates and begun populating them with results from multiple inversion systems. This process reduces barriers between the research and inventory communities and supports routine, transparent comparison of bottom-up and top-down estimates.

The poster will present the main outcomes of the PARIS project, demonstrating how the outcomes advance and embed atmospheric science in national GHG reporting to strengthen confidence in emission estimates, improve process attribution of regional emissions, and ultimately support more effective climate policy under the Paris Agreement.

How to cite: Walter, S., Manning, A., Röckmann, T., and Ganesan, A. and the PARIS Team:  Bridging Science and National GHG Inventories: Insights from the PARIS Project – Process Attribution of Regional Emissions, EGU General Assembly 2026, Vienna, Austria, 3–8 May 2026, EGU26-11963, https://doi.org/10.5194/egusphere-egu26-11963, 2026.

EGU26-12319 | ECS | Orals | AS3.38

The use of CLMS products for improving the spatialization of greenhouse gases emissions from LULUCF and agriculture sectors  

Giulia Cecili, Paolo De Fioravante, Guido Pellis, Marina Vitullo, and Angela Fiore

The Land Use, Land-Use Change, and Forestry (LULUCF) and agriculture sectors are increasingly central to global climate policy. They play a crucial role in climate mitigation strategies, as land acts as a carbon sink that needs to be enhanced and as a source of greenhouse gas (GHG) emissions that must be reduced. In the European context, the LULUCF Regulation (EU 2018/841), revised in 2023, aims for 310 Mt CO2eq net removals by 2030 and requires spatially explicit land-use representations to monitor land dynamics and assess policy impacts.

Within the Horizon project AVENGERS (Attributing and Verifying European and National Greenhouse Gas and Aerosol Emissions and Reconciliation with Statistical Bottom-up Estimates), a methodology was developed to generate an IPCC-compliant land-use map by integrating multiple Copernicus Land Monitoring Service (CLMS) products. In national GHG inventories, the operational use of spatial explicit data is often limited due to restricted temporal coverage, inconsistencies with national statistics, and challenges in interpreting mixed classes and land-use/land cover definitions. This methodology provides a transparent approach to reconcile inventory data with high-resolution spatial datasets.

The approach combines the CLC Plus Backbone geometry with CORINE Land Cover (CLC) and ancillary CLMS datasets, including the High-Resolution Layer Crop Types and Priority Areas monitoring products (e.g., Coastal Zones, Riparian Zones, and Protected areas). Multiple layers were integrated using overlay techniques and priority rules, resulting in an harmonized map at 10-m spatial resolution. CLC attributes were aggregated to IPCC land use categories, allowing direct comparison between mapped areas and inventory surfaces.

Preliminary validation involved cross-checks with national land-use activity data to ensure reliability of mapped areas across LULUCF categories. The resulting maps enable the spatialization of inventory-based LULUCF and agriculture emissions, producing gridded emission datasets based on improved spatially explicit land-use information. These datasets are suitable for use as input (priors) in atmospheric inversion modelling, a top-down emissions estimation method supporting policy evaluation.

The methodology is designed to be replicable across all European countries covered by CLMS data and to be updated approximately every 2–3 years, in line with the regular update cycle of CLMS products. The methodological framework is modular and flexible, based on a spatial data storage and management scheme developed by ISPRA, which allows the integration of additional datasets and adaptation to different territorial contexts. The approach was applied and tested in three national case studies for the year 2018—Italy, Sweden, and the Netherlands—with specific adaptations introduced to account for distinct territorial characteristics. This first implementation represents a promising step and provides a solid foundation for further refinements and future developments, supporting the production of high-resolution land-use maps helpful for national inventory agencies and inversion modelling experts.

How to cite: Cecili, G., De Fioravante, P., Pellis, G., Vitullo, M., and Fiore, A.: The use of CLMS products for improving the spatialization of greenhouse gases emissions from LULUCF and agriculture sectors , EGU General Assembly 2026, Vienna, Austria, 3–8 May 2026, EGU26-12319, https://doi.org/10.5194/egusphere-egu26-12319, 2026.

EGU26-12745 | ECS | Posters on site | AS3.38

Impact of Local-Scale Effects in Methane (CH₄) Inversions on Model-Observation Discrepancies 

Elena Zwerschke, Frank-Thomas Koch, Christoph Gerbig, Jennifer Mueller-Williams, Matthias Lindauer, Frank Keppler, and Dagmar Kubistin

Accurate estimates of greenhouse gas emissions are critical for determining the effectiveness of mitigation strategies under the Paris Agreement. These estimates are commonly derived by atmospheric inversion frameworks, which combine atmospheric transport models with in situ observations to obtain greenhouse gas fluxes. However, regional inversions are often challenged by local-scale signals in atmospheric measurements, that are insufficiently represented by the models. If not properly accounted for, these can introduce biases in inverse flux estimates undermining the reliability of emission estimates.

To address this limitation, observational data has typically been filtered for local influences before being used in inversion simulations, based on assumptions such as stable boundary conditions or wind speed. To make full use of the available dataset, we implemented an observation-dependent model-data uncertainty in the inversion optimisation process, allowing local signals to be explicitly considered. This approach has been applied to CH4 inversions over Europe using the mesoscale Jena CarboScope-Regional (CSR) system at 0.25° × 0.25° resolution.

To determine the time varying model-data uncertainty based on the local influence signal, a leave-one-out cross validation was performed for ground based in situ data of 47 atmospheric stations, excluding one station per inversion simulation. By determining the difference between modelled and observed concentrations, a model-data mismatch was estimated across station categories defined by surrounding land type. These estimates were then combined with local signal features, resulting from low wind speeds, atmospheric stability, and concentration spikes using a multivariate regression. The derived model-data mismatch function was applied to adjust the data weighting in the inversion enabling the inclusion of the observational dataset without discarding any measurements.

In this presentation, we demonstrate the potential of this novel approach to improve the robustness of regional CH4 inversions and to reduce the bias from local-scale signals.

How to cite: Zwerschke, E., Koch, F.-T., Gerbig, C., Mueller-Williams, J., Lindauer, M., Keppler, F., and Kubistin, D.: Impact of Local-Scale Effects in Methane (CH₄) Inversions on Model-Observation Discrepancies, EGU General Assembly 2026, Vienna, Austria, 3–8 May 2026, EGU26-12745, https://doi.org/10.5194/egusphere-egu26-12745, 2026.

EGU26-12776 | ECS | Posters on site | AS3.38

Quantifying European SF6 emissions (2005-2021) using a large ensemble of atmospheric inversions 

Martin Vojta, Andreas Plach, Rona L. Thompson, Pallav Purohit, Kieran Stanley, Simon O'Doherty, Dickon Young, Joe Pitt, Jgor Arduini, Xin Lan, and Andreas Stohl

Sulfur hexafluoride (SF₆) is an extremely potent (GWP100 = 24,300) and long-lived greenhouse gas whose atmospheric concentrations continue to rise due to anthropogenic emissions. Europe represents a particularly relevant test case for investigating SF₆ emissions, as successive EU F-gas regulations over the past two decades have aimed to substantially reduce emissions. A key question is whether these regulatory measures are reflected in observed emission trends and whether reported national inventories are consistent with observation-based estimates.

 In this study, we quantify European SF₆ emissions for the period 2005–2021 using a large ensemble of atmospheric inversions with a strong focus on uncertainty characterization. Uncertainties are assessed using an extensive set of sensitivity tests in which key inversion parameters are systematically varied, while final uncertainties are quantified via a Monte Carlo ensemble that randomly samples combinations of these parameters. This allows us to identify the main sources of uncertainty and to evaluate the robustness of inferred emission trends.

Our analysis focuses on countries with relatively dense observational coverage - the United Kingdom, Germany, France, and Italy - while also examining aggregated emissions for the EU-27.  The inversion results reveal declining SF₆ emissions in all studied regions except Italy, broadly consistent with the timing of EU F-gas regulations (842/2006, 517/2014). In several countries, inferred emissions exceed reported national inventories, although the agreement generally improves in more recent years. At the EU-27 scale, emissions exhibit a pronounced decline between 2017 and 2018, coinciding with a marked reduction in emissions from southwestern Germany, suggesting regional actions were taken as the 2014 regulation took effect.

Our sensitivity tests highlight the crucial role of dense and sustained atmospheric monitoring networks for robust inversion-based emission estimates. In particular, expansions of the UK observing system in 2012 and 2014 lead to significant reductions in emission uncertainties, demonstrating the importance of comprehensive observational networks in refining emission estimates.

How to cite: Vojta, M., Plach, A., Thompson, R. L., Purohit, P., Stanley, K., O'Doherty, S., Young, D., Pitt, J., Arduini, J., Lan, X., and Stohl, A.: Quantifying European SF6 emissions (2005-2021) using a large ensemble of atmospheric inversions, EGU General Assembly 2026, Vienna, Austria, 3–8 May 2026, EGU26-12776, https://doi.org/10.5194/egusphere-egu26-12776, 2026.

EGU26-14303 | ECS | Orals | AS3.38

Urban Atmospheric Monitoring and Modeling System (Urban-AMMS): A Top-Down Approach to Investigate Sources and Variability of an Inert Tracer in the Washington, DC, and Baltimore, MD, Metropolitan Area 

Miguel Cahuich-Lopez, Christopher Loughner, Fong Ngan, Anna Karion, Lei Hu, Israel Lopez-Coto, Kimberly Mueller, Julia Marrs, John Miller, Brian McDonald, Colin Harkins, Congmeng Lyu, Meng Li, Kevin Gurney, Sonny Zinn, Xinrong Ren, Mark Cohen, Howard Diamond, Ariel Stein, and James Whetstone

Accurate quantification of the sources and sinks of long-lived air pollutants is fundamental for effective emissions management, particularly in urban areas where emissions are generally more intense. Stakeholders commonly use so-called bottom-up methods to estimate emissions for urban areas. This type of emission accounting is typically carried out for annual totals, often with a latency of one or more years. Alternative methods that provide estimates with higher temporal resolution and lower latency could be helpful for stakeholders seeking targeted strategies to reduce emissions. A top-down urban emissions estimation system for the Washington, DC, and Baltimore, MD, metropolitan area, called the Urban Atmospheric Monitoring and Modeling System (Urban-AMMS), is being developed to provide accurate, up-to-date urban emissions data. Urban-AMMS has several components, including tower-based, aircraft, and mobile van measurements platforms, whose data are assimilated by the CarbonTracker-Lagrange analytical inverse model; an ensemble of HYSPLIT backward dispersion simulations driven by in-house high-resolution WRF simulations (spatial resolution of 1 km) enhanced with urban meteorological observations; biospheric models; and bottom-up inventories used for a prior estimate of emissions in the domain. The inversion system is tailored to account for the underlying variability in urban fluxes of an inert tracer (CO2) by solving for hourly fluxes and incorporating explicit spatiotemporal covariance of prior errors, as well as high-resolution source-receptor sensitivities estimated by WRF-HYSPLIT. Here, we present an overview of Urban-AMMS, including initial results and sensitivity analyses to investigate the effects of prior spatial aggregation, background handling, and the temporal covariance of prior errors. Numerical experiments show improvements in estimates of urban surface fluxes at both the city and grid cell scales. Still, the reliability of inverse fluxes depends on prior uncertainty, as observed in previous studies. These findings provide critical insights for the inverse estimation of long-lived air pollutants in complex urban environments.

How to cite: Cahuich-Lopez, M., Loughner, C., Ngan, F., Karion, A., Hu, L., Lopez-Coto, I., Mueller, K., Marrs, J., Miller, J., McDonald, B., Harkins, C., Lyu, C., Li, M., Gurney, K., Zinn, S., Ren, X., Cohen, M., Diamond, H., Stein, A., and Whetstone, J.: Urban Atmospheric Monitoring and Modeling System (Urban-AMMS): A Top-Down Approach to Investigate Sources and Variability of an Inert Tracer in the Washington, DC, and Baltimore, MD, Metropolitan Area, EGU General Assembly 2026, Vienna, Austria, 3–8 May 2026, EGU26-14303, https://doi.org/10.5194/egusphere-egu26-14303, 2026.

EGU26-14957 | Orals | AS3.38

Quantifying N₂O Flux over the EU27+3 Region Using CIF-CHIMERE Model for 2005–2023 

Tianqi Shi, Antoine Berchet, and Philippe Ciais

Nitrous oxide (N₂O) is the third most important long-lived greenhouse gas after CO₂ and CH₄, yet large uncertainties remain in its regional emission estimates. In this study, we apply the regional inverse modeling system CIF-CHIMERE to quantify N₂O surface fluxes over the EU27+3 region (European Union, United Kingdom, Norway, and Switzerland) for the period 2005–2023, providing a long-term and high spatiotemporal resolution assessment of N2O fluxes. The inversion is primarily constrained by in situ atmospheric N₂O measurements from the ICOS (Integrated Carbon Observation System) ground-based station network across Europe, and uses the CIF-CHIMERE transport model coupled with a four-dimensional variational (4D-Var) data assimilation framework to estimate posterior N2O fluxes. For 2005–2023, inversions are conducted at a spatial resolution of 0.5° × 0.5°, while for 2018–2023 the resolution is refined to 0.2° × 0.2°. In both configurations, hourly surface fluxes are estimated, enabling analysis of diurnal, seasonal, and interannual variability. The inversions significantly improve the representation of localized emission patterns and short-term flux dynamics. Overall, the results provide a top-down dataset for evaluating bottom-up inventories and for improving the understanding of regional and temporal variability in N₂O emissions across EU27+3.

How to cite: Shi, T., Berchet, A., and Ciais, P.: Quantifying N₂O Flux over the EU27+3 Region Using CIF-CHIMERE Model for 2005–2023, EGU General Assembly 2026, Vienna, Austria, 3–8 May 2026, EGU26-14957, https://doi.org/10.5194/egusphere-egu26-14957, 2026.

EGU26-15692 | ECS | Posters on site | AS3.38

CH4 emissions in Vietnamese Rice Agriculture: Benchmarking process-based model approaches (Tier 3) against Tier 1/2 Estimates 

Chien Nguyen, David Kraus, Tanh Nguyen, Reiner Wassmann, Klaus Butterbach-Bahl, Thi Bach Thuong Vo, Van Trinh Mai, Thi Phuong Loan Bui, and Ralf Kiese

Rice cultivation is the largest source of methane (CH4) emissions in Vietnam’s agricultural sector, making accurate quantification of these emissions critical for national GHG inventories and the design of mitigation policies. Currently, for UNFCCC GHG reporting, Vietnam primarily employs IPCC Tier 2 approaches using national emission factors combined with Tier 1 scaling factors. With the implementation of large-scale mitigation projects and Vietnam’s ambition to achieve Net Zero by 2050, Methane Global Pledge commitment by 2030, and joining international carbon markets, there is an urgent need to transition towards higher-tier methodologies. However, also process-based model (Tier 3) outputs are associated with uncertainty, which needs to be benchmarked first with established Tier 1 and 2 emission estimates.

In this study, CH4 emission data from 13 Vietnamese field experiments are split into two groups—one with comprehensive management information (sufficient data) and one with sparse information (limited data)—to test IPCC Tier methods under different activity data conditions. Furthermore, for Tier 3, an inter-comparison is conducted between two biogeochemical models, DNDC and LandscapeDNDC. The evaluation focuses on the performance in estimating rice yields, seasonal CH4 emissions, and daily flux dynamics, while also analyzing the impact of different model parameterization and simulation setups.

Our evaluation shows that Tier 1 significantly underestimates CH4 emissions, whereas Tier 2 provides a substantial improvement and remains robust across varying soil and management conditions. In contrast, Tier 3 outperforms Tier 2 only when comprehensive management data is available, reflecting its distinctive capacity to represent daily emission dynamics and management-driven peaks.  Consequently, while Tier 2 remains a practical choice for national inventories, Tier 3 is essential for high-resolution mitigation assessments, particularly for large-scale emission reduction evaluations where detailed management data are comprehensively collected and systematically organized. The process-based model comparison reveals that while DNDC and LandscapeDNDC show similar performance under continuous flooding, they diverge significantly under Alternate Wetting and Drying (AWD) regimes. These discrepancies are primarily attributed to the models' different concepts of representing water table fluctuations.

Building on these results, the Tier 3 approach of LandscapeDNDC was integrated into the web‑based LUI‑RICE platform (https://ldndc.online/rice/). This makes GHG quantification for Vietnamese rice cultivation directly accessible to local stakeholders and policymakers, translating the scientific findings of this study into a practical decision-support application.

How to cite: Nguyen, C., Kraus, D., Nguyen, T., Wassmann, R., Butterbach-Bahl, K., Vo, T. B. T., Mai, V. T., Bui, T. P. L., and Kiese, R.: CH4 emissions in Vietnamese Rice Agriculture: Benchmarking process-based model approaches (Tier 3) against Tier 1/2 Estimates, EGU General Assembly 2026, Vienna, Austria, 3–8 May 2026, EGU26-15692, https://doi.org/10.5194/egusphere-egu26-15692, 2026.

EGU26-15734 | Orals | AS3.38

ΔXCO/ΔXCO2 characteristics over coal-fire areas in Xinjiang, China using a portable EM27/SUN FTIR spectrometer 

Qiansi Tu, Jiaxin Fang, Frank Hase, André Butz, África Barreto, Omaira García, and Kai Qin

Long-term coal spontaneous combustion (CSC) represents a severe and persistent threat, resulting in substantial waste of energy resources, significant environmental degradation, and serious risks to human health and safety. To better understand the emission characteristics of CSC, we conducted ground-based measurements of XCO₂, XCH₄, XCO and aerosol optical depth (AOD) using a Fourier-transform infrared spectrometer (EM27/SUN) within the COCCON network, in the Wugonggou coal-fire region near Fukang, Xinjiang.

Our results indicate that TROPOMI satellite data systematically underestimated XCO, with a mean bias of 4.53 ± 5.53 ppb (4.54%). For distinct enhancement events observed by COCCON, ΔXCO₂ and ΔXCO exhibit a strong correlation (R² = 0.6082), with a slope of 9.782 ppb/ppm (9.782 × 10⁻³ ppm/ppm). This value is lower than the CAMS inventory ratio of 13.52 × 10⁻³. This discrepancy arises primarily from their distinct spatial representativeness. The COCCON instrument, located within the coal fire region, captures intense local combustion emission. In contrast, the CAMS product represents a daily average over a much larger model grid cell, which dilutes strong local point sources like coal fires within a broader regional background. Additionally, correlation analysis shows that ΔXCO is more closely linked to AOD (R² = 0.2283) than either ΔXCO₂ or ΔXCH₄, underscoring the distinct behavior of CO in coal-fire plumes.

How to cite: Tu, Q., Fang, J., Hase, F., Butz, A., Barreto, Á., García, O., and Qin, K.: ΔXCO/ΔXCO2 characteristics over coal-fire areas in Xinjiang, China using a portable EM27/SUN FTIR spectrometer, EGU General Assembly 2026, Vienna, Austria, 3–8 May 2026, EGU26-15734, https://doi.org/10.5194/egusphere-egu26-15734, 2026.

EGU26-16089 | Orals | AS3.38

National-scale methane emissions in South Korea (2010–2021): insights from multiple inversion systems  

Samuel Takele Kenea, Daegeun Shin, Wonick Seo, Sunran Lee, Fenjuan Wang, Shamil Maksyutov, Rajesh Janardanan, Soojeong Lee, Dmitry A. Belikov, Prabir K. Patra, Nicole Montenegro, Antoine Berchet, Marielle Saunois, Adrien Martinez, Ruosi Liang, Yuzhong Zhang, Ge Ren, Hong Lin, Sara Hyvärinen, and Aki Tsuruta and the Sangwon Joo, Sumin Kim

Accurate estimation of methane (CH₄) emissions is essential for assessing mitigation progress, 
yet substantial uncertainties persist at the national scale. In South Korea, CH₄ emissions are 
predominantly anthropogenic, with the waste and agricultural sectors contributing 
approximately 82% of total national emissions. This study analyzes national-scale CH₄ 
emission estimates for South Korea during 2010–2021 using multiple atmospheric inversion 
systems participating in the Methane Inversion Inter-Comparison for Asia (MICA) project. 
Results from inversions using only in situ observations indicate that prior emissions over South 
Korea were likely overestimated. Prior estimates range from 1.5 to 1.7 Tg yr⁻¹ for most years, 
whereas posterior emissions are, on average, about 15% lower than the prior estimates. A 
notable exception is the LMDZ inversion model, which yields posterior estimates that are 40
67% lower than prior values. This substantial reduction is primarily associated with the waste 
sector. Sectoral attribution reveals substantial inter-model differences. LMDZ shows a 
decreasing waste-sector emission trend in Exp. 1 but an increasing trend when only satellite 
observations are assimilated (Exp. 2), whereas the STILT-based inversion consistently 
indicates increasing waste-sector emissions. Given that the waste sector dominates national 
CH₄ emissions, these discrepancies strongly influence total emission estimates. The prior 
waste-sector emissions, derived from EDGAR v7, exceed those reported in South Korea’s 
national greenhouse gas inventory (GIR), contributing to the observed overestimation. 
Additionally, the inversion-derived posterior estimates consistently indicate an overestimation 
of prior agricultural emissions during the summer months. Model performance evaluation over 
the region of interest indicates varying levels of agreement between simulated and observed 
CH₄ mole fractions, with correlation coefficients ranging from 0.24 to 0.85 and posterior biases 
ranging from −65.6 to 0.34 ppb, highlighting the choice of transport model is important. Overall, 
this study highlights the value of multi-model inversion inter-comparisons for constraining 
national-scale CH₄ emissions, diagnosing sector-specific uncertainties, and identifying 
structural differences among inversion frameworks that can guide future improvements. 

How to cite: Takele Kenea, S., Shin, D., Seo, W., Lee, S., Wang, F., Maksyutov, S., Janardanan, R., Lee, S., Belikov, D. A., Patra, P. K., Montenegro, N., Berchet, A., Saunois, M., Martinez, A., Liang, R., Zhang, Y., Ren, G., Lin, H., Hyvärinen, S., and Tsuruta, A. and the Sangwon Joo, Sumin Kim: National-scale methane emissions in South Korea (2010–2021): insights from multiple inversion systems , EGU General Assembly 2026, Vienna, Austria, 3–8 May 2026, EGU26-16089, https://doi.org/10.5194/egusphere-egu26-16089, 2026.

EGU26-16769 | Posters on site | AS3.38

Improving the Accuracy of CO₂ Emission Estimates over South Korea Using a Top-down Inversion Framework 

Ho Yeon Shin, Daegeun Shin, Samuel Takele Kenea, Sunran Lee, Sumin Kim, and Yun Gon Lee

The international community has continuously monitored carbon emissions by publishing National Inventory Reports (NIRs) under the Paris Agreement adopted in 2015 to address the climate crisis. However, current emission estimation methods predominantly rely on bottom-up approaches based on statistical information, which are subject to limitations, including the potential omission of emission sources and the long time required for emission compilation. To overcome these limitations, top-down approaches that estimate emissions using meteorological models and observed atmospheric greenhouse gas concentrations have recently gained increasing attention. This approach has been adopted as a scientific methodology of the Integrated Global Greenhouse Gas Information System (IG3IS), developed under the auspices of the World Meteorological Organization (WMO), and is regarded as a complementary alternative to conventional emission inventories. In this study, carbon dioxide (CO₂) emissions over South Korea were estimated using a top-down approach based on the Stochastic Time-Inverted Lagrangian Transport Model (STILT) and observations from WMO/Global Atmosphere Watch (GAW) stations, and their accuracy was evaluated. The STILT-based inversion results indicate that anthropogenic CO₂ emissions in South Korea for 2019 amount to 589.7 Mt yr⁻¹, which is 83.6 Mt yr⁻¹ lower than the estimate reported in the existing NIR. The downward correction is primarily concentrated in Seoul and the surrounding metropolitan region. Furthermore, to account for the spatial characteristics of CO₂ emission distributions, high-resolution and realistic emission estimates were derived for regions with dense point-source emissions using the Weather Research and Forecasting (WRF) model. The application of top-down approaches for greenhouse gas emission estimation in East Asian countries, together with continuous technological advancement, is expected to provide a scientific foundation for improving the reliability of emission estimates and supporting future climate crisis response strategies.

How to cite: Shin, H. Y., Shin, D., Kenea, S. T., Lee, S., Kim, S., and Lee, Y. G.: Improving the Accuracy of CO₂ Emission Estimates over South Korea Using a Top-down Inversion Framework, EGU General Assembly 2026, Vienna, Austria, 3–8 May 2026, EGU26-16769, https://doi.org/10.5194/egusphere-egu26-16769, 2026.

EGU26-17209 | Posters on site | AS3.38

Development and Application of a Cryogenic Preconcentration System for Halogenated Greenhouse Gas Measurements in Korea 

Joo-Ae Kim, Sunggu Kang, Dohyun Kwon, Sunyoung Park, Soojeong Lee, and Sumin Kim

East Asia represents a major source region of greenhouse gas emissions associated with rapid industrialization and increasing energy demand. Among these emissions, halogenated synthetic greenhouse gases such as HFCs and PFCs, which have been widely used as substitutes following international regulations for ozone layer protection, are characterized by high global warming potentials (GWPs).

In South Korea, halogenated greenhouse gases have been monitored at the Gosan station on Jeju Island using the MEDUSA system of the AGAGE network.  However, the expansion of observational coverage and the establishment of measurement capabilities remain essential to better characterize regional emission signals.  In this study, a cryogenic preconcentration and analysis capability for halogenated greenhouse gases (NIMS-preconcentrator) was developed and and evaluate its capability for monitoring halogenated greenhouse gases.

The analytical setup includes a cryogenic thermal desorption (TD) unit and a pre-concentration trap capable of reaching temperatures down to −170 °C, integrated with an automated valve control module and gas chromatography–mass spectrometry (GC–MS). Measurements were conducted using an offline canister-based sampling approach. Analysis of ambient air samples collected at Anmyeondo (GAW station) resolved about ten halogenated greenhouse gas species, including HFC-134a, HFC-125, and legacy chlorofluorocarbons such as CFC-11 and CFC-12. Concentrations were evaluated using calibration standards, and ongoing performance assessment is conducted using laboratory working standards employed at the Gosan AGAGE station.

This study aims to establish a new measurement capability for halogenated greenhouse gases and to assess its consistency with international observation. Continued operation of this system will support the accumulation of long-term observational datasets and facilitate regional-scale analysis and inter-comparison of high-GWP halogenated greenhouse gases in Northeast Asia.

How to cite: Kim, J.-A., Kang, S., Kwon, D., Park, S., Lee, S., and Kim, S.: Development and Application of a Cryogenic Preconcentration System for Halogenated Greenhouse Gas Measurements in Korea, EGU General Assembly 2026, Vienna, Austria, 3–8 May 2026, EGU26-17209, https://doi.org/10.5194/egusphere-egu26-17209, 2026.

EGU26-17591 | Posters on site | AS3.38

High-resolution direct GHG emission estimation and simulation from residential space heating using open data  

Kirsten v. Elverfeldt, Gefei Kong, Veit Urlich, Maria Martin, Moritz Schott, and Sebastian Block

Residential space heating remains a major source of greenhouse gas emissions in the building sector. In Germany, space heating accounts for the largest share of residential energy consumption, and accurate quantification of associated emissions is essential to meet national climate mitigation targets.

Most research on residential heating emissions focuses on the regional or national levels, while estimates at finer spatial scales remain limited. Data availability further constrains the transferability and usability of current models. Consequently, approaches that deliver spatially and temporally detailed emission estimates and interactive tools to support analysis and decision-making by stakeholders are urgently needed.

We introduce the Climate Action Navigator (CAN), a dashboard for the analysis and visualization of climate mitigation and adaptation spatial data, based entirely on open science principles. One of the tools available in the CAN estimates carbon dioxide emissions from residential heating at fine spatial at temporal scales. The tool applies a bottom-up accounting methodology at 100 m spatial resolution based on publicly available census and building characteristics data in Germany, including building age and dominant energy carriers. The resulting emission estimates are consistent with official city- and national-level inventories, confirming methodological reliability. Germany-wide analyses reveal strong spatial heterogeneity in energy consumption and emissions that correlate with urban morphological characteristics.

Temporal dynamics are captured through an hourly simulation using the Demand Ninja model based on local weather data. The resulting temporal emission patterns can support inverse emission modelling applications as well as aid energy management by, for example, revealing peak heating demand times and locations.

Results are delivered via the CAN interface as intuitive, interactive maps and charts that allow users to compare across neighborhoods, explore temporal emission dynamics, and assess potential mitigation actions. By integrating open-source data with high-resolution modeling and visualization, the Climate Action Navigator bridges the gap between scientific emission quantification and practical decision making. The approach supports transparent attribution and tracking of residential space-heating emissions, thereby advancing evidence-based climate mitigation planning.

How to cite: v. Elverfeldt, K., Kong, G., Urlich, V., Martin, M., Schott, M., and Block, S.: High-resolution direct GHG emission estimation and simulation from residential space heating using open data , EGU General Assembly 2026, Vienna, Austria, 3–8 May 2026, EGU26-17591, https://doi.org/10.5194/egusphere-egu26-17591, 2026.

EGU26-19274 | ECS | Posters on site | AS3.38

Carbon dioxide and methane emissions from a network of thirty eddy-covariance sites in the Netherlands 

Ignacio Andueza Kovacevic, Laurent Bataille, Isabel Cabezas, Freek Engel, Wietse Franssen, Corine van Huissteden, Ronald Hutjes, Ruchita Ingle, Wilma Jans, Tan JR Lippmann, Jeferson Zerrudo, Hong Zhao, Reinder Nouta, and Bart Kruijt

Understanding the temporal dynamics and controls on greenhouse gas exchange between terrestrial ecosystems and the atmosphere is critical for advancing process-level understanding and informing national greenhouse gas budgets and inventories. A large portion of soils in the Netherlands are either drained or restored peatlands, where the high carbon/organic matter content is accompanied by large risk of carbon loss to the atmosphere through enhanced soil respiration (drained sites) and/or enhanced methane emissions (rewetted sites). For this reason, increasing attention is being paid to understanding and quantifying the greenhouse gas budgets of both drained and restored peatland sites across the Netherlands. 
 
To both inform national GHG inventories and improve our understanding of site scale process, we present a multi-site analysis of a network of more than thirty eddy-covariance sites in the Netherlands. We discuss the daily, seasonal, and annual variability of carbon dioxide (CO₂) and methane (CH₄) fluxes measured at these sites. These sites include intensively managed grasslands, arable fields, semi-natural pastures, forested peatlands, wetlands and marshes. These sites encompass a wide range of vegetation types, soil characteristics, and water-management practices, with continuous or semi-continuous high-frequency flux datasets extending across multiple years within the last decade.
 
We quantify daily, seasonal, and annual CO₂ and CH₄ fluxes and discuss key biophysical drivers, including soil composition and moisture, vegetation dynamics, groundwater levels, and the impacts of climate anomalies such as temperature and precipitation extremes across varying timescales. We discuss differences between sites and potential impacts of soil characteristics, vegetation, land management, and recent climate anomalies.
 
Our analysis indicates substantial variability in both CO₂ and CH₄ fluxes across sites and seasons. These results highlight the invaluable contributions of both high-resolution flux observations and rigorous data processing methods when disentangling ecosystem controls on gas exchange. These flux observations provide much needed empirical constraints for model evaluation and can facilitate improved representation of peatland and wetland systems in greenhouse gas inventories and process-based models.

How to cite: Andueza Kovacevic, I., Bataille, L., Cabezas, I., Engel, F., Franssen, W., van Huissteden, C., Hutjes, R., Ingle, R., Jans, W., Lippmann, T. J., Zerrudo, J., Zhao, H., Nouta, R., and Kruijt, B.: Carbon dioxide and methane emissions from a network of thirty eddy-covariance sites in the Netherlands, EGU General Assembly 2026, Vienna, Austria, 3–8 May 2026, EGU26-19274, https://doi.org/10.5194/egusphere-egu26-19274, 2026.

EGU26-19514 | Orals | AS3.38

Towards accurate quantification of New Zealand’s methane emissions from waste and agriculture 

Peter Sperlich, Christian Stiegler, Alex Geddes, Hamish Sutton, Brendon Smith, Molly Leitch, Sally Gray, Gordon Brailsford, Rowena Moss, Beata Bukosa, Sara Mikaloff-Fletcher, Amir Pirooz, Richard Turner, Jocelyn Turnbull, Johannes Laubach, Suzanne Rowe, Lorna McNaughton, Olivia Spaans, Kevan Brian, and Ellen Wymei

Methane emissions from waste and agriculture account for 46.6 % of Aotearoa New Zealand’s (ANZ) gross greenhouse gas emissions in 2023. Despite the significance of methane emissions, the only way to estimate their magnitude is based on emission factor methods, which include large uncertainties.  We present newly developed tools to directly measure methane emissions from wastewater treatment facilities, animal effluent storage systems and herds of dairy cows. We deploy in situ analysers on mobile observation platforms (vehicle and drone) and quantify methane emission fluxes using the tracer gas technique.  The accuracy of this method is estimated in multiple ways: i) a controlled release experiment, ii) through comparison to a mass-balance modelling approach, iii) through comparison to co-located chamber measurements for methane emissions from effluent ponds, iv) through comparison to co-located measurements of animal emissions using the “GreenFeed” technique. The comparisons show excellent agreement, providing much needed assurance of analytical performance to our mobile techniques. Our tools support ANZ’s farmers and waste managers to better understand current emissions, as well as to assess the efficacy of investments into emission mitigation. Additional tests explore new isotope techniques with the goal to quantify methane fluxes from different components within a plant, for example methane derived from digestors versus methane derived from biosolids in wastewater treatment systems, or methane from the open face of a landfill versus emissions from an area that is covered.

How to cite: Sperlich, P., Stiegler, C., Geddes, A., Sutton, H., Smith, B., Leitch, M., Gray, S., Brailsford, G., Moss, R., Bukosa, B., Mikaloff-Fletcher, S., Pirooz, A., Turner, R., Turnbull, J., Laubach, J., Rowe, S., McNaughton, L., Spaans, O., Brian, K., and Wymei, E.: Towards accurate quantification of New Zealand’s methane emissions from waste and agriculture, EGU General Assembly 2026, Vienna, Austria, 3–8 May 2026, EGU26-19514, https://doi.org/10.5194/egusphere-egu26-19514, 2026.

EGU26-19832 | ECS | Orals | AS3.38

Can observation-based atmospheric mixing state reduce filtering sensitivity in GHG inversions? Lessons from the UK GEMMA programme 

Dafina Kikaj, Peter Andrews, Alexandre Danjou, Alistair Manning, Matt Rigby, Ed Chung, Grant Forster, Angelina Wenger, Chris Rennick, Emmal Safi, Simon O’Doherty, Kieran Stanley, Joe Pitt, and Tom Gardiner

Uncertainty in atmospheric transport models, especially boundary-layer mixing and turbulence, still limits confidence in top-down GHG emission estimates. In inversion workflows, observation selection is commonly supported by empirically tuned filters based on modelled meteorological variables (e.g., boundary-layer height, wind speed). The selection prioritises periods when transport is expected to be well represented. This motivates continued work to characterise atmospheric mixing and its associated uncertainties using observations.

In the UK GEMMA programme, we investigate whether observation-based atmospheric mixing state can provide complementary information to support uncertainty characterisation in UK CH₄ inversions. We demonstrate the framework at UK sites with radon measurements and at a newly instrumented site in Scotland where only meteorological measurements are available. Where radon is measured, we use it as an independent tracer of near-surface mixing and compare observed radon with radon simulated using the Met Office NAME dispersion model and a radon flux map. This comparison is used to define transport-performance classes (periods of relatively better vs poorer agreement) and associated atmospheric mixing state. At the Scotland site, we derive atmospheric mixing regimes from in situ meteorological measurements alone, using a vertical profile sampled every 10 m to characterise stratification and mixing.

We show how the resulting atmospheric mixing state and transport-performance classes can be used in two operational ways: (i) as additional information to support observation selection alongside existing practice, and (ii) to define regime-dependent uncertainty characterisation within inversion frameworks rather than assuming a single fixed error model. We illustrate the approach using two UK CH₄ inverse methods (InTEM and RHIME) and discuss how observation-based mixing information can improve transparency and reproducibility in hybrid (inventory + atmospheric) emissions estimation for IG3IS-aligned information services.

How to cite: Kikaj, D., Andrews, P., Danjou, A., Manning, A., Rigby, M., Chung, E., Forster, G., Wenger, A., Rennick, C., Safi, E., O’Doherty, S., Stanley, K., Pitt, J., and Gardiner, T.: Can observation-based atmospheric mixing state reduce filtering sensitivity in GHG inversions? Lessons from the UK GEMMA programme, EGU General Assembly 2026, Vienna, Austria, 3–8 May 2026, EGU26-19832, https://doi.org/10.5194/egusphere-egu26-19832, 2026.

EGU26-20089 | Posters on site | AS3.38

From GHG Observations to Actionable Climate Information Services 

Daphne Kitsou, Parakevi Chantzi, Dimitrios Gkoutzikostas, Vasileios Rousonikolos, Georgios Galanis, Argiro Papastergiou, and Georgios Zalidis

Effective climate mitigation requires obtaining greenhouse gas (GHG) information and accounting that is scientifically robust and actionable for decision-making. The CARBONICA project has developed and implemented a robust climate-positive action plan for carbon farming implementation across the widening countries of Greece, Cyprus and North Macedonia, generating climate information services that operate at regional, national, and international scales. An extended management practices inventory has been developed and implemented in pilot sites across 15 crops between the 3 countries, fully aligned with the IPCC, the Natural Climate Solutions World Atlas, the GHG Protocol, and climate related EU laws and initiatives. GHG accounting is supported by a robust MRV system combining soil sampling, field inputs following IPCC Scope guidance, and management practices, covering direct, indirect, and upstream emissions across the farm system, with all procedures are fully compliant with ISO 14064-2. Farm-level data are also collected using the validated Field Diagnostic Toolbox, which includes soil CO₂ flux monitoring using spectroscopy to support accurate assessment of emissions and carbon removals.

This enables explicit attribution of emissions and carbon removals to farms, regions, and in general, the agrifood sector, supporting monitoring, reporting and validating of mitigation measures for positive climate action. LCA modelling on a pilot site (1ha peach orchard) has shown significant results in emissions reductions and carbon removals. The model was used once on the baseline (business-as-usual scenario) in 2024, and once after the management practices no- till and residues incorporation were implemented in the orchard, for the year 2025. The total greenhouse gas emissions from the pilot peach orchard decreased from 2,660 kg CO₂e in 2024 to 1,280 kg CO₂e in 2025, with emissions per ton of produced fruit dropping from 147.63 kg CO₂e to 71.04 kg CO₂e. Beyond the reduction of the emission sources, the demonstrated change in the soil carbon stock was also significant. While the 2024 cultivation season showed a net-zero change compared to the baseline scenario, the implementation of no-till and crop residue incorporation during the 2025 season created an active carbon sink, resulting in a net removal of 597.76 kg of CO₂e from the atmosphere into the soil. Thus, the project successfully demonstrated a twofold climate benefit: a major reduction in operation emissions and a significant sequestration of atmospheric carbon into the soil.

The results presented above are part of a third-party validated carbon farming project, facilitated through CARBONICA. This work also contributes to IG3IS-aligned applications demonstrating the operational use of multi-source GHG observations for real-world solutions in carbon farming.

How to cite: Kitsou, D., Chantzi, P., Gkoutzikostas, D., Rousonikolos, V., Galanis, G., Papastergiou, A., and Zalidis, G.: From GHG Observations to Actionable Climate Information Services, EGU General Assembly 2026, Vienna, Austria, 3–8 May 2026, EGU26-20089, https://doi.org/10.5194/egusphere-egu26-20089, 2026.

EGU26-20826 | ECS | Orals | AS3.38

Daily and 1/16 degree maps of CO2 fossil fuel emissions based on satellite retrievals of pollutant atmospheric data 

Alexandre Héraud, Frédéric Chevallier, Grégoire Broquet, Philippe Ciais, Adrien Martinez, and Anthony Rey-Pommier

In the context of the Paris Agreement on climate change and of a global effort to reduce greenhouse gas emissions, the monitoring of anthropogenic carbon dioxide (CO2) emissions is needed to assist policy makers but represents a major challenge. While current inventories provide rather robust annual emission totals at country scale, they lag behind real time by many months and they lack spatial and sub-annual details. Here we map the daily surface fossil fuel CO2 emissions at a 1/16 degree resolution over Europe, with the year 2021 as an example, based on spaceborne atmospheric composition observations.

As the high-resolution satellite monitoring of atmospheric CO2 remains challenging, especially at a local spatial scale and a daily time scale, we take advantage of the co-emission of CO2 and nitrogen oxides (NOX) during fossil fuel combustion: we exploit images of nitrogen dioxide (NO2) concentrations retrieved from the measurements of the Tropospheric Monitoring Instrument (TROPOMI) onboard the Sentinel-5P satellite.

From the TROPOMI NO2 concentrations, we retrieve daily maps of NOX emissions based on the divergence of the mass fluxes within the NO2 images. We combine the changes of these maps from one year to the next with low latency national CO2 emissions from Carbon Monitor (https://carbonmonitor.org/), and with a baseline of monthly spatially-distributed CO2 emissions for a previous year (here 2020) from GridFED (https://mattwjones.co.uk/co2-emissions-gridded/) from which we removed aviation and shipping emissions beforehand.

The resulting maps of emission increments from 2020 to 2021 capture changes in highly emitting areas: major urban or industrial areas, and main transport corridors. The emissions for the year 2021 show good consistency with existing inventories. The dataset also produces realistic seasonal variability at a local scale and captures daily variability, although temporally smoothed due to a 5-day rolling average of Carbon Monitor data.

This method is both temporally and spatially scalable and can therefore be extended to the entire world and to additional years, which provides encouraging prospects for the continuation of this work.

How to cite: Héraud, A., Chevallier, F., Broquet, G., Ciais, P., Martinez, A., and Rey-Pommier, A.: Daily and 1/16 degree maps of CO2 fossil fuel emissions based on satellite retrievals of pollutant atmospheric data, EGU General Assembly 2026, Vienna, Austria, 3–8 May 2026, EGU26-20826, https://doi.org/10.5194/egusphere-egu26-20826, 2026.

Quantitative evidence is increasingly required to assess the mitigation potential of cities in achieving global carbon neutrality. However, although urban green spaces contribute simultaneously through biophysical carbon sequestration and reductions in energy demand driven by urban heat island mitigation, few studies have systematically compared and evaluated these two effects within a unified framework at the global scale.This study quantifies the total contribution of urban green spaces to carbon neutrality across global cities and decomposes this contribution into carbon sequestration and cooling driven energy savings, assessing their relative importance and spatial patterns.The urban heat island effect is estimated using remote sensing derived land surface temperature differences between urban and non urban areas, while carbon sequestration by urban green spaces is simultaneously quantified based on satellite based observations.These two contributions are then integrated and compared. Furthermore, this study examines how the relative importance of the two effects varies across major climate zones and how heterogeneity manifests in distinct spatial patterns. Finally, this study investigates how vegetation related indicators, socio economic variables, and urban structural characteristics influence the two effects across climate zones with AI based approaches and identify contextual conditions under which the mitigation benefits of urban green spaces are amplified or attenuated even under similar urban green space availability.This study provides a global assessment of the contribution of urban green spaces to carbon neutrality and offers empirical evidence to support the design of climate and context specific nature based mitigation strategies in cities.

How to cite: Kim, S. and Choi, Y.: The dual role of urban green spaces in carbon neutrality: carbon sequestration and cooling driven energy savings at the global scale, EGU General Assembly 2026, Vienna, Austria, 3–8 May 2026, EGU26-20959, https://doi.org/10.5194/egusphere-egu26-20959, 2026.

EGU26-22515 | Orals | AS3.38 | Highlight

Assessing the accuracy of the Climate Trace global vehicular and power plant CO2 emissions 

Kevin Gurney, Bilal Aslam, Pawlok Dass, Lech Gawuc, Toby Hocking, Jarrett Barber, and Anna Kato

Accurate estimation of greenhouse gas (GHG) emissions at the infrastructure scale remains essential to climate science and policy applications. Powerplant and vehicle emissions often form the majority of fossil fuel CO2 (FFCO2) emissions in much of the world at multiple scales. Climate Trace, co-founded by former U.S. Vice President Al Gore, is a new AI-based effort to estimate pointwise and roadway-scale GHG emissions, among other sectors. However, limited independent peer-reviewed assessment has been made of this dataset. Here, we update a previous analysis of Climate Trace powerplant FFCO2 emissions in the U.S. and present a new analysis of Climate Trace urban on-road CO2 emissions in U.S. urban areas. This is done through comparison to an atmospherically calibrated, multi-constraint estimates of powerplant and on-road CO2 emissions from the Vulcan Project (version 4.0).

Across 260 urban areas in 2021, we find a mean relative difference (MRD) of 69.9% in urban inroad FFCO2 emissions. Furthermore, differing versions of the Climate Trace on-road emissions releases shift from over to under-estimation in almost equal magnitudes. These large differences are driven by biases in Climate Trace’s machine learning model, fuel economy values, and fleet distribution values. An update to the powerplant FFCO2 emissions analysis (from a 2024 paper) show both improved and degraded convergence of emissions. We continue to recommend that sub-national policy guidance or climate science applications using the GHG emissions estimates in these sectors made by Climate Trace should be done so with caution.

How to cite: Gurney, K., Aslam, B., Dass, P., Gawuc, L., Hocking, T., Barber, J., and Kato, A.: Assessing the accuracy of the Climate Trace global vehicular and power plant CO2 emissions, EGU General Assembly 2026, Vienna, Austria, 3–8 May 2026, EGU26-22515, https://doi.org/10.5194/egusphere-egu26-22515, 2026.

EGU26-718 * | ECS | Orals | CL3.2.1 | Highlight

Heatwave Differences Between Overshoot and Non-Overshoot Conditions Under Identical Emissions and Warming 

In-Hong Park and Sang-Wook Yeh

We analyze regional warming and extreme heat under a CO₂-overshoot pathway using eight CESM2 ensemble members forced by an emission-based experiment. The experiment prescribes a rise and decline in anthropogenic CO₂ emissions, allowing the selection of two climate states—one during overshoot and one outside overshoot—with nearly identical global emissions and global-mean surface temperature (GMST). This design provides a controlled framework to assess whether regional climate responses depend solely on the global mean state or also on the temporal sequence of forcing.

Despite matching GMST, the spatial distribution of near-surface warming differs substantially between the two states. During the overshoot period, temperatures are lower across most Northern Hemisphere land areas and higher over portions of the Southern Hemisphere compared with the non-overshoot state, producing net cooling across most global land regions. These differences are reflected in the behavior of extreme heat is generally reduced during overshoot relative to the non-overshoot state, consistent with the altered surface warming pattern.

Analysis of energy-budget components indicates that these spatial contrasts arise from asymmetric sea-ice responses between the Arctic and Antarctic. Differences in ice-sheet and sea-ice behavior modify ocean heat uptake and lead to distinct regional warming patterns under otherwise similar global forcing levels.

These results highlight that overshoot and non-overshoot climates with identical emissions and GMST can yield different regional warming and extreme-heat responses, indicating limited reversibility of regional climate impacts along overshoot pathways.

How to cite: Park, I.-H. and Yeh, S.-W.: Heatwave Differences Between Overshoot and Non-Overshoot Conditions Under Identical Emissions and Warming, EGU General Assembly 2026, Vienna, Austria, 3–8 May 2026, EGU26-718, https://doi.org/10.5194/egusphere-egu26-718, 2026.

EGU26-1212 | ECS | Orals | CL3.2.1

Pathways to Net Zero: A Multi-Dimensional Carbon-Neutrality Framework for Equitable Transition of Rural Communities 

Steipa Bituila, Priyanka Kaushal, and Rangan Banerjee

Abstract

Despite comprising 42% of the global population and accounting for 23% of annual anthropogenic GHG emissions while offsetting one-third of global CO2 emissions, rural areas remain critically underrepresented in carbon neutrality research (Guyadeen and Henstra, 2023; Huang et al., 2022; World Bank, 2023).  Existing carbon-neutrality frameworks are predominantly urban-centric, overlooking rural-specific challenges, including persistent energy poverty and development inequalities, as well as significant opportunities for carbon sequestration through natural ecosystems (Harris et al., 2022; WMO, 2024). This study addresses this gap by developing an evidence-based, integrated multi-dimensional framework specifically designed to guide rural communities toward net-zero emissions while leveraging their inherent ecological advantages. The framework addresses the specific technical, economic, and social dimensions of rural decarbonization through six interconnected pillars: (i) GHG inventory and digital monitoring, reporting & verification (dMRV) systems to establish baseline emissions and track progress; (ii) Sectoral mitigation roadmaps for Energy, AFOLU, IPPU, and Waste; (iii) Governance and institutional coordination to ensure multilevel policy alignment and stakeholder engagement; (iv) Financing mechanisms and carbon market integration to mobilize capital and revenue streams; (v) Capacity-building and inclusion strategies to develop local expertise and ensure equitable participation; and (vi) Just transition safeguards to protect vulnerable populations and livelihoods throughout the transformation process. The practical application of the framework is demonstrated through a case study of a displaced tribal community in Chiryapur village, Uttarakhand, India. Baseline assessment revealed annual energy consumption of 3.42 TJ and annual emissions of 3,099 tCO2e from the community, distributed across four sectors. A “bottom-up" low-carbon transition pathway adopted within the framework was proposed to reduce the community’s carbon footprint by reducing the reliance on fossil fuels and promoting the use of renewable energy (biogas, pyrolysis gas, & biochar) produced from an integrated biogas-pyrolysis system in the study area.  The analysis identified locally available biomass (690.2 tonnes) as sufficient for achieving energy independence through an integrated biogas-pyrolysis system, generating 0.83 TJ of energy from biogas and pyrolysis gas, supplemented by 0.47 TJ from biochar, totaling 1.30 TJ of renewable energy. The shortfall of 2.13 TJ, equivalent to ~134,000 kWh of electricity, against the energy requirement can be fulfilled by rooftop solar installations. This transition pathway delivers multiple co-benefits: immediate energy security through biogas and pyrolysis gas for cooking applications, long-term carbon sequestration through biochar soil amendment, and substantial financial returns of USD 53,838 annually via carbon credits from bio-oil sales, renewable gas credits, biochar sequestration, and solar integration, demonstrating a technically feasible and economically viable model for rural net-zero transitions.

This framework bridges a critical research gap by providing policymakers and practitioners with an evidence-based, scalable tool for rural decarbonization that balances technical feasibility, economic viability, social equity, and governance dimensions, ensuring just transitions that protect vulnerable communities while advancing climate goals.

Keywords:

Integrated mitigation framework, Biomass energy systems, Just transition, Equitable decarbonization, Rural climate action


How to cite: Bituila, S., Kaushal, P., and Banerjee, R.: Pathways to Net Zero: A Multi-Dimensional Carbon-Neutrality Framework for Equitable Transition of Rural Communities, EGU General Assembly 2026, Vienna, Austria, 3–8 May 2026, EGU26-1212, https://doi.org/10.5194/egusphere-egu26-1212, 2026.

India’s swift growth in energy, industry, and transportation has led to an increase in national greenhouse gas emissions by three times since 1990. This challenge is compounded by unmanaged agricultural residues and invasive species, such as Lantana camara and Prosopis juliflora, which exacerbate the deepening biomass and biodiversity crisis through the open burning of agri-biomass and the uncontrolled spread of invasive woody species, driving biodiversity loss and avoidable carbon emissions through uncontrolled decay. This study assesses the potential of utilizing and converting this “problematic biomass” into biochar as an integrated solution and scalable tool for Negative Emissions Technology (NET) in climate change mitigation, by integrating the life cycle, environmental co-benefits, and techno-economic perspectives into a single assessment framework. The comprehensive evaluation is based on thorough experimental data for these invasive feedstocks and the operational records of the commercial-scale Biochar Project, complemented by high-quality global databases from Ecoinvent and IPCC reports. The assessment synthesizes a comprehensive “cradle-to-grave” Life Cycle Assessment, adhering to ISO standards and integrated with EBC/Isometric permanence validation, within a Life Cycle Cost and Techno-Economic Assessment (LCC-TEA) framework. This further moves beyond, specifically identifying sustainable production pathways and quantifying environmental co-benefits at scale. Characterisation of feedstock reveals that the two species not only contain high amounts of carbon, due to high lignin content but also very little ash, which makes them perfect for stabilization due to the efficient conversion of biomass into stable carbon sinks through pyrolysis. Crucially, the assessment identifies logistics and the pyrolysis process energy as the primary emission hotspots in LCA, accounting for the majority of operational emissions. This framework provides a vital intervention strategy for addressing the climate crisis by bridging the gap between two key areas: ecological management and carbon markets. This provides a sustainable economic pathway, restores native biodiversity, and offers permanent and verifiable carbon removal. It also provides a practical roadmap for optimizing biochar systems, while guiding policy and investment decisions for the sustainable, large-scale deployment of invasive-biomass biochar, thereby turning an ecological liability into a climate and soil health asset.


Keywords: Carbon Dioxide Removal (CDR), Negative Emissions Technologies (NETs), Biochar, Ecological Restoration, Carbon Finance, Cradle-to-Grave Analysis, Waste-to-Value.

How to cite: Aagar, N. and Haridas Aithal, B.: Life Cycle, Environmental Co-Benefits, and Techno-Economic Assessment of Biochar Systems for Climate Change Mitigation: An Integrated Case Study from India, EGU General Assembly 2026, Vienna, Austria, 3–8 May 2026, EGU26-1344, https://doi.org/10.5194/egusphere-egu26-1344, 2026.

EGU26-2101 | ECS | Orals | CL3.2.1

Response of terrestrial ecosystems carbon budget to large-scale direct CO2 removal using Community Earth System Model 

Lili Liang, Shijing Liang, Zhenzhong Zeng, Alan Ziegler, Yuntian Chen, Yiheng Tao, Yubin Jin, Dashan Wang, Tianhao Wu, and Dongxiao Zhang

The terrestrial ecosystem is a critical carbon reservoir that faces the risk of transitioning from a carbon sink to a source under large-scale carbon dioxide removal (CDR) strategies aimed at mitigating climate change. In this study, we use a fully coupled Earth system model to simulate an abrupt decline in atmospheric CO2 concentrations from near-current levels to the pre-industrial level of approximately 280 ppm. We find that the CDR-induced reductions in net primary productivity lead terrestrial ecosystems to emit carbon. It takes approximately 14 years after removal for the global land-atmosphere system to reach a new carbon equilibrium, with recovery times varying by region, particularly delayed in the tropics. Boreal ecosystems play a key compensatory role by absorbing the excess carbon released from other regions, thereby helping to restore the global carbon balance. These findings underscore the pressing need for improved land management and a holistic approach that combines natural and technological CDR to achieve net-zero emissions targets.

How to cite: Liang, L., Liang, S., Zeng, Z., Ziegler, A., Chen, Y., Tao, Y., Jin, Y., Wang, D., Wu, T., and Zhang, D.: Response of terrestrial ecosystems carbon budget to large-scale direct CO2 removal using Community Earth System Model, EGU General Assembly 2026, Vienna, Austria, 3–8 May 2026, EGU26-2101, https://doi.org/10.5194/egusphere-egu26-2101, 2026.

EGU26-2709 | ECS | Orals | CL3.2.1

 Understanding mechanisms of the Zero Emission Commitment using MIROC-ES2L 

Natsuki Watanabe and Masahiro Watanabe

Zero Emissions Commitment (ZEC), defined as a change in global-mean surface temperature expected to occur after net-zero CO₂ emissions, is an important factor for estimating future climate and mitigation policies.

While the carbon budget arguments predict ZEC to be zero, it actually varies between slight positive and negative values in Earth system models (ESMs) and therefore uncertainty remains. Previous studies have shown that ZEC tends to be more positive with a greater amount of cumulative CO₂ emissions, but the underlying mechanisms are not yet understood well.

To clarify them, we performed an idealized global warming experiments using MIROC-ES2L, one of the CMIP6 ESMs. The experiments consist of the so-called flat10 run (with 10PgC emission) for 1000 years and zero-emission runs branched off at the time points when global-mean surface temperature reaches different values between 2 and 8°C in flat10.

We identified that the sign and value of ZEC in MIROC-ES2L depend on the global warming level when net-zero CO₂ emission is achieved. Specifically, GSAT tends to decrease when emissions are stopped at lower warming levels, whereas it increases when emissions are stopped at higher warming levels. This behavior arises from the state dependence of the ocean heat uptake weakening and change in the effective radiative forcing associated with the carbon uptake. Using the global energy budgets, we could estimate ZEC in the equilibrium state, which was similar to the ZEC in the first 200 years after net-zero CO₂ emissions.

How to cite: Watanabe, N. and Watanabe, M.:  Understanding mechanisms of the Zero Emission Commitment using MIROC-ES2L, EGU General Assembly 2026, Vienna, Austria, 3–8 May 2026, EGU26-2709, https://doi.org/10.5194/egusphere-egu26-2709, 2026.

EGU26-5420 | ECS | Orals | CL3.2.1

Reversal of extreme precipitation trends over the Northeast US in response to aggressive climate mitigation 

Bor-Ting Jong, Zachary Labe, Thomas Delworth, and William Cooke

Rapid reductions in greenhouse gas (GHG) concentrations are increasingly included in scenarios used to project the full range of possible future climate change, yet the response of regional climate extremes to such reductions remains highly uncertain. Here we focus on projected changes in extreme precipitation over the Northeast United States (US) in response to rapid reductions in GHG concentrations later this century. The Northeast US, the most densely populated region in North America including the Boston to Washington, D.C. metro corridor, has faced the most rapid increase in extreme precipitation events within the US over recent decades. With millions of people and critical infrastructure at risk, understanding how extreme precipitation may respond under different mitigation pathways is essential for informing urban adaptation and resilience strategies.

We use an ensemble of simulations driven by the SSP5-3.4OS scenario from the fully-coupled 25-km GFDL (Geophysical Fluid Dynamics Laboratory) SPEAR (Seamless system for Prediction and EArth system Research) model. In this overshoot scenario, hypothetical mitigation efforts are introduced starting in 2041, with net-negative GHG emissions achieved by the late 21st century. The frequency of extreme precipitation over the Northeast US increases through mid-century under rising radiative forcing but begins to decline following the sharp reductions in GHG concentrations. However, the timing of this reversal exhibits pronounced seasonality. In the warm season (May – November), extreme precipitation frequency begins to decline shortly after GHG drawdown begins. In the cold season (December – April), on the other hand, the frequency continues rising for roughly a decade after the peak global mean warming and exhibits hysteresis behavior. This delayed response in the cold season is spatially heterogeneous, suggesting that major metropolitan areas in the Northeast may experience different seasonal changes under the same climate migration efforts. These results highlight the benefit of climate mitigation in reducing extreme precipitation events, but also the complexity of regional climate responses, which can be modulated by seasonality, local-scale effects, and other factors.

How to cite: Jong, B.-T., Labe, Z., Delworth, T., and Cooke, W.: Reversal of extreme precipitation trends over the Northeast US in response to aggressive climate mitigation, EGU General Assembly 2026, Vienna, Austria, 3–8 May 2026, EGU26-5420, https://doi.org/10.5194/egusphere-egu26-5420, 2026.

EGU26-5472 | Orals | CL3.2.1

Heat-mortality impacts under 1.5°C overshoot pathways 

Samuel Lüthi, Mireia Ginesta, Fabrice Lacroix, Urs Hofmann Elizondo, Tino Schneidewind, Multi-Country Multi-City Collaborative Research Network, Thomas Frölicher, Carl-Friedrich Schleussner, Ana Vicedo-Cabrera, and Rupert Stuart-Smith

Within the 2015 Paris Agreement, the international community committed to limiting the long-term rise of global temperature to 1.5°C. As our planet continues to heat as a result of continued greenhouse gas emissions, it has become highly likely that the world is entering a period where global mean temperatures exceed this 1.5°C limit - a period referred to as Overshoot. Despite their importance for society and policymakers, health impacts of this overshoot remain understudied, particularly the different consequences of following different overshoot pathways.

In this study we therefore combine climate model output with a well-established epidemiological model to quantify the increase of heat-related mortality under pathways that overshoot the 1.5°C target. This analysis is conducted for over 850 locations across 52 countries, for which daily city-level mortality data is available through the MCC (Multi-Country Multi-City) Collaborative Research Network. The epidemiological analysis relies on quasi-Poisson regression time series analyses and requires daily city-level mortality data to establish location specific temperature-mortality relationships. We then project heat-related mortality levels across all 540 Paris Agreement–aligned scenarios available in the IPCC AR6 Scenario Database. To this end, we estimate local heat-mortality impacts for each location as a function of global mean surface temperature, by sampling data from five fully coupled earth system model initial condition large ensembles (SMILEs). In addition, we validate our approach using bespoke earth system model simulations that represent physically consistent overshoot and stabilization pathways which follow the recently developed Adaptive Emission Reduction Approach (AERA) methodology

We find a robust linear increase of heat-mortality with the cumulative temperature exceedance above 1.5°C (“overshoot-degree-years”) of each future global mean surface temperature (GMST) scenario. Hence, both the length (time) and intensity (temperature) of the overshoot is relevant for levels of heat-mortality as the impacts scale with the integral of GMST above 1.5°C over time. The linear increase of heat-mortality is in the range of 1-2 % / °C year, with larger increases found in tropical countries. While the linear scaling is apparent in nearly all countries and within all five SMILEs used, the slope of the linear relationship depends on the SMILEs. Comparing the sampled results to the physically consistent AERA runs reveals a good agreement, although the sampling approach slightly overestimates heat-mortality after the peak of GMST. Our results thus lay an important foundation for law and policy makers, as we clearly show that delaying climate action leads to increased heat-mortality.

How to cite: Lüthi, S., Ginesta, M., Lacroix, F., Hofmann Elizondo, U., Schneidewind, T., Collaborative Research Network, M.-C. M.-C., Frölicher, T., Schleussner, C.-F., Vicedo-Cabrera, A., and Stuart-Smith, R.: Heat-mortality impacts under 1.5°C overshoot pathways, EGU General Assembly 2026, Vienna, Austria, 3–8 May 2026, EGU26-5472, https://doi.org/10.5194/egusphere-egu26-5472, 2026.

EGU26-5638 | ECS | Orals | CL3.2.1

Asymmetric Responses of Temperature to Increasing vs Decreasing CO2 Concentrations 

Lucinda Palmer and Michael Byrne

Temperature responds asymmetrically to increases versus decreases in atmospheric CO2 concentrations. Understanding this asymmetry is important for our fundamental knowledge of the climate system and for projecting temperature responses to negative emission scenarios. Here we use CESM2, a fully coupled ocean-atmosphere Earth system model, to simulate the response of temperature to a period of increasing CO2 concentrations followed by a period of prescribed decreasing concentrations. CESM2 exhibits a pronounced hemispheric contrast in temperature reversibility, with persistent warming in the Southern Hemisphere and an over-recovery of temperature in the Northern Hemisphere following CO2 removal. The Southern Hemisphere response is broadly consistent with CDRMIP simulations from other models, which similarly show that temperatures remain elevated after a reduction in CO2 concentrations. In contrast, models disagree on the sign and magnitude of temperature reversibility in the Northern Hemisphere, particularly in the high northern latitudes. This work investigates the mechanisms responsible for persistent Southern Hemisphere warming and explores the sources of inter-model disagreement in Northern Hemisphere temperature recovery. This work will help clarify the reversibility of forced temperature changes and assist in setting expectations for carbon dioxide removal strategies.                                                                                                                                                                                                                                                                                                                                                       

How to cite: Palmer, L. and Byrne, M.: Asymmetric Responses of Temperature to Increasing vs Decreasing CO2 Concentrations, EGU General Assembly 2026, Vienna, Austria, 3–8 May 2026, EGU26-5638, https://doi.org/10.5194/egusphere-egu26-5638, 2026.

EGU26-6030 | Orals | CL3.2.1

Land carbon sinks in response to zero and negative emissions across Earth system models 

Abigail Swann, Charles Koven, Cristian Proistosescu, Rosie Fisher, Benjamin Sanderson, Victor Brovkin, Chris Jones, Nancy Kiang, David Lawrence, Spencer Liddicoat, Hannah Liddy, Anastasia Romanou, Norman Steinert, Jerry Tjiputra, and Tilo Ziehn

Land carbon sinks are responsible for removing about a quarter of anthropogenic CO$_2$ emissions, and make up approximately half of total global carbon sinks. Uncertainty in the response of land carbon sinks to climate and increasing CO$_2$ emissions are large, and dominate the uncertainty in total carbon sinks over the next century. Understanding the carbon cycle response to net-zero and net-negative emissions has important implications for projecting future climate. Experiments in the `flat10' model intercomparison (flat10MIP) were designed for directly estimating key climate metrics that underlie carbon budgeting frameworks. Here we characterize the response of land carbon pools and fluxes from ten emissions-driven Earth system models (ESMs) under positive, net-zero, and net-negative CO$_2$ emissions. Although there are many differences in simulated land carbon pools and fluxes across models, we find some consistent behavior across ESMs. 1) During the positive emissions phase, carbon is gained on land -primarily in vegetation pools- in both the tropics and mid-latitudes. 2) Following net-negative emissions to the point of cumulative zero emissions, vegetation carbon is lost from land. 3) In tropical latitudes, total carbon is lost coming primarily from vegetation pools, but in mid-latitudes nearly all models show net land carbon gain, primarily in soil pools. 4) Following an extended period of net-zero emissions, a majority of models again show carbon gain in mid-latitudes and vegetation carbon loss in the tropics. Under net-negative emissions the timing of vegetation carbon response relative to peak emissions is relatively consistent across ESMs, but timing of soil carbon response varies widely, implying larger intermodel disagreement associated with the longer timescale responses of land carbon.

How to cite: Swann, A., Koven, C., Proistosescu, C., Fisher, R., Sanderson, B., Brovkin, V., Jones, C., Kiang, N., Lawrence, D., Liddicoat, S., Liddy, H., Romanou, A., Steinert, N., Tjiputra, J., and Ziehn, T.: Land carbon sinks in response to zero and negative emissions across Earth system models, EGU General Assembly 2026, Vienna, Austria, 3–8 May 2026, EGU26-6030, https://doi.org/10.5194/egusphere-egu26-6030, 2026.

EGU26-6802 | ECS | Orals | CL3.2.1

State Dependence of Zero Emissions Commitment (ZEC) in Multi-Model TIPMIP Simulations 

Laura Gibbs, Chris Jones, Colin Jones, and Timothy Andrews

The Zero Emissions Commitment (ZEC) - the change in global temperature after CO2 emissions cease - plays a key role in quantifying remaining carbon budgets and assessing the reversibility of global temperature under carbon removal. ZEC has often been assumed to be close to zero in policy-relevant assessments. However, emerging single-model studies suggest that ZEC is not a fixed quantity, but may vary substantially with global warming level (GWL).

We present the first coordinated multi-model assessment of ZEC state dependence using results from the TIPMIP protocol. This analysis extends previous single-model studies by applying a consistent framework across Earth System Models (ESMs) to evaluate post-emissions temperature evolution following a common emissions-driven ramp-up to multiple GWL targets. We combine multi-century ESM simulations with a two-layer energy balance model to attribute ZEC to the evolving balance between committed ocean heat uptake warming and carbon-sink-driven cooling from land and ocean.

Preliminary intercomparisons suggest that models show relatively similar post-emissions temperature behaviour at lower GWLs (≤2K), remaining close to zero ZEC, whereas responses at higher GWLs are more varied, with most models continuing to warm. This coordinated analysis will deliver new understanding of the processes driving ZEC state dependence, with direct implications for TCRE assessments, IPCC carbon budget estimates, and the design of CO2 removal pathways.

How to cite: Gibbs, L., Jones, C., Jones, C., and Andrews, T.: State Dependence of Zero Emissions Commitment (ZEC) in Multi-Model TIPMIP Simulations, EGU General Assembly 2026, Vienna, Austria, 3–8 May 2026, EGU26-6802, https://doi.org/10.5194/egusphere-egu26-6802, 2026.

EGU26-8898 | Orals | CL3.2.1

Irreversibility of extreme precipitation intensity in global monsoon areas under multiple carbon neutrality scenarios 

Md. Babul Miah, Jong-Yeon Park, Min-Uk Lee, Woojin Jeon, Young-Hwa Byun, Hyun Min Sung, Jin Gi Hong, Md. Jalal Uddin, and Sanjit Kumar Mondal

The Global Monsoon Areas (GMAs), home to over half of the world's population, face escalating socio-economic risks from extreme precipitation events intensified by rising atmospheric carbon dioxide (CO2). While previous studies have examined the irreversibility of the climate system following carbon neutrality, most have focused on single carbon neutrality scenarios with limited attention to these vulnerable areas. This study assesses the irreversibility of extreme precipitation intensity across seven GMA sub-regions under eight future scenarios, incorporating four carbon neutrality targets and two reduction rates, using simulations from a state-of-the-art climate model. Our results reveal that extreme precipitation intensity exhibits irreversible behavior in response to carbon neutrality forcing, failing to return to its initial level even when atmospheric CO2 is reduced. This irreversibility is particularly pronounced when carbon neutrality timing is delayed, and the emission reduction rate is slow. Moreover, the irreversible response is nonlinear to the magnitude of carbon forcing, leading to distinct regional vulnerabilities, with some areas experiencing sharp increases in irreversibility by even small delays in reaching carbon neutrality. This region-specific behavior is largely attributed to increases in mean and variability of precipitation linked to irreversible El Niño-like warming and interhemispheric differential warming. Moisture budget analysis further shows that the intensified precipitation arises from the relative influence of thermodynamic (moisture flux) and dynamic (wind) drivers across regions. These findings highlight the urgency of rapid policy implementation in vulnerable regions and can provide a scientific basis for developing regional adaptation strategies to mitigate growing extreme precipitation risks.

How to cite: Miah, Md. B., Park, J.-Y., Lee, M.-U., Jeon, W., Byun, Y.-H., Sung, H. M., Hong, J. G., Uddin, Md. J., and Mondal, S. K.: Irreversibility of extreme precipitation intensity in global monsoon areas under multiple carbon neutrality scenarios, EGU General Assembly 2026, Vienna, Austria, 3–8 May 2026, EGU26-8898, https://doi.org/10.5194/egusphere-egu26-8898, 2026.

EGU26-11170 | ECS | Orals | CL3.2.1

Debt, Growth, and the Carbon Lock-In 

Silvia Montagnani, Barnabé Ledoux, and David Lacoste

Despite decades of climate policy initiatives and significant advances in decarbonization efforts, global CO₂ emissions continue to rise, suggesting the influence of structural factors that counteract mitigation gains. Here, we identify financial leverage as a fundamental mechanism that underpins this persistent overshoot.

We build a stochastic macro-financial model that integrates credit dynamics, economic growth, bankruptcy risk, and cumulative carbon emissions. The model shows that growth driven by debt financing consistently increases cumulative emissions, thereby locking economies into high-carbon pathways despite reductions in emissions intensity. This arises from a double constraint: debt repayment requires sustained growth, while growth remains energy-dependent and thus generates emissions. When growth becomes increasingly dependent on leverage, financial instability and cumulative emissions rise, while gains in real wealth diminish, revealing a leverage frontier beyond which additional credit primarily generates risk.

Calibrating the model to multi-decade data for the United States, China, France, and Denmark, we find a robust coupling between debt accumulation, cumulative GDP, and cumulative emissions across distinct economic structures. These results challenge the feasibility of growth–emissions decoupling under prevailing credit-driven growth regimes and indicate that achieving net-zero targets requires aligning credit allocation with decarbonisation objectives.

How to cite: Montagnani, S., Ledoux, B., and Lacoste, D.: Debt, Growth, and the Carbon Lock-In, EGU General Assembly 2026, Vienna, Austria, 3–8 May 2026, EGU26-11170, https://doi.org/10.5194/egusphere-egu26-11170, 2026.

EGU26-11381 | ECS | Orals | CL3.2.1

Marine heatwaves under net-zero and overshoot scenarios 

Isaline Bossert and Roland Séférian

Marine heatwaves are hazardous events particularly threatful to the ocean ecosystem. Observations show that their frequency and intensity are increasing in response to global warming. Evaluation of future marine heatwaves’ characteristics were primarily made using transient states of the Earth system. In this context, metrics were assessed at transient global warming levels (TWL), following the Paris Agreement goal to limit global warming well below 2.0°C or even 1.5°C above pre-industrial levels. However, assessment at TWL cannot be proxies for global warming stabilization storylines which require net-zero emission. In addition, current trends in global warming suggest that the Paris Agreement limits will be exceeded. Here, we analyse marine heatwaves’ characteristics at 2.0 and 4.0°C stabilized global warming levels (SWL) under net-zero and overshoot scenarios. For that, we run long term simulations following the TipMIP protocol and using the CNRM-ESM2-2 model. A positive 0.2°C.decade-1 ramp-up allows to reach the target temperatures where 300-years net-zero runs are branched. Overshoots are carried out, after 50-years of stabilization, using a symmetrical negative ramp-down. These results enable (i) to understand the global and regional evolution under net-zero and (ii) to evaluate possible hysteresis effects undergone with overshoots and net-zero pathways. In broader perspective, this work focuses on the implications for marine heatwaves’ key metrics as their consequent impacts could differ according to the pathway followed.

How to cite: Bossert, I. and Séférian, R.: Marine heatwaves under net-zero and overshoot scenarios, EGU General Assembly 2026, Vienna, Austria, 3–8 May 2026, EGU26-11381, https://doi.org/10.5194/egusphere-egu26-11381, 2026.

EGU26-11514 | Orals | CL3.2.1

Detecting Regional Climate Reversibility and Stabilization After Temperature Overshoot 

Carl-Friedrich Schleussner, Annika Högner, Niklas Schwind, and Assaf Shmuel

Due to insufficient climate action to date, the world is on track to exceed 1.5°C of global warming in the coming decade. Stringent climate action towards net zero, followed by continued net negative carbon emissions, may allow temperatures to be brought back below that level after a prolonged period of climate overshoot. Even if global mean temperatures are reversed, how such overshoot shapes regional climate patterns in the long term remains poorly understood. Here, we investigate the long-term effects of climate overshoot using explainable machine learning models to identify persistent and reversible changes in regional temperature patterns for ensembles of two different overshoot scenarios until 2300. Our approach allows for robust detection of statistically significant differences on the regional level. We address three questions: (1) which regional temperature distributions return to their pre-overshoot state, (2) which stabilize at altered conditions, and (3) how distinguishable high overshoot and low overshoot pathways remain up to 2300. To complement the machine learning analysis, we apply principal component analysis to compare pre- and post-overshoot climate states and assess their degree of convergence. Our analysis provides a methodological framework to detect climate reversibility and stabilisation on the regional level, highlighting where long-term changes persist despite global temperature decline. 

How to cite: Schleussner, C.-F., Högner, A., Schwind, N., and Shmuel, A.: Detecting Regional Climate Reversibility and Stabilization After Temperature Overshoot, EGU General Assembly 2026, Vienna, Austria, 3–8 May 2026, EGU26-11514, https://doi.org/10.5194/egusphere-egu26-11514, 2026.

EGU26-11614 | Posters on site | CL3.2.1

Comparison of Compound Marine Extremes Under Overshooting vs straight-stabilization Scenarios 

Raffaele Bernardello, Chiara De Falco, Ana Franco, Etienne Tourigny, and Eric Ferrer

Marine heatwaves and biogeochemical extremes such as deoxygenation and acidification are intensifying with climate change, becoming more frequent, persistent, and spatially extensive. Of particular concern are compound events, simultaneous extremes in multiple stressors, which can interact nonlinearly and trigger severe ecosystem disruptions. While their occurrence under long-term warming is increasingly documented, much less is known about their evolution in overshooting scenarios, where global temperatures temporarily exceed the Paris Agreement’s 1.5 °C target before declining through large-scale deployment of carbon dioxide removal (CDR). Such pathways raise critical questions about whether and when marine stress conditions can return to earlier states. Here we use simulations from the Horizon Europe project RESCUE (Response of the Earth System to overshoot, climate neutrality and negative emissions), which develops pairs (overshoot vs straight-stabilization) of novel socio-economic scenarios incorporating a broad portfolio of CDR strategies and arriving at the same cumulative carbon budget by the end of the century. We assess differences in the spatial patterns, frequency, intensity, and duration of compound events between an overshoot and its respective straight-stabilization trajectory. In addition, we evaluate ecosystem exposure to cumulative stress using indices for heat, hypoxia, and acidification, defined as exposure time below ecologically dangerous thresholds for marine organisms. Our analysis focuses on the persistence of these new extreme regimes and on when and if they can be reversed. 

How to cite: Bernardello, R., De Falco, C., Franco, A., Tourigny, E., and Ferrer, E.: Comparison of Compound Marine Extremes Under Overshooting vs straight-stabilization Scenarios, EGU General Assembly 2026, Vienna, Austria, 3–8 May 2026, EGU26-11614, https://doi.org/10.5194/egusphere-egu26-11614, 2026.

EGU26-11739 | ECS | Orals | CL3.2.1

Systematic comparison of emulation techniques for regional climate under temperature overshoot scenarios 

Niklas Schwind, Verena Kain, Annika Högner, Alexander Nauels, Zebedee Nicholls, Assaf Shmuel, Marco Zecchetto, and Carl-Friedrich Schleussner

How regional climate change evolves in overshoot scenarios, in particular after the global mean temperature (GMT) peak, is not well understood. To investigate regional changes under overshoot, we develop an emulator that predicts trends in regional climate variables at the spatial level of IPCC regions from GMT time series, with applicability both before and after overshoot.

A commonly used approach to relate regional climate change to GMT is pattern scaling, which assumes a linear relationship between GMT and regional climate variables. Previous studies indicate limitations in applying pattern scaling under post-overshoot conditions, a finding that is also reflected in results produced as part of our emulator development.

We therefore apply a range of alternative techniques to solve the regional climate trend emulation problem. These include approaches based on the existing literature, such as impulse response functions and operator approximation, as well as machine-learning-based methods, including Gaussian process regression, random forests, XGBoost, state space models, and pre-trained deep-learning-based time series prediction techniques. All methods are trained on overshoot and non-overshoot simulations from CMIP6, Flat10MIP, and additional model experiments available in the literature.

We assess the performance of each approach under overshoot scenarios and compare them with simple pattern scaling used as a baseline to assess approach performance. We introduce an evaluation framework for emulations under long-term stabilisation and overshoot pathways that accounts for whether regional climate signals are reversible or irreversible and enables robust detection of overshoot and stabilisation dynamics.

How to cite: Schwind, N., Kain, V., Högner, A., Nauels, A., Nicholls, Z., Shmuel, A., Zecchetto, M., and Schleussner, C.-F.: Systematic comparison of emulation techniques for regional climate under temperature overshoot scenarios, EGU General Assembly 2026, Vienna, Austria, 3–8 May 2026, EGU26-11739, https://doi.org/10.5194/egusphere-egu26-11739, 2026.

Carbon dioxide removal (CDR) will be required to support rapid emission reductions and reach net zero emissions. Recent studies have highlighted different global warming impacts of CDR options depending on the durability of their carbon storage. Geological net zero, which demands that residual fossil CO2 emissions are matched by permanent geological storage of CO2, has been identified as one potential policy approach to address these durability differences, as it recognizes the warming risk of delayed CO2 release from less permanent storage. Considering the UK as a national case study, we investigate the effect a geological net zero policy may have on national climate change mitigation strategies.  
Using the national-scale energy system model UK TIMES, we explore different ways of implementing a geological net zero policy: a strict implementation applied on an annual accounting basis from 2030 forward, a progressive implementation that introduces a more gradual “share” of fossil emissions covered under the policy, and a cumulative implementation to 2050 which allows emissions earlier in the time horizon to be compensated for later.  
Our initial results suggest extreme difficulty in achieving GNZ, highlighting that the UK is unlikely to be able to able to reach geological net zero before 2040, as more than one decade is required to decarbonize the emitting sectors and significantly scale up removal methods with permanent storage. It is also clear that the speed of change required to achieve even this outcome is significant, requiring rapid and deep phase out of fossil fuel use much earlier than traditional scenarios suggest. We find, however, that progressive and cumulative GNZ implementations can get much closer to solving, and offer more ambitious pathways that significantly reduce the UK's cumulative emissions to 2050 compared to the current UK pathways and emissions targets. We quantify residual emissions and determine the sectors with the highest challenges for full decarbonization and find that the availability of key resource biomass as well as the pace of scaling up carbon capture and storage infrastructure have crucial impact on the feasibility of any geological net zero policy.
To our knowledge, this study is the first to assess potential geological net zero policies at national level, providing insights into the opportunities and challenges of faster decarbonization and dependence on geological carbon storage in all sectors of the UK economy. Findings of this study are also relevant for other nations considering more ambitious climate change mitigation policy. 

How to cite: Broad, O., Hofbauer, V., and Butnar, I.: Geological Net Zero as policy to address the non-inequivalence of carbon emissions and removals in meeting national zero-emission targets in the United Kingdom , EGU General Assembly 2026, Vienna, Austria, 3–8 May 2026, EGU26-12586, https://doi.org/10.5194/egusphere-egu26-12586, 2026.

EGU26-12960 | Orals | CL3.2.1

Key Benchmarks of Global Emissions Scenarios 2025: Annual update of integrated assessment scenarios and related benchmarks for limiting global warming 

Karl Scheifinger, Keywan Riahi, Leon Clarke, Daniel Huppmann, Tomoko Hasegawa, Gunnar Luderer, Chris Smith, Elmar Kriegler, Joeri Rogelj, Zebedee Nicholls, Detlef van Vuuren, Bas van Ruijven, Mark Dekker, Philipp Verpoort, Hamish Beath, and Gabriel Sher

Global emissions scenarios describe the nature and pace of future transitions. As such, they have been critical to inform international policy and efforts to limit global warming to specific levels. Since the IPCC Sixth Assessment Report (AR6), the global mitigation landscape has changed substantially, yet many scenario-based benchmarks continue to rely on static assessments. The Scenario Compass Initiative (SCI) responds to this gap by providing a continuously updated, transparent, and curated collection of global emissions scenarios, combined with a systematic benchmarking framework that tracks how mitigation requirements evolve over time.

SCI introduces a novel “live” scenario collection approach that enables ongoing submission, vetting, and release of scenarios, ensuring timely access while maintaining quality control. Scenarios are assessed against feasibility and sustainability criteria, allowing the identification of a policy-relevant subset without relying on statistical outlier exclusion. Building on this curated ensemble, SCI derives benchmarks across key mitigation dimensions, including near-term emissions reductions, renewable energy deployment, net-zero timing, and reliance on net-negative emissions.

Comparing current benchmarks with those underlying AR6 reveals a marked shift in feasible mitigation pathways. The most ambitious AR6 category—characterized by immediate, steep emissions reductions and minimal temperature overshoot—has effectively become unattainable given observed emissions trends and delayed action. As a result, benchmarks for near-term mitigation, net-zero timing, and carbon dioxide removal have all shifted accordingly. At the same time, while quantitative assumptions span wide numerical ranges, most scenarios continue to rely on a narrow set of underlying socioeconomic narratives aligned with SSP1 and SSP2.

This presentation will inform about the updated benchmarks which provide critical reference points for interpreting contemporary scenarios and for supporting robust, policy-relevant climate decision-making.

How to cite: Scheifinger, K., Riahi, K., Clarke, L., Huppmann, D., Hasegawa, T., Luderer, G., Smith, C., Kriegler, E., Rogelj, J., Nicholls, Z., van Vuuren, D., van Ruijven, B., Dekker, M., Verpoort, P., Beath, H., and Sher, G.: Key Benchmarks of Global Emissions Scenarios 2025: Annual update of integrated assessment scenarios and related benchmarks for limiting global warming, EGU General Assembly 2026, Vienna, Austria, 3–8 May 2026, EGU26-12960, https://doi.org/10.5194/egusphere-egu26-12960, 2026.

EGU26-13648 | ECS | Orals | CL3.2.1

Peak warming and remaining carbon budgets under different methane emission targets 

Konstantin Weber, Cyril Brunner, Lena Brun, and Reto Knutti

Methane (CH4) is the second most important anthropogenic greenhouse gas after CO2, and CH4 mitigation is a main option to limit near-term warming. Yet, the required CH4 mitigation to stay below specific temperature limits remains uncertain. Furthermore, prevalent scenarios from Integrated Assessment Models (IAMs) typically exhibit highly non-linear and correlated CO2 and CH4 emissions, due to economic optimization and aggregation of greenhouse gases (GHGs). By contrast, climate targets are often framed as linear reductions in emissions with a primary focus on mitigating CO2 emissions.

Here, we present a simple, complementary approach for scenario generation that aligns more closely with the current framing of emission targets and remains largely independent of many assumptions in IAMs. Using this scenario generation approach and the simple climate model FaIR, we systematically map peak warming resulting from a linear reduction to net zero CO2 or GHG emissions combined with different changes in CH4 emissions. We estimate that without CH4 mitigation, peak warming of 1.7 °C is already unavoidable. We provide minimum CH4 mitigation targets compatible with different peak temperatures when combined with specific net zero CO2 or GHG emission targets. We further quantify how the remaining carbon budget (RCB) depends on the stringency of CH4 mitigation. Our results show that without sizable CH4 mitigation, RCBs are far smaller than commonly communicated.

These findings emphasize both the necessity and the benefit of strong near-term CH4 mitigation, and can support policymakers in setting CH4 emission targets compatible with globally agreed-upon temperature limits.

How to cite: Weber, K., Brunner, C., Brun, L., and Knutti, R.: Peak warming and remaining carbon budgets under different methane emission targets, EGU General Assembly 2026, Vienna, Austria, 3–8 May 2026, EGU26-13648, https://doi.org/10.5194/egusphere-egu26-13648, 2026.

EGU26-14355 | Orals | CL3.2.1

Reversible Atlantic overturning despite continued Greenland Ice Sheet melt in global climate overshoot scenarios 

Chuncheng Guo, Shuting Yang, Ilana Schiller-Weiss, Jorge Bernales, Steffen Olsen, Torben Koenigk, Rashed Mahmood, Tian Tian, and Klaus Wyser

The Atlantic Meridional Overturning Circulation (AMOC), a key component of the Earth’s climate system, has long been considered vulnerable to irreversible weakening or collapse under global warming and related Greenland Ice Sheet (GrIS) melt, yet its resilience remains uncertain. Here, we use a CO2-emission-driven Earth system model with an interactive GrIS to assess AMOC reversibility under idealised CO2 emission pathways that produce near-linear global warming up to 10 K, stabilisation across 1.5-9 K, and subsequent cooling. We find that although the AMOC attains “collapsed” states by commonly used threshold definitions, these weakened states do not represent dynamical tipping: the overturning weakens quasi-linearly with global temperature increase, yet consistently and promptly recovers under cooling. In contrast, GrIS mass loss accelerates with warming, continues through stabilisations, and is only slowed by cooling, committing the planet to long-term sea-level rise. These results reveal a striking asymmetry in Earth-system resilience: under transient CO2 forcing, the AMOC strength remains dynamically reversible even under continued Greenland meltwater input, whereas the GrIS is locked into persistent decline. Our findings underscore the urgency of rapid emission cuts to limit climate overshoot, AMOC weakening, and irreversible ice-sheet loss.

How to cite: Guo, C., Yang, S., Schiller-Weiss, I., Bernales, J., Olsen, S., Koenigk, T., Mahmood, R., Tian, T., and Wyser, K.: Reversible Atlantic overturning despite continued Greenland Ice Sheet melt in global climate overshoot scenarios, EGU General Assembly 2026, Vienna, Austria, 3–8 May 2026, EGU26-14355, https://doi.org/10.5194/egusphere-egu26-14355, 2026.

EGU26-14642 | ECS | Orals | CL3.2.1

Large ESM ensemble reveals complex responses of carbon and climate feedbacks to forestation across emission pathways 

Yiannis Moustakis, Tobias Nützel, Hao-Wei Wey, and Julia Pongratz

Reaching the Paris Agreement’s climate targets will require the large-scale deployment of Carbon Dioxide Removal (CDR), including Afforestation/Reforestation (AR). Carbon sequestration through AR is driven by plant metabolic processes affected by environmental conditions. However, AR-induced reduction of atmospheric CO2 levels causes compensating CO2 fluxes towards the atmosphere across the land and ocean. Further, beyond the CO2-induced reduction in temperature, AR also affects climate through local and non-local biogeophysical effects caused by changes in albedo, surface roughness, and transpiring leaf area. Given the breadth and interaction of Earth system effects of AR, the amount of CDR achieved depends not only on the scale and spatiotemporal pattern of the application, but also on ambient climate and CO2 levels, as determined by the emissions pathway, and complex emerging feedbacks. At the same time, understanding whether AR can cause a (non-)local warming that could potentially offset the cooling induced by the AR-driven CO2 reduction, whether this might hold across different emissions scenarios, and whether this signal can emerge from internal variability, is also crucial.

Here, using the fully coupled Earth System Model MPI-ESM, we create a multi-member ensemble of emission- and concentration-driven AR and reference simulations across different emissions pathways (SSP1-2.6, SSP5-3.4os, SSP3-7.0, SSP5-8.5). Our setup features an unprecedented number of 120 simulations in total, that allows us to robustly capture the impacts on the Earth system and the emerging climatic and carbon feedbacks across spatiotemporal scales. In the AR scenario, forest area increases by 935 Mha by 2100, representing ambitious AR in the range of country pledges (Moustakis et al. 2024).

Our results show that, under higher emissions, AR not only sequesters more carbon over land, but also does so more efficiently. In particular, for  every 100 GtCO2 sequestered over land (compared to the counterfactual reference scenario), atmospheric reduction reaches 89, 85, 74, and 73 GtCO2 in SSP5-8.5, 3-7.0, 5-3.4os, and 1-2.6 respectively. The reduction of carbon sequestration due to the AR-induced reduction in atmospheric CO2 can reach 29% in SSP1-2.6, which is significantly higher than the 7% loss in SSP5-8.5. Despite AR being more efficient under higher emissions, this is not translated to gains in temperature reduction, which is not statistically significantly different between scenarios, averaging at 0.2°C globally. Overall, CO2-induced cooling dominates biogeophysically-induced warming at both global and regional scales across scenarios, whereas the isolated biogeophysical effects on temperature are insignificant at the global scale.

Our results provide robust, scenario-dependent insights into how large-scale AR works within the Earth system, and how the emerging carbon and climate feedbacks affect sequestration and temperatures across global and regional scales.


References:

Moustakis, Y., Nützel, T., Wey, HW. et al. Temperature overshoot responses to ambitious forestation in an Earth System Model. Nat Commun 15, 8235 (2024). https://doi.org/10.1038/s41467-024-52508-x

How to cite: Moustakis, Y., Nützel, T., Wey, H.-W., and Pongratz, J.: Large ESM ensemble reveals complex responses of carbon and climate feedbacks to forestation across emission pathways, EGU General Assembly 2026, Vienna, Austria, 3–8 May 2026, EGU26-14642, https://doi.org/10.5194/egusphere-egu26-14642, 2026.

EGU26-14793 | ECS | Posters on site | CL3.2.1

Indirect Effects of Non-CO2 Forcings on Carbon Budgets in Overshoot pathways 

Koramanghat Unnikrishnan Jayakrishnan and Kirsten Zickfeld

Overshoot pathways involve exceeding a specific temperature target temporarily and returning to it using deliberate carbon dioxide removal methods. Quantifying the overshoot carbon budgets is becoming increasingly significant as the global mean surface air temperature approaches the 1.5°C target considered in the Paris Agreement. Contribution from non-CO2 forcings is a key component of estimating the carbon budgets. Non-CO2 forcings affect global mean temperature in two ways: i) by altering the energy balance at the top of the atmosphere (direct effect) and ii) by affecting the carbon cycle (indirect effect; for example, the effect of non-CO2 forcings on temperature causes changes in soil respiration which is a strong function of temperature). Current frameworks quantify the impact of non-CO2forcings on carbon budgets separately from CO2 forcing using emulators. Therefore, the effects of the interaction between non-CO2 forcings and carbon cycle (indirect effects) are not captured. Pre- and post-overshoot carbon budgets refer to the total anthropogenic emissions when the temperature exceeds and subsequently falls below the intended target, respectively. Here, we investigate how the indirect effects of non-CO2 forcings on global mean temperatures affect pre- and post-overshoot carbon budgets using an Earth system model of intermediate complexity.

Three sets of simulations are performed to isolate the direct and indirect effects of non-CO2 forcings on global mean surface air temperatures. The reference set involves prescribing fossil fuel emissions following historical data and Shared Socio-economic Pathways (SSP) scenarios, while excluding non-CO2 forcings.  The second set (total set) involves simulations with both fossil fuel emissions and non-CO2 forcings prescribed following historical data and SSP scenarios, which simulates the total effect of non-CO2 forcings on global mean temperature. In the third set (direct set), the same non-CO2 forcings as in the total set is applied, but the atmospheric CO2 concentration is prescribed from the reference simulation. Prescribing atmospheric CO2 concentration isolates the direct effects due to non-CO2 forcings by preventing the carbon cycle feedbacks from influencing temperature. The indirect effects are calculated as the difference between total and direct sets. We find that direct warming due to non-CO2 forcing is larger at both pre-and post-overshoots compared to indirect warming. However, the relative contribution of indirect warming increases during the post-overshoot relative to the pre-overshoot because of two reasons: i) non-CO2 forcings are smaller during the post-overshoot and ii) indirect warming increases from pre- to post-overshoot because of the slow carbon cycle response to non-CO2 warming. Further, we estimate the associated reductions in pre- and post-overshoot carbon budgets due to indirect effects of non-CO2 forcings. Our results suggest that frameworks quantifying overshoot carbon budgets should assess the contributions from CO2 and non-CO2 forcings together to fully capture the effects of the interactions between non-CO2 forcings and the carbon cycle.

How to cite: Jayakrishnan, K. U. and Zickfeld, K.: Indirect Effects of Non-CO2 Forcings on Carbon Budgets in Overshoot pathways, EGU General Assembly 2026, Vienna, Austria, 3–8 May 2026, EGU26-14793, https://doi.org/10.5194/egusphere-egu26-14793, 2026.

EGU26-15018 | ECS | Orals | CL3.2.1

Non-CO2 effects of carbon dioxide removal methods influence temperature response in overshoot scenarios 

Geoffrey Harper, Leon Merfort, Nico Bauer, and Kirsten Zickfeld

Exceedance of the long-term goal of the Paris agreement to limit warming to 1.5 degree Celsius above pre-industrial levels has become inevitable due to insufficient past and present climate action. Therefore, any future scenario consistent with meeting this goal will involve some level of temperature overshoot. Thus, it is essential to understand how the Earth system responds to overshoot scenarios, how reversible these changes may be compared to non-overshoot scenarios, and what the implications could be for future generations.

Overshoot scenarios are commonly derived from Integrated Assessment Models (IAMs). These scenarios describe possible pathways of greenhouse gas and aerosol emissions, along with changes in land use. To reach a specified climate goal, each scenario relies on the deployment of various types and amounts of carbon dioxide removal (CDR), such as reforestation, bio-energy with carbon capture and sequestration (BECCS) and direct air capture (DAC). In addition to removing CO2 from the atmosphere, each of these methods is associated with distinct non-CO2 related climate effects (e.g. biogeophysical effects, emissions of non-CO2 gases).

However, most Earth system modelling studies rely on idealized CDR implementation only modelling carbon dioxide emissions or concentrations for a given scenario. This neglects the non-CO2 climate effects and feedbacks that are associated with each scenario’s CDR methods. Therefore, the objective of this research is to investigate the

To study the Earth response to overshoot scenarios, two sets of scenarios were generated using the REMIND-MAgPIE IAM, with scenarios within each set designed to meet the same cumulative CO2 emissions by 2100 (450 GtCO₂ and 650 GtCO₂). Each set includes corresponding pairs of low and high carbon budget overshoot. These scenarios achieve the defined carbon budget through different CO2 emission trajectories and portfolios of CDR methods, different policy choices affecting land-use and available CDR methods, and different levels of overshoot. The Earth system response to these scenarios is then modelled via emission driven runs using the University of Victoria Earth System Climate Model, an Earth system model of intermediate complexity.

We find that high overshoot pathways have slightly different global temperature outcomes compared to low-overshoot pathways at the time the carbon budget converges. Global mean temperature differences across scenarios range from 0.00–0.04 °C for the 450 Gt CO₂ set and 0.00–0.05 °C for the 650 Gt CO₂ set. Regionally, differences are larger and range from -0.15–0.15 °C and -0.14–0.16 °C, respectively. Cancellation of positive and negative regional temperature differences results in small differences in the global mean. Differences in temperature response across scenarios are attributed to lags in the thermal and carbon cycle response to net-negative CO2 emissions, and non-CO2 effects associated with the unique CDR portfolio within each scenario Our results highlight the importance of considering non-CO2 effects of CDR methods in Earth system models to capture the full range of Earth system responses in overshoot scenarios, particularly at regional scales.

How to cite: Harper, G., Merfort, L., Bauer, N., and Zickfeld, K.: Non-CO2 effects of carbon dioxide removal methods influence temperature response in overshoot scenarios, EGU General Assembly 2026, Vienna, Austria, 3–8 May 2026, EGU26-15018, https://doi.org/10.5194/egusphere-egu26-15018, 2026.

EGU26-15351 | ECS | Orals | CL3.2.1

The Role of Carbon Cycle Feedbacks in the Land and Ocean Response to Zero Emissions 

Rachel Chimuka and Kirsten Zickfeld

The zero emissions commitment (ZEC) – change in global average temperature following a cessation of emissions – is determined by inertia in both physical and biogeochemical components of the climate system. The ZEC is commonly quantified from fully coupled model simulations in which the land and ocean respond to changes in both climate and atmospheric CO2 concentration. As a result, the role of carbon cycle feedbacks in zero emissions (ZE) simulations has not been explored in detail. This study uses an Earth system model to analyze the role of carbon cycle feedbacks in the land and ocean response to ZE. First, the model was forced with constant emissions of 10PgC yr-1 for 100 years (esm-flat10 experiment), then a series of zero emissions simulations were initialized from different time points along the esm-flat10 trajectory (esm-flat10-zec experiment). In each simulation, emissions were immediately halted, then the system was allowed to evolve. Simulations were run in fully coupled, biogeochemically coupled and radiatively coupled modes to isolate feedbacks. When the CO2 effect is isolated, atmospheric CO2 concentration declines more rapidly relative to the fully coupled mode due to continued land and ocean uptake. This decline in atmospheric CO2 concentration reduces the rate of carbon uptake, which in turn, reduces the rate of decline in atmospheric CO2 concentration. However, when the climate effect is isolated, warming results in land and ocean carbon loss. The continued warming exacerbates carbon loss, further amplifying warming. Overall, the concentration-carbon feedback acts to stabilize carbon sinks, resulting in a smaller ZEC, whereas the climate-carbon feedback acts to exacerbate carbon loss, resulting in a larger ZEC (relative to the ZEC in the fully coupled mode). Our results indicate that carbon cycle feedbacks are a key control on the ZEC, emphasizing the importance of disentangling and quantifying feedbacks in net-zero emissions pathways.

How to cite: Chimuka, R. and Zickfeld, K.: The Role of Carbon Cycle Feedbacks in the Land and Ocean Response to Zero Emissions, EGU General Assembly 2026, Vienna, Austria, 3–8 May 2026, EGU26-15351, https://doi.org/10.5194/egusphere-egu26-15351, 2026.

EGU26-15451 | ECS | Posters on site | CL3.2.1

Modelling solar radiation modification in process-based integrated assessment models 

Rodrigo Muñoz Sanchez, Oscar Calderon, Miguel Altamirano, Benardo Bastien-Olvera, and Francisco Estrada

As the gap keeps widening between current greenhouse gas emissions and the ever-shrinking remaining carbon budget for achieving the Paris Agreement, there has been a surge in interest in the implementation of geoengineering proposals such as solar radiation management (SRM). However, there are ethical concerns about the governance, economic viability, and climate impacts of such measures. Our understanding of climate impacts has improved with the GeoMIP protocol and dimensions of economic viability has been evaluated in engineering cost analyses and through impact functions in cost-benefit integrated assessment models (IAM) such as DICE. Nevertheless, a critical gap remains in the modelling of SRM as a mitigation measure in multisector and dynamic analyses.

In this study, we present GCAM-SRM, a modification of the Global Change Analysis Model (GCAM 8.2). GCAM is a dynamic-recursive model with technology-rich representations of the economy, energy sector, land use, and water linked to a reduced complexity Earth system model (Hector 3.2) for exploring consequences of and responses to global to local changes and stressors. GCAM-SRM models the G6Sulfur emissions scenario with an explicit representation of a technology for stratospheric aerosol injection (SAI) with cost and resource modelling and competition with regular mitigation strategies and carbon dioxide removal measures.

The SAI technologies explicitly emit stratospheric SO2, and the Earth system model has a detailed representation of the radiative forcing due to stratospheric SO2. The Global Warming Potential (GWP) for SO2 is calculated according to IPCC guidelines to derive a CO2 equivalent for SO2, and the radiative forcing of 4.5 W/m2 corresponding to the G6Sulfur scenario is achieved by setting a global CO2e price, which acts as a subsidy for SAI technologies. We finally compare the resulting CO2e price between the G6sulfur scenario and the SSP2-4.5 scenario with no SAI. Further developments will exploit GCAM’s capabilities to model climate impacts to differentiate resource availabilty and consumption in a wamer world with and without SAI.

How to cite: Muñoz Sanchez, R., Calderon, O., Altamirano, M., Bastien-Olvera, B., and Estrada, F.: Modelling solar radiation modification in process-based integrated assessment models, EGU General Assembly 2026, Vienna, Austria, 3–8 May 2026, EGU26-15451, https://doi.org/10.5194/egusphere-egu26-15451, 2026.

EGU26-15764 | Posters on site | CL3.2.1

Exploring the Critical Role of Mycorrhizal Fungi in Forest Carbon Sequestration: Evidence from Taiwan Spruce 

Chieh-Yin Chen, Shih-Hao Jien, Chun-Han Ko, Chia-Chia Lin, Hiran A. Ariyawansa, Zong-Yan Li, Yuan-Cheng Xu, and Wen-Wei Hsiao Hsiao

Soil microorganisms play a crucial role in long-term carbon storage, with mycorrhizal fungi being one of the most studied groups due to their ecological importance. These fungi form symbiotic associations with plants, significantly enhancing biomass accumulation and promoting the uptake of atmospheric CO2, thereby increasing plant carbon assimilation. This study was conducted at the Xitou nursery (elevation 1180–1200 m) of the Experimental Forest, National Taiwan University. Taiwan spruce (Picea morrisonicola), one of key native afforestation species in Taiwan, was selected to evaluate the effects of mycorrhizal inoculation on nutrient cycling and carbon dynamics in forest soils. Measurements of soil physicochemical properties, nutrient availability, microbial composition, spruce growth performance, and biochemical traits were carried out to identify potential correlations. Microbial community analysis revealed specific taxa closely linked to improved seedling growth and increased carbon sequestration potential. Observations of phenotypic and biochemical traits across developmental stages indicated that mycorrhizal fungi regulate seedling metabolic activity. Comparative analysis between inoculated and control treatments confirmed that mycorrhizal fungi significantly influence plant physiological responses and enhance soil carbon retention. The findings support the application of native mycorrhizal inoculants in sustainable soil management and reforestation strategies to strengthen the carbon sink function of forest ecosystems.

How to cite: Chen, C.-Y., Jien, S.-H., Ko, C.-H., Lin, C.-C., Ariyawansa, H. A., Li, Z.-Y., Xu, Y.-C., and Hsiao, W.-W. H.: Exploring the Critical Role of Mycorrhizal Fungi in Forest Carbon Sequestration: Evidence from Taiwan Spruce, EGU General Assembly 2026, Vienna, Austria, 3–8 May 2026, EGU26-15764, https://doi.org/10.5194/egusphere-egu26-15764, 2026.

EGU26-15838 | Orals | CL3.2.1

Making sense of ZEC and TCRE: A conceptual model for the coupled climate response to carbon emissions.  

Cristian Proistosescu, Abigail Swann, Kyle Armour, and Bb Cael

Effective climate policy requires quantifying the temperature response to CO2 emissions. The current policy framework centers around Remaining Carbon Budgets, and depends heavily on there being a linear Transient Climate Response to Cumulative Emissions (TCRE) and a low Zero Emission Commitment (ZEC). The linearity of TCRE and the smallness of ZEC are based on emergent behaviors of a small number of Earth System Models (ESMs) and lack both conceptual understanding and uncertainty quantification. 

Here we present an analytically tractable conceptual model for the coupled interaction of the thermal component of the climate system with the carbon cycles.  Unlike previous decompositions our model is built by assembling dynamical energy balance and carbon flux models. Thus, we obtain closed-form approximations for TCRE and ZEC in terms of well-established conceptual parameters such as the radiative feedback, ocean heat uptake efficiency, the average timescale ocean carbon uptake, the Q10 temperature sensitivity of respiration, etc. 

We derive conditions for both long-term (millennial-scale) low ZEC, as well as conditions for transient (centennial-scale) low ZEC, along with conditions for the near-linearity of TCRE. We find that there is no intrinsic physical reason for a low ZEC or a linear TCRE, and they arise from fortuitous compensations between unrelated parameters. We also show the system has the potential for significant centennial-scale transient amplification, arising from non-normal system dynamics.

In addition to providing conceptual insight, the model allows us to easily explore the limits of the traditional assumptions surrounding TCRE and ZEC. For example, we show that a pattern effect derived from models with observed Sea Surface Temperature patterns (AMIP), can lead to a much larger ZEC than that derived from coupled ESMs.  

How to cite: Proistosescu, C., Swann, A., Armour, K., and Cael, B.: Making sense of ZEC and TCRE: A conceptual model for the coupled climate response to carbon emissions. , EGU General Assembly 2026, Vienna, Austria, 3–8 May 2026, EGU26-15838, https://doi.org/10.5194/egusphere-egu26-15838, 2026.

EGU26-17472 | ECS | Orals | CL3.2.1

Assessing the reversibility of temperature and precipitation extremes under AMOC weakening and recovery 

Johannes Fjeldså, Ben Sanderson, Marit Sandstad, and Ada Gjermundsen

Most CMIP6 models simulate a substantial weakening of the Atlantic Meridional Overturning Circulation (AMOC), beginning around 1990 and persisting for decades after peak warming, with recovery requiring more than a century. This weakening is associated with reduced northward oceanic heat transport, pronounced winter cooling in the North Atlantic, a northward shift of the North Atlantic jet stream, and an increased risk of summer heatwaves in Europe, as well as a southward displacement of the Intertropical Convergence Zone (ITCZ). 

While the magnitude of AMOC weakening is broadly consistent across models and scenarios, its recovery shows large inter-model differences, particularly in overshoot scenarios. Here, we investigate the reversibility of the AMOC and its impact on large-scale circulation, with a focus on temperature and precipitation and associated extreme event indices. 

We analyze two Earth System Models with interactive carbon cycles (NorESM2-LM and MPI-ESM1.2-LR) under two overshoot scenarios: SSP5-3.4-OS (high overshoot) and SSP1-1.9 (low overshoot). The models exhibit contrasting AMOC responses to negative emissions. NorESM2-LM shows pronounced hysteresis and incomplete recovery, whereas MPI-ESM1.2-LR exhibits a largely reversible AMOC response with minimal path dependence. This contrast is reflected in the development of the top-of-atmosphere radiation balance, where NorESM2-LM has a pronounced hemispheric asymmetry and persistent energy imbalance during the cooling and stabilization phases, whereas MPI-ESM1.2-LR shows a largely symmetric and reversible response that closely follows global mean temperature. Results indicate the presence of Bjerknes Compensation in the northern hemisphere for NorESM2-LM, yielding a partial offset of the reduced oceanic heat transport by the atmosphere. We will further assess the reversibility of climate extremes using indices established by the Expert Team on Climate Change Detection and Indices, focusing on heat extremes, drought prevalence and precipitation intensity in regions sensitive to AMOC-induces circulation changes. 

Our results highlight the central role of the AMOC in governing regional climate responses on centennial timescales and underscore the importance of understanding AMOC hysteresis and reversibility when considering the long-term consequences of delayed action and subsequent large-scale carbon dioxide removal (CDR). 

How to cite: Fjeldså, J., Sanderson, B., Sandstad, M., and Gjermundsen, A.: Assessing the reversibility of temperature and precipitation extremes under AMOC weakening and recovery, EGU General Assembly 2026, Vienna, Austria, 3–8 May 2026, EGU26-17472, https://doi.org/10.5194/egusphere-egu26-17472, 2026.

EGU26-17772 | ECS | Orals | CL3.2.1

Investigating local drivers of heat extremes in a net-zero climate model 

Greta Paget, Jan Zika, Sarah Perkins-Kirkpatrick, and Lisa Alexander

The ACCESS-ESM1.5 model of climate stabilisation after net-zero emissions demonstrates temperature evolution after net-zero, with significant regional variation in local mean and extreme temperature changes.

However, the extent to which changes in the magnitude of heat extremes are driven by changes in mean temperature has not previously been investigated in the stabilised net-zero model.

In analysing the relationship between mean temperature and heat extremes in this net-zero model, we find that in some regions, heat extremes do not change linearly with mean temperature. In the Antarctic and Southern Ocean regions, the mean temperature and extremes both exhibit a warming trend after net-zero, however extreme temperatures do not warm as quickly as the mean temperature. Conversely, over some land regions in the Northern Hemisphere, the mean temperature and extremes both exhibit a cooling trend, however extreme temperatures cool more quickly than mean temperatures. 

By considering regional geography, we can understand the physical drivers of heat extremes including the role of sea ice and ice sheets, and understand physical limits on the temperature range of heat extremes in these regions. 

How to cite: Paget, G., Zika, J., Perkins-Kirkpatrick, S., and Alexander, L.: Investigating local drivers of heat extremes in a net-zero climate model, EGU General Assembly 2026, Vienna, Austria, 3–8 May 2026, EGU26-17772, https://doi.org/10.5194/egusphere-egu26-17772, 2026.

EGU26-18277 | ECS | Posters on site | CL3.2.1

Atmospheric temperature response to ambitious climate mitigation scenarios from RESCUE 

Sabine Bischof and Nadine Mengis

Limiting global warming in line with the objectives of the Paris Agreement requires rapid global emission reductions. Considering current policy, it is very likely that these reductions will not be enough and that the implementation of Carbon Dioxide Removal (CDR) measures is needed in addition. Within the RESCUE project ambitious climate mitigation scenarios were designed with the same end-of-century carbon emission budgets (1150 Gt CO2 and 500 Gt CO2) with and without overshoot. This allows us to investigate potential Earth system responses to the application of different activity-driven CDR portfolios using emissions-driven Earth System Model (ESM) simulations. The CDR measures implemented in these scenarios include bioenergy with carbon capture and storage, direct air capture and storage, afforestation and reforestation, and ocean alkalinity enhancement.

Here, we present initial results from using the RESCUE scenarios in our FOCI climate model, which is one of five ESMs involved in the RESCUE project. Based on our FOCI simulations, we investigate the differences of atmospheric temperature in the overshoot and stabilization pathways to evaluate how fast climate mitigation measures are detectable in the global climate system. Acknowledging detection challenges in global ESM experiments in the context of ambitious mitigation pathways, we extend our analysis to include stratospheric temperature responses, expecting a more distinct signal-to-noise ratio compared to the troposphere.

How to cite: Bischof, S. and Mengis, N.: Atmospheric temperature response to ambitious climate mitigation scenarios from RESCUE, EGU General Assembly 2026, Vienna, Austria, 3–8 May 2026, EGU26-18277, https://doi.org/10.5194/egusphere-egu26-18277, 2026.

EGU26-19913 | Posters on site | CL3.2.1

Is permafrost thaw reversible in policy-relevant overshoot scenarios?  

Camilla Mathison, Rebecca Varney, Daniel Hooke, Eleanor Burke, T.Luke Smallman, and norman steinert

The northern permafrost regions contain significant amounts of carbon and are warming at approximately 3-4 times the global rate. Understanding the response of these carbon stocks under policy-relevant overshoot scenarios is a priority for climate policy. The Illustrative Mitigation Pathways (IMPs) were policy relevant pathways in AR6 designed to limit warming to 2°C. ESM simulations are not available for these scenarios, so regional information is unavailable for these mitigation pathways.

Here, we use output from a simple climate model that has run a selection of IMPs to drive the UK land surface model JULES, with an improved and explicit representation of permafrost processes compared to the standard version used in CMIP6. Our simulations include probabilistic estimates of uncertainty in future projections derived from climate sensitivity and the spatial patterns of CMIP6 ESMs.  

With the CMIP6 version of JULES, permafrost extent is reversible when global warming is reduced, even under high warming levels. However, the updated version of JULES shows a delayed recovery of permafrost extent beyond 2300 (i.e. no recovery had begun) when warming levels are reduced to 2°C. In addition, a sink-to-source transition in the northern high latitudes is more likely with explicit permafrost, and despite the temperature falling again remains a source until 2300 in many of the simulations, i.e. largely an irreversible change. 

How to cite: Mathison, C., Varney, R., Hooke, D., Burke, E., Smallman, T. L., and steinert, N.: Is permafrost thaw reversible in policy-relevant overshoot scenarios? , EGU General Assembly 2026, Vienna, Austria, 3–8 May 2026, EGU26-19913, https://doi.org/10.5194/egusphere-egu26-19913, 2026.

EGU26-20234 | ECS | Posters on site | CL3.2.1

Probabilistic assessment of land-based carbon dioxide removal and biospheric feedbacks under overshoot pathways 

Biqing Zhu, Thomas Gasser, Xinrui Liu, and Danni Zhang

Limiting global warming to 1.5 °C is increasingly likely to involve temporary temperature overshoot followed by large-scale deployment of carbon dioxide removal (CDR). However, the effectiveness and reversibility of overshoot pathways remain uncertain due to climate–biosphere feedbacks and disturbance processes that may undermine net-negative emissions.

Here we present a probabilistic assessment of land-based CDR under overshoot scenarios using the reduced-complexity Earth system model OSCAR, extended with two new modules: OSCAR-Crop and OSCAR-Fire. OSCAR-Crop emulates climate–crop yield interactions for major food and bioenergy crops using Monte Carlo ensembles trained on complex crop model intercomparisons and field experiments, enabling efficient exploration of uncertainty in biomass availability for BECCS. OSCAR-Fire represents wildfire occurrence and post-fire carbon dynamics as functions of climate, vegetation, and human drivers, capturing both immediate emissions and delayed carbon losses as well as post-disturbance recovery.

We apply the fully coupled OSCAR framework to peak-and-decline pathways that temporarily exceed 1.5 °C before returning to lower warming levels through net-negative emissions. Results highlight substantial regional and probabilistic uncertainty in achievable carbon removal, driven by climate impacts on crop productivity, wildfire-induced carbon losses, and feedbacks between warming, land carbon sinks, and disturbance regimes. Our findings indicate that large-scale CDR deployment in overshoot pathways is constrained not only by socio-economic feasibility but also by nonlinear Earth system responses that may limit reversibility and increase climate risks.

How to cite: Zhu, B., Gasser, T., Liu, X., and Zhang, D.: Probabilistic assessment of land-based carbon dioxide removal and biospheric feedbacks under overshoot pathways, EGU General Assembly 2026, Vienna, Austria, 3–8 May 2026, EGU26-20234, https://doi.org/10.5194/egusphere-egu26-20234, 2026.

EGU26-20544 | Orals | CL3.2.1

Impacts of land-use-environment interactions on sources and sinks of CO2 

Julia Pongratz, Clemens Schwingshackl, Richard A. Houghton, and Mike O'Sullivan

We are at a turning point in the history of land use: While the main purpose of land use over millennia had been food and fibre production, its huge side-effects on the Earth system became discernible. Though global land use, dominated by deforestation, was historically a driver of global warming, the potential to deploy certain land-use practices such as reforestation for climate change mitigation became evident and land-use an important part of climate policies. Understanding the interactions of land-use change and the Earth system under future climates is thus of paramount importance to ensure policy pathways are compatible with the Paris Agreement.

Historically, land-use change has profoundly depleted terrestrial carbon stocks, contributing roughly one third of historical anthropogenic CO₂ emissions. The entire land biosphere (including land-use change) has, however, acted as a major sink in recent decades, as it strongly responded to environmental changes such as rising atmospheric CO₂, which outweighed the land-use change emissions. These dual drivers – land-use changes and environmental changes – have motivated extensive efforts to quantify land–atmosphere carbon fluxes, leading to the parallel development of bookkeeping models and process-based models, which are now increasingly linked. However, once land-use change and environmental responses are considered jointly, carbon flux attribution becomes non-unique: land-use decisions and environmental change interact to generate synergistic fluxes that blur the distinction between “anthropogenic” and “natural” sources and sinks.

Here, we review the evolution and integration of land use in carbon-cycle modeling and synthesize the current understanding of land-use-environment interactions, focusing on their implications for global and national carbon budgets and future mitigation pathways. We show that synergistic effects – such as replaced and (re-)established sinks and sources – are not secondary details and discuss how recent advances have enabled a consistent treatment of these synergies in the Global Carbon Budget, while highlighting why this attribution remains, in part, a policy choice rather than a purely scientific one.

Finally, we argue that land-use–environment synergies will become increasingly consequential in the future, as land-based mitigation expands, carbon dioxide removal scales up, and climate impacts intensify. Robustly projecting the net land carbon balance will therefore require renewed attention to these interactions, supported by improved process understanding, modeling capabilities, and transparent accounting conventions. Recognizing and consistently treating land-use–environment synergies is essential for robust carbon budgeting and for assessing the effectiveness and risks of land-based climate mitigation in a rapidly changing climate.

How to cite: Pongratz, J., Schwingshackl, C., Houghton, R. A., and O'Sullivan, M.: Impacts of land-use-environment interactions on sources and sinks of CO2, EGU General Assembly 2026, Vienna, Austria, 3–8 May 2026, EGU26-20544, https://doi.org/10.5194/egusphere-egu26-20544, 2026.

EGU26-20551 | ECS | Orals | CL3.2.1

Weaker than expected future ocean carbon uptake due to carbon-climate feedbacks 

Christopher Danek, Özgür Gürses, and Judith Hauck

The global ocean and terrestrial carbon dioxide (CO2) sinks have removed approximately half of the total anthropogenic carbon emissions emitted to the atmosphere since 1850. Robust estimates of future carbon uptake are paramount to determine Paris Agreement compatible remaining greenhouse gas emission budgets including negative emission pathways to balance hard to abate emissions. Missing carbon-climate feedbacks in state-of-the-art greenhouse gas concentration-driven Earth System Models (ESMs), however, render future carbon cycle estimates uncertain. Here, historical and future ocean and land carbon uptake estimates from emissions-driven CMIP6 experiments conducted with AWI-ESM-1-REcoM are presented.

In the emissions-driven model setup, carbon-climate feedbacks and differences in the initial distribution of terrestrial vegetation lead to a reduced carbon source from anthropogenic land use changes, a smaller atmospheric CO2 growth and a substantially weaker oceanic and terrestrial carbon uptake increase until the 1970s, compared to the concentration-driven model setup. Thereafter, the terrestrial CO2 sink increases stronger in the emissions-driven setup, leading to similar atmospheric CO2 growth in both model setups by the end of the historical period. In the future, ocean and land carbon sinks respond distinctively to both model setup and scenario forcing before peak emissions, between peak emissions and peak atmospheric CO2, and before and after net zero emissions. The land sink in particular continues to increase stronger than the ocean sink after peak atmospheric CO2. By the end of the 21st century, carbon-climate feedbacks yield atmospheric CO2 concentrations considerably lower by 17 to 42 ppm and a weaker ocean carbon sink in the emissions-driven model setup, with the largest differences in strong mitigation scenarios. As emissions-driven ESM setups are recommended for the upcoming CMIP7, these model results stress the need to improve our understanding of the future evolution of the global carbon sinks.

How to cite: Danek, C., Gürses, Ö., and Hauck, J.: Weaker than expected future ocean carbon uptake due to carbon-climate feedbacks, EGU General Assembly 2026, Vienna, Austria, 3–8 May 2026, EGU26-20551, https://doi.org/10.5194/egusphere-egu26-20551, 2026.

EGU26-20558 | Orals | CL3.2.1

Climate overshoot legacy: Distinguishing transient biophysical change from irreversible socioeconomic loss 

Edward A. Byers, Alaa Al Khourdajie, Anna Pirani, Carl Schleussner, and Rupert Stuart-Smith

Current climate policy debates increasingly refer to “overshoot” pathways; temporarily exceeding 1.5°C before returning to safe levels via net-negative emissions. Yet, this conflates geophysical recovery with socioeconomic recovery. Temperature decline does not entail that affected systems, livelihoods, settlements, institutions, recover as a result. Current literature lacks a framework for assessing when, and for whom, overshoot impacts persist as permanent legacies. This paper addresses that gap. We characterise overshoot along its three dimensions that govern system response: magnitude, duration, and rate of change. We distinguish between biophysical hazard persistence: transient hazards that recede with temperature versus persistent hazards that do not, and socioeconomic reversibility: systems that recover post-overshoot versus those that cross thresholds and do not return. Whether a socioeconomic system follows a reversible or irreversible trajectory depends on the determinants of risk: hazard characteristics combined with exposure, pre-existing societal vulnerability and response. Applying this framework to key sectors (e.g. agriculture, health, and coastal systems) we show that societal vulnerability effectively lowers the threshold for irreversibility. The same physical overshoot may constitute a manageable adaptation challenge for high-capacity systems but trigger permanent loss for vulnerable ones. Furthermore, persistent biophysical change compounds this risk by degrading the ecosystems required for carbon dioxide removal, potentially constraining the very mechanisms needed for temperature reversal. The principal danger of overshoot, we argue, lies in the accumulation of irreversible socioeconomic legacies, with direct implications for climate justice and Loss and Damage frameworks.


How to cite: Byers, E. A., Al Khourdajie, A., Pirani, A., Schleussner, C., and Stuart-Smith, R.: Climate overshoot legacy: Distinguishing transient biophysical change from irreversible socioeconomic loss, EGU General Assembly 2026, Vienna, Austria, 3–8 May 2026, EGU26-20558, https://doi.org/10.5194/egusphere-egu26-20558, 2026.

EGU26-22552 | ECS | Orals | CL3.2.1

Irreversibility of permafrost region carbon pool changes under temperature overshoot scenarios 

Takuma Mihara, Kirsten Zickfeld, and Andrew MacDougall

Most pathways that meet the Paris Agreement goal of limiting the global temperature increase to well below 2 °C above preindustrial levels will require a temporary exceedance (“overshoot”) of the target temperature and subsequent restoration of the target with net negative carbon dioxide emissions. If the target temperature is exceeded, a larger proportion of frozen soils in the northern high-latitude permafrost region is expected to thaw, releasing additional carbon into the atmosphere through microbial respiration. This study investigates whether permafrost soil carbon loss during the temperature overshoot phase is reversible if the temperature is restored to its target level. To attain this goal, we force an Earth system model of intermediate complexity that includes representation of permafrost carbon processes with a set of future scenarios with varying magnitudes and durations of cumulative CO2 emissions overshoot. Results show that high-latitude soil carbon loss and recovery in response to overshoot is dependent on peak warming and the duration of time excess warming is held. Continued decline of the permafrost region soil carbon pool following restoration of the target temperature suggests that changes are irreversible for at least several centuries.

How to cite: Mihara, T., Zickfeld, K., and MacDougall, A.: Irreversibility of permafrost region carbon pool changes under temperature overshoot scenarios, EGU General Assembly 2026, Vienna, Austria, 3–8 May 2026, EGU26-22552, https://doi.org/10.5194/egusphere-egu26-22552, 2026.

EGU26-23146 | Posters on site | CL3.2.1

Evaluation of N-limitation effect in 1% CO2 scenario 

Georgii Nerobelov, Hideki Ninomiya, Jan Engel, Veronika Gayler, Cheng Gong, Pin-hsin Hu, Julia Nabel, Karolina Slominska-Durdasiak, Reiner Schnur, Tobias Stacke, Roland Wirth, and Sönke Zaehle

Rising atmospheric CO2 enhances the land carbon (C) uptake, providing a negative feedback mechanism for atmospheric CO2. At the same time, CO2-driven warming of land and air temperature tends to weaken land carbon storage, providing a primarily positive feedback on climate (i.e. intensifying climate change). The magnitude of these effects is, beside others, mediated by the nitrogen (N) content in land, which attenuates the land C response to atmospheric CO2 and climate [Kou-Giesbrecht et al., 2025]. Comprehensive Earth System Models (ESMs) have been developed to project effects from different feedbacks on Earth’s climate change, but to date not all ESMs take into account effects from the coupled C-N cycles.

ICON is a state of the art ESM [Jungclaus et al., 2022], yet its initial land surface model (LSM) implementation JSBACHv4.3 [Schneck et al., 2022] does not include a representation of the N-cycle. Recently, the QUINCY model [Thum et al., 2019] was integrated into the ICON framework. While the geophysical processes of the initial LSM JSBACHv4.3 are taken over, the new QUINCY configuration provides an alternative representation of the vegetation and biogeochemical processes, including a more realistically representation of vegetation structure (e.g. by coupling the LAI to the available carbon) and a comprehensive representation of the terrestrial N-cycle processes.

In the current study, we apply ICON in its ICON-XPP configuration [Müller et al. 2025] and with QUINCY as configuration for ICON-Land to evaluate the N-effect on land C uptake under conditions of 1%CO2 increase in the atmosphere. For this purpose, two numerical AMIP experiments (sea surface temperature and sea ice are prescribed) were carried out for the period of 1850-2019. In one experiment only C cycle was considered, in another - C and N cycles. The modelling results will be analysed to evaluate a possible N limitation effect under the conditions of increasing atmospheric CO2.

How to cite: Nerobelov, G., Ninomiya, H., Engel, J., Gayler, V., Gong, C., Hu, P., Nabel, J., Slominska-Durdasiak, K., Schnur, R., Stacke, T., Wirth, R., and Zaehle, S.: Evaluation of N-limitation effect in 1% CO2 scenario, EGU General Assembly 2026, Vienna, Austria, 3–8 May 2026, EGU26-23146, https://doi.org/10.5194/egusphere-egu26-23146, 2026.

EGU26-1281 | ECS | Posters on site | BG8.11

Identifying upland blanket bog drainage channels using machine learning and very high resolution aerial remote sensing. 

Alice Watts, Wahaj Habib, and John Connolly

Peatlands only cover 3-4% of Earth’s terrestrial surface yet are globally important carbon stores, hydrological regulators and biodiversity hotspots. Blanket bog, a type of peatland, is a rare ecosystem type within the EU. Active and degraded blanket bogs are spatially abundant in Ireland covering ~11% of the country. EU Natura 2000 protected areas includes ~167,000 ha of active blanket bog, of which 93% is in Ireland. Yet despite peat soils extending to 1.66 Mha of Ireland (~23.3%), more than 90% of these peatlands have experienced anthropogenically induced degradation. Land use change and digging artificial drainage challenges are key mechanisms of degradation: impacting biodiversity, hydrology and resulting in carbon and greenhouse gas emissions. Consequently, few actively functioning Irish upland blanket bogs remain. Rewetting, rehabilitation and restoration could be conducted to improve local biodiversity, water regulation and water purification, and reduce emissions.
Peatland rehabilitation relies on effective water table management, including blocking drainage ditches, to raise the local water table to promote  wetland vegetation. Drainage ditches are extensive in Ireland and extend to thousands of kilometres, but manual mapping is expensive and time consuming. Still, these drainage ditches must be mapped to identify potential areas for rehabilitation. Potential areas to be restored must be mapped  and quantified under the EU Nature Restoration Law and Biodiversity strategy. 
We aim to: (1) adapt a methodological workflow using deep learning and very high resolution aerial imagery to map artificial drainage ditches in Irish upland blanket bogs ; and (2) combine the model with other GIS analyses to indicate upland bog rehabilitation potential. Our work adapts previous raised-bog drainage mapping models, and utilises recent peatland and peaty soil extent maps to delimit the analysis to these regions. 
The model was tested in the Wicklow Mountain upland blanket bog region. Initial results show that the model is effective at recognising linear drainage ditches on upland blanket bogs regardless of depth. Early analysis depict 464km of drainage channels in Co. Wicklow (East Ireland). Incomplete or interrupted drainage ditches may indicate that some drains are over-grown or have filled in with peat. . Current Completeness, Correctness and Quality (CCQ) accuracy assessment  indicates that the model identified drainage ditches with ~73% Completeness, ~94% Correctness and ~70% Quality. False positives seem to be limited to deer tracks or gullies. The same approach will be implemented Co. Mayo and Co. Sligo (West Ireland) demonstrating the transferability of these methods and potential for upscaling to a national level. The outputs from this study will inform policy, governance and practice as these bodies work towards meeting peatland restoration targets indicated in they implement EU and National Law.

How to cite: Watts, A., Habib, W., and Connolly, J.: Identifying upland blanket bog drainage channels using machine learning and very high resolution aerial remote sensing., EGU General Assembly 2026, Vienna, Austria, 3–8 May 2026, EGU26-1281, https://doi.org/10.5194/egusphere-egu26-1281, 2026.

EGU26-2514 | Orals | BG8.11

Distinguishing pristine and drained peatland sites: How effective is open source Sentinel-2 imagery? 

Miriam Groß-Schmölders, Surya Gupta, and Christine Alewell

Peatlands are among the most carbon-dense terrestrial ecosystems and play a crucial role in climate regulation and landscape hydrology, while supporting a unique and highly specialized biodiversity. In response, several European countries have developed national peatland strategies to support conservation, restoration, and sustainable management. A major limitation in implementing these strategies is the lack of consistent, up-to-date, and spatially explicit information on peatland health. Many existing peatland inventories are affected by missing data, outdated classifications, or heterogeneous data quality, which restricts their applicability for monitoring and management. In a previous study (Gross-Schmoelders et al., 2025), we demonstrated that high-resolution PlanetScope satellite imagery provides reliable information on peatland health, showing strong agreement with biogeochemical soil properties and enabling a clear distinction between pristine and drained peatland areas. Building on these findings, the present study evaluates whether freely available Sentinel-2 data are equally effective in distinguishing pristine from drained peatlands. Sentinel-2 offers moderate spatial resolution (10 m), a revisit time of approximately five days, and global open access, making it a highly attractive data source for large-scale peatland monitoring. Our analysis covers 13 peatland sites across Europe, representing a wide range of climatic conditions, peatland types, and management histories. Both, established reference sites (Gross-Schmoelders et al., 2025) and newly introduced test sites are included to enhance the robustness and transferability of the results. We analyze a suite of vegetation, moisture, and surface indices commonly applied in peatland remote sensing, including NDVI, GI, gNDVI, EVI, FAPAR, SAVI, MSAVI2, and albedo. In addition, ground motion metrics are incorporated to capture surface dynamics related to drainage and peatland health. The analysis focuses on the early growing season, when differences in vegetation structure, productivity, and moisture conditions between pristine and drained peatlands are expected to be most pronounced, consistent with findings from our previous work. Preliminary results show that both Sentinel-2 and PlanetScope data reliably differentiate between pristine and drained peatland conditions across all sites, particularly when using NDVI, GI, and EVI. Preliminary results show that FAPAR, SAVI, and MSAVI2  also exhibit consistent differences between pristine and drained conditions. Overall, these results demonstrate that Sentinel-2 represents a robust, cost-effective, and scalable data source for peatland health assessment. This has direct relevance for remote sensing–based peatland monitoring and supports the development of consistent, comparable, and transparent peatland inventories. The findings highlight the strong potential of open-access satellite data to support national peatland strategies, large-area monitoring frameworks, and evidence-based ecosystem management.

Reference:

Gross-Schmölders, M., Gupta, S., Grady, M., Wania, A., Bengtsson, F., and Alewell, C., (2025) Building a Framework to Differentiate between Pristine and Drained Peatlands in Europe by comparing Molecular and Spectral Data (submitted).

How to cite: Groß-Schmölders, M., Gupta, S., and Alewell, C.: Distinguishing pristine and drained peatland sites: How effective is open source Sentinel-2 imagery?, EGU General Assembly 2026, Vienna, Austria, 3–8 May 2026, EGU26-2514, https://doi.org/10.5194/egusphere-egu26-2514, 2026.

EGU26-3011 | Posters on site | BG8.11

First Assessment of Greenhouse Gas Emissions from Austrian Peatlands under Different Land Management Intensities 

Barbara Lanthaler, Andreas Maier, and Stephan Glatzel

In Austria, peatlands cover an area of approximately 44,400 ha. Of these, two-thirds are drained and used for agriculture and thus are potential hotspots for greenhouse gas (GHG) emissions. This highlights the need for accurate GHG accounting and reporting. However, only Tier 1 IPCC emission factors are currently in use for Austrian peatlands, as the exact GHG balance is still unknown and is estimated using data from other countries. This creates substantial uncertainty, especially since Austria is home to a variety of peatland types with different characteristics and land management practices.

As part of the EU-funded LIFE project AMooRE (Austrian Moor Restoration), this research aims to fill this gap and assess, for the first time, the impact of different land management intensities on the emissions of CO2, CH4, and N2O in Austrian peatlands. A particular focus is placed on grassland management, as this is the most common practice in Austria, and on the benefits of extensification in reducing GHG emissions. By gaining an improved understanding of the relationship between abiotic factors, human management and GHG dynamics, the objective is to generate Tier 3 IPCC emission factors for Austrian peatlands subjected to varying land management intensities and therefore provide valuable data for national GHG accounting and the implementation of mitigation strategies.

Using manual dynamic gas flux chambers connected to portable CO2, CH4, and N2O gas analysers, field measurements are being conducted at five sites along a land management intensity and hydrological gradient in the Wörschacher and Irdninger Moor (Styria, Austria) over a two-year period, from January 2025 to December 2026. To complement gas flux data, meteorological conditions, important soil and hydrological parameters, and vegetation dynamics are being monitored continuously at all sites. Here we present the status of our research, including preliminary results and first modelling approaches. Initial findings show clear differences between the sites, with CO2 and CH4 emissions showing opposing behaviours and gradually changing along the gradient and clear N2O emission peaks after fertilisation events. Our results provide insights into the spatio-temporal variability in GHG fluxes of Austrian peatlands across different management intensities, highlighting the management role in influencing the dynamics of CO2, CH4, and N2O fluxes.

How to cite: Lanthaler, B., Maier, A., and Glatzel, S.: First Assessment of Greenhouse Gas Emissions from Austrian Peatlands under Different Land Management Intensities, EGU General Assembly 2026, Vienna, Austria, 3–8 May 2026, EGU26-3011, https://doi.org/10.5194/egusphere-egu26-3011, 2026.

EGU26-3262 | Posters on site | BG8.11

Evaluating impacts of national and international peatland policies and projects 

Alex Cobb, René Dommain, Joshua Ng, Fradha Intan Arassah, Erin Swails, and Yiwen Zeng

Impacts of peatland conservation and restoration—whether in the context of projects for carbon markets, or national and subnational policies to achieve nationally determined contributions—are important to evaluate in countries where conversion and use of peatlands contribute substantially to greenhouse gas emissions. Past and present emissions can be estimated based on emissions factors and observed land use. However, the benefits of peatland projects or policies must be evaluated relative to business-as-usual, requiring forecasting of future or counterfactual peatland conversion and use. To enable objective decision-making, forecasts should avoid overestimation of project or policy benefits and should provide some estimate of uncertainty.

We are developing an ensemble approach to generate aggregate baselines of business-as-usual greenhouse gas emissions from peatland conversion and use. Because the peatland community currently lacks a rich literature on predictors of land-use change, we apply a simple pixel-matching approach to produce an ensemble of land use trajectories collectively representing business-as-usual in a jurisdiction or region. Greenhouse gas emissions across all trajectories are averaged to produce an approximation of expected business-as-usual emissions. We believe this approach has the potential to produce better evaluations of the impacts of peatland projects and policies on greenhouse gas emissions, ecosystem services, and communities, and invite discussion regarding the role of the peatland research community in generating unbiased baselines.

How to cite: Cobb, A., Dommain, R., Ng, J., Arassah, F. I., Swails, E., and Zeng, Y.: Evaluating impacts of national and international peatland policies and projects, EGU General Assembly 2026, Vienna, Austria, 3–8 May 2026, EGU26-3262, https://doi.org/10.5194/egusphere-egu26-3262, 2026.

EGU26-3561 | Orals | BG8.11

Impacts of Fire Disturbance on Carbon Dynamic and Ecosystem Recovery in a Blanket Bog Ecosystem 

Saw Min, Giulia Bondi, Alessandro Righetti, James Rambaud, and Rachael Murphy

Fire is an increasingly important disturbance in Atlantic blanket bogs, yet empirical evidence of its effects on carbon dynamics remains limited. This study quantified the immediate and short-term impacts of a burning event on ecosystem atmosphere carbon dioxide (CO2) exchange, vegetation loss, and post-fire recovery from a blanket bog in the North-West of Ireland in 2023. Continuous eddy-covariance (EC) measurements collected over three years (2023-2025) were analysed together with biomass sampling and burn severity mapping (dNBR) conducted in 2023.

Field scale measurements of  CO2 by EC quantified an emission event of 42.7 g C m-2 d-1during the burning window. Footprint-weighted biomass assessments indicated an above-ground vegetation carbon loss of 28.3 g C m-2, dominated by heather and graminoids, demonstrating that surface vegetation combustion was the primary contributor to the observed emission spike. Burn severity and field observations confirmed that combustion was surface limited, with no evidence of deep peat burning. Despite this disturbance, the bog remained a net annual carbon sink in all years analysed, indicating rapid functional recovery but reduced net carbon uptake in the later post-fire year. Annual net ecosystem exchange (NEE) remained within the range reported for blanket bogs under prevailing land management conditions.

Generalized additive models (GAMs) showed that post-fire CO2 exchange was primarily controlled by solar radiation and air temperature, with moisture related controls more pronounced in 2023 when the peat surface was exposed. Rapid graminoid regrowth and persistently high-water tables supported recovery of photosynthetic function and reduced moisture sensitivity by 2024.

Overall, the fire disturbance caused a distinct temporary carbon loss, with emissions during the burn substantially exceeding pre-fire emissions. Despite this disturbance, the ecosystem remained a net annual carbon sink, and post fire carbon recovered quickly due to intact hydrology and shallow burn severity. These findings demonstrate that Atlantic blanket bogs can exhibit high resilience to low-moderate severity surface fires and highlight the importance of maintaining high water tables and peatland condition to minimize fire related carbon losses under future climate change.  

Keywords: Atlantic blanket bog, fire disturbance, eddy covariance, CO2 exchange, burn severity, post-fire recovery

How to cite: Min, S., Bondi, G., Righetti, A., Rambaud, J., and Murphy, R.: Impacts of Fire Disturbance on Carbon Dynamic and Ecosystem Recovery in a Blanket Bog Ecosystem, EGU General Assembly 2026, Vienna, Austria, 3–8 May 2026, EGU26-3561, https://doi.org/10.5194/egusphere-egu26-3561, 2026.

EGU26-4006 | ECS | Orals | BG8.11

Climate-change-induced degradation of mires in Eastern Alps: A comprehensive resampling study of 200 mires after 35 years 

Pamela Alessandra Baur, Gert Michael Steiner, and Stephan Glatzel

Mires are among the most valuable and endangered ecosystems in the world. In the Alps, they are an integral component of the region’s natural, geographical, climatic, and cultural-historical diversity. Mires have been used by humans in many ways. Recent climatic changes and other human influences on mires are suspected of altering species composition. However, this assumption has never been comprehensively tested across a large number of mire sites in the Eastern Alps.

This study aimed to expand knowledge regarding the response and resilience of mire habitats and biodiversity after 35 years of environmental and anthropogenic influences and to determine the current state of native mire diversity in the Eastern Alps. In summer 2023, the vegetation of about 200 Austrian mires was resampled through more than 1000 vegetation surveys and compared with the plant diversity of the same mires recorded in the Austrian Mire Conservation Catalogue (Steiner, 1992) about 35 years ago (1984–1988).

Each vegetation survey was assigned EUNIS habitat types (Chytrý et al., 2020), regions, protection status, and altitude. We used indicator values of light, temperature, nutrients, reaction (pH), aeration, and moisture (Landolt et al., 2010) to examine the conservation status of these alpine mires and changes in climatic and edaphic site factors. Additionally, we analyzed long-term changes in plant diversity based on species richness, plant types, and red lists. The collected data supported selecting mires for restoration during the project period.

We compared the vegetation of mires from 1988 to 2023 and found that all six mire habitat types had degraded on average after 35 years due to less moisture, more nutrients, less light, and more aeration. The exceptions were Non-calcareous quaking mire, which showed no significant change in nutrients, and Tall-sedge bed, which showed only an average increase in aeration. An increase in the mean temperature indicator value, independent of altitude, was observed only for Poor fen in Northern and Central Alps.

On average, we observed a significant increase in plant species richness in all mire habitat types except Tall-sedge bed. The increase is attributable to species on the red list with the status “least concern”, as well as to woody plants and other herbaceous plants. This trend may not be positive for mires, as it suggests an increase in generalists rather than mire specialists.

We observed a reduction in typical mire plant types, such as a significant decline in mean peat moss (Spaghnum sp.) cover in Raised bog and a significant decline in mean sedge cover, except for Poor fen and Tall-sedge bed.

About one-third of all studied mire habitats showed negative trends regarding moisture, nutrients, and light. However, half were resilient in some way (only slight changes), and about 5 % even showed improvements (positive trends).

How to cite: Baur, P. A., Steiner, G. M., and Glatzel, S.: Climate-change-induced degradation of mires in Eastern Alps: A comprehensive resampling study of 200 mires after 35 years, EGU General Assembly 2026, Vienna, Austria, 3–8 May 2026, EGU26-4006, https://doi.org/10.5194/egusphere-egu26-4006, 2026.

EGU26-4015 | ECS | Orals | BG8.11

Water table and temperature dynamics control CO2 emission estimates from peatlands under rewetting and climate change scenarios 

Tanja Denager, Jesper Riis Christiansen, Raphael Johannes Maria Schneider, Peter Langen, Thea Quistgaard, and Simon Stisen

To mitigate agricultural greenhouse gas emissions, Danish ministerial agreements have initiated a land-use transformation of historical dimensions, focusing on restoring and rewetting extensive peatland areas currently used for agriculture. In addition, a CO2-equivalent tax on emissions from organic peatlands is scheduled to be implemented from 2028. This study informs discussions on requirements and best practices for rewetting and peatland restoration and highlights the importance of including changing climate conditions and rewetting management scenarios in future peatland management strategies.

The study integrates process-based hydrological modeling and empirical CO2 flux modeling at a daily temporal resolution to evaluate how peatland hydrology influences CO2 emissions under scenarios of rewetting and climate change.

Following the calibration of a three-dimensional transient distributed hydrological model for a peat-dominated catchment, daily groundwater table dynamics were simulated to represent hydrological conditions in drained peat soils. These simulations were coupled with an empirical CO2 flux model, developed from a comprehensive daily dataset of groundwater table depth, temperature, and soil CO2 flux measurements. The novel empirical CO2 flux model captures a clear temperature-dependent response of soil CO2 emissions to variations in groundwater table depth.

By applying this coupled modeling framework, we quantified CO2 emissions at daily timescales. The results demonstrate that incorporating both temperature sensitivity and high-resolution temporal variability in water level significantly influence projections of CO2 fluxes. In particular, high CO2 emissions are expected in cases of co-occurrence of elevated air temperature and low groundwater tables. Using 17 different climate projections from the Euro-CORDEX regional climate modeling project, we simulated future groundwater table depth and temperature-dependent CO2 emissions. We find increased emissions due to increased temperatures, which, however, can be counter-balanced (in the Danish case) or amplified depending on the future trend in groundwater table depth.

Our results further demonstrate that rewetting strategies that achieve near-surface groundwater tables mainly during winter result in only marginal emission reductions compared to drained conditions. Conversely, near-surface groundwater tables in summer offer more effective reductions (up to 50%).

The study illustrates the value of combining detailed hydrological simulations with emission models.

How to cite: Denager, T., Riis Christiansen, J., Johannes Maria Schneider, R., Langen, P., Quistgaard, T., and Stisen, S.: Water table and temperature dynamics control CO2 emission estimates from peatlands under rewetting and climate change scenarios, EGU General Assembly 2026, Vienna, Austria, 3–8 May 2026, EGU26-4015, https://doi.org/10.5194/egusphere-egu26-4015, 2026.

EGU26-5161 | ECS | Orals | BG8.11

Beyond the Forests: Peatlands as Dominant Carbon Stores in Coastal British Columbia 

Hanna Rae Martens and Jürgen Kreyling

Peatlands are significant carbon sinks, and yet their carbon stocks and extents in coastal British Columbia, Canada, remain largely unquantified. We conducted a field assessment to estimate above- and belowground carbon stocks at six peatland sites across the coast of British Columbia. These values were compared with regional aboveground carbon stock estimates. We found that coastal peatlands store approximately three times more carbon than adjacent temperate rainforests. These results underscore the importance of peatlands, and highlight a need for improved mapping and assessment. In particular, our results demonstrate a substantial gap in our understanding of the carbon stocks and spatial extent of peat-forming swamps in this region.

How to cite: Martens, H. R. and Kreyling, J.: Beyond the Forests: Peatlands as Dominant Carbon Stores in Coastal British Columbia, EGU General Assembly 2026, Vienna, Austria, 3–8 May 2026, EGU26-5161, https://doi.org/10.5194/egusphere-egu26-5161, 2026.

EGU26-5865 | ECS | Posters on site | BG8.11

Carbon dynamics in Danish peatlands under changing climate 

Clara Aguilar Vilar, Carla Cruz Paredes, and Simon Herzog

Peatlands cover around 3% of the Earth's land surface and store a significant portion of the world's soil carbon, about twice as much as the world's forests combined. These unique ecosystems are characterized by waterlogged, anoxic, and typically acidic conditions that inhibit microbial decomposition, leading to carbon accumulation and playing a vital role in the global carbon cycle. Peatlands serve as large carbon sinks; however, anthropogenic disturbances, such as draining and water table lowering for agriculture, or peat extraction for fuel and horticulture substrates, can convert them into carbon sources of greenhouse gases (GHG), such as carbon dioxide (CO2) and methane (CH4), which have led to increasing efforts to restore peatlands as a nature-based climate solution.

Although extensive research has improved our understanding of carbon dynamics in peatlands, including restored sites, long-term assessments remain limited. Yet, these assessments are essential for capturing climate variability and its impacts. Continuous gas monitoring, combined with physicochemical and microbial analyses, is therefore essential to evaluate the effectiveness of restoration efforts in terms of carbon sequestration. At the same time, there is a remaining knowledge gap regarding the role of microbial communities in carbon sequestration and GHG emissions. Therefore, this study aims to investigate how peatland restoration practices affect microbial activity and GHG fluxes in Danish peatlands across different seasons and years.

The study areas are located in Store Åmose, a Danish nature park on Zealand that comprises diverse peatland systems protected under the Natura 2000 network. Historically, these peatlands were converted to agriculture, forestry, and other land uses. Three sites have been selected: (i) a high water-table bog restored in 2017; (ii) a low water-table bog in a naturally forested state that has not been restored; and (iii) a high water-table fen  with a diverse, undisturbed plant community. At each site, in situ GHG emissions of CO₂ and CH₄ are measured using gas flux chambers, and soil samples are collected at three depths to assess soil physicochemical properties and microbial activity.

Preliminary results indicate that peatland restoration reduces GHG fluxes (CO₂ and CH₄). Middle and deeper soil layers in restored and non-restored bogs show similar C:N ratios and bacterial biomass, with the high C:N ratios suggesting that substantial organic carbon remains stored in the peat. Meanwhile, bacterial growth in surface layers appears to be primarily influenced by climate and vegetation, whereas deeper layers are more similar across sites. Warmer and wetter periods seem to enhance both CO2 fluxes and microbial activity, likely driven by seasonal variations in temperature and moisture.

Understanding the relationship between microbial activity and carbon fluxes is crucial for improving our knowledge of these ecosystems and developing effective management strategies to reduce emissions and restore degraded peatlands.

How to cite: Aguilar Vilar, C., Cruz Paredes, C., and Herzog, S.: Carbon dynamics in Danish peatlands under changing climate, EGU General Assembly 2026, Vienna, Austria, 3–8 May 2026, EGU26-5865, https://doi.org/10.5194/egusphere-egu26-5865, 2026.

EGU26-7144 | ECS | Orals | BG8.11

Improving national peat depth inventories with terrain-based digital soil mapping: evidence from Norway 

Julien Vollering, Naomi Gatis, Mette Kusk Gillespie, Karl-Kristian Muggerud, Sigurd Daniel Nerhus, Knut Rydgren, and Mikko Sparf

Accurate mapping of peat depth is crucial for carbon accounting, areal planning, and land management in peatlands. However, existing maps often lack the resolution and accuracy needed for these purposes, even in countries with rich spatial data sets.

We present a study that evaluated whether digital soil mapping using remotely sensed data could improve existing maps of peat depth across two, >10 km2 sites in western and southeastern Norway. We measured peat depth by probing and ground-penetrating radar at 372 and 1878 locations at the two sites, respectively. Then we trained Random Forest models using radiometric and terrain variables, plus the national map of peat depth, to predict peat depth at 10 m resolution.

The two best models achieved mean absolute errors of 60 and 56 cm, explaining one-third of the variation in peat depth. Our remote sensing models had better accuracy than the national map of peat depth, even when we calibrated the national map to the same depth data. Terrain variables were much better predictors than radiometric variables, with elevation and valley bottom flatness showing the strongest relationships to depth. At our coastal site, peats were much deeper above the Holocene marine limit than below, emphasizing the importance of accumulation time in places that have experienced glacial isostatic adjustment. Meanwhile, the national map of peat depth itself carried much more information about peat depth at one of the sites than the other --- likely as a result of uneven historical field sampling. 

Based on these findings, we conclude that digital soil mapping with DTM-derived predictors can improve the existing, national map of peat depth in Norway. Doing so would support national and regional-scale peatland carbon stock assessments and land management policies, as well as specific areal planning decisions at the municipal scale. Since our remote-sensing models relied on predictor--depth relationships that were specific to the sites we mapped, more depth measurements would be needed to expand the spatial coverage of an improved national map. A structured surveying effort coordinated in the manner of, or in conjunction with, the National Forest Inventory would be an efficient way to collect these data. Better data infrastructure for hosting and compiling peatland parameters from opportunistic measurements would also accelerate the accumulation of accuracy improvements. Besides specific accuracy improvements, digital soil mapping of peatland also offers advantages in transparency, reproducibility, and updatability.

How to cite: Vollering, J., Gatis, N., Kusk Gillespie, M., Muggerud, K.-K., Nerhus, S. D., Rydgren, K., and Sparf, M.: Improving national peat depth inventories with terrain-based digital soil mapping: evidence from Norway, EGU General Assembly 2026, Vienna, Austria, 3–8 May 2026, EGU26-7144, https://doi.org/10.5194/egusphere-egu26-7144, 2026.

EGU26-7410 | ECS | Posters on site | BG8.11

Six years of changing open-water cover across the peatlands of the Western Siberian Lowlands 

Daniel Colson, Paul Morris, Duncan Quincey, and Mark Smith

The Western Siberian Lowland (WSL) is the world’s largest peatland complex, containing vast areas of permafrost and non-permafrost peatland. Peatlands of the WSL feature extensive surface water cover. These pools play important roles in aquatic biodiversity and biogeochemical cycling, particularly of carbon, but are thought to be changing in response to climate. Synthetic Aperture Radar (SAR) satellite data are currently under-utilised for spatiotemporal peatland monitoring at large spatial scales. We analysed changing open-water cover across the WSL from Sentinel-1 SAR imagery. Our research illustrates the highly dynamic systems behaviour across the WSL with inter-year inundation dynamics observed. The cloud-computing basis of our method gives it clear potential for monitoring high-latitude regions. This potential will be realised through the recently funded NERC project, Antheia, which we also introduce here. Antheia will quantify recent and ongoing changes in northern peatland pools at a hemispheric scale and identify the drivers of change.

How to cite: Colson, D., Morris, P., Quincey, D., and Smith, M.: Six years of changing open-water cover across the peatlands of the Western Siberian Lowlands, EGU General Assembly 2026, Vienna, Austria, 3–8 May 2026, EGU26-7410, https://doi.org/10.5194/egusphere-egu26-7410, 2026.

EGU26-11927 | ECS | Posters on site | BG8.11

Limited climate benefits of rewetting a shallow drained peatland when interannual variabilities in CO2 and CH4 fluxes are considered  

Cheuk Hei Marcus Tong, Johannes Wilhelmus Maria Pullens, Rasmus Jes Petersen, Rasmus Rumph Frederiksen, and Poul Erik Lærke

Rewetting of agricultural peatlands is widely recognised as a key climate mitigation strategy, yet its net effect remains uncertain, particularly during the early transition years. We conducted a multi-year study using continuous eddy covariance measurements to quantify carbon dioxide (CO2) and methane (CH4) fluxes across two peatland fields undergone rewetting and an adjacent shallow-drained control field in Denmark. Rewetting raised the mean annual water table level by ~7 cm relative to the control when side-by-side comparisons were possible. Our results demonstrate that rewetting can rapidly shift the ecosystem carbon balance toward net CO2 uptake, likely due to the successful establishment of productive vegetation such as Phalaris arundinacea prior to rewetting. Early vegetation development may therefore accelerate CO2 uptake compared with slower trajectories observed in more degraded peatlands. However, this benefit can be partially offset by increased CH4 emissions, particularly during wet periods, which can rival the CO2 sink strength and reduce the overall greenhouse gas mitigation potential. Even in shallow-drained control areas, modest increases in water table during wet years were sufficient to temporarily reverse net carbon loss, highlighting the sensitivity of early outcomes to hydrological conditions. Management practices, such as autumn biomass cutting, further influenced CO2 exchange by enhancing early-season uptake, though biomass removal can partially offset these gains. Collectively, our findings underscore that the net climate effect of peatland rewetting depends strongly on interannual variability, water table dynamics, vegetation establishment, and management interventions. Long-term, ecosystem-scale monitoring is thus essential to capture the full spectrum of environmental variability and optimise restoration strategies for effective climate mitigation.

How to cite: Tong, C. H. M., Pullens, J. W. M., Petersen, R. J., Frederiksen, R. R., and Lærke, P. E.: Limited climate benefits of rewetting a shallow drained peatland when interannual variabilities in CO2 and CH4 fluxes are considered , EGU General Assembly 2026, Vienna, Austria, 3–8 May 2026, EGU26-11927, https://doi.org/10.5194/egusphere-egu26-11927, 2026.

EGU26-12880 | ECS | Orals | BG8.11

Quantification and mapping of carbon stocks in wetlands from southern Quebec, Canada 

Guillaume Primeau, Michelle Garneau, and Koreen Millard

Wetlands provide essential ecosystem services, including atmospheric carbon sequestration. In the context of climate change, these ecosystems offer a natural solution to mitigate greenhouse gas emissions. Unlike many European or tropical regions, Quebec and Canada still maintain vast carbon stocks that are largely unaffected by anthropogenic pressures. The conservation of these stocks acts as nature-based climate solution to mitigate climate change.

This project aims to document the distribution and quantify the carbon stored in southern Quebec’s wetlands that span over 75,000 km2and covering 9 different ecoregions. The study implies the development of a new dataset on peat depth, compiling over 40,000 data across marshes, swamps, fens, bogs, and forested peatlands. Using this database, we will compare three modeling approaches (Random Forest, LightGBM, and Generalized Additive Models [GAMs]) to identify the most important predictors of carbon storage. These models integrate the new peat depth dataset, some topographic indices derived from a DEM and reconstructed paleoclimatic data.

Furthermore, the study will explain how topographic and past climatic conditions influenced carbon distribution and composition across different wetland types. The results of this research will be synthesized into a map that will support decision for wetland conservation and management strategies, as well as for assessing carbon losses due to the alteration or destruction of some of these ecosystems. This project specifically focuses on identifying carbon hot spots, the areas with the largest carbon stocks, to prioritize their conservation.

How to cite: Primeau, G., Garneau, M., and Millard, K.: Quantification and mapping of carbon stocks in wetlands from southern Quebec, Canada, EGU General Assembly 2026, Vienna, Austria, 3–8 May 2026, EGU26-12880, https://doi.org/10.5194/egusphere-egu26-12880, 2026.

Peatlands cover just 3% of Earth's land surface, yet store an estimated 600-700 Pg carbon (PgC), approximately one-third of Earth's soil carbon, making them critical regulators of the global carbon cycle. However, peatland spatial extent remains highly uncertain, particularly at fine spatial scales and in data-sparse regions. Existing global peatland datasets rely on heterogeneous inventories and regional products, leading to large inconsistencies in both total peat area and spatial distribution. These limitations hinder accurate assessments of peatland-climate feedbacks, carbon budgets, national policy development, and restoration efforts. We propose a machine learning framework that combines a priori information from existing peat databases (PEATMAP, Global Peatland Database, and CORINE Land Cover) with satellite observations in the visible, together with topographic and hydrological information. Our methodology employs a neural network trained with 17 input variables including Landsat-8 surface reflectance, topographic attributes from the MERIT database (elevation, slope, distance to drainage, height above drainage), and water table depth data. The model first generates a continuous Peatland Index (PI) at 3 arc-second (~90m) resolution, that can be thresholded to obtain a binary peat classification. In regions with reliable coarse resolution peat information, the PI can be used to downscale it and obtain a coherent  high resolution peat classification. The obtained pan-boreal/Northern Hemisphere peatland map at 90m was evaluated through both quantitative and qualitative approaches. Fully independent validation using the Peat-DBase field dataset (over 180,000 peat and non-peat observations) demonstrates an overall accuracy of 68.4% and an F1-score of 0.80. Regional assessments show 69.2% overall accuracy (F1=0.81) in Eurasia and 63.8% (F1=0.74) in North America. Qualitative spatial evaluation across multiple case-study regions reveals that the proposed map successfully captures fine-scale spatial details absent in existing inventories, including explicit delineation of open water bodies, river networks, and topographic constraints on peatland distribution. The product exhibits improved spatial coherency with high-resolution imagery while remaining consistent with large-scale patterns from current peat databases. This work provides a spatially coherent, high-resolution peatland dataset spanning the Northern Hemisphere, offering improved capabilities for carbon stock estimation, hydrological modeling, and monitoring peatland degradation. Future improvements will incorporate SAR data, additional environmental drivers, and deep learning-based feature extraction to further enhance classification accuracy, spatial details, time-evolution, and peat information.

How to cite: Chen, M., Aires, F., and Ciais, P.: Coherent Northern peatlands retrieval at 90 m using machine learning based on satellite observations and a priori information, EGU General Assembly 2026, Vienna, Austria, 3–8 May 2026, EGU26-13217, https://doi.org/10.5194/egusphere-egu26-13217, 2026.

EGU26-14082 | ECS | Orals | BG8.11

Leveraging Long-Term, Multiscale Data to Understand Increased Carbon Release in an Alaskan Boreal Fen Complex 

Eleanor Serocki, Evan Kane, Eugenie Euskirchen, Catherine Dieleman, Laura Bourgeau-Chavez, Jeremy Graham, and Merritt Turetsky

Since 2005, the Alaska Peatland Experiment (APEX) has maintained experimentally manipulated water table levels in a rich fen to investigate how these key carbon sinks will function in an uncertain climatic future. This fen, located in an area of discontinuous permafrost, is representative of similar fens across interior Alaska, where they are considered significant carbon sinks and are projected to become more common on the landscape as climate and permafrost systems shift. Leveraging nearly twenty years of chamber and tower carbon-dioxide and methane flux data, as well as nearly a decade of both multispectral and SAR satellite data,[2]  we present an improved understanding of trends in trace gas fluxes in the context of a changing water table. We evaluate potential new functional patterns for rich fens, and endeavor to create time-series maps of total carbon flux using satellite systems.

            While water table position and carbon flux mapping via remote sensing platforms have been successful in other peatland systems, best practices for rich fens have not yet been established. Using the impressive temporal resolution of the APEX site, we compare a suite of historically successful multispectral and SAR indices to identify and implement carbon flux mapping across the site. Sentinel-1 SAR been used to successfully map variability in Water Table position with nearly 60% accuracy.

            Our research has found significant changes in the carbon flux of the fen, particularly within the last 10 years. Not only has the system overall become wetter, but the fen has begun to serve as a net source of carbon to the atmosphere, rather than a sink. [EK5] This change is largely due to increases in total methane production, as ecosystem respiration does not significantly change across both flooded conditions and water treatments. In the wettest years, when the water table remains above the soil surface for much of the growing season, CH4 accounts for nearly 8% of total carbon flux, more than four times that of the driest years. By considering both environmental and carbon flux trends across the entire data set, we are better able to understand and document the long-term changes in rich fen carbon fluxes and spatially [7] scale this understanding to the growing extent of this expansive ecosystem in interior Alaska.

How to cite: Serocki, E., Kane, E., Euskirchen, E., Dieleman, C., Bourgeau-Chavez, L., Graham, J., and Turetsky, M.: Leveraging Long-Term, Multiscale Data to Understand Increased Carbon Release in an Alaskan Boreal Fen Complex, EGU General Assembly 2026, Vienna, Austria, 3–8 May 2026, EGU26-14082, https://doi.org/10.5194/egusphere-egu26-14082, 2026.

EGU26-14138 | ECS | Orals | BG8.11

Spatial classification of peatland status using remote sensing and random forest 

Emmanuel Aduse Poku and Lisa Watson

12% of the disturbed peatlands in the world are known to contribute approximately 4% to global greenhouse gas emission, according to UNEP. Northern peatlands spread above latitude 45 N (e.g. in Canada, USA, Scandinavia and United Kingdon) are biomes where climate change may occur earlier and rapidly thus contributing to greenhouse gas emissions more than many other biomes around the world. Peatlands can be classified as either “intact” or “disturbed” to determine whether they could be CO2 sources or sinks yet, the classification process requires a remote sensing approach because of limited accessibility to physical locations and intensive nature of field mapping. The study presented here uses spectral reflectance from peatland surfaces, together with topographic and climatic properties of the environment to classify peatland areas across Scotland. Distinct spectral reflectance responses in visible red between 0.63 and 0.69 µm, near-infrared between 0.85 and 0.88 µm, and short-wave infrared between 1.6 and 2.2 µm of the optical electromagnetic spectrum, topography, climate and land surface temperature have been used to discriminate between peatlands. A random forest classifier was trained using a 70/15/15 train-validation split, to predict peatland status. The classifier achieved an overall accuracy (F1 Score) of 72%, with a class-level accuracy of 94% for Forested, 84% for Drained and Eroded, 67% for Modified, and 44% for Near-Natural Peatlands at 100m resolution.  Based on these results, a national Scottish peatland status map is modelled at 100-meter resolution, demonstrating the potential of using the model for large-scale peatland characterization. This work presents a remote-sensing-based classification framework to support peatland mapping and status monitoring.

How to cite: Aduse Poku, E. and Watson, L.: Spatial classification of peatland status using remote sensing and random forest, EGU General Assembly 2026, Vienna, Austria, 3–8 May 2026, EGU26-14138, https://doi.org/10.5194/egusphere-egu26-14138, 2026.

Ireland’s peatlands comprise up to 23.3% of the country’s area and up to 90% of these peatlands have been degraded [1]. It is crucial to understand these through modelling, because flooding, water quality, and carbon emission risks can be mitigated through the management of these ecosystems. Formerly extracted and degraded peatlands especially pose these risks due to increased uncertainty about the manner of their influence on biodiversity, hydrology, and water chemistry regardless of if they are restored, managed, or left alone. Ireland’s post-extraction peatlands are novel habitats, which will require more explicit parametrisation of vegetation types and quantities for adequate modelling.

This research carries out remote sensing and machine learning methods to identify habitats, subdivided into ranges of Plant Functional Types, in two rewetted Irish peatlands, which had formerly been extracted for fuel: Ballycon and All Saints, Co. Offaly. It attempts to link these habitats to calibrate the process-based model PVN in an Irish context.

Six habitat classes were generated for both sites using drone imagery and ArcGIS Pro’s Deep Learning library; in parallel, the method was applied to PlanetScope imagery at Ballycon using a Python Random Forest algorithm. Results yielded 72-77% accuracy for the different products, though this is highly dependent upon scale.

(ONGOING RESEARCH BELOW)

From this, locations were chosen to scale down to a single-dimension case at each site by ‘translating’ the habitat class for a given area into a range of areal cover per Plant Functional Type. This, alongside hydrological and geotechnical data collected in the field, can be used to develop scenarios for plant growth and carbon emissions, with potential for scaling up again to develop early-stage estimates about the whole site's carbon balance.


Paper on remote sensing approaches in prep. Publications relating to developing/calibrating PVN planned, but this work is ongoing.

[1] Gilet et al., 2025: https://doi.org/10.1016/j.landusepol.2025.107792

How to cite: Silva, M.: Classification and ecohydrological modelling of Irish post-extraction peatlands using Plant Functional Types: scenarios for rehabilitation, EGU General Assembly 2026, Vienna, Austria, 3–8 May 2026, EGU26-14293, https://doi.org/10.5194/egusphere-egu26-14293, 2026.

EGU26-15816 | ECS | Posters on site | BG8.11

Mapping Anthropogenic Disturbances in Canadian Boreal Peatlands using Satellite Imagery and a Machine Learning 

Sanghyeon Song, Oliver Sonnentag, Mary Kang, Matthew Fortier, Mélisande Teng, and Michelle Lin

Peatlands cover 12% of Canada's territory, primarily in the boreal and Arctic regions, and have the capacity to absorb and store significant amounts of carbon. They are therefore gaining attention as a nature-based climate solution, which involves protecting, managing, and restoring natural ecosystems from further degradation, thereby reducing greenhouse gas emissions. Canadian peatlands have been disturbed by human activities, which can convert peatlands from net carbon sinks (absorbing more than they release) into net carbon sources (releasing more than they absorb), and these disturbances have intensified in recent years. In this context, mapping anthropogenic disturbances in peatlands is crucial for effective monitoring and management of peatlands and ensuring they continue to serve as carbon sinks. Available maps of anthropogenic disturbances in peatlands are typically confined to specific regions, disturbance types, or time periods. Therefore, our goal is to develop a comprehensive Canada-wide map of anthropogenic disturbances, covering both historical and recent periods. To do this, we develop an automated framework for mapping current and historical anthropogenic disturbances in Canadian boreal peatlands. The framework leverages machine-learning–based image segmentation models applied to Landsat satellite imagery and is designed to process the full 40-year (1984 to 2024) satellite archive to generate multi-class disturbance maps (i.e., agriculture, forestry, resource extraction, transportation, industry, residential, seismic lines) across multiple decades. By comparing disturbance maps through time, the spatiotemporal dynamics of anthropogenic disturbances in boreal peatlands can be examined. The resulting maps provide a foundation for improved understanding of peatland disturbance patterns and support researchers investigating peatland–climate interactions, government agencies developing policies for peatland protection and restoration, and Indigenous communities working to safeguard their traditional lands.

How to cite: Song, S., Sonnentag, O., Kang, M., Fortier, M., Teng, M., and Lin, M.: Mapping Anthropogenic Disturbances in Canadian Boreal Peatlands using Satellite Imagery and a Machine Learning, EGU General Assembly 2026, Vienna, Austria, 3–8 May 2026, EGU26-15816, https://doi.org/10.5194/egusphere-egu26-15816, 2026.

EGU26-17915 | Orals | BG8.11

An assessment of Sentinel-2 multispectral satellite reflectance data for ecological mapping of temperate raised peatlands 

Zane Ferch, Corrado Grappiolo, Shane Regan, and Eoghan Holohan

Raised bogs are ombrotrophic peatlands defined by dome-like topography that is elevated above the water table. Once widespread in temperate northern Europe, their exploitation has necessitated special conservation status, which requires assessment of raised bog conditions at the scale of tens of thousands of hectares. Satellite remote sensing offers a solution to this challenge, but upscaling relationships between ground-based ecological surveys at temperate raised bogs and remotely sensed data are unclear. 

We provide a first statistical analysis of the relationship between ecological survey data obtained at temperate raised bogs at c. 80 m2 scale to multispectral remote sensing data recorded by the Sentinel-2 satellite at 100-400 m2 scale.  We analyse data from 34 images obtained in summer and winter of 2020-2025 in conjunction with 2827 ecological survey points recorded in 2023-2024 from six Irish raised bogs that cover an area of 3.91 km2. We test for correlations between ecological communities as established at each survey point and the reflectance spectra and amplitudes in the corresponding Sentinel-2 pixels. 

Our results show statistically significant differences between reflectance of pixels associated with the end-member ecological communities as well as in the broader classes of ‘active’ and ‘inactive’ raised bog habitat. Differences are most pronounced in red-edge and near infrared bands as well as indices composed of these bands. A general reduction of reflectance values in winter, likely related to phenology, moisture and solar radiance impacts, does not greatly diminish the statistical strength of differentiation between ecotopes. Winter images can be prone to frost/ice, however, which produces anomalous reflectance distributions that can be detected (and thus filtered) by principal component analysis. These findings help to underpin the use of multispectral data for large scale automated mapping of these vulnerable habitats via e.g. machine learning approaches.

How to cite: Ferch, Z., Grappiolo, C., Regan, S., and Holohan, E.: An assessment of Sentinel-2 multispectral satellite reflectance data for ecological mapping of temperate raised peatlands, EGU General Assembly 2026, Vienna, Austria, 3–8 May 2026, EGU26-17915, https://doi.org/10.5194/egusphere-egu26-17915, 2026.

EGU26-18264 | Posters on site | BG8.11

The first CO2 measurements by eddy covariance in natural and degraded peatlands in Latvia 

Jānis Bikše, Inga Retike, and Normunds Stivriņš

Peatlands play a crucial role in carbon sequestration, covering approximately 10-15 % of Latvia’s territory, with a large proportion drained for forestry or peat extraction. Peat is currently extracted on ~0.4 % of Latvia’s territory and largely exported. Despite their relevance for national greenhouse gas (GHG) balances, continuous ecosystem-scale CO2 flux measurements are absent in Latvia. Current GHG accounting relies on chamber campaigns and emission factors, limiting monitoring, reporting, and verification for restoration and climate mitigation.

To address this gap, we initiated the first deployment of autonomous eddy covariance (EC) Carbon Node systems (LI-COR) in Latvian peatlands to measure CO2 exchange together with ancillary environmental variables. The first unit was installed in August 2025 in an active peat extraction site (cutover bog), while a second unit is devoted to a natural raised bog. The distance between sites is < 5 km, ensuring similar regional meteorological conditions and enabling better comparative assessment of land-use impacts.

We present first operational results, focusing on data continuity and system performance, including the feasibility of solar-powered operation at northern mid-latitudes, which proved challenging during the winter of 2025/2026. Preliminary CO2 flux dynamics provide early insights into emission magnitude and temporal variability at the active extraction site. This initiative represents a foundational step toward long-term EC observations in Latvia with implications for national GHG accounting and evidence-based peatland restoration policy.

The study is supported by a donation from the "Mikrotīkls", which is administered by the University of Latvia Foundation and by the project PeatTransform (No. 6.1.1.2/1/25/A/001).

How to cite: Bikše, J., Retike, I., and Stivriņš, N.: The first CO2 measurements by eddy covariance in natural and degraded peatlands in Latvia, EGU General Assembly 2026, Vienna, Austria, 3–8 May 2026, EGU26-18264, https://doi.org/10.5194/egusphere-egu26-18264, 2026.

EGU26-18339 | Posters on site | BG8.11

Site Mapping to Inventory Accounting: Establishing Pre‑Restoration Baselines for Peatlands in The Netherlands and Belgium  

Ruchita Ingle, Laurent Bataille, Wietse Franssen, Wilma Jans, Corine van Huissteden, Hong Zhao, Ignacio Andueza Kovacevic, Ronald Hutjes, and Bart Kruijt

Peatland restoration is crucial to enhance climate mitigation potential and it’s important to have precise baseline scenario to analyze effectiveness of restoration efforts. This study develops a robust baseline scenario for peatlands undergoing restoration in the Netherlands and Belgium with a focus on the eco-hydrological and GHG emissions. Baseline conditions were mapped using detailed vegetation surveys, satellite data and water table depth (WTD) measurements. GHG emissions (CO₂ and CH₄) were estimated using the Greenhouse Gas Emission Site Types (GEST) framework, which links vegetation and hydrology classes to emission factors and enables systematic upscaling from site observations to regional inventories. To evaluate reliability, GEST derived estimates were compared with independent eddy covariance measurements. Results indicate that accurate mapping of vegetation hydrology strongly influences baseline emissions estimates and that GEST captures overall emission patterns while reflecting site‑specific variability. Follow up restoration scenarios and their regional scale implications are planned as a next step.

How to cite: Ingle, R., Bataille, L., Franssen, W., Jans, W., van Huissteden, C., Zhao, H., Andueza Kovacevic, I., Hutjes, R., and Kruijt, B.: Site Mapping to Inventory Accounting: Establishing Pre‑Restoration Baselines for Peatlands in The Netherlands and Belgium , EGU General Assembly 2026, Vienna, Austria, 3–8 May 2026, EGU26-18339, https://doi.org/10.5194/egusphere-egu26-18339, 2026.

EGU26-18584 | ECS | Posters on site | BG8.11

Advanced AI-Supported Peatland Vegetation Mapping using Remote Sensing for Environmental Monitoring  

Tom Ahlgrimm, Henriette Rossa, Timothy James Husting, Mario Trouillier, Milan Bergheim, Stefan Oehmcke, Gerald Jurasinski, and Daniel Lars Pönisch

Peatlands are complex ecosystems that provide a variety of ecosystem services, including the regulation of water. Peatlands also store huge amounts of carbon, thereby contributing to long-term climate protection. However, drainage and overuse are threatening these positive functions in many places. Consequently, numerous countries around the world have developed peatland conservation and restoration strategies. To support this process, monitoring approaches are needed that are suitable for areas that are difficult to access and for large-scale applications.

In previous studies, we conceptualized a methodology for the scalable monitoring of peatlands. A key component of this methodology is the automatic recognition of peatland plants. This methodology involves high-resolution drone images and metadata as input for an ecologically informed machine learning framework. We employ state-of-the-art deep learning segmentation architectures, such as DeepLabv3+ and OCRNet, which utilize a high-resolution network (HRNet) backbone. As a first step, we investigated the detectability of individual species, focusing on species for the initial class set for training the model.

Current project developments include expanding data-fusion strategies, model-architecture validation, and conceptualizing a new label strategy by introducing new vegetation class sets to address ecological issues and broaden applicability. We benchmarked multiple vegetation-classification architectures and optimized key hyperparameters via grid search to identify a robust domain-specific model. Auxiliary metadata (e.g., temperature sums, cloud cover) were integrated at different stages and early fusion (embedding metadata in the input data cube) techniques were compared with late-fusion approaches such as FiLM and feature weighting. Explainable AI was employed to identify the inputs that have the most significant impact on training and predictions. Vegetation indices (NDVI, EVI) were added as explicit input channels. As an additional target we evaluated plant dominance stand types instead of single species to better capture mixed stands. Furthermore, we expected dominance stands-based mapping to better support the integration into the GEST (Greenhouse-gas-Emission-Site-Type) approach and other applied peatland monitoring frameworks.

After classification, predicted vegetation/dominance patterns were combined with water-table maps. By using the GEST approach, spatially explicit peatland greenhouse gas emission estimates were derived and validated against a reference area. A Minimum Viable Product (MVP) combining vegetation maps, hydrological inference, and GEST-based emissions shall provide initial large-scale assessments of rewetting success and associated emission reductions. Further fields of application regarding the monitoring of ecosystem services and smart farming approaches for paludiculture will be investigated based on the results obtained.

How to cite: Ahlgrimm, T., Rossa, H., Husting, T. J., Trouillier, M., Bergheim, M., Oehmcke, S., Jurasinski, G., and Pönisch, D. L.: Advanced AI-Supported Peatland Vegetation Mapping using Remote Sensing for Environmental Monitoring , EGU General Assembly 2026, Vienna, Austria, 3–8 May 2026, EGU26-18584, https://doi.org/10.5194/egusphere-egu26-18584, 2026.

EGU26-19007 | Orals | BG8.11

Hotspots of greenhouse gas emissions from drained peatlands in the European Union 

Franziska Tanneberger, Quint van Giersbergen, Alexandra Barthelmes, John Couwenberg, Kristiina Lang, Nina Martin, Cosima Tegetmeyer, and Christian Fritz

Greenhouse gas (GHG) emissions from drained peatlands account for about 7% of the total anthropogenic GHG emissions in the European Union (EU). Yet, a lack of high-resolution spatial data hampers targeted mitigation. We present results of a recent study (van Giersbergen et al. 2025 Nature Communications) where we combined soil and land use data to generate detailed maps of land use, GHG emissions, and emission hotspots for EU+ peatlands. Undrained peatlands and those drained for forestry dominate at high latitudes, while drained grasslands and croplands prevail around latitudes 50°−55°. Four main emission hotspots emerge: the North Sea region, eastern Germany, the Baltics together with eastern Poland, and north Ireland. The North Sea region is the largest, accounts for 20% of EU+ peatland emissions on just 4% of the peatland area. Our findings highlight the urgency of reducing emissions from drained peatlands to meet EU climate targets and reveal substantial underreporting in National UNFCCC inventories, amounting to 59–113 Mt CO2e annually. Our findings provide a robust and spatially explicit evidence base for policymakers to prioritize peatland rewetting to reduce GHG emissions. Recent developments on reducing EU peatland emission underreporting will be included.

How to cite: Tanneberger, F., van Giersbergen, Q., Barthelmes, A., Couwenberg, J., Lang, K., Martin, N., Tegetmeyer, C., and Fritz, C.: Hotspots of greenhouse gas emissions from drained peatlands in the European Union, EGU General Assembly 2026, Vienna, Austria, 3–8 May 2026, EGU26-19007, https://doi.org/10.5194/egusphere-egu26-19007, 2026.

Drainage-driven peatland degradation in Europe has led to widespread loss of peatland functions, including important regulating ecosystem services such as climate and water regulation. European peatlands have been formed, used and managed in different ways, resulting in contrasting land-use practices and rewetting policies between countries. In this study, we investigate the differences between European countries in why and how peatlands are drained, used and restored and how these differences influence current peatland management and restoration strategies. We conduct a structured scientific literature review for ten European countries using the DPSIR (Drivers-Pressures-State-Impacts-Responses) framework. Our results from abstract screening of over 200 publications across seven countries (Denmark, Estonia, Finland, Ireland, the Netherlands, Sweden and the United Kingdom) indicate that peatland drainage is primarily driven by forestry (45%) and agriculture (40%), while peat extraction is less frequently identified as a driver (15%). Greenhouse gas emissions dominate the reported impacts of drainage (77%), whereas biodiversity loss and habitat degradation, and land subsidence are mentioned less frequently (16% and 14%, respectively). Reported responses are strongly skewed toward hydrological interventions such as rewetting (63%), with fewer studies emphasizing vegetation and biodiversity restoration (16%), land-use conversion (11%), or measures to improve water and soil quality (9%). Initial comparative analyses suggest that the relative emphasis on drivers, impacts and response strategies differ between countries, reflecting national peatland contexts and policy priorities. Although agriculture and forestry dominate as drivers, responses rarely address land-use systems directly, instead emphasizing hydrological interventions. Similarly, while biodiversity impacts are widely recognized, targeted ecological responses are seldom reported. Ongoing analysis will further explore country-specific DPSIR profiles and link dominant drivers and impacts to preferred restoration approaches. These insights are essential for targeted and appropriate restoration strategies to maximize the recovery of the regulating ecosystem services across European peatlands.

How to cite: Jongejans, L. and van der Velde, Y.: Why drained peatlands differ across Europe: drivers, impacts and responses in a DPSIR-based literature review, EGU General Assembly 2026, Vienna, Austria, 3–8 May 2026, EGU26-19808, https://doi.org/10.5194/egusphere-egu26-19808, 2026.

EGU26-19839 | ECS | Posters on site | BG8.11

Post-Rewetting Carbon Dynamics of a Temperate Peatland: Eddy Covariance–Based CO2 and CH4 Fluxes from Himmelmoor, Germany 

Yuqing Zhao, David Holl, and Lars Kutzbach

Peatland rewetting has been widely adopted in Germany as a climate-change mitigation strategy by reducing CO2 emissions from peat decomposition. However, rewetted peatlands may simultaneously act as sources of CH4 with varying strength. Quantifying their net greenhouse gas exchange remains challenging due to landscape heterogeneity and continuously changing vegetation, water table, and surface conditions following the rewetting. Therefore, sustained monitoring during and after the rewetting process is necessary.

In this study, we measured the fluxes of CO2 and CH4 at a rewetted peatland, Himmelmoor, in Northern Germany from 2015 to 2018, extending previous work conducted from 2012 to 2014. The site is characterized by heterogeneous terrain resulting from peat extraction and phased rewetting, which has been carried out alongside extraction activities since 2004. The objective is to provide updated greenhouse gas (GHG) estimates to assess how carbon dynamics have evolved in the rewetted section. Eddy covariance (EC) measurements of CO2 and CH4 fluxes were conducted at the center of the former mining area, allowing flux contributions from multiple surface classes, including rewetted area, vegetation strips, and bare soils to be captured within the source area of a single EC tower.

For CO2 fluxes, we apply and compare a wind-direction-based mechanistic source partitioning approach with a footprint-based source partitioning method to estimate flux contributions from multiple surface classes within the EC footprint, including the rewetted area, vegetated peat strips, and bare (non-rewetted) peat surfaces. For CH4 fluxes, a machine-learning framework based on an ensemble of multilayer perceptrons is used for gap filling and flux modeling of different surface classes. The model is driven by meteorological variables, optimally lagged predictors identified via cross-correlation, fuzzy seasonal and diurnal time variables, and class contributions derived from footprint analysis. 

The processed fluxes are compared with previously published EC measurements from 2012 to 2014. Preliminary results based on tower view fluxes (without flux partitioning and gap filling) show that the mean CO2 flux during the summer months (July–September) ranged from −0.68 to −0.71 µmol m-2 s-1 for the year 2016 to 2018. In comparison, the mean summer CO2 flux in 2012 was 0.67 µmol m-2 s-1, indicating a substantial shift from a net CO2 source to a net CO2 sink. In contrast, mean winter (January, November, and December) CO2 fluxes for 2016 and 2017 were 0.70 and 0.66 µmol m-2 s-1, respectively, which are comparable to the 2012 value (0.66 µmol m-2 s-1).  For CH4, the mean summer flux increased from 45 nmol m-2 s-1 in 2015 to 70 nmol m-2 s-1 in 2018, compared to 40 nmol m-2 s-1 in 2012, indicating a substantial increase in CH4 emissions following rewetting during the summer. Overall, the study suggests that rewetting reduced CO2 emissions while increasing CH4 emissions, providing new insights into the long-term impacts of peatland rewetting on climate and into the processing of EC flux data in heterogeneous landscapes. 

How to cite: Zhao, Y., Holl, D., and Kutzbach, L.: Post-Rewetting Carbon Dynamics of a Temperate Peatland: Eddy Covariance–Based CO2 and CH4 Fluxes from Himmelmoor, Germany, EGU General Assembly 2026, Vienna, Austria, 3–8 May 2026, EGU26-19839, https://doi.org/10.5194/egusphere-egu26-19839, 2026.

There is increasingly demanding effort across Europe to restore degraded peatlands through rewetting techniques. While the measures of restoration by rewetting can effectively encourage the growth of peat-forming mosses, there have been concerns about peatland water quality problems due to the interactions between raised water table level and the release of nutrients such as ammonium (NH4+), nitrate (NO3-) and phosphate (PO43-), which may pose a significant risk to water quality in receiving water bodies. Studies have shown that drained peatlands have high concentration of DOC, NH4+,  NO3-,  PO43-  and DON and rewetting is capable of reducing the concentration to near natural levels, however for NH4+ and PO43- studies have recorded elevated concentrations after full rewetting (WTD within 0 – 10cm) and less under partially rewetting ( WTD 20cm to surface) for which some researchers have suggested partial rewetting to curb internal release of nutrient on rewetted peatland.

To date, there is no peatland-specific water quality model. Although some existing water quality models have been applied to peatlands, the complex adaptive nature of peatland is oversimplified, e.g. complex interaction between fluctuating water table levels and biogeochemical processes that affect nutrients concentration are either neglected or not explicitly represented in the model. To address this knowledge gap, the objective of this study is to develop an integrated water quality model for peatlands, considering the advection-dispersion processes of solute transport, biogeochemical processes and related environmental factors that affect the evolution and variation of nutrients.

The solutions of the system of governing partial differential equations were implemented by using the finite volume method (FVM). While the overall solver was based on an explicit scheme, e.g. by using the Euler’s forward method, a second-order central differencing scheme was applied to discretise the dispersion term. In order to make the solver stable, the advection term was discretised using the second-order upwind total variation diminishing (TVD) method. The model was verified by comparing the numerical modelling results of a 1D benchmark problem with related analytical solutions, getting a coefficient of determination of R2 > 0.99. The 2D version of the water quality model has been coupled with DigiBog_Hydro model which simulates groundwater flow processes. This integrated water quality model will be applied to some selected bogs in Ireland which are under rehabilitation to investigate the hydrological and water quality responses to related restoration methods such as drain blocking and bunds creation. The results of integrated modelling will be compared to the experimental results of water quality measurements of related peatlands. 

How to cite: Opoku-Agyemang, E.: Development of integrated water quality model for evaluating the peatland rehabilitation measures in Ireland, EGU General Assembly 2026, Vienna, Austria, 3–8 May 2026, EGU26-20516, https://doi.org/10.5194/egusphere-egu26-20516, 2026.

EGU26-20667 | Orals | BG8.11

Assessing the application of random forest (RF) to predict water-table (WT) in selected Irish peatlands: Challenges and opportunities with upscaling the model to national scale 

Alina Premrov, Jagadeesh Yeluripati, Florence Renou-Wilson, Kilian Walz, Kenneth A. Byrne, David Wilson, Bernard Hyde, and Matthew Saunders

Peatlands are a well-known major global terrestrial carbon (C) sink. Most of Irish peatlands have been anthropogenically altered in past, such as by drainage for forestry, agriculture, and peat extraction. Recent restoration efforts highlight the need to better understand peatland C-dynamics and improve methods for reporting CO2 fluxes. Water-table (WT) depth is a key driver of CO2 flux exchange under different land-use types [1], making its inclusion in predictive models essential. Previous work by Premrov et al. [2], [3] assessed the application of random forest (RF) model to predict WT [2] at eight Irish peatland sites [4], using on-site measurements [4] and gridded meteorological data [5], with further details explained in Premrov, et al (2025) [2]. Findings reported in Premrov et al. (2025) [2] showed a relatively good RF- model performance at site-scale (R2 = 0.78). New work explores challenges and opportunities in upscaling the RF model from site- to national-scale. The ‘variable importance’ was assessed in order to reduce dimensionality (i.e. excluding less important variables), and to enable the upscaling. This resulted in a simplified RF model using only selected variables with the highest importance, to improve computational efficiency for upscaling model applications. While the simplified RF model showed slightly lower, but acceptable performance at site-scale compared to full RF model (including all variables) [2], the attempts to apply it at the national scale revealed challenges, and highlighted the need for further improvements. The study discusses the challenges and opportunities in upscaling the RF model to enhance the robustness of RF-based WT predictions at national scale.


Acknowledgements

The authors are grateful to the Irish Environmental Protection Agency (EPA) for funding projects CO2PEAT (2022-CE-1100) and AUGER (2015-CCRP-MS.30) [EPA Research Programmes 2021- 2030 and 2014–2020], and to University of Limerick funding.


References

[1] Tiemeyer, B., et al., 2020. A new methodology for organic soils in national greenhouse gas inventories: Data synthesis, derivation and application,Ecological Indicators, Vol. 109, 105838,  https://doi.org/10.1016/j.ecolind.2019.105838.

[2] Premrov, A., et.al., 2025. Assessing the application of random forest (RF) to predict water-table (WT) in selected Irish peatlands, EGU25-5122, https://doi.org/10.5194/egusphere-egu25-5122, 2025. 

[3] Premrov, A., et.al, 2023. Insights into the CO2PEAT project: Improving methodologies for reporting and verifying terrestrial CO2 removals and emissions from Irish peatlands. IGRM2023, Belfast, UK.  https://www.researchgate.net/publication/369061601_Insights_into_the_CO2PEAT_project_Improving_methodologies_for_reporting_and_verifying_terrestrial_CO2_removals_and_emissions_from_Irish_peatlands.

[4] Renou-Wilson, F., et. al, 2022. Peatland Properties Influencing Greenhouse Gas  Emissions and Removal (AUGER Project) (2015-CCRP-MS.30), EPA Research Report, Irish Environmental Protection Agency (EPA). https://www.epa.ie/publications/research/climate-change/Research_Report_401.pdf.

[5] Copernicus Climate Change Service, Climate Data Store, (2020): E-OBS daily gridded meteorological data for Europe from 1950 to present derived from in-situ observations. Copernicus Climate Change Service (C3S) Climate Data Store (CDS). https://doi.org/10.24381/cds.151d3ec6.

[6] Kuhn, M. 2008. Building Predictive Models in R Using the caret Package. Journal of Statistical Software, 28(5), 1–26. https://doi.org/10.18637/jss.v028.i05.

How to cite: Premrov, A., Yeluripati, J., Renou-Wilson, F., Walz, K., Byrne, K. A., Wilson, D., Hyde, B., and Saunders, M.: Assessing the application of random forest (RF) to predict water-table (WT) in selected Irish peatlands: Challenges and opportunities with upscaling the model to national scale, EGU General Assembly 2026, Vienna, Austria, 3–8 May 2026, EGU26-20667, https://doi.org/10.5194/egusphere-egu26-20667, 2026.

EGU26-21353 | ECS | Posters on site | BG8.11

Preliminary machine‑learning study of minimal hyperspectral bands for heat and drought stress in the Rzecin peatland 

Abdallah Abdelmajeed, Michal Antala, Sijia Feng, Christophe Elias Frem, Marcin Stróżecki, Anshu Rastogid, Sheng Wang, and Radosław Juszczak

Peatlands are significant carbon sinks, heat waves and drought threatens their function as long-term carbon sinks. Detecting stress in Sphagnum-dominated peatlands before damage occurs is critical for conservation and carbon accounting. Here, we present a trial framework combining high-resolution hyperspectral remote sensing with machine learning to identify minimal spectral band sets and develop peatland-specific indices for early stress detection.

This study was at the Rzecin peatland in Poland (52°45'N, 16°18'E), a poor fen. Hyperspectral measurements (350–1000nm) were acquired across 13 plots over 22 measurement campaigns, using a Piccolo Doppio dual-field-of-view spectrometer. environmental monitoring included water table depth (WTD) from plots nine using TD divers and meteorological variables (air temperature, vapour pressure deficit, precipitation) recorded at half-hourly intervals from 2020–2024.

We defined heat stress events using a compound threshold approach requiring exceedance of the 90th percentile for both daily maximum air temperature (Tair > 29.1°C) and vapour pressure deficit (VPD > 2.90 kPa) for a minimum of three consecutive days. Drought stress was characterised by plot-specific 10th percentile WTD thresholds (site median: −25.4 cm) sustained for at least five consecutive days. Bootstrap resampling (n = 1,000) quantified threshold uncertainty, yielding 95% confidence intervals of 28.6–29.6°C for temperature and 2.71–2.99 kPa for VPD thresholds.

To address the hyperspectral multicollinearity, we applied correlation-based filtering (ρ > 0.98), reducing the original 921 spectral bands to 9 representative wavelengths while preserving spectral diversity. Recursive Feature Elimination with Random Forest, validated through leave-one-plot-out cross-validation to ensure spatial independence, identified an optimal subset of eight features: Water Index (WI), Photochemical Reflectance Index (PRI), Peatland Stress-Water Index (PSWI), Normalised Difference Red-Edge Index (NDRE), Peatland Drought Index (PDI), Normalised Difference Vegetation Index (NDVI), reflectance at 800 nm, and the MERIS Terrestrial Chlorophyll Index (MTCI).

We are trying to build a peatland-specific spectral indices. The Peatland Drought Index (PDI), calculated as (R705 − R750)/(R705 + R750), exploits the red-edge region's sensitivity to both chlorophyll content and leaf water status. The Peatland Stress-Water Index (PSWI), formulated as (R860 − R550)/(R750 − R670), combines NIR water sensitivity with red-edge slope normalisation. Permutation tests (n = 1,000) demonstrated that PDI significantly outperformed NDVI in detecting VPD-related stress (Δρ = 0.054, p = 0.009), supporting the development of ecosystem-specific rather than generic vegetation indices.

Random Forest and XGBoost classifiers achieved strong discrimination between stressed and non-stressed conditions, with areas under the receiver operating characteristic curve (AUC) of 0.836 and 0.851, respectively. The water-related indices (WI, PSWI, PDI) among top-ranked features underscores the primacy of hydrological stress in peatland ecosystems. Sensitivity analysis across varying threshold percentiles (85–95%) and duration requirements (2–7 days) revealed that stress classification varied up to 10-fold, emphasising the critical importance of transparent methodological reporting in peatland remote sensing studies.

Our findings demonstrate that reliable stress detection in our peatlands can be achieved with eight spectral features, enabling potential deployment on multispectral sensor platforms. This framework could offer a transferable approach for early-warning systems in peatland conservation, supporting climate adaptation strategies for these critical ecosystem.


Acknowledgement: Acknowledgement: Funded by NCN (2020/39/O/ST10/00775), NAWA (BPN/PRE/2022/1/00102), DDSA (2025‑5687), and PANGEOS (CA22136‑80fe26e2).

How to cite: Abdelmajeed, A., Antala, M., Feng, S., Frem, C. E., Stróżecki, M., Rastogid, A., Wang, S., and Juszczak, R.: Preliminary machine‑learning study of minimal hyperspectral bands for heat and drought stress in the Rzecin peatland, EGU General Assembly 2026, Vienna, Austria, 3–8 May 2026, EGU26-21353, https://doi.org/10.5194/egusphere-egu26-21353, 2026.

The Eddy covariance (EC) is a well-known and widely used technique for investigating ecosystem exchange of greenhouse gases (GHGs) between the biosphere and the atmosphere [1]. Long-term EC datasets frequently contain gaps due to a variety of reasons [2], which have resulted in the development of various gap-filling methods/tools. Despite the availability of various existing gap-filling methods and tools, many users still rely on spreadsheet software for gap-filling via semi-empirical and nonlinear regression computations. Transitioning to R or Python can significantly reduce computation time for large datasets; however, less experienced users of these environments may face challenges in adapting their methods [5]. The development of a user-friendly R-based tool, such as ‘miniRECgap’ [3], that enables effortless application of frequently used semi-empirical approaches [5] is therefore considered beneficial. Further details on the introduction of the ‘miniRECgap’ R-package can be found in Premrov et al. (2024) and Premrov et al. (2025) [4], [5]. One of the main purposes of designing ‘miniRECgap’ was to assist new or less experienced users in applying light- and temperature-response functions (utilised in ‘miniRECgap’) to enable gap-filling in a simple and efficient way, while also serving as a learning tool for those users transitioning from spreadsheets to R [5]. The use of the ‘miniRECgap’ package involves five simple steps and operates via GUI-supported scripts [3], [4], [5], which will be demonstrated. The approach makes the package suitable for all users, including beginners with no prior R experience. To enhance learning, a mini tutorial will be presented on how to use ‘miniRECgap’, showing a practical example of gap-filling Irish peatland ecosystem EC CO₂ flux data from Premrov et al. (2025) [5], aiming to encourage learning and adoption of R-based solutions for EC flux gap-filling tasks.


Acknowledgements

The authors are grateful to the Irish Environmental Protection Agency (EPA) for funding the CO2PEAT project (2022-CE-1100) under the EPA Research Programme 2021-2030.


References

 [1] Burba, G., Anderson, D., Amen, J., (2007) Eddy Covariance Method: Overview of General Guidelines

[2] Baldocchi, D.D. (2003) Assessing the eddy covariance technique for evaluating carbon dioxide

[3] Premrov, A (2024). ‘miniRECgap’: R-Package for gap-filling of the Missing Eddy Covariance CO2 Flux Measurements Using Selected Classic Nonlinear Environmental Response Functions via Simple user-friendly GUI Supported R Scripts. (v0.1.0). https://github.com/APremrov/miniRECgap; https://doi.org/10.5281/zenodo.13228228; https://doi.org/10.5281/zenodo.13228227

[4] Premrov, A. et al. (2024): Introducing the ’miniRECgap’ package with GUI-supported R-scripts for simple gap-filling of Eddy Covariance CO2 flux data, EGU24-6475, https://doi.org/10.5194/egusphere-egu24-6475, 2024.

[5] Premrov, A. et .al. (2025). Introducing ‘miniRECgap’ R package for simple gap-filling of missing eddy covariance CO2 flux measurements with classic nonlinear environmental response functions via GUI-supported R-scripts (case-study: In-sample gap-filling with ‘miniRECgap’ vs. MDS and an optimised shallow ANN in a ‘challenging’ peatland ecosystem). Environmental Modelling & Software 193 106611. https://doi.org/10.1016/j.envsoft.2025.106611

How to cite: Premrov, A.: The ‘miniRECgap’ package with GUI-supported R-scripts for simple gap-filling of Eddy Covariance CO₂ flux data: Demonstrating the application of 'miniRECgap' suitable for new users with no prior knowledge of R, EGU General Assembly 2026, Vienna, Austria, 3–8 May 2026, EGU26-21762, https://doi.org/10.5194/egusphere-egu26-21762, 2026.

EGU26-21947 | ECS | Posters on site | BG8.11

Modeling of Greenhouse Gas Emissions from Peatlands in Germany: A Machine Learning Approach 

Florian Braumann, Janina Klatt, Sebastian Friedrich, Sergey Blagodatsky, Clemens Scheer, Ralf Kiese, and Matthias Drösler

The ITMS (Integriertes Treibhausgas Monitoring System) Sources and Sinks module, funded by the German Federal Ministry of Research, Technology and Space, develops modelling approaches to simulate greenhouse gas (GHG) fluxes in Germany at high spatial and temporal resolution. By integrating existing measurement data from national and Bavarian research initiatives with new field observations from natural, drained, and rewetted peatlands collected in the MODELPEAT project, we aim to refine statistical modeling approaches of peatland GHG exchange. While the current German national GHG inventory approach for landuse specific peatlands relies on functional relationships in dependency on water table depth and the type of organic soil (Tiemeyer et al. 2020), this project introduces a machine learning framework that leverages an extensive monthly dataset (approximately 190 site years) to capture peatland GHG dynamics in more detail. The poster presents the methodological implementation of a eXtreme Gradient Boosting (XGB) decision tree model, which incorporates predictors representing seasonal dynamics, vegetation activity, meteorological conditions, and management practices, along with initial findings. As the project progresses, the approach is aimed to be applied across Bavaria on a 30×30 m grid to generate spatially explicit simulations of peatland GHG fluxes (CO2, CH4, N2O). This work is essential for identifying emission hotspots and supporting the development of effective mitigation strategies. 

How to cite: Braumann, F., Klatt, J., Friedrich, S., Blagodatsky, S., Scheer, C., Kiese, R., and Drösler, M.: Modeling of Greenhouse Gas Emissions from Peatlands in Germany: A Machine Learning Approach, EGU General Assembly 2026, Vienna, Austria, 3–8 May 2026, EGU26-21947, https://doi.org/10.5194/egusphere-egu26-21947, 2026.

EGU26-21971 * | ECS | Orals | BG8.11 | Highlight

Is it possible to have 'sustainable' peat?  

Alexander Sentinella and Anna-Helena Purre

Peat replacement has dominated research in growing media science over the past decades, driven by peatland protection policies and the need to reduce greenhouse gas emissions. At the same time, global demand for growing media is projected to increase substantially, reflecting the expansion of horticultural and ornamental plant production worldwide. Achieving net-zero emission targets while maintaining a resilient horticulture sector therefore requires re-examining existing assumptions and broadening the scope of current research strategies.

While most scientific and regulatory efforts focus on substituting peat with alternative materials, comparatively little attention has been paid to reducing the environmental impact of peat extraction itself or to exploring whether pathways exist to make peat use more sustainable. Horticultural peat is generally considered unsustainable because peat mineralisation rates exceed natural peat accumulation, leading to the release of long-stored, non-biogenic carbon. Nevertheless, peat has  also been described as a slowly renewable resource, a claim that remains insufficiently examined in practical or quantitative terms.

We explore conceptual models in which peat extraction could be matched by equal or higher rates of peat accumulation across larger, managed landscapes. Such approaches would rely on long-term peatland management, compensatory restoration of degraded peatlands, or integrated landscape-scale strategies. The feasibility of these models is assessed in terms of biophysical constraints, economic costs, and competition with alternative land-use options, including carbon credit schemes, biodiversity restoration initiatives, and commercially available peat substitutes.

In addition, we discuss related approaches, including sphagnum moss cultivation in paludicultural systems, acrotelm harvesting, and the utilisation of residual peat from construction, mining/quarrying, or restoration projects. By comparing current peat extraction with potential future pathways, we aim to stimulate a broader discussion on whether or not peat use can be re-framed within sustainability goals, rather than being considered solely as a material to be phased out.

How to cite: Sentinella, A. and Purre, A.-H.: Is it possible to have 'sustainable' peat? , EGU General Assembly 2026, Vienna, Austria, 3–8 May 2026, EGU26-21971, https://doi.org/10.5194/egusphere-egu26-21971, 2026.

EGU26-22187 | Orals | BG8.11

Mapping the state of land cover and wetlands in the Northwest Territories, Canada 

Jurjen van der Sluijs, Rob Skakun, Kathleen Groenewegen, Tyler Rea, André Beaudoin, and Guillermo Castilla

The Northwest Territories (NWT) is a large jurisdiction (>1.3 million km2) in Canada featuring vast areas of forests, expansive organic wetlands (peatlands), and open tundra. Within the mainland of 1.15 Mkm2 (excluding the Arctic Archipelago), the diversity of terrain, climate, biotic factors, and sub-surface (e.g., permafrost) conditions give rise to heterogeneous landscapes at both small and large scales.  Land cover maps provide the basis for understanding how different types of vegetation and wetlands are distributed across landscapes, providing a foundation to subsequently derive information concerning climate change impacts and carbon/methane modelling. Through the joint Multisource Vegetation Inventory (MVI) project (Castilla et al. 2022), the Government of the Northwest Territories (GNWT) in partnership with the Canadian Forest Service of Natural Resources Canada (CFS) has developed land cover maps with improved classification accuracy of key vegetation types (forests, wetlands). The goal of this work is to produce and validate an updated land cover map of the entire NWT mainland including 10 forest classes as broad forest cover types (coniferous, broadleaf, mixedwood, treed wetland) combined with density classes (dense, open, sparse), as well as 10 non-treed classes. This presentation provides an overview of the major components in the land cover map development, with specific focus on improved (organic) wetland mapping. This initiative is based on a new network of land cover reference data consisting of thousands of points (n=24,865), forming the densest ever compilation of forest, wetland, and non-treed reference information available across NWT. The land cover map is produced from a random forest (RF) classification procedure using above reference land cover points and 30-m resolution rasters of predictive variables derived from satellite imagery and environmental datasets. Satellite imagery composites include cloud-free multispectral Sentinel-2 time-series of six spectral bands and six spectral indices which were temporally composited for each pixel over the 2020 to 2022 time period as i) seasonal summer (July-August) and winter (February-March) medians and ii) inter-annual statistics from full time-series including six percentiles (p5, p20, p40, p60 p80, p95) and two temporal variability measures (range, st. dev.). In addition, a single ca. 2020 PALSAR-2 L-band dual-polarized (HH, HV) summer composite was created, along with 26 terrain-derived data layers, 24 climatic layers, and three long-term spectral change metrics. The RF classification procedure included a spatially balanced split of the reference data into calibration and independent validation observations, a recursive feature elimination algorithm to iteratively remove the least important predictor variables, as well as a hyper-parameter optimization routine to further improve predictive performance. The resulting NWT land cover map product improves upon national mapping results (71 % vs 47 % overall accuracy all classes, improvements up to 20% in upland-wetland separation) and shows potential to provide an invaluable operational map of baseline forest and wetland information required to serve forest, wetland, wildfire, and wildlife management applications.

How to cite: van der Sluijs, J., Skakun, R., Groenewegen, K., Rea, T., Beaudoin, A., and Castilla, G.: Mapping the state of land cover and wetlands in the Northwest Territories, Canada, EGU General Assembly 2026, Vienna, Austria, 3–8 May 2026, EGU26-22187, https://doi.org/10.5194/egusphere-egu26-22187, 2026.

EGU26-22920 | Posters on site | BG8.11

Mapping Peat Soils and their Restoration Potential in Austria: Comparing Approaches and Limitations 

Christina Hummel, Stefan Forstner, Thomas Brunner, Michael Schwarz, Irene Schwaighofer, Michael Weiß, Hans-Peter Haslmayr, and Thomas Weninger

Knowledge about the extent, distribution and the state of drained peat soils as well as the suitability for measures to promote biodiversity and terrestrial carbon storage is urgently needed for the formulation of restoration plans for organic soils in the context of the EU nature restoration regulation. Recently, a probability map showing the potential distribution of peat soils in Austria was developed via modelling within the project MOIST (Forstner et al., in preparation). This map predicts the likelihood of occurrence of peat soil based on physical properties such as soil properties, climate, relief features, vegetation indices, parent material. However, factors like current land use intensity or drainage were not considered in the probability map. For the localisation of areas potentially relevant for the improvement of biodiversity and carbon storage via restoration measures, a suitability assessment was developed within the same project by an expert-based approach. It categorizes areas by their potential suitability for restoration depending on factors such as land use intensity and drainage. So far, the probability map and the suitability layer have not yet been combined to localise areas suitable and important for restoration measures.

In this study we want to methodologically analyse the combination of the probability map with the suitability layer. The results will be critically compared with other approaches for localising peat soils, e.g. the map of organic soils developed for the Austrian greenhouse gas inventory and the Mire Inventory Austria, as well as European maps. The study will compare the extent of (drained) peat soils in NUTS3-Regions in Austria determined by the different approaches and critically discuss differences and uncertainties. Furthermore, the predictions will be compared with ten on-site data collections.

The analysis will help to identify limitations and potentials of the probability map and the suitability layer for effectively and correctly using these tools to support decisions and planning restoration measures.

How to cite: Hummel, C., Forstner, S., Brunner, T., Schwarz, M., Schwaighofer, I., Weiß, M., Haslmayr, H.-P., and Weninger, T.: Mapping Peat Soils and their Restoration Potential in Austria: Comparing Approaches and Limitations, EGU General Assembly 2026, Vienna, Austria, 3–8 May 2026, EGU26-22920, https://doi.org/10.5194/egusphere-egu26-22920, 2026.

BG9 – Earth System Remote Sensing and Modelling

EGU26-2 | Posters on site | BG9.1

Automatically tracking down dynamic physiological traits in Millet plants as a possible physiological pre-breeding system 

Nir Sade, Yair Yehoshua Zach, and K.S.Vijay Selvaraj

Agriculture is a cornerstone of national security, underpinning human survival and economic stability. However, the combined pressures of climate change, population growth, and recent global disruptions—most notably the COVID-19 pandemic—have intensified vulnerabilities within agricultural systems and food supply chains. These compounded challenges have led to socio-economic insecurities and health disparities, particularly among marginalized communities. Farmers now face the dual crises of climatic variability and pandemic-induced uncertainties, underscoring the urgent need for a transition from incremental adaptation to transformative agricultural strategies that emphasize human health, nutrition, and environmental sustainability.

Developing climate-resilient agricultural systems requires the cultivation of crops that can withstand diverse and extreme environmental conditions. Millets, often referred to as “climate-smart crops,” offer a promising solution due to their inherent resilience to biotic and abiotic stresses, ability to thrive on marginal lands, and superior nutritional profile compared to major cereals. To advance millet improvement and identify stress-resilient genotypes, high-throughput phenotyping (HTP) technologies provide a powerful approach for rapid, quantitative, and automated evaluation of physiological performance under controlled and field conditions.

In this study, we applied HTP to assess water-use traits in two pearl millet hybrid lines (COH9 and COH10) grown under well-watered (WW) and water-stress (WS) regimes. Environmental monitoring revealed characteristic diurnal variations in vapor pressure deficit (VPD) and photosynthetically active radiation (PAR), both peaking around midday. The two hybrids exhibited distinct transpiration dynamics in response to stress. COH9 maintained higher transpiration rates during midday hours under WW conditions and demonstrated faster transpiration recovery in the mornings following water stress, indicating superior water-use efficiency and regulatory capacity. Over the entire experimental period, COH9 showed greater cumulative transpiration and soil water extraction efficiency relative to COH10. These physiological advantages were reflected in significantly higher field yields for COH9 under both irrigated and rain-fed conditions.

Our findings confirm the effectiveness of HTP for identifying genotypic variation in water utilization and stress adaptation. The integration of HTP with genomic sequencing and bioinformatic analysis presents a promising pathway to accelerate millet breeding programs. This combined approach enables precise, data-driven selection of drought-tolerant and water-efficient genotypes, reducing both time and cost associated with conventional breeding methods.

Overall, this study highlights the critical role of climate-resilient crops such as millets and the transformative potential of advanced phenotyping technologies in ensuring sustainable food production under changing global conditions.

How to cite: Sade, N., Yehoshua Zach, Y., and Selvaraj, K. S. V.: Automatically tracking down dynamic physiological traits in Millet plants as a possible physiological pre-breeding system, EGU General Assembly 2026, Vienna, Austria, 3–8 May 2026, EGU26-2, https://doi.org/10.5194/egusphere-egu26-2, 2026.

EGU26-2424 | Posters on site | BG9.1

Climatic impacts of decreased tree cover in sub-Saharan Africa 

Petri Pellikka, Temesgen Abera, Ilja Vuorinne, Ida Adler, Hari Adhikari, Vuokko Heikinheimo, Sheila Wachiye, Jan Kopecny, Antti Autio, and Janne Heiskanen

The human population in sub-Saharan Africa is growing the fastest in the world, which causes pressure on land resource together with climate change. More cropland needs to be cleared to maintain food security, but decreasing woody vegetation has climatic impacts. Loss of forests and woody vegetation decreases carbon sequestration from the air and carbon stocks of the above ground vegetation, while management of the land cleared for agriculture releases greenhouse gas emissions from soil. Loss of forest cover also leads to decreased soil organic carbon stocks. Loss of woody vegetation and trees in general causes increased land surface temperature, and consequently, increased air temperature. In the highlands, the decreasing forest cover also decreases the ability of the trees to capture atmospheric moisture by fog deposit, which also decreases the ability of water to infiltrate to the soil. Fog deposit is also decreased by increased land surface temperature, which causes the cloud base height to be at a higher level and out of the reach of forest canopy. While conservation and protected areas are typically considered to be positive, too high elephant populations overseeding the carrying capacity of the environment are decreasing the woody vegetation, thus having climatic impacts, too. This is because elephants tend to eat leaves and bark from the trees while not having grass to eat during the dry spells.

University of Helsinki has been studying climatic impacts of land cover change in Africa using Taita Taveta County in Kenya as a test site and model for whole sub-Saharan Africa applying remote sensing data and environmental sensing network since 2009. Currently, we are developing climate-smart agriculture and livestock management to mitigate climate change but improving food security.

How to cite: Pellikka, P., Abera, T., Vuorinne, I., Adler, I., Adhikari, H., Heikinheimo, V., Wachiye, S., Kopecny, J., Autio, A., and Heiskanen, J.: Climatic impacts of decreased tree cover in sub-Saharan Africa, EGU General Assembly 2026, Vienna, Austria, 3–8 May 2026, EGU26-2424, https://doi.org/10.5194/egusphere-egu26-2424, 2026.

EGU26-2861 | Orals | BG9.1

Beyond Industrial Emissions: How Biomass Burning Drives Extreme Urban Air Pollution 

Taciana Albuquerque, Caio Lopes, Amanda Ribeiro, Anderson Rudke, Otavio Sobrinho, Ana Damasceno, Ricardo Queiroz, Jessica Gonçalves, Maria de Fátima Andrade, Rizzieri Pedruzzi, Leila Martins, and Leonardo Hoinasky

Biomass burning has become an increasingly important driver of air quality degradation in Minas Gerais, southeastern Brazil, particularly during the dry season, when fire activity intensifies, and atmospheric dispersion is suppressed. This work addresses recent evidence on the role of regional biomass burning in shaping fine particulate matter (PM₂.₅) concentrations, with a particular focus on the extreme air pollution episodes observed during 2024. The analysis integrates long-term records of fire hotspots, ground-based air quality monitoring, and key meteorological variables to elucidate the coupled processes linking fire activity, atmospheric dynamics, and urban air quality.

Minas Gerais encompasses the third largest metropolitan region in Brazil and hosts major local atmospheric emission sources, including intensive mining activities, steelmaking, and a dense urban–industrial infrastructure. Despite the persistent contribution of these structural sources to baseline air pollution levels, fire occurrence in the state exhibits pronounced seasonality, with approximately two-thirds of annual hotspots concentrated between August and October. The year 2024 stands out as one of the most critical periods of the last decade, characterized by prolonged drought, anomalously high temperatures, and persistently low relative humidity. These conditions not only favored the ignition and spread of fires but also created a meteorological environment highly unfavorable to pollutant dispersion.

Time-series analyses indicate that peaks in PM₂.₅ concentrations closely coincided with periods of increased fire frequency and intensity, particularly in the Metropolitan Region of Belo Horizonte. Statistical analyses reveal a moderate-to-strong positive association between PM₂.₅ levels and fire hotspot counts, and a consistent negative association with relative humidity. Notably, even in a region with significant local emissions from mining, steel production, and vehicular traffic, biomass burning emerged in 2024 as the dominant driver of exceedances of the national PM₂.₅ air quality standards established by CONAMA Resolution No. 506/2024. These findings demonstrate that regional-scale transport and accumulation of biomass-burning emissions can outweigh the influence of traditional urban and industrial sources during extreme events.

Several monitoring stations recorded historically high PM₂.₅ concentrations in 2024, leading to recurrent violations of national air quality thresholds. The compounded effects of extreme meteorological conditions and biomass burning led to short-lived but severe pollution episodes that substantially deteriorated air quality across the metropolitan area. Beyond local emission sources, regional fire activity therefore represents a critical and recurrent contributor to urban particulate pollution, with direct implications for public health and regulatory compliance.

Overall, the results reinforce the need for integrated air quality management strategies that combine fire prevention and control, regional-scale monitoring, and meteorological forecasting. Such approaches are particularly relevant under a changing climate, in which the frequency and severity of droughts, heatwaves, and associated biomass-burning events are expected to increase, thereby amplifying their impacts on air quality even in heavily industrialized urban regions.

How to cite: Albuquerque, T., Lopes, C., Ribeiro, A., Rudke, A., Sobrinho, O., Damasceno, A., Queiroz, R., Gonçalves, J., Andrade, M. D. F., Pedruzzi, R., Martins, L., and Hoinasky, L.: Beyond Industrial Emissions: How Biomass Burning Drives Extreme Urban Air Pollution, EGU General Assembly 2026, Vienna, Austria, 3–8 May 2026, EGU26-2861, https://doi.org/10.5194/egusphere-egu26-2861, 2026.

EGU26-4533 | Posters on site | BG9.1

Earth's biodiversity balances the Universal's gravitational response of mass creation 

Guido J. M. Verstraeten and Willem W. Verstraeten

According to Whitehead (2007), nature is apprehended by the human mind as a network of events. Each event has factors that possess intrinsic and extrinsic characteristics, of which only the extrinsic aspects are observable. Observability requires extension and duration in space and time, both of which are implied by mass. Mass, however, is not understood as a simple substrate of inertial or linear momentum or energy. Instead, it functions as a dynamic and hidden factor inherent to events and is inseparably linked to another hidden factor which is gravitation.

Building on this framework, we have integrated Whitehead’s concepts of space, time, and mass into Verlinde’s emergent theory of gravity. Verlinde (2017) conceptualizes gravitation not as a fundamental force but as a memory effect arising from changes in quantum information and the competition between short- and long-range entanglement entropy within de Sitter space. In this model, mass acts as a hidden variable that alters quantum entanglement, thereby contributing to the emergence of spacetime and gravity. The gravitational response to baryonic matter redistribution minimizes the memory effects of external perturbations in condensed matter systems. Verlinde interprets this response as an apparent positive dark energy and describes gravity as a pressureless fluid, revealing its nature as an intrinsic elastic property of spacetime characterized by stress and strain.

If gravitation is understood as an elastic response, then entropy production depends on the balance between strain and stress. In elastic systems, including Earth, entropy decreases under stress and increases under strain. Furthermore, biological life plays a significant role in Earth’s entropy dynamics. As argued by Penrose, living organisms contribute to a reduction in planetary entropy by organizing matter and energy, thereby reinforcing entropy reduction when stress dominates over strain.

To examine biodiversity within this thermodynamic framework, we adopt Hubbell’s Unified Neutral Theory of Biodiversity and Biogeography. This theory treats species as functionally equivalent and explains biodiversity patterns through stochastic processes such as reproduction, immigration, and emigration. Species abundance follows a lognormal distribution, allowing biodiversity to be quantified using Shannon entropy, with the standard deviation serving as a key parameter.

We estimated entropy density production across multiple ecosystems by combining satellite-derived monthly land surface temperature data (LST) from MODIS & SENTINEL (1 x1 km grid) with energy balance calculations based on the Stefan–Boltzmann law using latent heat flux data from FLUXCOM-X (1 x 1 km), and linking these results to ecosystem-specific Shannon entropy values globally over the period 2003-2020. Our analysis includes 11 ecosystems worldwide, eight located within national parks with minimal human impact and three adjacent control areas subjected to anthropogenic activity, enabling comparative assessment of natural and human-influenced systems.

How to cite: Verstraeten, G. J. M. and Verstraeten, W. W.: Earth's biodiversity balances the Universal's gravitational response of mass creation, EGU General Assembly 2026, Vienna, Austria, 3–8 May 2026, EGU26-4533, https://doi.org/10.5194/egusphere-egu26-4533, 2026.

EGU26-4870 | ECS | Orals | BG9.1

Atmospheric Dryness Dominates Afternoon Depression of Global Terrestrial Photosynthesis 

Yue Liu, Josep Peñuelas, Alessandro Cescatti, Yongguang Zhang, and Zhaoying Zhang

Satellite observations reveal a widespread afternoon depression of photosynthesis globally.Utilizing satellite observations and eddy covariance tower‐based observations worldwide, we investigated the impact of climate factors on the diurnal patterns of ecosystem gross primary production (GPP). Our analysis revealed that the increase in vapor pressure deficit (VPD) shifts the diurnal peak of GPP activity to earlier morning hours, particularly in drylands and areas with short vegetation. After disentangling the strong correlations among VPD, temperature, and soil moisture, we unraveled that VPD emerges as the dominant driver contributing to the widespread afternoon depression of photosynthesis in terrestrial vegetation globally. However, Earth System Models (ESMs) systematically underestimate the significant role of VPD in regulating photosynthesis. Eight out of 10 ESMs exhibited a clear afternoon increase in photosynthesis, which was attributed to temperature. Our findings emphasize the need to enhance the negative effects of VPD on diurnal photosynthesis in ESMs

How to cite: Liu, Y., Peñuelas, J., Cescatti, A., Zhang, Y., and Zhang, Z.: Atmospheric Dryness Dominates Afternoon Depression of Global Terrestrial Photosynthesis, EGU General Assembly 2026, Vienna, Austria, 3–8 May 2026, EGU26-4870, https://doi.org/10.5194/egusphere-egu26-4870, 2026.

Solar-induced chlorophyll fluorescence (SIF) provides a direct optical signature of photosynthetic light reactions and is used to assess vegetation physiological function across spatial scales. However, top-of-canopy SIF measured from airborne platforms can be strongly modulated by canopy structure, and sun–shade geometry. As part of a larger effort to diagnose structural versus physiological controls on SIF at Alice Holt Forest, we report preliminary findings from high-resolution IBIS airborne SIF and Fenix hyperspectral data acquired over mixed oak-dominated woodland and adjacent pasture in southern England.

Initial analysis confirmed that pasture showed higher mean SIF than the neighbouring forest, despite the forest having higher NDVI, EVI and NIRv. Given the dense, vertically complex canopy at Alice Holt, we hypothesize that shading and within-canopy radiative transfer reduce the apparent SIF emitted from the forest canopy, whereas the pasture—being uniformly sunlit—preserves a higher top-of-canopy signal.

To test this hypothesis, we combine multi-method FLD analyses with targeted radiative-transfer experiments (DART) to quantify how much of the observed pasture–forest SIF contrast arises from canopy geometry rather than physiology.

This study provides high-resolution evaluations of structural biases in airborne SIF over temperate woodland and highlights the need to account for canopy shading when interpreting SIF–photosynthesis relationships.

How to cite: Onkaew, K.: Disentangling Structural Controls on Airborne SIF: Unexpected Pasture–Forest Contrasts at Alice Holt Forest, EGU General Assembly 2026, Vienna, Austria, 3–8 May 2026, EGU26-5607, https://doi.org/10.5194/egusphere-egu26-5607, 2026.

Remote sensing of solar-induced chlorophyll fluorescence (SIF) can provide non-invasive in-situ insight into plant physiology in real-time. Ground-based SIF measurements have advanced our understanding of ecosystem behavior and biosphere-atmosphere interactions and offer new approaches to crop and ecosystem monitoring. However, current SIF measurement techniques rely on cumbersome instrumentation and excessively complex signal retrieval algorithms. This fundamentally limits the scalability of SIF measurements, and thus their widespread application in research and agriculture.

We present a novel approach for proximal SIF remote sensing, in which SIF is measured directly, without the need for post-processing of the signal: The solar-blind optical radiometer for the quantification of SIF (SBR-SIF) measures the light intensity in a narrow spectral window (ca. 10 picometres width) inside a strong oxygen absorption line of the O2A-band. In this spectral window, SIF is the only natural light source, because all sunlight is absorbed by atmospheric oxygen before reaching the surface.  SBR-SIF uses a Fabry-Pérot interferometer to achieve the required high spectral resolution and contrast in a compact and robust instrument [1].

Proof-of-concept measurements with a first SBR-SIF prototype under real-world conditions demonstrate the feasibility of accurate, scalable, and real-time SIF quantification.


[1] Kuhn, J., Bobrowski, N., Wagner, T., and Platt, U.: Mobile and high-spectral-resolution Fabry–Pérot interferometer spectrographs for atmospheric remote sensing, Atmos. Meas. Tech., 14, 7873–7892, https://doi.org/10.5194/amt-14-7873-2021, 2021.


How to cite: Kuhn, J. and Stutz, J.: Direct quantification of solar-induced chlorophyll fluorescence by solar-blind optical radiometry, EGU General Assembly 2026, Vienna, Austria, 3–8 May 2026, EGU26-6011, https://doi.org/10.5194/egusphere-egu26-6011, 2026.

The expansion of satellite-based sensor constellations offer game-changing opportunities for observation-driven monitoring with unprecedented temporal resolution and timeliness. However, distributed sensor observations are not typically directly interoperable, and require significant preparation to add value and enable actionable and impactful insights.

The Harmonized Landsat, Sentinel-2, and PlanetScope (HLSP) surface reflectance (SR) product adopts an innovative data fusion methodology and brings enhancements in temporal resolution, quality, and interoperability to help unlock the full potential of time-series remote sensing data from both public and commercial sources.

HLSP leverages the comprehensive harmonization methodology developed as part of Planet’s flagship high resolution (3 m) analysis ready data products, which adopt an implementation of the CubeSat-Enabled Spatio-Temporal Enhancement Method (CESTEM) to leverage near-daily PlanetScope observations in synergy with public mission sources. HLSP is produced with a 30 m pixel size and consists of a traceable mixture of 30 m downsampled PlanetScope, Sentinel-2, and Landsat 8/9 clear-sky observations that have been directly fused and harmonized into a seamless sensor-agnostic data stream consistent with FORCE (The Framework for Operational Radiometric Correction for Environmental Monitoring) SR data.

HLSP moves towards fully unlocking the value of the multi-year (~2017 to present) near-daily PlanetScope archive, complemented and enhanced by Sentinel-2 and Landsat observations. As a near-daily, multi-year, analysis-ready product, HLSP provides the foundational characteristics required for use cases across many industries via high quality AI-driven insights and analytics. This presentation will showcase the impacts of HLSP processing on multi-constellation sensor interoperability, cross-sensor radiometric consistency, and temporal resolution, and highlight relevant use cases. Highlighted use cases include application of time-series HLSP data for daily phenological monitoring, land cover change and deforestation detection and mapping, and multi-modal (optical and passive/active microwave) data fusion.

The preliminary results support HLSP as a core demonstration of how public missions can be used to complement private Earth Observation efforts to produce analysis-ready SR datasets with significantly enhanced quality, temporal resolution, interoperability, and usability. The HLSP SR product is envisioned as a foundational analysis ready data building block to support effective and accurate monitoring and mitigation of impacts from critical environmental challenges.

How to cite: Houborg, R. and Nutini, J.: Applications of a Harmonized Landsat, Sentinel-2, and PlanetScope (HLSP) Surface Reflectance Product, EGU General Assembly 2026, Vienna, Austria, 3–8 May 2026, EGU26-6284, https://doi.org/10.5194/egusphere-egu26-6284, 2026.

This study will focus on the joint assimilation of multiple Earth Observation (EO) data streams – FAPAR, SIF, L-VOD, ASCAT slope, and SM – with eddy-covariance flux measurements of NEE and GPP at various FLUXNET sites in a developed data assimilation framework with TCCAS land surface model. The framework will be used to address the following questions. First, the consistency of assimilation results across sites and data streams will be tested to assess if the addition of EO variables is leading to significant improvements in the NEE/GPP estimates, and to measure how much posterior parameters are converging towards physically consistent values and their spread. The combination of diverse EO and flux will explain how multi-stream model-data can better constrain ecosystem fluxes and parameters, thus improving the terrestrial biosphere models used for the evaluation of the resilience of the land carbon sink under climate change.

How to cite: Shende, P.: Site-Level Coupled Assimilation of FLUXNET and Earth Observation (EO) Data, EGU General Assembly 2026, Vienna, Austria, 3–8 May 2026, EGU26-6342, https://doi.org/10.5194/egusphere-egu26-6342, 2026.

EGU26-6485 | Orals | BG9.1

Optimizing soil and plant hydraulic parameters in eCLM using multi-variable data assimilation of soil and vegetation observations 

Bibi S. Naz, Heye Bogena, Fernand B. Eloundou, Juan Baca Cabrera, Alexander Graf, and Harrie-Jan Hendricks-Franssen

Accurate representation of soil and plant hydraulic processes is crucial for predicting forest water and carbon fluxes under variable climate conditions. At the Forest Research sites across Germany, we applied an Ensemble Smoother with Multiple Data Assimilation (ESMDA) coupled with the Community Land Surface Model (eCLM; https://github.com/HPSCTerrSys/eCLM) to optimize soil and vegetation parameters. Site-specific observations included soil moisture, evapotranspiration (ET), and dynamic canopy conductance, with the latter derived from sap-flow measurements. Across all sites, ensemble simulations were performed for 2012 – 2024 using 120 ensemble members in which key parameters controlling soil hydraulics, photosynthesis, stomatal behavior, and plant hydraulics were perturbed.

We tested several data assimilation configurations. Assimilating soil moisture alone improved simulated soil water content, reducing RMSE by 5–50% across soil depths, but had limited impact on ET, gross primary production (GPP), or net ecosystem exchange (NEE). In contrast, assimilating both soil moisture and ET further constrained vegetation parameters, resulting in modest improvements in ET, GPP and NEE, while maintaining a large ensemble spread that captures a high percentage of observations. Optimized soil and plant hydraulic parameters also enhanced the representation of seasonal plant water stress, capturing summer stress dynamics more realistically in both wet and dry years, with stronger hydraulic limitation during dry years.

These results indicate that correcting soil water availability alone is insufficient to improve plant water use and photosynthesis. Including ET and canopy conductance observations provides additional constraints, strengthening the interactions between soil moisture, transpiration, and carbon uptake. This demonstrates that multi-variable data assimilation is needed to effectively reduce uncertainty in both soil and plant hydraulics, and that direct physiological measurements, such as sap-flow, can further enhance model predictions of both water and carbon fluxes.

How to cite: Naz, B. S., Bogena, H., Eloundou, F. B., Cabrera, J. B., Graf, A., and Hendricks-Franssen, H.-J.: Optimizing soil and plant hydraulic parameters in eCLM using multi-variable data assimilation of soil and vegetation observations, EGU General Assembly 2026, Vienna, Austria, 3–8 May 2026, EGU26-6485, https://doi.org/10.5194/egusphere-egu26-6485, 2026.

EGU26-6889 | Orals | BG9.1

Constraining vegetation turnover rates in Terrestrial Biosphere Model using L-band ALOS PALSAR backscatter 

Xu Shan, Sujan Koirala, Markus Zehner, Ranit De, Lazaro Alonso, Konstantinos Papathanassiou, and Nuno Carvalhais

An improved representation of the carbon and water cycle dynamics in terrestrial ecosystems underpins a large uncertainty reduction in modeling Earth system dynamics. The climate sensitivity of ecosystem processes controls land-atmosphere interactions and the overall atmospheric carbon uptake and release dynamics across scales. Local and Earth observations of vegetation dynamics are key for the evaluation of our understanding and support the quantification of process representation in model development. Previous research has shown the importance in undermining equifinality using multi-variate observation constraints, focusing water and carbon fluxes and stocks.

Long-wavelength radar backscatter provides unique insights into the dynamics of plant water and carbon dynamics when compared to optical EO products, as such, embeds the potential for constraining various parameters controlling local climate vegetation responses. In this study, we present an approach for assimilating L-band ALOS PALSAR backscatter data along with carbon and water fluxes measured at FLUXNET sites into a terrestrial ecosystem model to improve estimates of vegetation parameters turnover rates. A semi-empirical radiative transfer model, the Water Cloud Model (WCM), is employed as the observation operator linking modeled plant water content to L-band backscatter. Multiple model–data integration experiments are conducted to assess the added value of radar constraints across different model structures, including configurations with and without plant hydraulic schemes, and across temporal scales ranging from sub-daily to monthly.

Our results indicate that assimilating L-band backscatter observations improves estimates of aboveground biomass and strengthens constraints on foliage and woody turnover rates. However, persistent equifinality between plant water and carbon cycle processes remains, highlighting the need for improved estimates of the WCM parameters. Ultimately, this study highlights the potential of L-band backscatter to enhance vegetation carbon cycle modeling, emphasizes the added value of the newly launched ESA BIOMASS mission, and underscores the importance of integrating vegetation water dynamics into carbon models.

How to cite: Shan, X., Koirala, S., Zehner, M., De, R., Alonso, L., Papathanassiou, K., and Carvalhais, N.: Constraining vegetation turnover rates in Terrestrial Biosphere Model using L-band ALOS PALSAR backscatter, EGU General Assembly 2026, Vienna, Austria, 3–8 May 2026, EGU26-6889, https://doi.org/10.5194/egusphere-egu26-6889, 2026.

EGU26-7562 | ECS | Posters on site | BG9.1

Enhancing surface albedo and aerosol retrieval from MTG-I/FCI by accounting for Earth's sphericity and light polarization effects using a simple near-real-time-compatible approach 

Gloria Klein, Xavier Ceamanos, Jérôme Vidot, Maël Es-Sayeh, Didier Ramon, and Mustapha Moulana

Geostationary satellites allow continuous monitoring of the Earth including land surfaces and aerosols, which can now benefit from the advanced measuring capabilities of the new Meteosat Third Generation-Imager and its Flexible Combined Imager (FCI) on board. FCI offers many opportunities to improve the near real time (NRT) clear-sky retrieval of shortwave surface albedo as it is operationally conducted in the EUMETSAT Land Surface Analysis Satellite Application Facility (LSA-SAF) project (Juncu et al. 2022). For instance, FCI's new VIS04 measuring channel centered at 444 nm was found to enable better aerosol characterization (Georgeot et al. 2025) compared to what can be achieved with the previous generation GEO multi-spectral imager SEVIRI, which is essential to achieve high-quality estimation of surface properties. In addition, FCI's high spatio-temporal resolution (10-minute full-disk scan frequency and 1 km in most visible and near-infrared channels) enables enhanced surface monitoring overall. Currently, the atmospheric correction scheme used to retrieve surface albedo from FCI in the LSA-SAF is being improved to exploit all the relevant data provided by FCI while meeting the time constraints of near-real-time processing.

To achieve this goal, we use fast radiative transfer (RT) codes that make assumptions for the sake of computational constraints. This includes the plane-parallel and scalar approximations, which respectively neglect the Earth's sphericity and light polarization effects. Based on accurate top-of-atmosphere (TOA) reflectance simulations from the SMART-G Monte-Carlo RT code, we assess the errors resulting from these two simplifications in the case of FCI data processing. First, the plane-parallel approximation is found to impact significantly 36\% of FCI observations over the year, including errors larger than 10\% in some cases (e.g., at the beginning and end of each day) (preprint by Klein et al. 2025). Second, neglecting light polarization is found to lead to errors up to 6 \% in TOA reflectance simulations, especially in short visible wavelengths. Based on this study, we propose a simple approach that compensates fast RT simulations for the errors coming from these two assumptions by using pre-calculated look-up-tables of accurate Rayleigh reflectance accounting for Earth's sphericity and light polarization. According to our results, this simple approach leads to a significant error reduction overall, especially in FCI's VIS04 channel where error is divided by 4.

In addition to presenting the results above, we will discuss the upcoming integration of this simple approach in the atmospheric correction scheme of the algorithm iAERUS-GEO, which jointly retrieves aerosol optical depth and surface albedo from FCI (Ceamanos et al. 2023). Finally, we will present a first assessment of the benefits offered by this method when used to process real FCI data corresponding to relevant case studies.

How to cite: Klein, G., Ceamanos, X., Vidot, J., Es-Sayeh, M., Ramon, D., and Moulana, M.: Enhancing surface albedo and aerosol retrieval from MTG-I/FCI by accounting for Earth's sphericity and light polarization effects using a simple near-real-time-compatible approach, EGU General Assembly 2026, Vienna, Austria, 3–8 May 2026, EGU26-7562, https://doi.org/10.5194/egusphere-egu26-7562, 2026.

EGU26-8049 | ECS | Posters on site | BG9.1

Vegetation Mapping at the Tundra-Taiga Region in the Northwest Territories, Canada, and Indigenous Use 

Elisabeth Riegel, Birgit Heim, Lia Schulz, Ulrike Herzschuh, Simeon Lisovski, Ingmar Nitze, Guido Grosse, Carl C. Stadie, Annett Bartsch, Clemens von Baeckmann, Hannes Feilhauer, Ramona Heim, Antonia Ludwig, and Stefan Kruse

Arctic landscapes are very sensitive to warming with changes happening much faster than in other regions. The investigation on circumarctic Arctic vegetation change is carried out in the framework of the Federal Ministry of Research, Technology and Space (BMFTR) funded project SQUEEZE (Protection of the Disappearing Arctic Tundra: Potential, Planning, and Communication) in a large consortium. This study presented here focusses on the region close to Inuvik in the Mackenzie delta area in northwest Canada, which holds many different habitat types important to Indigenous peoples. The habitat diversity is important for ecosystem health and should be monitored as well as protected. In the region north of Inuvik, habitats range from tundra with low shrub structure, over forest tundra with sparse spruce forests, to taiga with dense needleleaf forests south of Inuvik and wetlands, lakes and river floodplains distributed over the area. These environments can be used for hunting, fishing, foraging of food, medicinal plants, firewood and construction material or as grazing grounds for caribou. However, those regions are facing changes due to climate change. Most dominant processes are increased permafrost thaw, shrubification of the tundra, northward shift of the treeline, more fires and pests in forests and changed waterways.

Remote sensing offers valuable insights into the current state of this region and can help to track changes. Airborne remote sensing provides high resolution and allows to cover large areas. The airborne data used in this work was acquired with the AWI Perma-X flight campaign in the summers 2023 and 2025. We use the Modular Airborne Camera System-Polar (MACS-Polar) optical data. The MACS-Polar camera was developed by the German Aerospace Centre (DLR, Adlershof) specifically for challenging, contrasting light conditions in the polar region. MACS images were processed to four-band (visible and near-infrared, VNIR) orthomosaics and digital surface models with spatial resolution of 15 cm and 3D point clouds with point densities of up to 25 points per m2. Features of the VNIR images as well as structural features of the surface will be used to classify the habitat types. The analysis of the data for the years 2023 and 2025 in this work allows for tracking of changes between the years. The outcomes are classified maps of habitats, such as wetland, tundra, forest tundra and different forest types, in the area around Inuvik. Those will be made publicly available to the Indigenous communities in northwest Canada. MACS optical orthomosaics can be challenging because of changing illumination during flight times and the data derivation from Structure from Motion can hold inaccuracies. However, the resulting maps of the current state of vegetation structure are valuable products. Future work can build upon those by looking at longer timescales and upscaling with Sentinel-2 satellite data.

How to cite: Riegel, E., Heim, B., Schulz, L., Herzschuh, U., Lisovski, S., Nitze, I., Grosse, G., Stadie, C. C., Bartsch, A., von Baeckmann, C., Feilhauer, H., Heim, R., Ludwig, A., and Kruse, S.: Vegetation Mapping at the Tundra-Taiga Region in the Northwest Territories, Canada, and Indigenous Use, EGU General Assembly 2026, Vienna, Austria, 3–8 May 2026, EGU26-8049, https://doi.org/10.5194/egusphere-egu26-8049, 2026.

EGU26-9332 | Orals | BG9.1

Potential Above-Ground Biomass data assimilation to constrain slow processes in ORCHIDEE (v4.3) land surface model.  

Augustin Poinssot, Guillaume Marie, Sebastiaan Luyssaert, Nicolas Viovy, and Philippe Peylin

Above Ground Biomass (AGB) and its temporal and spatial dynamics are key to monitor carbon budgets of land forest ecosystems, especially under climate change, but they are currently poorly represented in land surface models (LSMs). However recent advances in LSMs allow to have more explicit representations of stand dynamics, although key parameters associated to C allocation, mortality and recruitment processes are largely uncertain. Data assimilation methods can help to better parameterize these processes, but few studies focused on the use of AGB, compared to fast-varying fluxes like Gross Primary Productivity (GPP). This study aims to bridge this gap in the last version of the ORCHIDEE land surface model, focusing on the African tropical forest which was much less studied than other biomes. We investigate the optimal strategy to assimilate AGB products from remote sensing observations in combination with other classical C flux products in order to improve ORCHIDEE’s representations of C fluxes and stocks of African ecosystems. We assimilate the ESA-CCI AGB product along with the FLUXCOM GPP data to optimize key model parameters for two Plant Functional Types in Africa linked to photosynthesis, C allocation and mortality, using either a Genetic Algorithm or a variational approach. The fast processes are first constrained with GPP (FLUXCOM data) while the slow processes are optimized with AGB (ESA-CCI data). We select potential maximum AGB for each model pixel (~50km), using the upper quartile of the high-resolution data (~30m), which represents the likely AGB of an undisturbed ecosystem. This choice reflects the fact that the current ORCHIDEE version is more suitable to represent ecosystem response to climate drivers rather than to disturbances. The final objective will be to use raw AGB to define an additional regional or pixel-based disturbance layer to ORCHIDEE. Key parameters involved either in fast (GPP) or slow (AGB) processes are selected by sensibility analysis. This two-steps assimilation allows us to significantly reduce the RMSD against the observations, for both GPP and AGB. This study highlights the potential of remote sensing AGB to constrain slow processes of LSM to better capture the dynamic of AGB in African tropical forests. While requiring a specific methodology, the assimilation of AGB induces significant changes in the C allocation, mortality and regrowth simulation by the ORCHIDEE model, thus impacting the carbon budgets of African tropical forests as well as increasing the overall confidence in future projections.

How to cite: Poinssot, A., Marie, G., Luyssaert, S., Viovy, N., and Peylin, P.: Potential Above-Ground Biomass data assimilation to constrain slow processes in ORCHIDEE (v4.3) land surface model. , EGU General Assembly 2026, Vienna, Austria, 3–8 May 2026, EGU26-9332, https://doi.org/10.5194/egusphere-egu26-9332, 2026.

EGU26-9504 | Posters on site | BG9.1

Next-Generation Land Surface Albedo Products from Metop-SG: Towards a Synergetic Use of METimage and 3MI Observations 

Valentin Vigerie, Daniel Juncu, Xavier Ceamanos, Emanuel Dutra, Sandra Gomes, and Isabel Trigo

Land surface albedo, the ratio of reflected to incoming solar radiation at the Earth’s surface, is a fundamental parameter in the global energy budget. As an essential climate variable, it plays a key role in climate monitoring, environmental studies, and operational numerical weather prediction. Accurate, high-resolution albedo products are therefore critical for capturing land surface processes and their rapid changes, which in turn influence atmospheric dynamics and climate feedbacks.

Satellite remote sensing from Low Earth Orbit (LEO) provides a consistent means of estimating land surface albedo in the visible and near-infrared globally across the planet. The recent launch of the first platform of the EUMETSAT Polar System - Second Generation A series (Metop-SG-A1) marks a significant leap in satellite observation capabilities in comparison to the previous generation. In particular, Metop-SG-A payload includes two advanced multi-spectral imaging radiometers: METimage, offering enhanced spatial resolution down to 500 meters across a wide range of spectral channels, and the Multi-viewing, Multi-channel, Multi-polarisation Imager (3MI), which provides unique multi-angular information for characterising clouds, aerosols properties and surface directional reflectance.

Within the EUMETSAT Satellite Application Facility for Land Surface Analysis (LSA SAF), led by the Portuguese Institute for Sea and Atmosphere (IPMA), efforts are currently underway to develop, validate, and operationally and freely distribute surface albedo products derived from METimage and 3MI observations separately. These will ensure continuity with existing LSA SAF albedo products based on previous-generation sensors (Metop/AVHRR). The next step will be to exploit the complementarity between Metop-SG-A instruments, by combining METimage’s high spatial and spectral detail with 3MI’s angular diversity and related aerosol retrievals (e.g. from future EUMETSAT operational aerosol products). This joint retrieval is expected to mitigate existing atmospheric correction biases and enhance the overall accuracy of the current LSA SAF albedo products, as well as their temporal responsiveness in front of sudden land surface changes. All these aspects will be discussed in our presentation.

How to cite: Vigerie, V., Juncu, D., Ceamanos, X., Dutra, E., Gomes, S., and Trigo, I.: Next-Generation Land Surface Albedo Products from Metop-SG: Towards a Synergetic Use of METimage and 3MI Observations, EGU General Assembly 2026, Vienna, Austria, 3–8 May 2026, EGU26-9504, https://doi.org/10.5194/egusphere-egu26-9504, 2026.

EGU26-10895 | ECS | Posters on site | BG9.1

Constraining Forest Carbon and Water Fluxes in the Italian Alps by Coupling National Forest Inventory Data, Process-Based Modeling, and Earth Observation 

Vincenzo Saponaro, Elia Vangi, Anna Candotti, Daniela Dalmonech, Marta Galvagno, Gianluca Filippa, Alessio Collalti, and Enrico Tomelleri

Mountain forests play a key role in the terrestrial carbon cycle, yet their contribution as carbon sinks remains highly uncertain, particularly in alpine regions. Steep elevation gradients, complex topography, and highly heterogeneous forest structure generate strong spatial variability in meteorological conditions and ecosystem processes, making high spatial resolution essential for both observation and modeling. While process-based forest models provide valuable insight into carbon and water fluxes, their application in mountain environments is often constrained by sparse observations and difficulties in scaling plot-level processes to the landscape. Integrating plot-scale modeling with high-resolution spatial information is therefore critical to better constrain model estimates in these systems. In our study, we developed a model–data integration framework for the Italian Alps (~52,000 km²), in which the 3D-CMCC-FEM process-based forest model was parametrized and run at National Forest Inventory (NFI) plot level. Plot-scale simulations of Gross Primary Production (GPP), Net Primary Production (NPP), and Evapotranspiration (ET) were then spatialized to continuous 30 m resolution maps using machine learning. The spatialization combined NFI-derived forest structural variables with high-resolution meteorological data, topographic predictors, and satellite-based vegetation indices. Four machine learning algorithms—Random Forest, Artificial Neural Networks, Extreme Gradient Boosting, and Support Vector Machines—were evaluated to extend plot-scale model outputs across the landscape. Model performance was assessed using k-fold cross-validation. Random Forest consistently achieved the highest predictive accuracy for all target variables, explaining approximately 27–47% of the variance in GPP, NPP, and ET across k-fold cross-validation and showing 3–15% lower prediction errors compared to the other machine learning methods. Variable importance analyses indicated that forest structural attributes derived from NFI data, elevation-related topographic metrics, and temperature- and precipitation-based meteorological predictors together accounted for the majority of the explained variance, emphasizing their dominant control on the spatial variability of forest carbon and water fluxes in alpine terrain. The resulting maps show clear spatial patterns in productivity and water use across alpine forest types and elevational gradients, providing spatially continuous, wall-to-wall information that complements plot-based National Forest Inventories. By linking plot-scale forest processes to landscape-scale patterns, this approach supports improved estimation, spatial consistency, and upscaling of forest carbon fluxes and stocks for measurement, reporting, and verification activities in heterogeneous mountain landscapes under ongoing climate change.

How to cite: Saponaro, V., Vangi, E., Candotti, A., Dalmonech, D., Galvagno, M., Filippa, G., Collalti, A., and Tomelleri, E.: Constraining Forest Carbon and Water Fluxes in the Italian Alps by Coupling National Forest Inventory Data, Process-Based Modeling, and Earth Observation, EGU General Assembly 2026, Vienna, Austria, 3–8 May 2026, EGU26-10895, https://doi.org/10.5194/egusphere-egu26-10895, 2026.

EGU26-11052 | ECS | Posters on site | BG9.1

ENSO-induced regime shift from energy to water limitation in tropical ecosystems? 

Hao Huang and René Orth

Tropical forests take up a significant fraction of human carbon emissions, thereby contributing to slowing down global warming. In the context of El Niño-Southern Oscillation (ENSO), the El Niño and La Niña phenomena can cause anomalously weather patterns across tropical regions. However, it is largely unknown to what extent ENSO-induced climatic anomalies can alter the response of ecosystem function, for example, by inducing water-limited conditions as a consequence of dry and warm weather.

To address this question, we (i) quantify the degree of vegetation water limitation using the ecosystem limitation index (ELI), and (ii) correlate the local ELI with prior sea surface temperature in the Niño3.4 region, which represents the strength of ENSO. Gridded observation-based evapotranspiration data and near-infrared reflectance of vegetation are used to represent vegetation functioning in the ELI calculation. First results show that there are significant ELI-El Niño relationships in northern Amazon forests, while for La Niña conditions we find such relationships more widespread across the Amazon, Africa, Southeast Asia, and northern Australia. Despite these relationships, in most tropical ecosystems energy is still the main driver of vegetation functioning, while actual water limitation only occurs in a few regions including eastern South America and northern Australia, likely due to decreased precipitation. Thereby, water limitation as a consequence of ENSO impacts could be more prominent during the dry season in the tropics. Finally, for near-neutral ENSO conditions we find generally weak impacts on ELI in the tropics. Understanding the ENSO-induced shift in ecosystem limitation is crucial for better understanding the interannual variability of the land carbon sink, as well as because ENSO variability is expected to increase with more frequent extreme El Niño and subsequently more occurrences of consecutive La Niña, likely enhancing its influence on ecosystems.

How to cite: Huang, H. and Orth, R.: ENSO-induced regime shift from energy to water limitation in tropical ecosystems?, EGU General Assembly 2026, Vienna, Austria, 3–8 May 2026, EGU26-11052, https://doi.org/10.5194/egusphere-egu26-11052, 2026.

EGU26-11868 | Orals | BG9.1

The Cooling Efficiency Factor Index (CEFI): A New Satellite-Based Indicator for Research and Operational Monitoring of Land Surface Processes and Beyond 

Matteo Zampieri, Marco Girardello, Guido Checcherini, Md Saquib Saharwardi, Mirco Migliavacca, Emanuele Massaro, Milan Kalas, Ibrahim Hoteit, and Alessandro Cescatti

The cooling efficiency of the land surface, i.e. its ability to dissipate absorbed radiation and moderate temperature rise, is manifested by its apparent heat capacity, a property of the land surface that varies throughout the day in response to the intensities of the sensible and latent heat fluxes. Under clear sky conditions, the daytime increase in apparent heat capacity can be reliably estimated from geostationary satellite data and is used to define the Cooling Efficiency Factor Index (CEFI), which uniquely characterizes the temperature response to radiation at a given location on a given day. At longer time scales, the temporal variability of CEFI is modulated by several factors associated with changes in land surface state, including land cover, soil moisture availability, as well as the structure and dynamics of the atmospheric boundary layer. These relationships can be exploited to derive proxies for variables and processes that are otherwise difficult to observe, especially in real time. Here, we recall  the definition of CEFI and we also present several applications. As already demonstrated, the CEFI index can serve as an indicator of vegetation drought stress, the condition when plants close their stomata due to soil water limitation and excessive atmospheric moisture demand, and vegetation productivity. In addition, the CEFI can act as a proxy for surface wind stress over arid regions with sparse vegetation. Consequently, CEFI can be involved in the detection of flash drought and to estimate fire risk in natural ecosystems, crop production losses in agricultural areas, and dust formation in desert regions. The CEFI can also be applied to quantify the cooling efficiency of urban areas. Finally we introduce the estimation of the apparent heat capacity over the sea surface, with potential implications for estimating wind over the sea and mixed layer depth from a purely observed perspective. Given its broad range of applications, our next step is to compute CEFI using multiple geostationary satellites to extend its spatial coverage as well as to further demonstrate its applicability range.

How to cite: Zampieri, M., Girardello, M., Checcherini, G., Saharwardi, M. S., Migliavacca, M., Massaro, E., Kalas, M., Hoteit, I., and Cescatti, A.: The Cooling Efficiency Factor Index (CEFI): A New Satellite-Based Indicator for Research and Operational Monitoring of Land Surface Processes and Beyond, EGU General Assembly 2026, Vienna, Austria, 3–8 May 2026, EGU26-11868, https://doi.org/10.5194/egusphere-egu26-11868, 2026.

EGU26-12012 | Orals | BG9.1

RTSI: An Analytical Radiative Transfer Model for Strip-Intercropping Systems 

Run Zhong, Zhihong Li, Dalei Hao, and Yelu Zeng

Strip-intercropping systems present challenges for radiative transfer modeling due to the complex mutual shadowing between alternating tall and short crops. To address this, we developed an analytical Radiative Transfer model for Strip-Intercropping (RTSI), validated against UAV observations and 3D simulations in a maize-soybean system. The model demonstrated high accuracy in capturing canopy reflectance (R²≥0.94, RMSE<0.0251). Sensitivity analysis confirmed RTSI's robustness (RRMSE<8%) across varying configurations, significantly outperforming the Spectral Linear Mixture (SLM) model, which produced large errors in heterogeneous scenarios. Furthermore, the study elucidated the role of multiple scattering in compensating for energy in shadowed regions, effectively reshaping bidirectional reflectance anisotropy. RTSI serves as a vital tool for analyzing light transport and supporting the precise retrieval of biophysical parameters in complex intercropping systems.

How to cite: Zhong, R., Li, Z., Hao, D., and Zeng, Y.: RTSI: An Analytical Radiative Transfer Model for Strip-Intercropping Systems, EGU General Assembly 2026, Vienna, Austria, 3–8 May 2026, EGU26-12012, https://doi.org/10.5194/egusphere-egu26-12012, 2026.

EGU26-12429 | ECS | Orals | BG9.1

Using atmospheric inverse model CIF-FLEXPART to estimate the capability to monitor CO2 and CH4 emission changes in Finland 

Sara Hyvärinen, Maria Katariina Tenkanen, Anteneh Mengistu, Maija Pietarila, Aki Tsuruta, Rebecca Ward, and Tuula Aalto

In our changing climate and the green transition movement, it is important to verify national greenhouse gas emission inventories. By using prior emission estimates from inventories and process models as well as atmospheric greenhouse gas observations, we are able to assess emissions and their changes from different sources with inversion modeling. However, the scarcity of measuring stations affect the uncertainty of the inversion models.

In this study, we assess our ability to monitor the green transition in Finland. Currently atmospheric greenhouse gas concentrations are measured in 6 locations in Finland. Including new observation towers would fill existing gaps in the observation network. We aim to see how new atmospheric concentration measurement towers with different sensor accuracies could improve greenhouse gas detection in the area. We carry out an observing system simulation experiment (OSSE), using sensitivity tests with the Community Inversion Framework (CIF) using the transport model FLEXPART with a 0.1º x 0.1º spatial resolution on a nested domain, and observing how the model reacts to changes in the prior emissions and synthetic observations.

Addition of new stations in Finland could improve greenhouse gas detection and emission inventory assessment, and using lower accuracy sensors could help improve detection with a lower cost. Development of the OSSE experiment is still in progress and emissions from different source sectors, like wetlands and anthropogenic emissions will be optimized for multiple years. Our final inversion products will give improved estimates of inversion model sensitivity and show how effective a new observing system in Finland will be at detecting emissions.

How to cite: Hyvärinen, S., Tenkanen, M. K., Mengistu, A., Pietarila, M., Tsuruta, A., Ward, R., and Aalto, T.: Using atmospheric inverse model CIF-FLEXPART to estimate the capability to monitor CO2 and CH4 emission changes in Finland, EGU General Assembly 2026, Vienna, Austria, 3–8 May 2026, EGU26-12429, https://doi.org/10.5194/egusphere-egu26-12429, 2026.

EGU26-12474 | ECS | Posters on site | BG9.1

Beyond Static Fluxes: Constraining parameters of a wetland methane model in a new fully coupled CH4DAS using Satellite Concentrations and In-Situ Fluxes 

Rajarajan Vetriselvan, Peter Rayner, Antoine Berchet, Philippe Peylin, Elodie Salmon, Marielle Saunois, Juliette Bernard, and Alka Singh

Methane emissions from natural wetlands are the largest and most uncertain component in the global methane budget. Conventionally they are estimated using two main methods. Top-Down methods work by inverting atmospheric concentrations of methane into fluxes, using a chemistry transport model. This is often done by optimizing the scaling factors of the inventory flux maps, but this approach decouples the fluxes from their physics and has limited predictive capabilities. Conversely, Bottom-up methods use biogeochemical models to directly estimate the fluxes, but they are severely affected by the scarcity of in-situ flux observations to calibrate them. To bridge this gap, we present the development and validation of a new fully coupled Methane Data Assimilation System (CH4DAS). This system integrates these two techniques, and provides constraints to the bottom-up model (ie., optimizing its main parameters) from both satellite concentrations and site-level fluxes. Such integration ensures that flux estimates remain consistent with physical drivers, simultaneously addressing data scarcity and enabling predictive capability.

CH4DAS is developed within the Community Inversion Framework (Berchet et al., 2021) and couples SatWetCH4 (Bernard et al., 2025), a simple bottom-up wetland methane model with the LMDz-SACS chemistry-transport model. This system can simultaneously assimilate both satellite concentrations (GOSAT) and site-level in-situ fluxes (FLUXNET-CH4) within a variational assimilation scheme to constrain the model parameters. To address the scale challenges while simultaneously assimilating observations of different streams, we run two instances of SatWetCH4. The first, driven by global forcing is coupled with LMDz-SACS and constrained by Satellite observations. While the second instance driven by site-level forcing is constrained by in-situ fluxes. This way, the shared internal temperature sensitivity parameter Q100 is jointly constrained by two data streams, while site-level and regional base rate parameter K account for data-specific variability.

We mathematically validate the system using an Identical Twin Observing System Simulation Experiment (OSSE), demonstrating its capacity to constrain the control variables. Further, we apply the system to real-world data to demonstrate that the system can successfully reduce the mismatches in the prior to match the spatiotemporal gradients observed by GOSAT, enabling insights on regional CH4 budgets.

How to cite: Vetriselvan, R., Rayner, P., Berchet, A., Peylin, P., Salmon, E., Saunois, M., Bernard, J., and Singh, A.: Beyond Static Fluxes: Constraining parameters of a wetland methane model in a new fully coupled CH4DAS using Satellite Concentrations and In-Situ Fluxes, EGU General Assembly 2026, Vienna, Austria, 3–8 May 2026, EGU26-12474, https://doi.org/10.5194/egusphere-egu26-12474, 2026.

EGU26-12523 | ECS | Orals | BG9.1

Using k-means clustering as a robust and repeatable method to determine representative climate/eco-regions 

Emily Wright, Theodoros Economou, Arthur Argles, Eddy Robertson, Laura Gibbs, and Amy Bennett

The Amazon has a significant role in regional and global climate and carbon cycles. Having a robust method to determine and understand representative climatological sub-regions, and being able to sample these regions would help improve modelling the land surface and carbon cycle. The regions would also inform understanding of the representativeness of in-situ observations thereby correctly interpolating and bias correcting results as well as informing locations of future sites. Here the regions are calculated using a machine learning algorithm called k-means clustering, which groups datapoints which are close in variable space, hence have similar climatological characteristics. Various combinations of input variables and number of clusters (k values) were explored but the final results used annual average temperature, annual average precipitation and soil phosphorus as inputs, which produced contiguous regions which were easy to interpret. These regions were then evaluated using marginal distributions of the input variales and by exploring the above-ground-biomass distribution. This was performed for both present day observational data inputs and for projected climate data using ISI-MIP bias correct climate projections, exploring how the regions may change in future climates. This showcases the Amazon as an example, but more importantly highlights a robust technique for determining eco-regions which can be applied to different locations and climate scenarios.

How to cite: Wright, E., Economou, T., Argles, A., Robertson, E., Gibbs, L., and Bennett, A.: Using k-means clustering as a robust and repeatable method to determine representative climate/eco-regions, EGU General Assembly 2026, Vienna, Austria, 3–8 May 2026, EGU26-12523, https://doi.org/10.5194/egusphere-egu26-12523, 2026.

EGU26-12972 | Posters on site | BG9.1

Remote sensing capabilities of detecting spatio-temporal dynamics in unregulated extractivism hotspots in Ecuador  

Inga Lammers, Jose Jara-Alvear, Christian Geiß, and Valerie Graw

Degradation of the Amazon rainforest is increasing by expanding human activities, especially unregulated extractivism. Particularly gold mining is a major driver of environmental change, causing large-scale deforestation, river fragmentation and increased sediment loads. These pressures have intensified over the past decade due to rising global gold prices and policy shifts, most notably the 2016 decision by the Ecuadorian government to open approximately 13% of the national territory to mining exploration, including areas that were previously under protection [1, 2].

This study assesses the suitability of different remote sensing datasets for detecting unregulated mining and investigates the spatio-temporal dynamics of mining expansion in the Ecuadorian Amazon. The analysis focuses on three mining hotspots in eastern Ecuador (further called Punino, Napo, and Shaime) where unregulated activities have been widely reported. Given the sensitivity of the topic and the need for transparent and reproducible information, the study relies exclusively on remote sensing data, including Sentinel-1 synthetic aperture radar (SAR) data and PlanetScope optical imagery, as well as the Satellite Embedding Datatset V1 (SED). All datasets are processed mainly in Google Earth Engine (GEE) with dataset-specific methodologies applied. Supervised classification approaches were used, employing a k-NN classifier for the SED dataset and a random forest classifier for PlanetScope imagery, covering the period from 2017 to 2024. For Sentinel-1 data, a Sequential Change Detection (SCD) approach was implemented, evaluating multi-temporal polarimetric SAR time series to detect statistically significant changes throughout the specified observation period, with a revisit interval of approximately 12 days.

Results show a pronounced increase in mining extent and associated deforestation across all study areas, with particularly strong expansion during 2023 and 2024. In the Punino region, several sub-areas exhibited mining coverage approaching 10 % of the total AOI in 2024, while one sub-AOI exceeded 20 %, corresponding to approximately 13.2 km² of mining area. Comparison of classification results indicates that persistent cloud cover and temporal inconsistencies limit the effectiveness of optical PlanetScope data, whereas the SED dataset provides a reliable and efficient alternative for annual assessments with minimal preprocessing requirements. The SCD analysis revealed detailed expansion dynamics, demonstrating that mining typically initiates along major rivers and progressively expands toward tributaries and surrounding forest areas. The multi-method approach further enables cross-validation of results, which are consistent with independent reports documenting similar spatial patterns and trends.

The severe environmental consequences of unregulated mining, including deforestation, water pollution, and threats to indigenous communities, emphasize the importance of systematic and transferable remote sensing-based monitoring frameworks to support environmental protection in the Ecuadorian Amazon and enable timely, accessible reporting for environmental governance and decision-making.


[1] Albert, J. S., Carnaval, A. C., Flantua, S. G., Lohmann, L. G., Ribas, C. C., Riff, D., ... & Nobre, C. A. (2023). Human impacts outpace natural processes in the Amazon. Science, 379(6630), eabo5003.

[2] Roy, B. A., Zorrilla, M., Endara, L., Thomas, D. C., Vandegrift, R., Rubenstein, J. M., ... & Read, M. (2018). New mining concessions could severely decrease biodiversity and ecosystem services in Ecuador. Tropical Conservation Science, 11, 1940082918780427.


How to cite: Lammers, I., Jara-Alvear, J., Geiß, C., and Graw, V.: Remote sensing capabilities of detecting spatio-temporal dynamics in unregulated extractivism hotspots in Ecuador , EGU General Assembly 2026, Vienna, Austria, 3–8 May 2026, EGU26-12972, https://doi.org/10.5194/egusphere-egu26-12972, 2026.

EGU26-14508 | ECS | Posters on site | BG9.1

Airborne Full-Waveform Lidar Swath Mapping of Surface Topography and Vegetation 

Natalie Midzak, John Yorks, Guanging Yang, Jeffrey Lee, Jeffrey Chen, Patrick Selmer, and David Harding

The 2017–2027 National Academies Earth Science Decadal Survey identified Surface Topography and Vegetation (STV) as a targeted observable, calling for high-resolution, global measurements to improve understanding of the evolution of Earth’s landscape. The Concurrent Artificially-intelligent Spectrometry and Adaptive Lidar System (CASALS) is a novel airborne swath-mapping altimetry lidar that employs a novel transmitter and grating method in combination with a state-of-the-art, high-speed, photon-sensitive detector array. CASALS is designed to exceed current lidar capabilities by providing 3D swath mapping of Earth surface heights and vegetation waveforms with fine cross-track spatial resolution that are especially useful for characterizing the structure of forests.

The current airborne CASALS instrument flew onboard the NASA B-200 King Air aircraft at a typical cruise altitude of 4.5 km for 4 flights completed from 07-18 November 2024 targeting vegetated surfaces and forests over Virginia and North Carolina. The full-waveform lidar collected a total of 256 individual waveforms with ~21 cm horizontal resolution, creating a swath of 55 m across the aircraft flight line during these flights. This work focuses on describing the CASALS algorithm development to identify ground and vegetation features within CASALS waveform data, with a goal of demonstrating progress toward full waveform–to–3D point cloud generation and applicability to a future spaceborne NASA STV mission.

How to cite: Midzak, N., Yorks, J., Yang, G., Lee, J., Chen, J., Selmer, P., and Harding, D.: Airborne Full-Waveform Lidar Swath Mapping of Surface Topography and Vegetation, EGU General Assembly 2026, Vienna, Austria, 3–8 May 2026, EGU26-14508, https://doi.org/10.5194/egusphere-egu26-14508, 2026.

EGU26-15547 | ECS | Posters on site | BG9.1

Monitoring of vegetation phenology across England: Assessing interannual variability and land-cover sensitivity using Copernicus HR-VPP 

Francisco Salgado-Castillo, Maria Peppa, Jon Mills, and Doreen Boyd

Vegetation phenology is a primary indicator of ecosystem functioning and climate sensitivity, yet robust monitoring at landscape scales remains challenging in land-use heterogeneous regions such as England. The Copernicus High-Resolution Vegetation Phenology and Productivity product (HR-VPP), derived from Sentinel-2, provides 10 m phenological metrics, including start of season (SOS), end of season (EOS), and length of season (LOS), enabling unprecedented fine-scale mapping of vegetation dynamics.

In this contribution, we present a workflow to characterise phenological timing across England using HR-VPP time series from 2017 to 2024. We quantify spatial patterns and interannual variability in key phenometrics and summarise trends across major land cover types.

This study provides: (i) an England-scale baseline of phenological timing at 10 m resolution; (ii) an assessment of recent anomalies and climate-driven variability within the HR-VPP record; and (iii) practical guidance for integrating high-resolution Copernicus products into national ecological monitoring. This work supports the broader application of HR-VPP for assessing vegetation resilience to climate and land-use pressures at the national level.

How to cite: Salgado-Castillo, F., Peppa, M., Mills, J., and Boyd, D.: Monitoring of vegetation phenology across England: Assessing interannual variability and land-cover sensitivity using Copernicus HR-VPP, EGU General Assembly 2026, Vienna, Austria, 3–8 May 2026, EGU26-15547, https://doi.org/10.5194/egusphere-egu26-15547, 2026.

EGU26-15600 | ECS | Orals | BG9.1

Underlying Terrain and Forest Height Retrieval based on Lutan-1 L-Band Bistatic InSAR Phase-Height Histograms 

Zheng Jinting, Lei Yang, Qin Yuxiao, Li Guoqing, and Li Weiliang

This study presents a scalable framework for retrieving sub-canopy terrain elevations and forest canopy heights based on phase-height histograms constructed from few-look L-band bistatic InSAR data acquired by China’s Lutan-1 mission, with forest canopy height directly derived from the uppermost position of the histogram. The proposed method was evaluated over several representative forested regions in China, including Jianfengling National Forest Park (Hainan Province), Saihanba National Forest Park (Hebei Province), and the Northeast China Tiger and Leopard National Park (Jilin Province). The approach classifies phase-height histograms into four distinct types based on their statistical and morphological characteristics, corresponding to different scattering scenarios. For each type, type-specific strategies are applied to extract ground-related features, enabling robust estimation of the digital terrain model (DTM), while forest canopy height is derived from the vertical distribution of scattering. To improve accuracy in areas with complex scatterers, such as wetlands or water bodies, a supplementary regression based on backscatter intensity is employed to correct anomalously low height estimates. Validation against spaceborne LiDAR (GEDI and ICESat-2/ATLAS) demonstrates that the method produces reliable terrain and canopy height products across diverse forest types, ranging from tropical montane forests to temperate plantations and mixed natural forests. These results demonstrate that the proposed phase-height histogram-based approach can reliably and automatically retrieve forest canopy height and DTM without requiring any additional auxiliary data (e.g., LiDAR). This highlights that phase-height histograms provide a practical, reproducible, and scalable tool for large-scale forest monitoring, offering a complementary approach to PolInSAR and TomoSAR techniques for ecological applications.

How to cite: Jinting, Z., Yang, L., Yuxiao, Q., Guoqing, L., and Weiliang, L.: Underlying Terrain and Forest Height Retrieval based on Lutan-1 L-Band Bistatic InSAR Phase-Height Histograms, EGU General Assembly 2026, Vienna, Austria, 3–8 May 2026, EGU26-15600, https://doi.org/10.5194/egusphere-egu26-15600, 2026.

EGU26-15805 | Orals | BG9.1

How can we better track diurnal photosynthesis using geostationary satellite? A study over the Asia-Oceania flux tower sites 

Xuanlong Ma, Chunyan Cao, Xiaowei Liu, Zhenduo Deng, Wei Li, Zhi Qiao, and Wei Yang

Terrestrial photosynthesis constitutes a crucial component of the global carbon cycle, and its accurate quantification is essential for understanding climate change dynamics. However, current remote sensing monitoring of terrestrial photosynthesis often rely on data with coarse temporal resolution, which cannot adequately capture sub-daily variations in canopy photosynthesis in response to environmental drivers. The hyper-temporal observations enabled by new-generation geostationary satellites offer promising opportunities to monitor canopy photosynthesis with substantially improved temporal resolution and reduced data gaps. In this study, we evaluate the potential of spectral indices and radiation metrics derived from FY4B/AGRI and Himawari-8/AHI at 10/15-minute intervals to track diurnal variations in canopy light use efficiency (LUE) and photosynthesis across more than 50 flux tower sites in the Asia-Oceania region. Geometric, atmospheric, and angular corrections were applied to enhance radiometric consistency. Multiple modeling schemes of varying complexity were tested to determine the optimal parameter combination. Our results indicate that, with rigorous data processing and quality control, FY4B/AGRI and Himawari-8/AHI provide valuable information on diurnal canopy structure, physiological activity, and solar radiation dynamics, enabling reasonably accurate tracking of sub-daily canopy photosynthesis. Furthermore, compared to polar-orbiting satellites such as MODIS, geostationary satellites substantially reduce data gaps, particularly over cloud-prone regions such as tropical and subtropical forests. We suggest that observations from FY4B/AGRI and H8/AHI, in conjunction with flux tower networks, can contribute to a better process understanding of terrestrial carbon cycle over Asia-Oceania region at refined temporal scales.

How to cite: Ma, X., Cao, C., Liu, X., Deng, Z., Li, W., Qiao, Z., and Yang, W.: How can we better track diurnal photosynthesis using geostationary satellite? A study over the Asia-Oceania flux tower sites, EGU General Assembly 2026, Vienna, Austria, 3–8 May 2026, EGU26-15805, https://doi.org/10.5194/egusphere-egu26-15805, 2026.

EGU26-16501 | Posters on site | BG9.1

Remote sensing based water stress dynamics monitoring and drought impact prediction 

Christina Eisfelder, Juliane Huth, and Felix Bachofer

Climate change impacts on Earth’s ecosystems have become increasingly evident in recent years. Europe is currently the fastest-warming continent, with temperatures rising at approximately twice the global average rate. Climatic extremes, rising temperatures, and altered precipitation patterns are expected to increase the frequency and severity of droughts, especially in southern Europe. Vegetation is particularly sensitive to climatic conditions; consequently, substantial impacts of climate change on vegetation are expected in the future. 

In the presented study, a novel product is developed that combines near-real-time Earth observation data with short- to medium-range weather forecasts to monitor water stress dynamics and anticipate drought impacts. Earth observation data and derived products are utilized to deliver a regular monitoring of water stress and drought conditions. The application is based on a Combined Drought Indicator (CDI) approach, which enables the differentiation of drought severity levels. The CDI is based on anomaly detection using Copernicus Sentinel-2 and Sentinel-3–derived Normalized Difference Vegetation Index (NDVI), Sentinel-3–derived Land Surface Temperature (LST), Surface Soil Moisture (SSM) from the Copernicus Land Monitoring Service (CLMS), and the Standardized Precipitation Index (SPI) derived from Climate Hazards Center Infrared Precipitation with Stations (CHIRPS) data. Short-range to seasonal forecasts are integrated using the ECMWF HRES product. This information is exploited to generate spatially explicit early warnings of potential drought impacts. The derived product is computed at five-day intervals. To assess the accuracy of the product, forecasts for recent past years are generated and evaluated against existing drought maps and agricultural datasets. 

The presented approach moves beyond classical drought indices by focusing on drought impacts, such as agricultural stress, water availability and hydrological deficits. The resulting product can assist in anticipating and managing drought impacts for stakeholders from agriculture, water management, civil protection, and other drought-affected areas.


How to cite: Eisfelder, C., Huth, J., and Bachofer, F.: Remote sensing based water stress dynamics monitoring and drought impact prediction, EGU General Assembly 2026, Vienna, Austria, 3–8 May 2026, EGU26-16501, https://doi.org/10.5194/egusphere-egu26-16501, 2026.

EGU26-18162 | Posters on site | BG9.1

Spatiotemporal analysis of ground surface displacement using InSAR technique for monitoring peatland health in Sarobetsu Mire, Japan 

Takashi Machimura, Haodong Zhang, Satoru Sugita, Shiro Tsuyuzaki, and Stefan Hotes

Peatlands are a valuable environmental resource on Earth due to their large carbon storage capacity and role as a breeding ground for biodiversity. However, many of them are currently at risk of decline due to land development and climate change. We investigated the effectiveness of satellite-based Interferometric Synthetic Aperture Radar (InSAR) technique to support peatland conservation and restoration projects by monitoring the degree of peatland degradation and restoration. Sarobetsu Mire is the largest peatland in Japan, however its natural vegetation has been significantly disturbed by pasture development, drainage channels, and peat mining. We collected C-band SAR images from the Sentinel-1 satellite from 2015 to 2025. We created a series of surface displacement maps with a spatial resolution of 20 m using interferometry, Short Baseline Subset (SBAS), and phase unwrapping procedures. We then analyzed seasonal surface elevation changes during a snow-free period (207 days in total). Relative surface elevation change predicted by InSAR was highly correlated with ground observations (mean bias = -0.001 m, RMSE = 0.019 m, r = 0.58). Seasonal surface displacement clearly responded to changes in groundwater table. The amplitude of seasonal surface displacement differed significantly between natural vegetation and peat-mining ruin, and among the dominant vegetation classes (Sphagnum, Moliniopsis, and Phragmites). This differential dynamics indicates the amount and physical properties of subsurface peat deposits and potentially be a useful indicator of peatland health.

How to cite: Machimura, T., Zhang, H., Sugita, S., Tsuyuzaki, S., and Hotes, S.: Spatiotemporal analysis of ground surface displacement using InSAR technique for monitoring peatland health in Sarobetsu Mire, Japan, EGU General Assembly 2026, Vienna, Austria, 3–8 May 2026, EGU26-18162, https://doi.org/10.5194/egusphere-egu26-18162, 2026.

EGU26-18239 | ECS | Orals | BG9.1

Improving water and carbon flux simulations through multi-source earth observation data assimilation 

Haojin Zhao and Harrie-Jan Hendricks Franssen

Accurate representation of terrestrial carbon–water dynamics remains a challenge in Earth system modelling, particularly under extreme hydro-climatic conditions such as droughts and heatwaves. While data assimilation (DA) of satellite-based brightness temperature (BT) and soil moisture (SM) retrievals improves near-surface moisture estimates, its impact on evapotranspiration (ET) and carbon fluxes is limited. Recent studies demonstrate that the joint assimilation of multiple Earth observation streams, such as vegetation indices, can improve estimates of both hydrological and biogeochemical state variables.

In this study, we developed a DA framework coupled to the Encore Community Land Model (eCLM), a fork of the Community Land Model version 5.0, with some extensions. The framework is applied over the EURO-CORDEX domain at 0.11-degree resolution. Assimilation is performed using the Ensemble Smoother with Multiple Data Assimilation (ES-MDA) with 64 ensemble members, allowing for the joint updating of key land surface parameters governing both soil hydrology and vegetation physiology. Assimilation observations include satellite-derived SM retrievals from the Soil Moisture Active Passive (SMAP) mission, ET from the Integrated Carbon Observation System (ICOS) eddy covariance (ET) flux towers, and leaf area index (LAI) from the Moderate Resolution Imaging Spectroradiometer (MODIS). Experiments are performed for the period 2018-2020, which include several recent European hydro-climatic extremes. Model performance is evaluated against in situ eddy covariance (EC) flux tower measurements of SM, ET, and net ecosystem exchange (NEE) across multiple European sites. We demonstrate that joint assimilation enhances the model’s ability to reproduce observed water–carbon fluxes and improves representation of land surface responses under recent extreme drought conditions.

How to cite: Zhao, H. and Hendricks Franssen, H.-J.: Improving water and carbon flux simulations through multi-source earth observation data assimilation, EGU General Assembly 2026, Vienna, Austria, 3–8 May 2026, EGU26-18239, https://doi.org/10.5194/egusphere-egu26-18239, 2026.

EGU26-18352 | ECS | Orals | BG9.1

Extracting fluorescence efficiency from TROPOMI satellite observations: is it better to work on individual observations before gridding into data cubes? 

Qiqi Deng, Daniel Pabon Moreno, Zhaoying Zhang, Georg Wohlfahrt, and Gregory Duveiller

Solar-induced chlorophyll fluorescence (SIF) is a plant signal that can currently be retrieved from satellites at regional to global scale. Since SIF originates from the pool of excitation energy absorbed by chlorophyll molecules that also provides the energy for the photosynthetic CO2 assimilation, it has potential for diagnosing vegetation stress, particularly before the stress becomes apparent by optical decreases in greenness. However, the interpretation of satellite-observed SIF (SIFobs) remains challenging because it integrates multiple confounding factors beyond plant physiology, including variations in illumination conditions, canopy structure, and observation geometry. For applications aiming to detect early stress signals, it is essential to disentangle the physiological component, i.e., fluorescence efficiency (ΦF). SIFobs are strongly influenced by illumination conditions which change with actual differences in overpass times that can occur from one day to the next. Also, the canopy structure determines the fraction (fesc) of fluorescence that escapes the canopy to the sensor. Consequently, SIFobs are affected by the spatial heterogeneity of vegetation elements within the satellite footprint. A common practice to account for these effects is to apply corrections after multiple instantaneous SIFobs have been aggregated onto a regular grid of a geographic coordinate system, which may underestimate the uncertainty from spatio-temporal mismatches. We propose that these procedures should be applied prior to spatial gridding to ensure they are done over the correct spatio-temporal supports. We hypothesize that doing so will ensure consistency within the same support of all contributing variables and reduce uncertainties arising from spatial and temporal mismatches.

Here we derive ΦF from TROPOMI observations by normalizing SIFobs with radiation and canopy features prior to  gridding. We normalize SIFobs by photosynthetically active radiation (PAR) and near-infrared reflectance of vegetation (NIRv), where NIRv serves as a proxy for canopy structure and vegetation greenness status. We explore ΦF using multi-source NIRv and PAR datasets in combination with TROPOMI SIF from three independent retrieval products. PAR is approximated using downward shortwave radiation products with multiple spatio-temporal resolutions (e.g., MSG, ERA5, TROPOMI estimation of radiance). NIRv, derived from other sources (e.g., MODIS, Sentinel-3, and Sentinel-2), is aggregated to the TROPOMI footprint and compared against the native TROPOMI  top-of-atmosphere reflectance product. To evaluate the performance of ΦF derived at the individual footprint level, we compare it against flux tower observations from the Austro-SIF dataset. Austro-SIF is a fluorescence-specific dataset that integrates both active and passive measurement approaches from multiple European sites collected over different time periods between 2018 and 2022. It combines meteorological data with photosynthetic measurements of vegetation at both leaf and canopy scales, capturing comprehensive ecosystem responses to environmental variation. Using this dataset, we further assess the cross-scale consistency and uncertainty of ΦF across ecosystems spanning diverse biomes.

How to cite: Deng, Q., Pabon Moreno, D., Zhang, Z., Wohlfahrt, G., and Duveiller, G.: Extracting fluorescence efficiency from TROPOMI satellite observations: is it better to work on individual observations before gridding into data cubes?, EGU General Assembly 2026, Vienna, Austria, 3–8 May 2026, EGU26-18352, https://doi.org/10.5194/egusphere-egu26-18352, 2026.

EGU26-18437 | Orals | BG9.1

Understanding spatial variations in tree water stress across species and hillslope gradients  

Yousra El-Mejjaouy, Koen Hufkens, Lorenz Walthert, and Benjamin David Stocker

Understanding the spatial variability of tree water stress in complex terrain remains challenging due to strong heterogeneity in subsurface hydrology, plant water availability, and species-specific physiological responses. Along hillslopes, topographic gradients influence soil moisture redistribution, while tree species differ in their hydraulic regulation strategies and sensitivity to drought. Although field-based measurements provide detailed insights into individual-tree water relations, scaling these observations to heterogeneous landscapes remains limited. 

In this study, we investigate how hillslope position, associated with spatial heterogeneity in water stress exposure driven by slope and soil depth,  and species identity, modulate tree water stress across two forested sites in Valais, Switzerland: Saillon and Lens. Saillon is a mixed Quercus robur-Fagus sylvatica forested hillslope ranging from 645 to 1110 m a.s.l., with study trees located between 830 and 960 m a.s.l. Along this hillslope, soil depth varies strongly, with deep loess deposits upslope and shallower soils downslope, providing pronounced spatial heterogeneity in water stress exposure. The Lens site is a Pinus sylvestris-dominated forest with a south-facing hillslope ranging from 1057-1197 m.a.s.l. Tree water deficit was monitored using stem dendrometers installed on individual trees (7 oak, 8 beech, and 2 representative pine trees), complemented by in situ measurements of soil water potential and meteorological variables. To capture spatial and temporal variability in canopy conditions and link point-scale physiological measurements to landscape-scale patterns, unmanned aerial vehicles (UAV)-based multispectral and thermal imagery were acquired repeatedly over two consecutive growing seasons (2024 and 2025).

Preliminary analyses from the 2024 season indicate clear spatial and temporal patterns in tree water status across species and hillslope positions at the Saillon site, with downslope trees generally exhibiting higher water deficit and reduced canopy greenness compared to upslope trees, particularly during mid to late summer, reflecting the site-specific soil depth gradient, with shallower soils downslope and deeper loess deposits upslope. Relationships among UAV-derived spectral and thermal metrics, tree water deficit, and soil water potential were examined across species and hillslope positions. This integrated, multi-scale observational framework aims to improve the interpretation and spatial scaling of plant water stress across heterogeneous landscapes and complex terrain.

How to cite: El-Mejjaouy, Y., Hufkens, K., Walthert, L., and Stocker, B. D.: Understanding spatial variations in tree water stress across species and hillslope gradients , EGU General Assembly 2026, Vienna, Austria, 3–8 May 2026, EGU26-18437, https://doi.org/10.5194/egusphere-egu26-18437, 2026.

Tropical forests provide vital ecological, economic, cultural and climate-regulating services to local and global communities. However, these ecosystems are threatened by deforestation, often driven by complex and region-specific factors. Numerous studies have been conducted to predict the spatial distribution of deforestation risk, yet little research has explored the possible advantages of predicting deforestation intensity patterns. To support more effective forest management and conservation planning, this study examines the use of deep learning for predicting the spatial patterns of deforestation intensity.

This research develops and evaluates a regression-based ResUNet architecture for predicting deforestation intensity patterns. 
The deforestation datasets are, in most cases, highly skewed and zero-dominated, which poses the first challenge since this can significantly affect the predictive performance of the regression model. Several loss functions have been evaluated to mitigate this effect. The results illustrate how the Tweedie loss performs best. Furthermore, with a Root Mean Squared Error (RMSE) of 0.00494 on all values and 0.0169 on non-zero values, the Tweedie ResUnet model consistently outperforms the baseline XGBoost regression model. 

To test the model's cross-regional generalizability, four tropical regions were selected, each located on a different continent and characterised by varying deforestation drivers and dynamics. The Tweedie-ResUNet architecture was trained and tested on each study area. The differences in performance could be explained by regional characteristics such as data quality, topography, and seasonal cloud cover. However, the results still demonstrate a strong potential for the model's applicability to other tropical regions. 

The overall findings of this study suggest that deep learning models can be utilised to offer valuable insight into spatial patterns of deforestation intensity. 

How to cite: Sillem, K. and Cue la rosa, L.: Beyond Risk: Predicting Tropical Deforestation Intensity Patterns with Regression-Based Fully Convolutional Neural Networks, EGU General Assembly 2026, Vienna, Austria, 3–8 May 2026, EGU26-18862, https://doi.org/10.5194/egusphere-egu26-18862, 2026.

EGU26-19219 | ECS | Posters on site | BG9.1

Do Earth Observation Essential Climate Variables (ECVs) provide a consistent picture of land surface dynamics? Insights from a multi-variable analysis over the Mediterranean region 

Pierre Laluet, Chiara Corbari, Christian Massari, Luca Ciabatta, Odunayo David Adeniyi, Mohsin Tariq, Daniele Oxoli, Maria Antonia Brovelli, Andreas Wappis, Sophie Hebden, and Wouter Dorigo

Multi-variable analyses combining several Earth Observation (EO) Essential Climate Variables (ECVs) are increasingly used to investigate biosphere-land surface interactions under climate variability and anthropogenic pressure, including drought dynamics, vegetation responses, irrigation and land management practices, and land-atmosphere exchanges. By integrating optical, thermal, and microwave EO observations, large interdisciplinary initiatives such as the ESA Agricultural Land Abandonment and Climate Change (GLANCE) project aim to characterise coupled biosphere-hydrosphere processes at regional scales. These applications implicitly assume that EO-based ECVs provide a consistent and physically meaningful representation of the Earth system when jointly analysed. However, this assumption has rarely been evaluated explicitly.

Here, we present a systematic multi-annual (approximately two decades) cross-variable consistency analysis of key ESA Climate Change Initiative (CCI) ECVs over the Mediterranean region, conducted in the framework of the GLANCE project. The analysis focuses on soil moisture, precipitation, land surface temperature, vegetation parameters, biomass, and land cover, spanning multiple components of the biosphere-soil-water-atmosphere continuum.

We first assess each ECV by analysing its spatial patterns, seasonal and interannual variability, associated uncertainty, and response to drought events, and by comparing CCI products with external reference datasets. This single-variable assessment reveals substantial differences in some cases between CCI and non-CCI products, with particularly pronounced discrepancies for land cover. Building on this assessment, we investigate cross-variable consistency by jointly analysing the different CCI ECVs, focusing on the spatial correspondence of long-term mean patterns, correlations of temporal anomalies, and joint responses during drought conditions. Precipitation, land surface temperature, vegetation parameters, and soil moisture generally exhibit consistent behaviour, although sometimes with pronounced spatial and/or temporal differences, while biomass and land cover show substantially lower cross-variable consistency.

By explicitly evaluating the consistency of EO-based ECVs across biosphere-relevant variables, this work demonstrates that multi-variable EO analyses cannot assume coherence a priori. The results provide critical guidance for the interpretation and integration of multi-sensor EO datasets in biosphere and land surface studies, and help identify strengths and limitations of individual ECV products for Earth system research.

How to cite: Laluet, P., Corbari, C., Massari, C., Ciabatta, L., Adeniyi, O. D., Tariq, M., Oxoli, D., Brovelli, M. A., Wappis, A., Hebden, S., and Dorigo, W.: Do Earth Observation Essential Climate Variables (ECVs) provide a consistent picture of land surface dynamics? Insights from a multi-variable analysis over the Mediterranean region, EGU General Assembly 2026, Vienna, Austria, 3–8 May 2026, EGU26-19219, https://doi.org/10.5194/egusphere-egu26-19219, 2026.

EGU26-19603 | ECS | Orals | BG9.1

Constraining forest dynamics in LPJ-GUESS through data assimilation of forest inventory data using LAVENDAR 

Wenquan Dong, Mengyuan Mu, Stefan Olin, Mats Lindeskog, Haoming Zhong, and Thomas Pugh

The world’s forests take up ca. 30% of anthropogenic carbon emissions. However, despite the huge importance of this sink, we lack any direct method to measure it at large scales. All routes to estimate the forest carbon sink involve modelling of some kind. Dynamic vegetation models have been widely used in such estimations. These models, especially when they consider forest demography, have a clear advantage in providing a fully self-consistent digital representation of the forest, allowing all fluxes and stocks to be interrogated and drivers to be directly diagnosed. However, they also suffer from biases due to missing or simplified process representations or the use of coarse-scale or global parameters, which fail to capture the local-scale heterogeneity. These biases are particularly marked when it comes to the rates of tree growth and mortality, which are central to the forest carbon sink. Forest Inventory data offer a unique opportunity to constrain these parameters, as they provide repeated, spatially extensive observations of forest structure, growth and mortality across large regions. Here we present an approach to use forest inventory data to bias correct dynamic vegetation model simulations, to generate a hybrid product which combines the advantages of both methods.

The proposed framework uses multi-census forest inventory data to refine the performance of the latest version of the LPJ-GUESS dynamic vegetation model across temporal scales. Firstly, LPJ-GUESS employs a newly developed state initialisation method to initialise the simulated forest stands with the observed forest structures from the earliest available forest inventory census. Secondly, we integrate the Land Variational Ensemble Data Assimilation Framework (LAVENDAR) with LPJ-GUESS to assimilate observed growth rates and mortality, thereby calibrating two sets of model parameters that constrain the growth and mortality processes of the model. Specifically, we adopt a two-stage assimilation approach that not only maximises the utilisation of forest inventory data to reduce overall model bias, but also better captures temporal forest dynamics.

We apply this framework to repeated forest inventory data from Sweden and evaluate its impact on simulated forest growth and mortality. The results show that this framework improves the agreement between simulated and observed growth increments and mortality rates, while also enhancing the temporal responsiveness of the model to interannual variability. Compared to the original LPJ-GUESS configuration, the proposed framework enables a regionally and temporally adaptive parameterisation, leading to more realistic calculations of forest dynamics and carbon fluxes.

This study demonstrates the potential of combining repeated forest inventory data with advanced data assimilation techniques to provide assessments of forest carbon dynamics. The proposed two-stage framework is generic and can be extended to other regions and inventory systems, as well as integrated with complementary information from remote sensing, offering a promising pathway towards data-constrained, temporally adaptive and rapidly updatable assessments of forest carbon dynamics across large scales.

How to cite: Dong, W., Mu, M., Olin, S., Lindeskog, M., Zhong, H., and Pugh, T.: Constraining forest dynamics in LPJ-GUESS through data assimilation of forest inventory data using LAVENDAR, EGU General Assembly 2026, Vienna, Austria, 3–8 May 2026, EGU26-19603, https://doi.org/10.5194/egusphere-egu26-19603, 2026.

EGU26-19907 | ECS | Orals | BG9.1

Assessing vegetation seasonality in Tropical Dry Forests: Multi-site comparison of MODIS NDVI and CHIRPS Precipitation Time Series. 

Liam Loizeau-Woollgar, Samuel Corgne, Daniel Villavicencio, Pedro Mutti, Julie Betbeder, and Damien Arvor

Tropical Dry Forests (TDFs) exhibit strong couplings between precipitation and vegetation phenology. TDFs are broadly defined as ecological formations characterized by -but not limited to- the presence of deciduous tree species, occurring in tropical regions where precipitation is highly seasonal, with a distinct dry season lasting several consecutive months (Miles et al., 2006), and mean annual rainfall ranging from 250 to 2000 mm (Murphy, 1986; Holdridge, 1969). This broad definition covers multiple bioclimatic types depending on authors, ranging from woodland savannah to moist semi-deciduous forests. A final agreement on their extent and definition may remain unattainable (Murphy, 1986; Blasco, 2000), and areas locally recognized as TDFs sometimes defy the most commonly used thresholds (Pando-Ocon, 2021).

TDFs provide numerous critical ecosystem services including carbon sequestration, support for local livelihoods, maintenance of biodiversity through habitat provision, high levels of floristic endemism, and a buffering effect against desertification (Siyum, 2020; Mendes, 2025). Despite these vital services, TDFs have been described as one of the most threatened biomes worldwide, experiencing extensive loss, fragmentation, and degradation driven by agricultural conversion, fire, and other anthropic pressures, with less than one-third of original forest area remaining (Stan et al., 2024). However, these valuable ecosystems have long suffered from a lack of public interest and from limited attention in conservation policies and research (Santos et al., 2011).

In this context, our study aims to assess and compare the dynamics of vegetation phenology, precipitation and their relationships across multiple TDF hotspots: Santa Rosa national park (Costa Rica), the Caatinga ecoregion (Brazil), Bandipur and Mudumalai national parks (Southwestern Ghats, India), and the Chizarira and Sijarira national parks within the Miombo and Mopane woodlands (Zimbabwe). These sites collectively span more or less pronounced gradients in rainfall seasonality, topography, edaphic conditions, tree density and forest composition. Using two decades (2003-2023) of MODIS NDVI time-series and CHIRPS precipitation data, we investigate inter and intra-site variability based on the visual interpretation of weekly mean NDVI and precipitation time-series over multiple points along a rainfall gradient, and compare metrics characterizing both phenological dynamics (amplitude of the vegetation index time-series and temporal phenometrics) and rainfall regimes (precipitation values and temporality of the rainy season). Additionally, we cross both times-series to assess their relationship (lag time between rainy season onset and vegetation response).

Other drivers of phenology are mentioned as TDF definitions are not limited by the presence of deciduous vegetation, and phenological dynamics in these systems may be impacted by other factors such as access to groundwater or atmospheric moisture, floristic composition and stand age (Hasselquist et al., 2010; Cuba et al., 2017; Siyum, 2020; Parthasarathy et al., 2008).

Overall, understanding and spatializing the links between phenology, environmental drivers and the associated plant functional traits in TDFs has important implications for the assessment of carbon flux and storage, the projection of ecosystem resilience and redistribution under climate change as well as accurate description of land-cover, ecotones and habitat connectivity (Li et al., 2024; Pereira Dos Santos et al., 2025; Ribeiro et al., 2025).

How to cite: Loizeau-Woollgar, L., Corgne, S., Villavicencio, D., Mutti, P., Betbeder, J., and Arvor, D.: Assessing vegetation seasonality in Tropical Dry Forests: Multi-site comparison of MODIS NDVI and CHIRPS Precipitation Time Series., EGU General Assembly 2026, Vienna, Austria, 3–8 May 2026, EGU26-19907, https://doi.org/10.5194/egusphere-egu26-19907, 2026.

EGU26-20694 | Posters on site | BG9.1

Development, validation, and application of a land surface reflectance and albedo dataset derived from Himawari-8/9 

Kazuhito Ichii, Wei Li, Yuhei Yamamoto, Wei Yang, Taiga Sasagawa, Beichen Zhang, and Misaki Hase

Geostationary meteorological satellites such as Himawari-8/9 provide unprecedented high-frequency observations that enable detailed monitoring of land surface reflectance and albedo, which are key variables for terrestrial ecosystem and surface energy/carbon cycle studies. In this study, we will introduce our current status of development, validation, and application of land surface reflectance and albedo dataset derived from Himawari-8/9 observations. Surface reflectance was estimated from Himawari-8/9 measurements using the publicly available 6SV radiative transfer model and evaluated across low-mid-high latitudes using MODIS data. Surface albedo was derived using a standard broadband albedo algorithm, and its performance was assessed using a large number of validation sites distributed across full-disk spatial domains. The results demonstrate stable and physically consistent retrievals over diverse land cover and atmospheric conditions. We further present several application examples using the established datasets, including monitoring of vegetation dynamics in tropical rainforests, phenology monitoring as the detection of leaf flushing and senescence, and the detection of rapid albedo changes associated with anthropogenic disturbances in cropland areas. These examples highlight the advantages of geostationary satellite observations for capturing diurnal to sub-seasonal variability in land surface properties. The presented datasets provide a valuable foundation for advancing studies of terrestrial ecosystem processes, land–atmosphere interactions, and surface energy and carbon exchanges using geostationary satellite observations.

How to cite: Ichii, K., Li, W., Yamamoto, Y., Yang, W., Sasagawa, T., Zhang, B., and Hase, M.: Development, validation, and application of a land surface reflectance and albedo dataset derived from Himawari-8/9, EGU General Assembly 2026, Vienna, Austria, 3–8 May 2026, EGU26-20694, https://doi.org/10.5194/egusphere-egu26-20694, 2026.

EGU26-21075 | ECS | Posters on site | BG9.1

Tracking phase-specific vegetation responses to extreme climate anomalies in Tropical Asia using Himawari-8/9 AHI 

Misaki Hase, Xiangzhong Luo, and Kazuhito Ichii

Tropical Asia is influenced by large-scale climate modes, notably the El Niño-Southern Oscillation (ENSO) and the Indian Ocean Dipole (IOD), yet their impacts on vegetation in tropical Asia remain uncertain. A key challenge is the scarcity of clear-sky observations from satellites in this persistently cloudy region. The Advanced Himawari Imager (AHI) onboard Himawari-8/9 geostationary satellites provides observations every 10 minutes, substantially increasing clear-sky samplings and enabling more robust monitoring of vegetation responses to climate anomalies. Here, we focus on two recent large climate anomalies, the positive IOD (pIOD) event in 2019 and the compound pIOD and El Niño event in 2023/24, to characterize how vegetation responses evolve within events.

Based on ENSO and IOD indices, we defined the event periods as May 2019–November 2019 for the 2019 pIOD event, and April 2023–March 2024 for the 2023/24 compound pIOD and El Niño event. We used the two-band Enhanced Vegetation Index (EVI2) derived from Himawari-8/9 AHI surface reflectance (Li et al., 2025; Zhang et al., 2025) for 2016–2024, and monthly climate variables (i.e., shortwave radiation (SWR) and vapor pressure deficit (VPD)) over the same period. Monthly anomalies were computed relative to the 2016–2024 average. To capture intra-event evolution, we further assessed anomalies by sub-seasonal phases within each event.

We found that the anomalies in EVI2 showed clear phase-dependent responses during these events. For example, EVI2 decreased over continental Southeast Asia in phase 1 (April–June 2023) of the 2023/24 compound pIOD and El Niño, but increased in the same region in phase 3 (September–December 2023). These changes in EVI2 were consistently associated with a trade-off between atmospheric dryness (higher VPD) and enhanced light availability (higher SWR). Our results highlight that vegetation dynamics during extreme climate anomalies are strongly modulated by phase-specific light-dryness regimes, while the causal impact is unclear when examining these pIOD and El Niño events as a whole.

How to cite: Hase, M., Luo, X., and Ichii, K.: Tracking phase-specific vegetation responses to extreme climate anomalies in Tropical Asia using Himawari-8/9 AHI, EGU General Assembly 2026, Vienna, Austria, 3–8 May 2026, EGU26-21075, https://doi.org/10.5194/egusphere-egu26-21075, 2026.

EGU26-21288 | ECS | Posters on site | BG9.1

How Does Topography Affect Land-Surface Observations from Geostationary Satellites? 

Taiga Sasagawa, Kazuhito Ichii, Hiroki Yoshioka, Masayuki Matsuoka, Tomoaki Miura, Yuhei Yamamoto, and Wei Yang

In recent years, Earth observation using geostationary satellites has experienced remarkable development. In particular, third-generation geostationary satellites, beginning with Japan’s Himawari-8, have enabled sub-hourly measurements of the Earth. Following Himawari-8, the U.S. GOES-R series, China’s FY-4A, Korea’s GK-2A, and Europe’s MTG-1 have successively begun observations, making it possible to observe nearly the entire globe at sub-hourly temporal resolution. Along with these advances, research targeting terrestrial ecosystems such as forests, grasslands, and croplands has rapidly expanded beyond traditional meteorological applications. However, current studies on land-surface ecosystem observation with geostationary satellites still overlook an important but critical issue: topographic effects arising from the relatively large viewing angles of geostationary satellites compared with polar-orbiting satellites. As the distance from the satellite sub-satellite point increases, discrepancies grow between the latitude and longitude coordinates on the reference ellipsoid to which geostationary satellite data are projected and the actual geographic coordinates of the land surface. In addition, topographic features such as high mountains create invisible areas that are partially or entirely invisible to geostationary satellites. Despite these effects, few studies have considered topographic effects when comparing with in situ observations or polar-orbiting satellite data. In this study, we address this issue by using high-resolution digital surface model (DSM) data that are sufficiently detailed to represent sub-pixel topographic variability within individual geostationary satellite pixels. Specifically, we simulated topographic effects on geostationary satellite observations using a 30 m resolution DSM provided by the Japan Aerospace Exploration Agency (JAXA). Our results show that, due to topographic effects, the correspondence between ellipsoidal latitude–longitude coordinates and actual surface coordinates can be shifted by more than one pixel in some regions. We further confirmed that this spatial mismatch leads to differences in the seasonal variation patterns of vegetation indices. In addition, when attempting ray-matching with polar-orbiting satellite observations, we found significant differences between geostationary and polar-orbiting satellite data when topographic effects were not considered. These findings demonstrate that accounting for topographic effects is essential for accurate land-surface observation using geostationary satellites. Our results provide valuable guidance for future studies that aim to compare geostationary satellite data with in-situ observations or to perform data fusion with polar-orbiting satellites, and they will contribute to achieving more precise and reliable land-surface monitoring.

How to cite: Sasagawa, T., Ichii, K., Yoshioka, H., Matsuoka, M., Miura, T., Yamamoto, Y., and Yang, W.: How Does Topography Affect Land-Surface Observations from Geostationary Satellites?, EGU General Assembly 2026, Vienna, Austria, 3–8 May 2026, EGU26-21288, https://doi.org/10.5194/egusphere-egu26-21288, 2026.

Heterogeneous Mediterranean ecosystems are landscapes with scattered trees dispersed throughout a grassy matrix, and long-time series of land surface temperature (LST) images with high spatial and high temporal resolutions are needed to model their dynamics of the vegetation. Data assimilation systems have been developed for guiding the model with observations towards optimal solutions, and can be useful in the case of operational prediction approaches for reducing the uncertain model parameterization. For operational data assimilation approaches in heterogenous ecosystems there is the need of long-time series of LST images with high spatial and high temporal resolutions.  This is currently difficult because of the spatial-temporal trade-off associated with satellite-based observations of LST, and there is a need of obtaining long time series of high-spatial and high-temporal resolution thermal data. This prompted us to propose a novel downscaling procedure that used MOD11A1 and MYD11A1 (~1000 m spatial resolution) as source data, and a coarse (~ 1000 m) and a fine (~30 m) annual estimation of the NDVI as ancillary. The approach, tested in a ecosystem in Sardinia (Italy), supplied by an eddy-covariance station, led to the creation of ~7700 maps of LST (30 m) covering the years 2000-2022. A first validation was done by comparing 19 years of ground-based data with the LST estimates from satellites, while the second validation was performed spatially by comparing MODIS downscaled maps with ASTER (90 m) and LANDSAT (100 m) scenes. The approach was able to reduce the spatial scale of MODIS LST observations by maintaining their original time frequency. The use of the LST observations from MODIS using the downscaling approach allowed merging the LST data from remote sensors and the LSM optimally for predicting accurately grass and tree LST in the assimilation approach. A sensitivity analysis of the data assimilation approach to assimilation time interval demonstrated that the use of the MODIS time interval of acquisition (i.e., ~12 hours) allowed to obtain accurate results.

How to cite: Montaldo, N. and Sirigu, S.: The Estimate of Land Surface Temperature Components for Soil and Vegetation Using the MODIS Dataset and an Ensemble Kalman Filter – Based Assimilation Approach in a Heterogeneous Mediterranean Ecosystem, EGU General Assembly 2026, Vienna, Austria, 3–8 May 2026, EGU26-21289, https://doi.org/10.5194/egusphere-egu26-21289, 2026.

EGU26-21978 | ECS | Posters on site | BG9.1 | Highlight

Land-Cover Changes effects on Water-Carbon fluxes in a Colombian Amazonian basin 

Andres Garcia Salazar, David Zamora Avila, and Luis Carlos Belalcazar

Extractivism driven by licit and illicit economic activities has generated negative effects on natural land-covers and biodiversity, increasing ecosystem vulnerability as a consequence of local hydroclimatic fluxes alterations, as well as those transcending geographic boundaries. One of the main current drivers is deforestation, which in tropical regions has altered ecosystem carbon storage capacity, however, it's relationship with local hydroclimatic alterations has been poorly addressed. This study evaluates the relationship between land-cover changes and hydroclimatic dynamics through the analysis of actual [AET] and potential [PET] evapotranspiration, precipitation [P], and runoff [R], as well as their implications for terrestrial carbon uptake in the Upper Putumayo river basin, located in Colombia within the Amazon region and in an ecosystem convergence zone with the Andean region.  The analysis covers the 2000–2022 period and is based on remote sensing tools and in situ data under the Budyko framework, assessing water deficit in relation to biomass production in remaining forest ecosystems. Results show that deforested areas exhibit increased runoff, associated with reduced vegetation interception and greater exposure of bare soils, leading into diminished hydrological regulation capacity. Additionally, the basin maintains low evaporative ratios (AET/P = 0.346) despite a decrease in the aridity index (ΔPET/P = −0.023), evidencing an ecohydrological decoupling, which can be attributed to vegetation control loss. These changes reflect an increase in effective water deficit and coincide with reduced primary productivity [GPP and NPP], suggesting forest's lower capacity for terrestrial carbon sequestration.

How to cite: Garcia Salazar, A., Zamora Avila, D., and Belalcazar, L. C.: Land-Cover Changes effects on Water-Carbon fluxes in a Colombian Amazonian basin, EGU General Assembly 2026, Vienna, Austria, 3–8 May 2026, EGU26-21978, https://doi.org/10.5194/egusphere-egu26-21978, 2026.

EGU26-50 | Orals | BG9.4

Spatiotemporal Dynamics and Drivers of Forest Cover Changes in Bangladesh 

Kazi Ullah and Varun Tiwari

Bangladesh’s forests are vital for maintaining biodiversity, supporting rural livelihoods, and contributing to climate resilience. However, they face growing challenges from agricultural expansion, population pressure, infrastructure development, and climate-induced hazards. While several reforestation and community afforestation programs have been initiated, the overall trend, spatial variability, and underlying drivers of forest cover change remain insufficiently understood. This study integrates remote sensing, machine learning, and socioeconomic analysis to examine the dynamics and determinants of forest land change across Bangladesh over a 19-year period (2000–2018).

The study employs Landsat time-series imagery processed in Google Earth Engine. Random Forest classification generates annual land cover maps, followed by least-square trend modeling to detect forest growth rates. Hotspot and zonal statistical analyses will identify regions of significant change. Expert interviews, literature review, and secondary datasets will be used to examine drivers such as population pressure, shifting cultivation, community forestry programs, governance challenges, and climatic influences.

Preliminary results show that the total forest area in Bangladesh increased at an average annual rate of 0.78% (approximately 25,932 hectares per year) between 2000 and 2018. However, this growth is spatially uneven. The study will provide a comprehensive understanding of how forests in Bangladesh are changing across different forest types and vital project areas for forest development, such as community afforestation and coastal greenbelt projects, several reserved forests, including the Chittagong Hill Tracts and parts of the Sundarbans; and what factors are driving these dynamics. Findings will inform national forest management, policy development, and sustainable land-use planning.

How to cite: Ullah, K. and Tiwari, V.: Spatiotemporal Dynamics and Drivers of Forest Cover Changes in Bangladesh, EGU General Assembly 2026, Vienna, Austria, 3–8 May 2026, EGU26-50, https://doi.org/10.5194/egusphere-egu26-50, 2026.

EGU26-283 | ECS | Orals | BG9.4

Characterizing the impact of non-stand replacing disturbances on LiDAR based forest structure using a Harmonized Landsat-Sentinel-2 time-series 

Madison Brown, Nicholas Coops, Christopher Mulverhill, and Alexis Achim

Non-stand replacing disturbances (NSRs) are events that do not result in complete removal of forest stands and generally occur at a low intensity over an extended period (e.g., insect infestation), or at spatially variable intensities over shorter periods (e.g., windthrow). Forest structural change associated with NSRs can impact both timber supply and ecosystem services, necessitating the need for both detection of NSRs and characterization of their impact.  The increased accessibility of high frequency revisit, medium spatial resolution satellite imagery, has led to a subsequent increase in algorithms designed to detect sub-annual change across broad spatial scales. The Bayesian Estimator of Abrupt change, Seasonal change, and Trend (BEAST) has shown promise in both detecting NSRs on a sub-annual basis and estimating forest structure changes indicating the potential for continuous characterization of NSRs. This study assesses the impact of NSRs on forest structure across a dry interior forest in Western Canada with a specific case study on aspen leafminer (Phyllocnistis populiella) and two-year budworm (Choristoneura biennis). To do so, the BEAST algorithm was applied to a time-series of medium resolution optical satellite imagery for six disturbance-sensitive indices for the time period 2013-2021 to generate predictor variables capturing annual phenological variation (i.e., amplitude, slope, and trend). Three LiDAR derived forest attributes were modeled (i.e., canopy cover, height and height variability) using predictors variables as inputs (R2 values between 0.5 - 0.7).  These models were then applied across the study areas, and changes in structure estimated over NSR impacted stands. Results showed changes in forest structure over the period of continued NSR events, including an 11% decline in canopy cover. This approach enables the structural change caused by NSRs to be more rapidly identified, providing forest practitioners with approaches to better identify areas in need of intervention.

How to cite: Brown, M., Coops, N., Mulverhill, C., and Achim, A.: Characterizing the impact of non-stand replacing disturbances on LiDAR based forest structure using a Harmonized Landsat-Sentinel-2 time-series, EGU General Assembly 2026, Vienna, Austria, 3–8 May 2026, EGU26-283, https://doi.org/10.5194/egusphere-egu26-283, 2026.

EGU26-289 | ECS | Orals | BG9.4

Optimizing remote sensing workflows using machine learning techniques to quantify windthrow severity across Australian temperate forest. 

Anuj Singh, Lauren Bennett, Nina Hinko-Najera, and Tom Fairman

Windthrow events, characterized by tree uprooting or breakage by strong winds, can result in substantial structural change and biomass loss, altering biodiversity and carbon dynamics. They have led to severe disturbance of native forests in temperate Australia in recent years, and yet their extent and impacts remain largely unquantified. This study aims to advance the monitoring and understanding of windthrow dynamics by integrating remote sensing technologies, machine learning, and field-based data to quantify windthrow severity and associated impacts on the structure of native eucalypt-dominated forests. As a case-study example, it focuses on a major storm event on 9 June 2021 that affected an estimated 40,000 ha of the Wombat State Forest in Victoria, southeastern Australia. The study employs high to very-high resolution satellite and aerial imagery [PlanetScope (3m), NearMap (7.5cm)] and derived indices (Normalized Difference Vegetation Index, NDVI; Blue Normalized Difference Vegetation Index, BNDVI) to nominally map None, Low, Medium, and High severity windthrow zones. These zones were used in stratified random sampling to select 650 (30m×30m) plots in the NearMap imagery, which were analyzed for change in canopy cover using a machine learning workflow involving a Random Forest model. The workflow provided canopy cover reduction estimates from pre- to post-event scenario with high accuracy (96.9%), precision (92.5%), recall (92.8%,) and F1-score (92.68%) across plots in high windthrow severity locations (260) initially and significantly reduced the amount of time and labour for this task. Building on these canopy-level estimates, the final stage will upscale damage quantification across the entire Wombat State Forest by training PlanetScope imagery with very-high resolution canopy cover estimates data from NearMap while employing machine learning models integrating spectral predictors (including dNDVI, dBNDVI, and key multispectral bands). This will produce a high-resolution windthrow severity map, enabling an accurate assessment of windthrow severity across the large and heterogeneous landscape. These outputs will enable biomass-loss estimation from canopy and tree-fall metrics, and will support risk models that integrate remote sensing, biophysical variables, and climate data to predict windthrow susceptibility across the landscape of Australian temperate forests.

How to cite: Singh, A., Bennett, L., Hinko-Najera, N., and Fairman, T.: Optimizing remote sensing workflows using machine learning techniques to quantify windthrow severity across Australian temperate forest., EGU General Assembly 2026, Vienna, Austria, 3–8 May 2026, EGU26-289, https://doi.org/10.5194/egusphere-egu26-289, 2026.

Monitoring forest disturbances is essential for sustainable forest management. Remote sensing provides a powerful tool to detect and quantify such disturbances across large spatial and temporal scales, but separating different types of disturbances, such as wind-throw and insects, remains a challenge. In this study, we investigate how different types of information — spatial, spectral, and temporal — contribute to accurate classification of wind, bark-beetle and defoliator insect disturbances using modern machine learning (ML) and deep learning (DL) models. We rely on a comprehensive multimodal dataset based on multi-temporal optical, radar, and forest inventory data to evaluate several different ML/DL approaches for distinguishing between three disturbance agents.

A central focus of this work is to assess which dimensions of the data — spatial structure, spectral information, or temporal dynamics — are most informative for reliable classification.

Preliminary results suggest that (1) temporal information is highly important when combined with time-series–based deep learning architectures, which effectively capture disturbance trajectories and achieve F1-scores above 0.90 for wind and bark beetle disturbances; (2) spectral features alone achieve F1-scores of up to 0.86 when used with a multilayer perceptron (MLP), with SWIR bands and Sentinel-1 backscatter playing a key role in distinguishing disturbance agents; and (3) the combination of temporal and spectral information through multispectral temporal learning yields an overall F1-score of up to 0.95.

This work highlights the importance of carefully selecting appropriate data formats and choosing models that can effectively leverage the available information. We discuss methodological challenges, data limitations, and the potential of time-series–based deep learning approaches to improve forest disturbance monitoring across diverse forest types and disturbance regimes.

How to cite: Müller, F., Bastos, A., and Camps-Valls, G.: Balancing Spatial, Spectral, and Temporal Information: Which Dimension Drives Deep Learning Performance in Forest Disturbance Classification?, EGU General Assembly 2026, Vienna, Austria, 3–8 May 2026, EGU26-1823, https://doi.org/10.5194/egusphere-egu26-1823, 2026.

EGU26-2083 | ECS | Orals | BG9.4

Structural Forest Disturbances Revealed by LiDAR: Limits of Landsat Detection 

Xihui Yang and Tommaso Jucker

Understanding when and where satellite disturbance products miss forest change is critical for reliable large-scale monitoring. Landsat-based products such as the National Land Cover Database (NLCD) provide long-term coverage, but their disturbance signals are primarily driven by spectral change and can fail to capture canopy structural losses, especially when changes are subtle, fragmented, or occur in short/transitional vegetation. Here we use airborne LiDAR canopy height models (CHMs) from 32 NEON sites across the continent of United States as an independent structural benchmark to quantify Landsat detection limits.

We compared multi-year LiDAR-derived canopy height change with temporally matched NLCD disturbance layers. From CHMs we derived pre-disturbance canopy height, canopy-height loss (severity), and patch size. We quantified Landsat recall at pixel scale, and evaluated how recall varies with height, severity, forest type, and disturbance patch size.

LiDAR revealed systematic detection biases in Landsat disturbance detection. Recall increased with canopy height and remained low for low-to-moderate structural losses, rising sharply only for the most severe canopy-height reductions. At the patch scale, detection fraction increased with disturbance size: small patches were rarely detected, whereas larger patches showed substantially higher detection. Detection agreement varied across forest types and was weakest in open-canopy woodlands and transitional vegetation. In conclusion, Landsat disturbance products preferentially capture large, high-severity canopy-loss events while frequently omitting smaller and lower-severity structural changes evident in LiDAR.

How to cite: Yang, X. and Jucker, T.: Structural Forest Disturbances Revealed by LiDAR: Limits of Landsat Detection, EGU General Assembly 2026, Vienna, Austria, 3–8 May 2026, EGU26-2083, https://doi.org/10.5194/egusphere-egu26-2083, 2026.

EGU26-2555 | ECS | Orals | BG9.4

Tree Cover, Forest Definitions, and Trees Outside Forests: A National Assessment of China 

Xuexin Wei, Ronggao Liu, Yang Liu, and Quan Duan

Forests play a pivotal role in carbon sequestration, biodiversity conservation, and climate change mitigation, making accurate and comparable forest monitoring essential for global change research and climate policy. However, forest area estimates remain highly uncertain due to substantial inconsistencies among widely used definitions, including those adopted by FAO FRA, UNFCCC, and national forest inventories. Moreover, conventional forest assessments predominantly focus on closed forests, systematically neglecting Trees Outside Forests (TOF), such as scattered or linear trees embedded in agricultural and urban landscapes. This omission limits our understanding of national tree resources and introduces biases in carbon accounting.

Recent advances in high-resolution remote sensing provide new opportunities to overcome these limitations. In this study, we leverage the 1-m resolution Global Canopy Height Model (GCHM) to conduct a national-scale, definition-consistent assessment of tree cover across China, explicitly incorporating TOF. Tree cover was derived by aggregating 1-m canopy height data to 10-m resolution, enabling the detection of both continuous forests and sparse individual trees. Forest distributions were extracted under three commonly used definitions (FAO FRA, China’s National Forest Inventory, and UNFCCC) using definition-specific thresholds for tree cover, tree height, and minimum patch size. TOF were identified as tree-covered areas not meeting the forest definition of China’s NFI. We further analyzed the spatial distribution, structural characteristics, and landscape patterns of TOF across major land-use types, ecological zones, and geomorphological regions using landscape metrics that quantify fragmentation, connectivity, and aggregation.

Our results demonstrate that forest area estimates in China are highly sensitive to forest definitions. Forest area derived from the UNFCCC and China’s NFI definitions is comparable (148.37 and 145.79 Mha, respectively), whereas the FAO FRA definition yields a substantially lower estimate (85.72 Mha, approximately 58% of the former). Despite these differences, all definitions consistently identify Northeast China, Southwest China, and southeastern mountainous regions as core forest areas, while pronounced discrepancies emerge in fragmented landscapes of southern hills and ecological transition zones. TOF cover 49.21 Mha, accounting for 5.1% of China’s land area and 26.9% of total tree cover. TOF are dominated by low canopy cover and are widely distributed across agricultural and urban regions. In several provinces with low forest coverage, TOF contribute more than 50% of total tree cover, indicating that they constitute the dominant form of tree-based vegetation outside traditional forest areas.

By explicitly integrating TOF into a national-scale tree cover framework, this study reveals a substantial yet previously underrecognized component of China’s terrestrial carbon sink. The findings highlight the limitations of binary forest–non-forest classification systems and demonstrate the necessity of incorporating TOF into forest monitoring, land-use planning, and carbon accounting. This work provides a strengthened basis for reducing uncertainties in national carbon sink assessments and supports more effective climate mitigation strategies.

How to cite: Wei, X., Liu, R., Liu, Y., and Duan, Q.: Tree Cover, Forest Definitions, and Trees Outside Forests: A National Assessment of China, EGU General Assembly 2026, Vienna, Austria, 3–8 May 2026, EGU26-2555, https://doi.org/10.5194/egusphere-egu26-2555, 2026.

Forest structural complexity is a key control on carbon storage, ecosystem functioning, and forest resilience, but its quantification across spatial scales remain challenging, even in managed tropical systems. Commercial plantations of macaúba (Acrocomia aculeata), a native Brazilian palm with increasing relevance for the vegetable oil and bioenergy markets, represent an emerging forest-based bioeconomy whose structural development is still insufficiently described using remote sensing techniques. In this study, we evaluate an integrated remote sensing framework that combine multi-platform LiDAR data (UAV-borne and airborne), multispectral satellite imagery, and field measurements to characterize forest structure and associated carbon stocks in commercial macaúba plantations. High-density LiDAR point clouds were used to derive three-dimensional structural attributes such as canopy height, vertical complexity, and spatial heterogeneity, assessed at both individual-tree and stand scales. These LiDAR-derived metrics were then integrated with satellite time series to support spatial extrapolation and the analysis of structural development and carbon accumulation over time. Relationships between remote sensing metrics and field observations were established using machine learning approaches, enabling robust estimation of aboveground biomass and carbon stocks while maintaining sensitivity to fine-scale structural variability. At the stand scale, the integrated LiDAR–satellite approach achieved coefficients of determination above 0.70 in independent validation, with biomass estimation errors on the order of 10 t ha⁻¹. These results indicate that reliable structural and carbon assessments can be obtained without rely on single-sensor datasets. The analysis highlight the complementary contribution of different LiDAR platforms. UAV-borne LiDAR provide detailed information on canopy and sub-canopy structure at the individual-tree level, whereas airborne LiDAR allow consistent and scalable mapping at the landscape scale. In addition, LiDAR acquisition characteristics, particularly point cloud density, was found to strongly influence the robustness and transferability of structural metrics. By linking individual-level measurements with landscape-scale observations, this multi-platform LiDAR framework advances the assessment of structure and carbon dynamics in planted tropical forests, supporting applications in forest inventory, ecological modeling, and the sustainable management of commercial forest systems associated with climate mitigation and the vegetable oil bioeconomy.

How to cite: Imbuzeiro, H., Rosário, D., and Filpi, H.: From Trees to Landscapes: Integrating Multi-Platform LiDAR for Structural Assessment of Commercial Macaúba Forests and Carbon Monitoring, EGU General Assembly 2026, Vienna, Austria, 3–8 May 2026, EGU26-2632, https://doi.org/10.5194/egusphere-egu26-2632, 2026.

EGU26-3419 | ECS | Posters on site | BG9.4

When Inventories Lag Behind Forests, Updating Is Inevitable 

Temitope Olaoluwa Omoniyi, Allan Sims, Ronald E. McRoberts, Mait Lang, and Mercy Ajayi-Ebenezer

National forest inventory (NFI) data are often collected over a 5-year or 10-year period, meaning some are already outdated by the time the complete results are available. This study assesses changes in growing stock volume (GSV, m³/ha) using hybrid estimation combined with Sentinel-2 metrics. It focuses on constructing a model for estimating gain in GSV using NFI plot data for two points in time (t_1 and t_2) with remotely sensed data for both t_1 and t_2 for a bitemporal approach, and remotely sensed data only for t_2 for a unitemporal approach. A machine-learning approach based on the random forests (RF) algorithm was used to predict GSV change. The original data for t_2 and additional data for a time (t_3) were then used to evaluate the accuracy of the change prediction at the plot level, after which the predicted changes were applied to update the plot-level GSV to predict plot-level GSV at t_3, which was then validated against the observed plot-level GSV at t_3. Changes were assessed with the Mean Average Annual Volume Change (MAAVC) method representing the average annual change in GSV over a given period. The results indicate that at plot level, the bitemporal model produced GSV change estimates with low accuracy R² = 0.26, RMSE = 4.06 m³/ha and MAE = 3.26 m³/ha, while the unitemporal model, achieved R² = 0.40, RMSE = 3.64 m³/ha, and MAE = 2.65 m³/ha when predicting GSV change. Using the estimated change to project into t_3 the MAAVC based on field data yielded an R² = 0.91, RMSE = 45.11 m³/ha, while the RS unitemporal yielded R² = 0.73, RMSE = 83.79 m³/ha, and the bitemporal yielded an R² = 0.72, RMSE = 83.61 m³/ha. Model performance stability were evaluated using a Monte Carlo simulation approach with a novel stopping criterion. A linear mixed effect model showed a significant difference between methods and post-hoc pairwise comparisons were then applied to determine which groups differ significantly. Conclusively, MAAVC and spatiotemporal RS methods provide a robust framework for projecting GSV using NFI and Sentinel-2 data.

How to cite: Omoniyi, T. O., Sims, A., McRoberts, R. E., Lang, M., and Ajayi-Ebenezer, M.: When Inventories Lag Behind Forests, Updating Is Inevitable, EGU General Assembly 2026, Vienna, Austria, 3–8 May 2026, EGU26-3419, https://doi.org/10.5194/egusphere-egu26-3419, 2026.

EGU26-3906 | Orals | BG9.4

Tree-Quest: A Citizen Science App for Collecting Single-Tree Attributes 

Florian Hofhansl, Milutin Milenković, Rudi Weinacker, Tobias Sturn, Santosh Karanam, Ivelina Georgieva, Benjamin Wild, Norbert Pfeifer, Markus Hollaus, Luca Zappa, Viktor J. Bruckman, Ian Mccallum, and Steffen Fritz

Accurate quantification of single-tree structural attributes is essential for improving estimates of terrestrial carbon stocks and for supporting sustainable forest and urban tree management. While traditional forest inventory methods and advanced technologies, such as terrestrial laser scanning (TLS) provide high-quality measurements, their spatial and temporal coverage remains limited due to cost and logistical constraints. Citizen science offers an underexploited opportunity to complement expert-based data collection and enhance data availability at large scales.

We present an overview of recent advances in integrating citizen science with digital tools and remote sensing for single-tree assessment, with a particular focus on urban environments. Our contribution specifically explores the use of mobile applications, low-cost sensors, and participatory approaches to support crowdsourced identification of tree species diversity and mapping of vegetation carbon stocks in urban environments.

To this end, we developed Tree-Quest (TQ), a free citizen-science mobile application, designed to measure single-tree attributes, such as tree species (ID), tree height (TH) and stem diameter at breast height (DBH). We compiled a dataset comprising 700 measurements acquired from 30 volunteers across peri-urban landscapes located in the vicinity of Vienna. Volunteers achieved a mean absolute error (MAE) of 3 cm for DBH (R² = 0.97; rMAE = 6%) and 1.5 m for TH (R² = 0.91; rMAE = 11%), thus demonstrating comparable measurement accuracy with traditional forest inventory.

Our findings indicate the potential of citizen science to complement remote sensing estimates and forest inventory measurements, thus supporting climate adaptation strategies, and improving our understanding of tree-level carbon dynamics in urban environments, beyond traditional estimates derived from natural forest ecosystems.

How to cite: Hofhansl, F., Milenković, M., Weinacker, R., Sturn, T., Karanam, S., Georgieva, I., Wild, B., Pfeifer, N., Hollaus, M., Zappa, L., Bruckman, V. J., Mccallum, I., and Fritz, S.: Tree-Quest: A Citizen Science App for Collecting Single-Tree Attributes, EGU General Assembly 2026, Vienna, Austria, 3–8 May 2026, EGU26-3906, https://doi.org/10.5194/egusphere-egu26-3906, 2026.

EGU26-4052 | Posters on site | BG9.4

Mapping Forest Cover Using Sentinel-2 Imagery and Machine Learning Techniques 

Mohamed Chikh Essbiti, Mustapha Namous, Samira Krimissa, Abdenbi Elaloui, Said Elgoumi, Morad Dalal, Jawad Elatiq, and Mohamed Elhaou

Accurate and up-to-date forest land cover information is essential for environmental monitoring, biodiversity conservation, and sustainable land management. The increasing availability of high-resolution satellite imagery combined with advances in machine learning (ML) techniques offers new opportunities for improving forest mapping accuracy. In this study, we evaluate and compare the potential of several machine learning algorithms for Mediterranean forest land cover mapping using Sentinel-2 multispectral imagery. A comprehensive set of predictor variables was derived from Sentinel-2 data, including, textural features based on gray-level co-occurrence matrices (GLCM), and topographic variables (elevation and slope). Reference samples were generated using Google Earth Pro and used to train and test multiple ML models, including KNN, Random Forest, Gradient Tree Boost. Model performance was assessed using standard accuracy metrics, including overall accuracy, precision, F1-score. The results reveal notable differences in classification performance among the tested algorithms, highlighting the influence of model structure and feature utilization on forest mapping accuracy. Tree-based ensemble methods generally outperformed simpler classifiers, particularly in heterogeneous landscapes. The findings demonstrate the added value of integrating multi-source features and advanced machine learning approaches for reliable forest land cover mapping. This comparative analysis provides valuable insights into the strengths and limitations of different ML algorithms and supports the selection of appropriate models for large-scale forest land cover mapping using Sentinel-2 imagery.


Keywords: Forest land cover; Sentinel-2; Machine learning; Land cover classification; Textural features; GLCM; Topographic variables

How to cite: Essbiti, M. C., Namous, M., Krimissa, S., Elaloui, A., Elgoumi, S., Dalal, M., Elatiq, J., and Elhaou, M.: Mapping Forest Cover Using Sentinel-2 Imagery and Machine Learning Techniques, EGU General Assembly 2026, Vienna, Austria, 3–8 May 2026, EGU26-4052, https://doi.org/10.5194/egusphere-egu26-4052, 2026.

EGU26-4485 | ECS | Orals | BG9.4

Nationwide deadwood mapping reveals rising mountain forests vulnerability 

Luca Ferrari, Lars T. Waser, Achilleas Psomas, Clemens Mosig, Teja Kattenborn, Christian Ginzler, Verena C. Griess, and Mirela Beloiu

Forest mortality is increasing globally under climate change, making detailed, large-scale monitoring essential for understanding ecosystem responses and guiding adaptive forest management. In this study, we present the first nationwide spatio-temporal assessment of standing deadwood in Switzerland, covering the period from 2018 to 2023, based on a semantic segmentation model applied to centimeter-scale high-resolution aerial imagery. We reveal a consistent upslope concentration of standing deadwood, with highest shares occurring around mid to high elevations (~1,500 m), despite declining forest cover. Relative increases of up to 43% were observed in overlapping survey areas, following the 2018 drought. Random forest models, interpreted using SHAP analysis, identified maximum temperature anomalies and conifer dominance as the key predictors of standing deadwood. The consistent accumulation of standing deadwood at higher elevations suggests increasing vulnerability of mountain forests, with implications for carbon storage, biodiversity, and disturbance susceptibility under ongoing climate change. Our results highlight the value of high-resolution remote sensing for large-scale monitoring of forest mortality. They advance understanding of the climatic and forest compositional drivers on forest mortality and offer a reproducible and transferable framework to support assessments of spatial patterns relevant for climate-adaptive forest management.

How to cite: Ferrari, L., Waser, L. T., Psomas, A., Mosig, C., Kattenborn, T., Ginzler, C., Griess, V. C., and Beloiu, M.: Nationwide deadwood mapping reveals rising mountain forests vulnerability, EGU General Assembly 2026, Vienna, Austria, 3–8 May 2026, EGU26-4485, https://doi.org/10.5194/egusphere-egu26-4485, 2026.

EGU26-4814 | ECS | Orals | BG9.4

Toward Platform-Invariant Forest 3D Perception: A Multi-platform Synergistic Training for Forest Point Cloud Segmentation 

Jundi Jiang, Yueqian Shen, Jinhu Wang, Markus Hollaus, W. Daniel Kissling, Vagner Ferreira, and Norbert Pfeifer

Forests are critical ecosystems that sustain biodiversity conservation, carbon cycling and climate regulation. Recent advances in laser scanning technology have provided unprecedented opportunities for detailed forest inventory and monitoring. Airborne, unmanned aerial, mobile, and terrestrial laser scanning systems produce complementary 3D point clouds that capture forest structural attributes across multiple scales and viewing geometries. However, the inherent heterogeneity in data characteristics across platforms severely limits the generalizability of conventional data-driven models. Additionally, naive multi-platform data mixed-training strategies that simply combine multi-platform data often lead to negative transfer, degrading segmentation performance and hindering consistent results across different acquisition systems. To address these challenges, we propose a Multi-platform Synergistic Training (MST) paradigm, a data- and model-driven representation learning framework, which can be seamlessly integrated into both semantic (tree components segmentation) and instance (individual tree segmentation) segmentation deep learning architectures. MST explicitly captures shared structural representations of forest environments through Cross Platform Aware Tokens (CPATs) and a Context Integration Module (CIM), which together enhance transferability and stability across heterogeneous forest point clouds. Furthermore, MST employs a two-stage training strategy in which platform-invariant features are first learned from pre-training on virtual synthetic multi-platform forest datasets, followed by fine-tuning on real-world data. This design lays the foundation for robust, platform-agnostic forest scene understanding while substantially reducing reliance on large volumes of manually annotated real-world data for training. The code for the proposed representation learning framework is available at: https://github.com/jdjiang312/MST.

The effectiveness of the proposed method is evaluated on nine benchmark forest point cloud datasets covering airborne, unmanned aerial, mobile, and terrestrial acquisitions, for both semantic and instance segmentation. Cross-dataset generalization experiments demonstrate that our framework achieves robust performance across all platform datasets and consistently outperforms models trained on single-platform data. Furthermore, by pre-training MST on a virtual synthetic forest point cloud dataset and subsequently fine-tuning on real-world data, the framework attains accuracy comparable to fully supervised training for both single-tree segmentation and tree-component segmentation, while relying on only 20% of the real annotations (semantic - mIoU: fully supervised 69.42% vs. MST 69.71%, instance - F1 Score: fully supervised 88.69% vs. MST 86.96%). These results highlight MST as a promising paradigm for cross-platform forest point cloud analysis, significantly reducing labeling costs while improving robustness and scalability. The framework thus offers a practical tool to enhance forest monitoring, inventory, and ecosystem assessment.

How to cite: Jiang, J., Shen, Y., Wang, J., Hollaus, M., Kissling, W. D., Ferreira, V., and Pfeifer, N.: Toward Platform-Invariant Forest 3D Perception: A Multi-platform Synergistic Training for Forest Point Cloud Segmentation, EGU General Assembly 2026, Vienna, Austria, 3–8 May 2026, EGU26-4814, https://doi.org/10.5194/egusphere-egu26-4814, 2026.

Canopy height growth is a key determinant of the state and functioning of forest ecosystems. As traditional ground-based inventories can not exhaustively capture growth and ensure hotspots detection, mixed-source canopy height time series from multiple remote sensing platforms now enable extensive characterization of these dynamics, provided that measurement biases between sources are addressed. We proposed a transferable workflow to map spatially explicit patterns of vertical growth across forested landscapes. By leveraging recent aerial imagery and lidar data regularly acquired across Belgian temperate forests over 2006-2021, standardized against ground-based inventories at ~1000m² spatial resolution, we estimated plot-level vertical growth and modeled species-specific reference trajectories from which we quantified plot-level deviations, providing both absolute and contextualized assessments. Across acquisitions, the standardization approach reduced the top-of-canopy height bias from 2.64±2.01 m to 0±1.77 m (RMSE = 1.77 m, R² = 0.92). Canopy structure, rather than acquisition parameters, was the main source of bias when estimating forest height from aerial imagery. Plot-level growth exhibited decreasing trends as initial height increased. Importantly, deviations from reference vertical growth displayed significant spatial clustering (Moran's I = 0.36, p < 0.001), suggesting systematic variations indicative of potentially declining or over-performing stands. Our workflow offers transferability, reproducibility, and multi-scale applicability for spatially exhaustive characterization of forest growth dynamics, providing actionable insights to support adaptive management and conservation planning.

How to cite: de LAME, H., Bastin, J.-F., and Messier, C.: Spatial patterns of forest growth dynamics with mixed-source time series of canopy height, a novel approach using belgian temperate forests as case study., EGU General Assembly 2026, Vienna, Austria, 3–8 May 2026, EGU26-4839, https://doi.org/10.5194/egusphere-egu26-4839, 2026.

EGU26-5343 | Orals | BG9.4 | Highlight

Strengthening forest remote sensing by linking research and practice: a collaborative framework 

Lars T. Waser, Mirela Schwenke-Beloiu, Krzysztof Stereńczak, Petra Adler, Serhii Havryliuk, and Nataliia Rehush

Demand is growing for cost-effective, current, and spatially detailed data on forest attributes— including species composition, growing stock, disturbances, and mortality—driven by management requirements, the multifunctional roles of forests, and their sensitivity to climate change. Advances in high-resolution remote sensing, deep learning, and rapid data processing now enable reliable, reproducible, wall-to-wall forest products that complement traditional inventories with regularly updated, spatially explicit information essential for sustainable, multifunctional, climate-adapted forest management.

Despite four decades of developing remote sensing–based forest products, their adoption by forestry practitioners remains slow and often incorrect or limited (e.g., Barrett et al., 2016; Waser and Ginzler, 2023; Fassnacht et al., 2024; Waser et al., 2025). In some cases, products fail to meet user expectations for accuracy or update frequency, revealing a mismatch between development and practical needs. This gap stems largely from poor knowledge exchange between researchers and practitioners, leading to differing expectations and misunderstandings of product content. Misalignment arises from differing expectations, limited understanding of practical needs, and technical challenges. While datasets like canopy height models are widely and effectively used, more complex products such as tree species or disturbance maps remain challenging and prone to misinterpretation. Adoption is further hindered by technical terminology, the need to integrate products into existing workflows, and the time, cost, and complexity of adapting decision-making processes.

In this study we show how to bridge the gap between remote sensing research and stakeholders, including forest industries, service providers, practitioners, and forest owners. We identify core challenges limiting the adoption, accuracy, and utility of forest products and propose a collaborative framework emphasizing cooperation between researchers and practitioners. We present examples of active user involvement to further improve the quality of remote sensing–based forest products by incorporating additional training data, adjusting model settings, and retraining iteratively based on new feedback. Active user involvement benefits both sides: it helps develop user-friendly products and provides supplementary reference data essential for machine learning, thereby advancing remote sensing research.

We tackle the key challenges and opportunities for integrating remote sensing research into forestry practice and propose strategies to improve utilization and acceptance of these products. We focus on five critical components:

  • Enhancing collaboration between researchers and forestry stakeholders to ensure product development matches user requirements and fosters technological progress.
  • Engaging applied research initiatives, engineering firms, and start-ups to translate discoveries into practical products.
  • Tailoring methods and products to practical, real-world applications, while maintaining relevance in informational content, accuracy, spatial resolution, and alignment with existing datasets.
  • Integrating user feedback through quality checks, validation, and iterative improvements.
  • Promoting clear communication and documentation, including intended use, interpretation guidance, and transparency regarding accuracy and uncertainty.

In summary, we show that addressing these issues requires active engagement of stakeholders in product development, iterative quality assessments, and alignment of methods with real-world use cases.

How to cite: Waser, L. T., Schwenke-Beloiu, M., Stereńczak, K., Adler, P., Havryliuk, S., and Rehush, N.: Strengthening forest remote sensing by linking research and practice: a collaborative framework, EGU General Assembly 2026, Vienna, Austria, 3–8 May 2026, EGU26-5343, https://doi.org/10.5194/egusphere-egu26-5343, 2026.

EGU26-6099 | ECS | Posters on site | BG9.4

Validation of UAV-LiDAR–Derived Effective Leaf Area Index (eLAI) in a Conifer Forest: Comparison with High-Density Litter-Trap Measurements 

Asahi Hashimoto, Junpei Kariyazono, Tomo'omi Kumagai, Yuichi Onda, Takashi Gomi, and Chen-Wei Chiu

Leaf area index (LAI) is a key variable in environmental and ecological research and is widely used in many models. Although destructive sampling can provide more direct LAI estimates, it is extremely labor-intensive and typically limits observations to the individual-tree scale. Litter-trap measurements enable stand-scale LAI estimation, yet applications remain rare in conifer forests, where evergreen species dominate. Recent advances in UAV-LiDAR have enabled the estimation of effective LAI (eLAI), which does not account for leaf clumping, over broad areas at high spatial resolution. In conifer forests, comparisons of eLAI between instruments (e.g., UAV-LiDAR versus LAI-2200) have been reported; however, studies validating UAV-LiDAR-derived eLAI against ground-measured LAI are still very limited. Consequently, it remains unclear to what extent UAV-LiDAR eLAI represents true LAI at the stand scale.

In this study, we conducted intensive litter-trap sampling in a deciduous conifer plantation of Dahurian larch (Larix gmelinii) and compared ground-based LAI with UAV-LiDAR-derived eLAI. The study was carried out in Mikasa, Hokkaido, Japan. We deployed 100 litter traps (1 m × 1 m) in a grid to collect needle litter within a 10 m × 10 m plot, thereby deriving a ground-reference LAI and its spatial variability. Concurrently, we conducted a UAV-LiDAR survey to validate LiDAR-based eLAI and to assess the importance of key parameters and processing settings used in the gap-fraction approach.

UAV-LiDAR point clouds were processed using the R package lidR. eLAI (without clumping correction) was computed from the Beer–Lambert relationship based on gap fraction. To evaluate parameter sensitivity, we systematically varied the extinction coefficient (k), the minimum gap-fraction threshold (Pgap), scan-angle correction, and a minimum height threshold for including first returns. These settings were altered stepwise to generate 144 parameter combinations, and the resulting eLAI estimates were compared with litter-trap-based LAI. The relationship between eLAI and LAI was most strongly affected by k and Pgap, whereas the other settings had minor effects within the parameter ranges evaluated for this plot. Overall, agreement between UAV-LiDAR-derived eLAI and ground reference LAI was low, with correlation coefficients ranging from 0.02 to 0.21 across all parameter combinations. The mean measured LAI in the plot was 2.04 m² m⁻², whereas LiDAR-based eLAI was substantially higher (6.12–14.08 m² m⁻²).

These results indicate that UAV-LiDAR-derived eLAI can markedly overestimate LAI unless woody contributions are removed and clumping is explicitly corrected. In particular, k and Pgap critically influence estimation accuracy, highlighting the need for careful calibration and species-/site-specific parameter selection. Our findings caution that using UAV-LiDAR eLAI directly as LAI in conifer-forest studies may lead to substantial bias and should be avoided without appropriate corrections.

How to cite: Hashimoto, A., Kariyazono, J., Kumagai, T., Onda, Y., Gomi, T., and Chiu, C.-W.: Validation of UAV-LiDAR–Derived Effective Leaf Area Index (eLAI) in a Conifer Forest: Comparison with High-Density Litter-Trap Measurements, EGU General Assembly 2026, Vienna, Austria, 3–8 May 2026, EGU26-6099, https://doi.org/10.5194/egusphere-egu26-6099, 2026.

Forest biomass accumulation significantly alters three-dimensional structural characteristics. This study developed a physics-based allometric growth equation to estimate forest above-ground biomass (AGB) at the footprint level using GEDI L1B full-waveform LiDAR data. The model operates within a well-defined physical framework, systematically integrating canopy structural parameters and species-specific attributes through a three-component architecture. First, it constructs a Waveform Index (WI) characterizing the vertical energy distribution by combining canopy height (H) retrieved from waveform data with the typical crown architecture. The second component incorporates key canopy structural parameters: canopy gap fraction (P), which quantifies vertical openness, and leaf area volume density (LVD), describing the vertical distribution of foliar mass. The third component introduces wood density (ρ). In boreal coniferous forests, the model achieved an R² of 0.66 and an RMSE of 20.22 t/ha, explaining 83% of the observed variance in AGB.

The method revealed that biomass accumulation was closely related to canopy height and wood density. While canopy height was directly retrievable from the waveform, wood density data were not readily available at large regional scales. Therefore, this research utilized land cover types as a base map and inferred the distribution of diffuse-porous wood and ring-porous wood forests across China by integrating multiple factors—including climate, topography, and phenology. The species composition was further refined using provincial forest inventory data on dominant tree species, excluding species accounting for less than 5% of a province's forest area. Wood density grades were then classified and incorporated into the footprint-level allometric equation for AGB estimation. This estimation method enables direct parameterization and retrieves AGB directly from satellite observations, while also accounting for the physiological characteristics of trees. This study demonstrates the significant potential for forest AGB estimation by leveraging canopy height and wood density. The proposed approach provides a foundation for forest carbon monitoring in precision forestry.

How to cite: Zhihui, L. and Weimin, J.: A Physics-Based Estimation Model of Forest Aboveground Biomass Integrating Wood Density Classification and GEDI Waveform Retrieval, EGU General Assembly 2026, Vienna, Austria, 3–8 May 2026, EGU26-6230, https://doi.org/10.5194/egusphere-egu26-6230, 2026.

EGU26-6698 | ECS | Posters on site | BG9.4

Remote Sensing Perspective on Integrated Bark Beetle Vulnerability Assessment 

Paul Eisenschink, Tobias Thymian, Tobias Frühbrodt, and Lukas Lehnert

Threats to European forests caused by pests are increasing due to climate change and its associated effects. The European spruce bark beetle (Ips typographus) is a prominent example, benefitting from warmer and drier conditions and well-known to cause wide-spread calamities in spruce-dominated forests in Northern and Central Europe. Current remote sensing approaches, built upon changes in spectral signatures, do currently not provide satisfactory results on the early detection of infestation stages to contain outbreaks. Thus, visual terrestrial surveys are required, which are highly time-consuming and hardly feasible for most foresters due to spatio-temporal constraints. Additional tools, such as trap-based monitoring, aim to reduce the required effort in the field by prioritisation, but cannot deliver information over wide-spread areas. Therefore, this work provides an outlook on an explorative approach to analyse factors which influence the number of bark beetle monitoring trap catches, a proxy for the local bark beetle population, from a remote sensing perspective. It aims to further deduce factors that mediate forest vulnerability to bark beetle infestation and thus provide further decision ground for a more efficient management. To achieve this, we combine weekly data from pheromone traps that are part of the bark beetle monitoring in Bavaria (southwestern Germany) with open-source remote sensing data, including LiDAR, RGB-Imagery as well as meteorological measurements. The calculated products include the detection and quantification of forest edge effects, structural forest heterogeneity (vertical and horizontal), proportion of Norway spruce (Picea abies) and species composition. This will help to identify and quantify the impact of forest and landscape features on Ips typographus populations. In addition, we aim to analyse the effect of different spatial resolutions as well as the temporal dimension. Ultimately, together with other relevant information such as current bark beetle swarming activity, weather, as well as soil and site conditions, our results will contribute to a more holistic and precise assessment of forests’ vulnerability to bark beetles in the future.

How to cite: Eisenschink, P., Thymian, T., Frühbrodt, T., and Lehnert, L.: Remote Sensing Perspective on Integrated Bark Beetle Vulnerability Assessment, EGU General Assembly 2026, Vienna, Austria, 3–8 May 2026, EGU26-6698, https://doi.org/10.5194/egusphere-egu26-6698, 2026.

EGU26-6916 | ECS | Orals | BG9.4

Remote sensing-based forest aboveground tree biomass and uncertainty assessment through upscaling from single tree to stand level 

Emanuele Papucci, Raul De Paula Pires, Tuomas Yrttimaa, Ruben Valbuena, Henrik Persson, Alex Appiah Mensah, Cornelia Roberge, and Göran Ståhl

Robust estimation of aboveground biomass (AGB) plays a pivotal role in forest resource management and carbon accounting. These estimates are especially relevant within the framework of climate mitigation strategies such as REDD+, yet direct tree-level estimates over large areas are still challenging to obtain. AGB predictions commonly rely on allometric models calibrated from destructive sampled trees. While diameter-based allometric models dominate, the high costs related to measuring diameters at tree-level have recently driven interest in alternative allometries. In this context, advances in remote-sensing technologies enable direct and spatially explicit characterization of three-dimensional forest structure, including tree height and crown attributes. Crown width continues to expand even when tree height growth slows, offering valuable information for AGB prediction. Together, these developments support diameter-independent, remotely sensed AGB models, though challenges remain in data availability, segmentation accuracy, and cross-site generalization.


Thus, the objective of this study was to develop an alternative methodological framework for assessing single-tree and stand AGB, along with its associated uncertainty, by upscaling predictions from field-calibrated terrestrial laser scanning (TLS) data to airborne laser scanning (ALS) data.
To achieve our objective, we conducted a case study at the Remningstorp study area in southern Sweden (58.5° N, 13.6° E), where the forest is dominated by Norway spruce (Picea abies), Scots pine (Pinus sylvestris), and birch (Betula spp.). In 2014, the site was surveyed collecting a combination of field measurements (diameter at breast height and tree height), TLS, and ALS data. In addition, destructively collected single-tree measurements from Marklund (1998) are being used to define diameter-independent models for AGB prediction, using crown-related features, such as tree height and crown diameter, as explanatory variables.


Our assumption is that crown related features can be reliably characterized from medium-density ALS data (approximately 10–100 points/m²). Thus, we will use the diameter-independent model to predict tree-level AGB from ALS and perform a rigorous assessment of associated uncertainties. This approach relies on accurate single-tree segmentation, the matching of field-measured trees with remotely sensed trees, and the extraction of crown and height metrics from TLS and ALS data. The accuracy of our method will be further tested comparing the proposed survey approach with the traditional Swedish AGB models, based on the tree height and DBH as predictors (Marklund 1998).


The expected results of this study are twofold: (i) the development of an AGB allometric model based on tree height and crown diameter, applicable to both field-measured and remotely sensed data, (ii) a comprehensive evaluation of the uncertainties inherent in upscaling this model from TLS to ALS data, and (iii) wall-to-wall AGB mapping with associated uncertainty analysis across the study area.

How to cite: Papucci, E., Pires, R. D. P., Yrttimaa, T., Valbuena, R., Persson, H., Mensah, A. A., Roberge, C., and Ståhl, G.: Remote sensing-based forest aboveground tree biomass and uncertainty assessment through upscaling from single tree to stand level, EGU General Assembly 2026, Vienna, Austria, 3–8 May 2026, EGU26-6916, https://doi.org/10.5194/egusphere-egu26-6916, 2026.

EGU26-8149 | ECS | Orals | BG9.4

Detecting Bark Beetle Infestation at the Green Attack Phase Using Multi-Scale Physiological Indicators 

Lorenz Hänchen, Lorenz Zähle, Herbert Wachter, Albin Hammerle, Magnus Bremer, Andreas Czifersky, Thomas Geisler, Stefanie Mössler, Sebastian Spreitzer, Martin Rutzinger, and Georg Wohlfahrt

Bark beetle outbreaks pose a significant threat to European forest ecosystems, with early detection of their green attack phase being critical for implementing timely countermeasures. While traditional remote sensing approaches often focus on proxies representing vegetation structure, we aim to introduce a novel approach by emphasizing physiological proxies that respond near-instantaneously to stress. By bridging scales from leaf to tree, landscape, and satellite levels, the BeatTheBeetle project aims to develop a comprehensive framework for detecting early signs of bark beetle infestation.

In this contribution, we will present results from an intensive field campaign conducted at spruce trees in the Pitztal valley (Tyrol, western Austria) to characterize leaf-level physiological responses. Measurements included leaf gas exchange, active and passive chlorophyll fluorescence, and visible and near-infrared reflectance. Preliminary results present a comparison between leaf gas exchange data, leaf-level imaging spectroscopy, and initial observations from an uncrewed aerial vehicle (UAV) flight.

Our findings highlight the potential of physiological proxies in advancing remote sensing techniques for early bark beetle detection. They represent an important step towards integrating multi-scale physiological indicators into remote sensing workflows and pave the way for further work exploring the scalability of these proxies across other platforms, ranging from UAVs to the satellite scale, to enable large-scale forest health monitoring.

How to cite: Hänchen, L., Zähle, L., Wachter, H., Hammerle, A., Bremer, M., Czifersky, A., Geisler, T., Mössler, S., Spreitzer, S., Rutzinger, M., and Wohlfahrt, G.: Detecting Bark Beetle Infestation at the Green Attack Phase Using Multi-Scale Physiological Indicators, EGU General Assembly 2026, Vienna, Austria, 3–8 May 2026, EGU26-8149, https://doi.org/10.5194/egusphere-egu26-8149, 2026.

EGU26-8189 | Orals | BG9.4 | Highlight

All maps are wrong, but some are useful: Benchmarking European forest disturbance products using a consistent reference database 

Cornelius Senf, Felix Wieland-Glasmann, Katja Kowalski, and Alba Viana-Soto

Europe’s forests play a critical role as carbon sinks, yet their capacity for climate change mitigation is increasingly threatened by rising disturbances and increasing demand for wood. Reliable data on disturbance rates and trends are thus needed. Several Earth observation-based products have been released in recent years, providing an outstanding source of information on forest change. However, many of these products lack proper quantification of accuracies, rendering rates and trends derived from them uncertain. We address this problem by developing a new database of forest disturbances for Europe, based on consistent manual interpretation of satellite imagery. Using this database, we derive robust annual disturbance rates at both national and regional scales, as well as trends over time. We further compare our sample-based estimates with state-of-the art map-based products, showing significant differences in map accuracies and thus area and trend estimates. We finally provide a framework for incorporating different map products into an ensemble estimate with well quantified uncertainties. Our results underscore the need for consistent, transparent, and independent reference data, and highlight that relying on a single map product might lead to biased conclusions about forest change in Europe.

How to cite: Senf, C., Wieland-Glasmann, F., Kowalski, K., and Viana-Soto, A.: All maps are wrong, but some are useful: Benchmarking European forest disturbance products using a consistent reference database, EGU General Assembly 2026, Vienna, Austria, 3–8 May 2026, EGU26-8189, https://doi.org/10.5194/egusphere-egu26-8189, 2026.

Canopy percentile height is a critical parameter for describing forest vertical structure and assessing terrestrial carbon sequestration. At large scales, it is typically measured using spaceborne LiDAR systems. The DQ-1 satellite differs from conventional spaceborne LiDAR systems by employing a multi-band, single-footprint design with full-waveform reception, similar to ICESat-1 and GEDI. However, DQ-1 canopy height inversion is limited by 1064 nm waveform saturation and cross-band differences in shape and resolution. To overcome these issues, we propose a multi-band fusion algorithm (MBFA-F), whose resulting products serve as ancillary outputs of the DQ-1 satellite. Multi-source validation shows that with Finnish ALS data, MAE and RMSE remain small and stable in the RH20–RH40 range (MAE: 3.05–2.46 m; RMSE: 2.84–1.99 m). The errors increase with higher percentiles (RH41–RH100), reaching maximum values at RH100, where the MAE is 6.30 m and the RMSE is 4.89 m. With the combined use of ICESat-2 and GEDI data, RH98 yields an MAE of 6.27 m and an RMSE of 8.51 m, while RH90 yields an MAE of 6.40 m and an RMSE of 8.49 m. Although the accuracy may have some limitations, they effectively fill the data gap in high-latitude boreal forests, offering useful supplementary information for related research. Compared to the canopy percentile height products of GEDI and ICESat-2, statistical analysis of boreal forest regions shows that DQ-1 provides additional pixel coverage ranging from 0.05% to 3.06% in various countries. The above results demonstrate that the DQ-1 satellite has significant potential for dynamic monitoring of forest canopies. 

How to cite: Zhang, H.: Global Mapping of Forest Vertical Structure with DQ-1 Multi-Wavelength LiDAR: Focus on Boreal Forests, EGU General Assembly 2026, Vienna, Austria, 3–8 May 2026, EGU26-8619, https://doi.org/10.5194/egusphere-egu26-8619, 2026.

EGU26-9090 | Posters on site | BG9.4

Decadal aboveground biomass change (2014–2024) across a montane–lowland gradient in southeastern Kenya using airborne LiDAR  

Janne Heiskanen, Temesgen Abera, Chemuku Wekesa, Ilja Vuorinne, Ian Ocholla, Hanna Haurinen, Elli-Nora Kaarto, Ida Adler, Hari Adhikari, and Petri Pellikka

The Taita Hills in southeastern Kenya are a critical biodiversity hotspot within the Eastern Arc Mountains, characterized by a complex mosaic of montane forest fragments, exotic plantations, and agroforestry systems transitioning into semi-arid grasslands and Acacia-Commiphora bushland. This landscape with elevations ranging from approximately 750 m to 2200 m exemplifies competing land-use interests, where a growing population and agricultural expansion have historically driven forest and tree cover loss. Accurate monitoring of these biomass dynamics is essential for quantifying carbon stocks, informing climate mitigation strategies, and guiding contemporary conservation and natural forest regeneration efforts.

This study employs an extensive multi-temporal dataset to quantify aboveground biomass (AGB) changes across the Taita Hills and adjacent lowlands. We analyzed data from 38 airborne LiDAR flights conducted between 2014 and 2024, covering 1,600 km², with 650 km² of overlapping coverage for change detection. Field-measured AGB plots (2013–2018) and LiDAR data from 2014/2015 were used to generate a baseline AGB map. A Random Forest model, calibrated on this baseline and LiDAR metrics, was then applied to predict AGB from 2022/2024 acquisitions. These predictions were validated using independent field measurements collected in 2024–2025. Finally, we analyzed annual AGB change rates in relation to high-resolution canopy height model changes, elevation zones, and land cover types to characterize spatial AGB dynamics and identify drivers of gain and loss.

Preliminary analysis reveals heterogeneous AGB dynamics across the landscape. The highest positive change rates were observed in young forest plantations, while agroforestry systems exhibited modest gains, indicating successful tree retention and maturation. Notably, native montane forest fragments remained relatively stable, with forest cover losses primarily concentrated within exotic plantations. Conversely, localized AGB reductions were identified in foothill areas and along riverine corridors. The multi-temporal LiDAR approach proved robust for capturing these fine-scale spatial patterns. This ongoing analysis will further refine the magnitude and drivers of decadal carbon stock fluctuations, providing critical evidence for landscape-level conservation and climate mitigation strategies in the region.

How to cite: Heiskanen, J., Abera, T., Wekesa, C., Vuorinne, I., Ocholla, I., Haurinen, H., Kaarto, E.-N., Adler, I., Adhikari, H., and Pellikka, P.: Decadal aboveground biomass change (2014–2024) across a montane–lowland gradient in southeastern Kenya using airborne LiDAR , EGU General Assembly 2026, Vienna, Austria, 3–8 May 2026, EGU26-9090, https://doi.org/10.5194/egusphere-egu26-9090, 2026.

EGU26-9310 | Orals | BG9.4

Estimation of tree stem diameter with mobile laser scanning using beam divergence bias correction and allometric models 

Johan Holmgren, Niklas Förster, Johan Fransson, and Nils Lindgren

Mobile laser scanning can be used to efficiently measure tree stems with high precision. However, the laser beam divergence will affect the accuracy if a curved surface, such as a tree stem, is to be measured. In this work we present a method for correction of the bias introduced by the physical properties of the emitted laser pulses. The aim of the work was to estimate tree stem centres and stem diameters for different heights above the ground level (i.e., stem vector). We used two different laser scanners (Ouster OS0; Ouster OS1) mounted on a forest harvester operating in northern Sweden (64.3° N, long. 19.8° E). The beam divergences were 0.35 and 0.18 degrees, respectively. For validation, the trees were measured with stationary laser scanning (Leica RTC360). The mobile laser scanning data were combined with data from an inertial navigation system (INS) and point clouds were derived using a simultaneously localization and mapping (SLAM) algorithm. To avoid influence of errors remaining after the SLAM computations, laser data were in a first step processed scan-wise to estimate circle centre and circle radius based on laser returns from the tree stems. The correction of the stem diameter bias caused by beam divergence was in this step also performed using a new algorithm using solely data from the same scan rotation. In addition, laser returns from the ground were extracted for each scan rotation. In a second step, circle estimated and ground returns from all scans were merged for further processing. The circle locations were in this step clustered to build up tree stems, and a ground elevation model was created using an active contour surface to normalize height values. Stem diameter profiles (stem vectors) were estimated for each tree stem using all circles associated to an individual tree. A priori information about tree stem allometry was used for the final interpolation of stem diameter vectors. The vectors of stem diameters and tree stem centre locations were validated using data from the stationary laser scanning. The results show that stem diameter estimation bias could be corrected using the new scan-wise bias correction method. Furthermore, stem shape could be estimated with sufficiently high accuracy to make the method useful for practical applications. The method could therefore be used in the future for real-time bucking optimization to improve utilization efficiency of wood resources.

How to cite: Holmgren, J., Förster, N., Fransson, J., and Lindgren, N.: Estimation of tree stem diameter with mobile laser scanning using beam divergence bias correction and allometric models, EGU General Assembly 2026, Vienna, Austria, 3–8 May 2026, EGU26-9310, https://doi.org/10.5194/egusphere-egu26-9310, 2026.

EGU26-9636 | ECS | Posters on site | BG9.4

Two New Radar Vegetation Indices (RVVI and RSVI) for Reconstructing NIRv as an Indicator of Tree Growth 

Marvin Müsgen-von den Driesch, Jörg Bendix, and Boris Thies

Based on the latest research findings, structural vegetation indices such as the Near Infrared of Vegetation Index (NIRv) are better suited for determining tree growth than greenness indices like the Normalized Difference Vegetation Index (NDVI). Since the tree thickness growth-Vegetation Index (VI) relationship depends on the time of the growing season, continuous and cloud-independent datasets are necessary for operational applications. Consequently, we introduce two Sentinel-1 SAR-based VIs, the Radar Structure Vegetation Index (RSVI) and the Radar Volume Vegetation Index (RVVI), enabling operational modelling of structural photosynthetic capacity indicators.

Since there are no continuously cloud-free datasets suitable for operational applications, an operationally usable, cloud-free NIRv dataset was modelled using pairs of Sentinel-1 and Sentinel-2 data. Seven common radar VIs and the two newly developed RSVI and RVVI were calculated and tested for their tree species-specific correlation with NIRv over the entire growing season. To show the potential of RSVI and RVVI, a simple random forest model with forward feature selection (FFS) was trained using the local incidence angle, tree species, date within the growing season and Radar VIs as input variables.

NIRv's model results for reconstruction achieved an R² of 0.82 and MAE of 0.03. A total of seven variables were selected by the FFS. RSVI and RVVI showed highest increase of model explanation and were found to be the most important Radar VIs for modelling NIRv.

The introduced Sentinel-1 radar VIs, RSVI and RVVI, show great potential for modelling NIRv. The findings can help to identify early harvest damage in forestry and are a useful tool on the path to climate-resilient forests.

How to cite: Müsgen-von den Driesch, M., Bendix, J., and Thies, B.: Two New Radar Vegetation Indices (RVVI and RSVI) for Reconstructing NIRv as an Indicator of Tree Growth, EGU General Assembly 2026, Vienna, Austria, 3–8 May 2026, EGU26-9636, https://doi.org/10.5194/egusphere-egu26-9636, 2026.

EGU26-9660 | ECS | Orals | BG9.4

Mapping multi-decadal tree cover change from disturbances across Europe using spectral unmixing of Landsat time series 

Alba Viana Soto, Katja Kowalski, Lisa Mandl, and Cornelius Senf

Europe’s forests are under increasing pressure from natural disturbances, while there is growing demand for wood. With disturbances expected to further intensify under climate change, quantifying the impact of disturbances on forest resources has thus become a key challenge for Earth Observation. In particular, there is a strong need for spatially explicit information on how forests change over time, driven by disturbance and post-disturbance recovery. Most existing large-scale assessments derive this information using spectral indices. However, spectral indices tend to saturate in dense canopies while being limited in their ability to capture changes under mixed land cover conditions. In that sense, using estimates of tree cover might provide a clearer signal of forest canopy changes. Building on previous applications of spectral unmixing for mapping forest cover in European forest ecosystems (Mandl et al. 2024, Viana-Soto et al. 2022, Senf et al. 2019), we here present a novel framework for mapping tree cover across all of Europe’s forests. Specifically, we (i) estimate annual tree cover fractions from 1985 to 2024 at 30 m spatial resolution using spectral unmixing of Landsat data, (ii) assess the temporal consistency and accuracy of these estimates across Europe’s forests, and (iii) characterise tree cover loss from disturbance and post-disturbance tree cover gain, thereby distinguishing it from land use changes. As a data basis, we built a consistent Landsat data cube of atmospherically and topographically corrected Landsat surface reflectance data, including cloud and shadow masking, totalling to 363,088 images. Annual gap-free best available pixel composites were generated by selecting high-quality observations closest to 1st of August, minimizing phenological effects and ensure intra-annual consistency. Based on these composites, we developed a multi-year endmember library consisting of pure and temporally stable pixels representing treed and non-treed land cover types (herbaceous, shrubs, bare ground, and shadow). We collected endmember spectra by randomly sampling pure pixels from LUCAS database, providing in-situ land cover information across Europe, and by cross-checking their spectral–temporal stability and cover proportions using high-resolution imagery. To simulate the full range of possible spectral mixtures, we generated synthetic training datasets by linearly combining endmember spectra in known proportions. Lastly, these mixtures and their associated ratios were used to train regression models predicting annual tree cover fractions. Preliminary results indicate that the spectral unmixing framework enables consistent mapping of annual tree cover fractions across Europe, capturing losses associated with disturbance or land use conversion and gradual gains reflecting post-disturbance recovery. By delivering harmonized annual maps of tree cover fractions for Europe, this work advances continental-scale forest monitoring efforts and supports policy frameworks for forest adaptation to climate change.

How to cite: Viana Soto, A., Kowalski, K., Mandl, L., and Senf, C.: Mapping multi-decadal tree cover change from disturbances across Europe using spectral unmixing of Landsat time series, EGU General Assembly 2026, Vienna, Austria, 3–8 May 2026, EGU26-9660, https://doi.org/10.5194/egusphere-egu26-9660, 2026.

EGU26-9762 | ECS | Orals | BG9.4

Towards using GEDI in the French NFI-based AGB estimations: Systematic Assessment of Plot-level Simulations Using Nationwide Airborne LiDAR HD 

Sélim Behloul, Nikola Besic, Steven Hancock, Ibrahim Fayad, Cédric Vega, Sylvie Durrieu, Jean-Pierre Renaud, and Philippe Ciais

Accurate estimation of aboveground biomass (AGB) is essential for quantifying forest carbon stocks. Missions such as NASA’s Global Ecosystem Dynamics Investigation (GEDI) provide valuable forest structure data that can be converted into AGB estimates. The most robust approach relies on calibrating these metrics against National Forest Inventory (NFI) plots. However, GEDI’s sampling remains sparse in both space and time, limiting opportunities for local calibration and validation of biomass models [1]. To address these limitations, the forest and remote sensing community increasingly uses simulators to generate GEDI-like measurements at NFI locations. Among the available tools for emulating GEDI waveforms, the simulator developed by Steven Hancock [2] has been widely adopted. Yet, its accuracy and biases have not been systematically assessed beyond the initial test areas or against real GEDI observations. 

By evaluating the Hancock simulator across diverse French forests using high-density national airborne LiDAR data (LiDAR HD), this work investigates the validity of a globally developed tool when applied at the local scale. We quantify discrepancies between simulated and actual GEDI data with a focus on bias metric due to its potential propagation into downstream biomass models. Such errors may lead to significant over- or underestimation of carbon stocks. 

Our approach focuses on a bottom-up, empirical evaluation of GEDI-simulated metrics to diagnose local biases and their drivers. It does not provide a comprehensive review of the simulator's theoretical framework. Results reveal systematic structural biases of up to 1 m in RH metrics. We investigate these errors in relation to pulse shape, algorithms and beam energy differences, canopy cover, forest type, seasonal effects and topography. Finally, we propose correction strategies in which a multi-layer perceptron (MLP) is trained to adjust simulated RH metrics to better match real GEDI observations. Our findings provide practical recommendations for simulator users, implications for improving GEDI-based biomass estimation and insights for the design of future LiDAR missions.


[1] N. Besic, et al., “Using structural class pairing to address the spatial mismatch between GEDI measurements and NFI plots,” IEEE JSTARS, vol. 17, pp. 12854–12867, 2024. DOI: 10.1109/JSTARS.2024.3425431  

[2] S. Hancock, et al., “The GEDI simulator: A large-footprint waveform lidar simulator for calibration and validation of spaceborne missions,” Earth Space Sci., vol. 6, no. 2, pp. 294–310, 2019. DOI: 10.1029/2018EA000506

How to cite: Behloul, S., Besic, N., Hancock, S., Fayad, I., Vega, C., Durrieu, S., Renaud, J.-P., and Ciais, P.: Towards using GEDI in the French NFI-based AGB estimations: Systematic Assessment of Plot-level Simulations Using Nationwide Airborne LiDAR HD, EGU General Assembly 2026, Vienna, Austria, 3–8 May 2026, EGU26-9762, https://doi.org/10.5194/egusphere-egu26-9762, 2026.

EGU26-10061 | ECS | Orals | BG9.4

Towards long-term monitoring of forest phenology using Landsat time series 

Katja Kowalski, Alba Viana-Soto, and Cornelius Senf

Monitoring phenology over multiple decades is crucial for understanding how forest productivity responds to climate change. In this regard, satellite remote sensing is indispensable to capture land surface phenology (LSP) at regional to continental scales. Sensors with high spatial or temporal resolution, such as combined Landsat/Sentinel-2 or MODIS time series, have been used to estimate annual LSP. However, these time series either cover relatively short periods (<10 years) or aggregate signals across multiple land cover types, limiting our understanding of long-term phenology change. The full Landsat archive spans over 40 years, offering long-term coverage, but sparse observations before the 2000s have limited its use for annual LSP estimation. Here, we explore the potential of the Landsat archive for estimating phenological parameters across European forests. We processed all available Landsat Level 1 images from 1984-2024 (>300,000) using the Framework for Radiometric Correction for Environmental monitoring (FORCE), including radiometric and topographic corrections as well as cloud and cloud shadow masking. To isolate phenological changes, we excluded forest pixels affected by disturbances including windthrow, fire, bark beetle outbreaks, or harvest. For the remaining undisturbed pixels, long-term phenological parameter distributions were first estimated from the full 40-year time series using a double-logistic Bayesian model. These parameter distributions were subsequently used as informative priors in a Bayesian hierarchical framework to estimate start (SOS), peak (POS), and end (EOS) of season from sparse annual observations, while accounting for regional tree species composition. Our two-stage modelling approach enables robust annual phenology estimation across the full Landsat era, including data-sparse early decades, and provides a basis for analyzing long-term forest phenology dynamics at continental scales.  

How to cite: Kowalski, K., Viana-Soto, A., and Senf, C.: Towards long-term monitoring of forest phenology using Landsat time series, EGU General Assembly 2026, Vienna, Austria, 3–8 May 2026, EGU26-10061, https://doi.org/10.5194/egusphere-egu26-10061, 2026.

EGU26-10738 | ECS | Orals | BG9.4

Static and kinematic point clouds using a single terrestrial laser scanning system for forest structure characterization 

Anna Iglseder, Florian Pöppl, Bernhard Groiss, Lauris Bocaux, Alessio Brandolese, Norma Brunetto, Fangming Li, Luna Maes, Chihiro Naito, Niál Perry, Illan Reato, Barbara Van Sebroeck Martins, Carlos Cabo, and Mattia Balestra

Terrestrial laser scanning (TLS) enables the detailed three-dimensional characterization of forest stands, capturing structural elements from stems to individual branches in an objective and reproducible way. This high-resolution structural information is valuable for a wide range of applications, including precision forestry, forest management, and ecological and biodiversity monitoring. In addition, TLS-derived forest structure can serve as reference data for the calibration of area-wide remote sensing products, such as airborne laser scanning (ALS) point clouds, and for identifying the structural contributions to synthetic aperture radar (SAR) backscatter signals.

Recent technological developments, particularly devices becoming lighter, easier to operate, and capable of functioning in both static and kinematic modes, have considerably broadened the applicability of TLS in forest environments. While multi-scan static TLS acquisitions still represent the gold standard in terms of geometric accuracy, kinematic laser scanning setups are increasingly able to provide point clouds suitable for many forest-related applications and offer advantages with respect to acquisition time and field logistics. In addition, improved usability and increasingly automated processing workflows have expanded the user base of TLS beyond remote sensing and surveying experts. As a result, TLS is now frequently integrated into applied forestry as well as inter- and transdisciplinary forestry research and academic education and training.

Within the Earth Sensing Summer School 2025 in San Vito di Cadore (Italy), a student project group conducted forest point cloud acquisitions using multiple terrestrial laser scanning systems operated in both static and kinematic modes, complemented by UAV-based laser scanning (ULS) data. In the presented study, we show results derived from the data of this campaign, focusing on data acquired with a RIEGL VZ-600i terrestrial laser scanner operated in both static and kinematic acquisition setups. Both data acquisitions are performed with long-baseline RTK GNSS to provide absolute georeferencing, although GNSS accuracy is severely degraded within the forest. The analysis is based on a representative forest plot of approximately 2500 m², including around 150 trees. The plot is dominated by coniferous species, primarily Picea abies (Norway spruce), and is located on sloped terrain with sparse understory vegetation.

We systematically compare the static and kinematic TLS acquisitions and the resulting point clouds with respect to acquisition time, data processing, point cloud completeness and occlusion effects. Furthermore, the point clouds are analyzed at the individual tree level, including semantic segmentation of individual trees and the derivation of key tree metrics. ULS data are used as a reference for the assessment of tree heights and the representation of upper canopy elements.

The data acquisition was performed by students unexperienced with TLS after giving a 30 min introduction to the device and TLS in forest environments. Comparing data acquisitions, the two kinematic acquisitions took ~10 min each, the static acquisition resulted in 22 scan positions and an acquisition time of 1 h 35 min. Preliminary results of the initial data inspection indicate that the kinematic point clouds provide a more complete representation of tree tops than static point clouds.

How to cite: Iglseder, A., Pöppl, F., Groiss, B., Bocaux, L., Brandolese, A., Brunetto, N., Li, F., Maes, L., Naito, C., Perry, N., Reato, I., Van Sebroeck Martins, B., Cabo, C., and Balestra, M.: Static and kinematic point clouds using a single terrestrial laser scanning system for forest structure characterization, EGU General Assembly 2026, Vienna, Austria, 3–8 May 2026, EGU26-10738, https://doi.org/10.5194/egusphere-egu26-10738, 2026.

EGU26-10987 | ECS | Orals | BG9.4

Integration of Digital Cover Photography and Multi-Source Remote Sensing Approaches for Forest Canopy Cover Estimation in Southwest Ethiopia 

Mohammed Ozigis, Byongjun Hwang, Thierno Bachir, Matthew Snell, Desyalew Fantaye, and Adrian Wood

Integration of Digital Cover Photography and Multi-Source Remote Sensing Approaches for Forest Canopy Cover Estimation in Southwest Ethiopia


Mohammed S Ozigis1, Byongjun Hwang1, Thierno Bachir Sy2, Matthew Snell2 and Desyalew Fantaye3, Adrian Wood2

1Department of Biological and Geographical Sciences, School of Applied Sciences, University of Huddersfield, Queensgate, Huddersfield HD1 3HD, UK

2Department of Management, Huddersfield Business School, University of Huddersfield, Queensgate, Huddersfield HD1 3HD, UK

3Ethio-Wetlands and Natural Resource Association, Ethiopia.


Abstract

Forest loss through deforestation and degradation is an important factor shaping the global climate change and its attendant short- and long-term impacts. Forest canopy cover (FCC) estimation has evolved to become an important and essential parameter for establishing degraded forest. Recent advances in Earth Observation (EO) satellite sensors have opened a new frontier in estimating, mapping and monitoring forest cover using high-resolution imagery and machine learning (ML). These have typically relied on canopy cover extracted from aerial or satellite images to establish baseline reference data. While several studies have alluded to the suitability of field-based Digital Cover Photography (DCP) for forest canopy characterization, none have explored their potential in predicting forest canopy cover through its integration with EO satellite data in-combination with ML methods. This study explores the integration of multi-sensor EO data from Sentinel-1 and Sentinel-2, along with topographic information (Digital Surface Model, DSM) and field-based DCP canopy cover measurements, to enhance the accuracy of EO-derived forest canopy cover estimates in Southwest Ethiopia. Over 1,000 DCP measurements were obtained during a field campaign conducted from January to February 2025 in southwest Ethiopia. The DCP data were then used to train both simple linear regression and advanced ML regression models to predict and map canopy cover. Initial results suggest that the integration of Sentinel-2 raw spectral bands with DSM produced the most accurate canopy cover estimates, with Random Forest (RF) model achieving the highest R2 (0.63) and lowest RMSE (7.4%). In addition, the XGBoost model achieved R2 of 0.59 and an RMSE of 7.9%, while the Generalized Additive Model (GAM) outperformed the other linear models tested, producing a higher R2 (0.52) and a lower RMSE (8.63%). This study demonstrates that integrating field-based DCP measurements with EO data provides a more accurate approach for estimating baseline forest canopy cover, thereby advancing existing knowledge and methodologies for EO-based canopy cover mapping.

 Keywords: Forest Canopy Cover, Deforestation, Forest Degradation, XGBoost, Random Forest, Digital Cover Photography, Sentinel-1, Sentinel-2

How to cite: Ozigis, M., Hwang, B., Bachir, T., Snell, M., Fantaye, D., and Wood, A.: Integration of Digital Cover Photography and Multi-Source Remote Sensing Approaches for Forest Canopy Cover Estimation in Southwest Ethiopia, EGU General Assembly 2026, Vienna, Austria, 3–8 May 2026, EGU26-10987, https://doi.org/10.5194/egusphere-egu26-10987, 2026.

EGU26-11017 | Orals | BG9.4

Leveraging Copernicus data, local expertise, and novel technology to create national forestry products 

Albin Bjärhall, Phillipp Fanta-Jende, Lorenzo Beltrame, Jules Salzinger, Jasmin Lampert, and Benjamin Schumacher

The Austrian Research Centre for Forests (BFW) uses a range of remote sensing (RS) data—including aerial imagery, airborne laser scanning, and high‑resolution Copernicus Sentinel data—to support the National Forest Inventory and produce national forestry products. These include tree species maps, timber stock maps, and a Sentinel‑2‑based anomaly detection map for identifying forest disturbances across Austria. The success of these products is grounded in three factors: (1) strong collaboration with researchers to ensure that recent scientific advances are translated into operational applications; (2) the integration of high‑resolution aerial data with extensive local expertise, enabling high‑quality training datasets for machine‑learning approaches; and (3) the Austrian National Forest Inventory, which provides a robust ground‑truth basis for validating RS‑derived results.

At the same time, the demand for precise, timely, and spatially detailed national forestry products is steadily increasing. This demand is driven by growing monitoring and reporting requirements, as well as by the increasing impacts of land-use and climate change on forest ecosystems. These developments highlight existing limitations of RS-based forestry products, particularly in complex alpine terrain, where terrain shadows and cloud cover can delay or obscure the detection of natural disturbances such as windthrows. Within the SAFIR project, we investigate how AI–based tools can be used to address these challenges and enhance the performance of existing forest disturbance monitoring tools.

As presented in our poster, the SAFIR project combines BFW’s anomaly detection map with ground-truth training data on windthrow events provided by the Österreichische Bundesforste (ÖBF). This fusion allows us to: (1) distinguish windthrow events from other disturbance types within the anomaly detection map; (2) assess the spatial and temporal agreement between modelled disturbances and inventoried windthrow events across Austria; and (3) quantify the detection rate of windthrow events in the existing product. Building on this assessment, identified windthrow sites can be specifically targeted with machine-learning approaches for cloud and terrain-shadow removal, thereby improving both the timeliness and accuracy of windthrow detection and providing validated inputs for developing new datasets and AI models specialized in de‑clouding and de‑shadowing windthrow areas.

By integrating established Copernicus-based forest disturbance products with an extensive, independently collected ground-truth dataset on windthrows, SAFIR enables a systematic evaluation of current windthrow detection capabilities and provides a pathway for targeted methodological improvement. By leveraging AI-based techniques to overcome known limitations, the project contributes to the development of more robust national forestry products for monitoring windthrow damage.

How to cite: Bjärhall, A., Fanta-Jende, P., Beltrame, L., Salzinger, J., Lampert, J., and Schumacher, B.: Leveraging Copernicus data, local expertise, and novel technology to create national forestry products, EGU General Assembly 2026, Vienna, Austria, 3–8 May 2026, EGU26-11017, https://doi.org/10.5194/egusphere-egu26-11017, 2026.

EGU26-11036 | ECS | Posters on site | BG9.4

Hierarchical UAV-LiDAR Classification of Field Margin Structural Types in Agricultural Landscapes 

Lena Büschel, Mike Teucher, Mona Pawelke, and Julia Pöhlitz

Field margins substantially contribute to landscape connectivity and ecosystem functioning in agricultural systems, offering key opportunities to enhance biodiversity and ecosystem services. Their structural classification is essential for targeted conservation and management strategies. Currently, detailed characterization of field margin structural variation is limited: traditional field surveys lack reproducibility and scalability, while coarse-resolution remote sensing fails to capture fine-scale structure relevant for ecological assessment. To address this, we developed a hierarchical decision-tree framework based on high-resolution UAV-LiDAR data that automatically classifies field margins into ecologically meaningful structural types, enabling rapid, objective assessment of vegetation structure and ecological potential.

High-resolution UAV-LiDAR point clouds were acquired for four field margins at two study sites in southern Saxony-Anhalt, Germany. We derived four essential pixel-based structural indicators describing (1) vegetation height, (2) vertical stratification across herb, shrub and tree layers, (3) vegetation density/porosity (Pulse Penetration Ratio) and (4) structural homogeneity (dense vegetation fraction). Classification thresholds were defined from metric distributions to maximise separability among field margin types. A hierarchical decision tree with two main pathways (tree-dominant vs. shrub-dominant) classified field margins into five structural types: Tree Row, Compact Hedgerow (Shelterbelt and Hedge subtypes), Complex Woody Mosaic and Open/Degraded Shrub Margin. Classifications were validated internally based on metric-derived thresholds.

Applied to the dataset, the framework successfully distinguished four structural types among its five defined classes using pixel-based metrics. Compact Hedgerow (Shelterbelt) featured tall vegetation (15.1 m), moderate dense canopy fraction (0.46) and relatively low Pulse Penetration Ratio (0.30), suggesting homogeneous structure. Complex Woody Mosaic, despite similar height (17.8 m), showed slightly lower dense fraction (0.40) and Pulse Penetration Ratio (0.34), indicating subtle fragmentation. Open/Degraded Shrub Margin had distinctly lower height (6.2 m), moderate shrub ratio (0.27) and higher Pulse Penetration Ratio (0.36). Compact Hedgerow (Hedge) exhibited shrub dominance (2–5 m ratio 0.40) with highest dense fraction (0.62) and lowest Pulse Penetration Ratio (0.25).

This reproducible and scalable LiDAR-based classification provides a transferable framework for assessing field margin structure independent of species composition and supports targeted management and evidence-based conservation in agricultural landscapes.

How to cite: Büschel, L., Teucher, M., Pawelke, M., and Pöhlitz, J.: Hierarchical UAV-LiDAR Classification of Field Margin Structural Types in Agricultural Landscapes, EGU General Assembly 2026, Vienna, Austria, 3–8 May 2026, EGU26-11036, https://doi.org/10.5194/egusphere-egu26-11036, 2026.

EGU26-11057 | ECS | Posters on site | BG9.4

Reliability of EO time-series-based assessments of forest biomass dynamics driven by management practices 

Yuan Hua, Yunsheng Wang, Eetu Puttonen, Hanna Sorokina, and Mariana Campos

Understanding how, and to what extent, management practices affect forest biomass dynamics is essential for optimizing management to achieve long-term economic and ecological benefits. However, in-situ forest inventories are spatially and temporally limited due to labor and time costs; thus, post-management forest development and long-term biomass trajectories are typically under-observed or poorly characterized. Earth observation (EO) imagery offers dense, multi-decadal archives with broad spatial coverage, but most studies focus on natural disturbances rather than management interventions because of constraints in spatial coverage and temporal resolution. Consequently, the extent to which the impacts of management measures can be detected and quantitatively assessed using EO time series remains unclear.

This study compared the reliability of EO-based assessments of forest biomass dynamics using conventional optical vegetation indices (VIs) and deep learning–derived canopy height as proxies. VIs such as NDVI and NBR are derived from harmonized Landsat-5/8 and Sentinel-2. Management-specific event-aligned trajectories were used to characterize the interventions following different cutting practices.  The ability of VIs and DL–derived canopy heights to depict biomass dynamics is assessed through alignment with management trajectories.

The study focused on managed boreal forests at the Hyytiälä research site in southern Finland, dominated by Scots pine, using plot-level measurements and management records spanning 1909–2024. EO time series were compiled from Landsat-5/8 (1984–present), Sentinel-2 (10 m optical), and Sentinel-1 (SAR). ALS canopy height data (2019, 2021) were used to evaluate and augment field-measured as calibration. Moreover, meteorological records were included to support interpretation of seasonal variability.

In principle, canopy height is understood as a more reliable predictor for biomass. However, EO-derived VIs showed only moderate correlations with canopy height, and the correlation strength varied across stratification schemes (e.g., stand stage, species, and sensor), due to the saturation and increasing structural heterogeneity in mature stands.

Nevertheless, historical management events since 1985 showed consistent VI patterns, indicating that VIs capture immediate post- management dynamics within 5 years. NBR was most sensitive to abrupt canopy removal, whereas NDVI better reflected gradual recovery. Intensive removals (e.g., clearcutting, shelterwood cutting) produced larger VI responses and longer return times than partial removals (e.g., first thinning, thinning). NBR increased in both broadleaf (Birch) and conifer stands (i.e. Scots pine, Spruce) but recovered more slowly in conifers. NDVI recovery time was similar across species, yet conifer responses were insignificant relative to broadleaf stands. Finally, NBR showed stronger responses and slower recovery in taller stands, whereas NDVI varied little across stand height classes.

U-net DL models produced canopy heights from EO imagery with moderate accuracy (R² = 0.67–0.88; MAE = 1.66–2.98 m), strongly depended on dense harmonized multi-sensor inputs and reliable structural reference data. Ongoing work is evaluating whether the dynamic of such canopy heights aligned with historical management events; detailed results will follow.

Overall, VIs support characterization of managed disturbance and condition-dependent post-management trajectories but are limited as reliable proxies for biomass assessment. DL-based approach offers a potential pathway toward canopy height as proxy for biomass through multi-sensor and high-quality data.

How to cite: Hua, Y., Wang, Y., Puttonen, E., Sorokina, H., and Campos, M.: Reliability of EO time-series-based assessments of forest biomass dynamics driven by management practices, EGU General Assembly 2026, Vienna, Austria, 3–8 May 2026, EGU26-11057, https://doi.org/10.5194/egusphere-egu26-11057, 2026.

EGU26-11803 | ECS | Orals | BG9.4

Global Canopy Height Models from Optical Satellite Data: What Has the AI Learned? 

Vinzenz Zerres, Emilio Sanchez, Jakub Nowosad, Hanna Meyer, and Lehnert Lukas

Reliable global datasets of key forest variables are urgently needed to monitor forest dynamics both on regional and global scales. Forest canopy height is one of these key variables due to its close correlation to forest biomass and carbon stocks. Recently, new and promising datasets have been developed that utilize deep convolutional neural networks to predict canopy height from optical Sentinel-2 satellite data on a global scale. But how is this possible, given that there is no physical relationship between optical data and canopy height? To understand what the models have learned, we expanded upon the study of Lang et al. (2023) and quantified the contributions of geographical, spectral, and contextual features to the model's outcome. To evaluate the effect of geographical coordinates, the geo-locations of the model input scenes were systematically altered, while maintaining identical spectral features. The resulting canopy height predictions revealed consistent dependencies on geographic location, with mean increases of up to 10 m across entire Sentinel-2 scenes. Effect sizes for latitudinal shifts were large (Cohen's d ≈ 1), indicating that the model interprets spectrally identical input data differently at varying locations. This suggests that the subtle biases arose from the learned spatial priors of the model ensemble. Consequently, the accuracy of predictions decreases in areas where forest height substantially differs from the mean height typical for the respective biome or climate zone, e.g., due to local soil properties, climatic effects, or uncommon forestry management practices. To isolate the effect of spectral properties, we both increased and decreased values of single spectral bands in discrete steps while maintaining the same geographic locations. Mean differences in canopy height predictions, compared to those derived from unmanipulated input data, showed varying responses across different bands, manipulation degrees, and sample locations. The observed changes were not systematically connected to the manipulated spectral data, suggesting that spectral features did not significantly influence the model's output. By modifying the input data, we highlighted potentially significant obstacles to the further development of AI-driven models of key forest variables which need to be taken into account for applications thereof.

How to cite: Zerres, V., Sanchez, E., Nowosad, J., Meyer, H., and Lukas, L.: Global Canopy Height Models from Optical Satellite Data: What Has the AI Learned?, EGU General Assembly 2026, Vienna, Austria, 3–8 May 2026, EGU26-11803, https://doi.org/10.5194/egusphere-egu26-11803, 2026.

EGU26-11814 | ECS | Posters on site | BG9.4

Detection of thinnings and clearcuts in boreal forests using bi-temporal airborne laser scanning, aerial images and time series of Sentinel-2 images 

Katri Mäkinen, Eva Lindberg, Matti Maltamo, and Lauri Korhonen

Most forests in Finland are in commercial use, thus the amount of felled roundwood is several tens of millions cubic meter every year. Nevertheless, there are biodiversity hotspots protected by law and certification standards that should not be affected by cuttings. While clear cut areas are already well monitored by Finnish Forest Centre, the detection of thinnings has been more challenging when relying solely on spectral information from satellite imagery. Therefore, our study aimed to evaluate whether textural features could improve the detection of thinned stands. In this study, we used Haralick’s textural features, template matching as a line detection method, and spectral values. As data source, we used bi-temporal airborne laser scanning (ALS) data, aerial images and temporal series of Sentinel-2 images. Ordinal logistic regression with three classes (clear cut, thinning, and no change) was used in modelling. The models used in this study were all features together, Sentinel-2 and aerial images together, ALS, aerial images, Sentinel-2, and Sentinel-2 without SWIR and red edge bands. Two study areas were used to create models, and the third area was used as validation dataset. We had previous information about realized clearcuttings and thinnings for all study areas. The results showed that thinned stands were detected most accurately from ALS data (F1 score 97.4%). Overall, ALS data yielded good results for all classes, whereas aerial images produced the poorest results. F1 score for clear cuttings varied between 91.8% – 99.4%, for thinnings F1 score varied from 35.7% – 97.4% and for unchanged values varied between 82.7% – 99.4%. Average F1 score varied between 70.3% – 98.7% and weighted kappa varied from 0.79 to 0.99. Most misclassifications occurred between thinnings and unchanged stands, while clear cuttings were always predicted most accurately. Our results showed that ALS can produce highly accurate estimates of forest management activities, whereas aerial images were possibly more sensitive to shadows and thinning intensity.

How to cite: Mäkinen, K., Lindberg, E., Maltamo, M., and Korhonen, L.: Detection of thinnings and clearcuts in boreal forests using bi-temporal airborne laser scanning, aerial images and time series of Sentinel-2 images, EGU General Assembly 2026, Vienna, Austria, 3–8 May 2026, EGU26-11814, https://doi.org/10.5194/egusphere-egu26-11814, 2026.

EGU26-13608 | ECS | Posters on site | BG9.4

Time Series Analysis of Sentinel-2 Imagery for Mapping Forest Disturbance Agents 

Maryam Ahmadi, Fariborz Ghorbani, Ruxandra-Maria Zotta, and Wouter Arnoud Dorigo

Forests play a vital role in regulating the Earth's climate as they are the largest terrestrial carbon sinks. Climate change is increasing the degradation of trees throughout Europe due to disturbance from biotic agents such as insect outbreaks (e.g. bark beetle), abiotic factors such as drought and windthrow, wildfires, and anthropogenic impacts such as logging. Dense satellite imagery provides an opportunity to accurately detect disturbance and determine the timing that disturbances occurred, but determining the driving force behind these disturbances continues to be a challenge.

Recent time series analysis (TSA) methods, particularly the Forest Disturbance Level (FDL) framework, have shown strong capability in detecting forest disturbances using Sentinel-2 imagery. By modeling forest phenology and cumulative anomaly patterns, FDL-derived metrics, such as the Forest Disturbance Date (FDD) and cumulative deviation measures, provide detailed information on the timing, duration, and severity of disturbances. However, this method cannot identify disturbance agents.

This research proposes to expand the use of the FDL framework from the detection of disturbances to the identification of disturbance agents. The proposed method enhances the FDL model by incorporating detailed phenological modeling and data‐driven feature selection. The extraction of spectral bands and vegetation indices is performed first using Sentinel-2 time series data. Next, a combined correlation analysis and Random Forest-based feature importance ranking is conducted to identify the most informative spectral bands and vegetation indices. The proposed approach uses TSA-based breakpoint detection methods. This combined framework incorporates temporal descriptors of disturbance and applies machine-learning techniques after a disturbance has been detected. After disturbances have been detected, new variables can be calculated to describe post-disturbance behavior. Based on these variables, their potential for discriminating between disturbance drivers is analyzed using Random Forest classifiers. Variables developed through the use of FDL time series analyses can also be used to describe recovery dynamics after a disturbance and disturbance trend behavior. They can additionally characterize phenological shifts and spectral patterns associated with the disturbance events of interest.

This framework is applied to Sentinel-2 surface reflectance time series spanning 2020–2024 across European forests, using reference data from the European Forest Disturbance Atlas and Copernicus forest type maps. Preliminary results suggest that post-disturbance temporal and phenological features capture informative patterns associated with different disturbance processes.

This study seeks to improve the field of forest monitoring from simply identifying disturbances to analyzing the possible attribution of disturbance types by utilizing a combination of variables based on the analysis of Sentinel-2 time series data. This study also aims to create a foundation for future analyses to identify the possible drivers of forest degradation and the factors of forest vulnerability at a larger scale.

How to cite: Ahmadi, M., Ghorbani, F., Zotta, R.-M., and Dorigo, W. A.: Time Series Analysis of Sentinel-2 Imagery for Mapping Forest Disturbance Agents, EGU General Assembly 2026, Vienna, Austria, 3–8 May 2026, EGU26-13608, https://doi.org/10.5194/egusphere-egu26-13608, 2026.

EGU26-13684 | Orals | BG9.4

Mapping and assessing forest ecosystem condition in Lithuania 

Miguel Inácio, Fernando Santos-Martín, and Paulo Pereira

The System of Environmental-Economic Accounting – Ecosystem Accounting (SEEA-EA) is a standard statistical framework developed by the United Nations and adopted in 2021. SEEA-EA aims to integrate the natural value of ecosystems in both physical and economic terms through ecosystem accounts. Physical accounts include ecosystem extent (e.g., extent of an ecosystem type), ecosystem condition (EC) (e.g., the health/ecological status of an ecosystem), and ecosystem services (e.g., carbon sequestration). Monetary accounts include ecosystem services (e.g., economic valuation) and assets. Forests play an important role in the socio-economic dynamics of many countries by providing multiple ecosystem services that support human well-being. In the context of SEEA-EA, forests are among the most-studied ecosystem types. However, most studies focus on ecosystem extent (e.g., forest cover changes) and ecosystem services (e.g., carbon sequestration). Less attention has been paid to EC, despite its importance in fully disentangling the link between ecosystem status and the supply of ecosystem services. In this study, we map and assess forest EC at the Lithuanian national scale and analyse changes over time by comprising two periods (2021 and 2024). In the SEEA-EA, EC is assessed based on abiotic, biotic, and landscape ecosystem characteristics, as defined by the SEEA-EA Ecosystem Condition Typology. Based on the literature, we defined three ecosystem variables for the ECT class, totalling 18 variables (e.g., tree cover density, soil organic carbon). The reference conditions for forest ecosystems in Lithuania were defined based on forests under strict protection. Based on these reference areas, the 18 variables were rescaled to 0-1 using the SEEA-EA methodological guidelines. The final EC index was calculated by overlaying the 18 indicators and assigning equal weights to each. The results showed higher EC values across Lithuania, particularly in the central and western parts of the country, which were associated with large, contiguous forest patches. Low EC was found in areas with smaller forest patches, mainly in the central, eastern, and western parts of the country. Regarding differences across years, the overall median EC index was higher in 2021 than in 2024. This can be attributed to changes in indicators that were not static (e.g., Leaf Area Index), which highlights both the advantages of remote sensing (e.g., large area cover and capacity to detect changes over time) but also influences the results (e.g., problems with cloud coverage for large areas such as national scale). Overall, this study is the first effort to map and assess forest EC beyond previous efforts to implement the SEEA in its experimental phase, serving as a basis for further development and improvement. The results obtained contribute to enhancing knowledge of the ecological status of Lithuanian forests, providing insights and guidance to support the implementation of SEEA-EA in Lithuania, which is envisaged within European environmental directives and policies.

How to cite: Inácio, M., Santos-Martín, F., and Pereira, P.: Mapping and assessing forest ecosystem condition in Lithuania, EGU General Assembly 2026, Vienna, Austria, 3–8 May 2026, EGU26-13684, https://doi.org/10.5194/egusphere-egu26-13684, 2026.

EGU26-13800 | Posters on site | BG9.4

Deriving shrub biomass and carbon from affordable UAV observations 

France Gerard, Douglas Kelley, Richard Broughton, Emily Upcott, Ce Zhang, Rafael Barbedo, and Charles George

Measuring shrub cover and above ground biomass is important for habitat condition and carbon monitoring, particularly for early-successional woodland. Advances in unmanned aerial vehicle (UAV) remote sensing and artificial intelligence are creating opportunities to complement field-based surveying or provide effective alternatives.

While there is a wealth of biomass calculations and allometric equations available for trees, there is a contrasting lack of this information for shrubs. Here we show results combining a Maximum Entropy allometric model using Bayesian inference developed from destructive sampling, a U-NET deep learning model, and UAV imagery structure-from-motion, to identify individual hawthorn shrubs, extract shrub height and crown diameter and derived shrub biomass and carbon. Streamlining these steps into an accessible pipeline could result in an effective and affordable solution for shrub biomass mapping.

How to cite: Gerard, F., Kelley, D., Broughton, R., Upcott, E., Zhang, C., Barbedo, R., and George, C.: Deriving shrub biomass and carbon from affordable UAV observations, EGU General Assembly 2026, Vienna, Austria, 3–8 May 2026, EGU26-13800, https://doi.org/10.5194/egusphere-egu26-13800, 2026.

EGU26-14073 | ECS | Posters on site | BG9.4

Improving carbon estimation in restored tropical forests using LiDAR 

Laura B. Vedovato, Danilo Almeida, Matheus Ferreira, Juliano Van Melis, and Pedro Brancalion

Forest restoration projects are gaining increasing attention as nature-based solutions, due to their potential to sequester carbon over time while simultaneously supporting biodiversity recovery, water regulation, and social benefits.

Carbon stocks are commonly estimated from forest inventories based on tree-level measurements of species identity, diameter, and height combined with allometric equations. While accurate at plot scale (~1 ha), this method is difficult to apply over large areas (>100 ha), relying on extrapolation and leading to uncertainties in landscape-scale carbon estimates.

LiDAR enables rapid coverage of large areas by generating high-resolution three-dimensional representations of forest structure, particularly when using unmanned aerial platforms with high point density. Although LiDAR-based models for estimating forest aboveground carbon are well established, most have been developed for mature or degraded forests in Amazonia. Consequently, models specifically calibrated for young restored forests and different restoration techniques are needed to improve accuracy and ensure the integrity and credibility of carbon estimates. Here, we develop a carbon modelling equation using LiDAR metrics for the specific context of restored forests.

We compared carbon estimates for 150 restored forest plots (including natural regeneration and planted) across the Atlantic Forest, Brazil, comparing aboveground biomass estimated from field inventories and allometric equations, with estimates from Airborne LiDAR data acquired by unmanned aerial vehicles. The LiDAR data was used to derive mean canopy height, which served as the primary structural metric for modelling the relationship between LiDAR measurements and field-based aboveground biomass estimates.

Our restored-forest LiDAR model explained 78% of biomass variability (R²cv = 0.78; RMSEcv = 1.67±1.19 KgC/m²) and estimated 52% higher carbon stocks at 10 m mean canopy height than the existing Amazonian-based model (Longo et al. 2016).

The improved performance of our restored-forest LiDAR model enables scalable and repeatable monitoring of carbon stocks across large areas, supporting decision-makers, project developers, and investors with more reliable and transparent estimates of climate mitigation benefits. These advances contribute to strengthening carbon accounting frameworks and the integrity of nature-based climate solutions.

How to cite: B. Vedovato, L., Almeida, D., Ferreira, M., Van Melis, J., and Brancalion, P.: Improving carbon estimation in restored tropical forests using LiDAR, EGU General Assembly 2026, Vienna, Austria, 3–8 May 2026, EGU26-14073, https://doi.org/10.5194/egusphere-egu26-14073, 2026.

EGU26-14442 | ECS | Posters on site | BG9.4

UAV-LiDAR based tree species identification under leaf-on, leaf-off, and combined canopy conditions in a mixed temperate forest 

Mudassar Umar, Harm bartholomeus, Alvaro Lao Sarmiento, and Kirsten De Beurs

Accurate identification of individual tree species is essential for assessing forest biodiversity and supporting sustainable ecosystem management. This study investigates the capability of UAV-LiDAR features to identify six tree species in a mixed temperate forest in Germany. Pre-acquired UAV-LiDAR data collected under leaf-on and leaf-off conditions were used to evaluate how structural and intensity-based features contribute to individual tree species identification. A total of 69 LiDAR-derived features describing structural and intensity characteristics at the individual tree level were extracted, and 24 important features were retained after assessing correlation. A Random Forest (RF) algorithm was then applied to identify the tree species and evaluate the importance of features. The results showed that intensity-based features, particularly the mean intensity of first-or-single returns and median intensity, were the most effective for species discrimination. Combining leaf-on and leaf-off conditions achieved the highest identification (overall accuracy = 80%), while leaf-on and leaf-off condition exhibited lower accuracies (75-76%). Coniferous species such as Douglas-fir and Norway spruce, together with the deciduous specie European beech, were consistently identified with high accuracy, whereas morphological similarity between European hornbeam and European beech led to misidentification among deciduous species. These findings demonstrate that UAV-LiDAR derived features exhibit strong potential in distinguishing individual tree species in mixed temperate forest. This study further advances LiDAR based tree species identification by demonstrating the capability of UAV-LiDAR to integrate fine-scale structural and intensity information for improved species identification across canopy conditions.

How to cite: Umar, M., bartholomeus, H., Lao Sarmiento, A., and De Beurs, K.: UAV-LiDAR based tree species identification under leaf-on, leaf-off, and combined canopy conditions in a mixed temperate forest, EGU General Assembly 2026, Vienna, Austria, 3–8 May 2026, EGU26-14442, https://doi.org/10.5194/egusphere-egu26-14442, 2026.

EGU26-14546 | ECS | Orals | BG9.4

Mapping growth decline probability and trends across Canada’s black spruce forests from tree-ring, Landsat, and climate data 

Alexandre Morin-Bernard, Elizabeth M. Campbell, Txomin Hemosilla Gomez, Martin P. Girardin, and Joanne C. White

Rapid changes in climate and disturbance regimes are increasing uncertainty regarding the future vigour and productivity of boreal forests. This challenge is particularly relevant in Canada, where boreal forests cover more than 5.5 million km² and are predominantly composed of black spruce (Picea mariana Mill.) a species of central ecological and economic importance that appears increasingly sensitive to interacting climatic and biotic stressors. Drought, anomalous temperature extremes, frost damage and insect outbreaks can alter growth trajectories at annual to multi-decadal timescales. Quantifying the magnitude and spatial distribution of these growth changes is therefore crucial for anticipating impacts on timber supply, ecosystem service provision, and forest carbon balance.


Tree-ring data provide annual-resolution records of growth and have been instrumental in characterizing climate–growth relationships across the boreal forest. However, dendrochronological networks remain spatially sparse and often capture generalized sensitivities that do not fully reflect local growth responses driven by fine-scale environmental conditions, stand structure, and disturbance legacies. Critically, they do not provide a spatially continuous and regularly updated assessment of changes in forest productivity, nor do they readily identify the regions most vulnerable to emerging stressors. Time series of satellite observations offer a complementary and scalable perspective by providing spatially explicit, long-term measurements of canopy dynamics. In particular, Landsat imagery enables direct observation of forest canopy trajectories, capturing realized responses to multiple, interacting stressors and providing critical information to refine spatial assessments of growth dynamics beyond relationships based solely on climatic variability. Integrating Earth observation data with climate and tree-ring information therefore offers a powerful opportunity to leverage their complementary strengths and deliver timely, decision-relevant information for the stewardship of forest ecosystems.


In this study, we modelled the annual probability of severe growth decline in black spruce–dominated forests across Canada from 1988 to 2020 by integrating broad-scale climate data and Landsat time series with tree-ring–derived growth information from the CFS-TRenD repository. Tree-ring width series from 3,125 trees across 648 sites were used to characterize growth decline events and to train a probabilistic modelling framework that accounts for temporal dependence in growth responses and spatial heterogeneity in climate–growth relationships. The resulting model was then applied across key regions of Canada to examine spatiotemporal patterns in growth decline likelihood over recent decades and among major boreal ecozones. Results show that changes in the temporal trajectories of Landsat-derived spectral indices and forest structural attributes, together with indicators of climate extremes, were among the strongest predictors of growth decline probability, with spatial patterns and temporal trends in predicted likelihood consistent with observed growth variability in independent tree-ring series.


Although the mapped probabilities do not represent direct observations of severe growth decline, they provide continuous, spatially explicit information that is critical for identifying vulnerable regions, guiding targeted monitoring efforts, and anticipating future changes in boreal forest productivity under ongoing environmental change. More broadly, this study demonstrates how freely available climatic and satellite-derived datasets can be integrated with tree-ring information to extend growth-related insights to continental scales and support spatially explicit assessments of forest productivity and vulnerability.

How to cite: Morin-Bernard, A., Campbell, E. M., Hemosilla Gomez, T., Girardin, M. P., and White, J. C.: Mapping growth decline probability and trends across Canada’s black spruce forests from tree-ring, Landsat, and climate data, EGU General Assembly 2026, Vienna, Austria, 3–8 May 2026, EGU26-14546, https://doi.org/10.5194/egusphere-egu26-14546, 2026.

EGU26-14707 | ECS | Orals | BG9.4

A Vertical Vegetation Structure Model of Europe 

Hui Zhang, Nico Lang, Stefan Oehmcke, Mikolaj Mazurczyk, Martin Brandt, Rasmus Fensholt, Ankit Kariryaa, and Christian Igel
Vertical vegetation structure data has the potential to reveal nuanced ecosystem response to climate change and disturbances such as from wildfires, droughts, deforestation, and forest degradation. However, existing global-scale studies mainly focus on canopy top height or simplified single descriptors of vertical structure at low spatial resolution. Here, we address this gap by integrating full-waveform lidar observations from the Global Ecosystem Dynamics Investigation (GEDI) and Sentinel-2 optical images into a wall-to-wall vertical structure model (VSM). The model provides a dense map of estimated relative height profiles at 10 meter resolution for Europe. Uniquely, the VSM resolves the full vertical profile, which allows for direct comparison with existing global canopy top height maps that use different relative height (RH) metrics for canopy height definition. Our model achieves accuracy comparable to state-of-the-art global products. Beyond top height, the VSM offers distinct advantages in characterizing the understory; specifically, the lower RH layers (e.g., RH25) are better in capturing small structures, such as canopy gaps, compared to higher RH layers (e.g., RH98). We see great potential in the presented VSM for advancing science and environmental resource management.
References
Lang, Jetz, Schindler, Wegner. A high-resolution canopy height model of the Earth. Nature Ecology & Evolution, 2023
Zhang, Lang, Oehmcke, Mazurczyk, Brandt, Fensholt, Kariryaa, Igel . A Vertical Vegetation Structure Model of Europe. Advances in Representation Learning for Earth Observation (REO) at EURIPS, 2025

How to cite: Zhang, H., Lang, N., Oehmcke, S., Mazurczyk, M., Brandt, M., Fensholt, R., Kariryaa, A., and Igel, C.: A Vertical Vegetation Structure Model of Europe, EGU General Assembly 2026, Vienna, Austria, 3–8 May 2026, EGU26-14707, https://doi.org/10.5194/egusphere-egu26-14707, 2026.

EGU26-14805 | ECS | Orals | BG9.4

An update on deadtrees.earth: A community-driven infrastructure for tree mortality monitoring from local to global scales 

Jonathan Schmid, Clemens Mosig, Janusch Vajna-Jehle, Miguel Mahecha, Yan Cheng, Henrik Hartmann, David Montero, Samuli Junttila, Stéphanie Horion, Mirela Beloiu Schwenke, and Teja Kattenborn

Tree mortality rates are increasing across many regions of the world, driven by interacting abiotic and biotic stressors such as global warming, climate extremes, pests, and pathogens. Despite growing evidence of widespread forest change, major data gaps persist regarding where trees are dying, at what intensity, and how mortality patterns evolve across space and time. Field-based observations remain essential but are often sparse, inconsistent, and spatially incomplete, while satellite observations provide dense temporal sampling but are commonly too coarse to directly resolve individual dead tree crowns. Integrating drone imagery with satellite Earth observation and machine learning offers a scalable pathway to monitor standing dead trees and to support attribution and forecasting of mortality dynamics.

Here we present an update of deadtrees.earth, a community-driven platform for multi-scale tree mortality mapping that curates centimeter-scale RGB aerial imagery and provides end-to-end processing and publication workflows. Over the past year, the database has grown beyond 5,000 drone-based forest datasets. Our platform now enables users to generate georeferenced orthomosaics directly from raw drone imagery via an automated workflow, and to immediately obtain AI-based semantic segmentations for both standing deadwood cover and forest cover.

A key new capability is persistent publishing and long-term archiving: users can now permanently publish selected datasets and obtain citable DOIs through FreiData. In parallel, the platform has expanded community feedback and crowdsourcing functionality, including structured issue flagging and web-based tools to review and refine model outputs, enabling continuous improvement of training data and model robustness.

Finally, we report progress toward satellite-based monitoring at continental and global scales. Prototype products for Europe, derived from Sentinel data, now provide annual maps of forest cover and standing deadwood cover at 10-meter resolution. These products incorporate an interactive feedback system, enabling users to validate predictions against known disturbance events and contribute local expertise to improve model robustness and transferability. Together, these updates move deadtrees.earth from a database toward an integrated, community-validated infrastructure for tracking forest mortality trends, contributing to climate change impact assessments, and enhancing predictive capabilities for ecosystem resilience.

How to cite: Schmid, J., Mosig, C., Vajna-Jehle, J., Mahecha, M., Cheng, Y., Hartmann, H., Montero, D., Junttila, S., Horion, S., Schwenke, M. B., and Kattenborn, T.: An update on deadtrees.earth: A community-driven infrastructure for tree mortality monitoring from local to global scales, EGU General Assembly 2026, Vienna, Austria, 3–8 May 2026, EGU26-14805, https://doi.org/10.5194/egusphere-egu26-14805, 2026.

EGU26-15403 | ECS | Posters on site | BG9.4

Evaluating different classification methods to effectively delineate tree cover on cattle farms in Colombia 

Benjamin Jonah Magallon, Kiyoshi Honda, Paula Gabriela Triviño, and Maria del Mar Salazar


Beef production in Colombia is the fastest-growing in Latin America. In order to further the growth of beef production, opening trades with the EU and USA would be instrumental; however, footprinting the commodity-linked deforestation is mandatory, as half of tropical deforestation occurs in Latin America. 


The European Union (EU) addresses deforestation through its EU deforestation regulation (EUDR), targeting cocoa, rubber, cattle, palm oil, coffee, soy, and wood. The United States of America (USA) advances similar goals with the Fostering Overseas Rule of Law and Environmentally Sound Trade (FOREST) initiative. Both require exporters to show that no deforestation occurred during production from the year 2020 onwards.


Thus, this study aims to determine whether accurate and robust annual forest cover detection models can be developed for the Republic of Colombia, using freely available satellite data, ground truth data, and drone images. Specifically, the study evaluates the feasibility of using these data sources to monitor deforestation relevant to regulatory requirements. The study was conducted on two ranches in Monteria, Córdoba Department, with contrasting landscapes: El Rosario ranch, dominated by estrella grass in open spaces and mombasa grass on hilly areas, and Costa Rica ranch, which is mostly hilly and dominated by Toledo grass. The study is a part of a collaborative project between Japan and Colombia under the Science and Technology Research Partnership for Sustainable Development (SATREPS) program.


To achieve the study’s objectives, monthly cloud cover assessment was conducted first on both regions from 2020 using Sentinel-2’s Cloud Probability collection. The assessment showed that at least a month of cloud free satellite data can be generated for each region. Then, different land classification methods were evaluated to determine which best fits the application utilizing Sentinel-1 and 2 data. The methods considered were random forest (RF), support vector machine (SVM), gradient tree boost (GTB) machine learning models, mixed tuned match filtering (MTMF), trend analysis using fourier series (FS) and combination of these methods. The training and validation for the methods were derived from drone images and the tree inventory survey conducted over the El Rosario ranch. Each method’s implementation utilized two different approaches on building training dataset, vector-based approach and grid-based approach. The latter was used to consider the coarse resolution of Sentinel-2. To ensure model’s robustness, each model was tested on both ranches. Lastly, the methods were evaluated according to the accuracy metrics and also its integrability with the on-going farm management system in Colombia.


The best method identified was the RF using grid-based approach, producing an accuracy of 88.58%, and with the advent of freely accessible geospatial platforms such as Google earth engine, its integrability to any current system is very straightforward. The method is then used to produce an annual forest cover map and detect forest cover loss. Through this, a clear picture of the impact of beef production was created, and the risk assessment requirements by the EU and USA through their regulations were fulfilled.


Key words: EU deforestation regulation, cattle farms, remote sensing, classification

How to cite: Magallon, B. J., Honda, K., Triviño, P. G., and Salazar, M. M.: Evaluating different classification methods to effectively delineate tree cover on cattle farms in Colombia, EGU General Assembly 2026, Vienna, Austria, 3–8 May 2026, EGU26-15403, https://doi.org/10.5194/egusphere-egu26-15403, 2026.

Correcting the solar angle effect on the canopy bidirectional reflectance factor (BRF) is essential for quantitative remote sensing but remains challenging due to the limited solar–view geometries of satellite observations and the complex radiative transfer process. This study develops a semi-empirical, physics-guided model—referred to as the p-S model—to correct nadir-view canopy BRF across arbitrary solar zenith angles (SZAs) using a single reference observation. Grounded in spectral invariant theory (p-theory), the model expresses canopy BRF in a concise analytical ratio form and, for the first time, introduces a hotspot factor to describe the enhanced backscattering effect when solar and viewing directions coincide. The p-S model was validated using homogeneous, row-structured, and RAdiation transfer Model Intercomparison (RAMI) forest canopies simulated by the Discrete Anisotropic Radiative Transfer (DART) model, as well as real Landsat 8 observations. Across the red and near-infrared (NIR) bands, the p-S model accurately reproduced BRF patterns with root mean square errors (RMSEs) ( < 0.008 in red and 0.0142 in NIR bands). By providing representative parameter sets (a, b, c, and LAI) for major vegetation types, the p-S model offers a practical framework for solar angle correction of canopy BRF across diverse ecosystems, while application to Landsat 8 imagery successfully reproduced diurnal trends in canopy BRF and the normalized difference vegetation index (NDVI). The p-S model offers an efficient and physically consistent framework for canopy BRF correction under varying SZAs.

How to cite: Li, W., Mu, X., Chen, S., and Gong, P.: Solar Zenith Angle Correction of Nadir-View Canopy Reflectance: A Simple Physics-Guided Semi-Empirical Method Based on Spectral Invariant Theory, EGU General Assembly 2026, Vienna, Austria, 3–8 May 2026, EGU26-15514, https://doi.org/10.5194/egusphere-egu26-15514, 2026.

EGU26-15759 | ECS | Orals | BG9.4

Radiometric Features Enable Cross-Platform (TLS-to-ULS) Generalization for Forest Structure Assessment 

Roman Kaharlytskyi, Derek Robinson, and Roberto Guglielmi

Leaf-wood segmentation is a fundamental prerequisite for generating Quantitative Structure Models (QSMs) used in non-destructive biomass estimation. However, state-of-the-art segmentation models, typically trained on terrestrial laser scanning (TLS) data, often exclude radiometric features to ensure sensor-agnostic applicability. We challenge this design choice by investigating whether excluding radiometric data limits cross-platform generalization when transferring models from ground-based scans to remotely piloted aircraft (RPA) platforms. The RPA platform offers the ability to acquire data across much larger spatial extents relative to TLS data acquisition. 

We utilized a gradient-boosting framework to evaluate domain generalization, training on the public Heidelberg TLS dataset (European mixed forest; RIEGL VZ-400) and testing on a novel manually labeled RPA-LS dataset from a mixed deciduous forest in Southern Ontario, Canada. The testing data were acquired with a RIEGL Ultra120 at a density of approximately 10,000–12,000 pts/m². We compared a geometry-only model (utilizing 26 descriptors including eigenvalue features, verticality, and neighbor counts) against a radiometrically augmented variant (incorporating normalized intensity, return number and number of returns) and benchmarked these against established methods (LeWoS, ForestFormer3D, PointsToWood). 

Results indicate that geometry-only approaches fail to generalize to the aerial viewpoint, achieving F1 scores ≤ 0.56 and producing fragmented predictions. The inclusion of radiometric features increased the F1 score to 0.61 and more than doubled wood recall from 0.16 to 0.35. Crucially, the integration of radiometric data substantially enhanced structural coherence, reducing disconnections between stem and branch components observed in geometry-only predictions. 

Our results suggest that geometric descriptors are limited by their dependence on the scanner's viewpoint, while radiometric features rely on physical material properties that persist regardless of the sensor used. For operational forest inventory, leveraging these consistent radiometric signatures is essential for preserving the topological continuity required for downstream QSM reconstruction. 

How to cite: Kaharlytskyi, R., Robinson, D., and Guglielmi, R.: Radiometric Features Enable Cross-Platform (TLS-to-ULS) Generalization for Forest Structure Assessment, EGU General Assembly 2026, Vienna, Austria, 3–8 May 2026, EGU26-15759, https://doi.org/10.5194/egusphere-egu26-15759, 2026.

EGU26-15902 | Orals | BG9.4

Spatiotemporal dynamics of typhoon-induced landslides and associated biomass loss over three decades 

Hsueh-Ching Wang, Su-Fen Wang, Chih-Hsin Chung, and Cho-ying Huang

Long-term spatiotemporal mapping of landslides is crucial for understanding the dynamics of landslide, their impact on forest carbon stocks, and their interactions with environmental factors, climate variability, and disturbances. This study analyzed 33 years (1990-2022) of Landsat imagery and topography using machine learning (Random Forest) to map landslide dynamics in a 24,386-ha subtropical montane forest in Northeast Taiwan. We also quantified forest aboveground biomass (AGB) losses from landslides using temporally corresponding Landsat and lidar data. We observed pronounced interannual variability, with total landslide coverage ranging from 0.68% to 3.19%, and forest-to-landslide transitions driving annual AGB losses of 2 to 85 Gg yr⁻¹. Temporal analysis revealed exponential declines in landslide frequency (median = 2 events), persistence (one year), and reoccurrence (two times), indicating most landslides were short-lived. However, nearly half of affected sites reoccurred multiple times, indicating spatially persistent susceptibility. Topographic attributes, including elevation, aspect, slope, and local relief, exhibited greater sensitivity to extreme events. Crucially, typhoon-driven extreme rainfall, particularly daily maximum precipitation (r = 0.559, p = 0.004), showed a stronger relationship with newly formed landslides than daily maximum precipitation during the rainy season (r = 0.399, p = 0.026), emphasizing typhoon’s dominant triggering role. AGB losses from typhoon-triggered landslides were roughly 14-fold greater than in quiet years, profoundly impacting the regional forest carbon budget. Post-landslide vegetation recovery exhibited a highly variable trajectory and plateaued at ~63% of pre-disturbance biomass within 25 years, based on a non-linear asymptotic model. As climate change is projected to intensify typhoon activity and extreme rainfall, landslide risks and associated forest carbon losses will increase, particularly in vulnerable, typhoon-prone regions like Asia. These findings highlight typhoons are not only a principal driver of landslide activity but also a major disruptor of forest carbon budgets, underscoring their critical inclusion in carbon accounting frameworks for vulnerable montane ecosystems.

How to cite: Wang, H.-C., Wang, S.-F., Chung, C.-H., and Huang, C.: Spatiotemporal dynamics of typhoon-induced landslides and associated biomass loss over three decades, EGU General Assembly 2026, Vienna, Austria, 3–8 May 2026, EGU26-15902, https://doi.org/10.5194/egusphere-egu26-15902, 2026.

EGU26-16942 | ECS | Orals | BG9.4

Mapping canopy heights from space using deep learning with Sentinel-2 time series and LiDAR data 

Srilakshmi Nagarajan, Mauro Marty, Christian Ginzler, and Cornelius Senf

Canopy height is one of the most important forest structural variable, generated by remote sensing for applications such as forest inventory, sustainable management, carbon assessments and disturbance monitoring. But generating accurate and frequent canopy height maps over large areas remains a challenge. Airborne laser scanning (ALS) provides highly reliable and detailed canopy height models, repeated acquisitions are often limited by cost and availability. With the spaceborne LiDAR from NASA’s GEDI (Global Ecosystem Dynamics Investigation) there is globally distributed relative canopy height observations but these are affected by noise and terrain-related uncertainties. This has created a gap for generating consistent, wall-to-wall canopy height products at annual timescales. With the growing availability of high temporal multispectral imagery from satellite missions such as Sentinel 2 raises the question to what extent dense optical time series can be used to support operational canopy height mapping when combined with LiDAR observations. In this work, we investigate the potential and limitations of using dense Sentinel-2 time series in fusion with LiDAR data for generating CHMs at 10m resolution across Bavaria. We downloaded and processed all available Sentinel-2 imagery for Bavaria from 2019 to 2024 (~9 TB) by correcting it radiometrically and geometrically and regridding it into a non-overlapping datacube structure. From this datacube, we generated multi-seasonal composites and interpolated time series to capture forest phenology at the pixel level. Using the Sentinel-2 time series products created, we trained a CNN based model (UNet) with (i) high-resolution ALS derived CHMs and (ii) GEDI waveform relative height metrics as reference data. Preliminary results demonstrate that integrating multi-seasonal Sentinel 2 information substantially improves model performance at generating annual CHMs at 10m reoslution. At the same time, we also highlight limitations related to the choice of training supervision data and that models trained with higher quality ALS based CHMs yield the most reliable canopy estimates whereas GEDI based supervision can introduce increased uncertainty in heterogeneous terrain and areas with limited footprint samples. We thus provide a technically workable, scalable and semi-automatic forest canopy monitoring approach which - once trained for a region - uses only open-scource data, making it highly reproducible.

How to cite: Nagarajan, S., Marty, M., Ginzler, C., and Senf, C.: Mapping canopy heights from space using deep learning with Sentinel-2 time series and LiDAR data, EGU General Assembly 2026, Vienna, Austria, 3–8 May 2026, EGU26-16942, https://doi.org/10.5194/egusphere-egu26-16942, 2026.

EGU26-16958 | ECS | Orals | BG9.4

Abseiling for science: integrating mobile and terrestrial laser scanning with arborist methods to improve point clouds 

Samuel Hepner, Vladimir Wingate, and Chinwe Ifejika Speranza

Forests play a central role in biodiversity conservation, nutrient cycles, and climate regulation. At the same time, forests are increasingly affected by biodiversity loss, disruptions of nutrient cycles, and global warming. Forests respond to these pressures through a range of dynamics, including increased tree mortality, shifts in tree allometry, and changes in species composition. Accurate and detailed forest monitoring, which can track changes in these parameters, is therefore essential.

Mobile and terrestrial laser scanning (MLS and TLS) have proven to be among the most precise tools for assessing key forest characteristics such as forest structure, tree architecture, and aboveground biomass. However, these technologies are typically ground-based, and the resulting point clouds are strongly affected by sparse point density in the canopy and occlusion, i.e., when main branches block laser pulses. This leads to systematically vertically biased point densities and data gaps in the canopy.

Here, we present a novel methodological framework that integrates mobile and terrestrial laser scanning with canopy access methods to reduce occlusion and improve point cloud quality. We use modern arborist techniques to access tree crowns using ropes and harnesses. Once in the canopy, we abseil from two sides of the tree while carrying an MLS unit by hand. In addition, we distribute targets on branches and mount the TLS on custom-built platforms installed on lateral branches and along the main stem. This workflow is repeated several times per year to quantify changes in tree morphology, such as tree growth at the millimeter scale, and to derive accurate estimates of forest characteristics.

The resulting point clouds show a more homogeneous point density and substantially reduced occlusion. Consequently, estimates of tree allometry, volume, and biomass are significantly improved. These highly accurate digital forest representations can be extrapolated to larger spatial and temporal scales and used to calibrate and validate airborne and satellite remote sensing products.

This work demonstrates that accurately characterizing the structural complexity of trees and forests requires innovative measurement approaches to enable improved monitoring and sustainable forest management in a changing climate.

How to cite: Hepner, S., Wingate, V., and Ifejika Speranza, C.: Abseiling for science: integrating mobile and terrestrial laser scanning with arborist methods to improve point clouds, EGU General Assembly 2026, Vienna, Austria, 3–8 May 2026, EGU26-16958, https://doi.org/10.5194/egusphere-egu26-16958, 2026.

EGU26-17321 | Orals | BG9.4

The use of UAV-LiDAR time series to monitor spring and fall phenology of a beech provenance experiment 

Harm Bartholomeus, Niamh Kelly, and Paul Copini

Understanding how tree provenances respond to local climate conditions is essential for predicting forest resilience under climate change. To investigate the performance of different European beech (Fagus sylvatica) provenances in the Dutch climate, a provenance trial was established in 1998 in Wageningen, the Netherlands. In this study, we evaluate the ability of UAV-borne LiDAR time series to capture temporal differences in spring and autumn leaf phenology among provenances.

Weekly UAV surveys were conducted from March to June and from October to December 2024 and 2025, with two additional flights during the summer period, over a 0.9 ha beech provenance trial consisting of 29 European provenances planted in three blocks (plot size 10 × 10 m). Data were acquired using a DJI M300 UAV equipped with a DJI L1 LiDAR sensor. From the LiDAR data, structural and radiometric canopy metrics were derived. These time series were compared with dendrometer measurements and physiological information related to the geographic origin of the provenances.

UAV-LiDAR structural metrics, such as canopy cover and height distribution, showed stable and consistent temporal patterns and were generally less sensitive to illumination and calibration effects than multispectral indices. However, LiDAR-derived metrics were highly sensitive to flight altitude, highlighting the importance of maintaining consistent acquisition settings throughout a time series. Differences in the onset and senescence of leaf phenology between provenances were observed from the LiDAR data, but clear relationships with provenance origin and dendrometer data are not yet conclusive.

How to cite: Bartholomeus, H., Kelly, N., and Copini, P.: The use of UAV-LiDAR time series to monitor spring and fall phenology of a beech provenance experiment, EGU General Assembly 2026, Vienna, Austria, 3–8 May 2026, EGU26-17321, https://doi.org/10.5194/egusphere-egu26-17321, 2026.

EGU26-17448 | ECS | Posters on site | BG9.4

Benchmarking Large-scale Forest Disturbance Products 

Claudia Leal-Medina, Teja Kattenborn, Clemens Mosig, Janusch Vajna-Jehle, and Miguel Mahecha

Forest disturbances are among the main drivers of global carbon emissions.  These disturbances are associated with various human-related and natural drivers, including unsustainable resource extraction, fires, overgrazing and extreme weather events. Such disturbances vary in intensity and type, ranging from stand-replacing disturbances following clear-cuts or windthrow to more scattered disturbance patterns involving standing deadwood resulting from drought-induced mortality or small-scale canopy removal from selective logging. In recent years, multiple Earth observation products have been generated from Landsat and Sentinel missions to monitor such disturbances. These products vary in their methodological approaches and in their global and temporal coverage. However, there are currently no consistent benchmarks with which to evaluate their performance under different disturbance regimes and drivers. This study aims to evaluate and compare the accuracy and operational applicability of satellite-based forest disturbance products. We compared eight large-scale satellite products for detecting various forest disturbances, such as scattered tree mortality, large-scale removal and natural hazards. The disturbance products compared include Global Forest Change (GFC), DIST-ALERT, DeadTrees.Earth and the European Forest Disturbance Atlas (EFDA), amongst others. The products were compared qualitatively and quantitatively using reference data on disturbance events obtained from globally distributed aerial imagery acquired using unmanned aircraft systems (UAS).  We use a total of 35 aerial orthomosaics acquired between 2015 and 2024, obtained from the DeadTrees.Earth platform. We identify forest disturbance types and quantify their extent using visual interpretation. This study advances our understanding of the strengths and limitations of current forest disturbance products by systematically assessing their performance across diverse disturbance types and environmental contexts.

How to cite: Leal-Medina, C., Kattenborn, T., Mosig, C., Vajna-Jehle, J., and Mahecha, M.: Benchmarking Large-scale Forest Disturbance Products, EGU General Assembly 2026, Vienna, Austria, 3–8 May 2026, EGU26-17448, https://doi.org/10.5194/egusphere-egu26-17448, 2026.

EGU26-19047 | Orals | BG9.4

Multi-Sensor Remote Sensing of Mangrove Resilience and Stress After the 2019 Northeast Brazil Oil Spill 

Luis Americo conti, katia Takahashi, and Roberto Lima Barcellos

Mangrove forests provide important coastal protection, biodiversity support and blue-carbon storage, yet they are highly sensitive to pollution-driven disturbances. The 2019 oil spill along the Brazilian northeast coast represents one of the largest recent environmental disasters in the South Atlantic, highlighting the need for scalable monitoring approaches capable of detecting both immediate impacts and delayed ecosystem responses. Beginning in late August 2019, petroleum residues reached hundreds of beaches and estuaries across multiple Brazilian states, affecting extensive intertidal habitats including mangrove-fringed shorelines; despite subsequent investigations, the spill’s source has not been conclusively established to date. Here we assess mangrove canopy dynamics following the spill using a multispectral, multi-resolution remote sensing framework that integrates satellite imagery and uncrewed aerial system (UAS) observations.

We analyzed time series of vegetation indices (NDVI, NDWI and chlorophyll-related indices) derived from PlanetScope, WorldView, Sentinel and UAS multispectral imagery for two affected mangrove areas in Pernambuco State, Brazil (Itamaraca and Carneiros, North and South coast respectively), covering the period 2018–2024. To enable cross-sensor comparison across different spatial resolutions, index distributions were harmonized relative to reference acquisitions. Pre- and post-spill windows were evaluated to capture short-term responses and longer-term trajectories. Tree-level structural data (height) were incorporated to test whether canopy condition changes were size-dependent such as other geographical parameters (zonation). Statistical analyses included parametric and non-parametric pre/post contrasts, trend evaluation across irregular acquisition intervals, and correlation and regression analyses linking tree height to spectral change metrics.

Across both sites, short-term analyses show no clear evidence of abrupt canopy degradation in moths immediately following the spill. In contrast, long-term trajectories reveal (years) a persistent decline in NDVI coupled with stable or slightly increasing NDWI, consistent with chronic physiological stress or progressive canopy thinning rather than acute dieback. The magnitude of long-term greenness loss is significantly greater in Itamaracá (North Coast) compared to Carneiros (South Coast), demonstrating spatial variation in exposure and/or ecosystem resilience. Additionally, emergency cleaning programs conducted primarily by local communities may have played an important role in influencing forest conditions. Height-dependent analyses further suggest that taller trees in Itamaracá experienced stronger post-spill declines, whereas responses in Carneiros were weaker and less structured by tree size. There was a slightly stronger decline in NDVI in the parts of the basin farthest from the tidal channels, likely because oil tended to linger longer in these areas.

These results demonstrate the value of multispectral, multi-resolution monitoring—combining frequent satellite coverage with targeted UAS surveys—for detecting subtle, delayed ecosystem responses to environmental disasters, supporting more effective impact assessment and evidence-based protection of sensitive coastal ecosystems.


How to cite: conti, L. A., Takahashi, K., and Barcellos, R. L.: Multi-Sensor Remote Sensing of Mangrove Resilience and Stress After the 2019 Northeast Brazil Oil Spill, EGU General Assembly 2026, Vienna, Austria, 3–8 May 2026, EGU26-19047, https://doi.org/10.5194/egusphere-egu26-19047, 2026.

EGU26-19140 | ECS | Orals | BG9.4

3D Habitat characterisation for targeted bat conservation in the Vienna Woods Biosphere Reserve  

Lea Dammert, Reuma Arav, and Marcela Suarez-Rubio

Forest management shapes forest structure and thereby the habitat for wildlife. One group that relies on forests during at least part of its life cycle is European insectivorous bats. In the context of climate change, diversification of forest stands is increasingly promoted as a management strategy. However, robust and quantitative tools to evaluate the structural outcomes of different management regimes and their ecological consequences on forest-dwelling bats remain limited. Traditional forest habitat assessments rely largely on field surveys that are time-consuming and observer-dependent. Such surveys are unable to capture complex three-dimensional structural properties such as gap volume or foliage distribution.

In this study, we present a novel three-dimensional LiDAR-based forest habitat characterisation approach and assess how vegetation structure parameters relate to bat activity and bat species richness. High-resolution 3D point clouds were acquired using a handheld mobile laser scanner in beech and mixed forest stands under managed and unmanaged regimes in the Vienna Woods Biosphere Reserve, Austria. Unlike commonly used 2.5D raster-based methods, our approach exploits the full three-dimensionality of point clouds to quantitatively describe vegetation structure. For habitat characterisation, we calculated the number of potential habitat trees, gap availability (gap ratio), and foliage height diversity (FHD). To illustrate the ecological relevance of these structural parameters, we combined the 3D characterisation with acoustic monitoring of bat echolocation calls across 40 sampling plots. Activity data were collected in May and June 2024 and analysed in relation to forest type, management type, and the calculated vegetation structure parameters.

We found clear differences in vegetation structure between beech and mixed stands. Further, stand type and the three vegetation structure parameters (i.e. number of potential habitat trees, gap ratio, and FHD) significantly affected the activity of foraging groups (e.g. open-space foragers) and taxonomic groups (e.g. Myotis and the Nyctaloid group). In contrast, we did not detect significant effects of stand type, management type, or vegetation structure parameters on species richness. Our results suggest that forest structure primarily influences the intensity of habitat use rather than species presence in the Vienna Woods Biosphere Reserve.

Overall, this study demonstrates the added value of full 3D point cloud analysis for linking forest management practices to habitat characterisation. The proposed workflow, implemented in R and applicable across forested ecosystems, provides forest managers and researchers with a tool to assess and guide management decisions aimed at balancing timber production, climate adaptation, and biodiversity goals. The information gained from the habitat characterisation approach can support ongoing efforts within the Vienna Woods Biosphere Reserve and beyond. Improving forest conditions for bats will contribute to the long-term conservation of these mammals.

How to cite: Dammert, L., Arav, R., and Suarez-Rubio, M.: 3D Habitat characterisation for targeted bat conservation in the Vienna Woods Biosphere Reserve , EGU General Assembly 2026, Vienna, Austria, 3–8 May 2026, EGU26-19140, https://doi.org/10.5194/egusphere-egu26-19140, 2026.

EGU26-19228 | Orals | BG9.4

From Trees to Forest Inventories: Do End‑to‑End LiDAR Pipelines Really Work? 

Julian Frey, Katja Kröner, Max Weidenfeller, Yannik Wardius, Elena Larysch, Kilian Gerberding, Teja Kattenborn, and Thomas Seifert

There is an ever-growing toolshed of processing solutions for close-range LiDAR scans of forests. But these tools often cover only a fraction of the workflow from a point cloud to a full forest inventory, which includes tree position, diameter at breast height (DBH), tree height, and species. Many tools either perform single steps, such as segmenting individual trees, or extract only geometric information, such as DBH and tree height, but not species information, while others do just this. Even though many of these tools are validated, and first benchmarks exist for individual tasks, it remains unclear whether a pipeline can be conducted across multiple tools to generate a full inventory and how errors propagate through such pipelines. Therefore, we validate a pipeline that includes single-tree segmentation (SegmentAnyTree), species classification (DetailView), and geometric parameter extraction (CspStandSegmentation) against manual full inventories of two contrasting forests in south-west Germany. The first forest is a flat, mature mixed forest dominated by Fagus sylvatica (approx. 1500 trees), while the second forest is on steep terrain with a diverse age structure, mostly dominated by coniferous species like Picea abies and Abies alba (approx. 750 trees). Therefore, these forests depict a strong gradient in structural complexity. We illustrate how reproducible, easily usable and scalable pipelines can be implemented across programming languages using the Galaxy platform. We clearly depict how errors propagate from the segmentation to the subsequent processes and how this influences the overall performance of forest inventory tasks.

How to cite: Frey, J., Kröner, K., Weidenfeller, M., Wardius, Y., Larysch, E., Gerberding, K., Kattenborn, T., and Seifert, T.: From Trees to Forest Inventories: Do End‑to‑End LiDAR Pipelines Really Work?, EGU General Assembly 2026, Vienna, Austria, 3–8 May 2026, EGU26-19228, https://doi.org/10.5194/egusphere-egu26-19228, 2026.

EGU26-19308 | ECS | Posters on site | BG9.4

Estimating seed production quantification using drone imagery in the Walloon region (Belgium) 

Thomas Pollet, Quentin Ponette, and Jean-François Bastin

Walloon forests are dominated (65%) by three main tree species: oak, beech, and spruce, often occurring in monospecific stands. This homogeneity makes forest habitats particularly vulnerable to climate change, as illustrated by bark beetle outbreaks and beech decline. Functional diversification of forest stands therefore appears to be a priority pathway for restoring more resilient forests by mobilizing tree species already present within the landscape.

This study focuses on the ecological trajectory of clear-cut areas by examining propagule production capacity at the landscape scale, with particular attention to two species that are essential for the recolonization of clear-cuts in the Belgian Ardennes: sessile oak (Quercus petraea) and silver birch (Betula pendula). The objective is to estimate propagule production of these two species based on their multispectral emissions during the seed production period.

Ten sites per species were selected and surveyed every two weeks using a DJI Mavic 3M drone equipped with a multispectral camera. In addition, approximately twenty individuals per site were selected, and their fruit production was estimated through ground-based observations. Finally, phenological monitoring images were taken for each studied individual at a height of two meters above the canopy.

The variability in seed production among individuals provided a sufficiently wide gradient to highlight a relationship between seed production and individual spectral signals. However, a second measurement campaign is required, with an extended monitoring period, to strengthen these results.

Estimating annual seed production makes it possible to assess the potential for dispersal and establishment within a given clear-cut site targeted for restoration. This information will contribute to better adaptation of silvicultural management practices at the stand level by integrating landscape-scale propagule availability.

How to cite: Pollet, T., Ponette, Q., and Bastin, J.-F.: Estimating seed production quantification using drone imagery in the Walloon region (Belgium), EGU General Assembly 2026, Vienna, Austria, 3–8 May 2026, EGU26-19308, https://doi.org/10.5194/egusphere-egu26-19308, 2026.

EGU26-19343 | ECS | Orals | BG9.4

National Tree Species Mapping in Denmark with Machine Learning Using Multi-Temporal Sentinel Data  

Alkiviadis Koukos, Spyros Kondylatos, Kenneth Grogan, and Thomas Nord-Larsen

Forests play a critical role in sustaining biodiversity, regulating carbon and water cycles, and providing aesthetic and amenity value. While much is already known about the distribution of forest cover, detailed tree species composition remains poorly mapped at national scales. Earth observation, particularly through Sentinel missions, provides dense multi-temporal and multi-sensor data that, when combined with machine learning, can enable improved characterization of forest composition [1]. This study presents a machine learning assessment of tree species mapping across Denmark using multi-temporal Sentinel-1 and Sentinel-2 data. 

The task is formulated as a pixel-based, time-series multi-class classification problem. Two input representation strategies are evaluated: i) manually engineered features incorporating spectral bands, vegetation and moisture indices processed from Sentinel data, ii) pre-computed embeddings from Earth Observation foundation models (AlphaEarth [2] and Tessera [3]), which encode spatio-temporal information from multi-source Earth observation data. Both input representations were complemented by canopy height information from national elevation data provided by the Danish Agency for Data Supply and Infrastructure. Random Forest, XGBoost, and Artificial Neural Network classifiers were trained and evaluated for each representation using species-level reference data from the Danish National Forest Inventory. 

Results show that the traditional feature engineering approach achieves strong performance for tree species mapping, with consistent gains from Sentinel-1/2 fusion. Foundation model embeddings yield comparable, though slightly lower, accuracy under full training data conditions. However, in data-limited training scenarios, they outperform the feature-based workflow, indicating increased robustness to reduced training sample sizes. Moreover, the use of pre-computed embeddings reduces processing complexity and computational requirements by removing the need for data preprocessing and manual feature engineering, yielding benefits that extend beyond performance alone. 

Our findings highlight the effectiveness of machine learning for national-scale tree species mapping using Sentinel data and provide new evidence that Earth observation foundation model representations offer viable alternatives to handcrafted features. The study contributes to advancing operational forest monitoring and provides insights into the integration of foundation models into large-scale ecological mapping workflows. 

References 

[1] Holzwarth, Stefanie, Frank Thonfeld, Patrick Kacic, Sahra Abdullahi, Sarah Asam, Kjirsten Coleman, Christina Eisfelder, Ursula Gessner, Juliane Huth, Tanja Kraus, and et al. 2023. "Earth-Observation-Based Monitoring of Forests in Germany—Recent Progress and Research Frontiers: A Review" Remote Sensing 15, no. 17: 4234. https://doi.org/10.3390/rs15174234 

[2] Brown, Christopher F., Michal R. Kazmierski, Valerie J. Pasquarella, et al. “AlphaEarth Foundations: An Embedding Field Model for Accurate and Efficient Global Mapping from Sparse Label Data.” arXiv:2507.22291. Preprint, arXiv, September 8, 2025. https://doi.org/10.48550/arXiv.2507.22291. 

[3] Feng, Zhengpeng, Clement Atzberger, Sadiq Jaffer, et al. “TESSERA: Precomputed FAIR Global Pixel Embeddings for Earth Representation and Analysis.” arXiv:2506.20380. Preprint, arXiv, September 22, 2025. https://doi.org/10.48550/arXiv.2506.20380. 


How to cite: Koukos, A., Kondylatos, S., Grogan, K., and Nord-Larsen, T.: National Tree Species Mapping in Denmark with Machine Learning Using Multi-Temporal Sentinel Data , EGU General Assembly 2026, Vienna, Austria, 3–8 May 2026, EGU26-19343, https://doi.org/10.5194/egusphere-egu26-19343, 2026.

EGU26-19352 | ECS | Orals | BG9.4

Integrating Sentinel-2 time series with in-situ monitoring to evaluate post-windthrow vegetation recovery trajectories and management impacts 

Carlotta Grande, Anna Candotti, Miriam Stein, Giorgio Alberti, Emanuele Lingua, and Enrico Tomelleri

Extreme windthrow events have increasingly affected mountain forest ecosystems, highlighting the need for robust monitoring approaches to assess post-disturbance recovery and support adaptive forest management. In October 2018, Storm Vaia damaged more than 42,500 ha of forest across northern Italy, causing an estimated 16.5 million m³ of windthrown timber and providing a regional-scale case study to evaluate forest recovery dynamics. This study aimed to investigate post-windthrow vegetation trajectories, with a particular focus on the effects of edge forest stand characteristics and salvage logging strategies on vegetation recovery. Vegetation dynamics were reconstructed using Sentinel-2 Normalized Difference Vegetation Index (NDVI) time series (2016–2025) for 148 permanent plots established and surveyed in the field within an extensive monitoring programme. Temporal trajectories were interpolated and classified using a temporal similarity clustering approach. Seasonal behaviour was characterised by deriving phenological metrics (start, peak, and end of the growing season) for individual plots and cluster-level confidence intervals. Statistically significant differences were tested both among clusters and across successive years. We used a Multivariate Factor Analysis (MFA) to integrate topographic variables, forest stand characteristics, and salvage logging methods to assess their influence on the identified trajectories. Our analysis identified four distinct vegetation recovery trajectories. One trajectory, representing the most severely impacted areas and associated with herbaceous-dominated stages, exhibited a pronounced post-disturbance reduction in NDVI (approximately 45%) while maintaining a high seasonal amplitude in the later years. A contrasting trajectory showed progressively dampened seasonal oscillations, with a 2024 amplitude of about 0.45 and a mean NDVI recovering to approximately 0.77, reflecting a more stable and less seasonally variable recovery pattern. The timing of the peak growing season was significantly altered across the study period, with post-hoc comparisons showing that the immediate post-disturbance years (2019 and 2021) differed markedly from both the pre-storm baseline (2018) and subsequent years. The MFA showed that edge forest stand characteristics explained 33% of the observed variance in vegetation trajectories, while salvage logging strategies exhibited limited explanatory power. Overall, our results demonstrate the potential of dense optical time series to reconstruct complex post-disturbance vegetation dynamics and highlight the value of integrating satellite observations with ground-based surveys to improve the interpretation of recovery trajectories in mountain forest ecosystems.

How to cite: Grande, C., Candotti, A., Stein, M., Alberti, G., Lingua, E., and Tomelleri, E.: Integrating Sentinel-2 time series with in-situ monitoring to evaluate post-windthrow vegetation recovery trajectories and management impacts, EGU General Assembly 2026, Vienna, Austria, 3–8 May 2026, EGU26-19352, https://doi.org/10.5194/egusphere-egu26-19352, 2026.

EGU26-19863 | ECS | Orals | BG9.4

Deep learning-based tree mortality detection using drone imagery and canopy height models in Northern Lapland  

Katalin Waga, Parvez Rana, Mikko Kukkonen1, Timo Kumpula, and Anton Kuzmin

Dead trees are key indicators of biodiversity and forest health, recognized by both the UN Convention on Biological Diversity and the EU Biodiversity Strategy. Member states are required to monitor these indicators regularly, making accurate tree mortality detection essential. We utilized remote sensing data combined with AI-driven image analysis to improve dead tree detection and forest mortality mapping. In remote regions such as Lapland, where rapid changes caused by snow damage, windthrow, drought, or pest outbreaks occur, traditional inventories are often time consuming and difficult.

Our study area of 208 ha is located next to Pallasjärvi in Northern Lapland, Finland. The area is dominated by Norway Spruce (Picea abies), but Scots Pine (Pinus sylvestris), Silver Birch (Betula pendula) and Downy birch (Betula pubescens) are also present. In the training dataset we recorded 4380 tree segments, including 142 dead trees, and delineated their canopies using visual interpretation on an Altum multispectral drone imagery. We evaluated the integration of LiDAR-derived Canopy Height Models (CHM) with multispectral imagery for classifying living and dead standing trees. The training dataset consisted of 411 image tiles (256x256 pixels) with a pixel size of 5.2 cm, captured from drone in 2023 July using an Altum sensor. The CHM was interpolated with a 1m resolution from the low-pulse density Lidar data that is available via National Land Survey of Finland. The models’ performance was assessed using 10-fold cross-validation.

We applied pixel-level semantic segmentation using U-Net deep learning architecture to classify each pixel of the images into living tree, dead standing tree, and background (e.g. fallen dead trees and non-trees) pixels. The Basic model using only multispectral imagery achieved F1-scores of 0.33–0.44 for dead trees in different areas and up to F1-score of 0.83 for living trees. Incorporating the CHM improved dead tree detection by over 56%, providing F1-scores of 0.56–0.71 and 0.96 for living trees. Visual assessment confirmed that incorporating CHM improved crown delineation by producing more precise crown edges and enhanced the classification of standing deadwood by reducing misclassification of fallen deadwood. The resulting three-class map provides valuable data for qualitative measurements of deadwood, including total land area covered and the percentage of dead crown area.

Our current workflow relies on drone imagery and LiDAR data. However, future scalability through satellite data could enable large-scale, cost-effective monitoring beyond the Arctic region. By incorporating readily available canopy height models (CHM) as an additional input, we enhance tree classification accuracy and improve the detection of standing and fallen deadwood, furthermore, multiclass classification enables more precise tracking of tree mortality than binary classifications done by most studies, as classification could be extended by e.g. dying trees in future. This qualitative measurement supports forest conservation and biodiversity monitoring efforts and could provide a remote sensing-based estimate of dead wood volume to forest inventory.

How to cite: Waga, K., Rana, P., Kukkonen1, M., Kumpula, T., and Kuzmin, A.: Deep learning-based tree mortality detection using drone imagery and canopy height models in Northern Lapland , EGU General Assembly 2026, Vienna, Austria, 3–8 May 2026, EGU26-19863, https://doi.org/10.5194/egusphere-egu26-19863, 2026.

EGU26-19959 | ECS | Posters on site | BG9.4

Detecting forest disturbances in Germany from satellite time series using unsupervised LSTM autoencoders 

Ines Grünberg, Michael Förster, Robert Jackisch, and Christine Wallis

Climate change and natural disturbances are posing an increasing pressure on European forests and have led to extensive forest losses over recent decades. Large-scale monitoring of forest dynamics is therefore essential and can be effectively supported by remote sensing techniques. Previous studies have demonstrated the potential of supervised and unsupervised machine learning approaches for detecting forest disturbances, typically characterising forest condition at specific points in time. At the same time, comprehensive reference data remain scarce at large spatial scales.

Against this background, we investigate the potential of an unsupervised deep learning approach for large-scale detection of forest anomalies across Germany within the framework of the EO4Nature project. We apply a deep learning based Long Short-Term Memory (LSTM) autoencoder to model vegetation trajectories over multiple vegetation periods to capture gradual changes in forest vitality.

The LSTM model is trained on stratified healthy forest pixels across Germany, selected based on a low disturbance probability derived from the European Forest Disturbance Atlas (EFDA). We compare multiple model configurations using different input feature sets based on Sentinel-2 data at a monthly temporal resolution for the period 2018-2025. Anomalies in forest vitality are detected based on the reconstruction error of the autoencoder, using adaptive thresholds that account for seasonal variation and forest type. This enables the identification of pixels with different levels of anomaly severity.

We primarily evaluate the proposed approach using independent disturbance reference data at the local scale. High-resolution annual orthophotos from multiple disturbed forest sites in Germany are used to enable a detailed spatial assessment of detected anomalies.

In addition, we conducted a preliminary large-scale consistency check by comparing areas exhibiting high anomaly scores with disturbed forest regions derived from the EFDA. These initial results indicate that the unsupervised LSTM autoencoder, trained on stable forest conditions using NDVI, NBR and abiotic variables, produces a continuous anomaly score that correlates with independently mapped disturbance patterns (Spearman’s ρ = 0.65, p < 0.001), demonstrating consistency with external disturbance probabilities.

The results give insight into the disturbance intensities at which deviations from healthy forests dynamics become detectable and provide knowledge about the most relevant spectral features for large-scale monitoring of forest ecosystem stability.

How to cite: Grünberg, I., Förster, M., Jackisch, R., and Wallis, C.: Detecting forest disturbances in Germany from satellite time series using unsupervised LSTM autoencoders, EGU General Assembly 2026, Vienna, Austria, 3–8 May 2026, EGU26-19959, https://doi.org/10.5194/egusphere-egu26-19959, 2026.

EGU26-20067 | ECS | Posters on site | BG9.4

Integration of GEDI LiDAR, Optical Satellite and In-situ Data for Forest Structure and Biomass Assessment 

Atul Kaushik, Eswar Rajasekaran, Sasiganandhan Kumarasamy, and Ritika Srinet

Accurate information of forest aboveground biomass (AGB) and vertical structure is crucial for sustainable forest management and for understanding the role of forests in the global carbon cycle. Satellite remote sensing in conjunction with ground truth data provides an effective strategy for mapping and monitoring of forest biophysical variables over large areas. The Global Ecosystem Dynamics Investigation (GEDI) aboard the ISS is a unique sensor which uses infrared laser to observe the forest vertical structure. The present study evaluates the accuracy of GEDI L2A canopy height and L4A biomass in moist deciduous forests of Gariyaband region (Chhattisgarh, India) by using in situ data. We also integrate GEDI data products with optical satellite data for generating spatially continuous canopy height and AGB maps of the study region. We collected ground truth data of vegetation height, tree species and diameter at breast height (DBH) for all trees in 90 sample plots - out of which 70 plots are co-located with the GEDI L2A/L4A footprints, while 20 plots are outside the GEDI footprints. Data processing, model refinement and analysis are currently underway. This study provides a scalable framework for regional canopy height / AGB mapping using GEDI data. It also advances our understanding of the applicability of GEDI science data products for localized/regional forest monitoring and climate-related applications.

How to cite: Kaushik, A., Rajasekaran, E., Kumarasamy, S., and Srinet, R.: Integration of GEDI LiDAR, Optical Satellite and In-situ Data for Forest Structure and Biomass Assessment, EGU General Assembly 2026, Vienna, Austria, 3–8 May 2026, EGU26-20067, https://doi.org/10.5194/egusphere-egu26-20067, 2026.

EGU26-20093 | ECS | Posters on site | BG9.4

Seasonal dynamics of UAV-LiDAR derived canopy transmittance in a mixed-forest ecosystem 

Matthias Gassilloud and Anna Göritz

Forest vegetation regulates carbon and water fluxes and mediates the exchange of energy between the land surface and the atmosphere. However, quantitative information on how structural changes alter light penetration and their intra/inter‑annual dynamics is still limited. Phenological shifts are usually inferred from spectral indices such as the NDVI, which provide only indirect estimates of canopy cover. In this contribution we present a comprehensive UAV‑LiDAR (DJI Zenmuse L2) time‑series that records (bi‑monthly) overflights (25 flights) throughout two vegetation seasons over the ECOSENSE field site in Germany, covering 7 ha mixed‑temperate forest dominated by F. sylvatica and P. menziesii.

A dedicated processing chain was implemented to extract transmittance from the LiDAR point clouds. First, LiDAR beam trajectories are reconstructed and traced through a voxel grid. Second, the transmittance is calculated for a voxel size of 25-50cm resolution with an efficient implementation of AMAPVox developed in Python. Third, unseen and undersampled voxels are identified via occlusion mapping and the quantification of explored voxel volume to drive uncertainty estimates. 

Across the 24‑month record the resulting transmittance maps display phenological patterns. The dataset, together with the newly created Python implementation for transmittance calculation and tight integration of occlusion mapping, enables quantitative analysis of structural canopy changes and provides a robust framework for linking these changes to eco‑physiological and hydrological variables that were measured concurrently on the ECOSENSE field site.

How to cite: Gassilloud, M. and Göritz, A.: Seasonal dynamics of UAV-LiDAR derived canopy transmittance in a mixed-forest ecosystem, EGU General Assembly 2026, Vienna, Austria, 3–8 May 2026, EGU26-20093, https://doi.org/10.5194/egusphere-egu26-20093, 2026.

EGU26-20129 | ECS | Posters on site | BG9.4

Patterns and Drivers of 3D Space Exploration in European Tree Species 

Katja Kröner, Julian Frey, Elena Larysch, Dominik Florian Stangler, and Thomas Seifert

Trees in forests plastically explore three-dimensional space in response to competition and other environmental drivers. Above-ground space exploration involves several mechanisms, including stem leaning and bending, differential growth and survival of lateral branches, and vertical growth. These mechanisms collectively shape tree morphology and influence a multitude of ecological processes at the tree and stand level, such as resource acquisition, competitive dynamics, and microclimate. Species may differ in their level of plasticity and in general space exploration patterns, i.e. the mechanisms shaping their morphology. For example, European beech exhibits strong plasticity via lateral branch growth, whereas other species like Scots Pine may rely more on stem leaning.

Although advances in Terrestrial Laser Scanning (TLS) now enable detailed and accurate assessments of tree structural information, comprehensive studies that consider several space exploration mechanisms in a three-dimensional context remain scarce. Consequently, species-specific space exploration patterns and their drivers remain poorly understood. Therefore, enhanced descriptions of tree space exploration could support more accurate representations of tree structure in forest growth models. Further, increased knowledge of space exploration patterns could inform silvicultural interventions, such as planting patterns or thinning, to promote desired stand structures and boost productivity, habitat diversity, and forest resilience.

Within this research, we apply TLS to capture detailed three-dimensional data on the stem and crown structure of sample trees from four major European tree species. Based on this data, we address the following research questions: (1) What are species-specific patterns of space exploration? and (2) How do intrinsic and environmental drivers impact the space exploration patterns? We analyse several sites in Central Europe with different dominant species, namely European beech, Norway spruce, Scots pine, and Douglas fir. We compute various space exploration metrics describing stem leaning and bending, crown size and shape, crown shyness, and tree slenderness. We apply principal component analysis to identify species-specific space exploration patterns. Further, we conduct regression modelling and circular statistics to assess the influence of drivers, such as competition, slope, and tree size.  

The findings of this study offer valuable insights on species-specific space exploration patterns. Thereby, we improve our understanding of how tree and stand structures develop, and how different species deploy distinct mechanisms to optimize light capture, enhance mechanical stability, and compete with neighbours. These insights shed light on niche differentiation and coexistence in diverse forests.

How to cite: Kröner, K., Frey, J., Larysch, E., Stangler, D. F., and Seifert, T.: Patterns and Drivers of 3D Space Exploration in European Tree Species, EGU General Assembly 2026, Vienna, Austria, 3–8 May 2026, EGU26-20129, https://doi.org/10.5194/egusphere-egu26-20129, 2026.

EGU26-20155 | ECS | Orals | BG9.4

Evaluating P- and C-band spaceborne SAR for refined tropical ecosystem mapping in Amazonia under sparse ground-truth conditions 

Yu Dong, Elizaveta Avoiani, Zahra Dabiri, and Thomas Blaschke

Remote sensing plays a central role in providing qualitative and quantitative information on forest ecosystems for sustainable management and forest carbon inventory. The ESA BIOMASS satellite mission launched in 2025 introduces the first global P-band Synthetic Aperture Radar (SAR) system dedicated to forest structure and biomass, but its potential for refining tropical forest ecosystem maps remains largely unexplored. Here we compare P-band (~70cm wavelength) BIOMASS data with C-band Sentinel-1 SAR to assess their respective ability to discriminate structurally and hydrologically different forest ecosystems in Brazilian and Bolivian Amazonia, including terra firme forest, flooded forest and forest–wetland mosaics, in the presence of sparse solid ground-truth data.

We use MapBiomas Amazonia and MapBiomas Bolivia as primary land-cover references, taking advantage of their annual time series from 1985 to 2024 to address label noise. Because these maps are not error-free at the pixel level, we develop a noise-labelling pre-processing workflow to derive high-confidence forest samples at the epoch of the first BIOMASS acquisitions (2025). The workflow combines (i) spatial homogeneity constraints (distance to class boundaries, neighbourhood purity, minimum patch size), (ii) temporal stability of the MapBiomas class history (to identify pixels with persistent forest or flooded forest trajectories), and (iii) physical plausibility checks using auxiliary optical and terrain indicators. Pixels that satisfy these criteria are retained as reliable proxies for different forest ecosystem types.

For these filtered samples we extract BIOMASS Detected Ground-range Multi-looked (DGM) backscatter and Sentinel-1 Ground-range Detected (GRD) backscatter, derive polarisation ratios and simple texture metrics, and quantify within-class variability and between-class separability for both frequencies. We pay particular attention to forest–non-forest transitions and to distinctions among terra firme forest, flooded forest and adjacent forested wetlands that are relevant for high-carbon stock and peat-forming systems. Preliminary results from the Brazilian test site indicate that P-band reduces within-class variance in forested classes and enhances separability between terra firme and flooded forests compared to C-band alone, while C-band performs comparably or better for some open and anthropogenic land covers. By extending the analysis to Bolivian Amazonia and to a richer legend of forest and forest-wetland classes, and by testing a similar workflow for peatland-prone flooded forests, this study provides a first evaluation of the potentials and limitations of BIOMASS P-band SAR for tropical forest applications under sparse ground-truth conditions.

How to cite: Dong, Y., Avoiani, E., Dabiri, Z., and Blaschke, T.: Evaluating P- and C-band spaceborne SAR for refined tropical ecosystem mapping in Amazonia under sparse ground-truth conditions, EGU General Assembly 2026, Vienna, Austria, 3–8 May 2026, EGU26-20155, https://doi.org/10.5194/egusphere-egu26-20155, 2026.

EGU26-20357 | Posters on site | BG9.4

Forest recovery analysis combining AI with multi-platform LiDAR and UAV-based hyperspectral imaging (KI-Recover) 

Robert Jackisch, Caileigh Shoot, Christine Wallis, Jakob Ebenbeck, Max Mangold, Anna-Lena Thran, and Marco Heurich

Temperate forest ecosystems are increasingly pressured by climate warming and drought events that drive disturbances such as storms, wildfires and calamities. Forest dieback caused by windthrow and bark beetle infestations has increased significantly in severity and affected entire regions in Germany.

With the progression of remote sensing and unoccupied aerial vehicles (UAV, drone) as sensor platform, precise monitoring of extensive forest areas at high resolution is feasible. The project KI-Recover integrates AI-driven multi-sensor data analysis of diverse sites following significant disturbances. Our surveys were conducted during summer 2025 in the Bavarian Forest National Park and the Harz National Park. Both regions are characterized by disturbance legacies, recent dieback and minimal forest management.

Within these regions, we chose forest stands based on disturbance type and history to allow for natural regeneration, except for two sites with recent wildfire. Monitoring utilized UAV-hyperspectral scanning, multispectral and RGB mapping and UAV-LiDAR. An extensive ground campaign provided forest inventory adapted for remote sensing, vegetation species and deadwood mapping. Additionally, mobile laser scanning was employed to obtain fine-scaled 3D information of forest metrics, e.g. forest structural complexity.

We present initial results of our integrated multi-modal geospatial modelling approach. Forest inventory at image level is conducted via instance segmentation of individual living trees, as well as standing and lying deadwood at various decay stages, using convolutional neural network (CNN) architectures. A large training and validation database was created by manual annotations and labelling of RGB and multispectral data. Detailed volumetric forest structure was extracted from fused mobile and UAV LiDAR, to overcome the scale gap between. Hyperspectral transect data is used i.e. to model species richness and measure plant vitality. All methods combined will inform indicators of successional development, stand dynamics, and species establishment.

The overarching goal of this project is to couple the geospatial remote sensing surveys with a forest succession prediction and detailed AI-driven climate modelling to assess effects of extreme events, heat stress and drought, and to provide data-driven recommendations for forest management.

How to cite: Jackisch, R., Shoot, C., Wallis, C., Ebenbeck, J., Mangold, M., Thran, A.-L., and Heurich, M.: Forest recovery analysis combining AI with multi-platform LiDAR and UAV-based hyperspectral imaging (KI-Recover), EGU General Assembly 2026, Vienna, Austria, 3–8 May 2026, EGU26-20357, https://doi.org/10.5194/egusphere-egu26-20357, 2026.

EGU26-20434 | ECS | Orals | BG9.4

3Dtrees.earth - A platform for accessing, analyzing, and visualizing LiDAR data in forest environments 

Kilian Gerberding, Janusch Vajna-Jehle, Teja Kattenborn, Christian Scharinger, Daniel Lusk, Benjamin Brede, Maximilian Sperlich, Thomas Seifert, Björn Grüning, Stefano Puliti, and Julian Frey

Forests are undergoing rapid structural changes driven by droughts, storms, pests, and long-term climatic stress. Quantifying these dynamics requires detailed three-dimensional information on forest structure, biomass, and diversity. Drone-based, mobile, and terrestrial LiDAR have become essential for acquiring such data, yet their broader use remains constrained by fragmented processing workflows, heterogeneous data formats, limited cross-platform integration, and restricted access to scalable computing resources.

3Dtrees.earth is an open, cloud-based platform designed to overcome these barriers through integrated, scalable, and reproducible extraction of forest information from multi-platform LiDAR data. The platform supports standardized processing of LiDAR point clouds terrestrial (TLS), uncrewed aerial (ULS), and mobile laser scanning (MLS), applying modular pipelines for data harmonization, instance and semantic segmentation, species prediction, and structural trait extraction. Building on the recent advances in 3D deep learning, 3Dtrees.earth integrates state-of-the-art models for single-tree detection, species classification, and tree-level inventory generation. 

All processing workflows are containerized and deployed via Galaxy Europe, enabling users to analyze large LiDAR datasets without local software or dedicated computing resources. A core design principle is accessibility combined with transparency: users interact through web-based workflows and shared histories that fully document tool versions, parameters, and data provenance, ensuring reproducibility across regions, sensors, and applications. Derived products - including canopy height models, tree-level inventories, biomass estimates, and structural diversity indices - are curated according to FAIR principles with persistent storage, rich metadata, and standardized access interfaces. 

Co-developed with forest managers, researchers, public agencies, and AI developers, 3Dtrees.earth serves multiple communities. Practitioners gain access to operational products such as tree density and height maps, gap and deadwood indicators, and structural diversity metrics that can be directly integrated into management planning. Scientists benefit from harmonized benchmark datasets and reproducible workflows that facilitate method comparison across regions, forest types, and sensor platforms. AI developers are provided with large-scale, well-labeled 3D forest datasets for training and evaluating generalizable forest analytics models.

By lowering technical barriers and standardizing 3D forest analytics, 3Dtrees.earth aims to accelerate the integration of LiDAR-derived structural information into forest research, monitoring, and management at a global scale.

How to cite: Gerberding, K., Vajna-Jehle, J., Kattenborn, T., Scharinger, C., Lusk, D., Brede, B., Sperlich, M., Seifert, T., Grüning, B., Puliti, S., and Frey, J.: 3Dtrees.earth - A platform for accessing, analyzing, and visualizing LiDAR data in forest environments, EGU General Assembly 2026, Vienna, Austria, 3–8 May 2026, EGU26-20434, https://doi.org/10.5194/egusphere-egu26-20434, 2026.

Sun‑induced chlorophyll‑a fluorescence (SIF) is used as a proxy for photosynthetic activity measurements from space‑ and airborne platforms. However, its signal is affected not only by the underlying leaf biochemistry but also by geometric factors such as canopy architecture and leaf orientation, which can lead to misinterpretations of SIF signals. To evaluate how these interacting influences affect SIF signals and subsequent drought‑stress detection, we combined SIF measurements with high‑resolution structural monitoring and UAV‑based thermal imaging during a four‑week drought experiment on seedlings of two ecophysiologically contrasting tree species, Pseudotsuga menziesii (Douglas‑fir) and Fagus sylvatica (European beech). Soil moisture was recorded continuously with SMT100 sensors, while top‑of‑canopy SIF spectra were captured under clear sky conditions on four days using a spectroradiometric setup (FLOX). Leaf‑level chlorophyll fluorescence (effective quantum yield)  was assessed with a Junior‑PAM fluorometer. Photogrammetric reconstruction of RGB images allowed for the analysis of 3‑D point clouds that permitted a quantitative comparison of structural parameters from the onset to the end of the treatment. After the drought period, a multi‑sensor UAV flight acquired LiDAR point clouds, multispectral reflectance, and thermal imagery to provide spatial context for the physiological observations. Structural changes were modest, whereas apparent SIF yields declined markedly in the drought‑stressed seedlings relative to well‑watered controls. Thermal maps showed slightly increased canopy temperature in stressed plants, corresponding closely with observed SIF reductions, particularly for F. sylvatica. By a combined analysis of temporal SIF dynamics and thermal signatures, we were able to jointly interpret observed signs of stress. From this plant level analysis, an outlook is given towards continuous observations, which were conducted over the temperate mixed ECOSENSE forest in SW Germany in 2025. In summary, the synergistic, multi-sensor approach presented here enhances the reliability of fluorescence-based remote sensing of plant stress and provides a scalable framework for monitoring drought impacts across heterogeneous forest ecosystems.  

How to cite: Göritz, A., Enriquez, A., Gassilloud, M., Stock, C., Haberstroh, S., and Werner, C.: Experimental assessment of drought‑induced changes in Sun‑Induced Fluorescence (SIF), 3‑D canopy structure and UAV‑based thermal imaging of Pseudotsuga menziesii and Fagus sylvatica seedlings, EGU General Assembly 2026, Vienna, Austria, 3–8 May 2026, EGU26-20481, https://doi.org/10.5194/egusphere-egu26-20481, 2026.

EGU26-20765 | ECS | Orals | BG9.4

Region-wide Prediction of Boreal Understorey Vegetation using Spaceborne Remote Sensing 

Ritwika Mukhopadhyay, Benjamin Brede, and Inka Bohlin

Understorey vegetation (USV) plays a vital role in forest ecosystems by influencing biodiversity, nutrient cycling, and disturbance dynamics. Accurate mapping of USV is essential for understanding ecosystem functioning and its relationship with environmental variables across landscapes. The use of remote sensing (RS) for its application to USV prediction has been attempted a handful of times. Open-access Sentinel-1 C-band Synthetic Aperture Radar (SAR) and Sentinel-2 multispectral imagery have been used in this study for USV cover modelling, where USV cover is defined as the surface area (in m2) covered by the USV on the forest floor. Two sources of field reference data used here for USV cover measurements were from: (A) the Swedish National Forest Inventory (NFI) (for year 2019-2024) covering 55,000 km2 area in the Västerbotten County, northern Sweden, and (B) detailed field measurements from a smaller test site – the Krycklan catchment research area covering 70 km2 from 2024. This study aimed to 1) Develop two separate regression-based generalized additive models (GAM), Model A and Model B using an area-based approach integrating Senitnel-1 and 2 metrics and trained using the two field reference datasets A and B, respectively, and 2) Further extend Model A to account for interaction of USV with additional environmental covariate rasters of, e.g., soil moisture, elevation, land-use/land-cover classes, bedrock type, soil type, and bioclimatic metrics such as seasonal and annual temperature and precipitation, acquired over the entire Västerbotten county. 

Both baseline models A and B were developed using explanatory variables from Sentinel-1 namely, difference between the vertical transmit, vertical receive (VV) backscatter and vertical transmit, horizontal receive (VH) backscatter and total backscatter power (VV2+VH2), and from Sentinel-2 namely, Normalized difference vegetation index (NDVI), Visible atmospherically resistant index (VARI), and the difference between surface reflectance of the red-edge band in summer and autumn seasons. Both baseline models A and B - demonstrated comparable performance with similar magnitude of root mean square error (RMSE) and coefficient of determination (R²) values when validated against a common test subset derived from the NFI field reference data. With including the environmental covariates in model A, the USV cover showed correlation with soil moisture, elevation, land-use/land-cover classes, and seasonal and annual temperature and precipitation variables. The inclusion of these variables improved the extended model A performance compared to the baseline model A, with 15% increase of R² and 8% decrease of RMSE values. These results highlight the importance of integrating climate and topographic covariates along with RS data for improved USV prediction and mapping. 

This study demonstrates the feasibility of large-scale USV prediction using open access Sentinel-1 and 2 data combined with field reference data, and environmental covariates. While SAR and multispectral data provide valuable information, incorporating biophysical and climatic variables substantially enhances model performance. This approach offers a cost-effective and scalable workflow for monitoring USV in boreal forests, benefiting sustainable forest management and biodiversity studies.

How to cite: Mukhopadhyay, R., Brede, B., and Bohlin, I.: Region-wide Prediction of Boreal Understorey Vegetation using Spaceborne Remote Sensing, EGU General Assembly 2026, Vienna, Austria, 3–8 May 2026, EGU26-20765, https://doi.org/10.5194/egusphere-egu26-20765, 2026.

EGU26-21065 | ECS | Orals | BG9.4

Global forest, non-forest and tree crop mapping at 10 m resolution using satellite embeddings 

Daniel Paluba, Adam Todd Hastie, Yarin Tatiana Puerta Quintana, Valerio Marsocci, and Katarína Onačillová

Forests, which cover around one-third of the Earth’s land surface, play a crucial role in climate regulation, the global carbon cycle and biodiversity conservation. Forest-related datasets derived from Earth observation (EO) data often serve as baseline layers in various applications, ranging from biosphere monitoring to policy- and decision-making. However, their accuracy and temporal availability vary across regions and climatic zones, and trees used for agricultural purposes are frequently misclassified as forests. Therefore, there is a need for an accurate, up-to-date, and globally consistent forest cover layer that clearly distinguishes forests from tree crops and is available across multiple years. The current advent of big EO data with a combination of advances in Artificial Intelligence lead to the development of geospatial / EO embeddings as ready-to-use products for local to global applications, including forest monitoring. In this study, we develop a highly accurate global forest/non-forest (F/nF) classification at 10 m spatial resolution, while explicitly classifying tree crops as a sub-class of the non-forest category. Our approach implements Google Alpha Earth Foundation’s Satellite embedding dataset in an automatic training process through simple machine learning approaches, including linear Support Vector Machine (SVM), k-nearest neighbors (kNN) and random forest (RF). Automation is achieved through the generation of training data by intersecting multiple forest-related, land cover, plantation and agroforestry datasets across more than 200 training areas, proportionally representing all global biomes. Classification accuracy is assessed through ~21,000 global F/nF reference samples for the year 2020, complemented by several open-access tree crop and plantation validation datasets for 2019-2021. Our F/nF map for the year 2020 achieves an overall accuracy (OA) of 92% and macro F1-score of 0.91, with balanced omission and commission errors for the forest class of 14% and 13%, respectively. Validation of the tree crop sub-class showed high accuracies with OAs exceeding 90% for oil palm, while additional tree crop classes are still being assessed. Among the evaluated classifiers, both the linear SVM and kNN outperform more complex models, including non-linear SVM variants and fine-tuned RFs. In comparison to other global F/nF layers and widely-used land cover datasets, our F/nF dataset’s performance is better or comparable to these alternatives, while it additionally provides information on tree crops. Moreover, the initial transferability tests demonstrate that the trained models produce accurate and spatially consistent results for the period 2017-2024, showing their strong potential for global multi-year change detection analysis at 10 m spatial resolution. These results can support decision-making for policies and regulations, including the European Union Deforestation Regulation (EUDR). The open-access availability of both the resulting dataset and trained models enables global applicability and encourages further testing, adaptation and development by the EO and forest monitoring communities.

How to cite: Paluba, D., Hastie, A. T., Puerta Quintana, Y. T., Marsocci, V., and Onačillová, K.: Global forest, non-forest and tree crop mapping at 10 m resolution using satellite embeddings, EGU General Assembly 2026, Vienna, Austria, 3–8 May 2026, EGU26-21065, https://doi.org/10.5194/egusphere-egu26-21065, 2026.

EGU26-21076 | ECS | Posters on site | BG9.4

Remote sensing resistance and resilience estimation of a Japanese cedar plantation vs. native broad-leaved trees, in Shuang-lian-Pi forest, after 2015 typhoons. 

Rahmona Belgaïd, Teng-Chiu Lin, Kuan Yu Chen, Guan Bo Huang, and I Bang Yang

Typhoons cross Taiwan almost every year. This study quantifies the impact of two typhoons that passed through a forest located in northeastern Taiwan, near Shuang-lian-pi Lake, in August and September 2015.

The assessment was conducted using remote sensing techniques, specifically the Normalized Difference Vegetation Index (NDVI) and the NDVI ratio calculated with the formula ((NDVIafter_event - NDVIbefore_event) / NDVIafter_event) * 100, in order to evaluate changes in photosynthetic activity before and after the typhoons. SPOT 6, SPOT 7 and Sentinel-2 satellite images, aerial photographs and field validation were used to carry out the analyses.  

The NDVI index showed a decrease of 11% following typhoons Soudelor (08/07/2015) and Dujuan (09/28/2015). According to the NDVI index ratio, the forest recovered from these extreme weather events within 20 months. In addition, a comparison between the photosynthetic responses of conifers (Cryptomeria japonica) which were planted over 100 years ago, and those of native broad-leaves trees showed that Japanese cedars experienced less damage and greater recovery than broadleaved trees in response to the two typhoons.  

Future studies using radar images such as those taken by the sentinel 1 satellite can overcome the difficulties of acquiring cloud-free images before and after typhoons.

How to cite: Belgaïd, R., Lin, T.-C., Chen, K. Y., Huang, G. B., and Yang, I. B.: Remote sensing resistance and resilience estimation of a Japanese cedar plantation vs. native broad-leaved trees, in Shuang-lian-Pi forest, after 2015 typhoons., EGU General Assembly 2026, Vienna, Austria, 3–8 May 2026, EGU26-21076, https://doi.org/10.5194/egusphere-egu26-21076, 2026.

EGU26-21146 | ECS | Posters on site | BG9.4

Leaf-on and leaf-off UAV LiDAR data for stand structure classification of Apennine beech forests 

Mattia Balestra, Federico Giulioni, Federico Fiorani, Fabio Gennaretti, Roberto Pierdicca, Carlo Urbinati, and Alessandro Vitali

Traditional coppicing, followed by progressive abandonment and/or high-forest conversion are shaping the Apennines (Italy) beech forests, frequently exhibiting structural mosaics even at very small scales, making their ground assessment uncertain. Current forest planning requires spatially precise information of their respective stand attributes to set management priorities. In this study, we tested whether UAV-borne LiDAR scanning can accurately map stand attributes and detect the appropriate structures directly from 3D point clouds. Datasets from leaf-on and leaf-off flights were compared and analysed, together with data from ground surveys. The experimental site is a ~35 ha European beech (Fagus sylvatica, L.) previously coppiced forest at 1200 m asl in the Central Apennines (Frontone, Marche region, Italy). We set up 30 circular sampling plots on the ground, where we carried out a full stem inventory and derived plot-level dendrometric variables, including mean tree height, mean DBH and standing timber volume. Plots were clustered into three groups (stored coppice, transition to high forest and high forest) supported by ground-based observations, Principal Component Analysis and k-mean clustering. We also collected two UAV LiDAR datasets (leaf-on in July 2024 and leaf-off in March 2025) using a DJI Matrice 350 RTK equipped with a DJI Zenmuse L2 sensor. We normalized the point clouds heights and different LiDAR predictors were derived from vertical canopy profiles built with 1-m height bins for each inventory plot. We combined standard area-based metrics (height point density percentiles and return fractions) with structural descriptors that quantify canopy stratification, rugosity, openness/continuity and vertical filling. Preliminary results showed that stored coppice and high forest structures are easily distinguished, whereas the diverse stages of coppice-high forest transition are often confused. The UAV-LiDAR area-based regression models achieved solid performance, with a small subset of LiDAR metrics already capturing most of the variance in observed mean tree height (R² = 0.872; RMSE = 1.74 m), mean DBH (R² = 0.845; RMSE = 4.86 cm), and standing timber volume (R² = 0.768; RMSE = 41.67 m³ ha⁻¹). Leaf-off results classified with better accuracy the transition-to-high-forest structure, the mean DBH and standing timber volume, while the mean tree height was better estimated by leaf-on results. The LiDAR leaf-off and leaf-on data fusion slightly improved the stand attribute regression. The study suggests that the canopy-top texture of these beech forest mosaics can be better assessed using leaf-on UAV-borne LiDAR data. Conversely, structural changes and other stand attributes can be more accurately detected using leaf-off data, providing a deeper penetration into the understory and down to the ground. Multi-season UAV-borne LiDAR is a promising approach to accurately map structural mosaics and stand attributes at a spatial resolution relevant for forest management. Future work will focus on refining the data fusion strategy, identify the most informative LiDAR predictors for each classification target, quantify prediction uncertainty and evaluating model transferability across similar beech landscapes. Such developments will support the generation of repeatable, decision-support products, enabling evidence-based forest planning and management.

How to cite: Balestra, M., Giulioni, F., Fiorani, F., Gennaretti, F., Pierdicca, R., Urbinati, C., and Vitali, A.: Leaf-on and leaf-off UAV LiDAR data for stand structure classification of Apennine beech forests, EGU General Assembly 2026, Vienna, Austria, 3–8 May 2026, EGU26-21146, https://doi.org/10.5194/egusphere-egu26-21146, 2026.

EGU26-21293 | ECS | Orals | BG9.4

Drone-based LiDAR reveals behaviour-specific 3D habitat attributes of wild boar (Sus scrofa) in urban-edge forests 

Injae Hwang, Yujin Kim, Dong-Kun Lee, and Seunggyu Jeong

Heavily visited urban-edge forests create frequent encounters between people and wild boar (Sus scrofa), increasing risks to public safety and property. Effective human-wild boar coexistence requires practical management, which in turn depends on understanding how animals use space under human disturbance. Yet despite the prevalence of human-wildlife conflicts in these settings, fine-scale studies of wild boar ecology in urban-edge forests remain scarce. Moreover, habitat assessments have largely relied on coarse, two-dimensional variables, providing limited insight into behaviour-specific microhabitat use.

We investigated whether fine-scale three-dimensional (3D) habitat structure explains wild boar behaviour in a human-dominated forest landscape. Using drone monitoring (Feb–Apr 2025) and drone-based LiDAR mapping (Mar–Apr 2025), we linked boar locations classified as travelling or resting to LiDAR-derived terrain and vegetation structure metrics. We compared environmental conditions between the two behaviours using odds-ratio analysis, then used a resource selection function (RSF) to examine whether travelling locations are predictable from 3D habitat structure.

Travelling and resting occurred in measurably different 3D environments. Travelling was more likely on north-facing terrain and in areas with higher shrub density and canopy cover. When directly compared with travelling, resting sites showed even denser shrub cover and were associated with rougher microtopography, consistent with the use of refuge-like spaces. The RSF results further confirmed that travelling locations are non-random and can be partially explained by 3D habitat features.

Our findings highlight that behaviour-based analyses at fine spatial resolution, enabled by drone-LiDAR, can improve the accuracy and ecological relevance of habitat associations in urban-edge forests. This evidence can support more targeted identification of likely wild boar use areas for conflict mitigation. Future studies should incorporate seasonal and time-of-day variation and explicitly quantify anthropogenic factors (e.g., noise and built structures) to refine behaviour-specific predictions.

How to cite: Hwang, I., Kim, Y., Lee, D.-K., and Jeong, S.: Drone-based LiDAR reveals behaviour-specific 3D habitat attributes of wild boar (Sus scrofa) in urban-edge forests, EGU General Assembly 2026, Vienna, Austria, 3–8 May 2026, EGU26-21293, https://doi.org/10.5194/egusphere-egu26-21293, 2026.

EGU26-21854 | ECS | Posters on site | BG9.4

Urban tree health assessment by using bi-temporal airborne laser scanning 

Aleksi Auvinen, Minna Blomqvist, Mete Ahishali, Iris Starck, and Samuli Junttila

Urban trees are key components of cities’ green infrastructure and sustainable urban planning. Healthy trees provide essential ecosystem services, including air purification, temperature regulation, and biodiversity enhancement. However, trees in urban environments face many stressors such as heat, air pollution, road salt, and limited growing space. Many of these stressors are expected to become more pronounced under climate change. Therefore, cities need efficient methods to assess the health of their trees.  

Remote sensing techniques, such as multitemporal airborne laser scanning (ALS), provide detailed three-dimensional information on tree structure. However, most research has focused on forests, while urban trees have not been studied to a similar extent. In this study, we investigate the potential of multitemporal ALS data to assess urban tree health. By analyzing changes in tree height and crown growth over time, tree health can be inferred using physiological principles, as trees under stress photosynthesize and grow less efficiently than those growing under favorable conditions.  

We used ALS data collected across the entire city of Helsinki during the summers of 2015 and 2024. For each tree, height and canopy area growth were calculated over a nine-year period using a traditional watershed segmentation method, and growth indices were then calculated for each tree by size class and species. ALS-derived tree metrics were integrated with an open geospatial tree register containing information on more than 55,000 urban trees, including diameter at breast height and species. Field reference data from 1,119 visually assessed trees were used to evaluate the accuracy of the ALS-based tree health estimates. Relationships between ALS-derived tree growth metrics and field-based health scores were analyzed using correlation analysis and statistical modelling to assess method performance.  

The results indicate a strong correspondence between ALS-derived growth indices and field-based reference data. Our model performed particularly well in identifying declined trees, with especially strong performance for young and mid-sized trees. Together, these findings demonstrate the potential of ALS data for assessing urban tree health and supporting practical, evidence-based urban planning and decision-making.

How to cite: Auvinen, A., Blomqvist, M., Ahishali, M., Starck, I., and Junttila, S.: Urban tree health assessment by using bi-temporal airborne laser scanning, EGU General Assembly 2026, Vienna, Austria, 3–8 May 2026, EGU26-21854, https://doi.org/10.5194/egusphere-egu26-21854, 2026.

EGU26-22624 | Orals | BG9.4

Uncovering seasonal patterns in European forest disturbance regimes 

Sietse van der Woude, Alba Viana-Soto, Johannes Reiche, Cornelius Senf, Gert-Jan Nabuurs, Frank Sterck, and Martin Herold

We recently implemented Sentinel-1 radar-based weekly, high-resolution (10m pixel spacing) forest disturbance alerts for Europe and processed it for 2020-2025 (Reiche et al., 2021; van der Woude et al., in revision), providing the basis to analyze disturbance seasonality. However, identifying and interpreting seasonal disturbance patterns requires disturbance type information, as seasonal patterns can vary greatly between and within disturbance types (Wohlgemuth et al., 2022). The European Forest Disturbance Atlas (EFDA) is based on Landsat imagery and provides thematically detailed annual maps of forest disturbance, distinguishing between three disturbance types: fire, wind/bark beetle and harvest (Viana-Soto and Senf, 2025).

We analyzed seasonal patterns of forest disturbance across Europe by combining radar-based RADD Europe forest disturbance alerts with optical-based EFDA forest disturbance type information. Disturbance alerts were overlaid with disturbance type maps, aggregated to an ~20 km hexagonal grid, and summarized as mean disturbed area per day of year over a 4.5-year period from January 2020 to June 2024. We characterized disturbance seasonality using three complementary indicators: magnitude, timing, and modality. Seasonal magnitude was quantified using a seasonality index that measures the temporal concentration of disturbed area relative to a uniform distribution. Timing was described by deriving the mean day of year of disturbance occurrence. Modality was defined as the number of seasonal disturbance peaks, distinguishing between uni-, bi-, and multi-peaked patterns.

Our results showed strong contrasts in seasonal disturbance regimes across disturbance types. Fire exhibited the greatest seasonal magnitude, with disturbances primarily occurring during summer months. Wind and bark beetle disturbances were most concentrated in spring, while harvest-related disturbances were more evenly spread throughout the year. Substantial within-type variability was also observed, particularly for harvest, where differences in management practices between countries and regions lead to pronounced spatial variation in timing and a higher prevalence of bi- and multi-peaked seasonal patterns.

We emphasize the benefits of combining radar- and optical-based disturbance products for improved disturbance characterization, allowing for a better understanding of disturbance seasonality, as well as interactions between disturbance types and disturbance sequences. The launch of Sentinel-1C and 1D and the continued availability of optical satellite missions such as Sentinel-2 and Landsat will be crucial in reducing uncertainties in the analysis of forest disturbance seasonality.


Reiche, J., Mullissa, A., Slagter, B., Gou, Y., Tsendbazar, N.E., Odongo-Braun, C., Vollrath, A., Weisse, M.J., Stolle, F., Pickens, A., Donchyts, G., Clinton, N., Gorelick, N., Herold, M., 2021. Forest disturbance alerts for the Congo Basin using Sentinel-1. Environmental Research Letters 16. https://doi.org/10.1088/1748-9326/abd0a8

Senf, C., Seidl, R., 2021. Mapping the forest disturbance regimes of Europe. Nature Sustainability 4, 63–70. https://doi.org/10.1038/s41893-020-00609-y

Van der Woude, S., J. Reiche, J. Balling, G.-J. Nabuurs, F. Sterck, A.-J. Welsink, B. Slagter, and M. Herold  (2025). “Near real-time European forest disturbance alerts using Sentinel-1”. In revision.

Viana-Soto, A., Senf, C., 2025. The European Forest Disturbance Atlas: a forest disturbance monitoring system using the Landsat archive. https://doi.org/10.5194/essd-17-2373-2025

Wohlgemuth, T., Jentsch, A., Seidl, R. (Eds.), 2022. Disturbance Ecology, Landscape Series. Springer International Publishing, Cham. https://doi.org/10.1007/978-3-030-98756-5

How to cite: van der Woude, S., Viana-Soto, A., Reiche, J., Senf, C., Nabuurs, G.-J., Sterck, F., and Herold, M.: Uncovering seasonal patterns in European forest disturbance regimes, EGU General Assembly 2026, Vienna, Austria, 3–8 May 2026, EGU26-22624, https://doi.org/10.5194/egusphere-egu26-22624, 2026.

EGU26-3075 | ECS | Posters on site | BG9.6

Understanding changes in tropical wetlands with remote sensing, machine learning and land surface modleing 

Chandana Pantula, Robert J Parker, Heiko Balzter, Cristina Ruiz Villena, Toby R Marthews, and Khunsa Fatima

Tropical wetlands are among the Earth’s most critical ecosystems, playing a vital role in regulating global water and carbon cycles, buffering extreme weather events, and supporting biodiversity that sustains millions of people. Despite their importance, these ecosystems are highly vulnerable to climate change, and our understanding of their seasonal extent, their role in climate mitigation, and their response to changing climatic conditions remains limited. This lack of knowledge hinders the development of effective climate adaptation strategies and constrains projections of future carbon emissions. To address these gaps, this study and related ongoing work aim to develop an integrated framework that combines multiple methodologies, data sources, and analytical tools to improve the monitoring of surface water inundation in major floodplain systems.

A key component of this framework is understanding the availability, characteristics, and interpretative value of different remote sensing datasets. As a case study, this work focuses on two major wetland systems: the Sudd in South Sudan and the Pantanal in South America. Satellite observation datasets are compiled and categorized into static and dynamic products. The static datasets include GlobCover, GLWDv2 and SWAMP, while the dynamic datasets comprise WAD2M, JRC Global Surface Water (GSW), CYGNSS water mask, and GRACE Total Water Storage. Static datasets are used to assess long-term changes in wetland extent and classification, whereas dynamic datasets capture seasonal variability in wetland extent. Together, these datasets enable comparison between seasonal dynamics and long-term trends, providing improved insight into future projections of wetland extent. The dynamic datasets are projected onto a common grid to assess their consistency and agreement with one another. These datasets are also used to develop a Long Short Term Memory (LSTM) network, capable of capturing both seasonal variability and long-term trends, which is then applied to project future wetland dynamics.

This work represents an important first step towards reducing uncertainty in global wetland mapping. Building on this foundation, the study aims to use the Joint UK Land Environment Simulator (JULES) to simulate wetland extent and hydrological dynamics across selected tropical wetland regions (Sudd, Pantanal). Model simulations are driven by newly developed ancillary inputs, including land cover parameters, soil properties, and topographic information, to assess their influence on simulated wetland extent and seasonal flooding patterns. The resulting JULES outputs are systematically evaluated against EO-based wetland datasets such as GLWDv2, GlobCover, and WAD2M to identify areas of agreement, model sensitivities, and potential sources of bias. Through this comparative analysis, the study benchmarks the capability of the JULES land surface model to represent tropical wetland dynamics and provides insights into optimal data configurations for large-scale wetland modelling.

As the project develops, machine learning approaches are further applied to forecast wetland dynamics and to inform improvements in the representation of wetlands within climate models. Ultimately, this integrated modelling and data-driven framework aims to contribute to more reliable climate predictions and to provide decision-makers with clearer, evidence-based information for climate adaptation and mitigation planning.

How to cite: Pantula, C., J Parker, R., Balzter, H., Ruiz Villena, C., R Marthews, T., and Fatima, K.: Understanding changes in tropical wetlands with remote sensing, machine learning and land surface modleing, EGU General Assembly 2026, Vienna, Austria, 3–8 May 2026, EGU26-3075, https://doi.org/10.5194/egusphere-egu26-3075, 2026.

Peatland condition is a key indicator of ecosystem integrity and carbon storage potential, making reliable monitoring of degradation processes essential at regional to national scales. Mire breathing—the cyclic surface motion driven by hydrological dynamics—serves as an important proxy for peatland degradation. Drained or degraded peatlands typically exhibit weak oscillatory behaviour combined with persistent subsidence trends, whereas near-natural peatlands show pronounced seasonal surface dynamics. Quantifying peatland subsidence therefore provides a structural indicator for assessing peatland condition and its implications for carbon storage dynamics and greenhouse gas emissions.

In this study, interferometric time-series analysis based on Sentinel-1 Synthetic Aperture Radar (SAR) data was applied to monitor large-scale peatland subsidence using a Small Baseline Subset (SBAS) approach implemented in MintPy. Additionally, hourly Radolan precipitation data were integrated to relate subsidence dynamics to hydrological forcing, and first in-situ measurements from extensometers were used to capture actual ground motion. The analysis covers peatlands across the federal state of Mecklenburg-Vorpommern (north-eastern Germany) for the period 2017–2024 and demonstrates a scalable monitoring framework applicable to national peatland inventories.

The results reveal pronounced spatiotemporal subsidence patterns across the study region. At three representative sites, mean subsidence rates range from −4.3 to −9.6 cm yr⁻¹ in line of sight (LOS). In addition, distinct site-specific mire breathing signals were identified, with seasonal amplitudes between 5 and 15 cm (LOS). The time series show enhanced subsidence during summer months and partial surface recovery during wetter periods, highlighting the strong control of hydrological conditions on peatland surface dynamics.

Overall, the findings demonstrate the capability of SBAS-based InSAR time-series analysis to capture both long-term subsidence trends and short-term oscillatory responses in peatlands. Comparison with in-situ extensometer measurements confirms the validity of the remote-sensing-derived deformation signals. This supports large-scale peatland mapping and monitoring efforts and provides a remote-sensing-based component relevant for greenhouse gas accounting and monitoring, reporting and verification (MRV) frameworks. Future work will focus on improving methodological robustness and validating the InSAR-derived deformation signals using in-situ subsidence measurements.

This research was funded by the Deutsche Forschungsgemeinschaft (DFG, German Research Foundation) under Project-ID 531801029 (TRR 410).

How to cite: Pienkoß, L. and Marzahn, P.: Assessing mire breathing patterns across Mecklenburg Vorpommern, Germany using a Sentinel-1 SBAS approach, EGU General Assembly 2026, Vienna, Austria, 3–8 May 2026, EGU26-4912, https://doi.org/10.5194/egusphere-egu26-4912, 2026.

EGU26-5027 | ECS | Orals | BG9.6

Decade Dynamic Monitoring of Exotic Mangroves in Guangdong Province 

Yanjun Liu and Huabing Huang
Sonneratia apetala (S. apetala) and Laguncularia racemosa (L. racemosa) are typical exotic mangrove species in Guangdong Province, China. Their rapid spread brings potential invasive risks to the ecological balance and biodiversity of native mangrove ecosystems. Thus, accurately quantifying their distribution changes over the past ten years is key to regional ecological conservation and coastal zone management.
To tackle the classification problems caused by medium-low resolution remote sensing imagery and small-sample datasets, this study develops a hybrid spatio-temporal dual-channel (HSTD) method. This method integrates temporal and spatial feature information, which allows for accurate classification and dynamic monitoring of these two exotic mangrove species in Guangdong Province.
The experimental results show that the HSTD method significantly improves the classification performance for exotic mangroves, with an Intersection over Union (IoU) of 0.739. Its overall accuracy (OA) is 3.8% higher than that of standalone deep learning models and 9.7% higher than traditional machine learning models. Notably, compared with similar products, the proposed model can identify L. racemosa and scattered S. apetala patches more comprehensively.
In 2025, the total area of S. apetala in Guangdong Province reached 3509.13 ha, while that of L. racemosa was 81.01 ha. The two species showed an asymmetric overlapping distribution pattern. From 2016 to 2025, both exotic mangrove species presented an overall expanding trend: S. apetala had a cumulative area growth of 3.5%, while L. racemosa achieved an annual average growth rate of 5.4%—2.6 times that of S. apetala.
This study clarifies the spatio-temporal evolution patterns of S. apetala and L. racemosa in Guangdong Province, and provides important technical support and decision-making basis for the differentiated management and control of local exotic mangrove species.

How to cite: Liu, Y. and Huang, H.: Decade Dynamic Monitoring of Exotic Mangroves in Guangdong Province, EGU General Assembly 2026, Vienna, Austria, 3–8 May 2026, EGU26-5027, https://doi.org/10.5194/egusphere-egu26-5027, 2026.

EGU26-5347 | Orals | BG9.6

Expansion of aquatic vegetation in northern lakes amplified methane emissions 

Liu Jinying, Huang Huabing, and Hou Xuejiao

Aquatic vegetation contributes to lake methane emissions, but changes in aquatic vegetation in northern (>40° N) lakes remain unknown, hindering evaluations of its importance in estimating lake emissions. Here we use Landsat imagery to monitor aquatic vegetation (mainly emergent and floating vegetation) in 2.7 million northern lakes from 1984 to 2021. Vegetation was observed in 1.2 million lakes, with a total maximum vegetation area of 12.0 × 104 km2, a mean vegetation occurrence of 1.68 ± 3.8% and a greenness of 0.66 ± 0.05. From the 1980s–1990s to 2010s, significant (P  < 0.05) increases in maximum vegetation area (+2.3 × 104 km2) and vegetation occurrence (+73.7%) were observed and 72.5% of lakes experienced higher greenness. Vegetation expansion was affected by the temperature in sparsely populated regions, whereas lake area and fertilizer usage played vital roles in densely populated areas. The methane emission estimate that includes contributions from both aquatic vegetation and open water (1.31 [ 0.73, 1.89] Tg CH4 yr−1) is 13% higher than that calculated for open water (1.16 [0.63, 1.68] Tg CH4 yr−1). The long-term net increase in total methane emissions including aquatic vegetation is 125% higher than that of open water due to vegetation expansion. This highlights the necessity of incorporating aquatic vegetation in estimates of methane emissions from northern lakes.

How to cite: Jinying, L., Huabing, H., and Xuejiao, H.: Expansion of aquatic vegetation in northern lakes amplified methane emissions, EGU General Assembly 2026, Vienna, Austria, 3–8 May 2026, EGU26-5347, https://doi.org/10.5194/egusphere-egu26-5347, 2026.

EGU26-10244 | Posters on site | BG9.6

Assessing Peat Surface Motion using Interferometric Synthetic Aperture Radar (InSAR) in The Great Fen Area of Cambridgeshire, UK  

Abdou Khouakhi, Abhishek Patil, Nicholas Girkin, and Ian Holman

Peatland degradation is a critical global climate issue, releasing millions of tonnes of CO₂ annually due to drainage and changes in land use. As countries strive to meet net-zero targets, restoring degraded peatlands has become a priority for carbon sequestration and biodiversity conservation. However, monitoring peatland recovery remains a challenge, especially for large-scale restoration projects. This research is driven by the need for low-cost validation of peatland re-wetting schemes, enabling robust monitoring of peat physical condition and hydrological recovery, with implications for carbon accounting and agriculture’s contribution to net-zero targets. This study addresses this gap by applying remote sensing data from Interferometric Synthetic Aperture Radar (InSAR) to track peat surface motion in Cambridgeshire's Great Fen, one of the UK’s largest lowland peatland restoration initiatives. Sentinel-1 InSAR data (2015–2025) were used to quantify ground motion and derive deformation-based proxies for peat carbon flux. Our analysis revealed distinct subsidence patterns for undrained, early-restored, and later-restored farms, enabling first-order, deformation-based carbon flux estimation under common parameter assumptions. Early-restored farms experienced subsidence rates of up to 1.17 cm/year and deformation-associated carbon flux proxies of 14.50 tons CO₂/ha/year, compared to 1.40 cm/year and 17.37 tons CO₂/ha/year in later-restored sites. National Nature Reserves (Holme Fen and Woodwalton), which remained undrained, recorded the lowest subsidence (~0.48 cm/year) and lowest deformation-associated carbon loss proxy (5.98 tons CO₂/ha/year), linked to restoration timelines and peat moisture regimes. These estimates, interpreted as relative indicators rather than direct measurements of net ecosystem carbon balance, demonstrate InSAR’s utility for tracking peatland condition and relative peat carbon vulnerability across restoration timelines. Seasonal fluctuations aligned with soil moisture and precipitation anomalies, indicating a strong hydrological control on peat surface motion. Together, these findings show that InSAR provides a high-resolution, cost-effective tool for continuous monitoring of peatland physical dynamics, supporting comparative assessment of restoration outcomes and climate-relevant land management decisions.

How to cite: Khouakhi, A., Patil, A., Girkin, N., and Holman, I.: Assessing Peat Surface Motion using Interferometric Synthetic Aperture Radar (InSAR) in The Great Fen Area of Cambridgeshire, UK , EGU General Assembly 2026, Vienna, Austria, 3–8 May 2026, EGU26-10244, https://doi.org/10.5194/egusphere-egu26-10244, 2026.

EGU26-11461 | Orals | BG9.6

Framework for assessing wetland blue carbon provision through remote sensing and modelling  

A. Rita Carrasco, Katerina Kombiadou, Inês Carneiro, João Duarte, and Ana Matias

This study presents a comprehensive framework for assessing current and future ecosystem services in coastal wetlands, by integrating satellite image classification with simplified predictive modelling. The research was conducted in Ria Formosa, one of Portugal's most important coastal lagoons. Hard classification and soft regression Random Forest algorithms were employed to estimate the fractional coverage of marsh zones in 2025, with the former applied to very high-resolution satellite data (Worldview-3, with metric pixel size) and the latter to high and medium-resolution satellite imagery (PlanetScope and Sentinel-2, with metric to decametric pixel sizes). The results provide valuable insights into the challenges associated with variable satellite sources for automated mapping of ecological succession. Future projections up to 2100, informed by land cover change simulations from the SLAMM model, investigated potential ecological trajectories under sea-level rise (SLR) scenarios. Ecosystem adjustments to SLR were further translated into estimates of future blue ecosystem services (i.e., organic carbon stocks), based on reference values reported in the literature. Under the IPCC SSP5-8.5 pathway, significant transitions were projected, including relevant portions of present-day high marshes converting to low marsh, low marshes transforming into tidal flats, and tidal flats devolving into subtidal bare sediment. The modelling framework suggests that coastal squeeze will lead to a meaningful decline in salt marsh extent. The projected ecogeomorphologic adjustments to SLR allowed for pinpointing vegetated areas of gains and losses in carbon stocks by 2100. Foreseen changes will have key implications for the ecological balance of these wetlands, as the significant loss of high marsh habitat may compromise the ecological succession functioning and potentially lead to a decline in biodiversity within these zones. The integrative approach employed, which combines remote sensing and simplified modelling, offers crucial insights into the dynamics and resilience of wetland ecosystemsunder SLR conditions, supporting informed management and conservation efforts in the face of environmental changes.

Acknowledgements: This study contributes to the projects C-Land (CEXC/4647/2024), SYREN (ALGARVE-FEDER-00853600-SYREN-17135), and DEVISE (2022.06615.PTDC), funded by the Fundação para a Ciência e a Tecnologia, as well as to the CLARKS project (CLARKS - 2024-1-ES01-KA220-SCH-000246633) under ERASMUS+ 2024, and to RestLands (ID 705677) funded by Planet Labs.

How to cite: Carrasco, A. R., Kombiadou, K., Carneiro, I., Duarte, J., and Matias, A.: Framework for assessing wetland blue carbon provision through remote sensing and modelling , EGU General Assembly 2026, Vienna, Austria, 3–8 May 2026, EGU26-11461, https://doi.org/10.5194/egusphere-egu26-11461, 2026.

EGU26-11704 | ECS | Posters on site | BG9.6

Satellite observed rapid inland aquaculture expansion in Jianghan Plain, China from 2016 to 2022 

Chen Wang, Jinwei Dong, Yan Zhou, Yifeng Cui, Xi Chen, Yuanyuan Di, Xiangming Xiao, and Geli Zhang

Inland freshwater aquaculture which includes a new crop-aquaculture system accounts for 77 % of aquaculture production worldwide and contributed significantly to the global demand for fish products. Previous aquaculture monitoring efforts, however, mainly focused on coastal aquaculture ponds and hardly covered inland freshwater aquaculture areas. Here, based on the time-series Sentinel-1 and 2 data and the Google Earth Engine (GEE) platform, we developed a hierarchical framework for mapping inland freshwater aquaculture with different aquaculture types (both aquaculture ponds and rice-crayfish fields) in the Jianghan Plain (JHP), one of the most important inland freshwater aquaculture regions in China. First, we constructed two phenological temporary windows (T1 and T2) and used an automatic threshold extraction method (OTSU approach) to generate potential aquaculture layers in both two temporary windows. Second, based on the potential aquaculture layer in T1, the actual aquaculture was further distinguished from other water bodies (e.g., lakes, rivers, and ditches) by combining spectral and texture features and utilizing a random forest classifier from 2016 to 2022. Finally, by the differences in variations in aquaculture ponds and rice-crayfish fields in T1 and T2, we generated annual 10m maps of fine aquaculture area in the Jianghan Plain from 2017 to 2022, with overall accuracies (OA) of 87.5 %–98.7 % and Kappa coefficients of 0.81–0.98. We found a significant increase in the total aquaculture area in  the JHP, from 2266 ± 66 km2 in 2016 to 4766 ± 111 km2 in 2022, with rice-crayfish fields contributing the most, mainly related to a series of stimulus policies. This study proposed a novel framework for monitoring complex inland freshwater aquacultures over large areas and revealed the rapid expansion of inland aquaculture in South China.

How to cite: Wang, C., Dong, J., Zhou, Y., Cui, Y., Chen, X., Di, Y., Xiao, X., and Zhang, G.: Satellite observed rapid inland aquaculture expansion in Jianghan Plain, China from 2016 to 2022, EGU General Assembly 2026, Vienna, Austria, 3–8 May 2026, EGU26-11704, https://doi.org/10.5194/egusphere-egu26-11704, 2026.

EGU26-13089 | Orals | BG9.6 | Highlight

Modelling Carbon and Groundwater in Peatlands using Alpha Earth Embeddings 

Julian Koch, Tanja Denager, Simon Stisen, Mogens H. Greve, Anders B. Møller, and Amélie M. Beucher

Spatially explicit knowledge of soil organic carbon and groundwater variability in peatlands is essential to support climate action, such as planning and implementing restoration projects. Geospatial machine learning is a key tool to obtain such knowledge at high spatial resolution, based on linking maps of explanatory variables with point information to train regression or classification models. Explanatory variables are usually identified through expert knowledge and derived from satellite remote sensing, digital elevation models or maps of soil types or land use. Identifying and processing relevant explanatory variables at large scale is non-trivial and cumbersome.

Geospatial foundation models, such as Google’s Alpha Earth change how satellite data and other geospatial data can be utilized in downstream machine learning tasks. Such models provide analysis-ready unified layers, i.e. embeddings, that are semantically rich representations capturing the underlying input data. In the case of Alpha Earth, input data cover archives of Sentinel-1 and Sentinel-2 as well as other geospatial data sources.

In the present study we introduce Alpha Earth embeddings into the modelling of soil organic carbon and groundwater across Danish peatlands at 10 m resolution. We use existing datasets and models of the two variables to benchmark the potential of foundation models for low-barrier large-scale modelling. The models trained against solely Alpha Earth embeddings are contrasted with models trained against explanatory variables selected through expert knowledge as well as with hybrid models combining basic topographical variables with Alpha Earth embeddings.

The Alpha Earth model of soil organic carbon produces meaningful spatial patterns while having a 6% decrease in performance (RMSE) with respect to the expert model. The true positive rate to predict peaty and peat soils is 0.68 and 0.65 for the expert and Alpha Earth model, respectively. The hybrid model increases the performance slightly with respect to the Alpha Earth model and all models achieve very comparable result of mapping the overall peat extent.   

The Alpha Earth model predicting groundwater has a 3% performance decrease with respect to the expert model (RMSE). When introducing synthetic training data for drained and wet conditions to the groundwater model, the Alpha Earth model shows limited performance. However, the hybrid model can utilize the synthetic data in a more meaningful way and achieves satisfactory results with respect to performance and spatial patterns.

In addition, we carry out feature importance analysis to explain the Alpha Earth embeddings, which is clear limitation in the usage of foundation models, where explainability is typically not provided.   

How to cite: Koch, J., Denager, T., Stisen, S., Greve, M. H., Møller, A. B., and Beucher, A. M.: Modelling Carbon and Groundwater in Peatlands using Alpha Earth Embeddings, EGU General Assembly 2026, Vienna, Austria, 3–8 May 2026, EGU26-13089, https://doi.org/10.5194/egusphere-egu26-13089, 2026.

EGU26-13982 | ECS | Orals | BG9.6

Sentinel-1 reveals the dynamics of surface water connectivity across European wetlands 

Abigail Robinson and Fernando Jaramillo

Wetland restoration in Europe under the EU Nature Restoration Law prioritises the recovery of surface water connectivity. However, our understanding of how water moves and connects in European wetlands remains limited, hindering effective restoration and monitoring. To address this, we first analysed changes in surface water extent across ~50 European Ramsar wetlands from 2015 to 2024 using Sentinel-1 data. Second, we developed a novel set of surface water connectivity metrics describing how water bodies emerge, merge, fragment, and persist through time. Quantification of these metrics revealed that ~80% of wetlands exhibit highly variable and unpredictable connectivity patterns across years. While surface water extent generally followed seasonal cycles, the timing of water-body merging and fragmentation diverged from water extent trends in many wetlands. In northern European wetlands, surface water connectivity was stable and predictable across years and closely linked to temperature and precipitation, reflecting strong seasonality and snowmelt regimes. In contrast, many central European wetlands showed irregular connectivity, with large interannual variability in water extent and connectivity often decoupled from simple seasonal wet–dry cycles. These patterns are likely shaped by the interaction of erratic temperature and precipitation, large upstream catchments, and human-modified floodplains. Our results demonstrate how satellite-based monitoring of surface water connectivity can be used to identify distinct hydrological regimes and evaluate future restoration efforts. Furthermore, given the strong heterogeneity in surface water connectivity across Europe, we suggest that restoration should not be evaluated using static extent-based indicators alone, but rather with multitemporal connectivity metrics that reflect how water actually moves and reorganises within wetlands.

How to cite: Robinson, A. and Jaramillo, F.: Sentinel-1 reveals the dynamics of surface water connectivity across European wetlands, EGU General Assembly 2026, Vienna, Austria, 3–8 May 2026, EGU26-13982, https://doi.org/10.5194/egusphere-egu26-13982, 2026.

EGU26-14452 | Posters on site | BG9.6

Quantifying mass loss in raised bogs and heathlands in the central-northern United Kingdom from satellite-geodetic uplift rates 

Sabrina Metzger, Robert Dill, Volker Klemann, Torsten Sachs, and Atikah Zahra

Since decades, even centuries, blanket and raised bogs in the central-northern United Kingdom have been exposed to climatic and anthropogenic stressors like drainage, land management, evapotranspiration, peat extraction and/or atmospheric pollution. As a result, those landscapes undergo substantial mass changes and soil compaction, but the quantification of these processes remains a challenge: In-situ observations are cost-extensive and/or often biased due to an unstable local measurement reference.

To overcome this, we analyze remotely-sensed surface uplift rates from the European Ground Motion Service (EGMS) that were extracted from four years (2019-2023) of radar-interferometric (InSAR) time-series. We also consulted point-wise uplift rates from two decades of positioning (GNSS) measurements to reference ongoing bedrock uplift. We validate these observations with analytical models that mimic a the load response while also accounting for a remaining glacial isostatic adjustment.

The surface rate maps show ~50 km-wide uplift bulges that correlate with land classified as heathlands and bogs. Maximum uplift surrounding the heather/bogs reaches 2-7 mm/yr. The bogs/heathlands themselves, however, exhibit distinct subsidence due to mass loss (carbon, water) of up to 10 mm/yr, which is already corrected for the simultaneous bedrock uplift due to unloading. Based on these observations, we can reproduce the spatial bedrock uplift pattern with our load model. The explanation of the signal amplitudes requires further fine-tuning of the model parameters and a better understanding of the in-situ bio-chemical processes. This approach will enable us to quantify the amount of water-vs.-carbon loss in this particular landscape.

How to cite: Metzger, S., Dill, R., Klemann, V., Sachs, T., and Zahra, A.: Quantifying mass loss in raised bogs and heathlands in the central-northern United Kingdom from satellite-geodetic uplift rates, EGU General Assembly 2026, Vienna, Austria, 3–8 May 2026, EGU26-14452, https://doi.org/10.5194/egusphere-egu26-14452, 2026.

The invasion and subsequent removal of Spartina alterniflora in recent years have induced pronounced changes in landscape patterns and ecological processes of China’s coastal wetlands. Long-term and continuous remote sensing monitoring of its dynamics is therefore of considerable scientific and management importance. However, long-term wetland monitoring based on multi-source remote sensing data commonly faces several challenges, including inconsistencies in temporal information caused by asynchronous image acquisition, limited and unstable training samples, and pronounced spatial noise resulting from highly fragmented wetland landscapes. These issues constrain the stability and reliability of long-term classification results. To address these challenges, a spatiotemporal-context-enhanced multi-source remote sensing time-series (SCE-TS) is proposed. First, phenological dynamics from different sensors are preserved through feature-level joint modeling, avoiding phenological distortions introduced by forced temporal alignment. Subsequently, representative and stable temporal prototypes are extracted through repeated feature selection and clustering of local temporal features, and combined with feature enhancement strategies to improve the representation of class-specific temporal characteristics under limited sample conditions. Furthermore, spatial neighborhood convolution is incorporated during feature construction to integrate temporal information from the central pixel and its surrounding neighbors, thereby mitigating the effects of mixed pixels and pixel-level temporal instability. Finally, an improved cascade forest model is employed for classification and mapping. The Yellow River Delta (YRD) and Yancheng wetlands (YC), characterized by distinct geographic settings and landscape structures, were selected as study areas. Using 602 Sentinel-1 and Sentinel-2 images, wetland classification map was generated for the period from 2016 to 2025. Experimental results show that the proposed method achieves overall accuracies of 95.02% in the YRD and 94.48% in the YC, while maintaining stable classification performance across multiple years. Long-term monitoring results further indicate that the removal of Spartina alterniflora has promoted the recovery of wetland vegetation structure; however, post-removal wetland ecosystems still exhibit complex dynamics in terms of wetland area and carbon storage. Overall, the proposed method provides a robust framework for evaluating invasive species management and supporting sustainable wetland ecosystem monitoring.

How to cite: Wang, Z., Liu, Y., Wang, L., Zhao, J., and Lu, Z.: Long-Term Coastal Wetland Mapping Using SCE-TS: A Spatiotemporal-Context-Enhanced Multi-Source Remote Sensing Time-Series Approach, EGU General Assembly 2026, Vienna, Austria, 3–8 May 2026, EGU26-15636, https://doi.org/10.5194/egusphere-egu26-15636, 2026.

EGU26-16084 | ECS | Posters on site | BG9.6

Soil Moisture Correlation with Small Water Body Extents in Canadian Wetlands: Application to SMAP Soil Moisture Improvement 

Yasaman Amini, Koreen Millard, Aaron Berg, Elyn Humphreys, and Murray Richardson

Wetlands are among the most hydrologically dynamic ecosystems, particularly across northern boreal and subarctic regions of Canada, where seasonal freeze-thaw cycles and precipitation variability drive pronounced fluctuations in surface water and soil moisture. These landscapes play a critical role in carbon storage, ecosystem functioning, and regional hydrology, yet their remoteness severely limits the availability of long-term in situ soil moisture observations. Consequently, satellite-based microwave remote sensing has become an essential tool for monitoring wetland hydrological dynamics at large spatial scales.

NASA’s Soil Moisture Active Passive (SMAP) mission provides global soil moisture estimates at a coarse spatial resolution (~36 km). However, retrieval performance declines significantly in wetland-dominated regions due to the mixed influence of open water, saturated soils, and vegetation within a single footprint. This mixture complicates the interpretation of passive microwave brightness temperatures and increases uncertainties in soil moisture products. Improving SMAP performance in these environments requires a better understanding of how water dynamics influence the satellite signal.

In northern Canadian wetlands, small surface water bodies such as shallow ponds, ephemeral pools, and saturated depressions exhibit substantial seasonal variability, especially during snowmelt and early summer. Although individually below SMAP’s resolution, their aggregated extent may substantially affect observed brightness temperatures and mimic soil moisture variability. This study investigates whether temporal changes in small surface water extent can serve as a proxy for soil moisture variations within SMAP footprints.

We analyzed the relationship between in situ soil moisture, SMAP brightness temperatures, and surface water extent across two wetland regions: the Attawapiskat River (CA-ARB and C-ARF) and the Kinosheo Lakes (CA-KLP). Soil moisture data from eddy covariance flux towers (2017-2021) were used for snow- and ice-free periods (June-October). Small surface water bodies were mapped using Sentinel-1 SAR imagery and the Canadian Digital Elevation Model (CDEM) data through a random forest classification approach, then aggregated to the SMAP footprint scale for analysis.

Results show strong correlations between in situ soil moisture and surface water extent (r > 0.58), as well as between surface water extent and SMAP brightness temperatures (r > 0.77). These findings indicate that surface water dynamics capture spatially representative hydrological variability within SMAP pixels and help address scale-mismatch issues between point in situ measurements and coarse satellite products. The study demonstrates the potential of surface water extent as a proxy variable to support calibration, validation, and future improvement of SMAP soil moisture retrievals in wetland-dominated regions.

How to cite: Amini, Y., Millard, K., Berg, A., Humphreys, E., and Richardson, M.: Soil Moisture Correlation with Small Water Body Extents in Canadian Wetlands: Application to SMAP Soil Moisture Improvement, EGU General Assembly 2026, Vienna, Austria, 3–8 May 2026, EGU26-16084, https://doi.org/10.5194/egusphere-egu26-16084, 2026.

EGU26-16380 | Posters on site | BG9.6

WetSAT-ML: A Machine Learning Framework for Mapping Wetland Flooding Dynamics using Sentinel-1 Observations 

Sebastián Palomino-Ángel, Carlos Méndez, David Zamora, Tania Santos, Satish Prasad, and Thanapon Piman

Wetlands contribute to human well-being in multiple ways. These contributions take various forms, including goods such as food and other raw materials, but also through services like carbon sequestration, flood and climate regulation. Despite their importance, wetlands are being lost at annual rates exceeding 0.5% of their global extent over the past sixty years, mainly due to conversion to other land uses. Several multilateral agendas emphasize the importance of wetland monitoring and protection; however, progress toward established targets remains limited by the lack of consistent national datasets and operational monitoring tools. Satellite observations provide globally consistent data that enable systematic wetland monitoring. In particular, synthetic aperture radar (SAR) has been successfully used for mapping wetland flooding dynamics due to their all-weather acquisition capability and the ability to identify below canopy inundation processes. The increasing availability from current and planned SAR missions poses an opportunity to advance space-based wetland monitoring, but their operational implementation requires the development of flexible and scalable frameworks.

This study aims to develop WetSAT-ML, a satellite-based machine learning (ML) framework for mapping wetland flooding dynamics and trends using Sentinel-1 SAR data. The approach combines radar features with supervised and unsupervised ML classification algorithms, to distinguish different inundation categories, including open water, vegetated water, and land. Random Forest and K-means models were trained using two training and validation areas in the South Florida Everglades (USA) and the lower Atrato River Basin (Colombia). These sites were selected considering their wetland variability and the availability of reference data. The first version of the models was trained using all available Sentinel-1 observations from 2024 over the selected regions, capturing the full hydrological seasonality. Reference training and validation datasets included gauge measurements and manually annotated data for both regions. The trained WetSAT-ML models are being evaluated through a proof of concept across five wetland systems in South Asia and South America, including the Meghna River wetlands in Bangladesh; the Atrato River, Ayapel, and Barbacoa wetlands in Colombia; and the Pantanal wetlands spanning the Brazil–Bolivia border. The test sites represent a wide range of hydroclimatic conditions, geomorphological settings, and vegetation cover.

Preliminary results indicate that WetSAT-ML consistently captures spatial patterns and intra-annual inundation dynamics that are coherent with the known hydrological regimes of the test regions. Cross-site comparisons reveal clear differences in key hydroperiod parameters related to inundation persistence, seasonal amplitude, and ecosystem connectivity. Overall, the results provide a foundation for operational wetland monitoring applications. WetSAT-ML is open access, and the first public version is available in a GitHub repository: https://github.com/sei-latam/WETSAT_v2. The next steps of the research will focus on cross-validation using independent datasets and expanding the training database across additional wetland areas.

How to cite: Palomino-Ángel, S., Méndez, C., Zamora, D., Santos, T., Prasad, S., and Piman, T.: WetSAT-ML: A Machine Learning Framework for Mapping Wetland Flooding Dynamics using Sentinel-1 Observations, EGU General Assembly 2026, Vienna, Austria, 3–8 May 2026, EGU26-16380, https://doi.org/10.5194/egusphere-egu26-16380, 2026.

Emergent wetlands occupy the transitional zone between permanent wetlands and upland environments and provide a range of ecosystem services. These services strongly depend on inundation patterns and vegetation dynamics, which are often difficult to monitor using in-situ approaches due to limited accessibility, dense vegetation, and the need to minimise disturbance, particularly in protected areas. Remote sensing offers an effective means to overcome these constraints by providing consistent information over large areas in a timely and cost-efficient manner. Synthetic aperture radar (SAR), in particular, is well suited due to its sensitivity to water occurrence beneath vegetation canopies. In emergent wetlands, double-bounce scattering of the radar waves between standing water and vertical vegetation components typically results in elevated backscatter and coherence compared to other land-surface types. However, this response is influenced by several factors, including radar wavelength, vegetation structure, and water level. We analyse time series of Sentinel-1 backscatter intensity and coherence with the goal of characterising inter and intra-annual variations in surface water extent between 2015 and 2025. We interpreted the SAR-derived metrics using a comprehensive reference dataset including water level, high-resolution imagery from unmanned aerial vehicles, meteorological data and vegetation indices. The study was conducted at a long-term ecosystem research site at the shallow, subsaline Lake Neusiedl, located in the Pannonian lowlands of Eastern Austria. The lake is a Ramsar site of international importance due to its ecological significance, particularly for breeding and migratory birds. More than half its surface is covered by one of the largest continuous reed belts in Europe, dominated by Phragmites australis. During spring, the reed belt shows a clear double-bounce signature whereas in summer, high vegetation and declining water levels lead to a decrease in backscatter and coherence. During a prolonged drought period, which lasted from 2019 to 2022, water extent at Lake Neusiedl decreased significantly followed by a marked recovery starting in 2023. Our results showcase both potential and limitations of water extent retrieval in emergent wetlands based on C-band SAR data and hold important lessons for future wetland monitoring using data acquired at longer wavelengths by SAR missions, such as NISAR and ROSE-L. In addition, the observed coherence patterns offer initial indications of the potential for retrieving wetland water level changes using SAR interferometry.

How to cite: Schlaffer, S., Dorninger, P., and Qiu, S.: Sentinel-1 SAR backscatter and coherence patterns during dry and wet periods at a large emergent wetland in the Pannonian lowlands, EGU General Assembly 2026, Vienna, Austria, 3–8 May 2026, EGU26-17935, https://doi.org/10.5194/egusphere-egu26-17935, 2026.

EGU26-18201 | Orals | BG9.6

Space Monitoring of Wetlands for Climate Solutions – the Global Wetland Center initiative 

Stephanie Horion, Paul Senty, Gyula M. Kovacs, Laura Van der Poel, Sarah Franze, Nico Lang, Cecile M.M. Kittel, Christian Tøttrup, Rasmus Fensholt, and Guy Schurgers

Although covering a small fraction of Earth’s surface, wetlands play an important role in the global carbon cycle. They store about 35 percent of terrestrial carbon and have a high capacity for carbon sequestration and long-term retention. However, because the high water table in wetlands often creates anaerobic conditions, they can also emit greenhouse gases (GHG) such as methane and nitrous oxide. When drained, cleared or otherwise disturbed, large amounts of stored organic carbon can be released into the atmosphere as carbon dioxide.

Recent Earth Observation satellite systems such as Sentinels, SWOT or Planet provide new ways to map and capture wetland dynamics at high spatial and temporal resolutions. In combination with earlier missions (e.g., Landsat, PALSAR), they can provide essential information in support of modelling wetland hydrology and biochemistry. At the Global Wetland Center we leverage these multiple satellite systems and sensors to improve global accounting of GHG emissions for wetlands. Our vision is to extend wetland mapping based on categorizations relevant for GHG estimation with continuous priority variables and drivers that can inform about the spatial and temporal dynamics of GHG emissions. Furthermore, making use of differential programming, modern computer vision and knowledge-guided machine learning forced by EO and in-situ observation, we also work towards a better understanding of how management and disturbances (e.g., land conversion, fire, restoration) affect GHG dynamics.

Reducing the uncertainty of the global greenhouse gas budget of wetlands is an ambitious endeavour. The Global Wetland Center started contributing to this grand objective by leveraging methods for large-scale high-resolution mapping of wetland types and of flooded forest extent and inundation frequency. We used machine learning with Sentinel-1, Sentinel-2, and ancillary data to produce a 10-m wetland-type map across Europe, supporting wetland restoration. We also mapped seasonal dynamics of water beneath the forest canopy in the Amazon and Congo basins taking advantage of multi-year SAR data and virtual altimetry stations. Other activities at the GWC focus on using EO to calibrate catchment scale hydrological models in tropical wetlands where in situ data is scarce.

Together, these research activities aim to deliver new observation-driven insights into wetland processes that can directly support improved modelling of greenhouse gas emissions, reducing uncertainties in emission estimates and strengthening the scientific basis for wetland management and climate change mitigation.


More information: https://globalwetlandcenter.ku.dk

Acknowledgement: The Global Wetland Center is funded by the Novo Nordisk Foundation (grant NNF23OC0081089).

How to cite: Horion, S., Senty, P., Kovacs, G. M., Van der Poel, L., Franze, S., Lang, N., Kittel, C. M. M., Tøttrup, C., Fensholt, R., and Schurgers, G.: Space Monitoring of Wetlands for Climate Solutions – the Global Wetland Center initiative, EGU General Assembly 2026, Vienna, Austria, 3–8 May 2026, EGU26-18201, https://doi.org/10.5194/egusphere-egu26-18201, 2026.

EGU26-18588 | ECS | Orals | BG9.6

Monitoring Freshwater Ramsar Wetlands in Thailand Using Integrated Sentinel-1 SAR and Sentinel-2 Optical Observations 

Satish Prasad, Talengi Kasambara, Ridhi Saluja, and Thanapon Piman

Systematic wetlands monitoring is crucial for informed management, timely conservations actions and consistent temporal reporting. Recent global wetland assessments show that Southeast Asia is losing wetlands at faster than rest of world, with the floodplain wetlands declining by about 1.2% per year, primarily due to agricultural conversion. Thus, making wetlands monitoring and reporting crucial. The national wetland inventory of Thailand, last complied in 2002, requires an update. In this context, the present study introduces a satellite-based Wetland Monitoring Tool (WMT) for assessing five freshwater Ramsar wetlands in Thailand.

The WMT integrates multispectral Sentinel-2 and Synthetic Aperture Radar (SAR) Sentinel-1 observations to classify wetlands during the pre-monsoon period (March to May) from 2019 to 2025 in Google Earth Engine (GEE). Spectral indices (NDWI, MNDWI, NDVI, NDMI, NBR, AWEI, and Tasseled Cap components) are derived to identify pure pixels using Otsu thresholding. Sentinel-1 observations are used to complement optical observation results by improving identification of inundated and flooded vegetation, particularly in scenarios characterized by denser canopy cover or under cloud interference. Final wetland classification is done using a harmonized pixel-based, rule-based framework with an adaptive water detection approach for enhanced class separation across heterogeneous wetland ecosystems. Classification performance is evaluated using Overall Accuracy (OA), Producer’s Accuracy (PA), and the Kappa coefficient.

Results show vegetation increased across all five Ramsar wetlands, especially in Khao Sam Roi Yot (+823 ha) and Lower Songhkram River Wetland (+641 ha). Four of the five wetlands showed decline in open water, with Bung Khong Long Non-Hunting Area losing maximum area ( -163.4 ha; -13%) and Nong Bong Kai Non-hunting Area losing largest proportional area (-67.4 ha; -28%). Only Khao Sam Roi Yot shows increase in open water (+159.4 ha; 6.5%). Emergent and flooded vegetation declined significantly in smaller wetlands, especially in Nong Bong Kai, where they declined 86.2% and 73.4%, respectively. In contrast, land class declined significantly in larger wetlands, particularly in Khao Sam Roi Yot (−1,141.8 ha; -28.4%) and Lower Songkhram (−534.7 ha; −9.8%), indicating rise in wetland vegetation classes within Ramsar boundaries. The integrated optical-SAR approach in WMT enhances wetlands classification, can be scaled at national and regional level and demonstrates potential for standardized, long-term mapping and reporting for improved wetland management and decision making.

Keywords: Wetlands, Ramsar, Sentinel-1, Sentinel-2, Synthetic Aperture Radar, Google Earth Engine, Thailand

How to cite: Prasad, S., Kasambara, T., Saluja, R., and Piman, T.: Monitoring Freshwater Ramsar Wetlands in Thailand Using Integrated Sentinel-1 SAR and Sentinel-2 Optical Observations, EGU General Assembly 2026, Vienna, Austria, 3–8 May 2026, EGU26-18588, https://doi.org/10.5194/egusphere-egu26-18588, 2026.

EGU26-19100 | ECS | Orals | BG9.6

Uncertainty-aware Deep Learning for Wetlands Typology Mapping  from Multi-Source Satellite Remote Sensing Data   

Puzhao Zhang, Daniel Druce, Gyde Kruger, Walid Ghariani, Spyros Kondylatos, and Christian Toettrup

Wetlands are dynamic ecosystems whose health and functionality are continually shaped by seasonal fluctuations and long-term shifts in hydrology, climate, and land use. Effective wetlands mapping and monitoring requires methods capable of capturing temporal dynamics, spectral separability, and spatial patterns. Time series satellite observations are invaluable in this regard, as they reveal variations in vegetation phenology, water extent, and other key characteristics over time. To fully leverage temporal information, we employ the Continuous Change Detection and Classification (CCDC) algorithm, which robustly models temporal dynamics by detecting both abrupt and gradual changes, ensuring consistency across seasonal cycles and long-term trends. 

To overcome the limitations of individual sensors, we integrate multi-source satellite data. Sentinel-2 provides detailed spectral information related to vegetation conditions and water properties, while Sentinel-1 C-band SAR enables consistent, cloud-penetrating monitoring of surface water dynamics. PALSAR-2 L-band SAR complements them by capturing sub-canopy inundation and vegetation structure. This synergy of optical and multi-frequency SAR data enables a comprehensive characterization of both surface and sub-surface wetland properties across varying environmental conditions.  

Deep learning architectures such as U-Net outperform traditional pixel-based classifiers (e.g., Random Forests) by leveraging spatial context for object-level predictions. However, large‑scale wetland typology mapping remains challenging due to input‑dependent label noise arising from the integration of multi‑source maps at various spatial resolutions. We propose an uncertainty‑aware segmentation framework that fuses multi‑source satellite data and explicitly models heteroscedastic aleatoric uncertainty. Concretely, we combine a spatial overlap loss (Dice) with a heteroscedastic negative log-likelihood (NLL) to improve robustness to noisy labels and yield calibrated, per‑pixel uncertainty maps for quality control. 

We evaluate the performance of different feature representations derived from multi-source satellite data—including statistical metrics (minimum, maximum, and standard deviation), satellite embeddings, and CCDC-derived temporal features—using both Random Forests and deep learning models. Preliminary results indicate that CCDC features effectively capture temporal wetland dynamics, while spatial context plays a critical role in distinguishing specific wetland types such as marshes, forested wetlands, rivers, and lakes. The resulting uncertainty maps are spatially coherent and consistent with our expectations, showing higher uncertainty along wetland boundaries and lower uncertainty in homogeneous regions, ultimately contributing to more accurate and reliable wetland typology classification. 

How to cite: Zhang, P., Druce, D., Kruger, G., Ghariani, W., Kondylatos, S., and Toettrup, C.: Uncertainty-aware Deep Learning for Wetlands Typology Mapping  from Multi-Source Satellite Remote Sensing Data  , EGU General Assembly 2026, Vienna, Austria, 3–8 May 2026, EGU26-19100, https://doi.org/10.5194/egusphere-egu26-19100, 2026.

EGU26-20531 | ECS | Posters on site | BG9.6

Assessing the Potential of Sentinel-1 SAR Backscatter intensity for Monitoring Groundwater Levels in Temperate Raised Bogs 

Mahdi Khoshlahjeh Azar, Alexis Hrysiewicz, Shane Donohue, Shane Regan, Florence Renou-Wilson, Eoin Reddin, Jennifer Williamson, and Eoghan P. Holohan

Monitoring of peatland groundwater levels is crucial for effective bog rewetting. Traditional in-situ measurement methods are often costly and impractical in countries with expansive peatland areas. Synthetic Aperture Radar (SAR) may be an approach for remotely estimating groundwater levels over large areas due to its sensitivity to soil properties, such as soil moisture.  In this study, we investigated the relationships between terrain-corrected Sentinel-1 C-band SAR backscatter intensity (γ0) and groundwater level (GWL) at two temperate raised bogs: (1) a near-intact site (Cors Fochno bog, Wales, United Kingdom; 11 dip wells; Area = ~ 6.3 km2); and (2) an industrially-extracted, ‘bare-peat’ site (Castlegar Bog, Co. Galway, Ireland; 34 dip wells; Area = ~ 3.2 km2). Both sites have recently undergone rewetting measures, primarily bunding and drain blockage. For the industrially extracted Castlegar Bog, initial linear regression analysis between γ0 and GWL yielded average correlation coefficients (r) of 0.33 and 0.47 for VV and VH polarization, respectively. However, average correlation values increased when the dataset was separated into pre- and post-rewetting periods. Values of 0.55 and 0.64 for VV and VH, respectively, were found before restoration, and 0.43 and 0.54 for VV and VH, respectively, were found after restoration. For the near-intact Cors Fochno bog, SAR intensity exhibited very weak correlation with GWL, with average r values of 0.34 and 0.16 for VV and VH polarizations, respectively. Average correlation values changed to 0.41 and 0.14 for VV and VH after accounting for and filtering out rainfall events preceding each acquisition.  Consequently, our results indicate a limited capability of SAR backscatter intensity to serve as a reliable proxy for GWL in near-intact temperate raised peatlands. We hypothesize that the limited correlation is attributable to two main factors. Firstly, GWL in near-intact sites typically remains approximately 10 cm below the surface with minimal fluctuation, thereby maintaining a consistently saturated peat layer and limiting variance in dielectric properties beyond background noise levels. Secondly, vegetation acts as a buffer, temporarily retaining rainfall in above-ground and near-surface layers, which increases local volumetric water content, leading to surface saturation that affects the SAR backscattering mechanism. On the other hand, these findings indicate that SAR-based monitoring of GWL using C-band data is effective in highly degraded or extracted temperate peatlands, where water table fluctuations are pronounced and where vegetation impacts on the SAR signal are reduced due to extensive bare peat exposure.

How to cite: Khoshlahjeh Azar, M., Hrysiewicz, A., Donohue, S., Regan, S., Renou-Wilson, F., Reddin, E., Williamson, J., and P. Holohan, E.: Assessing the Potential of Sentinel-1 SAR Backscatter intensity for Monitoring Groundwater Levels in Temperate Raised Bogs, EGU General Assembly 2026, Vienna, Austria, 3–8 May 2026, EGU26-20531, https://doi.org/10.5194/egusphere-egu26-20531, 2026.

Raised bogs are ombrotrophic peatland ecosystems whose long-term functioning depends on the stability of a vertically growing peat surface sustained by tightly coupled ecohydrological feedbacks. In intact systems, the peat surface undergoes reversible seasonal shrink–swell behaviour (“bog breathing”), allowing bogs to self-regulate in response to water-table fluctuations. Prolonged hydroclimatic stress or artificial drainage for land use activities can disrupt this oscillatory regime, leading to peat consolidation, loss of water-storage capacity, and progressive surface subsidence. Despite extensive national and EU-level protection, the stability of near-intact raised bogs has rarely been assessed at national scales.

Here, we use vertical ground-motion time series from the European Ground Motion Service (EGMS) data to quantify seasonal and interannual peat surface dynamics across raised bog Special Areas of Conservation (SACs) in Ireland between 2019 and 2023. Surface elevation changes were analysed for 52 paired raised bog sites representing both active raised bogs (habitat type 7110) and degraded raised bogs capable of natural regeneration (7120), using over 39,000 EGMS measurement points located within bog SAC boundaries. Long-term elevation trends were quantified using linear regression, alongside analysis of seasonal surface oscillations associated with bog breathing.

Across the study sites, almost all raised bogs exhibit clear seasonal surface oscillations alongside a persistent decline in mean surface elevation over the five-year observation period. Across the protected sites at the national scale, this corresponds to a median surface lowering of approximately 3 mm per year, with similar magnitudes observed in both active and degraded raised bogs. Mean subsidence rates are slightly more negative but remain within a narrow range, and variability across sites is moderate. These preliminary results indicate that long-term surface lowering represents a shift away from stable peat surface equilibrium in raised bogs designated for protection in Ireland, affecting not only degraded sites but also bogs classified as “active”.

Our findings indicate that water-level monitoring alone may not be sufficient to assess raised bog condition. Declining surface elevation reduces peat specific yield, meaning that apparently stable or high water levels can mask a loss of hydrological storage capacity and self-regulation. Consequently, raised bogs may appear hydrologically “healthy” while undergoing structural degradation and progressive subsidence. The surface elevation decline observed across almost all protected raised bogs highlights the need to integrate surface motion metrics into peatland monitoring, conservation assessment, and restoration planning to avoid irreversible ecohydrological degradation.

How to cite: Ahmad, S., Habib, W., and Liu, H.: Satellite-derived evidence of recent peat surface elevation decline across the protected raised bogs of Ireland , EGU General Assembly 2026, Vienna, Austria, 3–8 May 2026, EGU26-21222, https://doi.org/10.5194/egusphere-egu26-21222, 2026.

EGU26-79 | ECS | Posters on site | BG9.7

Applying a unidimensional convolutional neural network for accurate land cover mapping in large areas: A case of study of the Guadiana Hydrographic Demarcation (Spain) 

Antonio Vidal Llamas, Carolina Acuña-Alonso, Diego Barba-Barragáns, and Xana Álvarez


Land use changes are one of the main drivers of global change, occurring at an accelerating rate. Therefore, obtaining accurate and up-to-date knowledge of the Earth's surface is essential. This paper aims to produce a land cover map for the Guadiana Hydrographic Demarcation (Spain), a region under diverse environmental pressures and part of one of the largest basins on the Iberian Peninsula. A 1D convolutional neural network (1D-CNN) deep learning method was applied to Sentinel-2 satellite imagery, yielding promising results with high accuracy when compared to other methods. A land cover map for the summer of 2022 was generated with a resolution of 10 x 10 m. Several differences were detected in the coverage of various classes when compared to the previously available data from the Spain's Land Occupation Information System (SIOSE) 2014 reference layer. Notably, “agricultural lands”, which cover more than half of the study area, showed a 7.34 % increase, while “broadleaf” areas exhibited a 7.75 % decrease over the total study area. Greater congruences were found in the larger classes between the two maps. The methodology demonstrated a remarkably high accuracy of 0.96. However, only 59.97 % agreement with the SIOSE layer was observed, due to differences in time periods, minimum representation sizes, and classification accuracies. The high accuracy achieved over such a large area underscores the potential of Sentinel imagery and neural networks for land cover classification, addressing some of the limitations of existing land cover products.

How to cite: Vidal Llamas, A., Acuña-Alonso, C., Barba-Barragáns, D., and Álvarez, X.: Applying a unidimensional convolutional neural network for accurate land cover mapping in large areas: A case of study of the Guadiana Hydrographic Demarcation (Spain), EGU General Assembly 2026, Vienna, Austria, 3–8 May 2026, EGU26-79, https://doi.org/10.5194/egusphere-egu26-79, 2026.

Large-scale mapping of environmental variables increasingly relies on integrating sparse in-situ measurements with dense remote sensing archives using advanced machine learning approaches. Suspended sediment concentration (SSC), a key driver of water quality, biogeochemical fluxes, and river-delta morphodynamics, is traditionally monitored at point locations and exhibits strong spatial and temporal heterogeneity. This makes SSC an ideal testbed for evaluating methodological challenges in upscaling point observations to continuous environmental surfaces. In this study, a continental-scale SSC mapping framework is developed by combining 40 years of Landsat surface reflectance with 16,311 quality-filtered SSC measurements from 247 U.S. Geological Survey stations across diverse hydroclimatic regions of the United States.

Tree-based ensemble models, including CatBoost, are employed to learn nonlinear relationships between spectral indices (e.g., Red/Green ratio, MNDWI, NIR reflectance), topographic metrics, precipitation records, and spatiotemporal predictors (latitude, longitude, month). During model development, several challenges central to environmental upscaling are addressed: (i) reference data that are not independent and identically distributed, (ii) spatial heterogeneity in sediment-generating processes, (iii) systematic biases introduced by log-transformation and back-transformation, and (iv) the risk of extrapolation artifacts when predictions are generated outside the feature space of the training data. Spatial dependencies in residuals are quantified using Moran’s I, and the performance of direct SSC prediction and ln(SSC)-based models is compared to illustrate how transformation choices influence uncertainty and predictive robustness across sediment regimes. Spatiotemporal predictors primarily encode climatological and regional priors rather than explicit causal processes, and results are therefore interpreted in a large-scale, statistical context.

To enhance interpretability, an increasingly important component of environmental machine learning, SHAP (SHapley Additive Explanations) values are computed to quantify feature contributions. SHAP analysis reveals strong physical consistency in the model outputs: elevated SSC is associated with high Red/Green ratios and NIR reflectance, water-pixel purity is improved by MNDWI, and elevation and longitude capture broad geomorphic and climatic gradients at continental scale, including the well-documented east-west aridity-driven increase in sediment yield. These insights allow regions with limited representativeness or increased extrapolation risk to be identified, providing a transparent diagnostic tool that extends beyond traditional accuracy metrics.

Generalizability is examined by applying the model to four major U.S. rivers (Mississippi, Colorado, Columbia, and Hudson). Spatial and temporal dynamics are reproduced, including snowmelt-driven sediment pulses in the Colorado River, regulated low-sediment conditions in the Columbia, seasonal fluctuations in the Mississippi, and episodic sediment events in the Hudson. These results demonstrate that spatially explicit machine learning models, when carefully validated, can upscale sparse in-situ measurements into continuous environmental maps that preserve regionally consistent behaviors and large-scale patterns.

Overall, the study shows that long-term satellite archives, physically informed predictors, and explainable machine learning techniques provide a robust foundation for upscaling environmental variables. By addressing spatial heterogeneity, uncertainty propagation, and interpretability, the framework contributes to the broader effort to generate reliable, large-scale geospatial products from distributed observation networks and can be transferred to other environmental variables requiring point-to-continuous scaling.

How to cite: Erten, G.: Statistical Upscaling of Point-Based Sediment Observations to Continental-Scale Maps Using 40 Years of Landsat and Explainable Machine Learning, EGU General Assembly 2026, Vienna, Austria, 3–8 May 2026, EGU26-1419, https://doi.org/10.5194/egusphere-egu26-1419, 2026.

EGU26-3585 | ECS | Posters on site | BG9.7

Continuous Plant Trait Vectors using Generative AI 

Gayathri Girish Nair, Camille Abadie, Midori Yajima, Luke Daly, and Silvia Caldararu

Plant morphological and physiological trait combinations exist on an almost continuous spectrum across varying climate conditions and geographic locations. Currently, a dominant but limiting approach to capturing this diversity, for example within Earth System Models (ESMs), is to discretize into few largely arbitrary Plant Functional Type (PFT) categories (e.g. tropical broad-leaved deciduous, C3 grass, temperate needle-leaved evergreen, etc.) based on broad functional similarities and responses to the environment, leading to much information loss.

Given recent advances in generative Artificial Intelligence (AI), it is now possible to develop Deep Learning (DL) models that can learn the distribution of plant trait vectors conditioned under varying environmental factors. This work explores using generative modelling approaches like conditional variational autoencoders / flow matching to train a Neural Network (NN) to learn the joint distribution of 26 plant traits as in the TRY Plant Trait Database under different environmental conditions across the globe. Generation is conditioned on climate variables from the ERA5-Land reanalysis dataset and Copernicus Digital Elevation Model fetched via Google Earth Engine alongside soil properties obtained from the ISRIC WISE30sec dataset.

Outputs of such a trained model can contribute towards downscaling and gap-filling approaches, as well as studies trying to understand plant responses under changing climate conditions. Furthermore, trained hidden layer output embeddings, being Continuous Plant Trait Vectors (CPTVs), better capture the spectrum of varying trait combinations. Such information-rich CPTVs have the potential to  be viable alternatives to PFT classes w.r.t parameterization of Earth System Functions within ESMs. The model itself serves as a tool for furthering understanding of plant functional adaptations through exploration of the learned trait space via cluster analysis, enabling the identification of latent structure, relationships, and patterns, as well as supporting hypothesis generation and comparative analysis across populations or conditions.

How to cite: Girish Nair, G., Abadie, C., Yajima, M., Daly, L., and Caldararu, S.: Continuous Plant Trait Vectors using Generative AI, EGU General Assembly 2026, Vienna, Austria, 3–8 May 2026, EGU26-3585, https://doi.org/10.5194/egusphere-egu26-3585, 2026.

EGU26-4160 | Posters on site | BG9.7

Deep learning framework for high spatiotemporal resolution monitoring of carbon uptake usng multi-source satellite imagery 

Jungho Im, Bokyung Son, Taejun Sung, and Sejeong Bae

With the increasing emphasis on climate change and carbon neutrality, accurately quantifying gross primary productivity (GPP) has become a key strategic objective. The spatiotemporal variability of GPP across vegetation types underscores the necessity of high-resolution data for precise estimation. While satellite imagery is a valuable tool for large-scale GPP monitoring, its effectiveness is constrained by trade-offs between spatial and temporal resolution, particularly impacting accuracy in heterogeneous vegetated areas. To address this limitation, we proposed a novel framework named UNified, high-resolution Intelligent carbon QUantification and Estimation (UNIQUE), which generates 30 m GPP maps by learning the spatial relationships between daily 500 m MODIS and 16-day 30 m Landsat imagery. The UNIQUE framework comprises two steps. In the first step, two independent artificial intelligence models were developed to estimate daily GPP using MODIS and Landsat vegetation indices tailored to their respective temporal resolutions, combined with a reanalysis of meteorological data. These models were trained and validated using 309 eddy- covariance flux observations from the Northern Hemisphere. As a result, GPPM represents the AI-based GPP estimated from MODIS data, while GPPL represents the AI-based GPP estimated from Landsat data. Among the various AI algorithms tested using AutoML packages, the light gradient boosting machine model demonstrated the best performance. For GPPM, it achieved an r of 0.80 and a root mean squared error (RMSE) of 2.47 gC/m2/day from a 20-fold spatial cross-validation. Similarly, for GPPL, the model achieved an r of 0.83 and an RMSE of 2.43 gC/m2/day. In the second step of UNIQUE, we downscaled GPPM to produce GPPL-like daily 30 m GPP maps using a generative AI model, the denoising diffusion probabilistic model (DDPM). This process was applied to South Korea, which is characterized by dominant mountainous regions and heterogeneous land cover. To produce reliable 30 m GPP maps corresponding to real-world land cover, two schemes were employed: (1) a DDPM model that uses only GPPM as input (GPPUNIQUE (S1)) and (2) a DDPM model incorporating high-resolution spatial topography information from 30 m digital elevation models and fractional land cover ratios within 30 m, derived from 1 m land cover data provided by the Korean Ministry of Environment (GPPUNIQUE (S2)). Training data were randomly extracted as 150 by 150-pixel patches, each covering 4,500 m × 4,500 m from 2020 to 2022. The test dataset was constructed using data from 2023. GPPUNIQUE (S2) outperformed both GPPUNIQUE (S1) and GPPM, demonstrating the lowest average RMSE (2.24 gC/m2/day). In contrast, GPPUNIQUE (S1) showed an RMSE of 3.36 gC/m2/day, which is a higher value compared to GPPM, which had an RMSE of 2.85 gC/m2/day. Incorporating auxiliary variables with high spatial information—here, topography and fractional land cover data—proved to be essential for producing stable generated images that accurately correspond to real-world land cover. GPPUNIQUE (S2) effectively identified carbon absorption sources that were previously undetectable with MODIS data alone. Furthermore, this approach enabled the analysis of spatiotemporal characteristics of GPP across different plant functional types, facilitating enhanced high-resolution carbon flux monitoring in diverse ecosystems.

How to cite: Im, J., Son, B., Sung, T., and Bae, S.: Deep learning framework for high spatiotemporal resolution monitoring of carbon uptake usng multi-source satellite imagery, EGU General Assembly 2026, Vienna, Austria, 3–8 May 2026, EGU26-4160, https://doi.org/10.5194/egusphere-egu26-4160, 2026.

Fractional vegetation cover (FVC) is widely used to characterize vegetation conditions, yet its accuracy in mountainous regions remains highly uncertain due to complex terrain effects. Focusing on the Hi-GLASS FVC product, this study evaluates its performance in mountainous regions and proposes two improvement methods: a terrain-correction method (TC) and a multi-feature fusion method (MF). In the TC method, terrain-corrected surface reflectance is used as input to the Hi-GLASS FVC model. The MF method improves FVC estimation by incorporating multiple additional features, including observation geometry, topographic parameters, and vegetation indices. It is implemented as two models: a full-feature model (MF-ALL) and an optimized model using recursive feature elimination (MF-RFE). Using very high resolution (VHR) reference data, we quantitatively evaluated the accuracy of the two methods (TC and MF) over mountainous regions in China and the United States. The results reveal notable regional differences. In China, the MF-RFE model achieved the best performance, increasing R² by 62% relative to Hi-GLASS, slightly outperforming the MF-ALL model, while the TC method improved overall accuracy but reduced R² on sunny slopes by approximately 14%. In the United States, the MF-ALL model performed best, increasing R² by 42% over Hi-GLASS and slightly surpassing MF-RFE, whereas the TC method led to an overall accuracy decline. Further analysis showed that topography and vegetation type significantly influenced FVC estimation accuracy. Higher accuracy was generally observed on sunny slopes compared with shady slopes, with greater relative improvements on shady slopes; accuracy decreased with increasing slope; and forests exhibited larger improvements than non-forest vegetation types. Overall, the MF method substantially enhances the accuracy and robustness of mountainous FVC estimation compared with the TC method, providing a reliable framework for vegetation monitoring, carbon cycle assessment, and ecosystem management under complex terrain conditions.

How to cite: Song, D.-X., Chen, Z., Qi, S., and He, T.: Improving and validating the Hi-GLASS FVC product over mountainous regions in China and the United States using very-high-resolution satellite imagery, EGU General Assembly 2026, Vienna, Austria, 3–8 May 2026, EGU26-6380, https://doi.org/10.5194/egusphere-egu26-6380, 2026.

EGU26-6504 | ECS | Posters on site | BG9.7

Ensemble machine learning for sub-daily downscaling of satellite-derived gross primary productivity 

Seoyeong Ku, Jongjin Baik, Seunghyun Hwang, and Changhyun Jun

Gross Primary Productivity (GPP) plays a central role in regulating terrestrial carbon uptake, yet commonly used satellite-based GPP products are provided at multi-day temporal resolutions, limiting their ability to capture rapid ecosystem responses to short-term environmental variability. This temporal constraint is particularly critical under increasing occurrences of extreme weather events, where sub-daily vegetation dynamics remain poorly understood. In this study, we propose a machine-learning-based framework to generate hourly GPP estimates at moderate spatial resolution across the Korean Peninsula. The approach integrates satellite-derived vegetation indices with reanalysis-based hydrometeorological variables and explicitly accounts for land-cover heterogeneity by constructing independent models for major land-cover classes. To enhance model interpretability and efficiency, a feature selection strategy was applied to identify key environmental drivers of GPP variability for each land-cover type. Model performance was evaluated using temporally independent datasets, demonstrating that hourly GPP estimates aggregated to multi-day scales are consistent with existing satellite GPP products, while additionally capturing realistic diurnal cycles and seasonal patterns. The results indicate that a reduced set of influential variables can preserve predictive skill while improving computational efficiency. The proposed framework provides a practical pathway for temporally downscaling widely available satellite GPP products to sub-daily resolution in regions with limited ground observations. This capability offers new opportunities to investigate vegetation productivity responses to short-term climatic extremes such as heatwaves and droughts, contributing to improved understanding of ecosystem carbon dynamics under a changing climate.


Acknowledgement

This work was supported by the Korea Environmental Industry & Technology Institute (KEITI) through Wetland Ecosystem Value Evaluation and Carbon Absorption Value Promotion Technology Development Project, funded by Korea Ministry of Climate, Energy and Environment (MCEE) (RS-2022-KE002066), and supported by the National Research Foundation of Korea(NRF) funded by the Ministry of Education (RS-2024-00465925) and by the Korea government (MSIT) (RS-2024-00334564 & RS-2021-NR060085).

How to cite: Ku, S., Baik, J., Hwang, S., and Jun, C.: Ensemble machine learning for sub-daily downscaling of satellite-derived gross primary productivity, EGU General Assembly 2026, Vienna, Austria, 3–8 May 2026, EGU26-6504, https://doi.org/10.5194/egusphere-egu26-6504, 2026.

EGU26-9141 | Orals | BG9.7

“Take one, get two!” - Spatial flux decomposition for eddy covariance towers 

Mark Schlutow, Ray Chew, and Mathias Göckede

Eddy covariance (EC) measurement sites are often located in heterogeneous terrain where aggregated ecosystem-exchange fluxes are observed originating from a mosaic of structured patches of different land cover types and mixed ecosystems, which may even exhibit sources and sinks simultaneously. This complex spatial heterogeneity makes it challenging to identify controls and processes governing carbon cycle processes of homogeneous sub-units surrounding the tower. As a consequence, for spatiotemporal upscaling of fluxes to large-scale maps any given tower is strictly speaking only representative for the exact same mixture of patches as found in the tower footprint.

We present FLUGS, a novel framework that infers land-cover-specific ecosystem-exchange fluxes provided the EC time series of aggregated fluxes and the land cover map of the ecosystem surrounding the EC tower. Using a multitask machine learning approach based on Kernel Ridge Regression combined with high-resolution flux footprints, FLUGS learns the environmental response functions (ERFs) from EC data for each land cover class simultaneously. The approach is versatile, robust to multicollinearity and yields smooth and interpretable ERFs with a unique global optimum. By offering a fast, transparent workflow for spatially decomposing ecosystem fluxes, FLUGS opens new opportunities to attribute EC fluxes to ecological processes, benchmark land-surface models and improve our understanding of land-atmosphere interaction. In terms of data coverage, applying spatial flux decomposition with FLUGS to a single tower effectively multiplies its scientific value, providing land-cover-specific insights equivalent to operating two or more conventional towers, one for each patch type individually. The FLUGS framework is validated against synthetic and real data experiments. The latter uses data from a twin tower site in Northeast Siberia and the STORDALENX25 campaign. Machine learned patch-level ERFs from FLUGS may be used directly for upscaling.

How to cite: Schlutow, M., Chew, R., and Göckede, M.: “Take one, get two!” - Spatial flux decomposition for eddy covariance towers, EGU General Assembly 2026, Vienna, Austria, 3–8 May 2026, EGU26-9141, https://doi.org/10.5194/egusphere-egu26-9141, 2026.

EGU26-9733 | ECS | Orals | BG9.7

Integrating forest inventory plot and GEDI data for forest structure assessment 

Alexandra Runge, Viola Heinrich, Simon Besnard, Emil Cienciala, Kevin Black, Roberto Pilli, Gherardo Chirici, Giovanni D'Amico, and Martin Herold

Forests play a critical role in the global carbon cycle, yet carbon removals in Europe are declining due to increasing wood demand, natural disturbances, and a growing share of aging forests. Sustaining and enhancing forest carbon sinks requires a better understanding of forest structure complexity, which underpins accurate carbon estimates and aligns with emerging EU policy priorities such as identifying old-growth, natural, and even-aged forests. 

Forest inventory surveys provide essential ground-based information for evaluating forest structure complexity. Remote sensing data enables consistent and timely large-scale assessments. Therefore, our objective is to assess the applicability of integrating NFI and GEDI data for characterising forest structure complexity, particularly for distinguishing low and high structural complexity forests. We evaluate the availability of matched NFI plots and high-quality GEDI shots, derive a forest structure complexity measure from integrated variables, and demonstrate a machine learning model trained on NFI-GEDI data to classify forest structure complexity. This study covers Czech Republic, Italy, and Spain, representing temperate, mountainous, and Mediterranean biomes.

We initially identified about 34,000 NFI plots that had a geographic match with almost 90,000 GEDI shots (from a total of ~64,000 NFI plots available and ~200,000,000 GEDI shots in Spain, Italy, and Czech Republic). Rigorous GEDI quality filtering and additional matching criteria reduced the dataset to a total of 2,509 NFI plots and 5,488 corresponding GEDI shots. This is 7% of the NFI plots and 6.5% of the geographically matched GEDI shots. This highlights that data quality requirements reduce the number of matched plots and GEDI shots drastically. Therefore, the data base for assessments of individual countries is low, and a pan-European assessment favourable. 

Forest structure complexity was derived at the plot level using variability in diameter at breast height, tree height, and species richness, combined into an equally weighted structure complexity score. Low variability indicated even-aged, single-species stands, whereas high variability reflected diverse, multi-aged, structurally complex forests. We selected the NFI plots within the lowest and highest 25 % structure complexity score for low and high structural complexity, respectively. 

Training a Support Vector Machine with GEDI data to differentiate between low and high structural complexity, as derived from the NFI-based score, resulted in a model accuracy of 0.81. Restricting the evaluation to the predictions with probabilities > 80% increased the accuracy to 0.94. Applying this model to high-quality GEDI shots in Italy, Czech Republic, and Spain highlights the country-wide occurrence and distribution of low and high structural complex forests. A first assessment indicates that 86%, 65%, and 26% of the forest areas are associated with high structural complex forests in Czech Republic, Italy, and Spain, respectively. 

These results demonstrate the potential of integrating ground-based data with spaceborne-lidar to characterise forest structure complexity. Even simple structure scores and models provide a reliable indication of the structural complexity distribution across Europe. This approach provides a new basis for improving carbon estimates, monitoring structural changes driven by disturbances and other changes, and supporting EU forest-policy targets related to biodiversity, climate resilience, and sustainable forest management.

How to cite: Runge, A., Heinrich, V., Besnard, S., Cienciala, E., Black, K., Pilli, R., Chirici, G., D'Amico, G., and Herold, M.: Integrating forest inventory plot and GEDI data for forest structure assessment, EGU General Assembly 2026, Vienna, Austria, 3–8 May 2026, EGU26-9733, https://doi.org/10.5194/egusphere-egu26-9733, 2026.

EGU26-11956 | ECS | Orals | BG9.7

Investigating whether considering spatial heterogeneity within Eddy-Covariance tower footprints can better characterise high-frequency changes in GPP 

Arianna Lucarini, Daniel E. Pabon-Moreno, Costantino Sirca, Donatella Spano, and Gregory Duveiller

Eddy Covariance (EC) towers measure ecosystem-atmosphere fluxes and are typically installed in homogeneous landscapes to ensure representativeness. However, sometimes the landscapes can exhibit more heterogeneity than desired, especially when the objective is to link these fluxes with other data sources, such as coarse remote sensing observations, notably in efforts to upscale these fluxes. Accurately integrating EC flux measurements with satellite observations or model-based simulations remains a significant challenge due to the inherent spatial heterogeneity that can occur within the flux footprint. This footprint is also dynamic, changing according to meteorological conditions such as wind speed and direction, while many approaches consider it static for simplicity. This study examines whether modelling the footprint dynamics and describing the underlying fine-scale spatial variability information from remote sensing data, specifically using 20 m Sentinel-2 data as a proxy for the spatial heterogeneity in vegetation structure, can help explain the high frequency (e.g., half-hourly) variability of Gross Primary Production (GPP) estimates from EC. To isolate the contribution of spatial heterogeneity from the dominant effect of incoming radiation, we work on light-normalized fluxes (i.e., GPP/PAR, as a proxy for light-use efficiency) measured at the tower. We hypothesize that combining light-normalized EC fluxes with remote sensing information weighted by dynamically modelled flux footprints provides a more accurate representation of the high-frequency variations in GPP than approaches relying on static footprint representations.

To test our hypothesis, we analyze three ICOS sites characterized by distinct ecosystem types: (i) IT-Noe, a Mediterranean maquis in Italy; (ii) ES-LMa, a typical holm oak savanna in Spain; and (iii) IT-Ren, a subalpine forest in Italy. Our methodology integrates half-hourly EC datasets for GPP and meteorological variables with Sentinel-2 data cube at 20 m spatial resolution to compute various Vegetation Indices (VIs), including: NDVI, EVI, CIR, NDWI, and NIRv. We compare three footprint modeling approaches: (i) Static Footprint (SF), a fixed-area approach with radii of 50, 250, and 500m; (ii) Climatological Footprint (CF), based on the Flux Footprint Prediction (FPP) model by Kljun et al. (2015) applied as an average over the growing season; and (iii) Dynamic Footprint (DF), providing a dynamic representation of flux for each Sentinel-2 band every 30 minutes.

Preliminary results indicate that incorporating high-resolution Sentinel-2 data to explicitly account for spatial heterogeneity within the flux footprint provides substantial added value for the ecosystem flux studies. The comparison between footprint-based approaches and simplified assumptions highlights the importance of capturing fine-scale spatial variability to ensure accurate estimates of GPP, particularly in complex and heterogeneous landscapes.

How to cite: Lucarini, A., E. Pabon-Moreno, D., Sirca, C., Spano, D., and Duveiller, G.: Investigating whether considering spatial heterogeneity within Eddy-Covariance tower footprints can better characterise high-frequency changes in GPP, EGU General Assembly 2026, Vienna, Austria, 3–8 May 2026, EGU26-11956, https://doi.org/10.5194/egusphere-egu26-11956, 2026.

EGU26-12569 | Posters on site | BG9.7

Salt march Leaf Area Index determination with AI driven aerial lidar and multispectral data fusion 

Sander Vos, Tegan Blount, Roderik Lindenbergh, José Antolinez, and Marco Marani

Salt marshes worldwide face ongoing climate change, including variations in local marine and meteorological forcing. Their resilience against relative sea level rise is partly dependent on organic soil production driven by vegetation development.

The Leaf Area Index (LAI) is a key indicator to quantify plant growth, ecosystem productivity and to characterize local vegetation distribution. However, area-wide LAI mapping from in situ measurements is challenging in inaccessible swampy and silty areas. Aerial/satellite mounted laser and imaging data have been used to augment in situ measured LAI values, but general methodology is lacking. Multi-sensor data fusion is an emerging area of research in improving LAI determination. In this abstract a novel data fusion technique is explored that uses an evolutionary AI model to map both  lidar 3D geometrical and multispectral vegetation data to LAI ground measurements.

A combined drone based survey acquiring both lidar and multispectral imagery (Green, Red, Red Edge and Near Infrared) was conducted in autumn 2025 at San Felice salt marsh in Venice Lagoon (Italy), a marsh shrinking and drowning due to microtide and reduced inorganic sediment input. Both lidar/multispectral flights were flown at around 30 meters above ground and processed into geo-referenced point clouds and multispectral orthomosaics.  Data sources were consequently merged into a multispectral point cloud by adding the nearest (in X-Y coordinate) multispectral information to each point in the point cloud. Ground based LAI in situ measurements were obtained in 40 vegetation patches spread out over the survey area.

The multispectral point cloud was subsequently divided into adjacent hexagonal cells (0.5m radius) with information per cell summarized by 19 parameters. Multispectral color (4 bands) information is reduced to a 4*4 averaged covariance matrix while a light reduction function (based on the Beer-Lambert law, 3 parameters) modeled the attenuation of Lidar returns with increasing height.

An Artificial Neural Network (ANN) model was trained using an evolutionary algorithm to find an optimized ANN model to couple multispectral point cloud parameters in the 40 ground patches to local LAI values. The model was varied in 1-3 hidden layers and 20 to 60 nodes per hidden layer.  Training data was split 80%-20% with 80% of the data used for training and the rest for prediction evaluation. The best model achieved a high prediction accuracy (R2=0.906, RMSE=0.11), but showed a tendency to underestimate LAI values possibly reflecting spectral saturation in denser vegetation. An example of a continuous salt marsh LAI map is shown in figure 1.
The data fusion approach offers a promising technique towards improved LAI mapping, contributing to a better understanding of salt marsh responses to climate change.


How to cite: Vos, S., Blount, T., Lindenbergh, R., Antolinez, J., and Marani, M.: Salt march Leaf Area Index determination with AI driven aerial lidar and multispectral data fusion, EGU General Assembly 2026, Vienna, Austria, 3–8 May 2026, EGU26-12569, https://doi.org/10.5194/egusphere-egu26-12569, 2026.

EGU26-13953 | ECS | Orals | BG9.7

Advancing Forest-Based Climate Solutions through Data-Driven Carbon Flux Estimation  

Xian Wang, Kim Novick, and Mallory Barnes

Nature-based climate solutions, including reforestation, require credible carbon accounting frameworks that capture ecosystem-scale carbon fluxes and ensure additionality. However, most existing baselines rely on static biomass estimates that overlook spatial heterogeneity and interannual variation in forest carbon uptake. Here, we present a data-driven framework for estimating monthly Net Ecosystem Productivity (NEP) across eastern U.S. forests at 500-m resolution from 2003 to 2023. We trained Random Forest models using observations from 47 eddy-covariance sites combined with gridded remote sensing and meteorological data. Feature selection and SHAP analyses highlight NDVI, LAI, solar-induced fluorescence, shortwave radiation, and vapor pressure deficit as the primary drivers of NEP. Our results show that eastern U.S. forests have continued to strengthen as a carbon sink over the past two decades, with a mean NEP of −195 ± 122 g C m⁻² yr⁻¹ and an increasing trend of 2.51 g C m⁻² yr⁻¹. Annual NEP exhibits strong year-to-year sensitivity to spring temperature and moisture anomalies, with extreme events causing large variations in carbon uptake that are often followed by partial or full summer recovery, reflecting considerable ecosystem resilience. The substantial spatial and temporal variability in NEP predictions underscores the need for regionally calibrated, observation-based baselines. Our framework supports this need by providing dynamic, annually updated maps of forest carbon uptake to improve evaluation of reforestation and other nature-based climate solutions in the eastern United States.

How to cite: Wang, X., Novick, K., and Barnes, M.: Advancing Forest-Based Climate Solutions through Data-Driven Carbon Flux Estimation , EGU General Assembly 2026, Vienna, Austria, 3–8 May 2026, EGU26-13953, https://doi.org/10.5194/egusphere-egu26-13953, 2026.

EGU26-14446 | ECS | Orals | BG9.7

Physics-guided machine learning improves spatial structure and transferability in high-resolution NO2 mapping under sparse observations 

Wenfu Sun, Frederik Tack, Lieven Clarisse, and Michel Van Roozendael

Machine learning has become an important tool for producing high-resolution environmental maps, as traditional chemistry-transport models often face limitations in computational cost and spatial detail at the kilometer scale and hourly resolution. At such high spatiotemporal resolution, target fields become highly dynamic and spatially heterogeneous, while ground observations remain sparse. This raises a key question: how can we improve physical consistency and recover realistic spatial structure (e.g., transport-related spatial patterns) when reconstructing high spatiotemporal resolution fields from sparse stations?

We address this question by systematically comparing three machine-learning models for hourly surface mapping of NO2, a critical air pollutant, at 2 km resolution over Western Europe. All models use the same inputs, including static emission-related fields, satellite remote-sensing products, and meteorological variables, constrained by ground-based measurements from the European Environment Agency’s AirBase network.

Model A is trained using station observations only. Model B extends Model A by introducing wind-driven advection encoding to explicitly consider atmospheric transport. Model C further builds on Model B by incorporating a pretraining stage informed by hourly gridded NO2 fields at a coarser resolution (10 km) from the Copernicus Atmosphere Monitoring Service (CAMS) European reanalysis. Model B and Model C represent two physics-guided machine learning paradigms.

In the study region, Model A and Model B show similar predictive performance at unobserved stations and similar structural similarity to CAMS fields, while Model C performs best. However, compared to Model A, both Model B and Model C can reproduce plume-like structures that respond coherently to wind-field perturbations, such as changes in plume orientation under altered wind directions. We have also conducted a transfer learning experiment in Central Europe and found that Model C achieves the highest transferability in terms of maintaining spatial structure.

Overall, our results demonstrate that, at high spatiotemporal scales, although including simple advection physics can recover the pollutant's transport, training on stations alone is insufficient to capture dynamics and physically plausible patterns. In contrast, pretraining with large-scale simulation data can more significantly improve spatial structure, physical sensitivity, and transferability, as well as station-based metrics. Our study highlights the importance of pretraining with large-scale simulations for improving physically consistent, transferable learning in complex environmental systems with sparse observations.

How to cite: Sun, W., Tack, F., Clarisse, L., and Van Roozendael, M.: Physics-guided machine learning improves spatial structure and transferability in high-resolution NO2 mapping under sparse observations, EGU General Assembly 2026, Vienna, Austria, 3–8 May 2026, EGU26-14446, https://doi.org/10.5194/egusphere-egu26-14446, 2026.

EGU26-16137 | Orals | BG9.7

How can we better benchmark global GPP data using flux tower measurements across timescales? 

Xuanlong Ma, Yu Liang, Youngryel Ryu, and Kazuhito Ichii

Gross Primary Productivity (GPP) is the largest flux in the terrestrial carbon cycle. Accurate GPP estimates across diverse spatio-temporal scales are essential for constraining the land carbon budget and understanding ecosystem feedbacks to climate change. While numerous global GPP products exist, they rely on models with differing complexities and assumptions. A persistent challenge remains: it is unclear how effectively these products capture photosynthesis across varying timescales—from rapid diel responses and seasonal dynamics to discrete extreme events and long-term inter-annual trends. This study moves beyond traditional comparisons that treat the entire time series as a whole to develop a robust methodological framework for benchmarking global GPP data across varying time domain. We leverage high-frequency measurements from eddy-covariance flux tower networks, which provide multi-decadal, half-hourly records across diverse plant functional types. Simultaneously, we integrate recent advances in Earth observation, specifically the hypertemporal sampling of geostationary sensors and the long-term consistency of cross-calibrated satellite Climate Data Records (CDRs). The core of our methodology involves developing scale-specific metrics designed to isolate uncertainties at different temporal resolutions. For high-frequency dynamics, we introduce metrics to evaluate the ability of satellite-derived GPP to resolve the diurnal cycle and its response to environmental stressors. For long-term dynamics, we propose diagnostic tools to assess whether products accurately capture the physiological "greening" or "browning" trends observed in multi-decadal tower records. By identifying whether discrepancies originate from structural model deficiencies, input errors, or scaling mismatches, this framework provides a deeper diagnostic understanding of GPP model performance.

How to cite: Ma, X., Liang, Y., Ryu, Y., and Ichii, K.: How can we better benchmark global GPP data using flux tower measurements across timescales?, EGU General Assembly 2026, Vienna, Austria, 3–8 May 2026, EGU26-16137, https://doi.org/10.5194/egusphere-egu26-16137, 2026.

EGU26-16811 | ECS | Posters on site | BG9.7

High-resolution upscaling of ecosystem carbon fluxes using Sentinel-2 and explainable AI 

Theo Glauch, Julia Marshall, and Marcia Kroker

High-resolution estimates of ecosystem carbon dioxide exchange are essential for interpreting atmospheric CO₂ observations and quantifying natural and anthropogenic carbon budgets across spatial scales. Most state-of-the-art data-driven biosphere models rely on MODIS or VIIRS products at 500 m resolution to upscale eddy-covariance flux measurements, despite the strong spatial heterogeneity of many landscapes and the limited representativeness of individual flux towers. Recent advances in satellite remote sensing, particularly the Sentinel-2 constellation, enable data-driven upscaling of ecosystem carbon fluxes at 10 m resolution and offer new opportunities to better align reference measurements with model inputs.

In this contribution, we present a novel explainable machine-learning framework that combines Sentinel-2 observations with meteorological data to predict net ecosystem exchange, gross primary productivity, and ecosystem respiration across a wide range of ecosystem types in Europe, including different crop species. A key methodological aspect is the explicit alignment of eddy-covariance footprint estimates with high-resolution Sentinel-2 data, which improves model training under non-independent and spatially heterogeneous reference data conditions typical of European landscapes.

We demonstrate that this footprint-aware upscaling strategy leads to improved flux estimates and more robust spatial predictions. Using explainable AI techniques, we further analyse feature contributions and extract ecosystem-specific temperature dependencies of photosynthesis and respiration, enhancing process understanding beyond purely predictive performance. Finally, we show how the resulting models can be applied to generate spatially explicit CO₂ flux maps from urban to continental scales while accounting for the representativeness of individual flux towers and reducing extrapolation artefacts.

How to cite: Glauch, T., Marshall, J., and Kroker, M.: High-resolution upscaling of ecosystem carbon fluxes using Sentinel-2 and explainable AI, EGU General Assembly 2026, Vienna, Austria, 3–8 May 2026, EGU26-16811, https://doi.org/10.5194/egusphere-egu26-16811, 2026.

EGU26-17883 | ECS | Posters on site | BG9.7

EO-Based Crop Classification for Rotation Monitoring – Evaluating Temporal Consistency of Operational Models for Sustainable Agricultural Management 

Franz Schulze, Johannes Loew, Julia Pöhlitz, and Christopher Conrad

Accurate crop rotation monitoring is essential for sustainable agricultural management, supporting policy compliance, soil health assessment, and climate-resilient farming practices. Earth observation-based crop classification has become operational across Germany, with models producing annual outputs since Sentinel-2's launch in 2017. While these systems report high single-year accuracies, their reliability for multi-temporal applications—particularly rotation pattern detection remains insufficiently evaluated. ­

This study assesses the performance of two operational German crop classification models from Thünen Institute and the German Aerospace Center (DLR) for rotation analysis in Saxony-Anhalt, testing their applicability beyond original training regions. We processed multi-year classification outputs (2017–2024) using CropRotViz, an open-source R package specifically designed for handling temporal intersection, change detection and rotation pattern visualization. Model outputs were validated against Land Parcel Identification System (LPIS) reference data, evaluating both spatial accuracy and temporal consistency—the latter being critical for reliable rotation monitoring. The rotation Sequences of 3, 4 and 5 years were analyzed.

Preliminary results revealed a significant performance gap between single-year classification accuracy and multi-year rotation detection reliability. The DLR and Thünen models achieve annual accuracies of 0.81–0.90, with variability across years and crop types. However, when comparing overlapping areas with LPIS data across multi-year sequences (3-, 4-, and 5-year rotations), accuracies dropped substantially to 0.36–0.57. These errors compound over time, limiting model utility for applications requiring temporal stability, such as crop diversification monitoring, compliance verification for sustainable farming schemes, or assessing rotation impacts on soil health and carbon sequestration.

Our findings highlight a critical challenge for operational EO-based agricultural monitoring: current validation frameworks emphasizing annual accuracy may inadequately assess suitability for sustainability-relevant applications requiring temporal field level consistency. To transition from observation to actionable agricultural management support, classification systems must explicitly optimize for temporal robustness. We recommend incorporating rotation-specific validation metrics and developing approaches that leverage temporal context during classification to enhance consistency.

This work contributes to improving large-scale agroecosystem monitoring capabilities by identifying limitations in current operational systems and providing methodological tools (CropRotViz) for temporal analysis. Enhanced rotation monitoring supports evidence-based sustainable management, from precision agriculture to policy evaluation for climate-resilient farming transitions.

How to cite: Schulze, F., Loew, J., Pöhlitz, J., and Conrad, C.: EO-Based Crop Classification for Rotation Monitoring – Evaluating Temporal Consistency of Operational Models for Sustainable Agricultural Management, EGU General Assembly 2026, Vienna, Austria, 3–8 May 2026, EGU26-17883, https://doi.org/10.5194/egusphere-egu26-17883, 2026.

EGU26-19861 | Posters on site | BG9.7

Using the pyVPRM framework to estimate biospheric carbon fluxes from city to global scales 

Julia Marshall, Theo Glauch, Marcia Kroker, and Philina Voss

The Vegetation Photosynthesis and Respiration Model (VPRM) is a data-driven light-use-efficiency model for estimating biospheric carbon dioxide fluxes based on satellite-derived vegetation indices, such as the Enhanced Vegetation Index (EVI) and the Land Surface Water Index (LSWI), which provide high spatial resolution information on land surface conditions. High temporal resolution is achieved through meteorological driving data, including 2 m air temperature and surface shortwave radiation. The model parameters are calibrated for each vegetation type using regional eddy-covariance flux measurements from previous years. VPRM is a well-established approach that has been widely applied to quantify gross primary productivity and ecosystem respiration and to interpret atmospheric CO₂ concentration measurements in terms of biogenic and anthropogenic flux contributions. In many cases VPRM fluxes are also used as priors for atmospheric inversions.

pyVPRM is an open and modular Python-based framework that facilitates the application of VPRM across a wide range of spatial scales, from urban domains to continental and global analyses. Its flexible design allows users to combine different satellite products (e.g. MODIS, VIIRS, Sentinel-2), land-cover classifications (e.g. ESA WorldCover, Copernicus Dynamic Land Cover, MapBiomas), and meteorological data sources (e.g. local observations or reanalysis products such as ERA5).

In this poster, we present recent developments in the pyVPRM framework, demonstrate typical application workflows, and discuss best practices for model configuration and evaluation. A central aim of this contribution is to engage with the user community, gather feedback on current capabilities and limitations, and discuss future directions for collaborative model development and applications.

How to cite: Marshall, J., Glauch, T., Kroker, M., and Voss, P.: Using the pyVPRM framework to estimate biospheric carbon fluxes from city to global scales, EGU General Assembly 2026, Vienna, Austria, 3–8 May 2026, EGU26-19861, https://doi.org/10.5194/egusphere-egu26-19861, 2026.

Identifying the weather conditions that lead to crop yield failure is critical for early warning systems and climate adaptation planning. However, yield at harvest time is driven by nonlinear interactions between weather and other variables across different stages of plant development. While machine learning models excel at capturing such complex relationships from high-dimensional data, they can easily overfit to the dependencies inherent to spatiotemporal agroclimatic data. We apply a data-driven framework to multivariate observational data to identify key climate drivers of wheat yield failure in Europe. The method, previously validated using process-based crop model simulations, yields parsimonious sets of drivers that are able to effectively reproduce interannual variability, based on their contribution to the predictive performance of models across held-out spatial regions and years and in combination with different sets of predictive features. The resulting drivers are physically interpretable and align with agronomic understanding. In addition, using both observational data and process-based model simulations, we explore the impact of different model evaluation strategies on the drivers that are identified and the transferability of resulting models to unseen regions. The approach allows researchers to exploit the information available in high-resolution multivariate datasets using machine learning, while making use of parsimonious, interpretable statistical models. Beyond agriculture, this framework may be useful for the study, modelling and mapping of other societally relevant climate impacts, such as forest mortality, wildfires, floods, and landslides.

How to cite: Sweet, L. and Zscheischler, J.: Identifying robust climate drivers of wheat yield failure in Europe from high-dimensional, multivariate spatiotemporal data, EGU General Assembly 2026, Vienna, Austria, 3–8 May 2026, EGU26-20132, https://doi.org/10.5194/egusphere-egu26-20132, 2026.

EGU26-20910 | ECS | Orals | BG9.7

Mechanistic Interpretability for Mapping Ecosystem Functioning 

Vitus Benson, Martin Jung, Sebastian Hoffmann, Christian Reimers, Alexander J. Winkler, Qi Yang, and Markus Reichstein

Mapping ecosystem properties and functioning from Earth observation data remains fundamentally an extrapolation problem. Ground-based measurements of ecosystem processes, such as carbon fluxes, are sparse and geographically biased towards the Global North. Machine-learning models are therefore trained on limited labeled data and subsequently upscaled globally using environmental covariates derived from satellite remote sensing and reanalysis products. A central challenge is ensuring that such models generalize robustly beyond their training domain, rather than exhibiting spurious confidence or biased predictions in poorly observed regions.

In this contribution, we explore how recent advances in mechanistic interpretability and self-supervised representation learning from AI safety research can help address these challenges. In particular, sparse autoencoders (SAEs), and more specifically Top-K sparse autoencoders, have recently been used to disentangle deep neural representations into interpretable and steerable concepts in large language models. We propose to adapt these methods to Earth system science, with the goal of learning sparse, disentangled, and spatially meaningful latent representations of ecosystem-relevant variables.

We first evaluate this approach on a self-supervised proxy task: compressing and reconstructing mean seasonal cycles derived from MODIS remote sensing products and ERA5 climate reanalysis data. Using a Matryoshka BatchTopK SAE, we obtain latent features that are highly localized in space, with individual features activating only over specific regions of the Earth. In contrast to dense embeddings, e.g. from variational auto-encoders, our approach offers a control on the average sparsity level. In other words, this intrinsic, data-driven partitioning of geographic space can be interpreted as emergent climate regimes or ecosystem types, without relying on predefined biome maps or expert labels. 

Building on these results, we apply the SAE framework to the mapping of ecosystem carbon fluxes, using FluxNet tower observations as ground truth. The sparse and disentangled latent structure provides a transparent link between remote sensing inputs and predicted ecosystem functioning. Simultaneous training on a self-supervised reconstruction task and on predicting net ecosystem exchange provides competitive performance, with the sparsity of the features offering a promising avenue to enhance robustness by controlling the extrapolation behavior of the neural network. Beyond predictive performance, we introduce an interpretability workflow that enables systematic inspection of learned features, supporting model diagnostics and scientific analysis.

Overall, we argue that self-supervised, interpretable representation learning offers a promising pathway toward robust global ecosystem mapping from both labeled and unlabeled satellite data. This approach leverages the full scale of Earth observation archives while improving trust and insight in mapping ecosystem properties and functioning. In addition, it sheds insight into geographical partitioning, offering a novel perspective on decade-old maps of plant functional types.

How to cite: Benson, V., Jung, M., Hoffmann, S., Reimers, C., Winkler, A. J., Yang, Q., and Reichstein, M.: Mechanistic Interpretability for Mapping Ecosystem Functioning, EGU General Assembly 2026, Vienna, Austria, 3–8 May 2026, EGU26-20910, https://doi.org/10.5194/egusphere-egu26-20910, 2026.

EGU26-21461 | ECS | Posters on site | BG9.7

A Generative Framework for Vegetation–Weather Interactions and Extreme Response Analysis 

Maurício Lima, Alexander Winkler, and Christian Reimers

Understanding and predicting the relation between plant productivity and meteorological drivers is central to ecosystem and climate science. Existing approaches fall into two broad categories: process-based models and data-driven models. Process-based models can represent causal relationships and allow users to prescribe and perturb variables, but at global scales they are either computationally expensive or simplified to the point that key processes and ecosystem diversity are lost. Data-driven models (e.g., FluxCom) produce only mean responses and therefore miss internal variability of meteorology, vegetation state, and fluxes. Because these approaches impose a fixed split between inputs and outputs, one must decide in advance which variables can be conditioned on and which will be predicted, which constrains the effect of perturbations and limits experimentations. We address these complementary shortcomings by developing a probabilistic model of vegetation and weather state variables using generative diffusion models trained on FluxNet data. As a consequence, the model can sample plausible trajectories that reflect the full distribution. We demonstrate two key capabilities. First, the model functions as a data-driven emulator that can be conditioned on specified inputs, such as prescribed temperature, radiation, or soil moisture, while producing ensemble outputs that capture uncertainty and internal state variability. This enables users to explore vegetation responses similarly to typical mechanistic models, but at a fraction of the computational cost and with observational grounding. Second, we exploit the stochastic model to analyze vegetation responses to extreme weather events. Unlike approaches predicting the mean, our diffusion-based emulator reveals how extreme meteorological inputs alter the tails of the vegetation response distributions. By bridging the gap between mechanistic workflows and data-driven models, our diffusion model offers a practical path toward both improved scientific understanding of vegetation–weather interactions and an operational product for future analyses, risk assessment, and scenario exploration.

How to cite: Lima, M., Winkler, A., and Reimers, C.: A Generative Framework for Vegetation–Weather Interactions and Extreme Response Analysis, EGU General Assembly 2026, Vienna, Austria, 3–8 May 2026, EGU26-21461, https://doi.org/10.5194/egusphere-egu26-21461, 2026.

EGU26-2159 | ECS | Orals | BG9.9

Supporting agricultural statistics through multispectral UAV-based crop cover mapping in complex smallholder farming systems in Mozambique 

Florian J. Ellsäßer, Claudia Paris, Sosdito Mananze, Lourenço Manuel, and Andy Nelson

Reliable agricultural statistics support food security monitoring and evidence-based decision making. In Mozambique, official agricultural statistics are primarily derived from the Integrated Agricultural Survey (IAI), an enumerator-based field survey that provides essential contextual information on agricultural production but remains labour-intensive, costly and spatially and temporally constrained, particularly in remote rural areas. While satellite remote sensing offers complementary, wall-to-wall coverage, its spatial resolution is often insufficient to directly capture the fragmented fields, mixed and intercropping patterns, shifting cultivation and strong sub-field variability typical of smallholder farming systems. Consequently, consistent estimation of crop area and crop type derived from enumerator-based crop cover assessments remains challenging in these landscapes.

This study investigates the potential of high-resolution multispectral data acquired with Uncrewed Aerial Vehicles (UAVs) to complement field surveys by providing spatially explicit and internally consistent crop cover and crop fraction estimates at the field and sub-field scale. By resolving individual crops and dominant intercropping systems, UAV-based observations support the interpretation of farmer-reported crop cover proportions, improve consistency across enumerators, and enable post-survey correction of crop area estimates, while providing a basis for future integration with coarser-resolution satellite remote sensing. High-resolution RGB and multispectral imagery (green, red, red edge, and near-infrared; ≤5 cm ground sampling distance) was collected using a DJI Mavic 3M with RTK over 30 sampling areas of 500 × 500 m in Manica Province during the 2025 agricultural season. In parallel, a field survey recorded standardized observations of agricultural activity, including crop type (of most field and tree crops), intercropping combinations and enumerator-based estimates of fractional crop cover. UAV images were processed using a workflow tailored to heterogeneous smallholder landscapes to produce orthomosaics, digital surface models (DSMs), and vegetation indices. These products were linked to field observations through segments representing relatively homogeneous land units, enabling direct comparison between UAV-derived and survey-based crop cover estimates.

For crop classification, training polygons were delineated on RGB orthomosaics for single-crop fields (e.g. maize, beans, sorghum and cassava) and common intercropping combinations (e.g. maize–beans). Annotated mosaics were tiled and augmented and used to train convolutional neural network models (e.g. UNet++), incorporating multispectral vegetation indices and DSM-derived height information as additional input channels. Model performance was evaluated using Intersection over Union, Dice coefficients, and regression metrics for fractional cover accuracy.

A comparison framework was implemented to relate UAV-derived crop type, crop combinations and fractional cover to field survey observations while explicitly accounting for measurement uncertainty. Model II regression quantified systematic bias and proportional differences between the two methods. Initial results indicate that UAV-derived estimates provide spatially consistent crop cover information in fields with complex intercropping structures. Ongoing work focuses on refining segmentation accuracy, analysing residual discrepancies and assessing how UAV-derived crop cover information can be integrated to expand the spatial coverage and reliability of agricultural statistics in smallholder landscapes.

How to cite: Ellsäßer, F. J., Paris, C., Mananze, S., Manuel, L., and Nelson, A.: Supporting agricultural statistics through multispectral UAV-based crop cover mapping in complex smallholder farming systems in Mozambique, EGU General Assembly 2026, Vienna, Austria, 3–8 May 2026, EGU26-2159, https://doi.org/10.5194/egusphere-egu26-2159, 2026.

EGU26-2168 | Orals | BG9.9

Machine Learning and Proximal Sensing for Predicting Evapotranspiration of Agricultural Systems 

Darren Drewry, James Cross, Sana Shirazi, Srishti Gaur, Kanishka Mallick, Guler Aslan-Sungur, and Andy Vanloocke

Machine learning methods provide a powerful basis for developing flexible, non-parametric models of complex phenomena and have demonstrated strong predictive capabilities across many areas of the physical sciences generally and the earth sciences specifically. While machine learning methods have been demonstrated to be flexible predictive tools capable of integrating diverse data streams, they present significant challenges in terms of interpretability and generalizability. This is especially true in the context of ecohydrological or biophysical systems, where the objective is often to develop a better understanding of the underlying system rather than exclusively improve predictive performance. There is a growing recognition that interpretability, physical consistency, and data complexity are key challenges in the successful adoption of machine learning methodologies. Here we evaluate the application of machine learning methods to produce models for land-atmosphere water vapor exchange across a set of diverse agricultural systems. Specific focus is placed on the use of environmental and proximal sensing information to develop simple and effective models of evapotranspiration using both machine learning and hybrid modeling approaches that leverage the advantages of machine learning and biophysical simulation. Emphasis is placed on parsimonious model development and interpretability of model performance.

How to cite: Drewry, D., Cross, J., Shirazi, S., Gaur, S., Mallick, K., Aslan-Sungur, G., and Vanloocke, A.: Machine Learning and Proximal Sensing for Predicting Evapotranspiration of Agricultural Systems, EGU General Assembly 2026, Vienna, Austria, 3–8 May 2026, EGU26-2168, https://doi.org/10.5194/egusphere-egu26-2168, 2026.

Brassica rapa, known as Kimchi cabbage, is an important cash crop in South Korea. However, climate change has inflicted major abiotic stresses on cabbage production, resulting in physiological effects that often decrease yield and quality. To overcome these challenges, the effects of individual stresses on cabbage production must be investigated through simulation modeling and other approaches. In this study, we aim to clarify the historical and future patterns of abiotic stress to assess its effects on cabbage production in Korea. To this end, different stress index models were adopted and compared to estimate the occurrence patterns of each abiotic stress and assess their impacts on cabbage production. Our machine-learning modeling analyses revealed that approximately 62% of the variation in historical cabbage productivity can be attributed to individual abiotic stresses. The relative impact of each stress on productivity has not changed significantly over the past 40 years (1981–2020), with slight increasing or decreasing trends in major stresses. Among the abiotic stresses, the low-temperature injury and wetness stress have largely affected the cabbage productivity by 2020, followed by drought, high-temperature injury (HTI), and frost stresses. Projections based on future climate change scenarios suggest a substantial increase in HTI stress, surpassing the levels observed over the past 40 years, while other stressors are expected to either persist at similar levels, or decrease or increase slightly. This study underscores the increasing need to effectively manage these stressors, particularly those that have a greater impact on productivity and are projected to exceed their historical ranges, in order to ensure the successful future production of cabbage in Korea.

How to cite: Kim, K.-H., Lee, N.-H., and Jeong, W.: Effect of abiotic stresses on Brassica rapa production in Korea: Learning from history to better prepare for the future impacts of climate change, EGU General Assembly 2026, Vienna, Austria, 3–8 May 2026, EGU26-2180, https://doi.org/10.5194/egusphere-egu26-2180, 2026.

EGU26-2432 | Orals | BG9.9

An Integrated Multi-Sensor Framework for National-Scale Crop Mapping and Climate-Resilient Agricultural Monitoring 

Tarin Paz-Kagan, Lior Fine, Adi Edri, Avraham Atanelov, Nechama Z. Brickner, and Offer Rozenstein

Accurate, timely, and spatially consistent crop maps are a cornerstone of sustainable agricultural management, climate adaptation, and evidence-based policy. Yet national-scale crop mapping remains challenging in heterogeneous agroecosystems due to fragmented field structures, dynamic land use, and the contrasting spatiotemporal characteristics of annual crops and perennial orchards. Addressing these pressures requires scalable, data-driven approaches that translate advances in Earth observation (EO), data science, and modelling into actionable tools for climate-resilient agroecosystem management. Here we present an integrated, end-to-end crop-mapping framework that synthesizes complementary methodological advances to enable robust, operational monitoring of agricultural systems across space, time, and crop types. Using Israel as a national-scale case study representative of heterogeneous, intensively and extensively managed agroecosystems, the framework links fine-scale field structure, crop phenology, and multi-year dynamics to support decision-making under climatic variability. First, national cadastral parcel layers are refined into agronomically homogeneous field units using deep learning-based semantic segmentation (U-Net, DeepLabV3, and SegFormer) and foundation models (SAM), addressing a critical limitation of registry-based agricultural databases. A U-Net architecture outperformed SegFormer and DeepLabV3, achieving a mean Intersection-over-Union (IoU) of 0.76 with balanced precision-recall. At the national scale, polygon correctness improved from 75.16% to 86.37%, resulting in tens of thousands of fields segmented into homogeneous management units. This step substantially improves geometric consistency and the reliability of downstream crop classification and agroecosystem analysis. Second, a hierarchical, multi-sensor classification strategy integrates Sentinel-1 SAR and Sentinel-2 multispectral time series with phenological metrics and expert-driven feature selection to map agricultural land use and dynamically classify annual field crops across multiple growing seasons. XGBoost achieved the highest land-cover accuracy (OA = 0.909), driven primarily by vegetation, moisture, and chlorophyll-sensitive indices (NDVI, MCARI, NDMI, PGHI). For detailed row-crop mapping, deep learning models outperformed traditional machine learning (TabM OA = 0.861). Multi-satellite fusion ensured robustness and transferability, yielding an average leave-one-year-out accuracy of 0.833. This integration captures crop rotations, seasonal shifts, and climate-driven phenological gradients, enabling consistent multi-year monitoring in dryland and Mediterranean environments. Third, perennial orchard systems, often underrepresented in national crop statistics, are mapped using a multimodal fusion approach that combines very-high-resolution (VHR) aerial imagery with multi-temporal Sentinel-1/2 data. Deep learning architectures jointly exploit fine-scale spatial structure and phenological dynamics, achieving the highest performance across all evaluation settings (same-year OA = 0.890 ± 0.009; cross-year OA = 0.881 ± 0.014), with particularly strong gains for early-stage and sparsely vegetated orchards. Overall, the framework is designed for scalability, interpretability, and operational deployment, demonstrating how multi-modal remote sensing, deep learning, and hierarchical modelling can bridge scientific innovation and real-world agricultural decision-making under climate change.

How to cite: Paz-Kagan, T., Fine, L., Edri, A., Atanelov, A., Brickner, N. Z., and Rozenstein, O.: An Integrated Multi-Sensor Framework for National-Scale Crop Mapping and Climate-Resilient Agricultural Monitoring, EGU General Assembly 2026, Vienna, Austria, 3–8 May 2026, EGU26-2432, https://doi.org/10.5194/egusphere-egu26-2432, 2026.

EGU26-4124 | ECS | Orals | BG9.9

Joint estimation of potato yield and nitrogen status using UAV-derived spectral and structural data 

Ehsan Chatraei Azizabadi and Nasem Badreldin

Understanding how canopy structure and plant nutritional status jointly regulate crop productivity remains a central challenge for precision agriculture, particularly when observations are limited to single growth stages. This study examines whether three-dimensional canopy information derived from unmanned aerial vehicle (UAV) LiDAR can be integrated with multispectral observations to improve spatial characterization of potato yield potential and nitrogen status under irrigated Prairie conditions.

Multispectral imagery and high-density UAV-LiDAR data were acquired at row closure across two growing seasons in southwestern Manitoba, Canada, spanning a controlled gradient of nitrogen availability. Rather than treating yield and nitrogen status as independent targets, we evaluated a joint learning framework in which both variables were estimated simultaneously from the same fused feature space. Multiple neural network architectures were compared under identical data partitions to isolate the effects of shared representation learning. Model interpretation was performed using attribution analysis to distinguish spectral versus structural feature dependence.

Joint learning substantially altered model behaviour. Yield estimation, which proved weak when optimized in isolation, improved markedly when trained alongside nitrogen status, indicating that shared canopy representations capture integrative growth signals not accessible through yield-only optimization. In contrast, nitrogen prediction exhibited limited or inconsistent benefit from joint learning, remaining primarily governed by chlorophyll-sensitive spectral information. Attribution results revealed that yield relied on a broader combination of spectral responses and LiDAR-derived structural descriptors, including canopy height distribution, volumetric development, and spatial heterogeneity, whereas nitrogen status remained physiologically localized within the spectral domain.

These results demonstrate that canopy structure provides complementary information for cumulative traits such as yield, even from single-date acquisitions, while offering limited leverage for physiologically proximal indicators like nitrogen concentration. More broadly, the study shows that multi-task learning does not uniformly enhance prediction accuracy but instead exposes how different agronomic traits are encoded across spectral and structural dimensions. This has direct implications for designing UAV-based decision support systems, where aligning sensing modalities, learning strategy, and crop physiology is critical for meaningful inference.

How to cite: Chatraei Azizabadi, E. and Badreldin, N.: Joint estimation of potato yield and nitrogen status using UAV-derived spectral and structural data, EGU General Assembly 2026, Vienna, Austria, 3–8 May 2026, EGU26-4124, https://doi.org/10.5194/egusphere-egu26-4124, 2026.

EGU26-4894 | ECS | Posters on site | BG9.9

A spatially explicit negative‑prognosis framework for Cercospora leaf spot using remotely sensed leaf area index 

Rene Heim, Paul Melloy, Facundo Ramón Ispizua Yamati, Nathan Okole, Alexey Mikaberidze, and Anne-Katrin Mahlein

Timely and spatially explicit forecasts of plant disease risk are essential for efficient fungicide use and sustainable crop protection, yet conventional epidemiological models commonly rely on weather data from single stations and assume spatially uniform canopies. Such simplifications overlook within-field variability in crop development that can be revealed by Earth observation data. Using the sugar beet–Cercospora beticola pathosystem, we tested whether integrating remotely sensed canopy metrics with epidemiological models can improve the spatial precision and timeliness of disease warnings.

We coupled a classic Cercospora leaf spot (CLS) negative-prognosis model with spatially explicit leaf area index (LAI) maps derived from multispectral satellite imagery (10 m), super-resolved imagery (1 m), and airborne campaigns (1 m). From these LAI time series, canopy closure dates were determined for each grid cell and used to initialise the CLS model. This workflow produced a distribution of earliest estimated epidemic onset dates (EEEOs) across the field, instead of a single area-averaged forecast. The method was benchmarked against ground observations of epidemic onset (EO) derived from repeated disease assessments in inoculated and non-inoculated plots.

EO occurred 156.9 days after sowing (DAS) in non-inoculated areas. Compared with the conventional, uniform-field prognosis, our spatially explicit approach predicted substantially earlier EEEOs—117.4 DAS for satellite, 114.0 DAS for super-resolved satellite, and 103.8 DAS for airborne imagery, with comparable trends in inoculated plots. These results confirm that accounting for within-field canopy heterogeneity allows earlier and more localised warnings, offering a pathway towards precision crop protection. The proposed workflow captures sub-field variability in canopy development missed by regional-scale disease models, thereby supporting more efficient scouting strategies and fungicide applications.

To promote transparency and reuse, all modelling and analysis steps are implemented in the open-source R package cercospoRa, which operationalises existing CLS rules and enables reproducible negative-prognosis modelling using FAIR (Findable, Accessible, Interoperable, Reusable) principles. The package provides a modular framework for integrating remote-sensing data, radiative transfer–based LAI retrieval, and epidemiological modelling. Beyond the case study presented here, cercospoRa can serve as an open hub for implementing new epidemiological components, such as inoculum distribution kernels or refined definitions of “epidemic onset”, and facilitate community-driven advance of spatial plant disease modelling.

Our results highlight that merging open data, Earth observation, and process-based modelling can bridge the current gap between plant epidemiology and agroecosystem monitoring. Future research aims to upscale these concepts towards landscape epidemiology, exploring how canopy heterogeneity, infection sources, and microclimatic variation combine across larger spatial scales to shape epidemic risk. By fostering open and reproducible workflows, we aim to advance data-driven, science-based decision support tools that contribute to sustainable, climate-resilient crop management.

How to cite: Heim, R., Melloy, P., Ispizua Yamati, F. R., Okole, N., Mikaberidze, A., and Mahlein, A.-K.: A spatially explicit negative‑prognosis framework for Cercospora leaf spot using remotely sensed leaf area index, EGU General Assembly 2026, Vienna, Austria, 3–8 May 2026, EGU26-4894, https://doi.org/10.5194/egusphere-egu26-4894, 2026.

EGU26-5216 | ECS | Orals | BG9.9

MS²-Net: A deep learning framework for high-throughput assessment of wheat emergence-stage plant density using multi-altitude multispectral UAV imagery 

Mengshuai Wang, Linjia Yao, Bin Chen, Zhiming Xia, Bo Pang, Zhijian He, Yingnan Wei, Genghong Wu, Qiang Yu, and Gang Zhao

Plant density at the wheat emergence stage is a fundamental structural attribute of agroecosystems, exerting strong control on early competition, resource use efficiency, and yield formation. While UAV-based counting approaches have been widely explored for visually distinct crops such as maize and cotton, accurate and scalable estimation of wheat seedlings remains challenging due to their small size, high spatial density, and spectral similarity to soil and residue backgrounds. Moreover, existing RGB-based UAV and ground imaging approaches face an inherent trade-off between spatial resolution, spectral sensitivity, and operational efficiency.

Here, we propose MS²‑Net (Multi-altitude, Multispectral Seedling Network), a high-throughput Earth-observation framework that integrates multi-altitude multispectral UAV observations with deep learning to enable robust estimation of wheat plant density at the emergence stage. Field experiments were conducted across three major wheat-growing regions in China (Henan, Hebei, and Shaanxi), covering approximately 1,500 plots spanning large variability in sowing density, genotype, and early growth conditions. Multispectral UAV imagery (blue, green, red, red-edge, and near-infrared) was acquired at four flight altitudes (12, 15, 20, and 40 m), enabling systematic evaluation of the trade-off between spatial detail and mapping efficiency. High-resolution smartphone images collected synchronously at plot level provided accurate reference plant counts for model training and validation.

All UAV data were radiometrically calibrated to surface reflectance and used to derive conventional vegetation indices (NDVI, GNDVI, NDRE, OSAVI, and a red-edge chlorophyll index) for spectral interpretability. Wheat plant density was estimated using a deep regression framework built on an EfficientNet-B6 backbone and enhanced with spectral-aware adaptation, spatial attention, and scale-consistent feature learning, allowing MS²-Net to exploit both multispectral information and multi-scale spatial patterns. Across five-fold cross-validation over regions and flight altitudes, MS²-Net achieved robust density estimation (R² = 0.86, RMSE = 37.20 plants m⁻², averaged across sites and flight altitudes), with red-edge and near-infrared bands contributing substantially to model stability across observation scales.

Results demonstrate that multi-altitude multispectral UAV observations provide a practical balance between spatial resolution, spectral sensitivity, and survey efficiency, outperforming both ground-based imaging and RGB-only UAV approaches for early wheat stand assessment. By enabling rapid, field-scale and spectrally informed plant density mapping, MS²-Net provides a scalable pathway for operational agroecosystem monitoring, high-throughput phenotyping, and precision crop management under real field conditions.

How to cite: Wang, M., Yao, L., Chen, B., Xia, Z., Pang, B., He, Z., Wei, Y., Wu, G., Yu, Q., and Zhao, G.: MS²-Net: A deep learning framework for high-throughput assessment of wheat emergence-stage plant density using multi-altitude multispectral UAV imagery, EGU General Assembly 2026, Vienna, Austria, 3–8 May 2026, EGU26-5216, https://doi.org/10.5194/egusphere-egu26-5216, 2026.

EGU26-6052 | ECS | Orals | BG9.9

Unsupervised detection of biotic and abiotic crop stress using Sentinel-2 time series and Isolation Forest  

Abhasha Joshi, Patrick Filippi, and Thomas Bishop

Detection of biotic and abiotic stress at the field level is an important crop monitoring task with varied applications, including the delineation of management zones and targeted management interventions. Satellite remote sensing provides extensive spatial and temporal coverage for this purpose; however, automated stress detection is constrained by a lack of field-level ground-truth data required to train supervised models. This study develops and evaluates an unsupervised anomaly-detection workflow for identifying biotic and abiotic crop stress using openly available Sentinel-2 satellite imagery, without relying on ground-truth labels. The study develops an Isolation Forest–based method incorporating within-season time-series data that include spectral bands and vegetation indices. Unlike traditional statistical anomaly-detection methods, this model-based technique accommodates multivariate inputs and does not require the assumption of a normal data distribution. Multiple feature configurations were assessed, including visible, red-edge, near-infrared, and shortwave infrared bands, their combinations, and selected vegetation indices. Anomaly scores were computed across multiple image acquisition dates, and only regions consistently identified as anomalous over time were retained as persistent stress signals. The framework was evaluated across three different stress scenariosfrost damage, Septoria disease incidence, and nitrogen deficiency. Results show that the proposed approach successfully detected stress patterns across all sites, achieving accuracies of up to 83%. In addition, the experiments identified key spectral features that were particularly informative for detecting each specific type of stress. This workflow offers a scalable and operationally feasible option for crop stress detection in agricultural systems where ground-truth data are limited. 

How to cite: Joshi, A., Filippi, P., and Bishop, T.: Unsupervised detection of biotic and abiotic crop stress using Sentinel-2 time series and Isolation Forest , EGU General Assembly 2026, Vienna, Austria, 3–8 May 2026, EGU26-6052, https://doi.org/10.5194/egusphere-egu26-6052, 2026.

EGU26-6102 | ECS | Orals | BG9.9

Assessing the dependence of paddy rice yield on field size across the Mekong Delta 

Qu Zhou, Zhixian Lin, Kaiyu Guan, Sheng Wang, and Xiangzhong Luo

The Mekong Delta contributes approximately 7–10% of the global rice trade, produced by about 1.5 million small-scale farmers. Understanding how field size affects rice yield is critical for advancing the sustainability and resilience of smallholder farming systems in the Mekong Delta. However, rice yield variability across field sizes remains poorly understood, due to the complexity of rice cropping systems and the lack of accurate field boundaries for smallholder farms in this region. In this study, we delineated field boundaries across the Mekong Delta using 3-m PlanetScope imagery and analyzed rice yield patterns across field sizes using near-infrared reflectance of vegetation (NIRv) as a yield proxy, derived from 10-m Sentinel-2 observations spanning 2019–2025. To delineate smallholder farms, we fine-tuned the Segment Anything Model (SAM), which generated field boundaries with an accuracy of 78%, an F1-score of 0.54, and a Matthew’s correlation coefficient (MCC) of 0.40. Using these boundaries, we assessed rice yield variability across field sizes and found that yield increased with field size (r = 0.30, p < 0.001). This relationship remained stable across years, indicating that smaller farms consistently experienced lower yields. This study contributes to understanding rice yield patterns within smallholder farming systems for better management practices in the Mekong Delta.

How to cite: Zhou, Q., Lin, Z., Guan, K., Wang, S., and Luo, X.: Assessing the dependence of paddy rice yield on field size across the Mekong Delta, EGU General Assembly 2026, Vienna, Austria, 3–8 May 2026, EGU26-6102, https://doi.org/10.5194/egusphere-egu26-6102, 2026.

Sugarcane is a vital sugar crop globally, yet its large-scale remote sensing monitoring is often hindered by the high costs of field sampling and the difficulty of reusing historical data across regions.Due to variations in climatic conditions and planting practices, sugarcane exhibits significant spatiotemporal phenological shifts across different regions, causing a sharp decline in the accuracy of traditional supervised classification models when applied cross-regionally. To address this challenge, this study proposes a Phenology-Constrained Joint Distribution Adaptation (PC-JDA) method that integrates biological mechanisms with transfer learning. Building upon the standard JDA algorithm, we innovatively introduce prior phenological knowledge as a constraint mechanism. Specifically, we utilize Dynamic Time Warping (DTW) to quantify phenological similarities between the source and target domains. Furthermore, during the iterative optimization process of JDA, standard NDVI time-series curves of sugarcane are employed to screen and correct the pseudo-labels generated for the target domain, thereby mitigating negative transfer effects. Experimental results transferring from Fusui (source) to Xuwen (target) demonstrate that this method effectively aligns the feature distributions of sugarcane between regions. It significantly improves identification accuracy in the target domain without labeled samples, providing a feasible and cost-effective solution for cross-regional crop mapping.

How to cite: Li, Z.: Cross-Regional Sugarcane Identification via Phenology-Constrained Joint Distribution Adaptation Method, EGU General Assembly 2026, Vienna, Austria, 3–8 May 2026, EGU26-6378, https://doi.org/10.5194/egusphere-egu26-6378, 2026.

EGU26-6972 | ECS | Posters on site | BG9.9

A Causal Machine Learning approach for estimating the heterogeneous effects of fertilizer dose and timing on smallholder maize yields in Tanzania 

Diego Quintero, Vasileios Sitokonstantinou, Jens A. Andersson, and Ioannis N. Athanasiadis

Smallholder farmers are responsible for 69% of the food produced in Tanzania, yet their productivity remains constrained by low soil fertility and limited economic access to inputs. While fertilizers are essential for achieving higher yields, suboptimal management can lead to environmental degradation and economic losses for the farmer. Therefore, optimizing the agronomic efficiency of fertilizers, specifically the question of the ideal dose and timing, is critical for the sustainable intensification of smallholder agriculture.  While on-farm field experiments are the gold standard to address this question, they are often prohibitively expensive, labor-intensive, geographically limited, and unable to account for farmer management differences. Causal Machine Learning offers a robust alternative that uses observational data by integrating the rigor of causal inference with the flexibility of Machine Learning. This approach is designed to overcome the selection bias present in observational data and some of the restrictive assumptions of standard statistical approaches. 
In this study, we analyze observational survey data from smallholder maize farmers in Tanzania (2023-24 season) using a Double Machine Learning approach to estimate conditional average treatment effects, identifying how Nitrogen and Phosphorus fertilizer response varies across different dose and timing regimes. Our findings show an average agronomic efficiency of 18 kg grain/kg of applied Nitrogen and 60 kg grain/kg of applied Phosphorus; results that closely align with established benchmarks from regional field trials. More importantly, our model captures management-driven heterogeneity. The results demonstrate that split applications of  Nitrogen –at planting/emergence and two times before silking– are more likely to provide higher efficiencies, while Phosphorus reaches peak efficiency when applied during the earliest development stage. Furthermore, the estimated dose-response curves exhibit characteristic diminishing returns; this showcases the framework’s ability to recover complex non-linear biophysical patterns. The successful recovery of these well-known agronomic insights from noisy observational data serves as a validation of the Causal Machine Learning framework for this specific context. This success demonstrates the potential to address increasingly complex agronomic challenges, utilizing existing datasets to identify site-specific patterns that provide a robust foundation for personalized optimal management.  

How to cite: Quintero, D., Sitokonstantinou, V., Andersson, J. A., and Athanasiadis, I. N.: A Causal Machine Learning approach for estimating the heterogeneous effects of fertilizer dose and timing on smallholder maize yields in Tanzania, EGU General Assembly 2026, Vienna, Austria, 3–8 May 2026, EGU26-6972, https://doi.org/10.5194/egusphere-egu26-6972, 2026.

EGU26-8435 | ECS | Posters on site | BG9.9

A Source-Free Unsupervised Domain Adaptation Framework for Large-scale, in-season Soybean Mapping 

Pengfei Tang, youngryel ryu, shaoyu wang, Ryoungseob Kwon, and Kyungdo Lee

Achieving reliable in-season soybean maps is challenging in heterogeneous and data-poor
agricultural landscapes because of domain discrepancies and limited reference data. Traditional
vegetation index methods and supervised machine-learning approaches often lack robustness
for early-season prediction, while conventional unsupervised domain adaptation (UDA)
typically requires access to source-domain data, increasing computational and data-sharing
burdens. In this study, we introduce a source-free UDA framework, Contrastive Representation
Optimized Prototype Segmentation (CROPS), for large-scale, early-season soybean mapping
without relying on source data. CROPS utilizes NDVI-Max composites from the
QualityMosaic method to emphasize peak vegetation signals, reduce noise and redundancy, and
simplify preprocessing. A pixel-wise entropy partitioning strategy identifies high- and low-
confidence regions, enabling curriculum-based optimization within a teacher-student
architecture enhanced by Exponential Moving Average (EMA). Extensive experiments across
the USA, China, Brazil, and Argentina demonstrate that CROPS consistently surpasses
traditional indices, supervised classifiers, and established UDA methods. At the end of the
season, CROPS achieved average macro F1 scores exceeding 92%, closely matching official
agricultural statistics. Importantly, in South America, CROPS enables reliable early-season
mapping, with macro F1 above 90% in Brazil by mid-January and over 80% in Argentina by late
January. In the US Midwest, where the spectral similarity between soybean and maize makes
accurate classification particularly challenging during the growing season, CROPS achieves
robust in-season mapping for both crops. Ablation experiments reveal that this strong
performance is primarily attributed to the NDVI-Max composites’ ability to capture key
phenological features and to the progressive self-adaptive learning process, in which high-
confidence target-domain samples iteratively guide the low-confidence ones. This strategy
avoids negative transfer from source data and enhances adaptation to local characteristics.
These findings underscore the potential of CROPS as a timely, accurate, and scalable solution
for crop mapping in complex, data-limited environments.

How to cite: Tang, P., ryu, Y., wang, S., Kwon, R., and Lee, K.: A Source-Free Unsupervised Domain Adaptation Framework for Large-scale, in-season Soybean Mapping, EGU General Assembly 2026, Vienna, Austria, 3–8 May 2026, EGU26-8435, https://doi.org/10.5194/egusphere-egu26-8435, 2026.

Near-real-time daily high-resolution estimates of crop gross primary productivity (GPP) are crucial for accurate biomass and yield estimation. The multiplicative combination of near-infrared reflectance of vegetation and photosynthetically active radiation (NIRvP) serves as a biophysically grounded proxy that enhances the responsiveness of GPP estimation. However, a mechanistic model for accurately estimating GPP using NIRvP remains lacking, which limits the potential for enhanced crop productivity assessments. In this study, we developed a model based on the NIRvP and eco-evolutionary optimality (EEO) theory (NIRvP-EEO) with Sentinel-2 imagery and meteorological data on Google Earth Engine for crop GPP estimation without the need for calibration. Specifically, we integrated the Ball-Berry stomatal conductance model into NIRvP-EEO to balance carbon and water vapor fluxes. To enable near-real-time daily monitoring of crop GPP, we employed temporal-weighted interpolation and Whittaker-smoothing filtering methods to fill data gaps. Compared to benchmark models such as enhanced SatelLite Only Photosynthesis Estimation (ESLOPE), crop SLOPE (CSLOPE), GPP network (GPP-net) and P-model, the NIRvP-EEO model demonstrated improved daily GPP estimation for four major crops including corn, soybean, wheat and rice. We found that NIRvP-EEO could reliably GPP estimation not only in drought and heatwave years but also in flood years. Additionally, the model effectively captures the fine spatial details and interannual variations in GPP for these crops. By leveraging the Google Earth Engine platform, our model enables conduct near-real-time daily continuous monitoring of crop GPP at a high spatial resolution anywhere in the world.

How to cite: Yu, W., Ryu, Y., Zhang, H., Wang, S., and Feng, H.: NIRvP-EEO: An NIRvP-based eco-evolutionary optimality model for near-real-time daily crop gross primary productivity estimation at field scale, EGU General Assembly 2026, Vienna, Austria, 3–8 May 2026, EGU26-8451, https://doi.org/10.5194/egusphere-egu26-8451, 2026.

EGU26-8816 | ECS | Posters on site | BG9.9

Towards Transferable Soil Property Estimation from Multi-Source Spectral Data 

Elakkiyaa Thiyagarajan Logambal and Debsunder Dutta

Soil properties such as soil organic carbon (SOC) and clay content are key indicators of ecosystem functioning, land degradation, and environmental change. Advances in spaceborne hyperspectral remote sensing enable new possibilities for large-scale soil property monitoring. However, differences in sensor characteristics, acquisition conditions, and surface heterogeneity continue to limit the transferability of retrieval models across regions and observation systems. This study investigates the role of spectral preprocessing in improving the transferability of soil property estimation using multi-source spectral data. We evaluate continuum removal (CR) and first-derivative (FD) transformations to improve the interpretability and alignment of diagnostic soil absorption features in laboratory and satellite reflectance spectra. Using different spectral datasets, we assess the impact of preprocessing on feature comparability, predictive performance, and robustness under varying data distributions. We further examine how spectral heterogeneity and distribution shifts influence model generalization. Our results demonstrate that robust preprocessing improves the comparability of spectral features and strengthens model transferability. These findings highlight the importance of sensor-independent preprocessing strategies for reliable and scalable soil property mapping using multi-source remote sensing data in environmental monitoring applications.

How to cite: Thiyagarajan Logambal, E. and Dutta, D.: Towards Transferable Soil Property Estimation from Multi-Source Spectral Data, EGU General Assembly 2026, Vienna, Austria, 3–8 May 2026, EGU26-8816, https://doi.org/10.5194/egusphere-egu26-8816, 2026.

EGU26-10454 | ECS | Orals | BG9.9

High-Resolution Plant Area Index Estimation in Cherry Orchards Using UAV LiDAR for Agroecosystem Monitoring 

Marcel El Hajj, Kasper Johansen, Fabio Camargo, Oliver Lopez Valencia, Yu-Hsuan Tu, Victor Angulo Morales, Omar A. López Camargo, Samer K. Al Mashaharawi, Dominique Courault, and Matthew F. McCabe

Monitoring crop conditions is crucial for effective crop management and provides valuable insights into soil-plant-atmosphere interactions. While some studies have used unmanned aerial vehicle (UAV)-based light detection and ranging (LiDAR) data for mapping plant area index (PAI) in orchards, LiDAR-based time-series analysis to assess PAI variations with phenology throughout the growing season represents a significant gap in knowledge. Tracking PAI dynamics across phenological stages reflects canopy development and leaf expansion, which are directly linked to yield formation. Furthermore, the optimal spatial resolution for mapping biophysical variables of tree crops from LiDAR point clouds is yet to be determined. This study aimed to demonstrate the potential of UAV-derived LiDAR time-series to monitor the PAI and tree vertical profiles at high spatial resolution throughout the growing season of a cherry orchard located in southeastern France. A time series of 14 point cloud acquisitions with a density of 3300 points/m² was collected between February and December 2022, with at least one acquisition per month, covering all phenological stages of the cherry orchard. Field measurements were collected on May 30, and October 6, to measure the PAI at twilight using an LAI-2200C Plant Canopy Analyzer (LI-COR Biosciences, Lincoln, NE, USA), with 248 trees sampled. A voxel-based method was applied on the LiDAR point cloud data to create a three-dimensional grid within which PAI was estimated for each voxel. The results showed that a voxel size of at least 70 cm is required to retrieve reliable PAI estimates, while a voxel size of 100 cm produced the most accurate PAI estimates (RMSE = 0.5 m2.m-2, bias = 0.07, R2 = 0.59), when assessed against in-situ PAI measurements. The temporal variation of canopy PAI illustrated the progression of the phenological stages, including flowering, leaf development, ripening and senescence, and the response of the canopy to drought stress (reduction in PAI due to leaf rolling) during the summer. The maps of PAI successfully described the variations in leaf canopy density for different cherry varieties and allowed assessment of the vertical PAI profile at the individual tree level. The LiDAR-derived PAI maps and vertical profiles were able to detect trees exhibiting poor leaf development, which is an important health indicator for effective crop management in orchard settings. Future work should focus on applying UAV-derived observations to optimize crop models to enhancing decision-making tools for effective orchard management.

How to cite: El Hajj, M., Johansen, K., Camargo, F., Lopez Valencia, O., Tu, Y.-H., Angulo Morales, V., López Camargo, O. A., Al Mashaharawi, S. K., Courault, D., and McCabe, M. F.: High-Resolution Plant Area Index Estimation in Cherry Orchards Using UAV LiDAR for Agroecosystem Monitoring, EGU General Assembly 2026, Vienna, Austria, 3–8 May 2026, EGU26-10454, https://doi.org/10.5194/egusphere-egu26-10454, 2026.

EGU26-10845 | ECS | Orals | BG9.9

Fusing UAV-based hyperspectral and RGB imagery for potato plant disease detection 

Tianyi Jia, Magdalena Smigaj, Gert Kootstra, and Lammert Kooistra

Pest and pathogen pressure in potato cultivation is increasingly affecting the potato quality and yield. The Netherlands, as the largest seed potato producer around the world, is particularly threatened by blackleg disease and potato virus Y (PVY). Uncrewed aerial vehicle (UAV)-based imaging combined with machine- and deep-learning methods have shown clear potential for potato disease identification, offering advantages over conventional human inspections, which are labor-intensive, expertise-demanding, and often subjective. Most existing studies focused on RGB data and pixel-level classification, producing maps that have limited practical value for targeted removal of infected plants. Earlier work demonstrated the potential of plant-level disease detection approaches. For example, Jia[1] employed hyperspectral data (specifically the first three principal component analysis (PCA) bands) with a YOLOv5s model to distinguish the blackleg- and PVY-infected plants from healthy ones, yielding average mAP@.50 scores of 0.85 for blackleg detection and 0.82 for PVY detection. Gibson-Poole[2] applied object-based image analysis (OBIA) to detect blackleg disease with RGB imagery, achieving a total accuracy of 87%. The findings suggest that multi-modal data (combining hyperspectral and RGB imagery) hold strong potential for plant-level disease detection. We aim to identify the most informative features derived from hyperspectral data and to investigate their integration with RGB data to enhance potato disease detection performance.

We proposed early fusion (E), where data were concatenated channel-wise before network input, and middle fusion (M) architectures, where features were extracted separately within a two-branch network and then merged at an intermediate stage, to integrate hyperspectral features and RGB imagery for potato disease detection. To reduce hyperspectral dimensionality, two feature sets were extracted: (i) the first three PCA bands, and (ii) 10 vegetation indices (VIs) selected from 64 candidates using variance inflation factor analysis to mitigate multicollinearity. Consequently, four models were developed and evaluated: E-PCA-RGB, E-VI-RGB, M-PCA-RGB, and M-VI-RGB. Unlike previous studies that focused on a single disease, our models detected blackleg-infected, PVY-infected, and healthy plants simultaneously. E-VI-RGB achieved the highest mAP@.50 value of 86.65±1.53, followed by M-VI-RGB (85.74±1.75). E-PCA-RGB and M-PCA-RGB yielded mAP@.50 scores of 83.00±2.52 and 83.11±2.20, respectively. These results demonstrate that combining hyperspectral features with RGB imagery improves detection performance compared with single-modality approaches (RGB 83.21±1.31, PCA 79.71±1.30, VIs 85.31±2.11). Our findings highlight the potential of multimodal fusion for potato disease detection in practice. The methods could enable automated systems not only to identify infected plants but also to support timely removal with machinery, mitigating the spread of disease in potato fields. The generalizability of our approach will be further tested and analyzed in future work.

References

[1] Jia, T., Smigaj, M., Kootstra, G. and Kooistra, L., 2024. Detection of Diseased Potato Plants with UAV Hyperspectral Imagery. In 2024 14th Workshop on Hyperspectral Imaging and Signal Processing: Evolution in Remote Sensing (WHISPERS) (pp. 1-5). IEEE.

[2] Gibson-Poole, S., Humphris, S., Toth, I. and Hamilton, A., 2017. Identification of the onset of disease within a potato crop using a UAV equipped with un-modified and modified commercial off-the-shelf digital cameras. Advances in Animal Biosciences8(2), pp.812-816.

How to cite: Jia, T., Smigaj, M., Kootstra, G., and Kooistra, L.: Fusing UAV-based hyperspectral and RGB imagery for potato plant disease detection, EGU General Assembly 2026, Vienna, Austria, 3–8 May 2026, EGU26-10845, https://doi.org/10.5194/egusphere-egu26-10845, 2026.

EGU26-10857 | ECS | Orals | BG9.9

Phenological Alignment and Divergence in Agricultural Systems Derived from Sentinel-1 

Johannes Löw, Christopher Conrad, Steven Hill, Tobias Ullmann, and Insa Otte

This study presents a novel framework for monitoring crop phenology using Sentinel-1 (S1) time series data. The proposed approach establishes explicit links between landscape-scale vegetation patterns and field-level phenological developments to address three key objectives: evaluating the agreement between field and landscape phenological signals, identifying dominant phenological tendencies at the field scale, and detecting phenological outliers. Two core indicators were developed—Average Agreement (AVA), which quantifies the correspondence between individual field dynamics and overall landscape development, and Dominance of Tendency (DoT), which characterizes whether fields are phenologically ahead or behind the broader landscape trend, while assessing the consistency of these tendencies across multiple S1 features and orbits.

Environmental descriptors, including soil organic carbon, topographic wetness index, and elevation, were found to shape the spatial and temporal variability of both indicators. Although no single dominant driver was identified, random forest analyses achieved an R2 of 0.8, highlighting the complex, multifactorial nature of phenological processes. By integrating growing degree day (GDD) information and S1 time series metrics, the framework reduces reliance on extensive in situ measurements while enabling robust field-scale characterization of phenological progression.

Results show that combining outlier detection with cross-scale comparisons provides valuable insights into typical and atypical crop behavior, supporting assessments of climate vulnerability, resilience, and adaptive management strategies. The flexibility of the method allows seamless application across various S1 features, acquisition geometries, and crop types, demonstrating strong potential for upscaling to regional or national monitoring as well as for broader studies of phenological dynamics.

This work establishes a data-driven pathway toward advanced agricultural management by linking temporal S1 observations with crop performance indicators, thereby enhancing informed decision-making in a sector increasingly challenged by climate change.


How to cite: Löw, J., Conrad, C., Hill, S., Ullmann, T., and Otte, I.: Phenological Alignment and Divergence in Agricultural Systems Derived from Sentinel-1, EGU General Assembly 2026, Vienna, Austria, 3–8 May 2026, EGU26-10857, https://doi.org/10.5194/egusphere-egu26-10857, 2026.

EGU26-11089 | ECS | Orals | BG9.9

From rice planting area mapping to rice agricultural system mapping: A holistic remote sensing framework for understanding China's complex rice systems 

Zizhang Zhao, Jinwei Dong, Jilin Yang, Luo Liu, Nanshan You, Xiangming Xiao, and Geli Zhang

Information on the rice agricultural system, including not only planting area but also phenology and cropping intensity, is critical for advancing our understanding of food and water security, methane emissions, carbon and nitrogen cycles, and avian influenza transmission. However, existing efforts primarily focus on mapping planting area and lack a comprehensive picture of the rice agricultural system. To address this gap, we propose a remote sensing-based comprehensive framework for mapping the rice agricultural system in China: First, we identified valid growth cycles of crop by using 30-m Sentinel-2 and Landsat fused data; Second, we applied a well-established phenology-based algorithm to map rice planting areas, by extracting the flooding and rapid growth signals in the transplanting and rapid growth temporal windows; Third, the rice-specific phenology phases (i.e., transplanting, tillering, heading, and mature) were identified using a phenology extraction method tailored to the physiological characteristics of rice; Finally, rice cropping intensity was determined based on detailed phenological phases and planting area data. Due to the accurate identification of crop cycles and pixel-level temporal windows at the national scale, the generated rice planting area maps exhibit a high accuracy across China, with both overall accuracy and F1 scores exceeding 0.8, based on validation with over 13,000 field samples. Improvements in the extraction method have addressed the lag in phenology detection caused by rice's flooded environment, leading to more accurate phenological information. As a result, the phenological data shows reliable accuracy (R2 of 0.6–0.8 and RMSE of 8–15 days), facilitated by the mutual enhancement of rice planting area and phenology mapping. The resultant rice phenology and cropping intensity maps are the first of their kind with 30 m resolution. Together, the resultant rice planting area, rice phenology, and cropping intensity maps provide, for the first time, a comprehensive picture of China's rice agricultural system, better supporting multiple targets related to Sustainable Development Goals.

How to cite: Zhao, Z., Dong, J., Yang, J., Liu, L., You, N., Xiao, X., and Zhang, G.: From rice planting area mapping to rice agricultural system mapping: A holistic remote sensing framework for understanding China's complex rice systems, EGU General Assembly 2026, Vienna, Austria, 3–8 May 2026, EGU26-11089, https://doi.org/10.5194/egusphere-egu26-11089, 2026.

The stabilization of soil organic carbon (SOC) in forest ecosystems is crucial for mitigating climate change. However, the interaction of mycorrhizal associations with environmental factors to influence SOC fractions globally remains poorly understood. Here, we synthesize 2,784 observations from 234 peer-reviewed studies to examine global patterns of particulate (POC) and mineral-associated organic carbon (MAOC) in forests dominated by arbuscular (AM) versus ectomycorrhizal (ECM) forests. Our results reveal that ECM forests possess 24% higher POC content and exhibit greater sensitivity to climate warming than AM forests. In contrast, AM forests sustain higher MAOC content, which shows less variability across climate gradients. Linear mixed-effects models indicate distinct responses of POC and MAOC to the interactive effects of mycorrhizal type and environmental drivers. Notably, POC content in ECM forests increases with stand age. While young AM forests contain higher levels of both POC and MAOC, middle-aged and mature ECM forests surpass AM forests in POC, with no significant difference in MAOC. Using existing data, we project global changes in these SOC fractions and propose a mycorrhiza-informed framework for forest carbon sequestration. Our findings underscore the pivotal role of mycorrhiza-environment interactions in SOC partitioning and stabilization, offering critical insights for refining global carbon models and guiding climate-smart forest management.

How to cite: Chen, J., Liu, S., and Sun, S.: Mycorrhiza-mediated distribution of particulate and mineral-associated organic carbon across global forests, EGU General Assembly 2026, Vienna, Austria, 3–8 May 2026, EGU26-12127, https://doi.org/10.5194/egusphere-egu26-12127, 2026.

EGU26-12595 | ECS | Posters on site | BG9.9

Transformer-Based Adaptive Multimodal Fusion Model for Remote Sensing Winter Wheat Yield Prediction 

Haoran Meng, Joel Segarra, Shawn Carlisle Kefauver, and José Luis Araus Ortega

Large-scale and highly accurate wheat yield prediction is of great importance for ensuring food security, supporting agricultural policymaking, and guiding grain allocation. In recent years, the rapid development of remote sensing technologies and deep learning algorithms has provided powerful tools for large-scale crop yield prediction. However, crop yield is jointly influenced by multiple environmental factors, such as climate, soil, and topography. Existing studies often adopt simple feature concatenation or fixed-weight fusion strategies, lacking adaptive modeling of relative modality importance, which limits further improvement in prediction accuracy. To address this issue, this study proposes a Transformer-based multimodal adaptive Gated Fusion model (TMMGF). The model employs Transformers to model dynamic time series of remote sensing spectral data and climate variables, applies multilayer perceptrons (MLP) to handle static environmental factors including soil and topography. Multiple modalities are then integrated through a gated fusion mechanism to achieve adaptive weighted fusion. This study was conducted across the conterminous United States, based on county-level winter wheat yield records from 2008 to 2023. The TMMGF was systematically compared with an LSTM-based multimodal adaptive Gated Fusion model (MMGF), Transformer single-modal remote sensing model, Transformer single-modal climate model, MLP single-modal soil model, and MLP single-modal topography model. The results show that TMMGF achieves the best performance, with an average R² of 0.813, RMSE of 0.571 t/ha, and MAPE of 14.49% in 10-fold cross-validation, significantly outperforming the baseline models. In particular, compared with the LSTM-based multimodal model MMGF (R² = 0.796, RMSE = 0.598 t/ha, MAPE = 15.11%), TMMGF shows clear advantages in both accuracy and stability. This study demonstrates that a Transformer-based adaptive multimodal fusion framework can effectively integrate heterogeneous data sources and provides a promising technical pathway for high-accuracy large-scale wheat yield prediction.

How to cite: Meng, H., Segarra, J., Kefauver, S. C., and Araus Ortega, J. L.: Transformer-Based Adaptive Multimodal Fusion Model for Remote Sensing Winter Wheat Yield Prediction, EGU General Assembly 2026, Vienna, Austria, 3–8 May 2026, EGU26-12595, https://doi.org/10.5194/egusphere-egu26-12595, 2026.

EGU26-12956 | ECS | Orals | BG9.9

Evaluating land and tree cover datasets for the identification of agroforestry in temperate Europe 

Arina Machine, Moya Burns, and Heiko Balzter

Agroforestry, the integration of trees on productive agricultural land (Mosquera-Losada et al., 2018), can be identified through remote sensing methods by the combination of land cover and tree cover maps. Previous work has classified agroforestry as agricultural land with greater than 5% tree cover (Lawson et al., 2025; Zomer et al., 2016).

However, there exist several regional, European, and global land cover and tree cover products that could be suitable for agroforestry identification, but these products vary in resolution, data inputs, and methodology of production. Our work benchmarked the performance of four land cover maps(Büttne et al., 2021; Karvatte et al., 2021; Schultz et al., 2025; UKCEH, 2022) and nine tree cover maps(Brandt et al., 2024; Copernicus, 2023, 2025; Hunter et al., 2025; Lang et al., 2023; Tolan et al., 2024; Weinstein et al., 2020) that were capable of mapping trees outside of woodlands.  We evaluated the datasets’ ability to identify agroforestry on 25 agroforestry sites across the United Kingdom, including a mix of silvoarable and silvopastoral systems, as well as planting ages, densities, and species, as well as nearby agricultural (no trees) and woodland (no agriculture) control fields.

We found that a number of datasets used in previous studies underperformed when distinguishing agroforestry from control fields as well as the previously utilised pixel-based approaches being unsuitable to identify agroforestry fields as a whole. Datasets with coarse resolutions (>10m) often confused proximal small woodlands for trees within agricultural fields. Many datasets struggled to map trees in silvoarable systems, likely due to their linear arrangement differing from that of other trees outside of woodlands.

In addition, the majority of datasets were unable to identify agroforestry sites planted since 2000, suggesting a 20-year lag in identification. The only tree identification method capable of identifying young sites was the fine-tuning of the DeepForest tree detection model (Weinstein et al., 2020) with local data, suggesting a need for tree cover datasets that are capable of identifying seedlings and saplings.

We used the best-performing datasets (balanced accuracy 83-87%) to create a map of agroforestry, with quality flags to signify agreement between datasets. We conclude that there is 517,300 ha (3% of UAA) of area under agroforestry in the United Kingdom. Our map could have further use cases for calculating the uptake of agroforestry, as well as its benefits to people and nature, such as carbon storage, biodiversity impacts, farm income, and health of crops and livestock. We also conclude the need for model training on agroforestry trees, to both identify young trees and those with complex planting arrangements.

How to cite: Machine, A., Burns, M., and Balzter, H.: Evaluating land and tree cover datasets for the identification of agroforestry in temperate Europe, EGU General Assembly 2026, Vienna, Austria, 3–8 May 2026, EGU26-12956, https://doi.org/10.5194/egusphere-egu26-12956, 2026.

Reliable quantification of agricultural water use and greenhouse gas (GHG) emissions is essential for understanding and mitigating the environmental footprint of food production. However, it remains challenging due to the limited spatial representativeness of in-situ measurements and the strong influence of vegetation dynamics, management practices, and weather variability. Eddy-covariance (EC) observations provide direct and high-frequency measurements of evapotranspiration (ET) and GHG fluxes, but their footprint is inherently local, constraining their applicability for regional and national assessments. Satellite remote sensing (RS) offers spatially continuous information on vegetation status and land cover, yet its effective integration with flux observations for process-relevant upscaling remains limited.

In this contribution, we provide first insights from a synthesis of recent field-scale literature, comprising over 300 ET studies and more than 400 GHG-focused studies, to assess how remote sensing information has been incorporated into ET and GHG flux modelling. Our review indicates a clear divergence in modelling development trajectories across flux types. Earlier ET studies were largely dominated by physically based formulations, such as Penman–Monteith and surface energy balance models. Over the past five years, ET modelling has shifted toward data-driven and machine-learning approaches, enabling the integration of a broader range of satellite-derived predictors, including vegetation indices and shortwave infrared (SWIR)-based indicators related to soil moisture conditions. Net ecosystem exchange (NEE) exhibits a similar transition from process-based to data-driven modelling frameworks, reflecting improved data availability and methodological flexibility.

In contrast, modelling of other GHG fluxes, particularly CH4 and N2O, remains largely confined to process-based approaches, with DNDC and DayCent being the most widely applied models. This persistence primarily reflects the limited availability of long-term, high-quality ground-based GHG flux measurements. Moreover, RS-based information on soil moisture and temperature, vegetation status, and land-use or management practices offers potential to better inform and constrain GHG flux estimates in agricultural systems. These findings highlight a persistent gap between the availability of spatially explicit satellite information and its current use in GHG flux modelling, pointing to substantial opportunities for improved integration of remote sensing and in-situ flux observations in future upscaling efforts.

How to cite: Jia, A., Aasen, H., and Buchmann, N.: Integrating Eddy-Covariance and Satellite Data to Upscale ET and GHG Fluxes across Swiss Agricultural Systems, EGU General Assembly 2026, Vienna, Austria, 3–8 May 2026, EGU26-13185, https://doi.org/10.5194/egusphere-egu26-13185, 2026.

EGU26-13294 | ECS | Orals | BG9.9

Global Rice Mapping Driven by Intelligent Models and Big Earth Data Supporting Progress Assessment of SDG 2 

Lu Xu, Hong Zhang, Huadong Guo, Mingyang Song, Lijun Zuo, and Yazhe Xie

Global food security is facing increasing pressure from population growth and climate change. Rice, the staple food for over half of the world’s population, is essential to nutritional supply and social stability, especially in developing regions. Highly dependent on water resources, rice production is highly sensitive to climate change and extreme events, and its changes affect global carbon emissions backward. Therefore, timely, accurate, and high-resolution global rice distribution information is indispensable for agricultural management and hunger elimination to achieve Sustainable Development Goal 2 (Zero Hunger) of the United Nations.

Overcoming the uncertainty of optical remote sensing data acquisition with all-weather, all-time, and stable revisits, Synthetic aperture radar (SAR) provides a highly promising solution for the timely acquisition of global rice cultivation. Deep learning models provide strong interpretability of rice scattering patterns and superior generalization capabilities among different agricultural scenarios. Combining the most advanced computation technology with the big remote sensing data, we developed a Time-Series-to-Vision Rice Classification Model (T2VRCM). Instead of learning from the remote sensing image stacks, T2VRCM learns the intrinsic feature variations during rice growth with standardized 2D visual representations, so that problems such as irregular sampling and insufficient modalities can be avoided. A novel global rice dataset, GlobalRice20, was achieved, providing comprehensive and consistent global rice cultivation data in 2015 and 2024 at 20 m resolution for the first time. An overall accuracy of 92.33% was achieved with rigorous validation against over 160,000 reference samples, enabling promising spatiotemporal analysis over the first decade of the SDGs.

Our team has been dedicated to large-scale rice mapping using intelligent computation methods, advancing from national and regional to global scales. Starting with the classic U-Net model, we produced the first 20 m interannual rice maps for Southeast Asia (2019–2021) using time-series Sentinel-1 data. We then proposed an optical–SAR fusion strategy using stacked random forests to generate EARice10, a 10 m rice distribution product in 2023 with comprehensive coverage of four East Asia countries. To overcome global spatial heterogeneity, we further upgraded the framework to the Explainable Mamba U-Net (XM-UNet). With strong generalization, the model provides a physically explainable interpretation of multi-temporal Sentinel-1 SAR data and possesses robust generalization capabilities in countries with diverse cultivation patterns. In addition, we constructed the world's first plot-level rice dataset, Plot-Rice v1.0, with the SAM-2 model and Sentinel-1/2 features. Covering various climatic zones, the dataset supports multiple mainstream deep learning models and demonstrates strong transferability among cross-regional and cross-annual scenarios.

As a result of the achievements outlined above, we provided the 20 m global rice product in 2023 to support the assessments of the UN’s SDG2 indicators, as detailed in the Reports on Big Earth Data in Support of the Sustainable Development Goals in 2024 and 2025. This study reveals the up-to-date progress of our research to address advanced intelligent models in global rice mapping. Meanwhile, we are developing an in-season rice mapping methodology to enhance the timeliness of rice distribution information, in comparison to the current mainstream post-season rice mapping methods.

How to cite: Xu, L., Zhang, H., Guo, H., Song, M., Zuo, L., and Xie, Y.: Global Rice Mapping Driven by Intelligent Models and Big Earth Data Supporting Progress Assessment of SDG 2, EGU General Assembly 2026, Vienna, Austria, 3–8 May 2026, EGU26-13294, https://doi.org/10.5194/egusphere-egu26-13294, 2026.

EGU26-14192 | ECS | Orals | BG9.9

Integrated In-season Rapeseed Mapping and Flowering Retrieval: A Multi-task Transformer Framework Using Sentinel-1 and Sentinel-2 

Yunze Zang, Xuehong Chen, Miaogen Shen, Wei Yang, Anton Vrieling, Claudia Paris, Bingwen Qiu, Lang Xia, Shangrong Wu, and Jin Chen

As a globally vital oilseed, rapeseed necessitates precise in-season mapping to support field management. Furthermore, the accurate retrieval of peak flowering dates is critical for yield estimation, as this phenological stage directly correlates with crop productivity. While state-of-the-art methods have advanced both crop mapping and phenology retrieval, existing approaches predominantly address these tasks in isolation, thereby neglecting their inherent phenological interdependence. Specifically, in-season mapping is often confounded by early-season phenological heterogeneity across fields and regions, whereas flowering retrieval typically relies on the prerequisite of an accurate a priori crop map. To address these limitations, this study introduces a multi-task Transformer-based framework that simultaneously maps rapeseed and retrieves peak flowering dates using Sentinel-1 and Sentinel-2 time series. Reliable training samples were automatically generated via phenology-based rules applied to cloud-free time series. To enhance the robustness against cloud contamination, a data augmentation strategy was introduced that masks Sentinel-2 observations using real-cloud temporal masks to simulate realistic data unavailability. The proposed architecture integrates a dual-task framework with adaptive loss weighting to dynamically balance learning gradients between tasks. Extensive validation across 13 European countries, covering a flowering gradient of up to two months, demonstrates that the proposed method achieves an F1-score of 0.89 for rapeseed mapping four months prior to harvest, and a Mean Absolute Error (MAE) of 6 days for peak flowering retrieval. These results substantially outperform both conventional sequential single-task baselines and specialized state-of-the-art methods. Furthermore, independent validation against phenological records from the German Weather Service (DWD) further confirm the robustness of the proposed method in flowering retrieval. To provide interpretable insights into the model's effectiveness, we analyzed Transformer attention maps and band importance. These visualizations substantiate that the multi-task model effectively extracts task-shared spectral-temporal features, offering a clear and interpretable basis for its enhanced generalization. Overall, this study presents a practical, scalable solution for integrated, large-scale rapeseed monitoring, demonstrating a robust framework that is adaptable to the integrated monitoring of other crops.

How to cite: Zang, Y., Chen, X., Shen, M., Yang, W., Vrieling, A., Paris, C., Qiu, B., Xia, L., Wu, S., and Chen, J.: Integrated In-season Rapeseed Mapping and Flowering Retrieval: A Multi-task Transformer Framework Using Sentinel-1 and Sentinel-2, EGU General Assembly 2026, Vienna, Austria, 3–8 May 2026, EGU26-14192, https://doi.org/10.5194/egusphere-egu26-14192, 2026.

EGU26-15427 | ECS | Orals | BG9.9

Weed Segmentation in Fallow Farmlands Using the ANYSAT Foundation Model  

Ratneel Deo, Patrick Filippi, and Thomas Bishop

Accurate mapping of weed infestations in fallow farmlands is critical for supporting sustainable weed management and reducing unnecessary chemical inputs. Previous work has demonstrated the effectiveness of convolutional encoder–decoder architectures, such as U-Net, for weed segmentation from satellite imagery; however, these approaches are typically constrained by sensor-specific training, limited cross-site generalisation, and sensitivity to variations in spectral and spatial resolution.  In this study, we investigate the application of the ANYSAT foundation model [1] for sensor-agnostic weed segmentation across heterogeneous fallow agricultural farms across Australia. Building on top of an established U-Net-based workflow, we evaluate whether a foundation model pretrained on diverse Earth observation data can improve robustness and transferability across multiple satellite sensors without explicit sensor-dependent retraining. Multi-spectral satellite imagery from different platforms is used to fine-tune ANYSAT for semantic segmentation of weed presence in fallow paddocks, with human-curated and U-Net-refined weed masks serving as supervisory labels.  We design a systematic evaluation strategy based on leave-one-farm and leave-one-region validation to test model robustness under spatial and spectral variability. Rather than focusing on achieved performance, this work emphasises assessing feasibility, identifying the strengths and limitations of foundation-model-based segmentation for this task, and outlining key considerations for operational deployment in data-sparse agricultural settings. By framing weed detection as a sensor-agnostic problem, this study provides a structured pathway for testing foundation models in agroecosystem monitoring. It contributes to understanding how emerging Earth observation foundation models can be adapted for practical agricultural applications. 

[1Astruc, Guillaume, et al. "AnySat: One Earth Observation Model for Many Resolutions, Scales, and Modalities." Proceedings of the Computer Vision and Pattern Recognition Conference. 2025. 

How to cite: Deo, R., Filippi, P., and Bishop, T.: Weed Segmentation in Fallow Farmlands Using the ANYSAT Foundation Model , EGU General Assembly 2026, Vienna, Austria, 3–8 May 2026, EGU26-15427, https://doi.org/10.5194/egusphere-egu26-15427, 2026.

EGU26-15448 | Posters on site | BG9.9

Rice Functional Responses to Biochar and Straw Return in the Lower Yangtze Region Revealed by UAV-based Sun-Induced Chlorophyll Fluorescence 

Lian Song, Chuang Cai, Zhengjun Wang, Hao Chen, Jiahui Yuan, Rui Wang, Yang Liu, Qian Zhang, and Yu Wang

Biochar application and straw return are widely promoted as sustainable fertilization practices to enhance crop production, yet their impacts on growth processes, structural traits and physiological functioning remain insufficiently quantified, particularly from a canopy-scale perspective. During the 2025 rice-growing season, we conducted a field experiment in Yixing, located in the lower Yangtze River region, to investigate rice functional responses to biochar and straw return and to evaluate the capability of sun-induced chlorophyll fluorescence (SIF) to detect these responses.

The experiment included conventional fertilization as a control, three biochar application rates (0.10%, 0.50%, and 1.00%), and partial straw return. Biochar and straw return substantially enhanced root biomass (by 25–37%) and leaf area index (by 10–31%) across key growth stages, indicating improved resource acquisition capacity and canopy development. These belowground-driven changes translated into increased aboveground biomass accumulation, particularly before heading, and higher panicle density, contributing to yield formation. At the same time, biochar application increased canopy temperature and reduced leaf chlorophyll content, suggesting altered nitrogen distribution and canopy energy balance under intensified growth conditions. High biochar application reduced grain filling percentage, indicating that productivity gains are constrained by physiological regulation during reproductive stages.

To characterize canopy-scale functional dynamics, unmanned aerial vehicle (UAV) campaigns were conducted at jointing, heading, and grain-filling stages to acquire SIF observations. SIF showed strong sensitivity to management-induced differences in canopy structure, biomass accumulation, and phenological progression, consistently reflecting treatment effects across growth stages. Importantly, SIF captured both enhanced canopy function under moderate biochar and straw return and constrained physiological performance under excessive application, demonstrating its ability to integrate multiple plant functional responses.

Our results show that biochar and straw return regulate rice productivity through coordinated changes in root development, canopy structure, and physiological functioning. UAV-based SIF provides an effective, non-destructive approach to monitor these management-driven functional responses, offering new opportunities to link field experiments with larger-scale assessments of sustainable agricultural practices.

How to cite: Song, L., Cai, C., Wang, Z., Chen, H., Yuan, J., Wang, R., Liu, Y., Zhang, Q., and Wang, Y.: Rice Functional Responses to Biochar and Straw Return in the Lower Yangtze Region Revealed by UAV-based Sun-Induced Chlorophyll Fluorescence, EGU General Assembly 2026, Vienna, Austria, 3–8 May 2026, EGU26-15448, https://doi.org/10.5194/egusphere-egu26-15448, 2026.

EGU26-15565 | ECS | Orals | BG9.9

Mapping the distribution of coffee agroecosystems in Indonesia from 2016 to 2024 

Tin Satriawan and Xiangzhong Luo

Indonesia is currently the third major producers of coffee in the world, with approximately 20% of its exports destined for European Union (EU) markets. Recent policy developments, such as the EU Deforestation Regulation (EU-DR), impose stringent traceability requirements on coffee imports to EU, requiring spatially explicit linkage between coffee products and their production area. Consequently, there is an urgent need for accurate coffee mapping to support compliance, monitoring, and benchmarking. In this study, we map coffee distribution across Indonesia using multi-temporal imageries, by integrating optical imageries from Harmonized Landsat Sentinel-2 (HLS) dataset, radar imageries from Sentinel-1, and auxiliary environmental data (i.e., topography and distance to human settlement) using Random Forest classification in Google Earth Engine. Specifically, we aim to (1) produce annual maps of monoculture and coffee agroforestry distribution from 2016 to 2024 and (2) assess coffee-related land use changes over this period. The resulting maps will provide critical information on regional coffee distribution to support sustainable land management and future carbon modelling.

How to cite: Satriawan, T. and Luo, X.: Mapping the distribution of coffee agroecosystems in Indonesia from 2016 to 2024, EGU General Assembly 2026, Vienna, Austria, 3–8 May 2026, EGU26-15565, https://doi.org/10.5194/egusphere-egu26-15565, 2026.

In the Galapagos Archipelago, agricultural abandonment and biological invasions act as synergistic forces, creating "novel ecosystems" that threaten both endemic biodiversity and local food security. While historical land cover changes are well-documented, the mechanisms determining when and where productive land is lost to invasion remain obscured by complex interactions between climatic legacies and anthropogenic pressure. This study presents a unified spatiotemporal framework to assess the susceptibility of island agroecosystems to three critical transitions: agricultural abandonment, invasive species expansion, and invasive conversion (die-back).

We integrated dense Sentinel-1 SAR time-series (2018–2024) with high-resolution climatic variables (CHIRPS/TerraClimate) across the agricultural highlands (≈25,000 ha). Our hybrid workflow fuses satellite event-dating (Vertex AI + PELT) with epidemiological Case-Crossover designs to pinpoint specific climatic triggers, followed by Bayesian Spatial Modeling (R-INLA) and Random Forest classifiers to map landscape susceptibility.

Our results reveal distinct spatiotemporal fingerprints with direct implications for farm management. Temporally, agricultural abandonment is triggered by persistent drought stress (longer dry spells); spatially, risk is critically clustered in Silvopasture and Mixed Forest zones, identifying these productive assets as "stepping stones" to total land abandonment. Conversely, invasive expansion exhibits a "Rainfall Paradox": it is primed by short-term wetting pulses, while spatially, the models detect a process of "densification" within existing patches rather than purely frontier expansion. Finally, invasive retreat (die-back) is linked to extreme wet spikes and heat interaction, and is spatially confined to high-elevation climatic niches, supporting the "Environmental Filtering" hypothesis where native resilience limits invasive establishment.

By coupling AI-driven event detection with physics-aware spatial statistics, we demonstrate that invasive dynamics are pulsed by climate "windows of opportunity." The resulting risk maps provide a dual-purpose baseline for the Galapagos National Park and the Ministry of Agriculture, facilitating targeted interventions to protect native ecosystems while reinforcing the resilience of farming systems against climatic shocks.

How to cite: Benitez, F., Mena, C., and Gobin, A.: AI-assisted event-dating of invasive transitions in Galápagos agroecosystems: Disentangling climate triggers and landscape susceptibility using Satellite Imagery and Bayesian–ML, EGU General Assembly 2026, Vienna, Austria, 3–8 May 2026, EGU26-16104, https://doi.org/10.5194/egusphere-egu26-16104, 2026.

EGU26-16567 | Orals | BG9.9

From Satellite Data and Geo-tagged Field Photos to Reliable  Agricultural Reference Data 

Claudia Paris, Mehmet Furkan Celik, Stefano Maurogiovanni, Rocco Sedona, Gabriele Cavallaro, Ruben Cartuyvels, and Valerio Marsocci

Recent advances in Earth Observation (EO) data and multimodal Geo-Foundation Models have sharply improved the ability to generate accurate crop-type maps by leveraging rich spatio-temporal representations. These models are inherently scalable across diverse and heterogeneous agricultural landscapes, thus exhibiting strong generalisation. However, timely and high-quality reference data remain a major bottleneck for reliable agricultural mapping and monitoring. Agricultural landscapes are highly dynamic, with frequent crop rotations that require seasonal or annual updates. In addition, European agriculture is increasingly affected by weather extremes (e.g., droughts, hail, and storms), which are expected to intensify in both magnitude and frequency.

Traditional approaches rely on time-consuming and costly manual annotations or field surveys, which are difficult to sustain on a continuous basis and at large spatial scales (e.g., continental monitoring). In this context, geo- and time-tagged field photos represent a promising complementary data source. Each field photo can be linked to satellite image time series acquired over the same location up to the acquisition date. Compared to conventional in-situ surveys based on manual annotations, the combined use of satellite image time series and field photos provides a richer semantic representation of agricultural areas. While satellite image time series capture the temporal dynamics of crop development, field photos offer ground-level information at high resolution on crop condition, phenological stage, and management practices.

Despite their potential, the operational use of field photos in agricultural monitoring remains limited, in part due to challenges in translating heterogeneous images into structured information. Recent advances in Vision–Language Models (VLMs) have unlocked substantial progress in the automatic interpretation and semantic extraction of information from raw field photos. By aligning visual features with semantic concepts expressed in natural language, VLMs provide a powerful mechanism for mapping unstructured field photos to standardised crop-type labels.

This study investigates the potential of combining satellite image time series and geo-tagged field photos to expand, update, and complement existing reference datasets to support continuous large-scale agricultural monitoring. Preliminary results of mapping seven crop types (i.e., maize, wheat, rape, sugarbeet, oat, barley, and sunflower) in Europe indicate that, even in a zero-shot setting and when using simple prompts, the CLIP VLM can correctly identify crop types from field photos when a distinct phenological stage is visible. Incorporating phenological information derived from the temporal patterns of satellite image time series is therefore crucial, as it allows for the filtering of irrelevant images (e.g., post-harvest fields) and the selection of samples for which reliable classification is feasible. Furthermore, when consistency of label predictions obtained independently from field photos (using CLIP) and from Sentinel-1 and Sentinel-2 time series (using a simple Random Forest classifier) is used as a data reliability strategy, highly accurate classification performance across all considered crop types can be obtained. Overall, these findings highlight the strong potential of jointly exploiting satellite image time series and geo-tagged field photos for the efficient and reliable preparation of crop-type reference datasets.

How to cite: Paris, C., Celik, M. F., Maurogiovanni, S., Sedona, R., Cavallaro, G., Cartuyvels, R., and Marsocci, V.: From Satellite Data and Geo-tagged Field Photos to Reliable  Agricultural Reference Data, EGU General Assembly 2026, Vienna, Austria, 3–8 May 2026, EGU26-16567, https://doi.org/10.5194/egusphere-egu26-16567, 2026.

EGU26-16890 | Posters on site | BG9.9

Retrieving Crop Traits from Canopy Hyperspectral Reflectance: A Comparative Assessment of Physical, Data-Driven, and Hybrid Models 

Sheng Wang and the PANGEOS Aarhus workshop working group

Hyperspectral remote sensing provides opportunities for accurate and non-destructive retrieval of crop biophysical and biochemical traits based on physical radiative principles; yet robust and transferable retrieval approaches remain challenging. In this study, we systematically compared physically based, data-driven, and hybrid retrieval strategies for estimating leaf chlorophyll content (Cab) and leaf area index (LAI) from 400–2400 nm canopy hyperspectral reflectance from a field spectrometer. Using multi-temporal field observations of potato as a model crop collected across two experimental sites in the Netherlands under contrasting nitrogen and irrigation regimes, we evaluated (i) radiative transfer model inversion using Soil Canopy Observation, Photochemistry, and Energy fluxes (SCOPE) model, (ii) pure data-driven approaches including bidirectional long short-term memory networks (Bi-LSTM) and Gaussian Process Regression (GPR), and (iii) two hybrid methods integrating radiative transfer simulations with machine learning, including GPR hybrid learning and a radiative transfer process-guided machine learning (PGML) framework. Results show that among the data-driven methods, GPR has better performance than Bi-LSTM for Cab retrieval, and slightly lower performance in LAI retrieval. PGML outperformed purely physical and data-driven methods, achieving the highest accuracy for Cab (R² = 0.81, RMSE = 5.41 μg cm⁻²) and LAI (R² = 0.53, RMSE = 0.64 m² m⁻²) in 10-fold cross-validation while requiring limited field measurements. Feature importance analysis revealed that PGML emphasized spectrally and biophysically meaningful regions, including the near-infrared plateau for LAI and the red-edge for Cab. Furthermore, hybrid-derived traits exhibited strong correlations with end-of-season potato yield across key growth stages, comparable to or exceeding those obtained from field measurements. These findings demonstrate the value of hybrid learning for improving the robustness and interpretability of hyperspectral trait retrieval, supporting scalable crop monitoring and precision agriculture applications.

How to cite: Wang, S. and the PANGEOS Aarhus workshop working group: Retrieving Crop Traits from Canopy Hyperspectral Reflectance: A Comparative Assessment of Physical, Data-Driven, and Hybrid Models, EGU General Assembly 2026, Vienna, Austria, 3–8 May 2026, EGU26-16890, https://doi.org/10.5194/egusphere-egu26-16890, 2026.

EGU26-17039 | ECS | Orals | BG9.9

SNIC: A spectral normalization resistant to illumination conditions for robust estimates of GAI from UAV multispectral measurements  

Mingxia Dong, Frédéric Baret, Marie Weiss, Yanfeng Ding, Linyuan Li, and Shouyang Liu

Unmanned aerial vehicle (UAV) remote sensing plays an increasingly important role in crop phenotyping and precision agriculture. As GAI (Green Area Index) is one of the main crop characteristics desired for crop management or plant selection, several retrieval algorithms have been proposed from multispectral observations. The inputs of these retrieval algorithms could be the spectral radiance, or the spectral reflectance that is based either on the calibration over a reference panel (PanelCal) or on the use of a Downwelling Light Sensor (DLS) aboard the UAV. However, variability in illumination conditions during UAV flights introduces pronounced artifacts, leading to unreliable inputs of the retrieval algorithms that degrade the accuracy of GAI estimates.

In this study, we propose a Spectral Normalization for Illumination Invariant Calibration (SNIC) method that aims at eliminating the artefacts introduced in the retrieval algorithms when the illumination conditions are changing during the flight of a multispectral camera aboard a UAV.

A Digital Plant Phenotyping Platform (D3P) coupled with a three-dimensional radiative transfer model was employed to simulate wheat canopy reflectance and GAI across a wide range of illumination scenarios. The simulated datasets provide a physically consistent benchmark for evaluating the robustness of different radiometric calibration strategies under varying illumination conditions during the UAV flight. Our model driven GAI retrieval approach is based on XGBoost (eXtreme Gradient Boosting) regression. Four calibration strategies—Radiance, PanelCal, DLS, and SNIC—were then systematically assessed in terms of GAI retrieval performance.

This in-silico experiment demonstrates that SNIC substantially minimizes the sensitivity of GAI retrieval to illumination variability, whereas PanelCal exhibits pronounced degradation under fluctuating illumination conditions. Validation against 4,000 in situ measurements collected under diverse weather conditions further confirms that SNIC is resistant to changes in illumination conditions. The radiance-based method performs also nicely. Conversely, the reflectance-based methods suffer from severe limitations under such conditions (PanelCal) or from the artefacts introduced by the DLS sensor.

How to cite: Dong, M., Baret, F., Weiss, M., Ding, Y., Li, L., and Liu, S.: SNIC: A spectral normalization resistant to illumination conditions for robust estimates of GAI from UAV multispectral measurements , EGU General Assembly 2026, Vienna, Austria, 3–8 May 2026, EGU26-17039, https://doi.org/10.5194/egusphere-egu26-17039, 2026.

EGU26-17433 | Orals | BG9.9

Large-Scale, High-Resolution Fractional Cover Mapping from Sentinel-2 for Agri-Environmental Monitoring 

Selene Ledain, Anina Gilgen, and Helge Aasen

Soil erosion by water is a widespread environmental problem with significant impacts on soil fertility, crop productivity, and ecosystem sustainability. In Switzerland, up to 10% of arable land is at a higher erosion risk [1], primarily due to unadapted farming methods, and could benefit from control measures. The combination of susceptible terrains with disturbances from reworking the soil or low soil coverage can exacerbate erosion risk. Reliable, spatially explicit information on soil cover dynamics is therefore essential for identifying erosion-prone areas and supporting sustainable land management.

A commonly used framework to assess erosion risk in agricultural systems is the Revised Universal Soil Loss Equation (RUSLE), in which the crop cover and management factor (C-factor) represents the protective effect of vegetation and farming practices against soil loss. The C-factor varies over time as a function of crop growth, harvest, residue management, and bare-soil periods [2], making its accurate estimation challenging at large spatial scales. For arable land in Switzerland, the annual average erosion indicator computed within the national agri-environmental monitoring programme [3] is based on generic crop calendars and assumed field management practices, leading to inaccuracies in the representation of crop cover and on-field management.

The advent of satellite data provides large-scale access to frequent and high-resolution observations (e.g. 5 days and up to 10 for Sentinel-2) that enable continuous monitoring of land surface conditions. Fractional cover can be retrieved at pixel level using spectral mixture analysis (SMA), which decomposes the mixed satellite signal into proportions of soil, photosynthetic vegetation, and non-photosynthetic vegetation [4].

In this research, we present an automated framework for producing high-resolution, temporally consistent fractional cover maps over Switzerland. We first establish SMA-based regression models by constructing a representative dataset of pure photosynthetic vegetation, non-photosynthetic vegetation, and soil spectra from Sentinel-2 imagery, capturing the diversity of crop types, management practices, and soil conditions across the country. Synthetic spectral mixtures with known proportions of each cover type are created and used as a training dataset for neural network models. The trained models are then applied to Sentinel-2 data to generate nationwide fractional cover time series. We further post-process the outputs to reduce cloud contamination, enforce temporal consistency, and aggregate predictions to regular timestamps and administrative units.

The resulting fractional cover product provides updated, spatially explicit inputs for C-factor estimation within the RUSLE framework, enabling up-to-date assessment of erosion risk at national scale. Beyond soil erosion modelling, the proposed approach offers a product for large-scale monitoring of vegetation and soil dynamics in agricultural landscapes.

[1] V. Prasuhn et al., “Der Agrarumweltindikator Erosionsrisiko,kulturspezifische C-Faktoren sowie eine Karte des aktuellen Erosionsrisikos der Schweiz,” tech.rep., Agroscope, 2023.

[2] P. I. A. Kinnell, “Event soil loss, runoff and the Universal Soil Loss Equation family of models:A review,” Journal of Hydrology, 2010.

[3] A. Gilgen et al., “New approach to calculateagri-environmental indicators using greenhouse gas emissions in Switzerland as an example”, Pre-print. 10.2139/ssrn.5640831, 2025.

[4] F. Lobert et al., “Unveiling year-round cropland cover by soil-specific spectral unmixing of Landsatand Sentinel-2 time series,” Remote Sensing of Environment, 2025.

How to cite: Ledain, S., Gilgen, A., and Aasen, H.: Large-Scale, High-Resolution Fractional Cover Mapping from Sentinel-2 for Agri-Environmental Monitoring, EGU General Assembly 2026, Vienna, Austria, 3–8 May 2026, EGU26-17433, https://doi.org/10.5194/egusphere-egu26-17433, 2026.

EGU26-18032 | ECS | Orals | BG9.9

National-Scale, Multi-Year Crop and Grassland Mapping from Satellite Image Time Series in Switzerland  

Thomas Lauber, Mehmet Ozgur Turkoglu, Dominik Senti, and Helge Aasen

Accurate and spatially explicit information on the condition of agricultural landscapes is essential for monitoring developments and advancing management practices in agricultural systems. A real-world example is the need for reliable, high-resolution crop maps as needed by the Swiss national greenhouse gas inventory. The inventory currently relies on crop distribution data aggregated at the municipality level, limiting the ability to capture spatial differences. Future inventories aim to transition toward fully spatially explicit representations, requiring robust, high-resolution crop type maps. 

 In this work, we generate national-scale distribution maps for 36 crop types and 6 grassland classes across Switzerland using satellite image time series. We employ an attention-based deep learning model trained on the “Swiss Crops” dataset, which is annotated from farmer declarations and contains 9.3M polygons (8.7M ha) covering the years 2019-2024. To ensure robustness under real-world conditions, we train models on temperature-informed samples in a cross-year setting and evaluate their ability to generalize to unseen years. This explicitly addresses inter-annual variability in crop development driven by climatic fluctuations and management practices. Preliminary results show F1-scores above 0.85 for most majority crops and above 0.7 for most minority crops. Meadow intensity classes (intensive vs. extensive) can be reliably distinguished (F1 ≈ 0.80 and 0.65), while performance in distinguishing pasture intensity remains limited. 

 Our results demonstrate that the proposed approach generalizes well throughout Switzerland and remains stable under substantial year-to-year variation, making it suitable for operational applications. All maps and labels will be made freely available, forming one of the largest national-scale, multi-year satellite benchmark datasets for crop classification and segmentation. The produced crop and grassland maps provide a key building block for spatially explicit greenhouse gas accounting and other agro-environmental assessments. 

How to cite: Lauber, T., Turkoglu, M. O., Senti, D., and Aasen, H.: National-Scale, Multi-Year Crop and Grassland Mapping from Satellite Image Time Series in Switzerland , EGU General Assembly 2026, Vienna, Austria, 3–8 May 2026, EGU26-18032, https://doi.org/10.5194/egusphere-egu26-18032, 2026.

EGU26-18055 | ECS | Posters on site | BG9.9

Mapping Trees on Agricultural Land Using U-Net Semantic Segmentation from Multitemporal RGBI Orthophotos in Southern Saxony-Anhalt 

Jonathan Renkel, Johannes Löw, Mike Teucher, and Christopher Conrad

Trees on agricultural land are key structural components of agroecosystems, contributing to essential ecosystem services like microclimate regulation, erosion control, biodiversity conservation, and the mitigation of climate-induced abiotic stresses, thereby enhancing the resilience of agricultural landscapes. However, existing inventories are often outdated, incomplete, and lack the spatial resolution necessary for in-depth analysis and effective decision-making. 
Therefore, we apply a semantic segmentation approach based on the U-Net architecture, to quantify the current spatial distribution of trees on agricultural lands across southern Saxony-Anhalt (approximately 4,000 km²). The model is based on official digital orthophotos (DOP) with 20 cm spatial resolution and a spectral resolution of four channels (RGBI).             
Given the large study area and the coarse repetition rate of aerial imagery, we further evaluate model performance across different acquisition dates, ranging from the beginning of the 2023 vegetation period (30.04. - spring) to the peak of the 2024 vegetation period (29.08. – late summer).
Training data generation uses a semi-automatic workflow: a normalized surface model is clipped into 512×512-pixel tiles, filtered to retain objects >4m height, and masked to exclude impervious surfaces. This produces 7,894 tiles containing 14,360 annotated features, which are manually verified against true-color imagery. An independent test set is created through manual digitization of agricultural trees, stratified by image acquisition date. Model performance is evaluated using Precision, Recall, F1-score, and Intersection over Union (IoU).
The dataset is split 70/30 for training/validation. Input data includes four channels (RGBI) and the Normalized Difference Vegetation Index (NDVI) as a fifth channel. Data augmentation applies random horizontal/vertical flips and rotations (±15°). The U-Net model is trained using focal Tversky loss (weighted to penalize both false positives and negatives) and the Adam optimizer with default learning rate.
Lowest model errors were reached after 48 epochs. The best-performing model is selected and subsequently applied to each DOP tile intersecting the study area, resulting in predictions for 1182 DOP tiles. First validation results on approximately 8000 reference polygons show an average F1-Score of 0.5 which is comparable to recent studies.          
A total area of 195 km² of trees on agricultural land are mapped. Despite the heterogeneity of acquisition dates, the model produces accurate segmentations and successfully identifies trees on agricultural land in different compositions. The results indicate that semiautomatic training data generation can compensate for seasonal variability in aerial images, which often hinders the application of deep learning models to larger spatial scales.

How to cite: Renkel, J., Löw, J., Teucher, M., and Conrad, C.: Mapping Trees on Agricultural Land Using U-Net Semantic Segmentation from Multitemporal RGBI Orthophotos in Southern Saxony-Anhalt, EGU General Assembly 2026, Vienna, Austria, 3–8 May 2026, EGU26-18055, https://doi.org/10.5194/egusphere-egu26-18055, 2026.

In recent years, the growing global emphasis on biodiversity conservation within Social–Ecological Systems (SES) has catalyzed the development of Long-Term Socio-Ecological Research (LTSER). However, effectively integrating social and ecological data remains a significant challenge. Agroecosystems represent a classic example of human-nature coupled systems, where human agricultural management serves as the core driver. Despite this, most existing research focuses on the broad social or environmental impacts of agriculture, with relatively little attention paid to how specific management practices disturb the activity of local species.

This study focuses on the disturbances caused by agricultural management practices, including pruning, fertilization, pesticide application, and weeding, on avian activities within tea plantations. To achieve high temporal resolution, we utilize Passive Acoustic Monitoring (PAM) to collect soundscape data. These recordings are processed using SILIC, an AI-based biological sound identification and labeling system, to extract precise species and activity information.

To evaluate the short-term impacts of these practices, the research employs Bayesian proportion tests to compare changes in avian habitat occupancy before and after specific management interventions. Furthermore, this study aims to identify bird species that are particularly sensitive to certain agricultural activities and analyze their activity patterns. The findings will serve as a practical reference for conservation and agricultural authorities, enabling the optimization of management schedules to avoid peak avian activity periods and minimize ecological disturbance.


Keywords: passive acoustic monitoring, automatic species identification, agricultural management practices, indicator species, tea garden, socio-ecological systems

How to cite: Chen, Y.-C. and Lin, K.-H.: Using Passive Acoustic Monitoring to Identify Avian Indicators for Reflecting Agricultural Management Practices : A Case Study in Tea Garden of Pinglin, EGU General Assembly 2026, Vienna, Austria, 3–8 May 2026, EGU26-18077, https://doi.org/10.5194/egusphere-egu26-18077, 2026.

EGU26-19004 | ECS | Orals | BG9.9

Understanding Local Drivers of Soil Organic Carbon Stocks and Stability Using SHAP Analysis in an Agricultural Territory of Eastern France 

Coline Girod, Pierre Barré, Rémy Fieuzal, Eric Ceschia, Nicolas Chemidlin Prevost-Bouré, Pierre-Alain Marron, Lionel Ranjard, and Anne Hermand

Soil organic carbon (SOC) plays a key role in climate regulation and soil functioning. Although SOC stock and stability result from complex interactions between environmental, biological, and anthropogenic factors, the hierarchy of these drivers is strongly scale-dependent. At large spatial scales, climatic forcing often dominates SOC patterns, potentially masking the effects of land management. At local scales, where climatic variability is reduced, the relative influence of agricultural practices compared to landscape heterogeneity (e.g., topography and soil properties) remains poorly quantified, notably due to the scarcity of datasets combining soil properties and high-resolution management data. Clarifying this balance is essential for designing effective climate mitigation strategies in agricultural systems.

We investigated the drivers of SOC stock and stability within a 3,000 km² heterogeneous agricultural territory in Burgundy (France). The territory spans a diverse landscape, transitioning from western limestone plateaus to agricultural plains in the east. SOC measurements (0–20 cm) from 147 cropland sites were combined with 18 explanatory variables derived from in situ measurements, field survey, or satellite data and describing topography, climate, soil physico-chemical properties, vegetation dynamics, and contrasting agricultural management (diverse crop rotations, residue management, the use of cover crops, and organic amendments). SOC stable and active fractions were quantified using Rock-Eval® thermal analysis coupled with the PARTYsoc learning model. The SOC stocks averaged 41.7 ± 13.9 tC.ha-1, with the active (Ca​) and stable (Cs) stocks representing 19.9 ± 8.3 tC.ha-1 and 21.8 ± 6.1 tC.ha-1, respectively. 

Random Forest models were used to capture non-linear relationships between SOC variables and their drivers, and SHAP (SHapley Additive exPlanations) values were applied to quantify the relative importance and direction of individual drivers. Model performance reached a coefficient of determination (R2) of 0.41 for SOC stocks, and 0.50 and 0.26 for Ca​ and Cs stocks respectively. The lower R2 for Cs​ likely reflects missing explanatory variables related to historical land use or specific soil mineralogy.

SHAP analysis revealed that even at local scales (a few km), soil properties and climate remain the dominant drivers of SOC stock and stability in this study. Nevertheless, management-related factors, such as crop residue management and number of vegetation days during the intercrop periods, exert a stronger influence on SOC stock than topographic variables. Patterns differ among pools: active carbon is mainly influenced by CaCO₃, temperature, and precipitation, whereas clay content dominates the stable carbon fraction.

Our results demonstrate that while soil and climate largely control SOC stocks at local scales in the context of a highly heterogeneous terrain, agricultural management can meaningfully influence SOC dynamics and stability, highlighting opportunities for targeted strategies to enhance soil carbon sequestration.

How to cite: Girod, C., Barré, P., Fieuzal, R., Ceschia, E., Chemidlin Prevost-Bouré, N., Marron, P.-A., Ranjard, L., and Hermand, A.: Understanding Local Drivers of Soil Organic Carbon Stocks and Stability Using SHAP Analysis in an Agricultural Territory of Eastern France, EGU General Assembly 2026, Vienna, Austria, 3–8 May 2026, EGU26-19004, https://doi.org/10.5194/egusphere-egu26-19004, 2026.

EGU26-19714 | ECS | Orals | BG9.9

Advancing spaceborne remote sensing for agroecosystem adaptive management 

Rodolfo Ceriani, Monica Pepe, Mirco Boschetti, and Francesco Fava

Over the last decade, innovations in satellite remote sensing (RS) and data science have widened the scope and relevance of agricultural monitoring and management applications at farm and territorial scales. Recently launched and upcoming hyperspectral satellite missions (e.g., ASI-PRISMA, DLR-ENMAP, Planet-Tanager, ESA-CHIME, Kuva-Hyperfield) provide high spectral resolution (< 10 nm) across the 400-2500 nm range, opening new frontiers for assessing biophysical and biochemical functional traits of agroecosystems, while advancements in machine learning (ML) and artificial intelligence (AI) allow the efficient exploitation of the information content of high-dimensionality spectral datasets.   
Here we summarize the results and lessons learned from three experiments in different European agricultural systems (croplands and grasslands), analysing how the synergy between hyperspectral imaging spectroscopy (field and satellite), ML, and foundation models could support adaptive agroecosystem management through the retrieval of vegetation and soil properties related to the nutrient cycle. The three case studies are:(1) Assessment of biomass and nutritional quality of Alpine pastures: Gaussian Process Regression (GPR) models were calibrated on 250 vegetation samples and field spectra collected in 2024 and 2025 from semi-natural pastures in Valtournanche (Aosta, Italy) and Val Camonica (Brescia, Italy). PRISMA-derived maps for biomass and leaf-level protein, and fiber content showed good accuracy against in-situ data (LAI [-] R2 = 0.71, RMSE = 0.89; Biomass [g · m-2] R2 = 0.67, RMSE = 178.71; DM [%] R2 = 0.65, RMSE = 2.70; CP [%] R2 = 0.58, RMSE = 0.52; ADF [%] R2 = 0.45, RMSE = 2.42; NDF [%] R2 = 0.50, RMSE = 0.61), allowing mapping of pasture metabolizable energy in support of grazing management.

(2) Monitoring of nutritional status of paddy fields: GPR models were developed on 200 vegetation samples and field spectra collected in 2024 and 2025 in several fields located in the Ferrara region (Italy). These models, demonstrated on PRISMA and EnMAP time-series, effectively monitored crop development across a temporally and spatially independent test set (LAI [-] R2 = 0.83, RMSE = 0.30; Fresh Biomass [g · m-2] R2 = 0.72, RMSE = 627.67; LCC [μg · cm-2] R2 = 0.58, RMSE = 3.40; LNC [μg · cm-2] R2 = 0.34, RMSE = 22.51; CNC [g · m-2] R2 = 0.56, RMSE = 0.77).

(3) Retrieval of Soil Organic Carbon (SOC) and soil Nitrogen (N) on arable lands: A transformer-based, sensor-agnostic deep learning architecture was fine-tuned on open global spectral libraries. When applied to EMIT and Tanager-1 imagery over the Po Plain (Italy) and Northern Netherlands regions, the model yielded high accuracy (SOC [%] R2 = 0.61, MAE = 0.37; N [%] R2 = 0.68, MAE = 0.12) against 289 independent field observations.

Our findings demonstrate that satellite hyperspectral spectroscopy can complement operational multi-spectral missions, adding key information about agroecosystems nutritional status.  Furthermore, we show that the use of pre-trained ML and AI models on global spectral libraries and field reflectance data allows accurate retrieval even in the absence of ground truth acquisition synchronous to the satellite overpass, offering a potential scalable solution for agroecosystems management and monitoring at landscape scale.

How to cite: Ceriani, R., Pepe, M., Boschetti, M., and Fava, F.: Advancing spaceborne remote sensing for agroecosystem adaptive management, EGU General Assembly 2026, Vienna, Austria, 3–8 May 2026, EGU26-19714, https://doi.org/10.5194/egusphere-egu26-19714, 2026.

Mango inflorescence malformation, caused by Fusarium mangiferae, represents a major constraint to sustainable mango production worldwide, leading to severe yield losses, reduced fruit set, and long-term reinfection of orchards. Current mitigation strategies rely on labor-intensive sanitation and fungicide applications, which are costly, environmentally burdensome, and often only partially effective and insufficiently timed. There is therefore a critical need for scalable, data-driven tools that enable early, accurate, and spatially explicit detection of disease hotspots within orchards.

In this study, we develop and evaluate an automated detection framework that integrates high-resolution Earth observation data with deep learning to identify malformed mango inflorescences at the canopy and tree level. RGB imagery was collected across multiple seasons (2022–2025) using complementary sensing platforms, including UAVs and ground-based imaging, covering three commercially important cultivars (‘Keitt’, ‘Lilly’, and ‘Kent’) and multiple phenological stages. Semantic segmentation models based on an enhanced U-Net architecture with a ResNet decoder were trained to discriminate healthy and malformed inflorescences at the pixel level, enabling fine-scale disease mapping under heterogeneous field conditions.

Results from the 2025 season demonstrate that millimetric ground-based imagery (0.19–0.68 mm pixel size) enables highly accurate detection of malformation at peak flowering, with average precision exceeding 90% and F1-scores above 0.85 for the disease-sensitive ‘Keitt’ and ‘Lilly’ cultivars. Importantly, incorporating multi-year data and balancing validation datasets significantly improved model robustness and generalization. For the first time, meaningful detection performance from UAV imagery was achieved (up to 71% and 87% precision for malformed and healthy inflorescences, respectively), indicating strong potential for operational orchard-scale monitoring. Cross-cultivar evaluation further revealed partial generalization to ‘Kent’, a cultivar unseen during training, highlighting both the promise and current limits of model transferability.

Beyond detection accuracy, this work delivers key operational insights: disease recognition is highly sensitive to spatial resolution and phenological timing, and segmentation-based approaches provide a strong foundation for precision sanitation, infestation quantification, and decision support. Future work will focus on instance segmentation for whole-inflorescence detection, early-stage disease identification prior to peak bloom, improved cross-cultivar generalization, and integration with UAV- and robot-assisted sanitation workflows. Overall, the study demonstrates how AI-driven Earth observation can support sustainable agroecosystem management by directing sanitation efforts to affected orchard zones, verifying their effectiveness, and enabling disease monitoring during periods of limited field activity, ultimately reducing chemical inputs, labor demands, and pathogen spread.

How to cite: Chen, A., Nagar, Y., and Dafny-Yelin, M.: Data-Driven Detection of Mango Inflorescence Malformation Using Remote Sensing and Deep Learning for Precision Agroecosystem Management, EGU General Assembly 2026, Vienna, Austria, 3–8 May 2026, EGU26-20230, https://doi.org/10.5194/egusphere-egu26-20230, 2026.

EGU26-20696 | ECS | Posters on site | BG9.9

Mapping the Spatial Distribution of Tobacco using Multi-modal Satellite Imagery and Deep Learning 

Chaoqun Zheng, Baojian Wu, Weihua Feng, Jianwei Wang, Yongsheng Wang, Hanghang Liu, and Leyi Zhang

Accurate mapping of high-value economic crops, such as tobacco, in complex mountainous regions is essential for sustainable precision agriculture and regional land-use management. However, identifying tobacco plots remains challenging due to spectral confusion among objects and insufficient segmentation accuracy in complex terrains encountered in traditional tobacco remote sensing image semantic segmentation. This study presents a deep learning framework designed to overcome these limitations by synergizing Unmanned Aerial Vehicle (UAV) imagery with multi-temporal satellite data.

We propose a novel semantic segmentation model. Specifically, by introducing a channel-spatial attention module, we enhance the feature discrimination between tobacco plants and background crops/bare land; by incorporating an adaptive convolution module, we improve the model's adaptability to complex terrains. To validate the model's performance, a dedicated semantic segmentation dataset for tobacco remote sensing imagery was constructed. Results on this dataset demonstrate that the proposed model outperforms mainstream segmentation models such as U-Net and DeepLabv3+, achieving an improvement of 5% in mean Intersection over Union (mIoU).

The framework offers a scalable, automated solution for monitoring economic crops in heterogeneous environments, providing critical spatial intelligence for crop yield estimation and agricultural policy-making in challenging mountainous terrains.

How to cite: Zheng, C., Wu, B., Feng, W., Wang, J., Wang, Y., Liu, H., and Zhang, L.: Mapping the Spatial Distribution of Tobacco using Multi-modal Satellite Imagery and Deep Learning, EGU General Assembly 2026, Vienna, Austria, 3–8 May 2026, EGU26-20696, https://doi.org/10.5194/egusphere-egu26-20696, 2026.

EGU26-21351 | ECS | Orals | BG9.9

Potentials and Limitations of Vision-Language Models for Large-Scale 3D Semantic Mapping in Agricultural Environments 

Tjark Schütte, Sascha Kontetzki, and Thomas Hänel

Vision–language models (VLMs) are increasingly used for the semantic interpretation of visual data, enabling flexible, open-vocabulary analysis of images based on natural language descriptions. These capabilities offer new opportunities for large-scale semantic mapping, particularly in domains where comprehensive labeled training data are scarce or difficult to obtain, such as agricultural and horticultural environments.

Recent research has explored the transfer of semantic information from 2D imagery into three-dimensional representations, a process often called semantic lifting. This approach is attractive for outdoor scene understanding, as training native 3D vision–language models that generalize across landscapes and management regimes remains challenging and tools for 3D data are therefore not developed as far as in the 2D domain. However, most existing studies on semantic lifting focus on indoor environments or urban outdoor scenes, while agricultural landscapes—with their distinct structural characteristics, vegetation dynamics, and management patterns—remain underexplored.

In this contribution, we investigate the applicability of open-vocabulary, VLM-based semantic lifting for large-scale 3D semantic mapping in agricultural settings. Building on insights from urban-scale benchmarks, we analyze how vision–language-driven semantic segmentation transfers to outdoor agricultural and horticultural scenes reconstructed from multi-view UAV imagery. Our results highlight both the potential of these models to generate spatially consistent semantic representations and their limitations, which are strongly dependent on land cover type and semantic classes.

We discuss how such preliminary semantic 3D representations can support large-scale agroecosystem mapping and serve as an initial layer for downstream applications, including spatial analysis and the deployment of agricultural robotic systems. The findings provide guidance on the opportunities and current constraints of foundation-model-based semantic mapping for sustainable agricultural monitoring.

How to cite: Schütte, T., Kontetzki, S., and Hänel, T.: Potentials and Limitations of Vision-Language Models for Large-Scale 3D Semantic Mapping in Agricultural Environments, EGU General Assembly 2026, Vienna, Austria, 3–8 May 2026, EGU26-21351, https://doi.org/10.5194/egusphere-egu26-21351, 2026.

EGU26-21855 | ECS | Orals | BG9.9

Climate Stresses and Adaptation Pathways under Changing Climate for South Asian Oilseed Systems 

Anasuya Barik, Paresh Shirsath, and Pramod Aggarwal

Climate stressors pose increasing risks to major oilseed cropping systems of groundnut, mustard, and soybean across South Asia, a region where these crops are critical for food security, livelihoods, and edible oil supply. Existing assessments often rely on aggregated climate indicators or generalized crop responses. This limits their usefulness for identifying suitable crop-specific adaptation options. This study advances current understanding of climate–oilseed interactions by adopting a physiology-based, adaptation-oriented framework that explicitly links biologically relevant climate stressors to the suitability of adaptation interventions under current and future climates.

We quantify multiple heat and rainfall-related stressors using crop-specific physiological thresholds and analyse their intensity and frequency under historical conditions and CMIP6-based future scenarios for the 2050s and 2080s. The analysis distinguishes between stress exposure over the full crop (cardinal) cycle and stress occurring during sensitive phenological windows, particularly the reproductive and pollination phases. Stressor projections are then linked to adaptation options using a logical, expert-reviewed heuristic framework that evaluates the feasibility and expected effectiveness of genetic, management, structural, irrigation, and financial interventions under increasing climate stress.

Our results show that the intensity of all heat-related stressors and the crop water deficit index is projected to increase substantially across oilseed-growing regions in South Asia. Rainfall-related stressors display mixed and spatially heterogeneous responses, reflecting uncertainty and regional differences in future precipitation patterns. Importantly, heat stress during the full crop cycle and during critical reproductive phases exhibits contrasting behaviour. Critical-phase heat stress is projected to increase mainly in frequency, implying more frequent exposure to damaging conditions during short, sensitive windows, whereas full-cycle heat stress is projected to majorly intensify in the future.

These changes have direct implications for adaptation planning. Genetic interventions and financial risk-transfer mechanisms emerge as the most consistently robust options across crops, regions, and emission pathways. In contrast, structural measures, nutrient management, and irrigation-based interventions progressively lose effectiveness as future heat and moisture stresses exceed the thresholds these measures can realistically buffer, with outcomes strongly dependent on emission trajectories.

By mapping transitions in stressor regimes and adaptation suitability, this study provides a first-order, spatially explicit basis for climate-smart adaptation planning in South Asian oilseed systems. The findings highlight the need for innovation focused on protecting critical phenological processes under future climate change.

How to cite: Barik, A., Shirsath, P., and Aggarwal, P.: Climate Stresses and Adaptation Pathways under Changing Climate for South Asian Oilseed Systems, EGU General Assembly 2026, Vienna, Austria, 3–8 May 2026, EGU26-21855, https://doi.org/10.5194/egusphere-egu26-21855, 2026.

EGU26-22005 | ECS | Posters on site | BG9.9

Advancing pasture biomass prediction with integrated proximal, multispectral, topographic and SAR data fusion 

Ajay Gautam, Bernardo Candido, Ushasree Mindala, Vandana Darapaneni, Kayan Baptista, Ellen Herring, Dan Evans, and Robert Kallenbach

Accurate pasture biomass prediction is central to precision grazing and sustainable land management. This study presents a multi-source biomass prediction model for Mid-Missouri test-site pasture by integrating field-based proximal height sensing, multispectral satellite derived vegetation indices and weather variables from 2024 - 2025. A ridge regression framework with L2 regularization addressed predictor multicollinearity, with cross-validated tuning yielding an R² of 0.92 and a mean absolute error of 388 kg/ha, representing an approximately 50 percent improvement over height-only models. These results confirm the effectiveness of fusing proximal, spectral, and meteorological data for paddock-scale biomass estimation. Further gains in prediction accuracy can be achieved through systematic expansion of the predictor space within the existing multi-source framework. Incorporation of synthetic aperture radar (SAR) metrics from Sentinel-1, including backscatter coefficients and spatial texture measures derived from gray-level co-occurrence matrices, is expected to improve sensitivity to canopy structure, surface roughness, and moisture dynamics while maintaining robustness under cloud cover. In addition, terrain-based variables, including elevation and slope, will further explain spatial variability in pasture growth. This integrated framework is expected to reduce residual uncertainty, improve model stability across seasons, and enhance species specific calibration, providing a scalable foundation for highly accurate pasture biomass prediction and advance sustainable pasture management practices.

How to cite: Gautam, A., Candido, B., Mindala, U., Darapaneni, V., Baptista, K., Herring, E., Evans, D., and Kallenbach, R.: Advancing pasture biomass prediction with integrated proximal, multispectral, topographic and SAR data fusion, EGU General Assembly 2026, Vienna, Austria, 3–8 May 2026, EGU26-22005, https://doi.org/10.5194/egusphere-egu26-22005, 2026.

EGU26-22080 | ECS | Orals | BG9.9

AI-Driven Insights from Multimodal Data for Optimized Soybean Growth Monitoring  

Sushma Katari and Sami Khanal

Monitoring soybean growth provides critical insights for farmers, enabling them to closely track crop development and implement proactive management practices that ultimately enhance yields. Inefficient management and excessive chemical use not only reduce efficiency but also result in significant environmental consequences, including water contamination and increased greenhouse gas (GHG) emissions. These environmental impacts degrade soil health, disrupt weather patterns, and contribute to issues such as soil nutrient depletion and irregular precipitation, all of which have direct, adverse effects on agricultural productivity. Integrating various sensor data, such as satellite and small Unmanned Aerial System (sUAS) data, with machine learning (ML) offers a pathway to precise soybean growth monitoring. This pathway enables farmers to make data-driven decisions that reduce the need for field scouting while improving resource efficiency. Though recent studies have begun to explore field-level, precise growth monitoring using sUAS and satellite imagery, in-depth research on their integration strategies is necessary to develop practical, cost-effective methods for accurately estimating soybean phenological stages. In this study, a comprehensive analysis of soybean growth is conducted across early vegetative to reproductive stages using ML and multi-sensor methods. The selected soybean fields are located at three Ohio State Agricultural Research Stations, which are geographically dispersed across Ohio, USA. Using fixed-wing Wingtra sUAS, high-resolution optical images of soybean fields were collected from 2023 to 2025. To determine whether simple machine learning or complex deep learning methods perform better, multiple combinations of these models with sUAS and satellite are trained, and their performance is evaluated. Best model performance was observed with the Vision Transformer (ViT) model on sUAS images, which detected soybean growth stages with an average Root Mean Squared Error (RMSE) of 0.7. Poor performance was observed with the Random Forest model on open-source Sentinel-2 images, with an RMSE of 3.1. Upon closer investigation of good-performing and poor-performing growth stages through sUAS and satellite, it was observed that early growth stages performed really well only with sUAS data (RMSE<1), while for later reproductive stages (>R2), satellite performed relatively well with RMSE<1. This indicates that using sUAS during the early growth phase and satellites during the late growth phase can be a promising approach for the future.  This strategy enables farmers to make data-driven decisions that optimize growth monitoring and resource use, reduce waste, and minimize environmental impacts.

How to cite: Katari, S. and Khanal, S.: AI-Driven Insights from Multimodal Data for Optimized Soybean Growth Monitoring , EGU General Assembly 2026, Vienna, Austria, 3–8 May 2026, EGU26-22080, https://doi.org/10.5194/egusphere-egu26-22080, 2026.

Future food security will increasingly depend on the development of crop ideotypes that produce higher yields per unit of water used. Stomata are central to developing water-efficient crop ideotypes, as they serve as the primary gateway for carbon and water exchange. Process-based crop models are essential tools for testing crop phenotypes with favorable stomatal traits, as they can explain how changes in stomatal traits propagate to whole canopy carbon gain and water use. Yet, current models still struggle to connect leaf-level physiology to season-long canopy performance (e.g., yield) under realistic climate variability.

Current process-based models have one of these limitations: (i) lack of explicit biochemical photosynthesis module for C3 or C4 crops, preventing mechanistic analysis of crop phenotypes; and (ii) models that explicitly represent biochemistry ignore leaf energy balance dynamics and assume leaf temperature (Tleaf) equal to air temperature (Tair), ignoring the feedback between stomatal conductance, transpiratory cooling. As a result, they require extensive empirical calibration and are not recommended for exploring novel stomatal phenotypes, such as lower stomatal density and pore size. In particular, current efforts to manipulate stomatal traits in crops cannot be reliably evaluated using these simplifications, as they do not account for how changes in stomata affect CO2 diffusion and canopy energy balance.

This study presents a novel cross-scale framework, vLeaf@DSSAT, where we couple a process-based leaf model with the CERES-Maize growth model and introduce a two-leaf (sunlit–shaded) canopy representation. The explicit consideration of energy balance makes this framework distinct from similar attempts in the past. CERES-Maize provides daily crop state variables such as leaf area index (LAI), phenology, soil water status, and nitrogen status. Using these, vLeaf then computes hourly net assimilation and transpiration rates for both sunlit and shaded leaf areas. It computes photosynthesis, stomatal conductance, boundary-layer conductance, and leaf energy balance simultaneously in an iterative loop. Root water uptake from CERES-Maize constrains canopy transpiration; vLeaf then reruns under these constraints and updates Tleaf and gas exchange rates. The resulting canopy-scale assimilation from vLeaf drives the biomass accumulation in CERES-Maize on the next day, closing the loop between leaf biophysics and crop growth.

Simulations for climates based on a US Midwest reference site show that neglecting leaf energy balance results in sizeable errors in both carbon gain and water use. For cooler climates, forcing Tleaf = Tair underestimates seasonal carbon gain by ≈ 9% and transpiration by ≈ 30%. For warmer climates, the bias in carbon gain is small, but transpiration is overestimated by 5–10%. These errors can create uncertainty in ranking crop phenotypes with favorable stomatal traits. vLeaf@DSSAT provides a practical approach to testing stomatal manipulation, irrigation strategies, and climate-resilient ideotypes under realistic climate conditions, while also connecting leaf biophysics to field-scale yield and water use.

How to cite: Srivastava, A.: vLeaf@DSSAT: integrating leaf energy balance and biochemistry into CERES-Maize to reassess water-efficient ideotypes, EGU General Assembly 2026, Vienna, Austria, 3–8 May 2026, EGU26-231, https://doi.org/10.5194/egusphere-egu26-231, 2026.

Accurate retrieval of wheat phenological stages is fundamental for crop monitoring, yield forecasting, and understanding climate-crop interactions, particularly in heterogeneous landscapes such as the Indo-Gangetic Plains. Conventional field-based observations, although reliable, are labour-intensive, spatially limited, and often unsuitable for regional-scale assessments. Satellite remote sensing offers a valuable alternative, yet current phenology monitoring is constrained by observational gaps driven by cloud interference, uneven temporal sampling, and signal noise in vegetation indices. These limitations create uncertainty in identifying critical phenological stages, such as emergence, jointing, heading, and maturity, during the entire winter wheat growing season. To address these challenges, this study presents a refined and transferable phenology extraction approach that integrates multisatellite observations from Sentinel-2A and Landsat-8 using a data assimilation-based fusion technique. Daily, gap-free wheat NDVI trajectories at high (10m) spatial resolution were generated by combining the strengths of both sensors through pixel-level data assimilation and Savitzky–Golay (SG) filtering. A double logistic curve-based phenology detection algorithm was then applied to extract key inflection points from the wheat NDVI seasonal profile. This allowed the retrieval of five major phenological stages: Start of Season, Active Greenup, End Greenup, Peak, and Senescence. The satellite-derived stages were compared with field-observed growth stages at the Department of Water Resources Development and Management, Indian Institute of Technology Roorkee experimental farm. These five satellite-derived phenological stages corresponded closely to emergence, crown root initiation, jointing, heading, and maturity, respectively. Validation showed strong performance, with a mean absolute error of 7 days and a Kling-Gupta efficiency of 0.92. Spatial patterns highlighted pronounced early and mid-season variability across the study region. The Siwalik–Bhabar uplands exhibited delayed emergence and slower Greenup due to shallow, gravel-rich soils and restricted moisture availability, while lowland floodplains demonstrated earlier and more uniform phenological progression. Despite variability in early stages, final maturity dates converged across districts, reflecting regionally synchronized harvest timing. This approach enhances large-scale phenological assessment for supporting better management decisions in data-scarce agroecosystems.

Keywords- Data assimilation, double logistic, wheat, phenology

How to cite: Singh, P. and Kothari, K.: Refined Retrieval of Winter Wheat Phenological Stages in the Indo-Gangetic Plains Using Fused Sentinel-2A and Landsat-8 NDVI Time Series Data, EGU General Assembly 2026, Vienna, Austria, 3–8 May 2026, EGU26-711, https://doi.org/10.5194/egusphere-egu26-711, 2026.

EGU26-1082 | ECS | Posters on site | BG9.10

Deep Learning Based Soil Moisture Downscaling Framework for Precision Agriculture in Data-Scarce Regions 

Usman Hyder Patoo, Chetan Arora, and Subimal Ghosh

High-resolution soil moisture (SM) information is critical for irrigation decision-making, crop modelling, flood and drought prediction, and water resources management. However, satellite products only provide coarse-resolution data that cannot capture farm-scale spatial variability influenced by factors such as soil heterogeneity, topography, and anthropogenic activities. While downscaling methods offer a potential solution, they currently struggle in data-scarce regions, such as India, where the absence of dense observation networks limits their effectiveness. In this study, we present an irrigation optimisation framework that downscales satellite-derived soil moisture (SM) data to field-scale root zone soil moisture (RZSM) to support data-driven irrigation decision-making in Nashik District, Maharashtra, India. Utilising a Convolutional Long Short-Term Memory (ConvLSTM) network, we integrated sparsely located in-situ data from ground-based sensors with remote sensing predictors, including precipitation, vegetation indices, land surface temperature, and terrain attributes. The ConvLSTM architecture captures non-linear spatial and temporal interactions governing the field-scale SM variability. The models achieved strong performance, with Root Mean Square Error (RMSE) values from 0.02 to 0.08 m³/m³, Mean Absolute Error (MAE) values from 0.02 to 0.06 m³/m³, Correlation Coefficient (r) values ranging from 0.79 to 0.92, and Coefficient of Determination (R²) values between 0.61 and 0.88. These results validate the potential of deep learning for accurate field-scale SM estimation without requiring dense ground networks. Building on this, we are currently extending the framework by coupling the ConvLSTM architecture with a farm-scale ecohydrological model. This hybrid approach enables generalised, field-scale mapping at ungauged locations without in-situ sensors, offering a scalable, scientifically grounded solution for precision agriculture in water-stressed regions. This work can support farmers in making informed irrigation decisions and contribute to improved water management practices.

How to cite: Patoo, U. H., Arora, C., and Ghosh, S.: Deep Learning Based Soil Moisture Downscaling Framework for Precision Agriculture in Data-Scarce Regions, EGU General Assembly 2026, Vienna, Austria, 3–8 May 2026, EGU26-1082, https://doi.org/10.5194/egusphere-egu26-1082, 2026.

Precise monitoring of crop canopy cover (CC) is crucial for evaluating growth and health under diverse water and nutrient conditions. Although nano liquid urea has been promoted in India as an eco-friendly alternative to conventional nitrogen (N) fertilizers. Its effectiveness in potato cultivation, particularly for canopy development and yield, remains unclear. To address this gap, a field experiment was conducted during the 2024–25 winter season using three N treatments under a micro-irrigation system: T1-recommended granular urea (46% N), T2-without N, and T3-IFFCO nano liquid urea (4% w/v). Images were captured using a downward-looking smartphone camera positioned 2.5 meters above the crop near each treatment, serving as the primary input for estimating canopy cover. The images were processed using both a prompt-based segmentation model (SAM3) and an image-processing pipeline (Modified Excess Green Index + Otsu thresholding) to estimate CC. The SAM3 occasionally overestimated or failed to detect the potato canopy with the prompt “Green plants, leaves, vegetations, canopy cover”, whereas the image-processing approach consistently provided accurate CC estimates and was therefore used for subsequent analysis. The result revealed that the CC clearly showed differentiation among the treatments after 25 days after sowing (DAS). With this most of the treatment comparisons depict the CC peaking after 45 DAS, where the T1 recorded the highest canopy cover (~71%), indicating a healthy crop, while the pairwise comparisons showed CC values of ~55% (T1–T2), ~66% (T1–T3), ~33% (T2–T2), ~36% (T3–T3), and ~36% (T2–T3), depicting the nitrogen deficit. Similarly, the yield followed the same trend, with T1 producing the highest yield (26.78 t/ha), compared to 10.89 t/ha in T2 and 11.90 t/ha in T3. The results indicate that nano liquid urea does not supply sufficient nitrogen to support optimal potato canopy growth and productivity, resulting almost similar response to the no nitrogen application treatment. Increasing the nitrogen concentration in nano liquid urea formulations may improve their effectiveness. This study provides evidence to guide farmers in selecting appropriate nitrogen fertilizers for potato cultivation. In the future, such fertilizers should be evaluated across different crops to ensure their efficacy and to prevent farmers from adopting products that may not meet crop nutrient requirements.

How to cite: Maurya, A. K. and Pathak, A.: Evaluating SAM3 and Conventional Image Processing Method for Potato Canopy Cover Estimation as an Indicator of Crop Health, EGU General Assembly 2026, Vienna, Austria, 3–8 May 2026, EGU26-1681, https://doi.org/10.5194/egusphere-egu26-1681, 2026.

EGU26-3532 | ECS | Orals | BG9.10

Improving regional simulations of processing tomato using remote sensing 

Xin Yang, Ehsan Eyshi Rezaei, Michela Farneselli, Michele Croci, Francesco Tei, and Claas Nendel

Over the past fifty years, tomato has become one of the most extensively cultivated horticultural crops in the Mediterranean region. Climate projections for Italy indicate that temperature increases and rainfall changes will cause a 15% yield reduction in processing tomatoes, requiring an additional 85-110 mm of irrigation and 20-30 kg N ha-1 to partially offset negative impacts. Mediterranean agriculture is particularly threatened by projected climate changes in temperature and precipitation patterns. Region-specific crop models, validated against local field data, are therefore critical tools for assessing yield risks and identifying effective agronomic adaptations. Conventional process-based crop models often rely on fixed transplanting or sowing dates and harvesting dates, which fail to reflect spatiotemporal variability in management practices. Such assumptions can lead to systematic biases in regional simulations and environmental assessments. Yet phenological observations (e.g., flowering, fruit set, harvest dates) are essential for parameterizing crop models, available data typically represent point locations or experimental stations rather than the field to regional scale resolution needed for spatially explicit modelling. Sentinel-2’s high temporal frequency and spatial resolution allow tracking of within-season crop development at field scale. This study aims to: (a) compare model performance using broad agricultural land masks versus pixel-level tomato identification; and (b) evaluate whether incorporating satellite-observed canopy development dynamics (greenness trajectories, growth stage timing) reduces uncertainty in simulated crop growth, water use, and nitrogen cycling processes including nitrate leaching risk.

We propose a simulation framework that combines the process-based model MONICA (Model for Nitrogen and Carbon dynamics in Agro-ecosystems) with earth observation data for processing tomatoes in the Emilia Romagna region, a major tomato production area in Italy. MONICA was calibrated and validated using four years field trials and two years on-farm data from 49 fields. We integrated two remote sensing inputs: (i) field scale processed tomato masks, and (ii) dynamic transplant and harvest dates extracted from Sentinel-2 EVI time series (validated against on-farm data, R²=0.90). We conducted regional simulations (2007-2023) comparing four model set-ups: fixed transplant and harvest dates with basic cropland mask, fixed dates with tomato masks, dynamic dates with tomato masks, and modified dynamic dates with tomato masks for sensitivity tests on transplanting date.

Our research results indicate that employing specific tomato field maps combined with dynamically determined growing periods significantly improved yield simulation accuracy compared to basic cropland mask (reducing RMSE by 24%) and specific maps without consideration of remotely sensed growing season dynamics (reducing RMSE by 10%). Incorporating remote sensing data and tomato maps into the MONICA crop model also improved the model’s ability to capture yield anomalies as an indicator of its sensitivity to climatic signals, with a 24% reduction in RMSE. Integrating remote sensing-derived growing periods into crop models resulted in a wider range of simulated values, enhancing the model’s capacity to simulate nitrate leaching under real-world conditions.

This study demonstrates that using remote sensing data to inform crop models significantly enhances the understanding of dynamic growth patterns, thereby supporting regional yield estimation and nitrate leaching simulations, while providing crucial insights for agricultural resource management.

How to cite: Yang, X., Rezaei, E. E., Farneselli, M., Croci, M., Tei, F., and Nendel, C.: Improving regional simulations of processing tomato using remote sensing, EGU General Assembly 2026, Vienna, Austria, 3–8 May 2026, EGU26-3532, https://doi.org/10.5194/egusphere-egu26-3532, 2026.

Reliable regional crop yield forecasts are increasingly challenged by climate variability, extreme weather events, and growing pressure on land and water resources. Process-based crop and agro-ecosystem models provide a physically consistent framework to assess these impacts, yet their predictive skills at regional scales remain limited by uncertainties in initial conditions, parameterization, and the representation of in-season stress dynamics. At the same time, Earth observation (EO) data provide spatially explicit information on crop phenology and vegetation status that can help constrain and update model simulations.

This study investigates hybrid modeling and data assimilation strategies to improve seasonal yield predictions by integrating satellite-derived vegetation indicators (e.g., fraction of absorbed photosynthetically active radiation (FAPAR)) with the process-based agro-ecosystem model LPJmL. The focus is on regional-scale applications, using Bavaria, Germany as a case study representative for a heterogeneous and hydrological complex landscape, and on assessing how EO-informed initial states and in-season updates influence yield predictions throughout the growing season.

Time series of FAPAR observations are used to characterize crop phenology and canopy dynamics during the growing season and are integrated with LPJmL simulations through different coupling strategies. As LPJmL does not natively support continuous EO data assimilation, several integration pathways are explored, including parameter forcing, ensemble-based approaches, and hybrid extensions that combine process-based modeling with machine learning components trained on model outputs, EO, and meteorological inputs. These hybrid elements are designed to leverage EO and meteorological information to account for non-linear effects and growth-stage-dependent responses that are difficult to capture in purely process-based algorithms.

Meteorological forcing is derived from ERA5-Land reanalysis and C3S seasonal forecast data, with sensitivity experiments exploring the role of seasonal forecast information. Particular emphasis is placed on the role of climate extremes during critical phenological phases and their implications for seasonal yield variability. Model calibration and evaluation are conducted using historical yield statistics and regionally consistent land-use information, allowing an assessment of uncertainty related to parameter choices, assimilation strategies, and hybrid model components.

The presented framework contributes to ongoing efforts to link regional crop models with EO vegetation dynamics data through scalable and transferable methods. By combining process understanding with data-driven constraints, this work aims to improve the robustness of seasonal yield forecasting and to support future applications in agricultural and food security monitoring, climate impact assessment, and adaptation planning.

How to cite: Jörges, C. and Hank, T.: Regional Seasonal Crop Yield Forecasts Through Hybrid Crop Modeling and Remote Sensing Data Assimilation, EGU General Assembly 2026, Vienna, Austria, 3–8 May 2026, EGU26-4037, https://doi.org/10.5194/egusphere-egu26-4037, 2026.

EGU26-6511 | ECS | Orals | BG9.10

Upscaling drought stress detection through integrated crop model and remote sensing data 

Jamina Gabrielle Bondad, Gohar Ghazaryan, Maximilian Schwarz, Isabel Augscheller, Rachel Escueta, and Claas Nendel

Understanding when major crops face water deficits and the magnitude of the resulting yield impact is becoming increasingly important; however, large-scale, crop-specific evaluations of when drought stress occurs and how severe it becomes remain limited, particularly those that connect stress timing and severity to the physiological processes determining yield. Our study addresses this gap by using a process-based model integrated with remote sensing data to derive a physiologically grounded drought indicator from point scale to grids and ultimately to district-level resolution. More specifically, we used gridded historical and projected climate data, along with crop, soil, and terrain information. Our first step was to examine how stress timing and severity have historically influenced silage maize and winter wheat yields across Germany. The analysis revealed that drought during shooting-tasselling and tasselling to flowering for silage maize, and grain filling for winter wheat had the strongest association with major yield losses. These crop-specific windows highlighted the importance of stage-dependent stress assessment. The next step involved benchmarking of our physiologically based drought indicator against Sentinel-3 based drought hazard products to compare the simulated and remotely sensed drought-affected areas. Finally, we conducted scenario-based exploration of climate and irrigation conditions to assess how different management and environmental scenarios alters future drought exposure and yield outcomes. In this process, we incorporated Sentinel-2 derived irrigation maps to spatially distinguish irrigated from rainfed areas, improving the representation of actual water management practices. By combining process-based crop models with Earth observation data, our framework provides a foundation for digital twin applications in agriculture showcasing a virtual replication of crop-climate interactions that enables systematic evaluation of how future stress patterns, management decisions and policy interventions may shape agricultural productivity at a larger scale.

How to cite: Bondad, J. G., Ghazaryan, G., Schwarz, M., Augscheller, I., Escueta, R., and Nendel, C.: Upscaling drought stress detection through integrated crop model and remote sensing data, EGU General Assembly 2026, Vienna, Austria, 3–8 May 2026, EGU26-6511, https://doi.org/10.5194/egusphere-egu26-6511, 2026.

EGU26-6744 | ECS | Orals | BG9.10

NeuralCrop: Combining physics and machine learning for improved crop yield predictions 

Yunan Lin, Sebastian Bathiany, Maha Badri, Maximilian Gelbrecht, Philipp Hess, Brian Groenke, Jens Heinke, Christoph Müller, and Niklas Boers

We introduce NeuralCrop, a differentiable hybrid global gridded crop model (GGCM) that combines the strengths of an advanced process-based GGCM, resolving important processes explicitly, with data-driven machine learning components. The model is first trained to emulate a competitive GGCM before it is fine-tuned on observational data. We show that NeuralCrop outperforms state-of-the-art GGCMs across site-level and large-scale cropping regions. Across moisture conditions, NeuralCrop reproduces the interannual yield anomalies in European wheat regions and the US Corn Belt more accurately during the period from 2000 to 2019 with particularly strong improvements under drought extremes. When generalizing to conditions unseen during training, NeuralCrop continues to make robust projections, while pure machine learning models exhibit substantial performance degradation. Thanks to optimization to graphical processing units (GPUs), NeuralCrop is more than 80 times faster on a single GPU than a state-of-the-art competitor on 128 CPU cores. Our results show that our hybrid crop modelling approach offers overall improved crop simulations and more reliable yield projections under climate change and intensifying extreme weather conditions.

How to cite: Lin, Y., Bathiany, S., Badri, M., Gelbrecht, M., Hess, P., Groenke, B., Heinke, J., Müller, C., and Boers, N.: NeuralCrop: Combining physics and machine learning for improved crop yield predictions, EGU General Assembly 2026, Vienna, Austria, 3–8 May 2026, EGU26-6744, https://doi.org/10.5194/egusphere-egu26-6744, 2026.

EGU26-9000 | Posters on site | BG9.10

Grain yield efficiency of dry land wheat in Israel: a high-resolution coupled crop-climate modeling approach 

Ehud Strobach, Avimanyu Ray, Daniel Farhi, and Roi Ben-David

Wheat crop provides a quarter of global calorie consumption. In dryland regions like Israel, spring wheat is grown under rain-fed conditions across a wide diversity of soils and agroclimatic zones. As a result, wheat grain yields suffer from high year-to-year and regional variability. With the projected climate warming intensifying water scarcity in the Eastern Mediterranean region and the global food demand rising, there is a need to develop new crop strategies for future needs.

Regional crop models allow us to assess yield and water use efficiency under future regional projected climate conditions, and thus can be used to develop such crop strategies. The current study uses a climate model (WRF) coupled to a crop model (Noah-MP-Crop) to simulate at high spatial resolution (3 km2) wheat crop growth in Israel. This approach allows accounting for feedback between the climate and the annual crop, which, in the case of widespread crops like wheat, might be significantly important. After calibration of model parameters for Israel’s commercial spring wheat fields, we run the coupled model over a 30-year period, finding a good match between model predictions and recent field observations.

Our results reveal a strong non-linear dependency of yield and water use efficiency on soil moisture. Notably, water stress exceeding 30% can trigger a rapid decline in the potential yield. Clayey soils show more resilience to moisture variability, whereas sandy soils can sometimes outperform clayey soils under greater water stress if other growth factors are optimal. This apparent yield advantage of sandy soils can be attributed to more optimal agroclimatic conditions of these soil locations. Overall, these findings demonstrate that climate-informed, site-specific management strategies, including the selection of appropriate crops and cultivars, can substantially improve yield efficiency under future climate conditions.

How to cite: Strobach, E., Ray, A., Farhi, D., and Ben-David, R.: Grain yield efficiency of dry land wheat in Israel: a high-resolution coupled crop-climate modeling approach, EGU General Assembly 2026, Vienna, Austria, 3–8 May 2026, EGU26-9000, https://doi.org/10.5194/egusphere-egu26-9000, 2026.

EGU26-9338 | Posters on site | BG9.10

Advancing Crop Modeling and Data Assimilation Using AquaCrop v7.2 in NASA's Land Information System Framework v7.5  

Gabriëlle De Lannoy, Louise Busschaert, Michel Bechtold, Niccolo Lanfranco, Shannon de Roos, Zdenko Heyvaert, Jonas Mortelmans, Samuel Scherrer, Martynas Bielinis, Maxime Van den Bossche, Sujay Kumar, David Mocko, Eric Kemp, Lee Heng, Pasquale Steduto, and Dirk Raes

This poster introduces the open-source AquaCrop v7.2 model as a new process-based crop model within NASA's Land Information System Framework (LISF) v7.5. Through two showcases, we demonstrate the current capabilities of AquaCrop in the LISF, along with topics for future development. In a first showcase, coarse-scale crop growth simulations with various crop parameterizations are performed over Europe. Satellite-based estimates of land surface phenology are used to inform spatially variable crop parameters. These parameters improve canopy cover simulations in growing degree days compared to using uniform crop parameters in calendar days. The second showcase aims at improving fine-scale agricultural simulations via satellite data assimilation. Specifically, the crop state is updated for winter wheat fields in the Piedmont region of Italy, through assimilation of fine-scale canopy cover satellite data with an ensemble Kalman filter. The state updating is beneficial for the intermediary biomass estimates, but leads to only small improvements in yield estimates. This is due to the strong model (parameter) constraints, and limitations in the assimilated satellite observations and reference yield data. The showcases highlight pathways to improve the current constraints in the crop model and observations, and to advance future crop estimates, e.g. through crop parameter updating and multi-sensor and multi-variate data assimilation.

How to cite: De Lannoy, G., Busschaert, L., Bechtold, M., Lanfranco, N., de Roos, S., Heyvaert, Z., Mortelmans, J., Scherrer, S., Bielinis, M., Van den Bossche, M., Kumar, S., Mocko, D., Kemp, E., Heng, L., Steduto, P., and Raes, D.: Advancing Crop Modeling and Data Assimilation Using AquaCrop v7.2 in NASA's Land Information System Framework v7.5 , EGU General Assembly 2026, Vienna, Austria, 3–8 May 2026, EGU26-9338, https://doi.org/10.5194/egusphere-egu26-9338, 2026.

EGU26-12455 | ECS | Posters on site | BG9.10

Sensitivity of Climate Analogues to Problem-Specific Adjustments 

Héloïse Allaman, Stéphane Goyette, Pierre-Henri Dubuis, and Jérôme Kasparian


As climate change reshapes environmental and human systems, climate analogues — present-day locations whose climate resembles projected future conditions1 — are increasingly used to support climate mitigation or adaptation. However, most existing applications rely on coarse climate model outputs and raw variables, often neglecting microclimatic variability and sector-specific climatic constraints.

Using European vineyards as a case study2, we investigate how incorporating problem-specific refinements affects climate analogue identification. We enhance the classical analogue framework by introducing bioclimatic indices tailored to vine growth and pathogen development, applying sub-grid temperature corrections based on elevation, slope, and aspect, and using Principal Component Analysis to weight their contributions and thereby reduce redundancy among indices. A systematic sensitivity analysis quantifies the individual impact of each refinement on the spatial distribution of the selected analogues.

All three refinements exert a significant impact on analogue identification with similar magnitude. While the generalized distance statistics between reference sites and their analogues remain relatively stable when changing parametrizations, the geographic location of analogues can shift by several hundred to over a thousand kilometres, in some cases altering matches at the continental scale. These results emphasise the significant impact of variable selection, their interdependence, and the local climate variability on climate analogue outcomes. Consequently, problem-specific considerations are essential to ensure that the identified analogues are truly relevant to the application of interest3. While developed for viticulture, the proposed framework is readily transferable to other climate-sensitive systems, including agriculture, ecosystem management, and urban planning, underscoring the need for problem-specific climate analogue methodologies.

1 G. Rohat, S. Goyette, J. Flacke, Characterization of European cities’ climate shift– an exploratory study based on climate analogues, International Journal of Climate Change Strategies and Management (2017) 
2 H. Allaman, S. Goyette, P.-H. Dubuis, J. Kasparian, Future viability of European vineyards using bioclimatic climate analogues, Agricultural and Forest Meteorology (2026)
3 H. Allaman, S. Goyette, P.-H. Dubuis, J. Kasparian, Sensitivity of Climate Analogues to Problem-Specific Adjustments: A Case Study, Manuscript submitted for publication, Under review

How to cite: Allaman, H., Goyette, S., Dubuis, P.-H., and Kasparian, J.: Sensitivity of Climate Analogues to Problem-Specific Adjustments, EGU General Assembly 2026, Vienna, Austria, 3–8 May 2026, EGU26-12455, https://doi.org/10.5194/egusphere-egu26-12455, 2026.

EGU26-12692 | Orals | BG9.10

Surface Soil Moisture Data Assimilation in AquaCrop: Overcoming Limited Vertical Coupling with an Exponential Filter 

Michel Bechtold, Louise Busschaert, Zdenko Heyvaert, Sujay Kumar, Dirk Raes, Christian Massari, and Gabrielle De Lannoy

Root-zone soil moisture (RZSM) critically controls crop development, yet satellite missions observe only near-surface soil moisture, which poses challenges for its incorporation into crop models. In AquaCrop, the soil water module exhibits limited vertical coupling between computational soil compartments due to the abrupt effects of wilting point and field capacity thresholds, restricting the downward propagation of surface information. To address this limitation, an exponential filtering approach can be used to transform surface soil moisture into temporally smoothed estimates that are more representative of deeper soil layers. We assess the assimilation of SMAP Level-2 surface soil moisture into AquaCrop over European croplands (2015–2023, 0.1° resolution) with the aim of improving RZSM under these structural constraints. We compare direct assimilation of SMAP retrievals with assimilation of exponentially filtered datasets representing effective target depths of 30, 60, and 100 cm, using seasonally varying CDF matching within an ensemble Kalman filter.

The assimilation consistently improves topsoil (0–30 cm) moisture, but gains in subsoil (30–100 cm) moisture are strongly affected by the weak internal vertical coupling of the soil water balance. Specifically, while the direct assimilation of surface observations has limited impact below 30 cm, that of filtered products leads to improvements in RZSM. The best performance is obtained for a 60 cm target depth, with widespread increases in correlation against in situ observations. The impact of improved soil moisture is also evaluated for canopy cover and biomass using satellite-based reference data. Vegetation improvements remain weak and inconsistent, influenced by several factors including biases in the reference data and limitations in soil–plant coupling, for example, due to the use of a generic crop parameterization that is not spatially explicitly calibrated. Our results highlight the value of exponential filtering for soil moisture assimilation in weakly coupled crop models and point to joint soil moisture–vegetation assimilation as a promising pathway for further improvements.

How to cite: Bechtold, M., Busschaert, L., Heyvaert, Z., Kumar, S., Raes, D., Massari, C., and De Lannoy, G.: Surface Soil Moisture Data Assimilation in AquaCrop: Overcoming Limited Vertical Coupling with an Exponential Filter, EGU General Assembly 2026, Vienna, Austria, 3–8 May 2026, EGU26-12692, https://doi.org/10.5194/egusphere-egu26-12692, 2026.

EGU26-14055 | ECS | Orals | BG9.10

Integrating dynamic planting dates into Noah-MP-Crop for sorghum simulation in semi-arid regions 

Yasir Hageltom, Joel Arnault, Nadir Elagib, Patrick Laux, and Harald Kunstmann

Process-based crop models embedded within land surface schemes provide a physically consistent framework for assessing crop–climate interactions. However, their application in semi-arid regions is often constrained by limited field data and simplified management assumptions. In particular, fixed planting dates remain a major source of uncertainty for rainfed systems where sowing decisions are strongly controlled by rainfall timing and intra-seasonal variability.

We develop and evaluate a framework for simulating rainfed sorghum growth using the Noah-MP-Crop model, with dynamic planting dates derived from satellite observations. Sowing timing is inferred from temporal trajectories of the GLASS Leaf Area Index (LAI) product, enabling spatially and interannually varying planting information to be incorporated. The approach is applied over the semi-arid eastern Nile basin, where sorghum production is highly sensitive to seasonal rainfall variability.

The model is implemented within the WRF-Hydro modeling system and driven by ERA5-Land atmospheric forcing and IMERG satellite-based precipitation. A stepwise calibration strategy is adopted, targeting crop phenology, leaf area development, and carbon allocation processes. Model performance is evaluated against satellite-derived LAI, independent energy flux estimates, and observed yield data, with comparisons between simulations using fixed and dynamic planting assumptions.

Results show that dynamic planting dates substantially improve the timing and magnitude of simulated LAI, particularly during early growth stages. In contrast, energy fluxes exhibit weaker sensitivity to planting date representation, reflecting the dominant control of atmospheric demand and radiation on surface energy partitioning in semi-arid conditions. Furthermore, simulations using dynamic planting dates show improved agreement with observed yields, indicating that a realistic representation of sowing variability translates into better seasonal productivity estimates. The findings highlight the importance of representing realistic sowing variability for crop growth simulation, while also illustrating the potential of combining open satellite products with process-based models in data-limited regions.

This work demonstrates a practical methodology for integrating dynamic planting information into land surface crop models, providing a transferable approach for improved crop–climate assessments and future seasonal yield prediction applications.

How to cite: Hageltom, Y., Arnault, J., Elagib, N., Laux, P., and Kunstmann, H.: Integrating dynamic planting dates into Noah-MP-Crop for sorghum simulation in semi-arid regions, EGU General Assembly 2026, Vienna, Austria, 3–8 May 2026, EGU26-14055, https://doi.org/10.5194/egusphere-egu26-14055, 2026.

PhenoCams have become a common tool for vegetation phenology monitoring in North America and Europe, but their use in Indian agriculture remains very limited. Most crop phenology research in India still depends on satellite imagery or field surveys. These approaches provide valuable information, but they often lack high temporal resolution and cannot capture short-term changes in crop conditions. To address this gap, we evaluated the use of a PhenoCam to monitor wheat and rice phenology at a field site in Roorkee, India across two growing seasons. Our aim was to assess how high-frequency imagery can complement field observations, satellite, and meteorological data for crop phenology assessment.

We installed an infrared-enabled PhenoCam on a 6.5 m tower overlooking a winter wheat field during the rabi season (2023-24 and 2024-25) and a rice field during the kharif season (2024). Images were captured automatically at fixed intervals and were processed using the PhenoAI framework, which is a deep learning Python framework designed for automated time-series data processing. Greenness indices such as GCC and NDVI were derived from the processed images. For the wheat study, we conducted a cross-platform evaluation over two consecutive seasons (2023–2025) by combining PhenoCam data with in-situ observations, Sentinel-2, and PlanetScope imagery. PhenoCam achieved the highest timing agreement with field observations, with a mean absolute error (MAE) of 2.6–3.5 days. Sentinel-2 followed with MAE values of 2.4–4.2 days, while PlanetScope showed larger errors of 4.1–5.6 days due to radiometric noise and cloud cover. GCC was most sensitive to early green-up, whereas NDVI provided stable tracking of the full growth cycle (R² > 0.90).

During the rice season, we focused on how crop phenology responds to local weather conditions. We collected meteorological data from a co-located automated weather station. We examined climate–phenology relationships using a combination of exploratory correlations and mixed-effects model analysis. Minimum air temperature and PAR showed the strongest overall negative correlations with canopy greenness (r = −0.42 and r = −0.37). Stage-wise analysis indicated that tillering responded positively to temperature (r = 0.45), while booting and heading showed negative responses. A log response ratio (lnRR) meta-analysis identified flowering as the most climate-sensitive stage, with significant lnRR effects for 4 out of 8 climate variables, followed by tillering (3/8) and germination (2/8).

Overall, these results show that PhenoCam imagery can resolve inter-annual shifts in wheat phenology, identify climate-sensitive stages in rice, and validate satellite-derived phenology at daily scale. As one of the first agricultural PhenoCam deployments in India, this work demonstrates the value of near-surface imaging for bridging field and satellite observations. It reduces temporal gaps during cloudy conditions, provides ground reference for satellite calibration, and reveals stage-specific climate responses relevant for climate-resilient crop management in India.

How to cite: Kumar, A. and Khare, S.: Establishing PhenoCam-based monitoring of wheat and rice phenology in India with satellite and meteorological data, EGU General Assembly 2026, Vienna, Austria, 3–8 May 2026, EGU26-14674, https://doi.org/10.5194/egusphere-egu26-14674, 2026.

EGU26-15156 | ECS | Posters on site | BG9.10

Monitoring Crop Residue Burning in Smallholder Farms at Sub-Field Scale Using High-resolution Satellite Imagery 

Preethi Konkathi, Nathan Torbick, Ishan Ajmera, Michele Reba, and Joanne V Hall

Crop residue burning in smallholder farming systems represents a critical source of atmospheric pollution and greenhouse gas emissions. However, current operational active fire monitoring products from coarse-resolution MODIS/VIIRS, restrict their application to mapping and monitoring crop stubble burning in smallholder farms. These smallholder farming systems have field sizes that may vary between 0.5 and 2 hectares, resulting in an underestimation across ~40% of the global croplands. This current limitation necessitates the need for high-resolution alternatives that can help track and monitor crop burn practices. This enables the accurate quantification of GHG emissions and the implementation of regulations in densely populated areas. To address this limitation, we developed a machine-learning approach for high-resolution mapping and monitoring of stubble burning using PlanetScope (3-5 m resolution) and Sentinel-2. Our results demonstrate that the burn detection model applied to PlanetScope achieved an accuracy of 81%, outperforming the Sentinel-2-based detection model, which had an accuracy of 69%. We attribute this to the finer resolution of Planetscope, which even compensated for the spectral limitation in detecting the burn events. The predicted PlanetScope burn detection product further enabled the delineation of burn patterns within individual farm boundaries, allowing us to classify whether a farm is entirely burned or partially burned based on the percentage of burnt area per field. Random Forest feature importance indicated that Global Environmental Monitoring Index (GEMI) consistently outperformed as the optimal spectral predictor, compared to the traditional indices, including the Normalized Burn Ratio and the Normalized Difference Vegetation Index. We also found that GEMI can effectively discriminate between burnt signatures and spectrally similar agricultural activities, such as post-harvest tillage and crop residue management operations.  Our results demonstrate that high-resolution commercial imagery can significantly enhance operational agricultural monitoring. Moreover inspiring confidence in policymakers and researchers by enabling the accurate quantification of emissions, effective policy enforcement, and environmental health protection across smallholder regions globally. However, a significant challenge persists in the scalability of research-grade studies to operations due to extremely higher costs associated with PlanetScope's commercial data acquisition (exceeding $200,000 annually for district-level continuous monitoring). These costs present significant barriers for resource-constrained governmental agencies and research institutions in developing countries, despite their demonstrable technical superiority. Future studies should address these challenges by developing data fusion-based hybrid frameworks that offer a scalable solution, striking a balance between technical needs and fiscal realities, while supporting climate mitigation and sustainable agricultural practices that strategically leverage complementary sensor capabilities. 

 Keywords: remote sensing, machine learning, PlanetScope, Sentinel-2, crop residue burning, burnt area detection

How to cite: Konkathi, P., Torbick, N., Ajmera, I., Reba, M., and Hall, J. V.: Monitoring Crop Residue Burning in Smallholder Farms at Sub-Field Scale Using High-resolution Satellite Imagery, EGU General Assembly 2026, Vienna, Austria, 3–8 May 2026, EGU26-15156, https://doi.org/10.5194/egusphere-egu26-15156, 2026.

EGU26-15617 | ECS | Posters on site | BG9.10

Dynamics of carbon-water coupling in the Brazilian Cerrado: A long-term comparison of natural and agricultural systems (1985–2024)  

Wilany Alves, Anderson Ruhoff, Nicole Ramalho, and Leonardo Laipelt

We investigated the evolution of surface-atmosphere interactions in two strategic irrigated agricultural frontiers within the Brazilian Cerrado: The Alto Rio Preto and São Marcos basins. Driven by agricultural expansion, regional landscapes underwent transformations over the last four decades. In Alto Rio Preto, savanna cover decreased from 42% to 30 %, while agriculture expanded to occupy 42% of the basin. In São Marcos, native vegetation retreat was more severe, dropping from 42% to 17%, yielding space to an agricultural matrix that dominates 43% of the total area, with irrigated agriculture already consolidating 10% of the territory. The central objective was to quantify how the replacement of native vegetation with rainfed systems and the subsequent implementation of irrigation altered regional ecosystem carbon and water dynamics. The methodology employed Landsat time series (30 meters) for field-scale vegetation mapping. Gross Primary Productivity (GPP) was estimated using an adapted Light Use Efficiency (LUE) model, and Evapotranspiration (ET) was obtained via the geeSEBAL model. Ecosystem Water Use Efficiency (WUEeco) was calculated as the ratio of carbon uptake to water loss (GPP/ET). The analysis was stratified into three levels: (i) regional spatiotemporal dynamics; (ii) trends in constant Land Use/Land Cover (LULC) areas; and (iii) impacts in technological transition zones. Regionally, a robust growth trend in GPP was observed, with mean annual values rising to unprecedented levels in both basins. Notably, over the last decade, the extent of high-productivity areas expanded significantly, becoming the dominant landscape feature in the São Marcos Basin. Water consumption followed this dynamic but with distinct regional behaviors: while ET in São Marcos remained stable at elevated levels, Alto Rio Preto underwent a structural shift, marked by a drastic reduction in low-consumption areas and a transition toward a regime of higher mean evapotranspiration. Consequently, mean annual WUEeco in both basins rose from <1.0 to >2.0 gC/mm, indicating that carbon uptake increments proportionally outpaced ET rates. The analysis of constant land use areas revealed distinct intensification strategies. Although forests maintained the highest absolute GPP and ET averages, anthropogenic systems showed the highest acceleration rates. The São Marcos basin was distinguished by the efficiency of rainfed agriculture, recording the highest relative productivity leap (+169%) while operating with stable water consumption, culminating in a 189% rise in WUEeco. In technological transition areas (rainfed to irrigated), the year 2000 marked a clear inflection point. From this date onwards, transition areas consistently outperformed rainfed GPP. Post-2010, WUEeco values converged between irrigated and rainfed areas, suggesting technical maturity. It is concluded that agricultural modernization has established a new regional paradigm: cultivated systems have attained water use efficiency levels that significantly contrast with historical baselines, resulting in a highly productive landscape that maintains resilience despite the extensive replacement of native vegetation.

How to cite: Alves, W., Ruhoff, A., Ramalho, N., and Laipelt, L.: Dynamics of carbon-water coupling in the Brazilian Cerrado: A long-term comparison of natural and agricultural systems (1985–2024) , EGU General Assembly 2026, Vienna, Austria, 3–8 May 2026, EGU26-15617, https://doi.org/10.5194/egusphere-egu26-15617, 2026.

EGU26-15918 | ECS | Orals | BG9.10

Satellite-guided crop phenology modeling for North and South America 

Zhe Zhang, Yan Jiang, Cenlin He, and Jennifer Burney

Crop phenology, representing the physiological development stages of crop growth, alters surface energy, water, and carbon budgets, thereby modulates land-atmosphere interactions. It is also crucial for estimating crop production and designing agricultural management, making it a key to food and water security. However, phenology varies across different crops and regions, and growth stage information is often sparse, limiting our understanding and modeling capabilities. Current process-based crop models typically determine phenology by accumulating growing degree days by using site-specific parameters, which limits its application to large-scale studies. Advances in remote sensing offer tools to bridge this data gap and enhance model performance.

In this study, we combined NASA MODIS reflectance data (NIRv) and USDA Crop Data Layer to create high-resolution, multi-decade crop phenology maps for four major crops (maize, soybean, wheat, and rice) in the US. Five phenology stages—emergence, vegetative, reproductive, mature, and harvest—were identified using a curve-based algorithm. Our estimates align well with USDA county-level crop progress reports, demonstrating the robustness of our method. Our approach also accurately captures interannual variability in crop phenology, such as late emergence dates in 2019 due to increased spring rainfall in the Corn Belt. We then used our product to guide a process-based crop model (Noah-MP crop), improving phenology parameterization of growing seasons. Extending our method to a global scale, we showcased its capability in regions lacking ground surveys, such as South America. These satellite-based phenology maps have significant potential for understanding crop responses to climate variability, enhancing model parameters, and fostering sustainable agricultural development, especially in data-scarce regions.

How to cite: Zhang, Z., Jiang, Y., He, C., and Burney, J.: Satellite-guided crop phenology modeling for North and South America, EGU General Assembly 2026, Vienna, Austria, 3–8 May 2026, EGU26-15918, https://doi.org/10.5194/egusphere-egu26-15918, 2026.

EGU26-16378 | ECS | Posters on site | BG9.10

Maize yield forecasting in Lombardy region in Italy using a machine learning model driven by remote sensing data 

Jiawei Chen, Belen Franch, Stefano Mariani, and Chiara Corbari

Regional crop production is increasingly affected by climate variability, creating a need for operational monitoring and early-warning systems based on Earth observation (EO). In this study, we present an end-to-end EO-driven framework for regional maize monitoring in Lombardy (Northern Italy), combining annual maize mapping (2017–2025) with early-season yield forecasting over the same period.

Maize distribution is mapped annually at 10 m resolution using Sentinel-2 imagery. A LightGBM classifier is trained on phenology-based NDVI features derived from seasonal composites. Training data are obtained from official crop-type raster maps of the Lombardy Regional Agricultural Information System and supplemented with provincial parcel data for 2024. To reduce commission errors, classification is restricted to cropland using the DUSAF “arable land” mask provided by Regione Lombardia.

Maize yield forecasting relies exclusively on early-season information defined in thermal time (GDD < 1200). Field-level features are extracted by GDD stages from multiple EO and meteorological sources, including Sentinel-2 L2A spectral indices, Sentinel-1 GRD VV/VH backscatter, MODIS land surface temperature, evapotranspiration (ET/PET), and LAI/FPAR, ERA5-Land daily temperature, precipitation, radiation and soil moisture (with vapor pressure deficit derived), SMAP surface and root-zone soil moisture, and static terrain and soil properties from NASADEM and SoilGrids.

A stacking ensemble model (Random Forest, Gradient Boosted Decision Trees, and XGBoost with a ridge regression meta-learner) is trained on an independent field-level maize yield dataset from Spain, linearly calibrated, and transferred to Lombardy. Regional and provincial yield estimates are further bias-corrected using standardized early-season anomaly features and an independent drought indicator (PDSI). When evaluated against official Lombardy maize yield statistics (7-province average), the anomaly- and PDSI-based correction substantially improves interannual performance, reducing RMSE from 1.20 to 0.53 t ha⁻¹ and increasing explained variance to R² ≈ 0.73.

Overall, the proposed framework shows how phenology-based crop mapping and early-season, multi-source EO information can be integrated into a practical regional system for maize monitoring and yield forecasting, supporting climate risk assessment and adaptation planning.

How to cite: Chen, J., Franch, B., Mariani, S., and Corbari, C.: Maize yield forecasting in Lombardy region in Italy using a machine learning model driven by remote sensing data, EGU General Assembly 2026, Vienna, Austria, 3–8 May 2026, EGU26-16378, https://doi.org/10.5194/egusphere-egu26-16378, 2026.

EGU26-16845 | ECS | Posters on site | BG9.10

Rainfed agriculture under a changing climate: Investigating barley crop growth at seasonal and decadal timescales 

Ioannis Sofokleous, George Zittis, Ehud Strobach, Hakan Djuma, Niovi Christodoulou, Andreas Savvides, and Adriana Bruggeman

Rainfed agriculture is widely practiced across Mediterranean landscapes; however, its strong dependence on seasonal weather conditions makes it particularly vulnerable to drought and heat stress. Under projected increases in the frequency and intensity of these extremes due to climate change, the agricultural sector requires timely and reliable information to support planning and adaptation strategies. The main objective of this study is to investigate the response of a rainfed crop to climate variability at both seasonal and decadal timescales. The crop examined is barley, a major rainfed cereal cultivated in semi-arid and Mediterranean regions. Cyprus, located in the Eastern Mediterranean, is used as a case study. Crop growth is simulated using the Noah Land Surface Model with multi-parameterization options and a crop module (Noah-MP-Crop). The model is calibrated and evaluated against observations of evapotranspiration and net ecosystem exchange measured by an eddy covariance flux tower, soil moisture from sensors at multiple depths, leaf area index, and crop yield for the period 2020 - 2025 at an agricultural site in the central plain of the island. The long-term average rainfall for the site is 315 mm. To assess climate impacts on crop growth and yield, the calibrated model is subsequently applied across Cyprus, focusing on areas under rainfed barley cultivation. Climate impacts are analysed at seasonal and decadal scales using two simulation experiments driven by bias-corrected and statistically downscaled climate datasets. Seasonal simulations are forced by ECMWF SEAS5, while decadal simulations are based on EC-Earth3 DCCP CMIP6. All simulations are conducted at a spatial resolution of 0.1° for the period 1982–2016.

This research received financial support from the European Union under the PREVENT Project (GAP 101081276).

How to cite: Sofokleous, I., Zittis, G., Strobach, E., Djuma, H., Christodoulou, N., Savvides, A., and Bruggeman, A.: Rainfed agriculture under a changing climate: Investigating barley crop growth at seasonal and decadal timescales, EGU General Assembly 2026, Vienna, Austria, 3–8 May 2026, EGU26-16845, https://doi.org/10.5194/egusphere-egu26-16845, 2026.

EGU26-19039 | Orals | BG9.10

INDRA-Net: A Weakly Supervised Multiple Instance Learning Framework for Spatio-Temporally Interpretable and Extreme-Aware Crop Yield Forecasting in India 

Amit Kumar Srivastava, Krishnagopal Halder, Kaushik Reddy Muduchuru, Luis Alfredo Pires Barbosa, KaziJahidur Rahaman, Karthikeyan Lanka, Karam Alsafadi, Michael Maerker, Thomas Gaiser, Dominik Behrend, Gang Zhao, Wenzhi Zheng, Liangxiu Han, Manmeet Singh, and Frank Ewert

In agrarian economies like India, anticipating crop yield shocks before harvest is crucial for managing climate risks, stabilizing markets, and safeguarding food security. As extreme weather events become more frequent, policymakers need not only early warnings but also interpretable insights that explain where and why failures may occur. Yet, a key limitation remains: while remote sensing provides fine-scale information, yield data are usually available only at coarse administrative levels, and common averaging approaches erase the local variability that often drives yield losses. To bridge this gap, we introduce INDRA-Net (Interpretable Network for District Residual Aggregation), a weakly supervised Multiple Instance Learning (MIL) framework that directly predicts 38 years (1980-2017) of district-level yield residuals from high-resolution pixel-level time series. Unlike conventional methods that rely on naive spatial aggregation, the architecture employs a shared Temporal Fusion Transformer (TFT) backbone to independently encode the complex interactions between static drivers (e.g., soil properties, topography) and dynamic inputs (e.g., weather, vegetation indices) at the individual grid-cell level. These local embeddings are then synthesized via a learnable Gated Attention mechanism, which dynamically assigns higher weights to agriculturally relevant pixels while suppressing noise and non-crop signals. The framework is trained with a quantile regression objective to forecast yield anomalies, enabling explicit uncertainty estimates (P10–P90) essential for operational risk management. Extensive evaluation on wheat and maize yields across Uttar Pradesh, Punjab, Madhya Pradesh, and Bihar demonstrates that INDRA-Net reduces forecasting error (RMSE) by 12–14% compared to state-of-the-art machine learning baselines (Random Forest, XGBoost) and deep learning models (LSTM). By preserving pixel-level variability, the model captures localized extreme events—such as heatwaves or moisture stress- that are typically smoothed out by spatial aggregation. Crucially, the model’s three-dimensional interpretability aligns with crop physiology, correctly identifying maximum temperature during wheat grain-filling and precipitation anomalies during maize silking as the dominant temporal drivers, while isolating sub-district clusters responsible for yield failures. This enables the generation of granular yield anomaly maps without pixel-level labels, offering policymakers a scalable and operational tool for precision monitoring and targeted risk intervention.

How to cite: Srivastava, A. K., Halder, K., Muduchuru, K. R., Pires Barbosa, L. A., Rahaman, K., Lanka, K., Alsafadi, K., Maerker, M., Gaiser, T., Behrend, D., Zhao, G., Zheng, W., Han, L., Singh, M., and Ewert, F.: INDRA-Net: A Weakly Supervised Multiple Instance Learning Framework for Spatio-Temporally Interpretable and Extreme-Aware Crop Yield Forecasting in India, EGU General Assembly 2026, Vienna, Austria, 3–8 May 2026, EGU26-19039, https://doi.org/10.5194/egusphere-egu26-19039, 2026.

Water productivity, defined as yield per unit consumptive water use, remains low in many marginal farming communities with landholdings of 1 ha or less, as defined by the Government of India. This persists despite the wide availability of field-scale weather forecasts, seasonal climate outlooks, and remote-sensing-based crop condition and soil moisture products, along with irrigation advisories. The challenge is not only limited information, but also the weak connection between top-down climate and crop data and bottom-up day-to-day irrigation and crop management decisions made by marginal farmers. This study develops an integrated framework to model water productivity for climate-resilient agriculture under high climate variability. In such conditions, rainfall and temperature vary strongly across seasons and years, creating uncertainty about when and how much to irrigate. This increases the risk of crop water stress or over-irrigation. Water productivity becomes critical under these conditions because it reflects how efficiently limited and uncertain water supplies are converted into yield, rather than focusing only on the volume of water applied. The research focuses on marginal farmers in semi-arid villages of Nashik District, Maharashtra, India. Top- down remote sensing data from MODIS and Sentinel-2 are used to derive evapotranspiration and NDVI, CHIRPS is used for rainfall, and ERA5 for temperature to generate initial local-scale estimates of water productivity. These estimates are then interpreted and refined using bottom-up field data. Bottom-up data collected from household surveys, focus group discussions, and participatory need assessment mapping capture farmer irrigation practices, perceived stress periods, soil moisture conditions, and decision rules. Seasonal and sub-seasonal patterns of water productivity are analysed and related to rainfall variability, temperature stress, irrigation timing, and NDVI-based crop growth dynamics. NDVI and temperature time- series fields are used to identify short stress windows and link fluctuations in water productivity to irrigation timing and crop growth stages, without overstating final yield outcomes. The framework links remote-sensing-based water productivity estimates with farmer-reported irrigation timing, irrigation method, and perceived stress, allowing fields to be grouped into short-term stress categories and relative performance classes that directly inform irrigation decisions. Comparison of satellite observations with farmer responses shows that mismatches between satellite-derived signals and farm-level outcomes arise mainly in small and fragmented plots, during short irrigation decision windows, and when advisory information lacks local relevance or trust. Results show strong variation in water productivity within small areas, driven by differences in irrigation decisions and access to usable information rather than by total consumptive water use. The study provides an integrated framework that reformulates water productivity based on remote sensing into indicators that are suitable for decision-making and are influenced by farmer participation. The framework demonstrates how combining top-down climate data with bottom-up participation can support more adaptive and equitable water use under increasing climate variability.

How to cite: Singh, M., Chinnasamy, P., and Mishra, T.: Integrating top-down remote sensing and bottom-up participatory approaches to model water productivity in marginal farming communities in Maharashtra, India, EGU General Assembly 2026, Vienna, Austria, 3–8 May 2026, EGU26-20964, https://doi.org/10.5194/egusphere-egu26-20964, 2026.

EGU26-807 | ECS | Posters on site | GM2.5

Deep-learning classification of cave-floor surface types from LiDAR data for detailed cave mapping 

Michaela Nováková, Jozef Šupinský, and Jozef Širotník

High-resolution 3D mapping of subterranean environments remains challenging due to their complex geometry, low-light conditions, and restricted accessibility. Among these environments, caves represent particularly demanding settings where detailed spatial documentation is essential for monitoring processes, supporting exploration and conservation efforts. Laser scanning has become a key technique for capturing accurate and detailed 3D representations of caves that form the basis for this heritage documentation and multidisciplinary research. Despite these advances, the creation of cave maps still commonly relies on traverse-line measurements and field sketches, later digitized using specialized cave-surveying software. In recent years, LiDAR data have been used for deriving the cave extent. While this method effectively captures the general geometry of cave passages, the delineation of cave-floor units, sediments, speleothems, rock blocks, and other features remains largely manual and relies heavily on the surveyor’s interpretation. As a result, feature boundaries vary between authors, and detailed cave-surface representation lacks reproducibility that is problematic for long-term documentation. In this study, we explore the use of deep-learning semantic segmentation for classifying selected cave-floor surface types based on geometric features derived from LiDAR data. Building on previous work focused on semi-automatic cave-map generation from LiDAR point clouds, we extend the workflow from deriving cave extent and floor morphology toward the automated interpretation of surface materials and forms. The method was tested on several common cave-floor surface types, including clastic sediments, flowstone, and bedrock, as well as artificial surfaces and objects typical in showcaves. The resulting classifications show that deep-learning models can distinguish surfaces with subtle geometric differences and produce consistent, reproducible delineations of units that are traditionally mapped by hand. Compared with manual digitization, the approach reduces subjectivity and provides a scalable way to generate polygonal layers used in speleocartographic workflows.

How to cite: Nováková, M., Šupinský, J., and Širotník, J.: Deep-learning classification of cave-floor surface types from LiDAR data for detailed cave mapping, EGU General Assembly 2026, Vienna, Austria, 3–8 May 2026, EGU26-807, https://doi.org/10.5194/egusphere-egu26-807, 2026.

EGU26-1968 | ECS | Posters on site | GM2.5

Comparative Analysis of 30-m DEM Products for Hydrological Applications: A Case Study in the Flinders Catchment Australia 

Laleh Jafari, Ben Jarihani, Jack Koci, Ioan Sanislav, and Stephanie Duce

Digital Elevation Models (DEMs) are fundamental to hydrological modelling, watershed delineation, flood hazard assessment, and resource management. However, the reliability of these applications depends heavily on the vertical accuracy of the DEMs. Although several global DEM products with 30-m spatial resolution are widely available, variations in sensor technology, data acquisition methods, and surface characteristics can significantly influence their accuracy and suitability for hydrological studies. This research provides a comparative evaluation of five commonly used global DEMs—TanDEM-X, ASTER GDEM, SRTM, Copernicus DEM, and ALOS World 3D—by assessing their vertical accuracy against high-resolution airborne LiDAR data and ICESat-2 ATL06 measurements. The findings aim to inform best practices for selecting DEMs in hydrological modelling and catchment-scale applications, particularly in data-scarce regions.

The Flinders River catchment in northern Queensland was selected as the critical test area for evaluating how DEM errors propagate into hydrological calculations. This region is characterised by low rainfall and pronounced topographic variability, encompassing flat lowland plains, dissected upland terrain, and localised areas of steep slopes. All DEMs were standardised to a common horizontal and vertical reference framework and co-registered with the test datasets to eliminate systematic discrepancies. ICESat-2 ATL06 data were rigorously filtered to retain only the highest-quality measurements, based on a combination of quality flags, topographic slope thresholds, and signal strength criteria in vegetated areas.

Elevation differences were computed at matched locations, and DEM performance was evaluated using key statistical metrics, including bias, root mean square error (RMSE), mean absolute error (MAE), median error, and standard deviation. To provide a more comprehensive assessment, error behaviour was analysed in relation to terrain slope and catchment characteristics, highlighting zones most vulnerable to error propagation in flow routing and watershed delineation. Systematic patterns in DEM error were further examined with respect to sensor characteristics under varying landscape conditions.

Results indicate that TanDEM-X and Copernicus DEM exhibit the highest vertical accuracy, closely aligning with ICESat-2 and LiDAR observations, whereas ASTER GDEM and SRTM show larger mean errors, particularly in dissected or mountainous terrain. These findings suggest that TanDEM-X and Copernicus DEM are preferable for hydrology-focused applications in semi-arid basins, while ASTER and SRTM should be used cautiously where precise modelling is required. The study underscores the importance of DEM accuracy evaluation in relation to basin characteristics, as errors can significantly influence hydrological modelling outcomes.

How to cite: Jafari, L., Jarihani, B., Koci, J., Sanislav, I., and Duce, S.: Comparative Analysis of 30-m DEM Products for Hydrological Applications: A Case Study in the Flinders Catchment Australia, EGU General Assembly 2026, Vienna, Austria, 3–8 May 2026, EGU26-1968, https://doi.org/10.5194/egusphere-egu26-1968, 2026.

EGU26-3936 | Posters on site | GM2.5

Historical Images for Surface Topography Reconstruction Intercomparison eXperiment (Historix) 

Amaury Dehecq, Friedrich Knuth, Joaquin Belart, Livia Piermattei, Camillo Ressl, Robert McNabb, and Luc Godin

Historical film-based images, acquired during aerial campaigns since the 1930s and from satellite platforms since the 1960s, provide a unique opportunity to document changes in the Earth’s surface over the 20th century. Yet, these data present significant and specific challenges, including complex distortions in the scanned image and poorly known exterior and/or interior camera orientation. In recent years, semi- or fully-automated approaches based on photogrammetric and computer vision methods have emerged (e.g., Knuth et al., 2023; Dehecq et al., 2020; Ghuffar et al., 2022), but their performance and limitations have not yet been evaluated in a consistent way.

The ongoing “Historical Images for Surface Topography Reconstruction Intercomparison eXperiment (Historix)” project aims at comparing existing methods for processing stereoscopic historical images and harmonizing processing tools.

Within this experiment, participants are provided with a set of historical images and available metadata and invited to return a point cloud and estimated camera parameters. We selected two study sites near Casa Grande, Arizona, and south Iceland, chosen for their  good availability of historical images and variety of terrain types. For each site, we selected 3 sets of film-based images acquired in the 1970s or 80s, overlapping in space and time: aerial images with fiducial marks from publicly available archives and 2 image sets from the American Hexagon (KH-9) reconnaissance satellite missions acquired by the mapping camera (KH-9 MC) and panoramic camera (KH-9 PC). The submitted elevation data will be cross-validated across different image sets and participant submissions, as well as against reference elevation data over stable terrain. The spread in the retrieved elevations will be analysed with respect to image type, terrain type and processing methods to highlight the strengths and limitations of the different approaches.

In this presentation, we will introduce the experiment design, the selected benchmark dataset, the current methodologies and the preliminary results of the intercomparison. Finally, we will present some of the open-source code that exist or are being developed to process historical images.

How to cite: Dehecq, A., Knuth, F., Belart, J., Piermattei, L., Ressl, C., McNabb, R., and Godin, L.: Historical Images for Surface Topography Reconstruction Intercomparison eXperiment (Historix), EGU General Assembly 2026, Vienna, Austria, 3–8 May 2026, EGU26-3936, https://doi.org/10.5194/egusphere-egu26-3936, 2026.

EGU26-4849 | ECS | Orals | GM2.5

Historical aerial imagery–derived Digital Elevation Models and orthomosaics for glacier change assessment in the western Antarctic Peninsula since 1989 

Vijaya Kumar Thota, Thorsten Seehaus, Friedrich Knuth, Amaury Dehecq, Christian Salewski, David Farías-Barahona, and Matthias H.Braun

The Antarctic Peninsula (AP) is a hotspot of global warming, with pronounced atmospheric warming reported during the 20th century. Although it is critical in terms of climate change studies, the mass balance of glaciers prior to 2000 remains poorly constrained. Existing mass balance estimates are further characterized by high uncertainties due to a lack of observations. In contrast, more than 30000 historical images in archives are the sole direct observations to quantify past glacial changes and their contribution to sea-level rise. 

In this study, we present a unique, timestamped, high-resolution Digital Elevation Model (DEM) and orthomosaic dataset, derived from aerial imagery that covers about 12000 km2 area on the western Antarctic Peninsula and surrounding islands between 66–68° S. We used a film-based aerial image archive from 1989 acquired by the Institut für Angewandte Geodäsie (IfAG), and is kept in the Archive for German Polar Research at the Alfred Wegener Institute, Germany, to generate the historical DEMs and orthoimages. The historical DEMs were co-registered to the Reference Elevation Model of Antarctica (REMA) mosaic on stable terrain. Our historical DEMs have vertical accuracies better than 6 m and 8 m with respect to modern elevation data, REMA, and ICESat-2, respectively. We have made this dataset publicly available at  https://doi.org/10.5281/zenodo.16836526.

Initial mass balance estimates from DEM differencing of our 1989 DEM with recent surfaces from REMA strip DEMs show a near-constant ice mass despite widespread glacier frontal retreat and thinning. We hypothesize that low-elevation ice thickness loss in this period is largely compensated by higher surface mass balance in higher areas. However, this regime appears to be changing, with glaciers transitioning toward increased dynamic activity with enhanced mass loss, and higher ice fluxes.

How to cite: Thota, V. K., Seehaus, T., Knuth, F., Dehecq, A., Salewski, C., Farías-Barahona, D., and H.Braun, M.: Historical aerial imagery–derived Digital Elevation Models and orthomosaics for glacier change assessment in the western Antarctic Peninsula since 1989, EGU General Assembly 2026, Vienna, Austria, 3–8 May 2026, EGU26-4849, https://doi.org/10.5194/egusphere-egu26-4849, 2026.

Quantifying pebble size, shape, and roundness is fundamental to
understanding sediment transport and abrasion in fluvial systems, yet
remains challenging in natural, densely packed settings.  Most existing
approaches rely on 2D imagery and therefore fail to capture true
three-dimensional morphology. Here, we present a curvature-based instance
segmentation framework for reconstructed surface meshes and demonstrate its
role as a key step enabling 3D roundness and orientation analysis.

In our approach, individual pebbles are detected directly from 3D surface
reconstructions using curvature features, without prior shape assumptions.
Validation against high-resolution reference models yields a high detection
precision of 0.98, with remaining errors mainly due to under-segmentation
in overly smooth reconstructions.  Estimates of 3D pebble orientation are
strongly controlled by the represented surface area, highlighting both the
potential and current limitations of orientation retrieval from incomplete
surface segments.

We illustrate how reliable segmentation allow downstream 3D shape and
roundness analyses that are not accessible in 2D, including curvature-based
surface metrics and volumetric descriptors. Example fluvial scenes
demonstrate that segmentation quality directly controls the stability of
roundness estimates and their geomorphic interpretation. Our results
establish curvature-based 3D pebble segmentation as a methodological
foundation for reproducible analyses of pebble shape, roundness, and
orientation in natural river systems.

How to cite: Rheinwalt, A. and Bookhagen, B.: Curvature-based pebble segmentation as a foundation for 3D roundness and orientation analysis, EGU General Assembly 2026, Vienna, Austria, 3–8 May 2026, EGU26-5922, https://doi.org/10.5194/egusphere-egu26-5922, 2026.

Currently available global Digital Elevation Model (DEM) surfaces are either derived from the stereoscopic exploitation of multispectral satellite imagery, point-wise laser altimetry measurements or the interferometric processing of bistatic synthetic aperture radar data, but only radar data allows the acquisition of a global product in a reasonable timeframe. The public private partnership of DLR and Airbus in the TanDEM-X mission paved the ground for the WorldDEM product line and its derivatives such as the Copernicus DEM. Both datasets are based on data acquisitions from December 2010 to January 2015, manual and semi-automated DEM editing procedures and represent a very accurate, very consistent and only pole-to-pole DEM data set. The Copernicus DEM is available with a free-and-open licence.

Various ecosystems such as the geosphere, biosphere, cryosphere and anthroposphere are subject to continuous changes which demand the monitoring of Earth’s topography in regular updates of global Digital Elevation Model data. The WorldDEM Neo product represents the successor of the aforementioned WorldDEM but is based on a fully-automated editing & production process and newer data: the on-going TanDEM-X mission is expected to operate until 2028 and has created an archive of up-to-date DEM scenes ready for integration into a new global DEM coverage (>90% of global landmass acquired between 2017 and 2021; ~60% of global landmass acquired again between 2021 and 2025). In conjunction with continuous improvements of the fully-automated production processes, a new global DEM coverage of WorldDEM Neo is produced early 2026. DEM applications such as the orthorectification of raw satellite imagery will benefit from the availability of an accurate and up-to-date global DEM dataset. Other applications such as multi-temporal 3D change analysis based on a single satellite mission (TanDEM-X) are possible and support the understanding of environmental changes thanks to the 3rd dimension. The rapid availability of the error-compensated WorldDEM Neo Digital Surface Model (DSM) and bare-ground Digital Terrain Model (DTM) after raw data acquisition serve various applications of global DEMs. Future acquisitions of the on-going TanDEM-X mission (until 2028) allow the processing of final and up-to-date DSM and DTM coverages at the end of the mission lifetime.

The presentation comprises a short look into the history with its manual & semi-automated DEM editing procedures. The main focus will be on the fully-automated production processes for truly global DSM & DTM coverages. Accuracy metrics, 3D change statistics between the different global coverages but also visual impressions of the various global DEM coverages will be addressed, too. On-going challenges with interferometry-based elevation data are part of an outlook and different error compensation strategies (e.g. height reconstruction from radar amplitude data based on machine-learning techniques) are highlighted.

How to cite: Fahrland, E. and Schrader, H.: Updating and upgrading a global Digital Elevation Model - the fully automated production of WorldDEM Neo with acquisitions until 2025, EGU General Assembly 2026, Vienna, Austria, 3–8 May 2026, EGU26-6660, https://doi.org/10.5194/egusphere-egu26-6660, 2026.

EGU26-9007 | ECS | Orals | GM2.5

Use of time-lapse photogrammetry to capture substantial accumulation rates on an on-glacier avalanche deposit  

Marin Kneib, Patrick Wagnon, Laurent Arnaud, Louise Balmas, Olivier Laarman, Bruno Jourdain, Amaury Dehecq, Emmanuel Le Meur, Fanny Brun, Andrea Kneib-Walter, Ilaria Santin, Laurane Charrier, Thierry Faug, Giulia Mazzotti, Antoine Rabatel, Delphine Six, and Daniel Farinotti

Avalanches are critical contributors to the mass balance and spatial accumulation patterns of mountain glaciers. While gravitational snow redistribution models predict high localized accumulation, these predictions lack field validation due to the difficulty of monitoring highly dynamic avalanche cones. Here, we present two years of high-resolution monitoring of a large avalanche cone in the accumulation area of Argentière Glacier (French Alps). To capture these dynamics, we employed a multi-sensor approach: Uncrewed Aerial Vehicle (UAV) surveys and a time-lapse photogrammetry array consisting of 7 low-cost cameras deployed ~1 km away from the cone. The distance of the sensors from the surveyed area, its geometry (>30°), its surface characteristics (smooth snow surface) and the absence of fixed stable terrain due to the surrounding headwalls being episodically covered in snow made this environment particularly challenging for the photogrammetry methods applied. Point clouds and Digital Elevations Models were produced at a two-week resolution using Structure-from-Motion photogrammetry in Agisoft Metashape v1.8.3. with the alignment being constrained with Pseudo Ground Control Points. We could further co-register all point clouds to a September UAV acquisition with the Iterative Closest Point algorithm from the open-source project Py4dgeo, using automatically-derived stable ground from the RGB information of the images.

Methodological validation shows that while side-looking time-lapse photogrammetry captures the overall trend, it tends to underestimate elevation changes compared to UAV data, with biases up to 1.8 m and standard deviations of 2–6 m. Winter-time acquisitions with low light conditions over smooth snow surfaces also lead to reduced correlation over the cone. Despite these uncertainties, our results reveal extreme spatial variability in accumulation. The top of the cone is the most active zone, exhibiting elevation changes of ~30 m annually and a strong accumulation of 60 m w.e. between March 2023 and 2025 when accounting for the ice flow—roughly 15 times the annual mass balance recorded by the GLACIOCLIM program in the nearby accumulation area not affected by avalanche deposits. We identify a topographical threshold for snow storage: the upper cone fills early in the season until reaching a critical slope of ~35°, after which subsequent avalanches bypass the apex to deposit mass at the cone’s base. From May onwards, mass redistribution is further modulated by the development of surface channels. Our findings demonstrate that time-lapse photogrammetry is a viable tool for monitoring dynamic glacier surfaces and provide rare empirical evidence of the dominant role avalanches play in glacier mass budgets.

How to cite: Kneib, M., Wagnon, P., Arnaud, L., Balmas, L., Laarman, O., Jourdain, B., Dehecq, A., Le Meur, E., Brun, F., Kneib-Walter, A., Santin, I., Charrier, L., Faug, T., Mazzotti, G., Rabatel, A., Six, D., and Farinotti, D.: Use of time-lapse photogrammetry to capture substantial accumulation rates on an on-glacier avalanche deposit , EGU General Assembly 2026, Vienna, Austria, 3–8 May 2026, EGU26-9007, https://doi.org/10.5194/egusphere-egu26-9007, 2026.

EGU26-9167 | ECS | Posters on site | GM2.5

Optimizing SfM workflows for continuous river bank monitoring: evaluating image alignment accuracies across diverse environmental conditions 

László Bertalan, Lilla Kovács, Laura Camila Duran Vergara, Dávid Abriha, Robert Krüger, Xabier Blanch Gorriz, and Anette Eltner

River bank erosion represents a dynamic geomorphic hazard, particularly in meandering channels where migration rates threaten critical infrastructure and agricultural land. While our previous work on the Sajó River (Hungary) established a novel, low-cost monitoring framework utilizing Raspberry Pi (RPi) cameras for near-continuous observation, the reliability of photogrammetric reconstruction under uncontrolled outdoor conditions remains a critical challenge. This study presents a systematic evaluation of the accuracy constraints inherent in automated Structure-from-Motion (SfM) processing pipelines, with a specific focus on optimizing image alignment across a wide range of scene conditions.

To determine the robustness of RPi imagery, we conducted a comprehensive sensitivity analysis of the SfM-based image alignment phase. We systematically tested over 120 variations of processing parameters, manipulating keypoint and tie-point limits, upscaling factors, and masking strategies. The implementation of rigorous masking was critical, as the imagery is geometrically challenging: the moving river surface in the foreground and the sky in the background occupy the majority of the field of view, leaving only a narrow, static fraction of the image relevant for reliable 3D reconstruction. These combinations were evaluated against a dataset representing the full range of environmental variability, including clear, cloudy, dark, foggy, overexposed, and rainy conditions, as well as distinct hydrological states such as low flows, flood events, and snow cover.

Preliminary results indicate that a specific balance of 30,000 keypoints and 5,000 tie points (ratio 6.0) optimizes reconstruction fidelity, achieving an RMS error of 0.75 pixels under clear weather conditions. Notably, the system demonstrated unexpected robustness in low-light scenarios, maintaining consistent error margins of 1.17–1.18 pixels across various configurations. Conversely, scaling up these limits beyond the optimum yielded diminishing returns, confirming that higher computational loads do not necessarily equate to improved geometric accuracy. Furthermore, we applied gradual selection algorithms to filter sparse point clouds, removing unreliable points based on reconstruction uncertainty to isolate the most geometrically valid features.

The crucial final phase of this research bridges the gap between digital reconstruction and physical reality. We validate the optimized SfM-based point clouds by comparing them directly against high-precision Terrestrial Laser Scanning (TLS) data acquired during two previous campaigns and upcoming field surveys. This multi-temporal comparison allows us to quantify specific error margins for volumetric and horizontal material displacement calculations. By defining these accuracy constraints, we establish a validated protocol for calculating erosion volumes during high-flow events, ensuring that automated, low-cost monitoring systems can provide actionable, high-precision data for river management even under adverse environmental conditions.

---

The research was funded by the DAAD-2024-2025-000006 project-based research exchange program (DAAD, Tempus Public Foundation).

How to cite: Bertalan, L., Kovács, L., Duran Vergara, L. C., Abriha, D., Krüger, R., Blanch Gorriz, X., and Eltner, A.: Optimizing SfM workflows for continuous river bank monitoring: evaluating image alignment accuracies across diverse environmental conditions, EGU General Assembly 2026, Vienna, Austria, 3–8 May 2026, EGU26-9167, https://doi.org/10.5194/egusphere-egu26-9167, 2026.

Long-term observations of glacier mass change provide a key indicator of atmospheric warming and are essential for understanding glacier behaviour and responses to climate forcing. Archived aerial photographs represent an underutilised source of historical information from which three-dimensional surface geometry can be reconstructed to quantify past glacier change. This approach is particularly valuable in Antarctica, where surface-elevation change prior to the 1990s remains poorly constrained due to limited pre-satellite altimetry and a scarcity of reliable Ground Control Points (GCPs). As a result, historic mass-balance estimates have largely relied on climate reanalysis and modelling.

Advances in photogrammetric techniques have substantially improved the efficiency and accuracy of Digital Elevation Models (DEMs) derived from historical aerial imagery. Here, we present a newly compiled inventory of Antarctic aerial surveys conducted throughout the twentieth century, documenting their spatial and temporal coverage to identify regions suitable for DEM reconstruction. Then, building on established workflows, we show newly constructed DEMs for three glaciers that formerly fed the Larsen A Ice Shelf on the Antarctic Peninsula, capturing surface geometry both before and after its collapse in 1995. These reconstructions reveal heterogenous glacier responses to reduced buttressing, controlled by local morphology and consistent with previous regional observations.

How to cite: Rowe, E., Willis, I., and Fenney, N.: Compiling an Inventory of Historic Antarctic Aerial Photographs to Measure Long-Term Glacial Mass Balance Change from Digital Elevation Models, EGU General Assembly 2026, Vienna, Austria, 3–8 May 2026, EGU26-13015, https://doi.org/10.5194/egusphere-egu26-13015, 2026.

EGU26-13875 | Posters on site | GM2.5

Using high-resolution bathymetric data from a multibeam sonar acquisition to map and analyse geomorphical underwater structures in the proglacial Grastallake in the Horlachtal valley/ Ötztal Alps 

Florian Haas, Manuel Stark, Jakob Rom, Lucas Dammert, Till Kohlhage, Toni Himmelstoss, Diana-Eileen Kara-Timmermann, Moritz Altmann, Carolin Surrer, Korbinian Baumgartner, Peter Fischer, Sarah Betz-Nutz, Tobias Heckmann, Norbert Pfeifer, Gottfried Mandlburger, and Michael Becht

As part of the DFG research group “Sensitivity of high alpine geosystems to climate change since 1850” (SEHAG), high-resolution multibeam sonar data was collected from the proglacial Grastallake in the Ötztal valley during a boat survey in the summer of 2025. The Grastallake has an area of approximately 63,000 m², a maximum depth of approximately 16 m, and lies at an altitude of 2,584 m. The lake is situated in a former cirque, and its shores and the surrounding are partly composed of loose material and partly of solid rock. In the western part, there is a large whaleback with already known Egesen-moraines on top. On the southern and eastern shores, larger active debris flow cones are coupled to the lake, with meltwater runoff from the higher Grastalferner glacier flowing into the lake as a perennial stream via the eastern debris flow cone. Due to the permanent inflow from the glacier and the topographic conditions of the catchment area, the eastern debris flow cone is very active and has intensively been reshaped by several extreme debris flow events during the last years.

The bathymetric data was collected using a Norbit multibeam sonar (WBMS), which was supplemented by an SBG INS system (dual GNSS patch antenna system, SBG Eclipse D) by Kalmar Systems. Since the underwater topography of the lake was unknown and its high turbidity due to the glacier inflow, the first step was to conduct a rough survey of the lake. This step made it possible to create a coarse depth map on site in order to identify spots with shallow water, determine the system settings, and draw up a navigation plan along strips. After field work the recorded data was processed using Quinertia for trajectory calculation and Opals for strip adjustment. This resulted in a final 3D point cloud with an average point density of 400 points per square meter, which was converted to raster data in order to perform spatial analyses.

Using the data, geomorphological forms were mapped in a first step. In addition to a previously unknown late glacial moraine section, the underwater deposits of recent debris flows became visible. In addition to mapping, geomorphological structures were used for spatial analysis, such as comparing the depositions of debris flows above and below the water. Since the data is very well suited for mapping underwater structures, this case study demonstrates the enormous potential of bathymetric data acquired by multibeam sonar measurements, that has rarely been used for geomorphological studies to date. Multitemporal analysis in the sense of a 4D analysis could only be carried out to a limited extent in this case study. However, with the data now available, multitemporal analysis, i.e., quantification of sediment input into lakes, will also be possible in the future. This would then enable assessments to be made of the hazard potential of newly formed lakes in the proglacial area and of their lifespan. 

How to cite: Haas, F., Stark, M., Rom, J., Dammert, L., Kohlhage, T., Himmelstoss, T., Kara-Timmermann, D.-E., Altmann, M., Surrer, C., Baumgartner, K., Fischer, P., Betz-Nutz, S., Heckmann, T., Pfeifer, N., Mandlburger, G., and Becht, M.: Using high-resolution bathymetric data from a multibeam sonar acquisition to map and analyse geomorphical underwater structures in the proglacial Grastallake in the Horlachtal valley/ Ötztal Alps, EGU General Assembly 2026, Vienna, Austria, 3–8 May 2026, EGU26-13875, https://doi.org/10.5194/egusphere-egu26-13875, 2026.

EGU26-17031 | ECS | Posters on site | GM2.5

High-precision point cloud generation for forest inventory: Integrating GNSS-RTK and SLAM for handheld laser scanning 

Carolin Rünger, Stefan Binapfl, Ferdinand Maiwald, Robert Krüger, and Anette Eltner

In recent years, forest management and inventory have increasingly relied on handheld personal laser scanners (H-PLS) for capturing flexible three-dimensional data. These systems have become essential for extracting critical tree attributes, such as diameter at breast height (DBH) and tree height. Most traditional H-PLS systems utilize Simultaneous Localization and Mapping (SLAM), which fuses LiDAR and Inertial Measurement Unit (IMU) data to reconstruct environments. However, SLAM is based on relative sensor measurements, which inherently causes accumulated errors and trajectory drift. In complex forest environments, similar-looking stems and moving vegetation can further confuse the mapping process, resulting in distorted point clouds or duplicated stems that reduce the accuracy of extracted tree attributes.

While Global Navigation Satellite System (GNSS)-based Real-Time Kinematic (RTK) positioning provides centimetre-level absolute accuracy and usually drift-free trajectories, its application in forestry is critically hindered by signal obstruction in dense canopies. The integration of GNSS-RTK and SLAM offers a robust and synergetic solution to these challenges, allowing one method to compensate for the failures of the other. A promising development in this field is an H-PLS system that integrates GNSS-RTK, IMU, LiDAR, and camera measurements to generate georeferenced point clouds directly in the field. This hybrid approach utilizes LiDAR and camera data to maintain positioning during GNSS outages and utilizes RTK information to re-initialize and correct the trajectory once the signal is restored.

Our study evaluates whether this integrated GNSS-RTK SLAM approach improves point cloud geometry and tree attribute extraction compared to traditional SLAM methods without GNSS integration. We conducted a field campaign in a mixed forest stand during the leaf-off period to simulate realistic operating conditions with alternating GNSS visibility. The performances of a SLAM-only and a SLAM + GNSS-RTK H-PLS were validated against highly accurate terrestrial laser scanning (TLS) reference data. The analysis involved tree segmentation to assess individual tree identification and the derivation of DBH, stem positions, and tree heights. Furthermore, we investigated internal geometric quality by analysing local noise levels using cross-sectional residuals relative to fitted circles and assessed spatial homogeneity to identify artifacts like duplicated stems or gaps.

Initial results indicate that the SLAM + GNSS-RTK H-PLS system provides DBH estimates comparable to TLS, with observed differences of 6.3 mm and 1.17 cm for major and minor axes, respectively. Despite slight overestimations due to scattering, the significantly reduced acquisition time makes this integrated system an efficient alternative for forestry applications. These findings contribute to a better understanding of how integrated positioning systems can enhance mobile laser scanning workflows and support the development of autonomous, high-precision forest mapping solutions.

How to cite: Rünger, C., Binapfl, S., Maiwald, F., Krüger, R., and Eltner, A.: High-precision point cloud generation for forest inventory: Integrating GNSS-RTK and SLAM for handheld laser scanning, EGU General Assembly 2026, Vienna, Austria, 3–8 May 2026, EGU26-17031, https://doi.org/10.5194/egusphere-egu26-17031, 2026.

EGU26-17484 | Orals | GM2.5

Permanent terrestrial laser scanning for environmental monitoring 

Roderik Lindenbergh, Sander Vos, and Daan Hulskemper

Many topographic scenes demonstrate complex dynamic behavior that is difficult to map and understand. A terrestrial laser scanner fixed on a permanent position can be used to monitor such scenes in an automated way with centimeter to decimeter quality at ranges of up to several kilometers. Laser scanners are active sensors, and can continue operation during night. Their independence from surface texture properties ensures in principle that they provide stable range measurements for varying surface conditions.

Recent years have seen an increase in the employment of such systems for different applications in environmental geosciences, including forestry, glaciology and geomorphology. This employment resulted in a new type of 4D topographic data sets (3D point clouds + time) with a significant temporal dimension, as such systems can acquire thousands of consecutive epochs.

However, extracting information from these 4D data sets turns out to be challenging, first, because of insufficient knowledge on error budget and correlations, and second, because of lack of algorithms, benchmarks, and best-practice workflows.

The presentation will showcase recently active systems that monitored a forest, a glacier, an active rockfall site and a sandy beach respectively. Data from these systems will be used to illustrate different systematic challenges that include instabilities of the sensor system, meteorological and atmospheric influence on the data product and the maybe surprising need for alignment of point clouds from different epochs.

In addition, different ways to extract information from these 4D data sets will be discussed, in connection with particular applications. While bi-temporal change detection is often a starting point for exploring 4D data, several methods are being developed that truly exploit the extensive time dimension, including tracking, trend analysis, time series clustering and spatio-temporal region growing.

Lessons learned from experiences with these systems in different domains lead to several recommendations for future employment considering field of view design, auxiliary sensors (e.g. IMU, camera, weather station) and the possible deployment of low-cost alternatives, thereby providing a view on the near future of permanent laser scanning.

Reference

Lindenbergh, R., Anders, K., Campos, M., Czerwonka-Schröder, D., Höfle, B., Kuschnerus, M., Puttonen, E., Prinz, R., Rutzinger, M., Voordendag, A & Vos, S. (2025). Permanent terrestrial laser scanning for near-continuous environmental observations: Systems, methods, challenges and applications. ISPRS Open Journal of Photogrammetry and Remote Sensing, 17, 100094. DOI: 10.1016/j.ophoto.2025.100094

How to cite: Lindenbergh, R., Vos, S., and Hulskemper, D.: Permanent terrestrial laser scanning for environmental monitoring, EGU General Assembly 2026, Vienna, Austria, 3–8 May 2026, EGU26-17484, https://doi.org/10.5194/egusphere-egu26-17484, 2026.

Beachrocks are cemented coastal deposits formed within the intertidal zone by the precipitation of magnesium-rich calcium carbonate. They constitute important paleogeographic and paleoclimatic markers, as they allow the reconstruction of past shoreline evolution. In addition, beachrocks influence current coastal dynamics and represent valuable geological heritage and ecological reservoirs that require preservation.

This study focuses on a sequence of multiple beachrock levels located along the Catalan Coast (NE Iberian Peninsula). The system consists of a complex sequence of submerged beachrocks with a wide formation range, situated at water depths between −0.25 m and −48 m below the current sea level. These deposits exhibit lateral continuity of up to 4.5 km and are characterized by reduced thicknesses and low geomorphic expression. The underlying substrate is composed of unconsolidated marine sediments. In certain sectors, a spatial overlap with Posidonia oceanica meadows occurs.

The aforementioned characteristics hinder their cartographic representation using traditional methods, such as aerial image interpretation and hillshade maps derived from bathymetric data, particularly for thin structures located at greater depths and in areas where Posidonia oceanica meadows are present.

The aim of this study is to evaluate the usefulness of the Red Relief Image Map (RRIM) method as an alternative quantitative terrain visualization tool for the cartography of submerged beachrocks. This method is based on the quantitative attribute openness, which expresses the degree of dominance or enclosure of a location on an irregular surface and enhances concave (negative openness) and convex (positive openness) features. Using this attribute, the RRIM method combines three main elements: topographic slope, positive openness and negative openness, allowing the visualization of subtle, low-relief topographic structures on apparently flat surfaces.

Using this approach, this study aims to improve the identification and cartographic delineation of submerged beachrock levels and to define optimal visualization parameters that contribute to a better understanding of the beachrock sequence.

How to cite: Vicente, M.-A., Mencos, J., and Roqué, C.: Testing the Red Relief Image Maps methodology to enhance the beachrock cartography in Torredembarra coast (Catalan coast, West  Mediterranean Sea), EGU General Assembly 2026, Vienna, Austria, 3–8 May 2026, EGU26-17571, https://doi.org/10.5194/egusphere-egu26-17571, 2026.

EGU26-17927 | ECS | Posters on site | GM2.5

Long-term glacier elevation change at Gran Campo Nevado since 1945  

Lucas Kugler, Camilo Rada, Clare Webster, Jan Dirk Wegner, Etienne Berthier, and Livia Piermattei

Scanned historical aerial photographs acquired with film cameras from the early twentieth century to the early 2000s are the longest and richest archive of Earth observation data for reconstructing past topography. Those with stereoscopic acquisition enable the generation of Digital Elevation Models (DEMs) and orthoimages when processed with photogrammetric techniques, extending the assessment of environmental change beyond the time scale of modern satellite observations.  

In this study, we present a long-term (1945-2020) dataset of glacier surface elevation for the Gran Campo Nevado ice field in southern Chile. The dataset is based on aerial photographs acquired in 1945 using a Trimetrogon camera and in the 1980s and 1990s using nadir-looking film cameras from the Chile60 and Geotec flight campaigns, complemented by a 2020 Pléiades satellite–derived DEM made available through the Pléiades Glacier Observatory program (Berthier et al., 2023). To process the historical photographs, we developed an open-source pipeline that builds on structure-from-motion (SfM) principles and incorporates learning-based feature-detection and matching algorithms, such as SuperPoint and LightGlue. Absolute image orientation is achieved through automated detection of ground control points derived from the Pléiades DEM and orthoimage. DEMs accuracy was evaluated over stable terrain by comparing them with the Pléiades reference DEM. As well, the reconstructed DEMs are compared with those obtained using an established SfM processing workflow (HSfM; Knuth et al., 2023). The resulting DEMs provide a reconstruction of glacier surface elevation spanning more than seven decades, and glacier elevation changes are quantified from the DEM time series. By using reproducible, open-source methodologies, this presentation demonstrates opportunities for the research community to leverage other historical datasets and extend analyses beyond what is possible with modern satellite observations alone. 

How to cite: Kugler, L., Rada, C., Webster, C., Wegner, J. D., Berthier, E., and Piermattei, L.: Long-term glacier elevation change at Gran Campo Nevado since 1945 , EGU General Assembly 2026, Vienna, Austria, 3–8 May 2026, EGU26-17927, https://doi.org/10.5194/egusphere-egu26-17927, 2026.

EGU26-18399 | ECS | Orals | GM2.5

From badland to bushland? Analysis of geomorphic process dynamics and vegetation development in a sub-humid calanchi area based on high-resolution UAS data (2014-2024). 

Manuel Stark, Annalisa Sannino, Martin Trappe, Jakob Rom, Jakob Forster, Georgia Kahlenberg, Florian Haas, and Francesca Vergari

Badlands are among the most rapidly developing landscapes and exhibit a significant degree of geomorphological activity. In semi-arid/ sub-humid landscapes, specific precipitation dynamics result in particularly rapid geomorphological development. This applies in particular to land cover and geomorphology. This study employs quantitative, multi-temporal analysis to examine the spatio-temporal changes in a sub-humid calanchi badland in the upper Val d'Orcia (Italy) over a period of ten years (2014-2024). Particular emphasis lies on the dynamics of geomorphological processes and topographical changes, while considering the variables of vegetation and precipitation. The analysis encompasses both extreme events and prolonged rainfall lasting several days, which are the primary factors for surface changes in subhumid badlands. The utilisation of UAS SfM-MVS in conjunction with precise dGNSS measurements facilitates high-resolution change detection and landform analysis across five distinct observation periods, each spanning two years (= five DoD). The interactions between vegetation and geomorphological processes are investigated using a semi-automatic mapping approach based on the Triangular Greenness Index (TGI) and the interpretation of topographical changes (DoD). The vegetation analysis are based on high-resolution orthomosaics with a resolution of 0.05 m, while the geomorphic change detection analysis is carried out on 2.5D rasterised digital surface models with a resolution of 0.25 m. The major results are as follows: The mean slope gradient of the entire study site remained largely stable despite certain areas showing enhanced geomorphic activity. The DoD analysis revealed four 'geomorphic hot spots', areas of enhanced geomorphic activity and sediment contribution from the tributaries to the main valley (the major deposition area). The annual erosion rates vary between -0.4 cm (2018-2022) and -4 cm (2022-2024). The observed topographic changes can be attributed primarily to high-magnitude events (complex landslides and debris-like flows) that occur irregularly. The multi-temporal mapping of landforms has revealed a significant reduction in water erosion, with a 50% decrease observed from 35% in 2014 to 17% in 2024. Furthermore, the combination of 2D-mappings and 2.5D DoD-analysis enabled the documentation of a geomorphological process previously unknown in badland areas, namely gravitational bulging. This describes the deformation of sediments in lower-lying clay layers as a response to water infiltration, high swelling capacities of clays and the pressure exerted by the sediment packages lying above them. A significant increase in vegetation cover has been observed, particularly in areas designated as potentially moist and gentle terrain, often the deposition areas from the previous period. In general, vegetation underwent a gradual transition, evolving from a fragmented to a continuous structure, primarily due to the widespread colonisation of the main valley and the landslide pathways.  Although the area affected by erosion processes decreased over the course of the study period, erosion rates remained relatively constant. This indicates a shift from high-frequency to high-magnitude processes in the most recent observation period. Overall, the phase under consideration in this study (2014-2024) can be characterised as a phase of badland stabilisation.

How to cite: Stark, M., Sannino, A., Trappe, M., Rom, J., Forster, J., Kahlenberg, G., Haas, F., and Vergari, F.: From badland to bushland? Analysis of geomorphic process dynamics and vegetation development in a sub-humid calanchi area based on high-resolution UAS data (2014-2024)., EGU General Assembly 2026, Vienna, Austria, 3–8 May 2026, EGU26-18399, https://doi.org/10.5194/egusphere-egu26-18399, 2026.

EGU26-19445 | ECS | Orals | GM2.5 | Highlight

From Static to Dynamic: Modernizing the Sharing of HistoricalPhotogrammetry Datasets 

Felix Dahle, Roderik Lindenbergh, and Bert Wouters

The recovery of historical topography from analogue aerial archives has has become a well-established workflow in geosciences, unlocking high-resolution records of topographic change that were previously inaccessible. However, the standard practice for sharing these results relies on static FTP servers or raw file downloads. Consequently, these datasets often remain difficult to discover, particularly for researchers from other disciplines who cannot easily assess the spatial coverage or relevance of the archive through static file lists. Furthermore, existing web-based visualization solutions often require complex database configurations and advanced full-stack development skills, rendering them inaccessible for many geoscience research groups lacking dedicated software engineers.

In this work, we present a lightweight, open-source web application designed to support the publication of historical photogrammetric data. The design prioritizes portability and ease of deployment for non-developers. Unlike complex Content Management Systems (CMS) that rely on heavy database backends, our tool utilizes a streamlined file-based ingestion pipeline. Researchers can deploy a fully interactive instance by populating a directory structure with standard geospatial vector formats (e.g., Shapefiles, GeoJSON) and point cloud data. The Node.js-based backend automatically parses these inputs to configure the visualization interface, thereby eliminating the need for manual database administration.

We demonstrate the capabilities of the website using a dataset from the Antarctic TMA archive with ~ 250.000 images. The resulting interface facilitates spatio-temporal discovery through an interactive map that visualizes survey footprints, including the residuals between metadata-derived and SfM-estimated positions. This allows users to rapidly assess geometric quality and survey coverage. To extend the platform beyond simple 2D mapping, we present the architectural integration of Potree for browser-based 3D visualization. We discuss the workflow for streaming massive point clouds to the client, a feature designed to transform the website from a passive gallery into an active analytical tool for measurement and validation. Finally, we address the challenge of data distribution by outlining the implementation of a bulk-download utility, structured to allow users to filter and request specific subsets of raw imagery, associated metadata and processed data based on their visual selection.

By providing a self-contained, low-dependency solution, we aim to shift the community standard from static archiving to dynamic, interactive exploration. This tool allows geoscientists to easily share their historical images and reconstructions and make their data truly accessible to the broader scientific community without the overhead of custom software development.

How to cite: Dahle, F., Lindenbergh, R., and Wouters, B.: From Static to Dynamic: Modernizing the Sharing of HistoricalPhotogrammetry Datasets, EGU General Assembly 2026, Vienna, Austria, 3–8 May 2026, EGU26-19445, https://doi.org/10.5194/egusphere-egu26-19445, 2026.

EGU26-20499 | ECS | Posters on site | GM2.5

Detecting desert kites in 3D point clouds by learning anomalies 

Reuma Arav

Desert kites are large prehistoric hunting traps typically composed of two long, low stone walls that converge toward an enclosure.  These structures are widely distributed across the arid and semi-arid margins of the Middle East and Central Asia, exhibiting substantial variability in size, geometry, construction techniques, and topographic setting. To better understand their functionality from the Neolithic to sub-contemporaneous times, terrestrial laser scanning has increasingly been used to capture high-resolution three-dimensional representations of desert kites, enabling detailed characterization of their construction and local terrain setting. However, the kites’ subtle expression, their large spatial extent, and their progressive blending into the natural surface complicate their detection. These difficulties are further exacerbated by variable point density resulting from the alignment of multiple terrestrial scans, unavoidable occlusions caused by topography or vegetation, and the sheer volume of data produced by high-resolution ground-based surveys.  Together, these factors make the reliable identification and analysis of desert kite features within raw terrestrial point clouds a challenge, which requires extensive manual intervention and expert interpretation.

In this study, I present an automated, machine-learning-based approach for highlighting desert kite features directly within 3D point clouds derived from terrestrial laser scanning, without the need for manual annotation or labelled training data. The proposed method is based on the premise that the kites' structures introduce geometric irregularities (anomalies) relative to the surrounding natural surface. Rather than explicitly modelling the kite's form  or imposing predefined shape descriptors, the method learns a representation of the underlying terrain surface directly from the point cloud. This learned representation is then used to reconstruct the surface, which is subsequently compared to the original terrestrial measurements. Local deviations between the reconstructed surface and the original point cloud are quantified, with larger reconstruction errors interpreted as potential surface anomalies indicative of the kite's features. 

The proposed workflow is fully data-driven and unsupervised. It does not rely on prior knowledge of kite geometry, site-specific heuristics, or expert-defined thresholds. Instead, the learning process adapts to the local surface characteristics captured in the input dataset, making it robust to variations in resolution, occlusions, and terrain complexity commonly encountered in terrestrial laser scanning surveys. 

The findings demonstrate that surface-reconstruction-based anomaly detection offers a promising pathway for the automated identification of desert kite features in terrestrial 3D point clouds. More broadly, the approach is applicable to archaeological structures that exhibit weak or subtle geometric signatures. By reducing dependence on manual interpretation and labelled datasets, the method supports more objective, scalable, and reproducible analyses of archaeological landscapes, particularly in complex terrain where anthropogenic features are embedded within natural surfaces.

How to cite: Arav, R.: Detecting desert kites in 3D point clouds by learning anomalies, EGU General Assembly 2026, Vienna, Austria, 3–8 May 2026, EGU26-20499, https://doi.org/10.5194/egusphere-egu26-20499, 2026.

Despite significant advancements in landslide monitoring, landslides occurring on densely forested slopes remain largely unexplored. While conventional subsurface characterization methods (e.g., DPH, CPT, percussion drilling) are often impractical due to limited accessibility and steep rugged terrain, surficial analyses using remote sensing techniques frequently face challenges in capturing high-resolution ground surface data due to occlusion caused by dense vegetation cover as well as technical limitations.
Although trees and forests are generally acknowledged to reduce the probability of landslide occurrence, they are unlikely to prevent or substantially mitigate deep-seated landslides or failures on very steep slopes. Instead, trees may serve as proxies of landslide activity, potentially improving the understanding and monitoring of densely forested slopes. Affected by slope movements, trees experience external growth disturbances and develop characteristic growth anomalies that can be partly attributed to underlying landslide processes.

Multiple studies have demonstrated the feasibility of extracting such external growth disturbances, primarily stem tilting, by assessing the inclination and curvature of tree stems in LiDAR point clouds, greatly building upon previous forestry-related studies exploring the mapping, classification, and derivation of stem parameters such as height and diameter from digital twins. However, the potential to extract externally visible eccentric growth patterns in stem cross-sections at heights of maximum bending, analogous to dendrogeomorphologic tree-ring analyses, as a proxy for landslide activity has not yet been explored. Additionally, the classification of overall tree shape may provide valuable insights into the characteristics of underlying slope movements, but, to the best of the author’s knowledge, this has not been addressed in previous research.

To investigate the potential of automatically extracting tree shape and stem eccentricity from LiDAR data, and to evaluate their suitability as proxies of landslide activity, we introduce an improved two-stage processing pipeline for tree identification and extraction, along with a dedicated framework for digital dendrogeomorphology. Building upon previous work, we compute normal vectors of locally fitted planes and projected point densities to separate trees from the point cloud. To enhance the extraction of complex shaped trees (e.g., S-shaped or pistol-butted) characteristic of landslide-prone slopes, we introduce dynamically adjusted normal vector thresholds derived from estimated stem inclination. After segmenting tree stems from the point cloud, ellipses are fitted at configurable height intervals to determine cross-section centroids. These centroids are then connected as vertices of a 3D polyline, which is subsequently smoothed using a natural spline to represent the generalized stem geometry. Based on the curvature of the resulting polyline, the height of maximum bending is identified, and the corresponding cross-section eccentricity is extracted. In addition, the curvature of the polyline is used to categorically classify overall tree shape.

Our digital dendrogeomorphology approach applied to 3D point clouds enables accurate extraction of stem eccentricity, even for complex tree shapes typical of landslide-prone slopes. When paired with automated tree-shape classification, these data offer insights into slope movement and improve understanding of landslide processes in densely forested environments.

How to cite: Kamaryt, T.-H. and Müller, B.: Tree Geometry as a Potential Proxy for Landslide Activity in Densely Forested Slopes: A LiDAR-Based Digital Dendrogeomorphology Approach, EGU General Assembly 2026, Vienna, Austria, 3–8 May 2026, EGU26-21238, https://doi.org/10.5194/egusphere-egu26-21238, 2026.

Large-scale infrastructure development in mountain regions produces significant changes in slope morphology and surface processes. However, stability assessments conducted after construction often rely on static or short-duration evaluations. These approaches tend to assume an immediate geomorphic adjustment to human disturbance, which can overlook delayed and nonlinear responses of hillslopes. This study examines terrain adjustments that occur with a time delay following major construction activities in complex mountainous settings. The analysis is based on a series of high-resolution topographic datasets obtained through repeated LiDAR surveys along the Sibiu - Pitești motorway corridor in the Southern Carpathians of Romania. Changes in terrain configuration caused by excavation, filling, drainage alteration, and the unloading of slopes are identified by comparing elevation models and terrain metrics. Instead of focusing solely on deformation located at the site of intervention, the study investigates terrain responses that appear later and in areas situated upslope or laterally from the engineered zones. Findings show that slope instability and surface reorganization often emerge after a measurable time delay, typically reactivating existing geomorphic features such as drainage pathways, slope breaks, and erosional forms. These responses are not random but show a strong dependence on prior landscape conditions and the type of construction-related disturbance. The results emphasize the limitations of early assessments performed shortly after construction, which may fail to capture landscape dynamics relevant for landslide initiation. The study demonstrates the usefulness of repeated LiDAR mapping for detecting evolving terrain responses in engineered mountain landscapes and supports the integration of time-sensitive processes into hazard assessment strategies.

How to cite: Al-Taha, W., Andra-Topârceanu, A., and Mustățea, S.: Delayed slope response to infrastructure-induced landscape modifications in mountainous terrain revealed by high-resolution LiDAR analysis, EGU General Assembly 2026, Vienna, Austria, 3–8 May 2026, EGU26-21758, https://doi.org/10.5194/egusphere-egu26-21758, 2026.

EGU26-22072 | ECS | Posters on site | GM2.5

Automated photogrammetric reconstruction of Birch Glacier, Switzerland (1946–2025): A high-density time series of topographic change preceding catastrophic glacier collapse 

Friedrich Knuth, Elias Hodel, Holger Heisig, Mauro Marty, Mylène Jacquemart, Andreas Bauder, Jean-Luc Simmen, and Daniel Farinotti

As glaciers retreat, permafrost degrades, and mountains destabilize, modern landscape evolution is increasing the potential for catastrophic events, such as the Birch Glacier collapse on May 28, 2025. To improve our understanding of mass movements in mountainous regions and support future hazard assessment and risk mitigation efforts, we are generating time series of glacier surface elevation change from historical aerial photography provided by the Swiss Federal Office of Topography (Swisstopo). 

In this case study, we leveraged multi-temporal photogrammetric reconstruction and Digital Elevation Model (DEM) coregistration techniques, implemented in the Historical Structure from Motion (HSfM) pipeline, to generate an ~80-year record of self-consistent DEMs and orthoimage mosaics from analog film imagery collected over the Birch Glacier between 1946 and 2010. From 1985 until 2010 we generated nearly annual surface measurements, making this a unique and remarkably dense historical time series. The time series is augmented with modern surface measurements generated from linescan and UAV imagery collected during the period of 2010 to 2025. To quantify the uncertainty of elevation change measurements we compute residuals with respect to the swissSURFACE3D elevation over stable ground, defined by the swissTLM3D land surface classification. The reconstructed time series provides geometric constraints to precisely model the preconditioning phase leading up to the May 2025 Nesthorn-Birchglacier hazard cascade, which may help mitigate future risks in mountainous terrain (see Jacquemart et al. 2026 in GM3.1)

How to cite: Knuth, F., Hodel, E., Heisig, H., Marty, M., Jacquemart, M., Bauder, A., Simmen, J.-L., and Farinotti, D.: Automated photogrammetric reconstruction of Birch Glacier, Switzerland (1946–2025): A high-density time series of topographic change preceding catastrophic glacier collapse, EGU General Assembly 2026, Vienna, Austria, 3–8 May 2026, EGU26-22072, https://doi.org/10.5194/egusphere-egu26-22072, 2026.

EGU26-4 | ECS | Posters on site | HS6.5

Advanced phycocyanin detection in a South American lake using Landsat imagery and remote sensing 

Lien Rodríguez-López, David Bustos Usta, Lisandra Bravo Alvarez, Iongel Duran Llacer, Luc Bourrel, Frederic Frappart, and Roberto Urrutia

In this study, multispectral images were used to detect toxic blooms in Villarrica Lake in Chile, using a time series of water quality data from 1989 to 2024, based on the extraction of spectral information from Landsat 8 and 9 satellite imagery. To explore the predictive capacity of these variables, we constructed 255 multiple linear regression models using different combinations of spectral bands and indices as independent variables, with phycocyanin concentration as the dependent variable. The most effective model, selected through a stepwise regression procedure, incorporated seven statistically significant predictors (p < 0.05) and took the following form: FCA = N/G + NDVI + B + GNDVI + EVI + SABI + CCI. This model achieved a strong fit to the validation data, with an R2 of 0.85 and an RMSE of 0.10 μg/L, indicating high explanatory power and relatively low error in phycocyanin estimation. When applied to the complete weekly time series of satellite observations, the model successfully captured both seasonal dynamics and interannual variability in phycocyanin concentrations (R2 = 0.92; RMSE = 0.05 μg/L). These results demonstrate the robustness and practical utility for long-term monitoring of harmful algal blooms in Lake Villarrica.

How to cite: Rodríguez-López, L., Bustos Usta, D., Bravo Alvarez, L., Duran Llacer, I., Bourrel, L., Frappart, F., and Urrutia, R.: Advanced phycocyanin detection in a South American lake using Landsat imagery and remote sensing, EGU General Assembly 2026, Vienna, Austria, 3–8 May 2026, EGU26-4, https://doi.org/10.5194/egusphere-egu26-4, 2026.

EGU26-125 | ECS | Orals | HS6.5

Flood Dynamics and Frequency Mapping in the Lower Ganges Floodplain in India Using Multi-Temporal Sentinel-1 SAR Observations (2016–2024) 

Mohammad Sajid, Haris Hasan Khan, Arina Khan, and Abdul Ahad Ansari

The Ganges floodplains are among the most flood-prone regions in India, where recurrent inundations cause significant socio-economic and ecological impacts. Understanding the spatial distribution, frequency, and dynamics of flooding is essential for effective floodplain management and enhancing climate resilience. This study examines the flood frequency and spatial extent across a section of the Ganga River floodplains in Bihar, utilising multi-temporal Sentinel-1 Synthetic Aperture Radar (SAR) data spanning the period from 2016 to 2024. Flooded areas were delineated through an optimal threshold-based classification of VH-polarised backscatter images, with threshold values ranging from -19.5 dB to -22.3 dB. Annual flood extents were mapped, and an inundation frequency composite was generated to identify zones experiencing recurrent flooding. The spatial analysis revealed substantial variability in flood occurrence, with extensive inundation observed in low-lying regions. Several areas were inundated in more than 60% of the study years, indicating chronic flood exposure. The decadal analysis revealed that August and September were the peak months for flooding, with some areas remaining inundated for more than one month, which had an adverse impact on both human settlements and agricultural lands. Validation using optical satellite imagery from Sentinel-2 confirmed a 98% accuracy in the SAR-derived flood extent, reinforcing the reliability of the classification method. The temporal flood frequency analysis provides crucial insights into long-term flood dynamics and helps identify hydrologically sensitive zones. Overall, this study highlights the effectiveness of SAR-based monitoring in understanding floodplain behaviour under changing climatic and hydrological conditions, and supports improved flood hazard mapping, hydrodynamic model calibration, and sustainable flood risk management in the Ganges Basin and other monsoon-affected regions.

Keywords: Flood Inundation, Multi-Temporal, Time-Series, Flood Frequency, Sentinel-1 SAR, Ganges River

How to cite: Sajid, M., Hasan Khan, H., Khan, A., and Ansari, A. A.: Flood Dynamics and Frequency Mapping in the Lower Ganges Floodplain in India Using Multi-Temporal Sentinel-1 SAR Observations (2016–2024), EGU General Assembly 2026, Vienna, Austria, 3–8 May 2026, EGU26-125, https://doi.org/10.5194/egusphere-egu26-125, 2026.

Wetlands are very sensitive hydrological ecosystems that are essential for groundwater recharge, flood control, and biodiversity. Climate variability, changed river regimes, and unsustainable anthropogenic pressures are all posing new challenges to their stability. The current work evaluates the two-decade hydro-climatic dynamics of the Haiderpur Wetland (Ganga River, India) by merging optical (Landsat), radar (Sentinel-1), and gridded climate (ERA5, CHIRPS) datasets with GRACE-based groundwater anomalies. On the Google Earth Engine (GEE), processing of time-series Landsat (NDVI, NDWI, LST) and Sentinel-1 (SAR) data to monitor all-weather surface inundation and vegetation structure. To disentangle climatic and anthropogenic drivers, these remote sensing products are statistically correlated against ERA5-Land (Evapotranspiration) and CHIRPS (Precipitation) data, alongside GRACE groundwater anomalies. The findings demonstrated a considerable downward trend in pre-monsoon NDWI and wetland water distribution. This was accompanied by a significant increase in LST and an unexpected increase in NDVI. All-weather Sentinel-1 data validated the drying trend. On the other hand, 'greening' (as indicated by NDVI) in a drying environment suggests a structural shift from native wetland vegetation to more drought-tolerant or invasive terrestrial plants. The study assesses the capability of a multifaceted (optical-radar-climate) GEE strategy to quantify the individual contributions of climatic and anthropogenic factors, while also monitoring wetland development. Furthermore, these findings quantify the hydro-ecological vulnerability of major Ramsar wetlands and emphasize the vital need for coordinated water management to sustain ecosystems in the Ganga River Basin, with far-reaching implications for global wetland conservation.

Keywords: Hydrology, GRACE, Climate Change, SAR, NDVI, NDWI, LST

How to cite: Ansari, A. A., Hasan Khan, H., Khan, A., and Sajid, M.: Hydro-Ecological Vulnerability of  Ganga River Wetland (India): A Multi-Sensor Remote Sensing and GRACE-based Assessment of the Haiderpur Ramsar Site, EGU General Assembly 2026, Vienna, Austria, 3–8 May 2026, EGU26-147, https://doi.org/10.5194/egusphere-egu26-147, 2026.

Floods are the costliest and most frequently occurring natural disasters. One of the key factors in preventing and reducing losses is providing a reliable flood map. However, the uncertainty associated with either flood inundation model or data, specifically the Digital Elevation Model (DEM), may have adverse effects on the reliability of flood stage and inundation maps. Therefore, a systematic understanding of the uncertainty is necessary. In this study, an attempt is made to assess whether models are more susceptible to the uncertainties or the data itself. In order to do this, a SCIFRIM (Slope-corrected, Calibration-free, Iterative Flood Routing and Inundation Model) is employed, utilizing a list of DEM datasets to reconstruct the October 2024 Valencia flood event. The modelled flood extents were validated against those derived from multi-sensor remote sensing data. The Critical Success Index (CSI) was calculated to assess the agreement between observed and modelled flood extents, yielding values of 0.49 and 0.59 for October 30th and 31st, respectively, when combining SCIFRIM and Lidar-DEM. Additionally, a multi-model comparison has been performed between SCIFRIM and CaMa-Flood (Catchment-based Macro-scale Floodplain), HEC-RAS (Hydrologic Engineering Center's River Analysis System), and TUFLOW (Two-dimensional Unsteady FLOW), demonstrating its relevance in terms of outputs (flood extent and stage) and model runtime. The findings demonstrate that the proposed modeling framework offers a reliable approach for flood assessment. It has great potential to support rapid assessment and decision-making in data-scarce regions.

How to cite: Tripathi, G., Sarkar, E., and Biswal, B.: Evaluating Slope-corrected, Calibration-free, Iterative Flood Routing and Inundation Model (SCIFRIM)-based Flood Inundation against multi-satellite observation, EGU General Assembly 2026, Vienna, Austria, 3–8 May 2026, EGU26-436, https://doi.org/10.5194/egusphere-egu26-436, 2026.

Floods are highly dynamic hazards whose spatial extent can change rapidly within hours. Timely and accurate monitoring is essential for early warning, emergency response, and post-disaster assessment. A major challenge in current Earth Observation (EO) based approaches is the difficulty of capturing the complete evolution of a flood event, including its maximum flood extent. This information is often missing due to temporal gaps in Synthetic Aperture Radar (SAR) acquisitions and cloud cover in optical imagery. Missing the peak extent limits the accuracy of impact assessments and poses challenges for applications such as parametric insurance, which depend on reliable measurements of flood magnitude. Although daily flood products exist, they are often based on large-scale multi-spectral sensors and struggle during persistent cloud cover as well as with resolution for smaller events, creating an urgent need for a more reliable method for daily flood estimation from higher-resolution SAR datasets. To address these challenges, we propose a novel deep learning framework that fuses EO-based coarse dynamic hydrometeorological data with static geospatial datasets to produce high-resolution daily flood extent maps. Our approach integrates static flood conditioning inputs, including elevation, Height Above Nearest Drainage, Urban Development Area, flow direction, Normalized Difference Vegetation Index, Normalized Difference Built-up Index, soil clay and sand content, and pre-flood SAR and multispectral imagery with dynamic hydrometeorological variables such as daily precipitation and soil moisture. The model adopts a multi-stage vision transformer architecture: encoders extract multi-level latent representations from all inputs, which are then fused using cosine similarity, normalization, and temporal attention mechanisms. A decoder reconstructs high-resolution flood extent, followed by a Gaussian filter to reduce high-frequency noise. The framework is fully supervised using the globally available KuroSiwo flood mask dataset, ensuring transferability across diverse geographic regions and climate zones. In addition, this research provides a complete data preparation workflow that converts flood mask shapefiles into standardized image patch datasets, including a modular input selection interface that removes dependence on inputs included in specific datasets, directly suitable for deep learning training, enabling straightforward implementation and practical applicability. The model is trained and evaluated across three distinct climate zones on multiple continents, demonstrating a robust capability to overcome the temporal limitations of SAR data and cloud-induced gaps in optical observations. Held-out region tests with strict geographic separation to minimize spatial autocorrelation induced data leakage, further ensure unbiased evaluation and true transferability. Preliminary tests across multiple continents yield stable performance, with cross-site metric variations remaining within approximately 5-7 percent. This study introduces the first deep learning framework for daily fine-scale flood extent mapping using purely EO data which are globally accessible, providing a scalable and transferable solution for real-time flood monitoring, disaster management, and potential applications in parametric insurance by improving flood mapping cadence and reliably estimating maximum flood extents.

Keywords: spatio-temporal fusion, vision transformer, high-resolution flood mapping

How to cite: Surojaya, A., Kumar, R., and Dasgupta, A.: DeepFuse2.0: Novel Deep Learning-based Fusion of Satellite-based Hydroclimatic Data and Flood Conditioning Factors for Daily Flood Extent Mapping, EGU General Assembly 2026, Vienna, Austria, 3–8 May 2026, EGU26-1047, https://doi.org/10.5194/egusphere-egu26-1047, 2026.

EGU26-1092 | ECS | Posters on site | HS6.5

Cross-Biome Transferability of SAR-based Flood Mapping with Random Forests 

Paul Christian Hosch and Antara Dasgupta

Fully automated, globally applicable flood-mapping systems must earn user trust, which in turn requires systematic testing across diverse environmental conditions to understand performance stability and a clear understanding of model transferability. While some recent studies have evaluated cross-site performance of flood mapping algorithms, the cross-biome transferability of Random Forest (RF) models for SAR-based flood delineation has not yet been thoroughly evaluated. In this study, we assess how well RF classifiers trained for binary flood detection generalize across biomes using primarily Synthetic Aperture Radar (SAR) data. Our feature stack comprises 14 variables, including 9 SAR-derived features (Sentinel-1 VV and VH backscatter and associated temporal-change metrics) which provide information on the flood-induced land surface changes and 4 contextual predictors such as land cover and topographic indices which influence radar backscatter and help to reduce as well as mitigate uncertainties. Experiments were conducted across 18 flood events distributed equally amongst 6 distinct biomes: (1) Deserts and Xeric Shrublands, (2) Tropical and Subtropical Moist Broadleaf Forests, (3) Temperate Broadleaf and Mixed Forests, (4) Temperate Coniferous Forests, (5) Mediterranean Forests, Woodlands and Scrub, (6) Temperate Grasslands, Savannas and Shrublands. Model transferability is evaluated using a two-level nested cross-validation approach. First, intra-biome performance is established through an inner 3-fold Leave-One-Group-Out Cross-Validation (LOGO-CV), in which models are trained on all but one site within a biome and evaluated on the held-out site iteratively. Second, inter-biome transferability is quantified using an outer 6-fold LOGO-CV, treating each biome as a distinct group. In this setup, models are trained on all biomes except one and evaluated on all sites of the held-out biome. Classification performance is assessed using Overall Accuracy (OA), F1-score, Precision, Recall, and Intersection over Union (IoU), with all experiments repeated across 10 independent iterations to capture model structural and sampling variability.

Preliminary results on select biomes show substantial variation in inter-biome transferability. Notably, in some cases, models transferred between biomes outperform those trained within the same biome. These findings highlight the need for comprehensive biome-level transferability assessments to better understand the capabilities and limitations of RF-based flood mapping under globally diverse conditions, ultimately supporting more transparent and trustworthy flood-mapping products for end users.

How to cite: Hosch, P. C. and Dasgupta, A.: Cross-Biome Transferability of SAR-based Flood Mapping with Random Forests, EGU General Assembly 2026, Vienna, Austria, 3–8 May 2026, EGU26-1092, https://doi.org/10.5194/egusphere-egu26-1092, 2026.

EGU26-1266 | ECS | Posters on site | HS6.5

Cross-Biome Feature Importance Stability Analysis for SAR-based Flood Mapping with Random Forests 

Parisa Havakhor, Paul Hosch, and Antara Dasgupta

Flood mapping using machine learning methods such as Random Forests (RF) requires informed feature engineering and selection. Despite feature-importance rankings across different biomes and land covers varying substantially, the stability of these feature rankings has not been evaluated specifically for RF-based flood delineation. In this study, we investigate the consistency of RF feature-importance rankings in a binary flood-classification task primarily based on Synthetic Aperture Radar (SAR) imagery. The feature stack comprises 14 variables, including 9 SAR-based features, Sentinel-1 VV and VH polarizations and their temporal-change metrics which inform the flood extent identification, and 4 contextual features such as land cover and topographic indices which provide information on backscatter uncertainties. The classification task was conducted across 18 flood events spanning six distinct biomes: (1) Deserts and Xeric Shrublands, (2) Tropical and Subtropical Moist Broadleaf Forests, (3) Temperate Broadleaf and Mixed Forests, (4) Temperate Coniferous Forests, (5) Mediterranean Forests, Woodlands and Scrub, and (6) Temperate Grasslands, Savannas and Shrublands. Three feature-attribution methods were evaluated: (1) Shapley Additive exPlanations (SHAP) provides a game-theoretic framework for feature attribution and is widely recognized for its consistency and interpretability; (2) Mean Decrease in Impurity (MDI), computed during tree growth, is the most commonly used importance metric for RF models; (3) Permutation feature importance (MDA) offers a model-agnostic approach that assesses importance by measuring the reduction in model accuracy when feature values are randomly shuffled. Both feature cardinality and feature correlation, which bias the feature rankings for these algorithms in different ways, were considered during interpretation. All experiments were repeated across 10 independent iterations to account for random variability. We first examined feature-importance rankings independently across the three sub-sample studies within each biome to establish baseline intra-biome variability, followed by quantification of inter-biome variability to assess whether feature-importance patterns transfer across different environmental conditions. Preliminary results across select biomes indicate stable rankings for SAR-based features, with VV and VH event polarizations dominating the decision boundary, while contextual descriptors, particularly terrain indices such as Height Above the Nearest Drainage, exhibit greater variability both within and between biomes. Understanding the transferability of feature-importance patterns and feature stacks across biomes is critical for developing an RF-based flood-mapping pipeline that operates reliably under diverse environmental conditions worldwide and ultimately builds user trust in the resulting products.

How to cite: Havakhor, P., Hosch, P., and Dasgupta, A.: Cross-Biome Feature Importance Stability Analysis for SAR-based Flood Mapping with Random Forests, EGU General Assembly 2026, Vienna, Austria, 3–8 May 2026, EGU26-1266, https://doi.org/10.5194/egusphere-egu26-1266, 2026.

EGU26-1859 | ECS | Posters on site | HS6.5

Detecting Waterlogging in Agricultural Fields in Denmark using High-Resolution PlanetScope Time Series 

Jasper Kleinsmann, Julian Koch, Stéphanie Horion, Gyula Mate Kovacs, and Simon Stisen

Waterlogging in agricultural fields is the condition of temporally inundated areas driven by extreme rainfall, rising groundwater or poor drainage, and has been identified as a major issue by Danish farmers. During the inundation period, plants are deprived of oxygen which negatively affects the root development and leads to decreased yields and grain quality. Additionally, these waterlogged areas are a large source of greenhouse gas (GHG) emissions. The issue is expected to exacerbate under current climate projections through wetter winters and rising groundwater levels in Denmark. Hence, an increased understanding of the spatio-temporal dynamics of waterlogging is required to future-proof the management strategies. The research goals are three-fold: (1) to optimise the detection of waterlogging, (2) to reveal inter- and intra-annual patters across Denmark and (3) to investigate the drivers of waterlogging such as climate, topography and bio-physical conditions. We aim to detect waterlogged areas through a deep learning semantic segmentation approach utilising multi-temporal PlanetScope imagery and nation-wide high resolution elevation data. This approach requires a manually delineated reference dataset to train, validate and test the model which needs to be well-balanced spatially, e.g. covering various soil types, and temporally, e.g. including various illumination conditions. Additionally, we will experiment with various model architectures, backbones and covariate combinations to optimise the segmentation performance. Initial tests using a UNET architecture and building upon a published reference dataset by Elberling et al. (2023), show promising results and lay the foundation for the upcoming model development and extension of the existing reference data.


Elberling, B. B., Kovacs, G. M., Hansen, H. F. E., Fensholt, R., Ambus, P., Tong, X., ... & Oehmcke, S. (2023). High nitrous oxide emissions from temporary flooded depressions within croplands. Communications Earth & Environment, 4(1), 463.


How to cite: Kleinsmann, J., Koch, J., Horion, S., Kovacs, G. M., and Stisen, S.: Detecting Waterlogging in Agricultural Fields in Denmark using High-Resolution PlanetScope Time Series, EGU General Assembly 2026, Vienna, Austria, 3–8 May 2026, EGU26-1859, https://doi.org/10.5194/egusphere-egu26-1859, 2026.

EGU26-2995 | ECS | Orals | HS6.5

SaferSat: The Saferplaces’s  Operational Sentinel-1 Toolbox for Multi-Temporal Flood Extent Mapping, Water-Depth Estimation and Impact Assessment  

Saeid DaliriSusefi, Paolo Mazzoli, Valerio Luzzi, Francesca Renzi, Tommaso Redaelli, Marco Renzi, and Stefano Bagli

Operational flood intelligence for emergency response and insurance, providing a rapid overview of impacted land, population, and economic damages, requires mapping solutions that remain reliable under adverse observational conditions and across diverse landscapes. Although Sentinel-1 SAR provides consistent global, all-weather and day-and-night coverage, automated flood extraction is challenged by speckle noise, land-cover heterogeneity, and confusion between floodwater and permanent low-backscatter surfaces. These limitations highlight the need for approaches that exploit temporal backscatter changes while maintaining global robustness and computational efficiency.

We present SaferSat, a fully automated Sentinel-1 toolbox for flood-extent mapping, water-depth estimation, and impact assessment. SaferSat is part of SaferPlaces (saferplaces.co), a global Digital Twin platform for flood risk intelligence supporting emergency response and insurance applications. Central to the framework is Pr-RWU-Net (Progressive Residual Wave U-Net), a lightweight deep-learning model with 2.6 million trainable parameters, designed to detect flood-induced backscatter changes using VV-polarized SAR imagery. The model uses a three-channel input; pre-event VV, post-event VV, and their radiometric difference, enhancing inundation sensitivity while mitigating VH instability for global deployment.

SaferSat provides end-to-end processing: automated data retrieval, multi-date flood inference, and Maximum Flood Extent generation. To reduce SAR ambiguities, it generates auxiliary layers: a vegetation mask for SAR "blind spots" and a low-backscatter anomaly mask for permanent dark features. Flood extent layers are integrated with the FLEXTH model and GLO-30 or local high-resolution LiDAR DTMs for water-depth reconstruction. The system also analyzes acquisition patterns to predict short-term revisit opportunities. Impact assessment intersects flood extents with JRC GHS-POP and ESA WorldCover datasets.

The Pr-RWU-Net model was trained on the S1GFloods dataset, containing 5,360 paired pre- and post-event Sentinel-1 GRD images across 42 flood events from 2016–2022. Binary flood masks were generated via semi-automated thresholding and expert quality control. Evaluation on the test split achieved an IoU of 90.0%, F1-score 94.6%, Recall 95.6%, Precision 93.8%, and overall accuracy 96.6%.

Operational applicability was demonstrated on three 2025 flood events: Romania, Pakistan, and France. SaferSat flood extents closely matched SAR manual driven flood references (IoU 89–92%) and CEMS products (IoU 85–88%). Water-depth estimation against a reference hydrodynamic model yielded a MAE of 34–40 cm and correlation R of 0.78–0.82. For a 260 km² flood in Romania, the full processing chain completed in ~3 minutes on a standard CPU, demonstrating suitability for rapid, large-scale deployment.

SaferSat is available globally through SaferPlaces, supporting emergency response and insurance applications. Future developments aim to enhance SaferSat globally via integration of commercial satellite data to reduce revisit time and rapid hydrodynamic modeling to address radar limitations.

How to cite: DaliriSusefi, S., Mazzoli, P., Luzzi, V., Renzi, F., Redaelli, T., Renzi, M., and Bagli, S.: SaferSat: The Saferplaces’s  Operational Sentinel-1 Toolbox for Multi-Temporal Flood Extent Mapping, Water-Depth Estimation and Impact Assessment , EGU General Assembly 2026, Vienna, Austria, 3–8 May 2026, EGU26-2995, https://doi.org/10.5194/egusphere-egu26-2995, 2026.

EGU26-3018 | Posters on site | HS6.5

Advancing Flood Forecasting in Large River Basins Using Multi-Mission Satellite Data: the EO4FLOOD project 

Angelica Tarpanelli and the EO4FLOOD Team

Floods are among the most destructive natural hazards worldwide, causing severe impacts on human health, ecosystems, cultural heritage and economies. Over the past decades, both developed and developing regions have experienced increasing flood-related losses, a trend that is expected to intensify under climate change due to shifts in precipitation patterns and the frequency of extreme events. In many large river basins, particularly in data-scarce regions, flood forecasting remains highly uncertain because of limited in situ observations and complex hydrological and hydraulic dynamics.

EO4FLOOD is an ESA-funded project aimed at demonstrating the added value of advanced Earth Observation (EO) data for improving flood forecasting at regional to continental scales. The project focuses on the integration of multi-mission satellite observations with hydrological and hydrodynamic modelling frameworks to support flood prediction up to seven days in advance, with an explicit treatment of uncertainty.

A key outcome of EO4FLOOD is the development of a comprehensive and openly available EO-based dataset designed to support flood modelling and forecasting studies. The dataset covers nine large and hydrologically complex river basins worldwide, selected to represent a wide range of climatic, physiographic and anthropogenic conditions, and characterized by limited or heterogeneous availability of ground-based observations. It integrates high-resolution satellite products from ESA and non-ESA missions, including precipitation, soil moisture, snow variables, flood extent, water levels and satellite-derived river discharge.

Within EO4FLOOD, these EO datasets are combined with hydrological and hydraulic models, enhanced by machine learning techniques, to improve flood prediction skill and to better quantify predictive uncertainty in data-scarce environments. The project also investigates the role of human interventions, such as reservoirs and land-use changes, in modulating flood dynamics across the selected basins.By making this multi-variable EO dataset publicly available, EO4FLOOD aims to support the broader hydrological community in testing, benchmarking and developing flood modelling and forecasting approaches in challenging large-basin settings. The project provides a unique opportunity to explore the potential and limitations of EO-driven flood forecasting and contributes to advancing the use of satellite observations for global flood risk assessment and management.

How to cite: Tarpanelli, A. and the EO4FLOOD Team: Advancing Flood Forecasting in Large River Basins Using Multi-Mission Satellite Data: the EO4FLOOD project, EGU General Assembly 2026, Vienna, Austria, 3–8 May 2026, EGU26-3018, https://doi.org/10.5194/egusphere-egu26-3018, 2026.

            Water security in the Chi River Basin is critical for the agricultural economy and ecosystem stability of Yasothon Province, Thailand. However, effective spatiotemporal monitoring of water surface dynamics is frequently hindered by persistent cloud cover during the monsoon season, limiting the utility of traditional optical remote sensing. This study addresses this challenge by developing a robust Multi-Sensor Deep Learning Fusion system that integrates Synthetic Aperture Radar (SAR) and optical satellite imagery to ensure continuous observation capabilities.

            We employ a U-Net convolutional neural network architecture, selected for its high boundary precision and efficiency with limited training datasets. The model is trained on a fused six-channel input configuration, combining Sentinel-1 SAR data (weather-independent) with Sentinel-2 optical bands (RGB), augmented by the Normalized Difference Water Index (NDWI) and Normalized Difference Vegetation Index (NDVI). This multi-modal approach enhances feature extraction, allowing for the accurate differentiation of open water from floating vegetation and flooded agricultural lands in complex transition zones.

            The study analyzes the hydrological cycle of 2022, capturing distinct drought, flood, and post-flood conditions. To ensure hydrological validity, the model’s segmentation outputs are not merely visually assessed but are quantitatively validated against ground-truth water level data from the E.20A gauge station in Kham Khuean Kaeo District. By establishing a precise Stage-Area Relationship, this research demonstrates a scalable, cost-effective framework for flood risk assessment and water capital estimation, offering a resilient solution for river basin management in cloud-prone tropical regions.

How to cite: Pruekthikanee, P.: Multi-Sensor Deep Learning Fusion for Spatiotemporal Water Surface Monitoring in the Yasothon Province's Chi River Basin, Thailand, EGU General Assembly 2026, Vienna, Austria, 3–8 May 2026, EGU26-4154, https://doi.org/10.5194/egusphere-egu26-4154, 2026.

EGU26-5752 | ECS | Orals | HS6.5

Satellite-Enhanced Flood Modelling for the Niger River Basin using a Synergy of Hydrological Modelling and Earth Observation Data 

Shima Azimi, Alexandra Murray, Connor Chewning, Cecile Kittel, Henrik Madsen, Fan Yang, Maike Schumacher, and Ehsan Forootan

Accurate water cycle representation in data-scarce and flood-prone regions like the Niger River Basin demands stronger integration between remote sensing and hydrological modelling. Spanning ten water-stressed nations, this basin faces critical challenges under climate change, requiring robust water-budget assessments to guide resilience strategies. We employ DHI’s Global Hydrological Model (DHI-GHM) to simulate key hydrological components of the regional water cycle. Model outputs for surface and root-zone soil moisture (SSM and R-ZSM) and terrestrial water storage (TWS) are systematically compared against satellite observations (GRACE/GRACE-FO and multiple soil moisture products) to identify discrepancies and enhance the understanding of regional hydrological behavior. A near real-time SSM data assimilation scheme is implemented to enhance spatiotemporal accuracy of surface and top-soil interactions, particularly beneficial in the flood-sensitive Inner Niger Delta. Post-assimilation hydrological outputs are coupled with the CaMa-Flood surface hydraulic model to simulate inundation dynamics, enabling improved flood prediction and supporting risk management. Finally, we pursue two-way coupling of hydrological and hydrodynamic models by integrating river flow–storage feedbacks to advance flood forecasting and sustainable water-resources planning. 

How to cite: Azimi, S., Murray, A., Chewning, C., Kittel, C., Madsen, H., Yang, F., Schumacher, M., and Forootan, E.: Satellite-Enhanced Flood Modelling for the Niger River Basin using a Synergy of Hydrological Modelling and Earth Observation Data, EGU General Assembly 2026, Vienna, Austria, 3–8 May 2026, EGU26-5752, https://doi.org/10.5194/egusphere-egu26-5752, 2026.

EGU26-5862 | ECS | Orals | HS6.5

Refining global wetland characterization using an unsupervised, wetness-based dynamic framework 

Yang Li, Nandin-Erdene Tsendbazar, Kirsten de Beurs, Lassi Päkkilä, and Lammert Kooistra

Existing global wetland datasets and monitoring approaches emphasizepersistent inundation, while intermittent inundation and waterlogged states—especially where vegetation is present—are underrepresented or of lower accuracy. This leads to inaccurate estimates of greenhouse gas emissions from carbon-rich systems (e.g., peatlands). Meanwhile, the predominance of annual mapping limits the capture of intra-annual variability, further reinforcing these inaccuracies and obscuring sub-seasonal disturbances from human activities (e.g., shifts in rice-cropping intensity). This study presents an unsupervised, wetness-driven framework for improving global wetland monitoring that leverages earth observation data streams. For framework development, the OPtical TRApezoid Model is applied to Harmonized Landsat-Sentinel imagery to retrieve surface wetness, followed by wetland delineation using a scene-adaptive grid-based thresholding algorithm. This framework is applied to 824 globally distributed 0.1° grid cells encompassing 9,781 land-cover-labeled sites and 134 sites with daily wet–dry labels across 28 Ramsar wetlands, and validated for spatial delineation, thematic, and temporal accuracy. Comparative analysis employs Dynamic World, the first global 30 m wetland map with a fine classification system (GWL_FCS30), and the modified Dynamic Surface Water Extent algorithm (DSWE). Our framework achieved moderate spatial delineation accuracy with F1 of 0.64 (recall 0.75, precision 0.56), comparable in F1 to Dynamic World and with higher recall than DSWE and GWL_FCS30. It delivered the highest temporal accuracy (F1 0.72; precision 0.81; recall 0.64) and improved thematic accuracy for vegetated wetland, reducing omission with modest commission. The proposed wetland monitoring framework enables more accurate targeted policy interventions.

How to cite: Li, Y., Tsendbazar, N.-E., de Beurs, K., Päkkilä, L., and Kooistra, L.: Refining global wetland characterization using an unsupervised, wetness-based dynamic framework, EGU General Assembly 2026, Vienna, Austria, 3–8 May 2026, EGU26-5862, https://doi.org/10.5194/egusphere-egu26-5862, 2026.

EGU26-6114 | ECS | Orals | HS6.5

Evidential Deep Learning for Uncertainty-Aware Global Flood Extent Segmentation 

Chi-ju Chen and Li-Pen Wang

Flood extent mapping from satellite imagery plays a critical role in disaster response and flood risk management, particularly as flood events become more frequent and severe under a changing climate. At its core, the task involves classifying each pixel in an optical satellite image as flooded or non-flooded. Recent deep learning-based segmentation models have demonstrated strong performance at the global scale. However, despite their accuracy, most existing approaches provide deterministic predictions and offer limited information on the reliability of individual pixel-level outputs. This lack of uncertainty information constrains their operational applicability, especially in high-risk scenarios where models may exhibit overconfident but incorrect predictions.

To address this limitation, we extend a global flood extent segmentation framework by explicitly incorporating uncertainty quantification. Specifically, an Evidential Deep Learning (EDL) approach is integrated into a UNet++ architecture within the ml4floods framework, enabling simultaneous prediction of flood extent and associated pixel-wise uncertainty. Within the EDL formulation, network outputs are interpreted as evidence and parameterised using a Beta distribution, providing a principled estimate of predictive uncertainty. Furthermore, total uncertainty is decomposed into aleatoric and epistemic components, allowing clearer interpretation of whether uncertainty arises from data ambiguity or from limited model knowledge.

The proposed approach is evaluated using the extended WorldFloods global flood dataset. Preliminary results indicate that the EDL-enhanced model maintains promising segmentation performance while producing informative uncertainty maps. Elevated uncertainty is consistently observed in misclassified regions and along land-water boundaries, where optical signals are inherently ambiguous. These results demonstrate that uncertainty estimates offer valuable insight into model reliability and support operational decision-making by highlighting areas that require closer inspection. In practice, uncertainty-guided triage can help prioritise expert review and resource allocation, focusing attention on regions where decision risk is highest.

How to cite: Chen, C. and Wang, L.-P.: Evidential Deep Learning for Uncertainty-Aware Global Flood Extent Segmentation, EGU General Assembly 2026, Vienna, Austria, 3–8 May 2026, EGU26-6114, https://doi.org/10.5194/egusphere-egu26-6114, 2026.

EGU26-6180 | ECS | Orals | HS6.5

 The capabilities of virtual gauging stations in satellite monitoring of water bodies 

Ildar Mukhamedjanov and Gulomjon Umirzakov

Remote sensing technologies provide effective tools for monitoring and assessing the state of inland water bodies, enabling extraction of various hydrological parameters from satellite observation. Central Asian and some African countries are currently implementing practical programs aimed at mitigating water scarcity and improving the management of transboundary water resources. Rivers and their tributaries flowing across national boundaries require continuous monitoring to support early warning of droughts and floods at the basin scale.

Conventional ground-based hydrological stations are traditionally used to measure water level, estimate daily river discharge, and support hydrological forecasting. However, limitations related to accessibility, data-sharing restrictions, and the high cost of installation and maintenance often constrain their spatial coverage and long-term operation.  Virtual gauging station (VGS) represents a complementary remote-sensing approach, providing time series derived from the long-term satellite image archives. A VGS is defined as a free-shaped polygon on the map used to analyze data within the borders of this polygon and collect observations based on the requirements. Currently, VGS applications primarily rely on optical satellite imagery from Sentinel-2, Landsat-4, -5, -7, -8, -9 missions to estimate water surface area (WSA) using spectral water index (MNDWI, AWEI or AWEIsh). Variations in WSA serves as a proxy for surface water availability and river dynamics. 

In addition, VGS can be used to enrich satellite altimetry-based water level (H) time series. For this purpose, the VGS polygon is calibrated using reference altimetric observations obtained from open-access data source (e.g. SDSS, DAHITI, Hydroweb). Calibration involves estimating the parameters of a regression model describing the functional relationship between water level and water surface area.  The resulting values can finally be integrated into hydrological models to support short-term river discharge forecasting. Thus, VGS provides continuous hydrological information independent of ground-based measurements, while optional validation against in-situ observations allows for the assessment of the model uncertainty.  Based on the experimental analysis, optimal placement of VGS polygons is recommended dynamically active river sections that account for annual riverbed displacement, as well as in river reaches located near satellite altimeter ground tracks to improve calibration accuracy.

The experiments demonstrated that correlation between ground truth and forecasted water level values is upper 0,85 and mean absolute error is lower than 0,3 m. The following result has been obtained using linear regression which shows that application of more complex forecasting models could significantly improve the results.

How to cite: Mukhamedjanov, I. and Umirzakov, G.:  The capabilities of virtual gauging stations in satellite monitoring of water bodies, EGU General Assembly 2026, Vienna, Austria, 3–8 May 2026, EGU26-6180, https://doi.org/10.5194/egusphere-egu26-6180, 2026.

EGU26-6408 | ECS | Posters on site | HS6.5

Multisensor Ensemble Mapping of Sub-hectare Ephemeral Surface Water in Kenyan ASALs 

James Muthoka, Pedram Rowhani, Chloe Hopling, Omid Memarian Sorkhabi, and Martin Todd

Ephemeral pans and seasonal ponds in arid and semi-arid lands supply critical water for pastoral and ecological systems, yet are not routinely monitored due to their small size, highly dynamic and spectral confusion with vegetation and shadows. We present and evaluate a multisensor mapping approach to detect sub-0.5 ha surface water bodies and quantify their linkage to rainfall variability to inform decision making.

Our approach fuses Sentinel-1 SAR, Sentinel-2 optical indices and DEM derived covariates within an ensemble classifier (voting of Random Forest, Gradient Boosting, and Decision Tree models). Predictive uncertainty is mapped using ensemble agreement and class probabilities, and we compare SAR-only, optical-only, terrain-only, and fused configurations. Additionally, rain and ephemeral surface water dynamics are modelled using generalised additive models with CHIRPs  and local rain gauge observations to test the lagged relationships in monthly water area anomalies.

Results show the fused model achieves an overall accuracy of 85%, outperforming Sentinel-1, and Sentinel-2 (78% and 72%, respectively). Generalised additive models explain 62% of variance in monthly water area anomalies, with a strong response at 1-3 month lags. These results show multisensor fusion with  quantified uncertainty improves detection of ephemeral surface water and enables estimation of rainfall thresholds and lagged dynamics relevant to pastoral water planning and targeted anticipatory action interventions.

How to cite: Muthoka, J., Rowhani, P., Hopling, C., Memarian Sorkhabi, O., and Todd, M.: Multisensor Ensemble Mapping of Sub-hectare Ephemeral Surface Water in Kenyan ASALs, EGU General Assembly 2026, Vienna, Austria, 3–8 May 2026, EGU26-6408, https://doi.org/10.5194/egusphere-egu26-6408, 2026.

EGU26-6586 | ECS | Posters on site | HS6.5

Do Geospatial Foundation Models Improve SAR-Based Flood Mapping?  

Antara Dasgupta and Moetez Zouaidi

Accurate and timely flood delineation is a cornerstone of disaster response and hydrological risk management. Synthetic Aperture Radar (SAR) is uniquely suited to this task because it operates independently of cloud cover and illumination, yet its interpretation remains challenging due to speckle, terrain effects, vegetation scattering, and ambiguities between flooded and permanent water as well as shadows and smooth surfaces such as tarmac. While deep learning has substantially advanced SAR-based flood segmentation, most existing models are trained from scratch and often struggle to generalize across regions and flood regimes. Recently, geospatial foundation models (GFMs) pretrained on massive satellite archives have shown promise, but their benefits for SAR-based flood mapping remain insufficiently quantified. This paper presents a controlled, large-scale global scale evaluation and benchmarking of a vision-transformer based GFM (NASA IBM Prithvi) against two task-specific segmentation architectures, the SegFormer (hierarchical transformer) and the commonly used U-Net (convolutional neural network), including lightweight variants, for post-event SAR-based flood mapping. All models were trained and evaluated under a standardized pipeline that explicitly addresses extreme class imbalance via stratified negative sampling and weighted loss functions. Training and validation used the expert-annotated Kuro Siwo dataset (43 flood events, 67,490 Sentinel-1 VV/VH tiles), while generalization is assessed on both the in-distribution Kuro Siwo test set and the out-of-distribution Sen1Floods11 hand labelled benchmark dataset. Results show that stratified negative sampling (controlling how many background-only tiles are shown to the model in each training epoch) increases precision by approximately 6% and mean Intersection-over-Union (mIoU) by about 7% relative to no sampling, while stabilizing training loss dynamics. On the in-distribution data, all architectures reach similar performance (mIoU ≈ 0.82), indicating that well-designed task-specific models remain competitive with GFMs. However, under out-of-distribution conditions, the foundation model Prithvi (mIoU 0.768) closely matches the performance of the SegFormer (mIoU 0.772) and clearly outperforms the U-Net (mIoU 0.712), highlighting the robustness of transformer-based representations when transferring across datasets. Pretraining on optical imagery yields only modest gains for SAR (+3.4% mIoU), suggesting that architectural inductive biases and data handling matter more than cross-modal pretraining. Notably, lightweight GFM variants achieve comparable accuracy with up to 94% fewer parameters, demonstrating strong potential for operational deployment. Scene-level analysis reveals that CNNs suppress scattered false alarms due to the neighborhood contextualization but miss large, continuous floods, while transformers preserve spatial coherence yet overpredict along complex boundaries and scattered surface water ponding, especially near permanent water bodies. Findings demonstrate that while SAR-based flood mapping accuracy requires a combination of appropriate model architectures and class imbalance-aware training, rather than foundation-scale pretraining alone. However, for spatial and statistical transfer to out of distribution datasets, GFMs offer substantial advantages and provide above-average performance for unseen cases, even without localized fine-tuning.

How to cite: Dasgupta, A. and Zouaidi, M.: Do Geospatial Foundation Models Improve SAR-Based Flood Mapping? , EGU General Assembly 2026, Vienna, Austria, 3–8 May 2026, EGU26-6586, https://doi.org/10.5194/egusphere-egu26-6586, 2026.

EGU26-6617 | ECS | Posters on site | HS6.5

SARFlood: A Web-Based, Cloud-Native Platform for Automated and Optimized ML-based SAR Flood Mapping    

Patrick Wilhelm, Paul Hosch, and Antara Dasgupta

Synthetic Aperture Radar (SAR) imagery offers weather-independent observation capabilities critical for monitoring flood events. However, SAR-based flood detection workflows typically require specialized software, local computational resources, and expert knowledge in remote sensing. This work presents SARFlood, a web-accessible application that automates the complete SAR flood detection pipeline using the OpenEO platform. SARFlood is built on a Flask backend architecture designed for accessibility and reproducibility. Users interact with the system through a web interface that guides them through case study creation, including Area of Interest (AOI) definition via shapefile upload, event date specification, and optional ground truth data integration. The application implements OpenEO OAuth 2.0 authentication using the device code flow, enabling secure access to the Copernicus Data Space Ecosystem (CDSE) backend without requiring users to manage API credentials locally. Session-based project management allows users to track processing progress in real-time through a status reporting system that monitors each pipeline stage. Data acquisition is performed server-side via OpenEO, while feature engineering processors execute locally. The data acquisition module fetches multiple data sources through a unified OpenEO interface: pre-event and post-event Sentinel-1 VV and VH imagery, Digital Elevation Models (DEM) with automatic source fallback (FABDEM, Copernicus 30m/90m), and ESA WorldCover land cover classification. The OpenStreetMap water body features and the FathomDEM are acquired via their own APIs/websites. A caching system prevents redundant API calls for previously acquired datasets, significantly reducing processing time for iterative analyses, while keeping licensing in mind so only users who are logged in and have the according license will be able to access the cached files. The processing pipeline computes a comprehensive feature stack for flood detection. SAR derivatives include intensity bands, VV/VH polarization ratios, and change detection metrics computed in decibel space to enhance flood signal discrimination. Topographic features encompass slope and Height Above Nearest Drainage (HAND) derived from the DEM, as key indicators of flood susceptibility. Flow direction calculations use an expanded bounding box to determine the extended HAND computation domain to address edge artifacts, finally cropped to the original AOI during band compilation, ensuring computationally efficient and accurate flow routing. Additionally, stream burning is implemented to improve drainage network delineation. Further, contextual features include Euclidean Distance to Water and rasterized land cover classification. Users can currently upload ground truth shapefiles (e.g., Copernicus EMS), which are automatically rasterized and compiled into the output stack, enabling supervised classification workflows.  

SARFlood includes integrated sampling and training modules. Multiple strategies such as Simple Random, Stratified, Generalized Random Tessellation Stratified, and Systematic Grid sampling are supported. The training module implements Random Forest classification with Leave-One-Group-Out Cross-Validation across multiple case studies, hyperparameter optimization via Bayesian search, and feature importance assessment through Mean Decrease Impurity, permutation importance, and SHAP values. The platform-, data- and model-agnostic design principles used in developing SARFlood, support open science and FAIR practices in the geoscience community. By combining web accessibility with robust feature engineering and machine learning integration, SARFlood provides researchers with a reproducible platform for generating uncertainty-aware flood labels lowering barriers to use. 

How to cite: Wilhelm, P., Hosch, P., and Dasgupta, A.: SARFlood: A Web-Based, Cloud-Native Platform for Automated and Optimized ML-based SAR Flood Mapping   , EGU General Assembly 2026, Vienna, Austria, 3–8 May 2026, EGU26-6617, https://doi.org/10.5194/egusphere-egu26-6617, 2026.

EGU26-7132 | ECS | Orals | HS6.5

Monitoring Freshwater Bodies over the Past 40 Years Using Synthetic Monthly Sentinel-2 MSI Imagery  

Federica Vanzani, Patrice Carbonneau, Simone Bizzi, Martina Cecchetto, and Elisa Bozzolan

In the last decade rapid advancements in remote sensing have opened new frontiers in our ability to monitor freshwater bodies dynamics at the global scale. Most works have taken advantage of the long time series of Landsat constellations (30 m resolution) relying on spectral indices to identify water. Recently, much progress has also been made in the development and use of deep learning models capable of explicit semantic classification of river water, lake water and sediment bars, based on Sentinel-2 (S2) MSI imagery (10 m resolution). In this work, we present an approach that seeks to extend these existing, trained, fluvial landscape classification models to Landsat data in order to observe long-term water and morphological shifts in rivers and lakes. Rather than explicitly re-training the models with Landsat data and labour-intensive manual label data, we apply a domain transfer approach to generate synthetic S2 MSI imagery from Landsat inputs. This approach has the advantage that the training of deep learning domain transfer models only requires synchronous Landsat and Sentinel data and thus obviates the need for manual labels.

The results show that, when using these synthetic images, river water, lake water and sediment bars are classified with an F1 score of 0.8, 0.94, 0.65 respectively, which represents a decrease of ca. 10% for river water and 20% for sediment with respect to real S2 imagery. By adopting this integrated approach, we are therefore able to monitor, for the first time, lake water, river water and sediment bars at 10 m resolution, over a 40-year period, integrating both synthetic S2 and real S2 acquisitions through a single, fluvial landscape segmentation model. Classification obtained from median monthly images can then be aggregated at the yearly or multi-yearly scale to delineate river or lake water fluctuations, and active channels (river water plus sediment bars) trajectories, from specific freshwater bodies to the global scale.

How to cite: Vanzani, F., Carbonneau, P., Bizzi, S., Cecchetto, M., and Bozzolan, E.: Monitoring Freshwater Bodies over the Past 40 Years Using Synthetic Monthly Sentinel-2 MSI Imagery , EGU General Assembly 2026, Vienna, Austria, 3–8 May 2026, EGU26-7132, https://doi.org/10.5194/egusphere-egu26-7132, 2026.

EGU26-7320 | ECS | Posters on site | HS6.5

Evaluating multimodal optical and SAR learning strategies for flood and surface water delineation 

jiayin xiao, zixi li, and fuqiang tian

Flood and surface water mapping from satellite observations remains challenging due to the complementary yet heterogeneous characteristics
of optical and synthetic aperture radar (SAR) data. While deep learning has achieved promising results, existing studies are often evaluated on
isolated datasets or focus on a single modality, limiting their comparability and operational relevance. In this study, we conduct a large-scale and systematic evaluation of optical, SAR, and combined optical–SAR learning strategies for flood and surface water mapping across multiple public satellite benchmarks. Using a common training and evaluation protocol, we compare lightweight convolutional networks and large pretrained vision models under single-modality and multimodal settings. The analysis reveals that attention-based multimodal fusion consistently improves water delineation accuracy on most datasets, while model capacity and preprocessing choices play a critical role in balancing missed detections and false alarms. On global-scale benchmarks, moderately sized backbones coupled with dedicated fusion mechanisms achieve robust performance without relying on extremely large models.These findings provide practical guidance for selecting architectures and fusion strategies in operational flood mapping and establish a reproducible benchmark for future optical and SAR studies.

How to cite: xiao, J., li, Z., and tian, F.: Evaluating multimodal optical and SAR learning strategies for flood and surface water delineation, EGU General Assembly 2026, Vienna, Austria, 3–8 May 2026, EGU26-7320, https://doi.org/10.5194/egusphere-egu26-7320, 2026.

EGU26-7998 | Orals | HS6.5

Ten years of floods across Europe mapped from space with reconstructed water depths  

Andrea Betterle and Peter Salamon

Floods are among the most deadly and destructive natural disasters. Improving our understanding of large-scale flood dynamics is crucial to mitigating their dramatic consequences. Unfortunately, systematic observation-based datasets—especially featuring flood depths—have been lacking.

This contribution presents advancements in developing an unprecedented catalogue of satellite-derived flood maps across Europe from 2015 onwards. Results are based on the systematic identification of floods in the entire Sentinel-1 archive at 20 m spatial resolution as provided by the Global Flood Monitoring component of the Copernicus Emergency Management Service. Using a novel algorithm that accounts for terrain topography, flood maps are enhanced and provided with water depth estimates—a critically important information for flood impact assessments.

The resulting dataset represents a significant step towards the creation of a global flood archive. It provides new tools for interpreting flood hazards on large scales, with substantial implications for flood risk reduction, urban development planning, and emergency response.

How to cite: Betterle, A. and Salamon, P.: Ten years of floods across Europe mapped from space with reconstructed water depths , EGU General Assembly 2026, Vienna, Austria, 3–8 May 2026, EGU26-7998, https://doi.org/10.5194/egusphere-egu26-7998, 2026.

EGU26-8292 | Posters on site | HS6.5

Modelling wetland resilience to climate change and anthropogenic impacts. 

Patricia Saco, Rodriguez Jose, Breda Angelo, Eric Sandi, and Steven Sandi

Coastal wetlands provide a wide range of ecosystem services, including shoreline protection, attenuation of storm surges and floods, water quality improvement, wildlife habitat and biodiversity conservation. These ecosystems have been observed to sequester atmospheric carbon dioxide at rates significantly higher than many other ecosystems, positioning them as promising nature-based solutions for climate change mitigation.  However, projections of coastal wetland conditions under sea-level rise (SLR) remain highly variable, owing to uncertainties in environmental factors as well as the necessary simplifications embedded within the wetland evolution modelling frameworks. Assessing wetland resilience to rising sea levels and the effect of anthropogenic activities is inherently complex, given the uncertain nature of key processes and external influences. To enable long-term simulations that span extensive temporal and spatial scales, models must rely on a range of assumptions and simplifications—some of which may significantly affect the interpretation of wetland resilience.


Here we present a novel eco-hydro-geomorphological modelling framework to predict wetland evolution under SLR. We explore how accretion and lateral migration processes influence the response of coastal wetlands to SLR, using a computational framework that integrates detailed hydrodynamic and sediment transport processes. This framework captures the interactions between physical processes, vegetation, and landscape dynamics, while remaining computationally efficient enough to support simulations over extended timeframes. We examine several common simplifications employed in models of coastal wetland evolution and attempt to quantify their influence on model outputs. We focus on simplifications related to hydrodynamics, sediment transport, and vegetation dynamics, particularly in terms of process representation, interactions between processes, and spatial and temporal discretisation. Special attention is given to identifying modelling approaches that strike a balance between computational efficiency and acceptable levels of accuracy. We will present recent model results to assess the resilience of coastal wetland to SLR on several sites around the world and will discuss new results to assess the effect of human interventions and infrastructure on wetland resilience.

How to cite: Saco, P., Jose, R., Angelo, B., Sandi, E., and Sandi, S.: Modelling wetland resilience to climate change and anthropogenic impacts., EGU General Assembly 2026, Vienna, Austria, 3–8 May 2026, EGU26-8292, https://doi.org/10.5194/egusphere-egu26-8292, 2026.

EGU26-9354 | ECS | Orals | HS6.5

L-band InSAR to complement SAR inundation mapping under vegetation 

Clara Hübinger, Etienne Fluet-Chouinard, Daniel Escobar, and Fernando Jaramillo

Wetland inundation dynamics are key for understanding flood regulation, ecosystem functioning and greenhouse gas emissions. Synthetic Aperture Radar (SAR) can map water extent independent of cloud cover and can partly penetrate vegetation, particularly at L-band. Many SAR inundation products rely primarily on intensity thresholding and indicators such as specular reflection and double-bounce scattering. However, these approaches can underestimate inundation extent in densely vegetated wetlands where volume scattering can obscure the water signal. Here we demonstrate how L-band interferometric SAR (InSAR) can complement intensity-based inundation mapping under vegetation by exploiting phase differences between repeat SAR acquisitions. Using ALOS PALSAR-1 and PALSAR-2, together providing a nearly two-decade observational archive, we show that L-band InSAR can capture inundation dynamics in tropical floodplain wetlands, such as the Atrato floodplain (Colombia) and Amazon várzea floodplains (e.g., along the Río Pastaza). In the Atrato floodplain, the InSAR-derived flooded vegetation extent shows pronounced seasonal variability, ranging from ~500 to >1500 km² during 2007–2011. Comparison with existing L-band SAR inundation products yields ~70% overall agreement, while InSAR consistently detects broader inundated extents in densely vegetated floodplain areas where intensity-based thresholding underestimates inundation. This complementarity among methodologies is particularly relevant for inundation extent data products from the NASA–ISRO NISAR mission, which are expected to rely largely on SAR backscatter thresholding. Our results highlight the value of integrating InSAR-derived information to strengthen wetland inundation monitoring under vegetated canopies.

How to cite: Hübinger, C., Fluet-Chouinard, E., Escobar, D., and Jaramillo, F.: L-band InSAR to complement SAR inundation mapping under vegetation, EGU General Assembly 2026, Vienna, Austria, 3–8 May 2026, EGU26-9354, https://doi.org/10.5194/egusphere-egu26-9354, 2026.

EGU26-9758 | ECS | Orals | HS6.5

Hydrologically-Informed DTM Super-Resolution for Rapid Flood Depth Estimation 

Sandro Groth, Marc Wieland, Christian Geiß, and Sandro Martinis
Reliable estimation of flood depths from satellite-derived inundation extent information critically depends on the spatial resolution and hydrological consistency of the underlying digital terrain model (DTM). Accurate, very high–resolution DTMs are typically not publicly available, difficult to access within the time constraints of rapid mapping, and lack consistent coverage. Although open-access DTMs such as the Forest and Buildings removed Copernicus DEM (FABDEM) provide global coverage, their coarse spatial resolution often fails to represent important small-scale terrain features that control flow paths, slopes, and local water accumulation. To address these limitations, this study proposes a deep learning framework for DTM super-resolution that combines low-resolution DTMs with optical satellite imagery by integrating hydrological knowledge into the training process to force the reconstruction of relevant topographic features for improved flood inundation depth estimation.

The proposed approach employs a residual channel attention network (RCAN) enhanced with optical satellite imagery as auxiliary input to upscale low-resolution terrain data. Central to the methodology is a collaborative hydrologic loss function that guides network optimization beyond elevation-based accuracy. In addition to the mean absolute elevation error (MAE), the loss integrates slope deviation and flow direction disagreement to focus the learning on the reconstruction of terrain features that are directly relevant for hydrologic applications.

Unlike other super-resolution approaches, which are often using downscaled versions of the low-resolution inputs to learn super-resolved DTMs, the proposed framework was trained on a growing set of aligned patches of real-world globally available low-resolution elevation data, optical satellite imagery, and high-resolution reference DTMs derived from airborne LiDAR. Model performance is evaluated against conventional interpolation and standard super-resolution baseline architectures, including convolutional neural networks (CNN) as well as geospatial foundation models (GFM). To assess the practical impact on flood mapping, the super-resolved DTMs are tested on a set of real-world flood events in Germany by using the well-known Flood Extent Enhancement and Water Depth Estimation Tool (FLEXTH) to derive inundation depth metrics.

Results show that integrating DTMs derived using hydrologically guided super-resolution into flood depth tools can lead to more accurate flood depth estimates compared to low-resolution or other super-resolved inputs. The added hydrologic loss significantly improves the preservation of slopes and flow directions while maintaining elevation accuracy.

Overall, the presented framework offers a method to generate hydrologically meaningful high-resolution DTMs from globally available low-resolution inputs to benefit flood depth estimation in areas, where no high-resolution terrain information is available.

How to cite: Groth, S., Wieland, M., Geiß, C., and Martinis, S.: Hydrologically-Informed DTM Super-Resolution for Rapid Flood Depth Estimation, EGU General Assembly 2026, Vienna, Austria, 3–8 May 2026, EGU26-9758, https://doi.org/10.5194/egusphere-egu26-9758, 2026.

Flash flood disasters have increased by more than 50% in the first 20 years of the 21st century compared to the last 20 years of the 20th century. Monitoring and understanding flood events might lead to better mitigation of this natural hazard. Using SAR and SAR interferometry (InSAR) proved to be a useful tool for mapping flooded areas due to the lower backscatter or decorrelation of the SAR signal in an open-water environment. In Arid regiem, flash flood water is rapidly drained by evaporation or percolation, often before the satellite image is acquired. To overcome this challenge, we propose in this study to use the InSAR coherency loss, created by surface changes during a flash-flood, to map the runoff path and utilize it to quantify peak discharge (Qmax).

We focus on the Ze’elim alluvial fan along the western shore of the Dead Sea, Israel, an arid area affected by seasonal flash floods a few days a year. We use 34 interferograms of X-band (COSMO-SkyMed/TerraSAR-X) SAR data, covering 25 runoff events between 2017 and 2021, and upstream hydrological gauge data. To consider the natural decorrelation processes, we calculate a normalized coherence (ϒn) term, using the average coherence of the study area and the average coherence of a stable reference area, identified by differential LiDAR measurements.

We find a strong correlation between gn and the logarithm of the peak discharge (Qmax). However, the method is limited by a minimal peak discharge—where energy is too low to change the surface—and maximal total water volume—where decorrelation is saturated. The method may provide tools for reconstructing runoff data in arid areas where historical SAR data is available, and for monitoring in difficult access areas or where hydrological stations are sparse or damaged.

How to cite: Nof, R.: Estimating Flash Flood Discharge in Arid Environments Using InSAR Coherence: A Case Study of the Ze’elim Fan, Dead Sea, EGU General Assembly 2026, Vienna, Austria, 3–8 May 2026, EGU26-11948, https://doi.org/10.5194/egusphere-egu26-11948, 2026.

EGU26-12249 | Orals | HS6.5 | Highlight

Lessons Learned from Remote Sensing of River Ice for Flood Early Warning 

Arjen Haag, Tycho Bovenschen, Elena Vandebroek, Athanasios Tsiokanos, Ben Balk, and Joost van der Sanden

Rivers in regions with cold winters can seasonally freeze up. River ice breakup and freeze-up processes can lead to river ice jams, which are a major contributor to flood risk in cold regions (across most of the high latitudes of the northern hemisphere). In Canada, satellite remote sensing is used across the country to provide timely information on the status of river ice. Methods and algorithms to classify various stages of river ice from the Radarsat Constellation Mission (RCM) are available, but the operational implementation of these, especially the integration into larger flood forecasting and early warning systems, requires specific expertise, software and computational resources, and comes with its own set of challenges. In collaboration with various agencies across Canada we have set up operational monitoring systems with the purpose of assisting the daily tasks of forecasters on duty. These have been used in practice over multiple ice breakup and freeze-up seasons, which has highlighted both their usefulness and shortcomings. We will focus on various aspects of such a system and share lessons learned on its design, setup and operational use, as well as a framework to analyse various factors relevant for operational monitoring purposes (e.g. spatiotemporal coverage and latency of the data, critical elements in the support of decision-making relating to floods). In this, we do not shy away from problems and pitfalls, so that others can learn from these. While various challenges remain, this work is a good example of the value in the joint engagement of applied science and end users.

How to cite: Haag, A., Bovenschen, T., Vandebroek, E., Tsiokanos, A., Balk, B., and van der Sanden, J.: Lessons Learned from Remote Sensing of River Ice for Flood Early Warning, EGU General Assembly 2026, Vienna, Austria, 3–8 May 2026, EGU26-12249, https://doi.org/10.5194/egusphere-egu26-12249, 2026.

EGU26-13343 | Posters on site | HS6.5

Operational, national-scale monitoring of river trajectories using satellite imagery  

Elisa Bozzolan, Marco Micotti, Elisa Matteligh, Alessandro Piovesan, Federica Vanzani, Patrice Carbonneau, and Simone Bizzi

The global degradation of river ecosystems and the growing impacts of flood hazards have highlighted limitations in current river management approaches. In Europe, the Water Framework and Flood Directives promote integrated, catchment-scale assessments of hydromorphological conditions and flood risk. Such integration is essential for sustainable management. Planform dynamics and river bed aggradation/incision, for example, can modify channel conveyance and compromise flood mitigation measures, whereas granting more space to rivers can both enhance ecological quality and reduce flood peaks.

In this context, the availability of long-term satellite archives and advances in computational and machine-learning methods enable large-scale, high spatiotemporal resolution monitoring of large and medium river systems. However, despite this potential, the operational adoption of satellite-based river monitoring remains limited due to data complexity, interdisciplinary requirements, and the lack of harmonised computational infrastructures.

Thanks to a collaboration between industry, public institutions and the university, we developed a methodology to systematically map monthly water channel, channel width, sediment bars and vegetation dynamics, testing the results on the full archive of Sentinel-2 (10 m resolution) for medium-large Italian rivers (active channel > 30m - i.e. 3 Sentinel-2 pixels). In this talk, I will outline the applied methodology, discuss its applicability at national scale with Sentinel-2 data, and show how the generated products can better inform river habitat mapping, river conservation practices, and flood risk assessments by supporting consistent national scale geomorphic trajectories identification.

How to cite: Bozzolan, E., Micotti, M., Matteligh, E., Piovesan, A., Vanzani, F., Carbonneau, P., and Bizzi, S.: Operational, national-scale monitoring of river trajectories using satellite imagery , EGU General Assembly 2026, Vienna, Austria, 3–8 May 2026, EGU26-13343, https://doi.org/10.5194/egusphere-egu26-13343, 2026.

Flood inundation mapping has become increasingly critical as climate change intensifies the frequency and severity of flooding worldwide, amplifying risks to populations, infrastructure, and ecosystems. Recent advances in Earth Observation (EO) have shown unprecedented opportunities to monitor flood dynamics across large spatial scales.. However, significant challenges remain due to the limitations of single-sensor approaches. While multispectral imagery provides rich semantic information, it is frequently constrained by cloud cover during flood events. Conversely, Synthetic Aperture Radar (SAR) offers all-weather capability but suffers from signal ambiguity in complex terrains and urban environments. Effectively integrating these heterogeneous modalities therefore remains a challenge, particularly with limited labelled flood event data.

In this study, we propose a deep learning-based cross-modal fusion framework that leverages the representational capacity of Remote Sensing Foundation Models (RSFMs). High-level feature embeddings are extracted from Sentinel-1 and Sentinel-2 multispectral imagery by initializing modality-specific encoders with pretrained weights from state-of-the art multi-modal foundation models, providing a robust and semantically aligned feature space despite limited task-specific training data 

To integrate the multi-modal representations, we adopt a Gated Cross-Modal Attention mechanism, which adaptively modulates the information flow from each modality based on their observation reliability. Specifically, the model is trained to prioritise SAR features to ensure spatial continuity under cloud-obscured conditions, while simultaneously leveraging richer optical semantics to disambiguate SAR signals, correcting for example false detections caused by radar shadowing or smooth impervious surfaces. 

To assess the generalisation of the proposed framework across diverse regions and sensor conditions, we trained and evaluated our model using a comprehensive dataset compiled from publicly available benchmarks, including Kuro Siwo and WorldFloods. Our framework not only establishes a new benchmark for all-weather flood monitoring but also demonstrates the critical role of remote sensing foundation models in overcoming the limitations of traditional, data-hungry fusion approaches.

How to cite: Chen, Y. C. and Wang, L. P.: Integrating SAR and Multispectral Satellite Observations for Flood Inundation Mapping: A Cross-Modal Fusion Framework Leveraging Foundation Models and Gated Attention Mechanism, EGU General Assembly 2026, Vienna, Austria, 3–8 May 2026, EGU26-13502, https://doi.org/10.5194/egusphere-egu26-13502, 2026.

EGU26-13888 | ECS | Posters on site | HS6.5

A Comparative Assessment of Threshold-Based and Machine Learning Methods for Flood Detection 

Jawad Mones, Saeed Mhanna, Landon Halloran, and Philip Brunner


Flood mapping plays a key role in understanding hazard impacts, supporting emergency response, and guiding long-term risk planning. Remote sensing is now widely used in flood studies because it offers low-cost data, avoids the need for dangerous field surveys, and provides rapid observations over large areas. Despite these advantages, comparative research remains limited, particularly with respect to differences among flood-mapping algorithms, such as machine-learning versus threshold-based approaches, and the performance of optical versus radar sensors. This research addresses these gaps by applying multiple flood-mapping methods to the same flood event in Pakistan, and then comparing their performance with respect to a validation benchmark to provide a clearer insight into how data selection and methodological design influence flood detection outcomes

This study evaluates four distinct methods for mapping floods using multi-sensor satellite data. To ensure a fair comparison, three unsupervised machine-learning approaches including a synergetic Sentinel-1 and Sentinel-2 workflow, a method integrating harmonized Landsat–Sentinel data with radar, and a daily MODIS imagery technique were tested alongside a traditional Otsu thresholding baseline. All four were tested on the same 2025 Pakistan flood event, characterized by intense monsoon rains and flash flooding across regions such as Sindh and Punjab in mid- to late-2025.  The flood maps were then validated against UNOSAT flood reports for this event, where UNOSAT’s flood extent closely matches the results produced by the Sentinel-1/Sentinel-2 workflow, which yields the most conservative flood extent among the tested methods.

 Larger flood extents from some methods, especially the Sentinel-1 Otsu thresholding approach, include areas not clearly flooded in optical images. This happens because SAR backscatter also responds to wet soil and saturated vegetation, which a simple threshold can misclassify as water, leading to flood overestimation.

Overall, the results show that flood maps are not just different versions of the same answer, they reflect different satellite data and the utilized algorithms detect flooding. Approaches that combine multiple data sources with machine-learning strike a better balance, producing flood extents that are both spatially consistent and physically realistic. This indicates that multi-sensor, machine-learning–based methods are better suited for operational flood monitoring than simple thresholding, which is too sensitive to surface noise and often overestimates flooding. 

How to cite: Mones, J., Mhanna, S., Halloran, L., and Brunner, P.: A Comparative Assessment of Threshold-Based and Machine Learning Methods for Flood Detection, EGU General Assembly 2026, Vienna, Austria, 3–8 May 2026, EGU26-13888, https://doi.org/10.5194/egusphere-egu26-13888, 2026.

EGU26-16468 | ECS | Orals | HS6.5

Multidecadal Changes and Trends in Global River Positions 

Elad Dente, John Gardner, Theodore Langhorst, and Xiao Yang

Rivers play a central role in shaping the Earth's surface and ecosystems through physical, chemical, and biological interactions. The intensity and locations of these interactions change as rivers continuously migrate across the landscape. In recent decades, human activity and climate change have altered river hydrology and sediment fluxes, leading to changes in river position, or migration. However, a comprehensive perspective on and understanding of these recent changes in the rate of river position shifts is lacking. To address this knowledge gap, we created a continuous global dataset of yearly river positions and migration rates over the past four decades and analyzed trends. The global annual river positions were detected using Landsat-derived surface water datasets and processed in Google Earth Engine, a cloud-based parallel computation platform. The resulting river extents and centerlines reflect the yearly permanent position, corresponding to the rivers’ location during base flow. This approach improves the representation of position changes derived from geomorphological rather than hydrological processes. To robustly analyze river position changes across different patterns and complexities and at large scales, we developed and applied a global reach-based quantification method.

Results show that while alluvial rivers maintain stable positions in certain regions, others exhibit trends in the rates of position change. For instance, the Amazon Basin, which has experienced significant deforestation and hydrological modifications, has shown increased rates of river position change in recent decades, directly modifying active floodplains. In this presentation, we will discuss the advantages, limitations, and applications of the global yearly river position dataset, offer insights into the changing rates of river position, and highlight current and future impacts on one of Earth’s most vulnerable hydrologic systems.

How to cite: Dente, E., Gardner, J., Langhorst, T., and Yang, X.: Multidecadal Changes and Trends in Global River Positions, EGU General Assembly 2026, Vienna, Austria, 3–8 May 2026, EGU26-16468, https://doi.org/10.5194/egusphere-egu26-16468, 2026.

Satellite-based surface water monitoring is essential for traking the spatiotemporal dynamics of global water bodies. However, most existing systems rely on a single mission or sensor modality, constraining both accuracy and temporal coverage. To overcome these limitations, we propose a multi-mission data fusion framework that integrates SAR Sentinel-1 and optical Sentinel-2 observations. Two U-Net convolutional neural networks were trained independently on the S1S2-Water dataset: one using Sentinel-1 sigma-nought backscatter (VV/VH) and the other using Sentinel-2 RGB and NIR bands, with terrain slope incorporated as ancillary input in both models. Predictive uncertainty is quantified via Monte Carlo dropout embedded within the networks, modeling pixel-wise predictions as Gaussian distributions. These probabilistic outputs are subsequently fused using a Bayesian framework and refined through sensor-specific exclusion masks. Evaluation across 16 geographically diverse test sites demonstrates that the fused probabilistic predictions achieve an overall IoU of 89%, highlighting the synergistic benefits of uncertainty-aware, multi-sensor integration. Furthermore, we show that model evaluation restricted to cloud-free optical imagery introduces substantial bias, limiting applicability for near-real-time monitoring. The proposed framework improves temporal availability, robustness, and reliability, advancing multi-satellite approaches for global surface water monitoring.

How to cite: Hassaan, M., Festa, D., and Wagner, W.: SAR and optical imagery for dynamic global surface water monitoring: addressing sensor-specific uncertainty for data fusion, EGU General Assembly 2026, Vienna, Austria, 3–8 May 2026, EGU26-17524, https://doi.org/10.5194/egusphere-egu26-17524, 2026.

EGU26-18308 | Orals | HS6.5

RESCUE_SAT project: Leveraging Satellite Data to Improve Large‑Scale Flood Modeling 

Elena Volpi, Stefano Cipollini, Luciano Pavesi, Valerio Gagliardi, Richard Mwangi, Giorgia Sanvitale, Irene Pomarico, Aldo Fiori, Deodato Tapete, Maria Virelli, Alessandro Ursi, and Andrea Benedetto

The RESCUE_SAT project was launched as part of the “Innovation for Downstream Preparation for Science” (I4DP_SCIENCE) programme (Agreement no. 2025‑2‑HB.0), funded by the Italian Space Agency (ASI), with the goal of enhancing the performance of the RESCUE model through the integration of satellite data. RESCUE is a large‑scale inundation model that enables probabilistic flood‑hazard assessment over large areas by preserving computational efficiency while explicitly representing hydrologic-hydraulic processes along the full drainage network. Primarily based on digital terrain models (DTMs), RESCUE is a hybrid framework that combines a geomorphology-based representation of the river network with simplified hydrological and hydraulic formulations to estimate water levels and inundation extents. The central challenge of the RESCUE_SAT project is to deliver a flood‑modelling tool capable of providing a more reliable and detailed representation of both large‑scale hydrological behavior and local hydraulic processes, including flow interactions with structures such as levees, bridges and dams which are currently not explicitly represented in RESCUE. To this purpose, the Synthetic Aperture Radar (SAR) imagery acquired by the ASI’s COSMO-SkyMed constellation is processed using interferometric techniques to derive high-resolution digital elevation models (DEMs), reaching meter-scale resolution. Starting from high-resolution DEMs derived from COSMO-SkyMed satellite imagery, RESCUE_SAT enables the identification of the locations of structures that interacts with flow propagation, supporting their systematic mapping. Once the infrastructures have been identified and parameterized from the high-resolution DEM, the DEM is resampled and processed to a computationally advantageous coarser resolution, while the detected infrastructure elements are directly integrated into the hydrological–hydraulic model.

How to cite: Volpi, E., Cipollini, S., Pavesi, L., Gagliardi, V., Mwangi, R., Sanvitale, G., Pomarico, I., Fiori, A., Tapete, D., Virelli, M., Ursi, A., and Benedetto, A.: RESCUE_SAT project: Leveraging Satellite Data to Improve Large‑Scale Flood Modeling, EGU General Assembly 2026, Vienna, Austria, 3–8 May 2026, EGU26-18308, https://doi.org/10.5194/egusphere-egu26-18308, 2026.

EGU26-18518 | Orals | HS6.5

Automated Detection of Flood Events from CYGNSS: Observing Flood Evolution Along Propagating Tropical Waves  

Zofia Bałdysz, Dariusz B. Baranowski, Piotr J. Flatau, Maria K. Flatau, and Clara Chew

Flooding is a major natural hazard across the global tropics. Although flood occurrence is shaped by rainfall characteristics—including duration, frequency, and intensity—accurate prediction remains challenging. A key limitation is the lack of reliable, long-term flood databases that capture events across all spatial scales and durations, hindering a clear understanding of how rainfall variability translates into flood onset. This limitation is particularly critical in the Maritime Continent, where extreme rainfall is common and many small, short-lived, yet severe, floods remain undocumented. To address this limitation, we investigate whether a relatively new approach, global navigation satellite system reflectometry (GNSS-R), can help close this observational gap.

In this work, we assess whether data from the CYGNSS small-satellite constellation can be used to identify small- to regional-scale floods, including short-lived events. Our study focuses on Sumatra, an island within the Maritime Continent that is frequently affected by such hazards. A joint analysis of CYGNSS inundation estimates and two independent flood databases allowed us to evaluate how CYGNSS measurements can be used for flood detection. Three detailed case studies demonstrate that CYGNSS provides an unprecedented ability to monitor day-to-day changes in surface water extent, including floods at the urban scale. Specifically, we show that CYGNSS-derived inundation anomalies can clearly capture evolution of a flooding event, with the largest signature one day after known flood initiation. A systematic analysis of 555 flood events over a 21-month period enabled us to identify characteristic patterns in inundation anomalies that reliably distinguish flood events from non-flooding conditions, through the definition of an inundation-anomaly threshold and a maximum distance between CYGNSS detections and reported flood locations. We established that CYGNSS observations within 15 km not-only significantly differ from base-line conditions, but they allow tracking day-to-day flood dynamics as well.

The proposed methodology is transferable and can be applied to establish flood-inundation thresholds for any region within the global tropics, enabling automated detection of previously unreported flood events or the study of relationships between extreme precipitation and flood evolution. An example of its application is the automatic detection of flooding from CYGNSS data associated with subseasonal variability in tropical circulation: the passage of multiple convectively coupled Kelvin waves embedded within an active Madden–Julian Oscillation in July 2021. These waves propagated eastward across the Maritime Continent, triggering extreme rainfall and widespread flooding in equatorial Indonesia and East Malaysia. The day-to-day evolution of floods could be observed alongside the propagating waves, with the termination of the MJO coinciding with the cessation of the flood events.

Relying on low-cost small satellites, this approach shows strong potential for future scalability with larger constellations, ultimately improving flood monitoring and advancing our understanding of how rainfall patterns shape flood dynamics across global tropics.

How to cite: Bałdysz, Z., Baranowski, D. B., Flatau, P. J., Flatau, M. K., and Chew, C.: Automated Detection of Flood Events from CYGNSS: Observing Flood Evolution Along Propagating Tropical Waves , EGU General Assembly 2026, Vienna, Austria, 3–8 May 2026, EGU26-18518, https://doi.org/10.5194/egusphere-egu26-18518, 2026.

Accurate long-term monitoring of surface water dynamics in the Niger River and Lake Chad basins is crucial for regional ecological security and sustainable water resource management. However, such monitoring is often hindered by insufficient continuous high-frequency observations—necessary to capture rapid shifts between permanent and seasonal water bodies in semi-arid transition zones—as well as by persistent cloud cover. To address these limitations, we developed a spatio-temporal data fusion framework designed to delineate detailed evolutionary patterns and regime shifts in surface water. Our methodology integrates Sentinel-1 SAR, Sentinel-2 optical imagery, and digital elevation model (DEM) data, adopting a “zoning modeling” strategy to reduce sensor-specific biases and environmental noise, thereby producing annual and seasonal surface water distribution maps. Furthermore, we developed a pixel-level, climate-coupled model based on inundation frequency to quantify changes in the extent, timing, and type of water bodies across a multi-year time series. Integration of these outputs elucidated the spatial heterogeneity of water resources throughout the study region from 2015 to 2024. Validation using randomly distributed reference samples demonstrated strong consistency, with overall accuracy exceeding 90%, confirming the robustness of our framework. Through an ecology-oriented classification scheme, we identified permanent water bodies—largely concentrated in the southern reaches of the Niger River main channel and the central zone of Lake Chad—as serving a “core support” function within the ecosystem. In contrast, seasonal water bodies followed a “dense in the south, sparse in the north” spatial pattern and acted as critical “ecological buffers” for arid northern areas. Notably, seasonal water extent expanded significantly during high-rainfall years such as 2018 and 2022, underscoring its pronounced sensitivity to climatic variability. Compared with current state-of-the-art approaches, the proposed framework enables characterization of high-frequency surface water dynamics and associated ecological interactions as continuous spatio-temporal fields, thereby providing a reliable and scalable tool to inform sustainable watershed management strategies across Africa.

How to cite: Du, L., You, S., Ye, F., and He, Y.: Tracking Dynamic Regimes and Ecological Functions of Surface Water in the Niger-Lake Chad Basins through Multi-Source Fusion (2015–2024), EGU General Assembly 2026, Vienna, Austria, 3–8 May 2026, EGU26-19055, https://doi.org/10.5194/egusphere-egu26-19055, 2026.

EGU26-19963 | ECS | Orals | HS6.5

Development of routine flood mapping using SAR satellite observation for long-term monitoring system in the flood-prone regions, Cambodia 

Chhenglang Heng, Vannak Ann, Thibault Catry, Vincent Herbreteau, Cyprien Alexandre, and Renaud Hostache

Monitoring inland surface water in near-real time is a key challenge in cloud-prone tropical regions.  Recently, Synthetic Aperture Radar (SAR) products have been widely used to detect surface water. Our area of interest, the Tonle Sap Lake region is a complex environment where very large areas and floodplains are partially or fully submerged seasonally. As the population living around the lake strongly rely on the seasonal flooding dynamics for their socio-economic activities and can at the same time be at risk due to extreme flooding events, it is of main importance to develop tools for the monitoring of flooded areas. In this context, we are adopting and evaluating an algorithm which relies on parametric thresholding, and region growing approaches applied over time series of Sentinel-1 (S1) SAR backscatter images (VV and VH). To evaluate the produced water extent maps based on VV and VH polarizations, we used a cross evaluation using multi-sensor products: high-resolution optical data such as Sentinel-2 (S2) and the coarser resolution Sakamoto flood extend derived from MODIS product. The comparison is made using the Critical Success Index (CSI) and Kappa coefficient performance metrics. During the dry season, the VV polarization demonstrated very good performance using S2-derived maps as a reference, with CSI of 0.84 and a Kappa coefficient of 0.91, indicating highly accurate surface water detection. Performance was similar using the Sakamoto product as a reference (CSI=0.87). However, performance dropped during the rainy season, with the VV polarization's CSI decreasing to 0.76 comparing S2, reflecting challenges in detecting water in the extensive flooded vegetation areas. VH polarization consistently overestimated water extent by misclassifying wet vegetation and rice fields. A merge of VV and VH product yielded an intermediate performance, improving water detection in vegetated areas compared to VV alone. This comprehensive, multi-sensor and multi-season assessment clarifies the specific strengths of each S1 polarization, showing VV's superiority for open water mapping, especially in the dry season. It underscores the importance of selecting the appropriate product (VV for open water, merged for total inundation) and considering seasonal context for operational monitoring, thereby demonstrating the algorithm's robustness while also defining its operational limitations.

How to cite: Heng, C., Ann, V., Catry, T., Herbreteau, V., Alexandre, C., and Hostache, R.: Development of routine flood mapping using SAR satellite observation for long-term monitoring system in the flood-prone regions, Cambodia, EGU General Assembly 2026, Vienna, Austria, 3–8 May 2026, EGU26-19963, https://doi.org/10.5194/egusphere-egu26-19963, 2026.

The research focused on developing the framework for assessing marine, nearshore and transitional waters across Ireland and validated for generalization of the framework across at any geospatial scale using remote sensing (RS) products. To the best of authors knowledge, existing most of the studies only have demonstrated for retrieving particular water quality (WQ) indicators like turbidity, salinity or chlorophyll a without in depth validation results. Recently the authors comprehensively reviewed several studies focusing on the RS applications for assessing WQ using computational intelligence techniques (CIT) like machine learning, artificial intelligence, statistical approaches etc. Unfortunately, the reviewed findings reveals that most of the research are questionable in terms of using data transparency, and validation with independent or other geospatial domains applications of the existing developed tools. Therefore, the research aim was to develop a novel framework and validated with independent datasets including new domain(s) adaptation or validation. For developing the framework, to achieve the goal of the research, the study utilized Sentinel-3 (S3) OLCI RS reflectance data. For obtaining RS data, the study utilized S3-OLCI level 3(L3) and level 4 (L4) reflectance data Rhow_1 to Rhow_11 form the Copernicus Marine Services (CMS) repository datasets for 2016 to 2024. To obtain the overall WQ, the research considered 49 (in-situ) EPA, Ireland monitoring sites across various transitional and coastal waterbodies for computing the overall WQ (IEWQI scores) scores using recently developed and widely validated the IEWQI model. After than the RS data prepared and match-up with 49 considering monitoring sites. For predicting IEWQI scores, the research utilized the multi-scale signal processing framework (MSSPF) by following configurations: data augmentations: 2x to 20x, noise level from 0.0001 to 0.05, and data spilled ratios 60-20-20 and 70-20-10, respectively for train, test and validation of 43 CIT models using RS data from 2016 to 2023 both L3 and L4, whereas the 2024 dataset using for testing independent dataset to generalize the model prediction capabilities. Utilizing four identical model performance evaluation metrics, the results reveals that the PyTorchMLP could be effective (train performance : R2 = 0.86, RMSE =0.09, MSE = 0.008, and MAE = 0.067; test performance : R2 = 0.84, RMSE =0.094, MSE = 0.008, and MAE = 0.071; and validation performance : R2 = 0.81, RMSE =0.095, MSE = 0.009, and MAE = 0.074, respectively at 7x augmentation with 0.0001 of noise level for 60-20-20) compared to the 43 CIT models in terms of predicting and validating independent dataset (independent dataset validation performance for 2024 : R2 = 0.62, RMSE =0.164, MSE = 0.026, and MAE = 0.12). Based on the predicted IEWQI scores, the WQ ranked “marginal”, “fair” and “good” categories for Irish waterbodies. The findings of the framework align with the traditional EPA, Ireland monitoring approaches. However, findings of the research reveals that the proposed framework could be effective to monitoring WQ general purposes using RS data across any geospatial resolution.

Keywords: remote sensing; Copernicus database; MSSPF, IEWQI, Ireland.

How to cite: Uddin, M. G., Diganta, M. T. M., Sajib, A. M., Rahman, A., and Indiana, O.: A comprehensive framework for assessing marine, nearshore and transitional waters quality integrating Irish Water quality Index (IEWQI) model from remote sensing products using computational intelligence techniques, EGU General Assembly 2026, Vienna, Austria, 3–8 May 2026, EGU26-20016, https://doi.org/10.5194/egusphere-egu26-20016, 2026.

EGU26-20097 | ECS | Orals | HS6.5

Comprehensive validation of the benefits of multi-sensor flood monitoring 

Chloe Campo, Paolo Tamagnone, Guy Schumann, Trinh Duc Tran, Suelynn Choy, and Yuriy Kuleshov

Multi-sensor methodologies are gaining traction within flood monitoring research, grounded in the rationale that data fusion from diverse sources mitigates uncertainty and improves spatiotemporal coverage. However, these assumed benefits are rarely quantified.

This work aims to comprehensively compare the performances of multi-sensor and single-sensor approaches to understand to what extent increasing the number and variegate data source may improve the detection rate and temporal characterisation of flood events. A multi-sensor flood monitoring approach using AMSR2 and VIIRS data is assessed against each sensor individually and against standard benchmarks in EO-based flood detection (e.g., MODIS and Sentinel-1)  for major flood events in the Savannakhet Province of Laos.

The comparative analysis evaluates multiple metrics. First, detection comparison classifies events as captured by each considered approach, multi-sensor only, each individual sensor only, or missed by all, to directly quantify the improvement attributable to multi-sensor integration. The spatial agreement is assessed between the multi-sensor and single sensor approaches for jointly detected flood events. Additionally, the temporal component is characterized by an examination of the observation frequency, maximum observation gaps, and peak capture timing. Lastly, the various detection outcomes are related to event characteristics, including cloud cover persistence, flood magnitude, duration, and flood type, quantifying the conditions under which a multi-sensor approach performs optimally.

How to cite: Campo, C., Tamagnone, P., Schumann, G., Duc Tran, T., Choy, S., and Kuleshov, Y.: Comprehensive validation of the benefits of multi-sensor flood monitoring, EGU General Assembly 2026, Vienna, Austria, 3–8 May 2026, EGU26-20097, https://doi.org/10.5194/egusphere-egu26-20097, 2026.

Integrated Monitoring of Lake Garda with Radar, Optical Sensors and In Situ Instruments: Insights from the SARLAKES Project

Virginia Zamparelli1, Simona Verde1, Andrea Petrossi1, Gianfranco Fornaro1, Marina Amadori2,3, Mariano Bresciani2, Giacomo De Carolis2, Francesca De Santi4, Matteo De Vincenzi3, Giulio Dolcetti3, Ali Farrokhi3, Raffaella Frank2, Nicola Ghirardi2,5, Claudia Giardino2, Fulvio Gentilin6, Alessandro Oggioni2, Marco Papetti6, Gianluca Pari7 Andrea Pellegrino2, Sebastiano Piccolroaz3, Tazio Strozzi8, Marco Toffolon3, Maria Virelli7, Nestor Yague-Martinez9, and Giulia Valerio6


1Institute for Electromagnetic Sensing of the Environment (IREA), National Research Council, Naples, Italy

2Institute for Electromagnetic Sensing of the Environment (IREA), National Research Council, Milan, Italy

3Department of Civil, Environmental and Mechanical Engineering (DICAM), University of Trento, Trento, Italy

4Institute for Applied Mathematics and Information Technologies (IMATI), National Research Council, Milan, Italy

5 Institute for BioEconomy (IBE), National Research Council, Sesto Fiorentino, Italy

6Department of Civil, Environmental, Architectural Engineering and Mathematics (DICATAM), University of Brescia, Brescia, Italy

7Italian Space Agency (ASI), Rome, Italy

8GAMMA Remote Sensing, Gümligen, Switzerland

9Capella Space Corp., San Francisco, CA, USA


SARLAKES (SpatiAlly Resolved veLocity and wAves from SAR images in laKES) is a PRIN (Projects of National Interest) project funded in 2022 by the Italian Ministry of University and Research. The project is now in its final phase and is scheduled to end at the beginning of 2026. The project developed a novel, advanced and adaptable tool capable of accurately measuring water dynamics in medium- and large-sized lakes.

A key and innovative aspect of the project is the use of spaceborne Synthetic Aperture Radar (SAR) data, which are widely exploited for routine observation of the marine environments but remain relatively underutilized for lake monitoring. SARLAKES investigated the capability of SAR imagery to retrieve the spatial distribution of wind fields, surface currents, and wind-generated waves in lacustrine environments.

The project considers Lake Garda and Lake Geneva as case studies, with Lake Garda—the largest lake in Italy—selected as the primary test site due to the research group’s long-standing experience and the availability of extensive historical data.

This contribution presents the main results obtained over two years of project activity, with particular emphasis on outcomes from a multidisciplinary field campaign conducted on April 2025. The campaign aimed to reconstruct lake surface currents during a strong wind event in the peri-Alpine Lake Garda region.

The field instrumentation included a wave buoy, an acoustic Doppler current profiler (ADCP), Lagrangian drifters, anemometers, a ground-based radar, fixed cameras, a drone, and a conductivity–temperature–depth profiler. Satellite acquisitions from the COSMO-SkyMed Second Generation and Capella Space SAR sensors, as well as from the optical sensor PRISMA were scheduled over the study area during the campaign. Archive data from Sentinel-1, Sentinel-2, Sentinel-3, Landsat, and COSMO-SkyMed missions were also utilized.

The project demonstrates how the integration of in-situ instrumentation, spatially distributed flow measurements from remote sensing, and hydrodynamic modeling provides a comprehensive and scalable approach to next-generation monitoring of complex lake systems.

How to cite: Zamparelli, V. and the SARLAKES project team: Integrated Monitoring of Lake Garda with Radar, Optical Sensors and In Situ Instruments: Insights from the SARLAKES Project, EGU General Assembly 2026, Vienna, Austria, 3–8 May 2026, EGU26-21000, https://doi.org/10.5194/egusphere-egu26-21000, 2026.

Semi-urban vegetation systems play a critical role in ecosystem stability but are increasingly exposed to flood hazards due to climate variability and rapid land-use change. Accurate flood detection in such system remains challenging because radar backscatter is influenced by complex and mixed scattering mechanisms arising from vegetation, built-up structures, and surface water. Conventional intensity-based flood indices struggle to separate flooded vegetation from non-flooded rough surfaces and tend to miss inundated areas under mixed land-cover conditions. To address these limitations, this study presents a physically interpretable flood detection framework that integrates Synthetic Aperture Radar polarimetric descriptors with a machine learning classifier. The proposed approach utilizes dual-polarized Sentinel-1 SAR data to derive polarimetric features from Stokes parameters and the covariance matrix. Specifically, the Degree of Polarization and Linear Polarization Ratio are combined with eigenvalue-based information to capture changes in both amplitude and polarization state between pre-flood and during-flood conditions. These descriptors are integrated into a novel Flood Index (FI) designed to distinguish flooded urban areas dominated by double-bounce scattering from flooded vegetation characterized by depolarized volume scattering. Unlike commonly used indices such as the Normalized Difference Flood Index (NDFI) or VH/VV ratio, the proposed FI exploits polarization behaviour rather than relying solely on backscatter intensity. A Random Forest classifier is trained on the proposed FI using a tile-based sampling strategy to handle class imbalance between flooded and non-flooded pixels. The framework is evaluated across three flood events representing diverse geographic and land-cover conditions: the 2019 Typhoon Hagibis flood in Japan, the 2023 Yamuna River flood in India, and the 2023 Larissa flood in Greece. Model performance is assessed using multiple accuracy metrics, including F1 score, Intersection over Union (IoU), False Positive Rate (FPR), and False Negative Rate (FNR). Results demonstrate that the Random Forest model trained on the proposed Flood Index consistently outperforms threshold-based Otsu methods and NDFI across all study areas. The approach achieves F1 scores ranging from 0.81 to 0.86 and IoU values between 0.70 and 0.76, while maintaining a relatively low False Negative Rate (0.09-0.17), that is critical for minimizing missed flooded areas in disaster response applications. Sensitivity and ablation analyses further confirm the robustness of the Flood Index to speckle noise and highlight the complementary contribution of its individual components. Overall, the proposed framework offers a transferable and computationally efficient solution for flood mapping in semi-urban vegetation systems using widely available dual-polarized SAR data. The results highlight its potential for scalable flood monitoring and rapid damage assessment across regions with heterogeneous land-cover conditions.

How to cite: Adhikari, R. and Bhardwaj, A.: SAR polarimetry-based machine learning method for flood detection in semi-urban vegetation systems, EGU General Assembly 2026, Vienna, Austria, 3–8 May 2026, EGU26-21063, https://doi.org/10.5194/egusphere-egu26-21063, 2026.

EGU26-21507 | ECS | Posters on site | HS6.5

Flood Susceptibility Mapping with GFI 2.0 and Artificial Intelligence Models 

Jorge Saavedra Navarro, Ruodan Zhuang, Caterina Samela, and Salvatore Manfreda

Floods are among the most damaging natural hazards, motivating the development of rapid and scalable tools for floodplain mapping across multiple return periods and for post-event assessment. The Geomorphic Flood Index (GFI) is widely used to identify flood-prone areas using topographic information, but it can exhibit reduced reliability under complex hydraulic conditions—particularly near confluences where backwater controls water levels—and it may systematically overestimate inundation extents when used as a binary classifier.

This study advances the GFI framework by explicitly accounting for backwater effects at river confluences and along tributary junctions. In parallel, to reduce the intrinsic overestimation of GFI-derived floodplains, we test a suite of Artificial Intelligence (AI) classifiers—Random Forest, XGBoost, and Neural Networks—trained through a multi-parametric formulation that combines GFI with auxiliary predictors, including precipitation, lithology, land use, and slope. The approach is evaluated across multiple Italian catchments, using satellite-derived inundation and hydrodynamic simulations as independent benchmarks. Model performance is quantified against the baseline GFI approach using a standard threshold-based binary classification using an optimal cutoff.

The proposed framework aims to improve post-event flood delineation under observational constraints (e.g., satellite data gaps due to cloud cover, vegetation, or imaging limitations) and to provide a computationally efficient surrogate for extending hydrodynamic information to additional return periods or large basins where full numerical modelling is impractical. Preliminary results indicate that Random Forest provides the most robust performance across study sites. Incorporating backwater effects yields clear gains at confluences, primarily by reducing omission errors and improving the representation of hydraulically controlled inundation patterns. Moreover, the AI-based correction substantially mitigates the overestimation typically associated with standard GFI mapping, resulting in floodplain delineations that are more consistent with complex hydrodynamic processes and suitable for scalable flood hazard applications.

How to cite: Saavedra Navarro, J., Zhuang, R., Samela, C., and Manfreda, S.: Flood Susceptibility Mapping with GFI 2.0 and Artificial Intelligence Models, EGU General Assembly 2026, Vienna, Austria, 3–8 May 2026, EGU26-21507, https://doi.org/10.5194/egusphere-egu26-21507, 2026.

EGU26-21622 | ECS | Orals | HS6.5

Mapping and modeling coastal flood dynamics using remote sensing and hydrodynamic models 

Giovanni Fasciglione, Guido Benassai, Gaia Mattei, and Pietro Patrizio Ciro Aucelli

This study presents an integrated and multidisciplinary methodology for investigating coastal flooding and morphodynamic processes in low-lying coastal environments, with a comparative application to two geomorphologically distinct Mediterranean coastal plains: the Volturno Plain and the Fondi Plain. The methodological framework combines high-resolution topographic and bathymetric datasets, aerial remote sensing, sedimentological analyses, statistical wave climate assessment, numerical hydrodynamic modelling, and relative sea-level rise scenarios that incorporate both eustatic trends and local vertical land movements. This approach enables a robust evaluation of how differing coastal configurations influence flooding susceptibility under extreme marine conditions.

For both study areas, the topographic baseline was derived from 2 m resolution LiDAR-based Digital Terrain Models, subsequently refined using site-specific datasets. In the Volturno Plain, extensive GNSS field surveys were conducted along the beach between Volturno and Regi Lagni river mouths. In the Fondi Plain, DTM refinement relied on aerial drone surveys carried out over the beach sector between the Canneto and Sant’Anastasia river mouths. Photogrammetric processing of aerial imagery allowed the generation of high-resolution surface models, which were integrated with the existing LiDAR DTM to enhance the depiction of subtle morphological features critical for flood propagation.

Sedimentological characterization was performed to constrain morphodynamic responses. Granulometric samples were collected along cross-shore transects at elevations ranging from −1.5 m to +2 m. Grain-size distribution analyses supported the calibration and interpretation of sediment transport and wave dissipation processes within numerical models.

Bathymetric modelling was based on high-precision single-beam echo-sounder surveys, with depth data corrected for tidal variations using official tide-gauge records. Emerged and submerged datasets were merged into continuous topo-bathymetric models, ensuring consistency in vertical reference systems and numerical stability.

Marine storms were identified through the analysis of offshore buoy records using a Peak Over Threshold approach. Storm events were classified into five classes using their Storm Power Index calculated by combining significant wave height and event duration. Representative events were selected as boundary conditions for coupled hydrodynamic simulations performed with Delft3D and XBeach. Simulations were run for future scenarios based on high-emission IPCC projections (SSP 5-8.5), integrating local sea-level rise, local subsidence rates, and highest tidal and surge levels.

A comparative analysis of the simulation outcomes highlights marked differences between the two coastal plains. The Volturno Plain results highly prone to inundation, with storm surges overtopping dune systems and propagating inland due to low elevations, local subsidence, and limited effectiveness of existing coastal defenses. Conversely, the Fondi Plain exhibits significantly reduced flood penetration. The presence of a wide bar system, coupled with efficient coastal defense structures, promotes substantial dissipation of incoming wave energy. As a result, even under intense storm conditions, inundation remains confined to a narrow coastal strip immediately landward of the beach.

Overall, the comparative methodological application demonstrates how coastal morphology, sedimentological properties, and defense systems critically control flood dynamics. The proposed framework provides a transferable and decision-oriented tool for assessing coastal vulnerability and supporting adaptation strategies in heterogeneous low-lying coastal settings under climate change pressure.

How to cite: Fasciglione, G., Benassai, G., Mattei, G., and Aucelli, P. P. C.: Mapping and modeling coastal flood dynamics using remote sensing and hydrodynamic models, EGU General Assembly 2026, Vienna, Austria, 3–8 May 2026, EGU26-21622, https://doi.org/10.5194/egusphere-egu26-21622, 2026.

EGU26-21631 | ECS | Posters on site | HS6.5

Assessment of Multi-Mission Satellite Altimetry GDR L2 Products for River Water Surface Elevation in the Ganga Basin 

Barun Kumar, Shyam Bihari Dwivedi, and Shishir Gaur

Precise monitoring of water surface elevation (WSE) in data-deficient areas such as the Ganga River stretch is essential for hydrological modelling, flood prediction, and comprehensive water resource management. This study introduces a comprehensive evaluation framework for Level-2 Geophysical Data Records (GDR L2) derived from various satellite altimetry missions, including Sentinel-3A/B, Sentinel-6A, Jason-3, and SWOT Nadir, validated against in-situ gauge stations from the Central Water Commission (CWC) across a range of hydrological conditions. The process includes advanced geographical analysis. Gaussian-process Kriging interpolation generates continuous longitudinal WSE profiles across strategically placed virtual stations; rigorous outlier detection employs interquartile range (IQR) and Hampel filters; bias correction employs dry-season median alignment to a common orthometric datum; and Kalman filter smoothing effectively reduces measurement noise while preserving critical hydrological signal dynamics.

Comprehensive performance evaluations employ co-located time series analysis, scatter plots, and flow duration curves (FDCs), with seasonal stratification distinguishing monsoon high-flow variability from stable non-monsoon baseflow conditions. The evaluation stresses physically significant parameters based on Kling-Gupta Efficiency (KGE) and RMSE. Sentinel-6A is the strongest performer in all situations with high non-monsoon accuracy (KGE 0.894, RMSE 0.089 m) and monsoon performance (KGE 0.57, RMSE 3.08 m) despite turbulent flow issues, but SWOT Nadir's processing potential is limited by specific hooking artifacts. During non-monsoon periods, measurement reliability is consistently 2-4 times higher. This proven multi-mission system demonstrates satellite altimetry as an operationally viable method for WSE retrieval in major braided rivers, allowing for accurate rating curve generation and discharge computation. In future machine learning data fusion and hydrodynamic modelling can be incorporated to increase basin-scale forecast capabilities.

How to cite: Kumar, B., Dwivedi, S. B., and Gaur, S.: Assessment of Multi-Mission Satellite Altimetry GDR L2 Products for River Water Surface Elevation in the Ganga Basin, EGU General Assembly 2026, Vienna, Austria, 3–8 May 2026, EGU26-21631, https://doi.org/10.5194/egusphere-egu26-21631, 2026.

EGU26-21734 | Posters on site | HS6.5

Evaluating Copernicus Global Flood Monitoring (GFM) Service trade-offs in near-real-time flood mapping 

Shagun Garg, Ningxin He, Sivasakthy Selvakumaran, and Edoardo Borgomeo

Near-real-time satellite-based flood maps support disaster risk management and emergency response. One widely used service is the Global Flood Monitoring (GFM) product of the Copernicus Emergency Management Service, launched in 2021 and based on Sentinel-1 Synthetic Aperture Radar (SAR) data. The GFM service combines three flood-mapping algorithms: pixel-based thresholding, region-based approaches, and change-detection techniques, merged using a majority-voting scheme to generate the final flood extent product. Another key strength of the GFM service is its rapid analysis, providing flood maps within approximately five hours of satellite image acquisition through a fully automated processing chain. As the product is increasingly relied upon by practitioners and decision-makers, there is a growing need to assess its accuracy and robustness. Understanding false alarms and missed detections is critical for improving the reliability and usability of the service.


In this study, we systematically compare GFM flood maps across twenty real-world flood events using high-resolution reference datasets. To ensure temporal consistency, the GFM-derived flood maps are generated using Sentinel-1 acquisitions from the same day as the reference observations. Spatial agreement between datasets is quantified using the Intersection-over-Union metric.


Our results suggest that the GFM service performs well for large, extensive flood events but degrades for smaller, localized ones. Many of the observed errors come not from flood detection itself, but from inaccuracies in the reference water layer - while surface water is correctly identified, misclassification of permanent or seasonal water bodies leads to false alarms and missed floods. We evaluate the three-underlying flood-mapping algorithms individually for consistent patterns of misdetection or false alarms. In addition, we develop an automated framework to rapidly compare any external flood map with the GFM outputs, enabling near-instant evaluation of agreement and error patterns. 


This framework provides practical insights into where and why the GFM services achieve successes and failures and offers continuous validation and iterative improvement of global flood mapping services. 

How to cite: Garg, S., He, N., Selvakumaran, S., and Borgomeo, E.: Evaluating Copernicus Global Flood Monitoring (GFM) Service trade-offs in near-real-time flood mapping, EGU General Assembly 2026, Vienna, Austria, 3–8 May 2026, EGU26-21734, https://doi.org/10.5194/egusphere-egu26-21734, 2026.

EGU26-22077 | Orals | HS6.5

A fully automatic processing chain for the systematic monitoring of surface water using Copernicus Sentinel 1 satellite data: first results of the SCO-CASCADES project. 

Renaud Hostache, Cyprien Alexandre, Chhenglang Heng, Thibault Catry, Vincent Herbreteau, Vannak Ann, Christophe Révillion, and Carole Delenne

Water is essential to life and health of various ecological and social systems. Unfortunately, water is one of the natural resources most impacted by climate change, with increasingly intense hydro-meteorological extremes (floods, droughts, etc.) and growing societal demand. To help manage this vulnerable resource, it is vital to assess and monitor its availability on a regular basis, as well as to track its trajectory over time to better understand the impact of global change on it. Surface water (lakes, rivers, flood plains, etc.) represents an important component of total water resources, and it is of primary importance to monitor it to better understand and manage the consequences of climate change. Surface water resources provide populations around the world with essential ecosystem services such as power generation, irrigation, drinking water for humans and livestock, and space for farming and fishing.

In this context, the SCO-CASCADES project implements end-to-end processing chains for satellite Earth observation data, including Sentinel-1 and 2 (S-1 and S-2), in order to provide surface water products (surface water body and inundation depth maps) that will be made available via an interactive platform co-constructed with identified users.

In the first phase of the project a fully automated Sentinel-1 based processing chain has been implemented. This chain is based on automatic multiscale image histogram parameterization followed by thresholding, region growing and chain detection applied on individual, subsequent pairs, and time series of S1 images. This chain enables us to derive various products: i) an exclusion layer identifying areas where water cannot be detected on Sentinel 1 image (e.g. Urban and forested areas), ii) permanent seasonal water body maps, iii) a water body map for each S1 image, iv) an uncertainty map characterizing the water body classification uncertainty, v) an occurrence map providing the number of times (over the time series) each pixel was covered by open water.

Here, we propose to present and evaluate the robustness of the processing chain and the resulting maps produced using multi-year S1 time series over two large scale sites: the Mekong flood plains between Kratie, the Tonle Sap lake and the Mekong Delta, and the Tsiribihina basin in Madagascar. The kappa score obtained from the comparison between S1 and S2-derived maps shows a good agreement yielding CSI and Kappa Cohen scores most of the time higher than 0.7 and sometimes reaching values higher than 0.9.

How to cite: Hostache, R., Alexandre, C., Heng, C., Catry, T., Herbreteau, V., Ann, V., Révillion, C., and Delenne, C.: A fully automatic processing chain for the systematic monitoring of surface water using Copernicus Sentinel 1 satellite data: first results of the SCO-CASCADES project., EGU General Assembly 2026, Vienna, Austria, 3–8 May 2026, EGU26-22077, https://doi.org/10.5194/egusphere-egu26-22077, 2026.

EGU26-3821 | Orals | ESSI2.7

Reproducible and Scalable cloud-native EO data analysis using openEO  

Pratichhya Sharma, Hans Vanrompay, and Jeroen Dries

Earth Observation (EO) data plays a crucial role in research and applications related to environmental monitoring, enabling informed decision-making. However, the continuously increasing volume and diversity of EO data, distributed across multiple platforms and varying formats, pose challenges for easy access and the development of scalable and reproducible workflows.

openEO addresses these challenges by providing a community-driven, open standard for unified access to EO data and cloud-native processing capabilities. It supports researchers to develop interoperable, scalable and reproducible workflows that can be executed using various programming languages (Python, R or JavaScript).

openEO has become a cornerstone technology across major initiatives in agriculture, natural capital accounting, and land-cover monitoring. In ESA’s WorldCereal project, it provides the scalable framework needed to process global Sentinel-1 and Sentinel-2 time series and integrate advanced machine-learning models, enabling dynamic 10-meter cropland and crop-type maps. It also supports the Copernicus Global Land Cover service and its tropical forestry component by delivering consistent and repeatable processing chains for annual 10-meter land-cover products, which are crucial for policy reporting and SDG monitoring. Beyond land cover, openEO supports efforts like ESA's World Ecosystem Extent Dynamics project by creating reproducible ecosystem-extent mapping and change detection maps — key elements for biodiversity and environmental management.

Building on this foundation, the openEO Federation, now integrated within the Copernicus Data Space Ecosystem (CDSE), provides seamless access to distributed Earth observation data and processing resources through a single, unified interface. By connecting multiple backends, it removes the need to juggle separate accounts or APIs and enables cross-platform workflows over datasets hosted by platforms such as Terrascope and CDSE.

openEO also strongly supports FAIR (Findable, Accessible, Interoperable, Reusable) principles. It exposes rich metadata, relies on standardised processes, and encourages the use of reusable workflow definitions. This promotes transparency, reproducibility, and the sharing of algorithms and data across research and operational communities. The approach has been validated in several large-scale implementations, including ESA’s WorldCereal and the JRC’s Copernicus Global Land Cover and Tropical Forestry Mapping and Monitoring Service (LCFM), demonstrating its maturity for both research and production environments.

By enabling reusable, federated, and reproducible Earth observation workflows, openEO is helping to build a more interoperable and efficient computational ecosystem, one that supports scalable innovation, collaboration, and long-term operational monitoring. Therefore, in this session, we aim to spark discussion on how openEO enables federated, FAIR-compliant, and reproducible workflow approaches for large-scale Earth observation applications.

How to cite: Sharma, P., Vanrompay, H., and Dries, J.: Reproducible and Scalable cloud-native EO data analysis using openEO , EGU General Assembly 2026, Vienna, Austria, 3–8 May 2026, EGU26-3821, https://doi.org/10.5194/egusphere-egu26-3821, 2026.

EGU26-5728 | ECS | Posters on site | ESSI2.7

Parallel HPC workflow orchestration with Nextflow, supported by CI/CD and containerization tools for global high resolution evaporation modelling 

Joppe Massant, Oscar Baez-Villanueva, Kwint Delbaere, Diego Fernandez Prieto, and Diego Miralles

The Global Land Evaporation Amsterdam Model (GLEAM) estimates daily land evaporation using a wide range Earth observation forcing datasets. In the project GLEAM-HR funded by the European Space Agency (ESA), we aim to create a global high-resolution daily evaporation dataset at 1 km for a period of eight years (2016–2023). To produce high-resolution evaporation estimates, all forcing data must be processed at 1 km resolution, requiring substantial computational resources. As the complete high-resolution forcing data no longer fits within the memory capacity of single HPC nodes, parallelization tools are necessary. To achieve this parallelization in a seamless way, a workflow orchestration ecosystem is designed that leverages the use of Zarr, Apptainer and Nextflow.

The Zarr ecosystem allows for easily writing to a dataset in parallel. Nextflow is an orchestration tool that allows dynamic job submissions, where the configuration of jobs can depend on the outcome of earlier jobs, such as the spatial domain to be processed. Apptainer is a containerization tool developed for HPC environments, allowing a “build once, deploy anywhere” approach. Combining these tools allows building a workflow orchestration environment that enables the automation of these parallel workflows while optimizing the job sizes for a given HPC environment.

The use of containers allows this workflow to be ported to different hardware without the need to set up all the environments again, making the designed workflow fully reproducible independent of the computing environment. Combining this with Continuous Integration and Continuous Delivery (CI/CD) practices to automate the container building and deployment, code development and workflow execution can be cleanly separated.

In a first test case, this processing workflow is used to produce global datasets of LAI, FPAR and vegetation cover fractions at 1 km resolution.  Future work focuses on the extension of this workflow to the other forcing datasets and the entire pipeline execution.

How to cite: Massant, J., Baez-Villanueva, O., Delbaere, K., Fernandez Prieto, D., and Miralles, D.: Parallel HPC workflow orchestration with Nextflow, supported by CI/CD and containerization tools for global high resolution evaporation modelling, EGU General Assembly 2026, Vienna, Austria, 3–8 May 2026, EGU26-5728, https://doi.org/10.5194/egusphere-egu26-5728, 2026.

EGU26-6238 | ECS | Posters on site | ESSI2.7

A prototype Open-Source data-processing pipeline to efficiently combine in-situ data with remote-sensing observations of the Earth 

Robert Reinecke, Annemarie Bäthge, David Noack, Matthias Zink, Simon Mischel, and Stephan Dietrich

In situ and remote sensing data are crucial in earth sciences, as they provide complementary perspectives on environmental phenomena. In situ data, collected directly from the Earth’s surface, offer high accuracy and detailed insights into local conditions, enabling precise measurements of variables such as soil moisture, temperature, and pollutant levels. Conversely, remote sensing data provides for extensive spatial coverage and the ability to monitor changes over time across vast areas, capturing large-scale patterns and trends that in situ data alone cannot reveal. By combining these two data sources and automatically preprocessing them into Analysis-Ready Data, researchers can enhance scientific insights, improve the robustness of machine learning applications, and refine models used to predict environmental changes or assess the impacts of human activity on natural systems. This integrated approach promotes a more comprehensive understanding of complex Earth processes, enabling better-informed decision-making and effective management strategies for sustainable development. However, preprocessing and combining in situ data from different sources can be highly complex, especially for global datasets. Joining this data with remotely sensed products may require substantial computational resources, given the increased number of observational records and high temporal resolutions. Here, we present a prototype of such a pipeline, CULTIVATE, an open-source data-processing pipeline that efficiently cleans in situ records and combines them with remote sensing data to create an automatically curated database. As new in situ data records are inserted, CULTIVATE updates only those records in the final database. In this presentation, we showcase CULTIVATE for over 200,000 global groundwater well observation time series that are merged with an extensive list of other time-series products, and we show how data curators can interact with the data processing pipeline. We further discuss how this prototype can serve as a blueprint for future architecture development for Research Data Infrastructures, how we can implement and enforce international standards, and how we can enable global datacenters to utilize automated data preparation in operational settings.

How to cite: Reinecke, R., Bäthge, A., Noack, D., Zink, M., Mischel, S., and Dietrich, S.: A prototype Open-Source data-processing pipeline to efficiently combine in-situ data with remote-sensing observations of the Earth, EGU General Assembly 2026, Vienna, Austria, 3–8 May 2026, EGU26-6238, https://doi.org/10.5194/egusphere-egu26-6238, 2026.

EGU26-7115 | ECS | Posters on site | ESSI2.7

STeMP: Spatio-Temporal Modelling Protocol 

Jan Linnenbrink, Jakub Nowosad, Marvin Ludwig, and Hanna Meyer

Spatio-temporal predictive modelling is a key method in the geosciences. Often, machine-learning, which can be applied to complex, non-linear and interacting relationships, is preferred over classical (geo)statistical models. However, machine-learning models are often perceived as "black boxes", meaning that it is hard to understand their inner workings. Furthermore, there are several pitfalls associated with the application of machine-learning models in general, and spatio-temporal machine-learning models in particular. This might, e.g., concern the spatial autocorrelation inherent in spatial data, which complicates data splitting for model validation. 

Following from this, it is key to transparently report spatio-temporal models. Transparent reporting can facilitate interpreting, evaluating and reproducing spatio-temporal models, and can be used to determine their suitability for a specific research question. Standardized model protocols are particularly valuable in this context, as they document model parameters, decisions and assumptions. While such protocols exist for machine-learning models in general (e.g., Model Cards, REFORMs), as well as for specific domains like species distribution modelling (ODMAP), such protocols are lacking in the general field of spatio-temporal modelling. 

Here, we present ideas for STeMP (Spatio-Temporal Modelling Protocol), a protocol for spatio-temporal models that fills this gap. The protocol is designed to be beneficial for all parties involved in the modeling process, including model developers, maintainers, reviewers, and end-users. The protocol is implemented as a web application and is structured in three sections: Overview, Model and Prediction. The Overview section contains general metadata, while the following two sections go into more detail. The Model section includes modules describing, for example, the predictors, model validation procedures, and software. The optional Prediction section contains information about the prediction domain, map evaluation, and uncertainty assessment.

To make the protocol useful during model development, warnings are raised when common pitfalls are encountered (e.g., if an unsuitable cross-validation strategy is used). These warnings can be automatically retrieved from a filled protocol, spotlighting potential issues and helping authors and reviewers. Moreover, we provide the optional possibility to generate automated reports and also inspection figures from user-provided inputs (e.g., from model objects as well as from training and test data sets). The protocol is hosted on GitHub (https://github.com/LOEK-RS/STeMP) and hence open to flexible incorporation of feedback from the broader community.

With our presentation, we aim to encourage the discussion of our proposed model report in the spatio-temporal modelling community.

How to cite: Linnenbrink, J., Nowosad, J., Ludwig, M., and Meyer, H.: STeMP: Spatio-Temporal Modelling Protocol, EGU General Assembly 2026, Vienna, Austria, 3–8 May 2026, EGU26-7115, https://doi.org/10.5194/egusphere-egu26-7115, 2026.

EGU26-9928 | Orals | ESSI2.7

Research data infrastructure evolution for handling km scale simulations of a warming world 

Kameswarrao Modali, Karsten Peters-von Gehlen, Fabian Wachsmann, Florian Ziemen, Carsten Hinz, Rajveer Saini, and Siddhant Tibrewal

With the advancement of technical capabilities, Earth System Models (ESM) are rapidly moving toward much higher spatial resolutions - down to kilometer scale - to better capture key processes and feedbacks needed for robust climate impact assessments. This growing model complexity places significant demands on data infrastructures, which must evolve to support widespread application of  high-resolution simulations.

This evolution is needed across various stages of the ESM simulation data life cycle, right from the choice of the variables that need to be part of the simulation output, the format of the output, residence period and transfer of the data across various active storage tiers and the final movement to the cold storage tier (tapes) for long time archival. Also tools to handle the discoverability of these data must be developed and implemented. The evolution of the infrastructure also must take hardware constraints into account and should ideally be in line with the FAIR principles.

As part of the Warm World Easier project, these developments were the adaptation of the model output to zarr, a cloud native format, the development of bespoke tools like ‘zarranalyzer’ to handle the movement of the data across storage tiers by creating tarballs suitable also for the tapes, creating reference files for these tarballs in parquet format to summarize the entire dataset and the inception of these into a metadata catalog following the SpatioTemporal Asset Catalog (STAC) standard. Finally, a virtual machine to host the STAC catalog with appropriate access rights for the data providers and data curators within the federated structure, as well as the end users, was set up. 

Applying this data handling concept to km-scale ESM data bridges the gap between infrastructures that produce flagship datasets and those that enable their efficient and reliable reuse by the community. For example, data generated at large, compute-focused HPC centers with limited storage could be transferred to partner centers that provide specialized data services for long-term access and reuse. 

Through the federated and seamless setup of the research data infrastructure, data handling matters are abstracted away from the data users. Hence, the developed setup provides an end to end solution, achieving the objective of providing the km scale ESM simulation output to a broader scientific community tackling the urgent societal problems arising due to a warming planet.

How to cite: Modali, K., Peters-von Gehlen, K., Wachsmann, F., Ziemen, F., Hinz, C., Saini, R., and Tibrewal, S.: Research data infrastructure evolution for handling km scale simulations of a warming world, EGU General Assembly 2026, Vienna, Austria, 3–8 May 2026, EGU26-9928, https://doi.org/10.5194/egusphere-egu26-9928, 2026.

EGU26-11128 | Orals | ESSI2.7

Antflow: Simplifying Workflow Sharing and Execution for Digital Twins 

Nicolas Choplain and Gaudissart Vincent

Antflow is a next-generation orchestration and publication framework designed to streamline the operational deployment of Earth Observation (EO) processing workflows, particularly within Digital Twin environments. By automating the transformation of scientific code into interoperable, shareable, and scalable services, Antflow removes the traditional barriers between algorithm development and production-grade execution.

At its core, Antflow enables scientists and developers to publish complex workflows directly from their Git repositories, using OGC Earth Observation Application Packages (EOAP) as the workflow definition mechanism. These EOAP descriptions allow Antflow to instantly expose workflows as OGC API Processes services, enriched with dynamic user interfaces and STAC-compliant cataloguing of outputs. This ensures that every workflow - no matter how experimental or mature - can be discovered, reused, and integrated across Digital Twin platforms.

Antflow’s hybrid orchestration engine distributes tasks across heterogeneous computing environments, from HPC clusters to cloud-native nodes. Git-based lineage guarantees traceability and scientific integrity, while integrated multi-provider retrieval mechanisms (EODAG) simplify access to EO data sources.

A key strength of Antflow is its ability to generate interactive user interfaces automatically. These interfaces allow domain experts, integrators, and end-users to parameterize, run, and monitor workflows through clean, intuitive views.

Antflow is currently used across several projects (CNES Digital Twin Factory, OGC Open Science Persistent Demonstrator). It acts as a middleware layer that bridges algorithm design, operational integration, and stakeholder consumption. By standardizing workflow publication, ensuring reproducibility, and supporting scalable execution, it accelerates the deployment of modelling chains such as 3D environmental reconstruction, forecasting, and multi-sensor analysis workflows.

How to cite: Choplain, N. and Vincent, G.: Antflow: Simplifying Workflow Sharing and Execution for Digital Twins, EGU General Assembly 2026, Vienna, Austria, 3–8 May 2026, EGU26-11128, https://doi.org/10.5194/egusphere-egu26-11128, 2026.

EGU26-11759 | ECS | Posters on site | ESSI2.7

Accelerating Earth System Workflows with In Situ Workflow Task Management 

Manuel Giménez de Castro Marciani, Mario Acosta, Gladys Utrera, Miguel Castrillo, and Mohamed Wahib

Modern experimentation with Earth System Models (ESMs) is accelerated by the employment of automated workflows to handle the multiple steps such as simulation execution, post-processing, and cleaning, all while being portable and tracking provenance. And when executing on shared HPC platforms, users usually face long queue times, which increase the time to solution. The community has proposed to aggregate workflow tasks into a single submission in order to save in queue time with promising results. But by doing this the workflow manager has to deal with the remote task execution that otherwise would have been done by the HPC scheduler.

Therefore, we propose to integrate two workflow managers to create a versatile and general solution for the execution of these aggregated workflows: one that orchestrates the workflow globally and another that is in charge of running tasks within an allocation, which we refer to as "in situ."

In this work, we performed a qualitative and quantitative comparison of three suitable and representative workflow and workload managers running in situ, HyperQueue, Flux, and PyCOMPSs, on three of the top 20 HPCs: Lumi, MareNostrum 5, and Fugaku. We evaluated the portability and setup, failure tolerance, programmability, and provenance tracking of each of the tools in the qualitative part. In the quantitative part, we measured total runtime, task runtime, CPU and memory usage, disk write, and node imbalance of workflows running a memory-bound, a CPU-bound, and an IO-intensive application.

Our initial results yield recommendations to the community as to which workflow manager to use in situ. HyperQueue's easy installation and portability makes it the best solution for non-x86 platforms. Flux had the easiest running setup due to its preparedness to run nested in Slurm. Finally, PyCOMPSs is the only tool out of the three to provide provenance tracking with RO-Crates.

How to cite: Giménez de Castro Marciani, M., Acosta, M., Utrera, G., Castrillo, M., and Wahib, M.: Accelerating Earth System Workflows with In Situ Workflow Task Management, EGU General Assembly 2026, Vienna, Austria, 3–8 May 2026, EGU26-11759, https://doi.org/10.5194/egusphere-egu26-11759, 2026.

EGU26-12058 | ECS | Orals | ESSI2.7

Optimizing the Destination Earth Workflow with in situ HPC Task Orchestration 

Pablo Goitia, Manuel Giménez de Castro Marciani, and Miguel Castrillo

Traditionally, climate simulations are executed on High-Performance Computing (HPC) platforms, organized in workflows that involve all the steps for the complete execution of the model, data processing, and management tasks. With the sustained increase in the computing capacity of these machines over the years, the accuracy and resolution of climate simulations have reached levels never seen before.

In this context, the European Commission launched the Destination Earth initiative, aimed at developing a digital twin of the Earth for the adaptation to climate change. This initiative seeks to operationalize the running of very high-resolution climate simulations that are coupled with applications that consume their data as it is produced. In order to address the challenge of processing the hundreds of terabytes that each single simulation involves, the ClimateDT project implemented a data streaming approach. This means that any delay between the production time of the climate model data and the subsequent consumption by the post-processing applications results in a workflow misalignment, leading to unacceptable delays in the total execution time. This poses unprecedented challenges on the workflow management side.

One of the main causes of the misalignments that commonly occur lies in the long time that each of the many thousands of tasks of the workflow spends in the queues of the HPC job schedulers, such as Slurm. To address this issue, the community proposed to aggregate workflow tasks into a single submission to the HPC without altering their execution logic—a technique known as task aggregation. Previous studies have demonstrated the effectiveness of this approach for climate workflows, yielding promising results. However, the current implementation is limited, as the task execution within an allocation still relies on the workflow manager, which is not able to perform the fine-grained workflow orchestration that a dedicated tool could do in a convenient way.

To overcome this limitation, we propose in this work to integrate existing HPC software into the Autosubmit Workflow Manager to enable in situ orchestration of aggregated tasks, such as the renowned Flux Framework and Parsl. This integration aims to abstract both developers and users from the complexity of managing supercomputing resources, providing an easy-to-use interface. The proposed approach is validated using the Destination Earth workflow to enable more complex, structured forms of task aggregation while reducing queue times in large-scale simulations.

How to cite: Goitia, P., Giménez de Castro Marciani, M., and Castrillo, M.: Optimizing the Destination Earth Workflow with in situ HPC Task Orchestration, EGU General Assembly 2026, Vienna, Austria, 3–8 May 2026, EGU26-12058, https://doi.org/10.5194/egusphere-egu26-12058, 2026.

EGU26-14853 | ECS | Posters on site | ESSI2.7

AutoML: A Flexible and Scalable HPC Framework for Efficient Machine Learning in Atmospheric Modelling 

Isidre Mas Magre, Hervé Petetin, Alessio Melli, James Petticrew, Michael Orieux, Miguel Hortelano, Luiggi Tenorio, and David Mathas

The integration of Machine Learning (ML) into Earth System Sciences has revolutionized predictive modeling. However, the transition from local prototyping to large-scale deployment is often hindered by fragmented codebases and the manual overhead of managing complex hyperparameter tuning on High-Performance Computing (HPC) clusters. We present AutoML, a framework developed to automate and standardize the ML lifecycle in HPC environments by leveraging the open-source Autosubmit workflow manager.

AutoML employs a configuration-driven architecture that decouples model logic from workflow execution. By utilizing Autosubmit’s proven capability to handle complex dependencies and remote HPC environments, AutoML allows researchers to scale experiments—from initial prototyping to production-level global pipelines—through a single configuration file. This approach directly addresses the challenge of experiment reproducibility and efficiency within ML projects. The framework automates critical steps in the typical ML workflow, including hyperparameter search space optimization, multi-node distributed training, and dynamic resource allocation on heterogeneous HPC architectures.

We demonstrate the framework’s utility through Atmospheric Composition applications at the Barcelona Supercomputing Center (BSC). By providing a standardized structural template AutoML fosters collaboration and ensures that advancements in machine learning for atmospheric science are scalable, computationally efficient, and transferable across research lines.

How to cite: Mas Magre, I., Petetin, H., Melli, A., Petticrew, J., Orieux, M., Hortelano, M., Tenorio, L., and Mathas, D.: AutoML: A Flexible and Scalable HPC Framework for Efficient Machine Learning in Atmospheric Modelling, EGU General Assembly 2026, Vienna, Austria, 3–8 May 2026, EGU26-14853, https://doi.org/10.5194/egusphere-egu26-14853, 2026.

EGU26-15002 | Orals | ESSI2.7

Toward Federated Agentic Workflows for Numerical Weather Prediction With Chiltepin 

Christopher Harrop and Isidora Jankov

The development of efficient, scalable, and interoperable workflow management systems is critical for supporting reproducible research to drive the scientific advancement of earth system modeling capabilities. Many workflow systems targeted for earth system science have been developed to meet that challenge, each having similar capabilities as well as some unique strengths. However, the earth system modeling community now faces additional challenges that impose new requirements. The landscapes of both high performance computing (HPC) environments and numerical modeling are evolving rapidly. HPC systems are composed of a growing diversity of hardware architectures that may be hosted on-prem or by a variety of cloud vendors. Earth model system components are also increasing in diversity as research to augment or replace traditional physics based models with machine learning models progresses. Additionally, a growing diversity of end-users with varying levels of knowledge and expertise require agentic workflows that can respond to their requests. A consequence of this rapid growth in diversity is a growing need to run workflows that span multiple systems in order to optimize data locality and access to resources that maximize performance of specific model components. The availability of, and requirement for, diversity naturally leads to a requirement for federated workflows that effectively harness the computational power of a diverse set of resources distributed both geographically and across multiple administrative domains. In this presentation, we introduce and report our progress with the development of Chiltepin, the first known federated numerical weather prediction workflow system within the National Oceanic and Atmospheric Administration (NOAA). Chiltepin is designed to address key challenges in numerical modeling, particularly those related to sustainable progress in a changing NWP landscape characterized by increasing diversity of technologies and use of high-performance computing resources distributed across both geographical and administrative boundaries.

How to cite: Harrop, C. and Jankov, I.: Toward Federated Agentic Workflows for Numerical Weather Prediction With Chiltepin, EGU General Assembly 2026, Vienna, Austria, 3–8 May 2026, EGU26-15002, https://doi.org/10.5194/egusphere-egu26-15002, 2026.

EGU26-17077 | Posters on site | ESSI2.7

ARCA: A Scalable and Reproducible AI-Driven Workflow Platform for Climate Change and Natural Hazard Applications 

Maria Mirto, Marco De Carlo, Shahbaz Alvi, Shadi Danhash, Antonio Aloisio, and Paola Nassisi

Earth System Sciences (ESS) are increasingly characterized by large data volumes and high computational demands, which make complex analyses difficult to manage using ad hoc or manual solutions. This challenge is amplified when heterogeneous data sources, such as Internet of Things (IoT) infrastructures including wireless sensor networks, video cameras and drones, must be combined with high-performance computing (HPC) environments for climate modelling and advanced artificial intelligence (AI) algorithms.

The ARCA (Artificial Intelligence Platform to Prevent Climate Change and Natural Hazards) project, funded by the Interreg IPA ADRION Programme, was designed to respond to these challenges by providing a practical, workflow-based platform aimed at supporting climate change and natural hazard applications and, ultimately, reducing their impacts. The main objective of ARCA is to strengthen the cross-border operational capacity of stakeholders across the Adriatic–Ionian region, involving Italy, Croatia, Montenegro, Albania, Serbia and Greece. The platform supports the monitoring of forest ecosystems through AI-based tools, enabling continuous observation of forest areas and the prediction of multiple natural hazards, including droughts, wildfires and windstorms.

ARCA is built on a modular architecture centered on scientific workflows, which orchestrate multiple-type data ingestion, processing, analysis and AI model execution in a consistent and reproducible manner. The platform integrates big data technologies, workflow management systems and AI components, allowing complex processing chains to be automated while ensuring full traceability of data provenance, computational steps and model configurations. This approach supports FAIR principles and promotes the reuse of data and workflows across different applications and computing environments.

A key strength of ARCA lies in its ability to shield users from much of the underlying technical complexity, such as heterogeneous computing resources, access constraints and large data volumes, while still enabling scalable AI-driven analyses. As a result, researchers and practitioners can focus on scientific and operational questions related to climate impacts and hazard prevention rather than on low-level technical orchestration. In this contribution, we present the overall ARCA architecture together with selected use cases, illustrating how workflow-based approaches can effectively support scalable, transparent and reproducible ESS research in a multinational and federated context like the Adriatic–Ionian region.

How to cite: Mirto, M., De Carlo, M., Alvi, S., Danhash, S., Aloisio, A., and Nassisi, P.: ARCA: A Scalable and Reproducible AI-Driven Workflow Platform for Climate Change and Natural Hazard Applications, EGU General Assembly 2026, Vienna, Austria, 3–8 May 2026, EGU26-17077, https://doi.org/10.5194/egusphere-egu26-17077, 2026.

EGU26-17974 | Orals | ESSI2.7

Multi-target process dispatch on the European Digital Twin of the Ocean  

stella valentina Paronuzzi ticco, Quentin Gaudel, Alain Arnaud, Jerome Gasperi, Mathis Bertin, and Victor Gaubin

The EDITO platform serves as the foundational framework for building the European Digital Twin of the Ocean. It seamlessly integrates oceanographic data and computational processes (non-interactive remote functions that take input and produce output) on a single platform that relies on both cloud and HPC (EuroHPC) resources. In this context, EDITO already provides many processes, such as OceanBench model evaluation and the ML-based GLONET 10-day forecast. To make scientists' work easier, we have developed a new way of generating processes on EDITO. We will use OceanBench evaluation as an example of a process that can be dispatched by the user on multiple targets, seamlessly handling the technical complexity of dealing with different hardware (cloud CPUs/GPUs, HPC, etc.). In our presentation we will explain how EDITO contributors will benefit from this new method of generating processes.   

How to cite: Paronuzzi ticco, S. V., Gaudel, Q., Arnaud, A., Gasperi, J., Bertin, M., and Gaubin, V.: Multi-target process dispatch on the European Digital Twin of the Ocean , EGU General Assembly 2026, Vienna, Austria, 3–8 May 2026, EGU26-17974, https://doi.org/10.5194/egusphere-egu26-17974, 2026.

EGU26-18841 | ECS | Posters on site | ESSI2.7

Efficient large-scale data structuring to support Earth System Science analytics workflows 

Donatello Elia, Gabriele Tramonte, Cosimo Palazzo, Valentina Scardigno, and Paola Nassisi

The amount of data produced by Earth System Model (ESM) is continuously growing, driven by their higher resolution and complexity. Approaches for efficient data access, management, and analysis are, thus, needed now more than ever to tackle the challenges related to these large volumes. Moreover, data generated by ESM simulations could be organized in a way that is not the most effective for data analytics, slowing down scientists’ productivity. In this context, novel data formats and proper chunking strategies can significantly speed up access and processing of Earth system data and, in turn, the whole analysis workflow. 

In the scope of ESiWACE3 - Centre of Excellence in Simulation of Weather and Climate in Europe - we experimented the impact of different data formats and chunking configurations on high-performance data analytics operations/workflows. In particular, we evaluated performance of the well-known NetCDF format and the more recent cloud-native Zarr format, which is being increasingly used in Earth Science data analytics workflows and machine learning applications. Results show that the use of a proper data format and structure can noticeably reduce the time required for executing these analytics workflows, provided the structure is carefully tuned (e.g., chunking).

The work presents the main outcomes of such evaluation and how we are exploiting this knowledge to enhance Earth system data management workflows. In particular, the results achieved have contributed to enabling a more efficient access, delivery and analysis of large-scale data in CMCC’s tools and services, which are involved in different initiatives, including the ICSC - National Centre on High Performance Computing, Big Data and Quantum Computing.

How to cite: Elia, D., Tramonte, G., Palazzo, C., Scardigno, V., and Nassisi, P.: Efficient large-scale data structuring to support Earth System Science analytics workflows, EGU General Assembly 2026, Vienna, Austria, 3–8 May 2026, EGU26-18841, https://doi.org/10.5194/egusphere-egu26-18841, 2026.

EGU26-19451 | ECS | Posters on site | ESSI2.7

Making Kilometer-Scale Earth System Model (ESM) simulations usable: A workflow approach from European Eddy RIch ESMs (EERIE) project. 

Chathurika Wickramage, Fabian Wachsmann, Jürgen Kröger, Rohith Ghosh, and Matthias Aengenheyster

Kilometer-scale global climate simulations are now generating petabytes of output at such a rapid pace that data production is surpassing data standardization. Central ESM infrastructures have traditionally followed a “data warehouse” approach: extensive preprocessing, quality control, and formatting are performed before users receive self-describing, FAIR-aligned files. While this delivers highly standardized and interoperable products, it also creates a growing bottleneck, computationally and organizationally, so that routine actions like checking variables, extracting a region and time slice, or comparing experiments can become slow, and hard to reproduce in practice. The EERIE project (https://eerie-project.eu/about/) is a clear example: its eddy-rich Earth System Models generate detailed and valuable output, but at a scale and pace that overwhelms traditional file-by-file workflows and delays usable access.

At DKRZ, we address this with an end-to-end workflow that transforms raw EERIE model output into analysis-ready datasets (ARD) that are easy to discover, subset, and analyze without requiring users to copy or download terabytes of files. The central element of this workflow is to create virtual Zarr datasets of the raw model output received from the modeling groups, by extracting chunk information and storing them in the kerchunk format with VirtualiZarr (https://virtualizarr.readthedocs.io/en/stable/index.html). These native-grid virtual datasets are published through both an intake catalog (https://github.com/eerie-project/intake_catalogues) and a STAC (SpatioTemporal Asset Catalog; https://discover.dkrz.de/external/stac2.cloud.dkrz.de/fastapi/collections/eerie?.language=en) interface, enabling users to examine variables, time period, regions etc., and retrieve only the subset they need while the bulk remains in place. Alongside native model-grid resolution, the data is also provided on a common ¼ degree regular grid to facilitate inter-model comparison.  Finally, we employ widely used standards and publish standardized products through established climate-data services (ESGF; https://esgf-metagrid.cloud.dkrz.de/search and WDCC; https://www.wdc-climate.de/ui/project?acronym=EERIE). We also aim to publish the processing scripts used throughout the pipeline, enabling others to build on the lessons learned from the EERIE approach.

How to cite: Wickramage, C., Wachsmann, F., Kröger, J., Ghosh, R., and Aengenheyster, M.: Making Kilometer-Scale Earth System Model (ESM) simulations usable: A workflow approach from European Eddy RIch ESMs (EERIE) project., EGU General Assembly 2026, Vienna, Austria, 3–8 May 2026, EGU26-19451, https://doi.org/10.5194/egusphere-egu26-19451, 2026.

EGU26-20269 | Posters on site | ESSI2.7

Federated AI-Cubes: Towards Democratizing Big Earth Datacube Analytics 

Peter Baumann, Dimitar Misev, Bang Pham Huu, and Vlad Merticariu

Datacubes are an acknowledged cornerstone for analysis-ready Big Earth Data as they allow more intuitive, powerful services than zillions of "scenes". By abstracting from technical pains they offer two main advantages: for users, it gets more convenient; servers can dynamically optimize, orchestrate, and distribute processing.
We propose a combination of datacube service enhancements which we consider critical for making data exploitation more open to non-experts and more powerful, summarized as "Federated AI-Cubes": 

  • Location-transparent federation allows users and tools to perceive all datacube assets as a single dataspace, making distributed data fusion a commodity. Instrumental for this is automatic data homogenization performed at import and at query time, based on the open Coverage standards.
  • High-level datacube query languages, such as SQL/MDA and ISO/OGC WCPS, simplify analysis and open up data exploitation to non-programmers. Server-side optimization can automatically generate the individually best distributed workflow for every incoming query. At the same time, queries document workflows without low-level technical garbage, making them reproducible. 
  • The seamless integration of AI into datacube analytics plus AI-assisted query writing open up new opportunities for zero-coding exploitation. By not hardwiring a particular model a platform for easy-to-use model sharing emerges. Model Fencing, a new research direction, aims at enabling the server to estimate accuracy of ML model inference embedded in datacube queries. 
  • Standards-based interoperability allows users to remain in the comfort zone of their well-known clients, from map browsing over QGIS and ArcGIS up to openEO, R, and python frontends.
  • Cloud/edge integration opens up opportunities for seamless federation of data centers with moving data sources, such as satellites, including flexible onboard processing.

In summary, these capabilities together have potential for empowering non-experts and making experts more productive, ultimately democratizing Big Earth Data exploitation and widening Open Science.
In our talk, we discuss these techniques based on their implementation in the rasdaman Array DBMS, the pioneer datacube engine, which is operational on multi-Petabyte global assets contributed by research centers in Europe, USA, and Asia. We present challenges and results, supported by live demos many of which are public. Additionally, being editor of the OGC and ISO coverage standards suite, we provide an update on recent progress and future developments.
This research is being co-funded by the European Commission through EFRE projects FAIRgeo and SkyFed.

How to cite: Baumann, P., Misev, D., Pham Huu, B., and Merticariu, V.: Federated AI-Cubes: Towards Democratizing Big Earth Datacube Analytics, EGU General Assembly 2026, Vienna, Austria, 3–8 May 2026, EGU26-20269, https://doi.org/10.5194/egusphere-egu26-20269, 2026.

EGU26-21194 | ECS | Posters on site | ESSI2.7

PHENOMENA: a modular HPC model to facilitate automatic high-resolution greenhouse gas emission monitoring 

Carmen Piñero-Megías, Laura Herrero, Artur Viñas, Johanna Gehlen, Luca Rizza, Ivan Lombardich, Oliver Legarreta, Òscar Collado, Paula Camps, Aina Gaya-Àvila, Marc Guevara, Paula Castesana, and Carles Tena

This work presents the sPanisH EmissioN mOnitoring systeM for grEeNhouse gAses (PHENOMENA), a python-based, open-source, multiscale emission model that computes high resolution (up to 1km2 and daily) and low latency greenhouse gas (GHG) emissions for Spain. The system uses a bottom-up approach, based on emission factors and activity data, and consists of four different modules: First, the downloading module retrieves low latency activity data from multiple sources, including APIs, open data repositories, websites, and private providers, with error handling and automatic retrials to minimize manual intervention. Next, the preprocessing module standardizes the data and applies quality-control checks. The activity data is then combined with emission factors in the calculation module, which covers 11 emission sectors. Finally, the resulting emissions are post-processed to meet the requirements of an open web platform where the results are displayed.

PHENOMENA is based on the OOP paradigm and designed to run on High Performance Computing (HPC) infrastructures. While each one of the emission sectors can run in parallel using MPI strategies, it is still not feasible to run all of them at the same time or download all the activity data at once, as different data providers have different temporal availability. Thanks to the modularity of the system, it can be split into different HPC jobs to handle the heterogeneous data frequencies, increase robustness through automatic retrials, run different instances at the same time and automatize monthly uploads to the web portal, using the Autosubmit workflow manager.

The resulting product is a web app which provides daily 1 km x 1 km gridded emission maps and emission totals aggregated per region and sector. The system's latency is determined by the availability of the activity data from external providers, ranging from daily updates to delays of up to four months.

PHENOMENA allows monitoring low-latency GHG emissions for Spain at high temporal and spatial resolution, providing information in an accessible way to support national to local policymakers. The system is scalable, robust against failures, and easily adaptable to new data providers, regions and emission sectors.

How to cite: Piñero-Megías, C., Herrero, L., Viñas, A., Gehlen, J., Rizza, L., Lombardich, I., Legarreta, O., Collado, Ò., Camps, P., Gaya-Àvila, A., Guevara, M., Castesana, P., and Tena, C.: PHENOMENA: a modular HPC model to facilitate automatic high-resolution greenhouse gas emission monitoring, EGU General Assembly 2026, Vienna, Austria, 3–8 May 2026, EGU26-21194, https://doi.org/10.5194/egusphere-egu26-21194, 2026.

The current era of Earth Observation (EO) is marked by an unprecedented increase in data volume and a growing number of satellite missions, driving a transition from dedicated processing infrastructure to cloud-native, distributed, and scalable orchestration. As Earth System Science, industry, and society increasingly rely on near-real-time EO data, efficient processing and workflow management have become critical components of modern ground segments. This presentation introduces an operational framework designed to meet the challenges of large-scale EO data processing. Examples from the Copernicus Sentinel programme and ESA’s Earth Explorer missions illustrate the framework’s scalable cloud deployment and operational performance. Common challenges - such as handling geospatial data formats, managing ground-segment anomalies, ensuring cybersecurity, providing standardized service interfaces, and leveraging public-cloud infrastructure - are addressed through a unified workflow approach. Operational experience from Copernicus payload data ground segment services, including monitoring via dashboards and control procedures, serves as a model for scientific missions and initiatives adopting these proven concepts. Scalability has emerged as a key feature, enabling efficient data transfers for the Copernicus Long-Term Archive, data access for Copernicus services, and higher-level processing workflows for scientific missions like BIOMASS. These orchestration strategies optimize resource use and energy efficiency for on-demand processing. The generic processing concepts demonstrated in the Copernicus and Earth Explorer programmes offer inspiration for new applications within the Earth System Science community, including hybrid approaches that integrate observations and simulation data.

How to cite: Hofmeister, R.:  A unified framework for large-scale, operational data processing in Earth Observation, EGU General Assembly 2026, Vienna, Austria, 3–8 May 2026, EGU26-21804, https://doi.org/10.5194/egusphere-egu26-21804, 2026.

EGU26-21909 | ECS | Orals | ESSI2.7

Workflow Modernization for Open and Scalable Access to Operational NWP Data 

Nina Burgdorfer, Christian Kanesan, Victoria Cherkas, Noemi Nellen, Carlos Osuna, Katrin Ehlert, and Oliver Fuhrer

Operational Numerical Weather Prediction (NWP) workflows are increasingly challenged by rapidly growing data volumes, expanding product diversity, and the need for timely and scalable access to model data. At the same time, modern Earth system services are evolving toward open data policies that require not only standardized access to model output for internal and external users, but also flexible mechanisms to extract and process relevant information in a FAIR (Findable, Accessible, Interoperable, and Reusable) manner. In this context, MeteoSwiss, in collaboration with the European Centre for Medium-Range Weather Forecasts (ECMWF), is developing a modernized data workflow to improve access to NWP model data for internal and external downstream users. 

The redesigned workflow shifts from a product-centric dissemination model toward a scalable data-as-a-service approach. Rather than relying on the generation and distribution of numerous predefined products, recent ICON forecast output is organized in the Field Database (FDB) and exposed through Polytope, which provides semantic data access and feature extraction capabilities. The workflow automates the ingestion, indexing, access control, and on-demand extraction of forecast fields, and integrates these steps into existing HPC-based production workflows and downstream processing pipelines. By replacing file-based product generation with database-backed access, the workflow enables deterministic data extraction, explicit provenance tracking, and consistent versioning of datasets, so that identical data requests can be reproduced reliably across time and environments. We present recent developments in Earthkit and Polytope that, for the first time, enable such automated workflows on the icosahedral grids used by ICON. Standardized interfaces and modern processing tools from the Earthkit Python ecosystem enable downstream users and applications to retrieve and process tailored subsets of NWP data on demand. 

Our use of open-source, community-developed software (FDB, Polytope, Earthkit) as core workflow components illustrates how ECMWF technologies can be integrated into national weather service environments. Operational experience gained in this context contributes to improving the maturity and usability of these tools and supports their broader adoption by other ECMWF Member States, facilitating the transfer of FAIR, workflow-based data access concepts across the weather and climate community. 

How to cite: Burgdorfer, N., Kanesan, C., Cherkas, V., Nellen, N., Osuna, C., Ehlert, K., and Fuhrer, O.: Workflow Modernization for Open and Scalable Access to Operational NWP Data, EGU General Assembly 2026, Vienna, Austria, 3–8 May 2026, EGU26-21909, https://doi.org/10.5194/egusphere-egu26-21909, 2026.

EGU26-22151 | ECS | Posters on site | ESSI2.7

Earthscope Seafloor Geodesy Tools 

Franklyn Dunbar, Mike Gottlieb, Rachel Akie, and David Mencin

Earth System Science increasingly depends on scalable, reproducible computational workflows to manage complex data processing across heterogeneous environments and cloud infrastructure. In seafloor geodesy — a domain where high-resolution geodetic time series and acoustic ranging techniques are essential for understanding submarine tectonic and deformation processes — the need for robust, automated tooling is acute. We present Earthscope Seafloor Geodesy Tools, an open-source Python library developed by Earthscope consortium that supports preprocessing and GNSS-A processing workflows for seafloor geodesy data collected via autonomous wave glider platforms.
Earthscope Seafloor Geodesy Tools, provides modular utilities to translate, organize, validate, and prepare raw observational data for integration with GNSS-A positional solver inversion software (e.g., GARPOS), enabling reproducible, data pipelines within research and operational contexts. By encapsulating domain-specific processing steps into composable components, Earthscope Seafloor Geodesy Tools, enables workflow orchestration and large scale data processing across environments (i.e. local vs remote) and reproducibility of results.

How to cite: Dunbar, F., Gottlieb, M., Akie, R., and Mencin, D.: Earthscope Seafloor Geodesy Tools, EGU General Assembly 2026, Vienna, Austria, 3–8 May 2026, EGU26-22151, https://doi.org/10.5194/egusphere-egu26-22151, 2026.

EGU26-511 | ECS | Orals | CL5.8

Satellite-based detection of agricultural flash droughts and their ecosystem impacts in southeastern South America 

Lumila Masaro, Miguel A. Lovino, M. Josefina Pierrestegui, Gabriela V. Müller, and Wouter Dorigo

Flash droughts are rapid-onset events that develop within weeks, imposing severe and often unexpected impacts on agriculture. Their monitoring remains challenging due to several factors, including the scarcity of root-zone soil moisture (RZSM) observations and the lack of methodological consensus. This study has two main objectives: (1) to evaluate the applicability of the European Space Agency Climate Change Initiative Combined Root-Zone Soil Moisture product (ESA CCI COM RZSM) for detecting agricultural flash droughts (AFDs) across southeastern South America (SESA), and (2) to assess how satellite-based indicators obtained from the Moderate Resolution Imaging Spectroradiometer (MODIS) capture their physical evolution and agricultural impacts.

We apply two complementary AFD detection frameworks to ESA CCI COM and ERA5 RZSM data for 1979–2022: a statistical percentile-based approach and a physically based formulation derived from the Soil Water Deficit Index (SWDI). The percentile method detects AFDs as rapid transitions from above-normal to below-normal soil moisture. The SWDI identifies events through shifts from near-optimal water availability to physiological stress based on soil hydraulic properties. To evaluate agricultural impacts, we analyze satellite-derived evapotranspiration (EVT) and vegetation indicators from MODIS for two representative events in central-eastern and northern SESA. Vegetation indicators include the Land Surface Water Index (LSWI), fraction of absorbed Photosynthetically Active Radiation (fPAR), and Gross Primary Productivity (GPP).

Our results suggest that AFD detection is strongly conditioned by both methodological framework and dataset characteristics. The percentile-based approach tends to overestimate AFD occurrence in persistently wet or dry regimes, where small fluctuations are amplified after percentile transformation. In contrast, the SWDI-based approach preserves regional hydroclimatic gradients and provides a physically consistent representation of plant water stress. Regarding the dataset, ESA CCI COM RZSM captures the main spatial patterns and seasonal cycles of soil moisture depicted by ERA5 across SESA. However, it exhibits smoother short-term variability, delayed drying, and lower absolute soil moisture than ERA5, which could be attributed to the empirical filtering used to propagate surface signals into deeper layers.

Satellite-derived indicators effectively capture the evolution of AFDs across SESA. Soil moisture depletion is followed by reductions in EVT as ecosystems transition from energy- to water-limited conditions. Vegetation indicators respond shortly thereafter: LSWI reveals declining canopy water content, fPAR shows reduced photosynthetic activity, and GPP reflects suppressed ecosystem productivity. The magnitude and spatial extent of these impacts depend on antecedent soil moisture and land-cover type, highlighting the importance of background conditions in modulating drought severity.

Overall, the results demonstrate that ESA CCI COM RZSM provides valuable information for regional AFD monitoring when its physical limitations are considered. The coherence among soil moisture, surface fluxes, and biological responses highlights the potential of satellite observations to track the onset, intensification, and agricultural consequences of AFDs. These results strengthen the use of multi-sensor satellite systems for operational early-warning applications and impact assessment across climate-sensitive agricultural regions such as SESA.

How to cite: Masaro, L., Lovino, M. A., Pierrestegui, M. J., Müller, G. V., and Dorigo, W.: Satellite-based detection of agricultural flash droughts and their ecosystem impacts in southeastern South America, EGU General Assembly 2026, Vienna, Austria, 3–8 May 2026, EGU26-511, https://doi.org/10.5194/egusphere-egu26-511, 2026.

EGU26-1232 | ECS | Orals | CL5.8

Evaluating Divergent Evapotranspiration Feedbacks to Warming Across Water- and Energy-Limited Regimes 

Marco Possega, Emanuele Di Carlo, Annalisa Cherchi, and Andrea Alessandri

Land–atmosphere coupling is a central driver of climate variability and extremes, yet Earth System Models (ESMs) struggle to capture the complex interplay between hydrology, vegetation, and surface energy fluxes. In particular, the evapotranspiration–temperature (ET–T) feedback—a key mechanism linking soil moisture, vegetation water use, and near-surface climate—is poorly constrained, limiting confidence in projections of heat extremes and ecosystem stress. Here, we first assess ET–T feedback across a suite of post-CMIP6 ESMs for the historical period (1980–2014) as compared with available GLEAM observations; thereafter the ET-T feedback is investigated in a set of future idealized warming scenarios spanning multiple global temperature targets. To identify the physical and ecohydrological regimes controlling feedback strength, we apply the Ecosystem Limitation Index (ELI), which distinguishes energy-limited from water-limited conditions. Our results reveal a strong negative ET–T feedback in energy-limited regions, where evapotranspiration efficiently cools the surface and stabilizes temperature. In contrast, the feedback reverses in water-limited and transitional regions: here, worsening soil-moisture deficits suppress evaporation and reduce evaporative cooling, thereby amplifying surface warming. Comparison with GLEAM observations highlights regions where models succeed and fail in capturing these feedbacks, particularly in semi-arid ecosystems where land–atmosphere coupling is strongest. Future warming scenarios indicate an expansion of water-limited regimes, weakening negative ET–T feedbacks and reducing the ability of land surface to buffer temperature variability. This shift implies an increased risk of persistent heat extremes, stronger land-surface amplification of warming, and eco-hydrological transitions in sensitive regions. The findings of this study suggest priorities for next-generation ESMs: better representation of soil moisture dynamics, vegetation water-use strategies, and hydrological constraints.  

How to cite: Possega, M., Di Carlo, E., Cherchi, A., and Alessandri, A.: Evaluating Divergent Evapotranspiration Feedbacks to Warming Across Water- and Energy-Limited Regimes, EGU General Assembly 2026, Vienna, Austria, 3–8 May 2026, EGU26-1232, https://doi.org/10.5194/egusphere-egu26-1232, 2026.

Air pollutants can penetrate deep into the lungs, enter the bloodstream, and trigger a cascade of cardiovascular diseases. Elevated pollutant levels in cities are often associated with heavy traffic and industrial emissions, highlighting the need for effective mitigation strategies. Street trees can reduce air pollution through dry deposition, whereby particles are captured by tree canopies in the absence of precipitation. However, city-level models typically assume uniform deposition rates and neglect location-specific variation in tree benefits. Here, we designed a social-ecological systems approach (SES) and revealed substantial spatial disparities in tree-derived air quality benefits within a city. We found that communities with lower urban canopy received fewer air quality benefits. To address these differences, priority tree planting sites were determined using a stepwise framework that takes into account both neighbourhood-level population exposure and social vulnerability. Our findings demonstrate the uneven distribution of urban ecosystem services, emphasizing the importance of integrating environmental justice into urban forestry planning and provide practical guidance on optimizing planting for reducing population exposure to air pollutants. 

How to cite: Cui, S. and Adams, M.: Unequal Canopies, Unequal Benefits: Environmental Justice Implications of Street Tree Air Pollution Mitigation, EGU General Assembly 2026, Vienna, Austria, 3–8 May 2026, EGU26-2092, https://doi.org/10.5194/egusphere-egu26-2092, 2026.

EGU26-2682 | ECS | Posters on site | CL5.8

Constraining Flash Drought Projections Through Land-Atmosphere Coupling 

Yumiao Wang and Yuan Xing

The increasing drought onset speed is driving a global transition toward more frequent flash droughts, presenting unprecedented challenges for drought management and adaptation. However, projected changes in future flash drought characteristics show considerable divergence among climate models. Here, using models from the Coupled Model Intercomparison Project Phase 6 (CMIP6), we demonstrate that models capable of capturing the land-atmosphere coupling gradient between dry and wet soil conditions tend to project more pronounced global transition from slow to flash droughts in the future. This emergent relationship provides a robust constraint for future projections based on observed land-atmosphere coupling characteristics. Our analysis suggests that the societal and environmental risks posed by future flash droughts could be more severe than previously projected. Given the widespread impacts of flash droughts, this study not only enhances our understanding of uncertainties in drought projections, but also holds promise for supporting socio-economic planning and adaptation strategies through constrained projection.

How to cite: Wang, Y. and Xing, Y.: Constraining Flash Drought Projections Through Land-Atmosphere Coupling, EGU General Assembly 2026, Vienna, Austria, 3–8 May 2026, EGU26-2682, https://doi.org/10.5194/egusphere-egu26-2682, 2026.

In 2024, an exceptionally severe abrupt drought-to-flood transition (ADFT) event occurred over Henan Province in central China, causing substantial economic losses due to its abruptness and limited early warning. Although intraseasonal oscillations (ISOs) can provide precursors for forecasting extremes, previous studies have primarily focused on floods or droughts in isolation, leaving the synergistic impacts of multiple ISO modes on drought-to-flood transitions poorly understood. Here we show that the 2024 ADFT event was jointly modulated by two ISO modes with opposite propagation directions. During the drought stage, Rossby wave train maintained a Ural blocking pattern and displaced the westerly jet southward. This circulation configuration suppressed precipitation while enhancing temperature and sensible heat, leading to persistent drought conditions. During the transition-to-flood stage, both the Rossby wave train and the Western Pacific Subtropical High (WPSH) oscillation acted in concert. The southeastward-propagating Rossby wave train disrupted the blocking, while the WPSH oscillation migrated northwestward. Their combined effects shifted the rain belt northward, strengthened southerly moisture transport, increased latent heating, and ultimately triggered the extreme flood. The synergy between these two ISO modes amplified the transition magnitude by 50%, suggesting that the ADFT event would have been largely suppressed in the absence of their concurrent influence. These results underscore critical role of ISO phase evolution and propagation in ADFT events, and suggest that they may serve as useful precursors for forecasting abrupt transitions.

How to cite: Zhou, S. and Yuan, X.: The impact of intraseasonal oscillations on the 2024 abrupt drought-to-flood transition over central China, EGU General Assembly 2026, Vienna, Austria, 3–8 May 2026, EGU26-2684, https://doi.org/10.5194/egusphere-egu26-2684, 2026.

EGU26-3979 | Orals | CL5.8

Assessing Canopy and Roughness‑Sublayer Turbulence Representation in Noah‑MP over Forest and Grassland at Lindenberg (Germany) 

Kirsten Warrach-Sagi, Frank Beyrich, Cenlin He, and Ronnie Abolafia-Rosenzweig

Land–atmosphere exchange in tall canopies is strongly controlled by turbulence within and above the canopy and in the roughness sublayer (RSL), where classical Monin–Obukhov similarity theory (MOST) is known to be imperfect. Recent developments in the Noah‑MP land surface model (LSM) include a unified turbulence parameterization that aims to provide a consistent treatment of turbulence from within the canopy, through the RSL, to the surface layer (Abolafia‑Rosenzweig et al., 2021). While this scheme has been tested primarily under snow‑dominated conditions, its performance for non‑snow, multi‑canopy environments over long time periods remains largely unexplored.

Here, we evaluate the unified canopy–RSL turbulence parameterization in Noah‑MP (version 5.1.1) using multi‑year, multi‑level observations from the Lindenberg observatory of the German Meteorological Service (DWD). We focus on two contrasting sites: (i) Kehrigk, a tall evergreen needleleaf forest canopy where RSL effects are expected to be strong, and (ii) Falkenberg, a short grassland site that more closely conforms to MOST assumptions. Both sites provide continuous 30‑min data since 2005, including eddy‑covariance fluxes of sensible and latent heat, radiation components, soil heat flux at 5 cm depth, skin temperature, and multi‑level profiles of air temperature, humidity, and wind speed up to 30 m (forest) and 10 m (grassland). All forcing and flux data undergo standard DWD quality control procedures.

Noah‑MP is run offline at both sites with identical land and soil parameterizations, driven by observed meteorology. We compare a standard configuration (MOST‑based surface‑layer and canopy treatment) with the unified canopy–RSL turbulence configuration. Beyond standard flux evaluation, we will diagnose friction velocity, Monin–Obukhov length, bulk transfer coefficients for heat and moisture, and the vertical structure of wind and temperature in the surface and roughness sublayers. Model performance will be analysed as a function of season, canopy type, and atmospheric stability.

By linking detailed, long‑term observations to alternative turbulence representations in a widely used LSM, this study aims to clarify under which conditions enhanced canopy–RSL formulations improve land–atmosphere coupling in next‑generation Earth System Models.

How to cite: Warrach-Sagi, K., Beyrich, F., He, C., and Abolafia-Rosenzweig, R.: Assessing Canopy and Roughness‑Sublayer Turbulence Representation in Noah‑MP over Forest and Grassland at Lindenberg (Germany), EGU General Assembly 2026, Vienna, Austria, 3–8 May 2026, EGU26-3979, https://doi.org/10.5194/egusphere-egu26-3979, 2026.

Terrestrial water storage (TWS) is a key variable in the water cycle, and accurate estimation of TWS is crucial for understanding hydrological processes and improving hydrological prediction. In this study, we develop an AI-based data assimilation method for GRACE TWS observations, aiming to integrate the advantages of satellite observations and land surface models. The assimilation adopts the ResUnet model combined with a self-supervised learning strategy. Specifically, the ResUnet model is used to extract large-scale variation information from GRACE TWS observations and high-resolution information from the land surface model. This assimilation system is applied to the NoahMP land surface model for long-term simulation, and the performance is compared with the nudging method. Results show that the AI-based assimilation method is more conducive to depicting fine-scale hydrological processes. Quantitative evaluation indicates that the assimilation effect of the proposed method is superior to that of the nudging. In addition, validation against in-situ observations confirms the rationality and reliability of the proposed method, as it can more accurately estimate terrestrial water storage and related hydrological variables. In the future, this AI-based assimilation method can be extended to the assimilation of more hydrological variables and multi-source observations, which is expected to further improve the estimation capability of land surface hydrological variables and provide more reliable data support for water resource management.

How to cite: Zhu, E. and Wang, Y.: An AI-Based GRACE Terrestrial Water Storage Data Assimilation Improves Hydrological Simulation, EGU General Assembly 2026, Vienna, Austria, 3–8 May 2026, EGU26-4437, https://doi.org/10.5194/egusphere-egu26-4437, 2026.

The rapid development of numerical weather prediction (NWP) models offers new opportunities for improving quantitative precipitation forecasting, while raising challenges in objectively integrating multi-model forecasts. This study presents recent advances in an operational multi-model integration precipitation forecasting method based on the generalized Three-Cornered Hat (TCH) theory.Seven NWP models routinely operated at the National Meteorological Center of the China Meteorological Administration are considered, including ECMWF, GERMAN, NCEP, GRAPES_3KM, BEIJING_MR, GUANGZHOU_MR, and SHANGHAI_MR. The method applies TCH theory to estimate the relative error characteristics of precipitation forecasts from different models. A Bayesian framework is then used to derive objective, model-dependent weighting coefficients, enabling short-range multi-model integration forecasts.The integration performance is evaluated using Threat Score (TS) metrics for 2025. Results show that the TCH-based integration consistently outperforms the single ECMWF model across all precipitation categories. The 24-hour heavy rainfall TS reaches 0.2357, a 48% improvement, while the TS for extreme rainfall events reaches 0.1354, a 141% improvement relative to ECMWF.The multi-model integration products have been operationally implemented at the National Meteorological Center, providing critical support during high-impact weather events, highlighting both recent advances and remaining challenges in operational multi-model precipitation forecasting.

How to cite: chen, S.: Multi-model Integration Precipitation Forecasting Based on TCH Theory: Recent Advances and Challenges, EGU General Assembly 2026, Vienna, Austria, 3–8 May 2026, EGU26-6074, https://doi.org/10.5194/egusphere-egu26-6074, 2026.

Ecosystem water use efficiency (WUE), an indicator of the trade-off between carbon uptake and water loss, is widely used to assess ecosystem responses to climate change. However, large-scale studies of WUE typically assume a single, fixed lag or accumulation period of climatic drivers across regions. This static assumption neglects spatially heterogeneous temporal responses of WUE to climate, potentially biasing attribution analyses and reducing predictive skill. Here, we developed a pixel-level model to quantify the temporal effects of climatic drivers on WUE by explicitly accounting for no-effect, lagged, cumulative, and combined effects and allowing effect timescales to vary spatially. We found that more than 80% of pixels across China exhibited lagged and/or cumulative effects for each driver, with distinct temporal effect patterns among vegetation types and drivers. In herbaceous cover croplands, precipitation exhibited the shortest lag (0.31 ± 0.56 months) and the longest accumulation time (1.71 ± 0.96 months). Accounting for these spatially heterogeneous temporal effects increased the explanatory power of climatic drivers for WUE variation by 17.7% compared with models without temporal effects. We further showed that for most vegetation types, precipitation and air temperature were more strongly associated with temporal variation in WUE, whereas solar radiation contributed more to spatial variability. These findings indicate that location-specific temporal effects can modulate the climatic controls on WUE. Our framework is readily applicable beyond China and can support a shift toward dynamic climate responses in climate–ecosystem interaction modeling, thereby improving forecasts of ecosystem dynamics and informing climate-adaptive vegetation management.

How to cite: Jiao, X.: Widespread Time-Lagged and Cumulative Effects Modulate Climatic Controls on Ecosystem Water Use Efficiency , EGU General Assembly 2026, Vienna, Austria, 3–8 May 2026, EGU26-6580, https://doi.org/10.5194/egusphere-egu26-6580, 2026.

Abstract:To address the challenge of simulating runoff in ungauged regions, a hybrid physical–data-driven framework was developed by coupling Soil and Water Assessment Tool (SWAT) with an LSTM–Transformer. SWAT-derived process variables were fused with meteorological forcing to form a physically informed feature set for the Transformer-enhanced LSTM. The framework was first calibrated at a gauged station and then transferred to ungauged basins to evaluate its spatial generalizability. At the gauged station, the SWAT–LSTM–Transformer achieved the highest accuracy among all tested models, yielding an NSE of 0.587 and an R² of 0.728 on the validation dataset. It also maintained a better balance between calibration fit and validation robustness than SWAT–LSTM, SWAT–RF, SWAT–SVM, and stand-alone SWAT. SHAP-based interpretation revealed stable and hydrologically coherent predictor dependencies: temperature, lateral flow, and evaporation emerged as dominant drivers of the model’s runoff simulations, whereas precipitation and soil moisture exerted shorter-term and event-focused influences. When transferred to ungauged stations in the same watershed, the model reproduced seasonal runoff variations and event-scale fluctuations with high accuracy, with NSE ranging from 0.80 to 0.94 and R² from 0.83 to 0.92. Under cross-watershed transfer, the model continued to capture the main temporal patterns, with NSE and R² ranging from 0.62 to 0.83 and 0.60 to 0.84, respectively, although performance declined during extreme events. Overall, the coupled SWAT–LSTM–Transformer framework provides a robust and transferable approach for daily runoff simulation in data-scarce watersheds.

Key words: SWAT; LSTM-Transformer; runoff simulation; ungauged watersheds

How to cite: Peng, Z., Li, Y., and Liu, D.: An interpretable daily runoff simulation method in data-scarce watersheds by coupling SWAT and LSTM-Transformer, EGU General Assembly 2026, Vienna, Austria, 3–8 May 2026, EGU26-7092, https://doi.org/10.5194/egusphere-egu26-7092, 2026.

EGU26-7919 | ECS | Posters on site | CL5.8

A dynamic representation of wetlands for the ISBA land surface model 

Lucas Hardouin, Bertrand Decharme, Jeanne Colin, and Christine Delire

Wetlands play a critical role in terrestrial hydrology and land–atmosphere exchanges, yet they remain poorly represented in many land surface models. Most approaches rely on static wetland maps, preventing models from capturing hydrological variability and associated feedbacks. Here we introduce a new dynamic wetland scheme in the ISBA land surface model, combining explicit hydrological processes with an annually varying diagnostic of wetland extent.

Wetland extent is computed using a TOPMODEL-based approach that links grid-cell saturation deficit with sub-grid topographic indices, and includes a correction for soil organic content to better represent peat-rich areas. Hydrological properties of wetlands and sub-grid runoff redistribution allow water to accumulate and persist in saturated zones, influencing the overall grid-cell water budget.

Simulated wetland extent shows good spatial agreement with multiple satellite-derived wetland datasets across a range of climate zones. Hydrological evaluation against GRACE-based terrestrial water storage and observed river discharge indicates that dynamic wetlands exert a modest but physically consistent influence on ISBA hydrology: they adjust discharge timing and magnitude without degrading model skill, while increasing grid-cell water storage and associated evapotranspiration. However, regional patterns of simulated evapotranspiration reveal a strong sensitivity to the assumed wetland vegetation type, underscoring the need for improved vegetation representation.

In particular, the dynamic wetland extent opens new opportunities for simulating wetland biogeochemistry, including methane emissions, and for exploring the key role of soil oxygen availability in controlling greenhouse gas fluxes.

How to cite: Hardouin, L., Decharme, B., Colin, J., and Delire, C.: A dynamic representation of wetlands for the ISBA land surface model, EGU General Assembly 2026, Vienna, Austria, 3–8 May 2026, EGU26-7919, https://doi.org/10.5194/egusphere-egu26-7919, 2026.

EGU26-8456 | ECS | Posters on site | CL5.8

C4MIP Multi-Model Projections of Moisture Convergence and Extreme Precipitation Risks over East Asia 

Nayeon jeon, Rackhun Son, and Dasom Lee

As extreme precipitation events intensify under climate change, understanding changes in precipitation patterns over East Asia has become increasingly important. While most future projections have relied on CMIP6 models, the Coupled Climate Carbon Cycle Model Intercomparison Project (C4MIP) integrates terrestrial–oceanic carbon cycle feedback including nitrogen deposition and biogeochemical processes to enhance the reliability of climate projection. Despite these advancements, C4MIP has been underutilized in hydrological assessments for East Asia. In this study, we analyze precipitation patterns over East Asia during the historical period (1980–2014) using a C4MIP multi-model ensemble and evaluate model performance through comparison with reanalysis datasets. The C4MIP ensemble demonstrates improved skill in capturing seasonal and interannual patterns of vertically integrated moisture flux convergence (VIMFC), particularly during periods of pronounced moisture convergence and divergence. Under the SSP5–8.5-bgc scenario, projection indicate intensified moisture convergence and increased risks of extreme precipitation over southeastern China and North Korea. These findings provide a diagnostic evaluation of C4MIP's hydrological performance and offer valuable insights for future regional climate projections and adaptation strategies.


This work was funded by the Korea Meteorological Administration Research and Development Program under Grant RS-2024-00404042 and the National Research Foundation of Korea (NRF) grant funded by the Korea government (MSIT) (RS-2024-00343921).

How to cite: jeon, N., Son, R., and Lee, D.: C4MIP Multi-Model Projections of Moisture Convergence and Extreme Precipitation Risks over East Asia, EGU General Assembly 2026, Vienna, Austria, 3–8 May 2026, EGU26-8456, https://doi.org/10.5194/egusphere-egu26-8456, 2026.

EGU26-9964 | ECS | Posters on site | CL5.8

How do climate factors influence plant-based carbon sequestration in land surface model, and how does this change under global warming? 

He-Ming Xiao, Daniele Peano, Simone Mereu, and Antonio Trabucco

Gross primary production (GPP) is an important indicator of carbon uptake by ecosystems, and plants play a central role in ecosystem carbon sequestration. Understanding how plant-driven GPP fluctuates from year to year and which climate factors control these fluctuations is essential for assessing carbon sequestration. In addition, how carbon sequestration by these plants responds to a warming climate is still not well understood. The lack of high-resolution, well-networked, and long-term stable observations, together with mixed signals from land–atmosphere interactions, makes it difficult to identify and isolate the climate factors influencing plant-driven GPP from an observational perspective. In contrast, land surface models provide an alternative approach to addressing these limitations.

In this study, we conducted 5-km resolution simulations using a land surface model (Community Land Model Version 5, CLM 5, Lawrence et al., 2019) forced with high-resolution atmospheric datasets and updated land surface data covering the Italy and the western Mediterranean region. The high-resolution simulations allow for improved discrimination among different land types, such as urban areas and natural vegetation. We further articulated implementation of Corine land-cover data to better represent current land surface conditions and distribution of Plant Functional Types (PFT). Remarkable progress in the last years has increased representation of more and more complex processes incorporating, among others, plant and soil hydrological and carbon cycles, physiological and phenological processes, land surface heterogeneity and PFT parameterization in LSM. However, large limitations still remain due to uncertainties in representation of spatial and temporal dynamics of model parameters, sub-grid heterogeneity, and ultimately resolving optimal allocation and ecosystem functioning at small scales.  Mediterranean regions were selected as the focus of this study because, as climate change hotspot, they experience strong variability of ecosystem processes and dependencies to changing climate and to increasing severe drought-heatwaves compound events, making vegetation-based mitigation practices particularly urgent. 

We found that both temperature and precipitation play dominant roles in shaping interannual variations in GPP. Under cold or dry regimes, warmer temperatures and higher precipitation are beneficial for higher GPP. In contrast, under warm and wet regimes, further increases in temperature and precipitation are not beneficial for plant GPP production. We further used the model to identify suitable temperature and precipitation ranges for the growth of different plant types, and to examine how global warming is altering these ranges. Our analysis may provide implications for future afforestation practices, particularly in selecting forest types and specific climate/geographic zones that can achieve better carbon sequestration under a warming climate.

How to cite: Xiao, H.-M., Peano, D., Mereu, S., and Trabucco, A.: How do climate factors influence plant-based carbon sequestration in land surface model, and how does this change under global warming?, EGU General Assembly 2026, Vienna, Austria, 3–8 May 2026, EGU26-9964, https://doi.org/10.5194/egusphere-egu26-9964, 2026.

EGU26-11167 | Posters on site | CL5.8

An introduction to the EarthRes program 

Xing Yuan, Justin Sheffield, Ming Pan, Jonghun Kam, Xiaogang He, Joshua Roundy, Nathaniel Chaney, Niko Wanders, Linying Wang, Chenyuan Li, and Yi Hao

The High-Resolution Earth System Modeling, Analysis and Prediction for a Society Resilient to Hydrometeorological Hazards (EarthRes) is a program of the International Decade of Sciences for Sustainable Development (IDSSD), endorsed by UNESCO in 2025. EarthRes aims to build global societal resilience to hydrometeorological hazards through five pillars: (1) establishing cooperative observation networks; (2) advancing process-based understanding of Earth system dynamics; (3) enhancing prediction and early warning capabilities; (4) fostering indigenous and local knowledge and data sharing; and (5) strengthening capacity building among international partners.

This presentation will introduce the program's recent progress, including collaborative observations for understanding Earth system dynamics, the integration of a regional climate model with a coupled land surface-hydrology-ecology model that accounts for human activities (e.g., reservoir regulation, irrigation, urbanization), and the development of a forecasting framework. This framework connects the regional model with an AI model to predict droughts, floods, and compound events at synoptic to sub-seasonal scales.

Other activities under EarthRes will also be introduced, and future plans will be discussed. Through international collaboration and targeted capacity-building, EarthRes seeks to enhance sub-seasonal prediction and early warning capabilities, with particular benefits for vulnerable regions.

How to cite: Yuan, X., Sheffield, J., Pan, M., Kam, J., He, X., Roundy, J., Chaney, N., Wanders, N., Wang, L., Li, C., and Hao, Y.: An introduction to the EarthRes program, EGU General Assembly 2026, Vienna, Austria, 3–8 May 2026, EGU26-11167, https://doi.org/10.5194/egusphere-egu26-11167, 2026.

EGU26-13594 | ECS | Posters on site | CL5.8

Classification and Attribution of Compound Flood Events  

Jinjie Zhao and Carlo De Michele

Floods are the most common natural hazards, and the compound effects of flood events pose severe challenges to flood protection. The lack of flood observation data makes it difficult to identify and analyze compound flood effects. Here, we employed a data-driven approach to reconstruct discharge in ungauged regions. We classified flood events from a compound perspective, quantified the contributions of different drivers, and compared the impacts of compound and non-compound flood events. Our results showed that pronounced compound effects were common in most flood events, with many compound flood events clustered in India and southeastern China. Compound events caused substantially greater impacts than non-compound events in Asia and North America.

How to cite: Zhao, J. and De Michele, C.: Classification and Attribution of Compound Flood Events , EGU General Assembly 2026, Vienna, Austria, 3–8 May 2026, EGU26-13594, https://doi.org/10.5194/egusphere-egu26-13594, 2026.

EGU26-14172 | ECS | Posters on site | CL5.8

Benchmarking machine learning-based emulators and traditional methods to calibrate land model parameters for 124 global flux tower sites 

Ignacio Aguirre, Wouter Knoben, Nicolas Vasquez, and Martyn Clark

Accurately simulating latent and sensible heat fluxes is a long-standing open challenge in the land modeling community. The recent model intercomparison project PLUMBER 2 over 154 flux towers showed that simple 1-variable linear regression models can outperform process-based models in simulating latent and sensible heat. PLUMBER 2 simulations were run using default model parameters, leaving the potential performance gains from parameter estimation unquantified.

Identifying optimal parameters in land models has several challenges, including high computational cost and the need to identify parameters that can correctly reproduce temporal dynamics (i.e., good performance across different time epochs) and spatial patterns (i.e., good performance across many sites). To evaluate the ability of different calibration methods to handle these challenges, this study compared the performance of traditional and machine-learning emulator-based calibration methods against Long Short-Term Memory (LSTM) benchmarks, with single-objective experiments (latent heat or sensible heat calibrated individually) and multi-objective experiments (latent and sensible heat calibrated simultaneously). We also tested two ways to train emulators and LSTMs: either considering one site at a time or leveraging information from multiple sites and their attributes simultaneously.

Our results show that the calibrated simulations outperformed the default parameters and the simple benchmarks used in PLUMBER 2, demonstrating the potential to improve process-based models. Moreover, we observed that traditional calibration methods have a tendency to overfit: these traditional calibration methods can achieve high performance during calibration but are unable to achieve similar results during validation. The emulator-based methods achieve more consistent results across both calibration and validation time periods. Additionally, we found that parameter estimation methods that incorporate information from multiple sites simultaneously achieve better spatial consistency than methods that only learn from one site at a time. These results suggest that the performance gap between LSTM and process-based models can be significantly narrowed through calibration.


How to cite: Aguirre, I., Knoben, W., Vasquez, N., and Clark, M.: Benchmarking machine learning-based emulators and traditional methods to calibrate land model parameters for 124 global flux tower sites, EGU General Assembly 2026, Vienna, Austria, 3–8 May 2026, EGU26-14172, https://doi.org/10.5194/egusphere-egu26-14172, 2026.

Land hydrology is a fundamental part of the global water cycle, and as such, of Earth’s climate system, including the biosphere. Yet, this basic component is still poorly represented in current models, partly because the structure of the land features scales much smaller than what those models can resolve, but also due to a lack of understanding of processes occurring below ground that are not readily at sight. Here we will examine from the perspective of what is important to the atmosphere from seasonal to centennial timescales, questions such as what groundwater and surface water do in shaping water availability and how vegetation and ecosystems adapt to it, ultimately modulating land-surface fluxes and climate. How relevant are these processes and what are we missing in current land-surface models? 

How to cite: Miguez-Macho, G. and Fan, Y.: Land hydrology, water availability for ecosystems and land surface models: what are we missing? , EGU General Assembly 2026, Vienna, Austria, 3–8 May 2026, EGU26-15491, https://doi.org/10.5194/egusphere-egu26-15491, 2026.

Human interactions with the water cycle are increasingly recognised as critical drivers of land-climate feedbacks, yet they have long been under-represented in climate modelling.  With ongoing climate change, water management strategies and irrigation practices are becoming more important across many parts of the world. Since these activities can significantly alter surface energy and water fluxes, and thus local and regional climate, it is important to study these processes in more detail.

Although some Earth system models and regional climate models have started to incorporate irrigation routines, they still lack a representation of water availability from different sources and the competing demands of other sectors. To address this gap, we are developing the flexible water modelling tool C-CWatM that can be easily coupled with existing (regional) climate models. Based on the socio-hydrological model CWatM, it simulates river discharge, groundwater, reservoirs and lakes, as well as water demand and consumption from industry, households and agriculture.

In this contribution, we present initial results from coupled simulations using C-CWatM and the regional climate model REMO to study the impact of large-scale irrigation on regional climate conditions. The coupling is implemented via the OASIS3-MCT coupler, which manages synchronised data exchange and regridding of coupling fields. REMO provides the forcing fields required by C-CWatM and receives irrigation water amounts from C-CWatM, which are then applied within REMO's irrigation scheme. 

The development and coupling of C-CWatM allows climate models to realistically account for irrigation constraints, which is particularly important in water-scarce regions and under the increasing risk of droughts driven by climate change. Thus, our approach is an important step towards next-generation land surface modelling and promotes collaboration between hydrology and climate modelling communities to advance understanding of land-climate feedbacks and inform future adaptation strategies.

How to cite: Schmitt, A. and Greve, P.: Irrigation–climate feedbacks in coupled climate simulations: First results using an integrated hydrological modelling tool, EGU General Assembly 2026, Vienna, Austria, 3–8 May 2026, EGU26-17003, https://doi.org/10.5194/egusphere-egu26-17003, 2026.

EGU26-17882 | ECS | Posters on site | CL5.8 | Highlight

Rapid Forecasting Method for Flood Process by Using on Physically Based Numerical and AI Model 

Xinxin Pan and Jingming Hou

With the acceleration of urbanization, complex underlying surfaces, pipe networks, river channels, and hydraulic facilities (gates, sluices, pumps) have significantly increased the number of computational grids and physical processes, making the computational efficiency of physical rainfall-runoff models insufficient to meet the timeliness requirements of emergency management for flood disasters. This necessitates further research on new technologies to enhance the computational efficiency of flood simulation and forecasting models. The development of AI technology provides new approaches for rapid flood disaster simulation and forecasting. This study proposes three innovative methods to address these challenges. First, GPU Accelerated Model for Surface Water Flow and Associated Transport. Second, AI Based Rapid Predicting Method for Flood Process. Third, Model Application for Dam Break Flood Simulation. 

How to cite: Pan, X. and Hou, J.: Rapid Forecasting Method for Flood Process by Using on Physically Based Numerical and AI Model, EGU General Assembly 2026, Vienna, Austria, 3–8 May 2026, EGU26-17882, https://doi.org/10.5194/egusphere-egu26-17882, 2026.

EGU26-18864 | ECS | Posters on site | CL5.8

Global amplification of water whiplash revealed by terrestrial water storage 

Yuheng Yang and Ruiying Zhao

Hydroclimate volatility, characterized by abrupt transitions between dry and wet extremes, poses a growing threat to global water security. Yet, current understanding of these transitions largely relies on meteorological metrics, which often fail to capture the full complexity of hydrological processes, land surface memory, and human water management. Here, we present a global assessment of water whiplash through the lens of terrestrial water storage (TWS). By integrating hydrological modeling with data-driven approaches, we reconstructed a comprehensive long-term TWS dataset to identify these events and account for delayed hydrological responses. Our results reveal a widespread intensification of global water whiplash in recent decades, with a substantial further increase projected under high-warming scenarios. Attribution analysis indicates that while climate change acts as the dominant driver of this amplification, human water management plays a critical role in spatially modulating these events, capable of either significantly mitigating or exacerbating local volatilities. We identify key hotspots of intensification in the tropics and high latitudes, encompassing extensive agricultural regions and major river basins. These findings establish TWS as a vital integrative indicator for monitoring abrupt hydrological transitions and underscore the urgent need for adaptive water management strategies to navigate an increasingly volatile hydroclimate.

How to cite: Yang, Y. and Zhao, R.: Global amplification of water whiplash revealed by terrestrial water storage, EGU General Assembly 2026, Vienna, Austria, 3–8 May 2026, EGU26-18864, https://doi.org/10.5194/egusphere-egu26-18864, 2026.

EGU26-19214 | ECS | Orals | CL5.8

Introducing Groundwater Dynamics into the ECLand Land Surface Model: Implementation and Effects 

Vincenzo Senigalliesi, Andrea Alessandri, Stefan Kollet, and Simone Gelsinari

Land surface models still lack a realistic representation of groundwater, often relying on a free drainage condition at the bottom of the unsaturated soil column as in the current version of ECLand. This unrealistic assumption places the groundwater infinite depth below the surface, thus limiting the model’s ability to simulate realistic soil–vegetation-groundwater interaction.

To address this limitation, we implemented a Dirichlet boundary condition at the bottom of the unsaturated soil to enable a fully implicit numerical scheme for coupling with groundwater. First, we prescribed the water table depth (WTD) using global scale estimates to allow for the computation of realistic water fluxes between the unsaturated zone and the underlying aquifer. In a second step,  a dynamic WTD (hereafter the DYN configuration) was  developed by defining the water stored in the  unconfined aquifer, which evolves prognostically according to drainage (groundwater recharge) and subsurface runoff (groundwater discharge).

The effects of these developments were preliminarily evaluated through offline land-only simulations forced by station data from the PLUMBER2 project, which includes observational networks such as FLUXNET2015, La Thuile, and OzFlux. We validated the DYN configuration against the model setup with free-drainage conditions (CTRL). Our results show a systematic improvement in both latent and sensible heat fluxes, as quantified by the reductions in the error metrics  across most stations, with runoff scoring the best performances. 

The results of the global simulations largely corroborate and expand upon those of the station-based evaluation experiments conducted using PLUMBER2. The DYN configuration provides a more accurate representation of WTD, both spatially and temporally. This is evident in global climatological maps and independent observational datasets. Additionally, latent and sensible heat fluxes are consistently better represented in DYN than in CTRL, showing closer agreement with DOLCE and GLEAM products. Improvements are also evident in runoff simulations, with DYN exhibiting greater consistency with GLOFAS observations. Model performance was further evaluated against multiple observational datasets, such as GRACE/GRACE-FO to verify temporal variability in total water storage and to assess long-term mean conditions.

This work demonstrates that incorporating  groundwater dynamics significantly improves the realism of land-surface processes, particularly in the representation of the flux exchange of water and energy with other components. These results provide a foundation for the enhancement of the representation of land-climate interactions and hydroclimatological behaviour in next generation of reanalysis and climate predictions.

How to cite: Senigalliesi, V., Alessandri, A., Kollet, S., and Gelsinari, S.: Introducing Groundwater Dynamics into the ECLand Land Surface Model: Implementation and Effects, EGU General Assembly 2026, Vienna, Austria, 3–8 May 2026, EGU26-19214, https://doi.org/10.5194/egusphere-egu26-19214, 2026.

EGU26-19820 | Posters on site | CL5.8

 Surface Soil Moisture–Vegetation Feedbacks in Water-Limited Regions across Land Surface Models 

Andrea Alessandri, Marco Possega, Annalisa Cherchi, Emanuele Di Carlo, Souhail Boussetta, Gianpaolo Balsamo, Constantin Ardilouze, Gildas Dayon, Franco Catalano, Simone Gelsinari, Christian Massari, and Fransje van Oorschot

Soil moisture plays a critical role in water-limited regions through its strong coupling and feedbacks with vegetation. However, state-of-the-art Land Surface Models (LSMs) used in reanalysis and near-term prediction systems still lack a realistic coupling of vegetation, limiting their ability to properly account for the fundamental role of vegetation in modulating the feedback with soil–moisture.
In this study, we incorporate Leaf Area Index (LAI) variability from observations - derived from the latest-generation satellite products provided by the Copernicus Land Monitoring Service - into three different LSMs. The models perform a coordinated set of offline, land-only simulations forced by hourly atmospheric fields from the ERA5 reanalysis. An experiment using interannually varying LAI (SENS) is compared with a control simulation based on climatological LAI (CTRL) in order to quantify vegetation feedbacks and their impact on simulated near-surface soil moisture.
Our results show that interannually varying LAI substantially affects near-surface soil moisture anomalies across all three models and over the same water-limited regions. However, the response differs markedly among models. Compared with ESA-CCI observations, near-surface soil moisture anomalies significantly improve in one model (HTESSEL–LPJ-GUESS), whereas the other two models (ECLand and ISBA–CTRIP) exhibit a significant degradation in anomaly correlation. The improved performance in HTESSEL–LPJ-GUESS is attributed to the activation of a positive soil moisture–vegetation feedback enabled by its effective vegetation cover (EVC) parameterization. In HTESSEL–LPJ-GUESS, EVC varies dynamically with LAI following an exponential relationship constrained by satellite observations. Enhanced (reduced) soil moisture limitation during dry (wet) periods leads to negative (positive) LAI and EVC anomalies, which in turn generate a dominant positive feedback on near-surface soil moisture by increasing (decreasing) bare-soil exposure to direct evaporation from the surface. In contrast, ECLand and ISBA–CTRIP prescribe EVC as a fixed parameter that does not respond to LAI variability, preventing the activation of this positive feedback. In these models, the only active feedback on near-surface soil moisture anomalies is negative and arises from reduced (enhanced) transpiration associated with negative (positive) LAI anomalies.
Our findings demonstrate that simply prescribing observed vegetation properties in LSMs does not guarantee a realistic coupling between vegetation and soil moisture. Instead, it is shown that the explicit representation of the underlying vegetation processes is essential to activate the proper feedback and capture the correct soil moisture response.

How to cite: Alessandri, A., Possega, M., Cherchi, A., Di Carlo, E., Boussetta, S., Balsamo, G., Ardilouze, C., Dayon, G., Catalano, F., Gelsinari, S., Massari, C., and van Oorschot, F.:  Surface Soil Moisture–Vegetation Feedbacks in Water-Limited Regions across Land Surface Models, EGU General Assembly 2026, Vienna, Austria, 3–8 May 2026, EGU26-19820, https://doi.org/10.5194/egusphere-egu26-19820, 2026.

The plant litter layer, a critical interface between the atmosphere and soil, regulates energy, water, and carbon exchanges, yet its thermal insulation effects are poorly represented in Earth System Models (ESMs). This omission hampers our ability to accurately simulate the climate-hydrology-ecosystem nexus, particularly in cold regions where soil thermal regimes control freeze-thaw processes, hydrology, and biogeochemical cycles. To address this gap, we integrated a dynamic litter layer with explicit thermal properties into the Noah-MP land surface model. Validation against global flux tower sites confirms significant improvements in simulating soil temperature and moisture.
Our results reveal that litter insulation creates a strong seasonal asymmetry in soil temperatures, inducing a net annual cooling (up to –0.69 °C) by providing stronger summer cooling than winter warming. Furthermore, it fundamentally alters soil freeze-thaw processes (FTP), but with divergent impacts: it delays the freezing end date in permafrost regions while advancing it in seasonally frozen ground, with shifts up to 40 days. The strongest modulation of freezing duration (~100 days) occurs in regions with a mean annual temperature near 10°C. We identify six distinct FTP response modes, controlled by the non-linear interplay between climate, litter thickness, and snow depth. The altered thermal and hydrological states feedback to ecosystem processes, offsetting the greening-driven gains in gross primary productivity by 20.57 ± 3.65 g C m⁻² yr⁻¹ while enhancing forest soil organic carbon stocks by 2.08 ± 0.24 kg C m⁻².
These findings demonstrate that the litter layer is a key biogeophysical mediator, directly coupling vegetation dynamics with soil thermal-hydrological states. Explicitly representing this process in ESMs is therefore essential for advancing the simulation of the carbon-water-energy nexus, improving projections of permafrost thaw, ecosystem feedbacks, and hydrological changes under vegetation greening and climate warming.

How to cite: Huang, P., Wang, G., and Valentini, R.: Representing Plant Litter Insulation in Land Surface Models: A Critical Process for Simulating the Soil Thermal-Hydrological-Ecological Nexus in Cold Regions, EGU General Assembly 2026, Vienna, Austria, 3–8 May 2026, EGU26-22297, https://doi.org/10.5194/egusphere-egu26-22297, 2026.

BG10 – Interdisciplinary topics in Biogeosciences

EGU26-4553 | Posters on site | HS2.1.9

Influence of river network representation on discharge and flooding in kilometre-scale CaMa-Flood simulations across Australia  

Filippo Nelli, Christopher Pickett-Heaps, Fitsum Woldemeskel, Foad Brakhasi, Katayoon Bahramian, Jiawei Hou, Ulrike Bende-Michl, and Wendy Sharples

Australian catchments exhibit diverse hydrological responses across climates, ranging from humid tropical and temperate systems to arid regions with intermittent rivers. Accurately representing this diversity requires river routing models that resolve drainage connectivity, floodplain storage and travel times at high spatial resolution. In this study, we present a novel approach using an Australia wide CaMa-Flood configuration at ~1.5 km (1 arc-minute) resolution, using MERIT-Hydro and Australian Geofabric DEMs to parameterize drainage networks and river geometry

The routing system is driven by projected runoff from the Bureau of Meteorology's operational Australian Water Resources Assessment (AWRA) model, enabling multi-decadal simulations of river discharge and floodplain dynamics across contrasting hydro-climatic regimes. To allow investigating effects of hydrography-driven differences in discharge, water level and inundation, we perform paired CaMa-Flood simulations using identical AWRA runoff. We compare (i) a river network derived from the MERIT digital elevation model and (ii) the Australian Geofabric river network and attributes.

We investigate a range of river systems including low-gradient floodplains, endorheic basins and ephemeral river systems, where flow intermittency and channel–floodplain interactions strongly control downstream hydrological behaviour. Modelled discharge and water levels are evaluated against in situ streamflow and stage gauge observations, while simulated flood extents are compared with satellite-based inundation maps derived from ICEYE synthetic aperture radar imagery. Model behaviour is analysed across representative catchments spanning tropical monsoonal, temperate, semi-arid and arid climates to identify scale-dependent controls on hydrological response. We further assess numerical stability and computational performance to quantify the feasibility of kilometre-scale routing for large-domain and ensemble applications. 

Our results demonstrate that high-resolution routing substantially improves representation of river connectivity and flood dynamics, particularly in dryland environments, providing a robust framework for catchment-scale hydrological analysis and climate-impact studies including future flood-risk assessment and across diverse Australian environments. Future developments will extend this framework through coupling with ocean circulation models to assess the combined influence of tides and storm surge on coastal flood hazard, enabling the evaluation of compound river-coastal flooding processes.

How to cite: Nelli, F., Pickett-Heaps, C., Woldemeskel, F., Brakhasi, F., Bahramian, K., Hou, J., Bende-Michl, U., and Sharples, W.: Influence of river network representation on discharge and flooding in kilometre-scale CaMa-Flood simulations across Australia , EGU General Assembly 2026, Vienna, Austria, 3–8 May 2026, EGU26-4553, https://doi.org/10.5194/egusphere-egu26-4553, 2026.

Understanding how small-scale processes interact to shape ecosystem development at landscape scales remains a major challenge in environmental science, particularly in post-mining environments where belowground processes are difficult to measure and manipulate. To address this, we established FALCON (2019), an array of four hydrologically isolated artificial catchments (0.25 ha each) in a post-coal mining area in Czechia, enabling controlled, landscape-scale experimentation. Two catchments were reclaimed by leveling and planting alder, while two were left to spontaneous succession on wave-like microtopography. Each catchment is fully instrumented to monitor water, nutrient, gas, and energy fluxes, and includes lysimeters to link small-scale processes to catchment-scale responses. Early studies demonstrate that erosion and deposition strongly control microhabitat formation, with wave-like topography generating pronounced heterogeneity in soil texture, hydrology, and water retention  while homogenization prevail in flat catchments. These processes support surface run off in reclaimed and subsurface run off in unreclaimed catchments. Carbon flux measurements show rapid ecosystem recovery at both reclaimed and unreclaimed sites, with all catchments transitioning from CO₂ sources to sinks within four years; differences between treatments shifted from being driven by soil physical properties to vegetation productivity as alder established. Lysimeter-based assessments indicate that surface water fluxes and evapotranspiration can be reasonably upscaled, particularly in unreclaimed sites, but subsurface flow and solute transport remain poorly represented. Overall, FALCON provides a unique platform to experimentally link erosion, hydrology, biogeochemistry, and carbon exchange across scales

How to cite: Bartuška, M. and Frouz, J.: Large experimental fully hydrologically isolated catchment as a tool to study hydrological and ecological processes on multiple scales , EGU General Assembly 2026, Vienna, Austria, 3–8 May 2026, EGU26-6970, https://doi.org/10.5194/egusphere-egu26-6970, 2026.

EGU26-7089 | Posters on site | HS2.1.9

Critical zone studies in pre-alpine climate 

Vesna Zupanc, Matic Noč, Urša Pečan, Nejc Golob, Matjaž Glavan, Rok Kuk, Marina Pintar, Tjaša Pogačar, Špela Železnikar, Vid Žitko, Zala Žnidaršič, Luka Žvokelj, and Rozalija Cvejić

Weighing monolith lysimeters enable precise measurement of water balance parameters, including infiltration, evapotranspiration, and deep percolation as well as studies of solute fluxes within the complex soil–plant–atmosphere continuum. At the experimental field of the Biotechnical Faculty, University of Ljubljana, two monolith lysimeters were installed to study solute transport and to measure evapotranspiration. In addition to the installed lysimeters, an advanced meteorological station is located at the same site, enabling measurement of other meteorological variables required for calculating evapotranspiration. To expand and establish a critical zone research site, the lysimeter station was equipped with two cosmic ray neutron sensors for proximity moisture sensing, as well as sampling points for drainage water and groundwater quality. The research center serves as a focal point for soil water balance studies in the peri-urban area of a pre-Alpine climate in central Slovenia, and is a part of SI-COSMOS network that spreads across the Continental, Alpine, Karst, Mediterranean, and Pannonian regions. Biotechnical faculty critical zone research field enables quantification of hydrological processes that control the upper critical zone water balance and contaminant transport under changing climate conditions. Evaluation after the first decade of operation shows that advances in weighing technology, lower boundary condition control, and data processing have made high-precision lysimeters very useful tools; however, they require intensive, regular maintenance to ensure data quality. Drainage water monitoring indicates favorable water quality conditions for developing circular water and nature based solutions in per-urban agricultural landscape.
Acknowledgements: This research was partially supported by ARIS research programme P4-0085, IC RRG-AG (IO-0022-0481-001), Interreg Alpine Space program, project Alpine Space Drought Prediction (A-DROP) (grant number 101147797), European Union – LIFE Programme (LIFE23-IPC-SI-LIFE4ADAPT), OPTAIN Horizon 2020 (grant number 862756), and the Slovenian CAP Strategic Plan 2023–2027 (grant number 33126-3/2025/23).

How to cite: Zupanc, V., Noč, M., Pečan, U., Golob, N., Glavan, M., Kuk, R., Pintar, M., Pogačar, T., Železnikar, Š., Žitko, V., Žnidaršič, Z., Žvokelj, L., and Cvejić, R.: Critical zone studies in pre-alpine climate, EGU General Assembly 2026, Vienna, Austria, 3–8 May 2026, EGU26-7089, https://doi.org/10.5194/egusphere-egu26-7089, 2026.

EGU26-7113 | ECS | Orals | HS2.1.9

Integrating microbiome responses across warming experiments in coastal marshes 

Johanna Schwarzer, Susanne Liebner, Alexander Bartholomäus, Ella Lu Logemann, Julian Mittman- Goetsch, Kai Jensen, Simon Thomsen, J. Patrick Megonigal, Roy Rich, Genevieve Noyce, and Peter Mueller


Coastal marshes are critical carbon sinks in the global carbon system, yet rising temperatures may alter microbial processes that regulate carbon and nutrient cycling. In a recent ex-situ warming experiment conducted in the Climate Change Marsh Mesocosm Facility (CCMMF) at the University of Hamburg, Germany, we could show that warming can alter soil microbial communities, and that responses vary with environmental context, such as plant community diversity and ecosystem age. We also found that warming favored microbial taxa with traits supporting plant growth and nutrient cycling. Here, we expanded our analysis and included microbial 16S rRNA gene sequencing data sets from two in-situ coastal marsh warming experiments: MERIT (“Marsh Ecosystem Response to Increased Temperatures”) in northern Germany and SMARTX (“Salt Marsh Accretion Response to Temperature eXperiment”) in a brackish marsh on Chesapeake Bay, USA. By this, we combined three genetic microbial data sets of coastal marshes characterized by different soil type, ecosystem age, vegetation type, tidal regime, and soil carbon and nitrogen stocks.

We will show how warming-induced shifts in microbial community relate to ecological parameters across sites building on the hypothesis that microbial responses to warming vary strongly with vegetation composition and ecosystem age. With this meta study, we will be able to identify key factors controlling microbial responses to experimentally increased temperatures to better understand how climate change reshapes microbial composition and thereby carbon dynamics in coastal wetlands.

How to cite: Schwarzer, J., Liebner, S., Bartholomäus, A., Logemann, E. L., Mittman- Goetsch, J., Jensen, K., Thomsen, S., Megonigal, J. P., Rich, R., Noyce, G., and Mueller, P.: Integrating microbiome responses across warming experiments in coastal marshes, EGU General Assembly 2026, Vienna, Austria, 3–8 May 2026, EGU26-7113, https://doi.org/10.5194/egusphere-egu26-7113, 2026.

EGU26-9220 | Posters on site | HS2.1.9

WATCH / Time2WATCH projects towards the implementation of a permanent observatory of groundwater in Kenya – A first hydrogeological model of the Chyulu Hills 

Helene Celle, Julie Albaric, Yael Barre-Rolland, Stéphanie Gautier, Yanni Gunnell, Jean-Christophe Ianigro, Ian Kaniu, Jacques Marteau, Agnes Mbugua, François Mialhe, Patrick Murunga, Oldrich Navratil, Pierre Nevers, Edwin Nyaga, Lydia Olaka, Lydia Roos, Christel Tiberi, Matias Tramontini, and Dennis Waga

In semi-arid southern Kenya, the Chyulu Hills consist of an alignment of Quaternary scoria cones and basaltic lava flows. This ~80-km-long, NW–SE volcanic fissure vent hosts underground water resources of importance to the local rural population and the savanna ecosystems. The subvolcanic topography allows groundwater to flow south and east, resulting in a line of springs along the base of the hills. Several springs are partially tapped to supply water for drinking water and farming activities. Mzima spring, in the south, yields 70% of the total outflow of the Chyulu Hills watershed, and 10% of Mzima water is diverted from its local use to supply the city of Mombasa, 200 km to the southeast. This generates conflict between local residents and regional water resource authorities. It is therefore crucial to quantify the water resources of the Chyulu Hills and establish to what extent these are suitable for sustainably supplying the local and wider regional population in the future, in a context of global change. The WATCH and Time2WATCH projects (2024–2026), funded by the Centre National de la Recherche Scientifique (France), aim to assess and monitor Chyulu-wide water budgets by setting up a multidisciplinary observatory combining meteorological, geophysical, geological, hydrogeological, and land use/land cover evaluations. This observatory was elaborated in close collaboration between Kenya (University of Nairobi, Technical University of Kenya, Regional Centre on Groundwater Resources Education, Training & Research) and France (Université Lumière Lyon 2, Université Claude Bernard Lyon 1, Université Marie and Louis Pasteur, Université de Montpellier, Sorbonne Université). The present contribution mainly focuses on preliminary hydrochemistry results. Their integration across the entire observatory provides the first functional insights into the Chyulu Hills groundwater system.

How to cite: Celle, H., Albaric, J., Barre-Rolland, Y., Gautier, S., Gunnell, Y., Ianigro, J.-C., Kaniu, I., Marteau, J., Mbugua, A., Mialhe, F., Murunga, P., Navratil, O., Nevers, P., Nyaga, E., Olaka, L., Roos, L., Tiberi, C., Tramontini, M., and Waga, D.: WATCH / Time2WATCH projects towards the implementation of a permanent observatory of groundwater in Kenya – A first hydrogeological model of the Chyulu Hills, EGU General Assembly 2026, Vienna, Austria, 3–8 May 2026, EGU26-9220, https://doi.org/10.5194/egusphere-egu26-9220, 2026.

EGU26-12381 | Orals | HS2.1.9

Infrastructures – a primer for the Critical Zone 

Martyn Futter, Ulf Grandin, Dolly Kothawala, Holger Villwock, Marcus Wallin, James Weldon, and Blaize Denfield

This presentation will articulate a metaphor about painting. If it is successful, you should be convinced that there are things out there that, if we made better use of them, would significantly enhance our understanding of the critical zone. Before working on the actual painting, most artists apply one or more coats of primer. In most finished paintings, you don’t see the primer, but without it, the painting would likely not be as good. Just because we don’t usually think about the primer doesn’t mean it isn’t there. 


One can make the same argument for monitoring and research infrastructures; hopefully you can be convinced that infrastructures could provide the primer behind the critical zone painting. Infrastructures such as the International Cooperative Programme on Integrated Monitoring of Air Pollution Effects (ICP-IM) collect, curate and report monitoring data to assess compliance with European legislation. In some ways, the data they collect are a by-product or intermediary step in regulatory assessments. However, these long-term, standardized, well curated and increasingly open access data series can be a resource in and of themselves as well as providing vital context for new data collection.


Some infrastructures, e.g., the Swedish Infrastructure for Ecosystem Science (SITES) and the Integrated European Long-Term Ecosystem, critical zone and socio-ecological system Research Infrastructure (eLTER) not only collect and curate environmental data, they function as a platform to support field sampling and experiments across multiple ecosystems and spatial scales. The background monitoring data collected by the infrastructure enhances the scientific value of these experiments. Platforms can also help to grow networks by providing the opportunity for people to work together on new questions, such as in the global Aquatic Mesocosm network (AQUACOSM).


Often, the role of these networks, platforms and infrastructures is mentioned in the acknowledgements, if at all. Even if they are not visible, they are vital. The future of infrastructures and platforms is not guaranteed. If we as a community make more use and highlight what they have to offer, it helps them to secure their future and to give us a primer for our scientific canvas.

How to cite: Futter, M., Grandin, U., Kothawala, D., Villwock, H., Wallin, M., Weldon, J., and Denfield, B.: Infrastructures – a primer for the Critical Zone, EGU General Assembly 2026, Vienna, Austria, 3–8 May 2026, EGU26-12381, https://doi.org/10.5194/egusphere-egu26-12381, 2026.

EGU26-12631 | Orals | HS2.1.9

Lessons learned from a long-term manipulation experiment in a semi-arid savanna ecosystem 

Laura Nadolski, Sinikka Paulus, Bayu Hanggara, Richard Nair, Tarek El Madany, Arnaud Carrara, Mirco Migliavacca, Markus Reichstein, and Sung-Ching Lee

Semi-arid ecosystems dominate the interannual variability and trend of the terrestrial carbon sink. They are sensitive to anthropogenic environmental changes, including shifts in the nitrogen (N) to phosphorus (P) ratio driven by increasing N deposition.

In 2015, a large-scale fertilization experiment was established at Majadas de Tiétar, a tree-grass ecosystem in western Spain. Three eddy covariance towers operate simultaneously at the site: one serves as unfertilized control plot, one measures an area fertilized with N, and the third samples an area with N and P addition. This setup provides an exceptional opportunity to study the long-term influence of altered N:P ratios on ecosystem functioning. Flux measurements are complemented by a variety of other instruments, such as lysimeters, mini-rhizotrons, soil chambers, soil sensors, phenocams and proximal sensing instruments. The comprehensive measurement setup at Majadas de Tiétar therefore enables a deeper understanding of the trends and interactions among climate change, nutrient availability and the biogeochemical cycles of carbon, N, and P in semi-arid ecosystems.

We found that both fertilization schemes increased carbon uptake, and that N+P addition enhanced the water use efficiency more than N-only addition. Fertilization also increased the inter-annual variability of net ecosystem exchange (NEE) and altered the sensitivity of seasonal NEE to its drivers. However, water limitation in summer and energy limitation in winter overweighed fertilization effects at the seasonal scale.

How to cite: Nadolski, L., Paulus, S., Hanggara, B., Nair, R., El Madany, T., Carrara, A., Migliavacca, M., Reichstein, M., and Lee, S.-C.: Lessons learned from a long-term manipulation experiment in a semi-arid savanna ecosystem, EGU General Assembly 2026, Vienna, Austria, 3–8 May 2026, EGU26-12631, https://doi.org/10.5194/egusphere-egu26-12631, 2026.

EGU26-12900 | ECS | Posters on site | HS2.1.9

Hydro-ecological controls of dissolved organic carbon dynamics and greenhouse gas emissions in a temperate peatland: A multi-disciplinary collaboration in the Frasne peatland observatory (Jura Mountains, France) 

Noémie Poteaux, Alexandre Lhosmot, Marc Steinmann, Robin Calisti, Adrien Jacotot, Sarah Coffinet, Philippe Binet, Anne Boetsch, Marie-Laure Toussaint, Lilian Joly, Nicolas Dumelie, Jean-Louis Bonne, Laurent Longueverne, Marie-Noelle Pons, Christophe Loup, and Guillaume Bertrand

Peatlands are increasingly recognized as key components of the Critical Zone (CZ) - the thin layer at the surface of the Earth where major biogeochemical reactions occur - , because they tightly integrate, within a single ecosystem, hydrological, biological, and carbon cycle processes that all impact each other. Although they cover only about 3% of the global continental surface, they store over 30% of global soil organic carbon, highlighting their long-term role as carbon sinks, largely due to permanent water saturation and specific vegetation. However, climate change is increasingly disrupting the hydroecological balance of peatlands, potentially converting them from carbon sinks into sources of greenhouse gases (GHGs) and dissolved organic carbon (DOC).              
In this study, we adopted an approach using innovative techniques developed within the TERRA FORMA initiative of the French OZCAR CNRS research infrastructure. Our work was focused on a temperate 7-hectare peatland (Frasne, French Jura Mountains) hosting a long-term Critical Zone observatory (SNO Tourbières) to unravel the mechanisms underlying the continuum of DOC production, mineralization and export to the atmosphere as GHGs (CO₂ and CH₄). Spatial variability in DOC quality - including aromaticity, molecular weight, and microbial origin - was compared to hydrological gradients, vegetation types and atmospheric GHG concentrations, the latter measured by drone surveys and ground-based accumulation chambers.              
The results indicate a preferential production of recalcitrant DOC in the upstream part of the peatland, where conifers dominate the vegetation. In contrast, biochemical markers reveal intense microbial decomposition of organic carbon in the more frequently flooded downstream zones, producing DOC that is lower in concentration, less aromatic, and more labile. This area coincides with higher GHG concentrations in the overlying atmosphere, suggesting that the labile DOC is readily transformed into GHGs. This pattern is hypothesized to result from the presence of less aromatic molecules originating from vascular plants and Sphagnum moss exudates formed under anaerobic conditions, in areas where the water table is close to the surface. With declining Water Table Depth (WTD), this more labile carbon becomes exposed to aerobic conditions, enhancing microbial respiration and promoting GHG emissions.
Lateral DOC export at the outlet of the peatland is strongly controlled at seasonal scale: export increases in spring and autumn during WTD transitions, with generally higher fluxes in winter when the water table is near the surface. In the context of climate change, with progressively wetter winters and drier summers, this pattern suggests a potential intensification of winter DOC export and higher atmospheric GHG emissions during summer, thus leading both to increased annual organic carbon exports. However, the model still needs to account for changes in vegetation type and productivity to fully capture future dynamics.
Overall, this study emphasizes that understanding such a complex environment requires strong integration across scientific disciplines. The integrative framework enabled by the OZCAR  research infrastructure provides a robust foundation for a better understanding of peatland carbon dynamics at different spatial scales.

How to cite: Poteaux, N., Lhosmot, A., Steinmann, M., Calisti, R., Jacotot, A., Coffinet, S., Binet, P., Boetsch, A., Toussaint, M.-L., Joly, L., Dumelie, N., Bonne, J.-L., Longueverne, L., Pons, M.-N., Loup, C., and Bertrand, G.: Hydro-ecological controls of dissolved organic carbon dynamics and greenhouse gas emissions in a temperate peatland: A multi-disciplinary collaboration in the Frasne peatland observatory (Jura Mountains, France), EGU General Assembly 2026, Vienna, Austria, 3–8 May 2026, EGU26-12900, https://doi.org/10.5194/egusphere-egu26-12900, 2026.

Snowmelt-driven watersheds provide water for billions of people, yet warming temperatures threaten to reduce streamflow across these regions. One pathway for greater water loss is through increased evapotranspiration (ET), particularly during the warm summer growing months. However, the magnitude of summer transpiration and the water sources accessed by vegetation remain poorly understood. While snowmelt is the primary driver for peak runoff and supplies soil moisture for early summer transpiration, vegetation water use and its influence on summer baseflow are less well understood.

To study this pathway, we instrumented an 81 ha headwaters micro-catchment in the Upper Colorado River Basin (UCRB), where ET represents the largest annual water flux. This site includes eddy-flux towers, stream gages, shallow groundwater wells, sap-flux sensors, and a dense soil-moisture network. High-resolution eddy-flux observations show how ET is sustained even during extended summer droughts. Over three growing seasons, daily fluctuations in soil moisture, groundwater, and streamflow indicate roots intercept shallow groundwater to support the continued transpiration during these dry periods.

We extended this analysis basin wide across 18 headwaters catchments and observed that summer growing season conditions independently regulate streamflow, with effects rivaling those of snowpack. Warm summers suppress streamflow, causing high-snowpack years to be near-average, while cool summers elevate flow.

Together these results demonstrate upland vegetation suppresses summer streamflow in mountain headwaters by sustaining transpiration through shallow groundwater access during hot, dry periods. As warming continues, this vegetation-groundwater pathway will intensify summer streamflow declines across mountain regions, with significant implications for future water availability and management.

How to cite: Stone, H. and Maxwell, R.: Not Just Snowpack: Vegetation-Groundwater Controls on Summertime Streamflow in Colorado River Headwaters, EGU General Assembly 2026, Vienna, Austria, 3–8 May 2026, EGU26-14762, https://doi.org/10.5194/egusphere-egu26-14762, 2026.

EGU26-15714 | Posters on site | HS2.1.9

Manipulation to prediction: integrating flood experiments and AI to understand coastal forest mortality 

Peter Regier, Ben Bond-Lamberty, Pat Megonigal, Ben Sulman, Nicholas Ward, and Vanessa Bailey

Rising sea levels and intensifying storms are driving increased flooding and salinization of coastal forests, yet the mechanistic pathways linking belowground disturbances to forest mortality remain poorly constrained. We designed an ecosystem-scale flood manipulation experiment in a coastal forest to disentangle the roles of inundation and salinity in initiating the hypothesized “tree mortality spiral”. Our experimental plots are outfitted with an extensive array of sensors to complement high resolution sampling campaigns, allowing us to observe immediate and lagged responses to flooding. Experimental flooding drove rapid, consistent shifts in soil biogeochemistry indicative of oxygen stress and altered carbon cycling, followed by a lagged response in aboveground vegetation. The temporal disconnect between belowground process thresholds and observable forest impacts demonstrates how manipulative experiments can benchmark the early stages of transitions in the coastal Critical Zone. 

Building on our field-based findings and substantial AI-ready datasets produced over multiple years of flooding experiments, we are developing a coupled modeling framework that leverages both AI-based and process-based models to predict forest responses under future flooding regimes. Through this integrated approach, we aim to understand how disturbance intensity, duration, and legacy effects propagate across time and space to control coastal forest resilience. The combination of controlled large-scale ecosystem manipulation and data-driven predictive modeling provides a framework for bridging disciplines and scales—linking soil biogeochemistry, ecohydrology, and vegetation dynamics—to improve projections of coastal forest mortality and its consequences for coastal Critical Zone carbon cycling.

How to cite: Regier, P., Bond-Lamberty, B., Megonigal, P., Sulman, B., Ward, N., and Bailey, V.: Manipulation to prediction: integrating flood experiments and AI to understand coastal forest mortality, EGU General Assembly 2026, Vienna, Austria, 3–8 May 2026, EGU26-15714, https://doi.org/10.5194/egusphere-egu26-15714, 2026.

EGU26-15787 | Posters on site | HS2.1.9

Investigating the Root Zone Critical Interface in Intensively Managed Critical Zones 

Ashlee Dere, Brian Saccardi, Jinyu Wang, Jennifer Druhan, Neal Blair, Lisa Welp, Timothy Filley, Martha Jimenez-Castaneda, Sean Schaeffer, Andrew Stumpf, Erin Bauer, James Haken, Isaac Noel, Kelly Deuerling, Alison Anders, Allison Goodwell, and Praveen Kumar

The Critical Zone (CZ) in the Midwestern United States has transformed from predominantly prairie landscapes to highly productive row-crop agriculture that requires intensive management such as tillage, tile drains and fertilizer inputs. The Critical Interfaces CZ Network (CINet) project focused on three critical interfaces that are important regulators of material storage, transport and transformation in the CZ: the near-land surface, the active root zone and the river corridor. To investigate the root zone critical interface, we established instrument clusters called MIRZ (Management Induced Reactive Zone) in Illinois and Nebraska on both agriculture and restored prairie land management. The study sites differ in climate and geology: Illinois has wetter conditions (100 cm MAP) with loess over glacial till and extensive tile drainage, while Nebraska is drier (78 cm MAP), formed in loess, and lacks artificial drainage. At each site, precipitation, soil porewater (sampled at 20, 60, 110, and 180 cm depths), surface waters, tile drains, groundwater and soil gases were collected biweekly. In addition, co-located sensors were installed to monitor soil moisture, temperature, electrical conductivity, oxygen, carbon dioxide, and meteorological conditions at hourly intervals. Bulk soil measurements included geochemistry, carbon/nitrogen concentrations, mineralogy, density and particle size. Key findings from the MIRZ root zone measurements suggest that land use strongly controls how quickly water moves through soils and how much geochemical alteration occurs before water reaches streams. Longer water residence times and greater water–mineral interaction occur in agricultural soils, whereas stronger soil structure and deeper root systems in restored prairies promote rapid infiltration and more limited geochemical alteration. The geochemical similarity between agricultural porewaters and stream or tile-drain waters highlights strong hydrologic connectivity and implies that agricultural land use fundamentally alters root-zone structure, water flow paths, and ultimately stream geochemistry at the watershed scale. The diverse and deeply rooted prairie vegetation also influences soil gases, with higher carbon dioxide production rates and enhanced seasonal variability in prairie soils compared to agricultural soils. The widespread conversion of Midwestern USA prairies to intensive agriculture has therefore altered solute, carbon, and gas fluxes throughout the root zone critical interface, including the depth and intensity of the reactive zone where weathering, nutrient cycling, and carbon storage occur.

How to cite: Dere, A., Saccardi, B., Wang, J., Druhan, J., Blair, N., Welp, L., Filley, T., Jimenez-Castaneda, M., Schaeffer, S., Stumpf, A., Bauer, E., Haken, J., Noel, I., Deuerling, K., Anders, A., Goodwell, A., and Kumar, P.: Investigating the Root Zone Critical Interface in Intensively Managed Critical Zones, EGU General Assembly 2026, Vienna, Austria, 3–8 May 2026, EGU26-15787, https://doi.org/10.5194/egusphere-egu26-15787, 2026.

EGU26-16343 | Orals | HS2.1.9

The future of critical zone research in Europe imbedded in eLTER research infrastructure 

Jérôme Gaillardet and Michael Mirtl

Although scientific disciplines are becoming increasingly specialised and expert, they nevertheless isolate themselves from one another. This is particularly evident in the study of the Earth's surface. Over time, the geosciences have diverged from ecology, despite the fact that the historical concept of ecosystem (Tansley, 1935) included both biotic and abiotic components. With time and investment from also compartmented institutions, this has led to independent communities developing parallel research and equipping themselves with field laboratories (long-term observatories): geosciences focusing on the biophysical components of water, relief, and soils, and ecology focusing on biodiversity. Even within geosciences, disciplines are isolated and have developed their own “dialects”.

The Critical Zone Initiative, which originated in the US in 2003, was an attempt to encourage these different Earth science communities to collaborate at the level of instrumented scales (Critical Zone Observatories). This initiative has expanded further in Europe, particularly through the SoilTrec FP7 programme (2009–2014), the CRITEX program in France (2022-2021) or the OZCAR and TERENO research networks in France and Germany respectively. Today, these divisions are no longer tenable. The deterioration of the planet's habitability means that we need to return to a much more systemic approach to habitats that support life, particularly humans and their societies. While disciplinary expertise, particularly in experimental developments and numerical modelling, is necessary, it is far from sufficient to understand how changes in biodiversity will affect biogeochemical cycles, water and food resources.

The eLTER (Long-Term Ecosystem, critical zone, and socio-ecological) Research Infrastructure represents a unique and even historic achievement to (re)connect scientific communities working in the field of environmental and sustainability sciences on continental surfaces. At a backbone of permanently operated sites, eLTER promotes a holistic approach from the local/regional to the continental and global scales. In this contribution, we will present eLTER and show how the list of eLTER Standard Observations selected, distributed across different layers or “spheres,” and the categorization of sites (with a focus on the geosphere and hydrosphere) make it possible to capitalize on the previous works of the critical zone community and enrich it with ecological measurements or socio-ecological practices (Zaccharias et al., 2025). The services offered by eLTER RI also exploit recent advances in critical zone modeling. They provide access to a network of sites spanning large environmental conditions open to transnational access and an open data base and hence a unique opportunity for the moving forward critical zone science, at the local to global scales.

eLTER is the European future of critical zone science.

Tansley, A. G. (1935). The use and abuse of vegetational concepts and terms. Ecology,16, 284–307.

Zacharias, S., Lumpi, T., Weldon, J., Dirnboeck, T., Gaillardet, J., Haase, P., ... & Mirtl, M. (2025). Achieving harmonized and integrated long-term environmental observation of essential ecosystem variables-eLTER's Framework of Standard Observations. Authorea Preprints.

How to cite: Gaillardet, J. and Mirtl, M.: The future of critical zone research in Europe imbedded in eLTER research infrastructure, EGU General Assembly 2026, Vienna, Austria, 3–8 May 2026, EGU26-16343, https://doi.org/10.5194/egusphere-egu26-16343, 2026.

EGU26-16646 | Orals | HS2.1.9

Revisiting the meanings of the Critical Zone through the OZCAR research infrastructure example, definitions and evolutions 

Damien Jougnot, Isabelle Braud, Julien Tournebize, Brice Boudevillain, Agnès Rivière, Jean Marcais, Eliot Chatton, Sylvain Pasquet, Julien Bouchez, Héloise Bénard, and Jérôme Gaillardet

Since its first definition by the National Research Council in 2001, the concept of Critical Zone has known undeniable success over the last quarter of a century. A success that is often reflected by the evolution and diversification of its meanings. Recently, Lee et al. (2023) proposed a review that literally focuses on “the meanings of the Critical Zone”. Through an extensive review of the literature across the disciplines and journals, they have identified three loosely overlapping meanings. An ontological meaning, where the Critical Zone is mostly seen as the Earth’s spatial interface where geochemical and biological activity sustains life. An epistemic meaning, where the Critical Zone is considered a product of collaborative efforts between scientific communities to build a whole-system knowledge data-base and library. And finally, an anthropocenic meaning, where the Critical Zone is the vulnerable home of the human species. In this contribution, we aim at revisiting these three meanings through the creation and development of the French network OZCAR (Critical Zone Observatories: Research and Application).

Created in 2015 to enhance the collaborations between Critical Zone observatories (Gaillardet et al., 2018), OZCAR is a French Research Infrastructure that gathers 23 national observation services and +120 study sites in metropolitan France and on 5 continents. If most observation services existed prior to the creation of OZCAR, we have seen major evolutions over the last decade as the OZCAR community developed and bloomed. Originally conceived as a spatial definition (ontological meaning), the “Critical Zone” words in OZCAR became a vast collaborative effort to develop the whole system approach and data base (epistemic meaning). It is now also fostering transformative research aimed at preserving our planet’s habitability, i.e., the giant spaceship in which we all live together (anthropocenic meaning).

References:

  • Lee, R. M., Shoshitaishvili, B., Wood, R. L., Bekker, J., & Abbott, B. W. (2023). The meanings of the Critical Zone. Anthropocene, 42, 100377.,doi:10.1016/j.ancene.2023.100377.
  • Gaillardet, J., Braud, I., Hankard, F., Anquetin, S., Bour, O., Dorfliger, N., et al. (2018). OZCAR: The French network of critical zone observatories. Vadose Zone Journal, 17(1), 1-24, doi:10.2136/vzj2018.04.0067.

How to cite: Jougnot, D., Braud, I., Tournebize, J., Boudevillain, B., Rivière, A., Marcais, J., Chatton, E., Pasquet, S., Bouchez, J., Bénard, H., and Gaillardet, J.: Revisiting the meanings of the Critical Zone through the OZCAR research infrastructure example, definitions and evolutions, EGU General Assembly 2026, Vienna, Austria, 3–8 May 2026, EGU26-16646, https://doi.org/10.5194/egusphere-egu26-16646, 2026.

EGU26-18719 | Posters on site | HS2.1.9

Connecting Ecosystems Across Scales: eLTER Standard Observations and Critical Zone Science 

Steffen Zacharias, Jaana Bäck, Jérôme Gaillardet, and Michael Mirtl

The European Long-Term Ecosystem, Critical Zone, and Socio-Ecological Research Infrastructure (eLTER RI) aims to provide a continental-scale, site-based network for observing, understanding, and addressing major ecological, geochemical, and socio-ecological challenges. A core element of eLTER RI is the implementation of the eLTER Standard Observations (SOs), which establish a harmonised framework for the systematic collection and analysis of long-term environmental data across a diverse range of ecosystems. Ensuring methodological consistency and interoperability by the SOs is imperative in order to create a shared observational basis. Such a basis is essential for large-scale synthesis and international collaboration, particularly within the context of Critical Zone Science.

The eLTER Standard Observations adopt a multidisciplinary perspective, integrating biological, hydrological, geochemical, climatic, soil-related, and socio-economic variables. Core thematic domains include biodiversity, primary production, water quality, nutrient and carbon cycling, soil processes, and climate dynamics. This integrated design explicitly supports Critical Zone Science by enabling the coupled analysis of processes spanning the Earth’s surface, from the vegetation canopy through soils and groundwater to the underlying geology, while simultaneously accounting for human influences. Standardisation across sites and regions ensures data comparability over space and time, facilitating cross-site analyses, model development, and the identification of patterns and drivers of change.

The SOs are closely aligned with the concept of Essential Variables (EVs) and cover key elements of Essential Climate Variables (ECVs), Essential Biodiversity Variables (EBVs), and Essential Socio-Economic Variables (ESVs). Through this coverage, the SOs provide a comprehensive observational foundation to assess ecosystem status, track long-term trends, and analyse human–nature interactions. By harmonising observations and explicitly linking Critical Zone processes to existing EV frameworks, eLTER strengthens connections between national and international research initiatives and enhances the contribution of European long-term ecosystem research to global observation systems.

This presentation will outline the scope, methodology, and scientific relevance of the eLTER Standard Observations, with a particular emphasis on their role in fostering international collaboration in Critical Zone Science. It will demonstrate how the SOs support integrative ecosystem research and contribute to addressing global challenges such as climate change, biodiversity loss, and sustainable resource management through coordinated, long-term, and comparable observations.

How to cite: Zacharias, S., Bäck, J., Gaillardet, J., and Mirtl, M.: Connecting Ecosystems Across Scales: eLTER Standard Observations and Critical Zone Science, EGU General Assembly 2026, Vienna, Austria, 3–8 May 2026, EGU26-18719, https://doi.org/10.5194/egusphere-egu26-18719, 2026.

EGU26-22054 | Posters on site | HS2.1.9

DELUGE - Disturbance and Ecohydrological Legacies in Upland Great-lakes Ecosystems: An Ecosystem Scale experiment to study coastal critical zone 

Inke Forbrich, Kennedy Doro, Avni Malhotra, Etienne Fluet-Chouinard, Prince Atiti, Alaina Foster, Evangelos Grammenidis, Roberta Peixoto, Fausto Machado-Silva, Roy Rich, Sacha Brewer, Cecilia Howard, Kenton Rod, Nicholas Ward, Michael Weintraub, Patrick Megonigal, and Vanessa Bailey

Coastal ecosystems along the Great Lakes play an important role in critical element cycling between land and lake ecosystems. Because lake water levels are highly dynamic, the dominant ecosystems (marsh, swamp, upland forest) constantly respond to the varying water line. Flood pulses are important controls on plant community zonation, as well as their respective biogeochemical functions, setting the boundary between herbaceous wetlands, forested wetlands, and/or upland forest based on the respective flooding tolerance. Because lake levels are predicted to increase in future decades (e.g. 2040-2049 vs. 2010-2019), shifts in ecosystem boundaries are expected but the change in ecosystem function is currently unknown.

To understand the impact these flood pulses have on soil biogeochemistry and plant function, we are implementing an ecosystem-scale manipulative experiment to create increasingly intense flood pulses by pumping water across an elevation gradient from forested wetland to upland (DELUGE - Disturbance and Ecohydrological Legacies in Upland Great-lakes Ecosystems). We follow a before-after-control-impact design using two diked parcels in the Ottawa National Wildlife Refuge at the coast of Lake Erie, one of which will be untreated and serve as a reference. The main objective is to gain a mechanistic understanding of how the effects of freshwater flooding and subsequent drainage propagate through water, soils, microbes, and plants to cause ecosystem state changes such as tree mortality and changes in biogeochemical cycling. Here we present the experimental design, site characterization, and results from sensor-based baseline measurements which started in June, 2025. Results from DELUGE will be incorporated into multi-scale process and Earth system models, with the overarching goal of an improved predictive understanding of coastal ecosystems.

How to cite: Forbrich, I., Doro, K., Malhotra, A., Fluet-Chouinard, E., Atiti, P., Foster, A., Grammenidis, E., Peixoto, R., Machado-Silva, F., Rich, R., Brewer, S., Howard, C., Rod, K., Ward, N., Weintraub, M., Megonigal, P., and Bailey, V.: DELUGE - Disturbance and Ecohydrological Legacies in Upland Great-lakes Ecosystems: An Ecosystem Scale experiment to study coastal critical zone, EGU General Assembly 2026, Vienna, Austria, 3–8 May 2026, EGU26-22054, https://doi.org/10.5194/egusphere-egu26-22054, 2026.

The soil security situation in Africa continues to worsen endangering both food production, population health and Sustainable Development Goal (SDG) achievement. While soil degradation and contamination happen in local areas, policies remain largely at national levels or beyond. This situation exists because of an organizational dependence on low-resolution top-down geospatial information which fails to detect the micro-scale mechanisms operating within African critical zones.
The study combines data from the Critical Zones Africa (CZA) project which studied five African countries including Ethiopia, Tanzania, Malawi, Zimbabwe and South Africa to understand the reasons behind different soil policies that do not match smallholder farming practices. The study evaluates the advantages and weaknesses of multiple geospatial tools through a systematic literature review framework to analyze land-use and land-cover mapping and vegetation indices and erosion models and hydrological simulations.
The study results demonstrate that geospatial methods successfully detect large-scale patterns of land deterioration and soil erosion vulnerability, but they do not solve essential soil management problems which need higher resolution at both farm and community levels. The main blind spots exist in Ethiopia where geochemical contamination occurs, and Tanzania faces groundwater contamination because of agricultural land growth and Malawi experiences soil degradation because of deforestation and Zimbabwe and South Africa struggle with water system nutrient waste. The evaluation process for all cases shows that soil investment choices and governance decisions face limitations because the available data does not match what happens in the field.
The achievement of soil security in African critical zones needs policymakers to adopt evidence-based integrated systems which operate at suitable scales. We recommend three essential measures which include: (i) providing all of Africa with access to detailed geospatial information (ii) African soil science education needs to be revitalized while laboratory facilities must be restored (iii) All fields must undergo ground-truthing assessments while local communities need to participate in the process. The study also recommends that proposed work program for AMCEN during 2026-2028 should enable UNEP to provide high-resolution data access which will help develop soil policies that fit the specific conditions of African territories.

How to cite: Chari, M. and Green, L.: Linking geospatial science with local knowledge systems to support soil security in African critical zones, EGU General Assembly 2026, Vienna, Austria, 3–8 May 2026, EGU26-22760, https://doi.org/10.5194/egusphere-egu26-22760, 2026.

The Lilongwe River Upper Catchment Area (LRUC) exemplifies the urgent need for Critical Zone Science (CZS) in Africa, where biophysical degradation and socio-political inequities converge. This study applies a CZ lens to investigate how soil health deterioration, land commodification, governance fragmentation, and gendered struggles intersect to undermine ecological livability and community resilience. Preliminary findings reveal alarming soil erosion rates exceeding global tolerable limits, rapid land-use transformations driven by urbanization and infrastructure expansion, and persistent exclusion of women from land and resource governance.

By integrating soil health assessments, geospatial analysis, ethnographic inquiry, and participatory community engagement, the Malawi CZA team identifies critical micro-watersheds where ecological degradation and human vulnerability overlap. Modeling of Nature-Based Solutions (NbS), including reforestation, contour farming, and integrated agroecological practices, demonstrates pathways to restore soil function, regulate hydrology, and enhance resilience under future climate scenarios. Importantly, the research situates soil health as both an ecological indicator and a sociopolitical marker, revealing how commodification and complex tenure systems exacerbate inequities.

This work contributes to global CZ science by foregrounding African environmentalism and community-driven approaches, while linking directly to Sustainable Development Goals (SDGs) 1 (poverty reduction), 2 (food security), 5 (gender equality), and 15 (life on land). By framing LRUC as a social-ecological system shaped by material flows and governance structures, the Malawi CZA initiative demonstrates how CZ methodologies can inform inclusive policies, strengthen grassroots participation, and advance equitable sustainability in rapidly transforming landscapes.

How to cite: Kampanje Phiri, J.: “Our Soils are Sick”: Addressing Soil Health, Energy, Land, Governance and Gender Complexities through Critical Zone Approaches in Lilongwe River Upper Catchment Area of Malawi, EGU General Assembly 2026, Vienna, Austria, 3–8 May 2026, EGU26-23138, https://doi.org/10.5194/egusphere-egu26-23138, 2026.

Urban watersheds in sub-Saharan Africa face unprecedented environmental degradation due to rapid urbanization, inadequate infrastructure, and governance failures. Lake Chivero, a shallow hypereutrophic reservoir constructed in 1952 on Zimbabwe's Manyame River, exemplifies this crisis. Serving as the primary water source for Harare and its dormitory towns of Chitungwiza and Ruwa a combined population exceeding 2.4 million. The lake has experienced catastrophic deterioration over seven decades. This study presents an innovative multidisciplinary framework combining Critical Zone Sciences with participatory diagnosis and community engagement to address complex socio-environmental challenges threatening water security in rapidly urbanizing African contexts. This framework offers scalable insights for addressing watershed degradation across African urban centers where rapid demographic transitions outpace infrastructure development and governance capacity, demonstrating how transdisciplinary approaches can bridge science-policy-community divides to achieve sustainable water resource management.

Lake Chivero's degradation manifests across multiple dimensions. Sedimentation has consumed 18% of the reservoir's storage capacity (49,126,170.34 m³), with annual capacity losses averaging 792,357 m³ year⁻¹ since 1953. Current sedimentation rates of 352.31 m³ year⁻¹ km⁻² project a remaining useful life of merely 106.63 years, pointing to a "2050 Doomsday Scenario." Sediment composition analysis reveals concerning proportions of mud (54%), sand (24%), and silt (22%). Nutrient pollution has escalated dramatically, with combined nitrogen and phosphorus loads surging from 3,524 tons in 2000 to 38,940 tons in 2012, an increase primarily attributable to untreated and partially treated sewage effluent. This pollution has triggered extensive water hyacinth (Pontederia crassipes) proliferation, linked to sewage effluent and abattoir waste discharge. Public health consequences include cholera outbreaks, waterborne diseases, and elevated cancer incidence rates, while ecological and economic impacts manifest in green-colored water and ecosystem collapse, as well as ballooned water treatment and public costs.

The research identifies governance fragmentation and knowledge silos as critical barriers to effective watershed management. Population growth from 200,000 during the colonial era to over 2.4 million by 2022, compounded by civil conflict in the 1970s, rural-urban migration, economic structural adjustment programs (ESAP), and informal settlement expansion, has overwhelmed water and sanitation infrastructure. Policy dissonance, corruption, informal waste management through opaque private contracts, chemically intensive agriculture, and politically connected land speculation further exacerbate environmental stress.

Our methodological innovation addresses these challenges through deliberate transdisciplinary integration. The research team comprises experts in social sciences, governance, environmental science, GIS, soil science, hydrology, waste management, and renewable energy. We hypothesize that fragmented relationships among stakeholder’s stem fundamentally from asymmetric data access and exclusion of local communities from knowledge production and decision-making processes. Our approach systematically reviews published literature while collecting primary field data, then transforms scientific findings into accessible formats for policymakers, government officials, planners, and local communities.

Participatory diagnosis employs ethnographic methods including "photovoice" to capture thick descriptions of lived experiences, validating local knowledge systems alongside scientific data. GIS-based time series analysis integrates scientific measurements with ethno-environmental perspectives, creating space for authentic dialogue. This methodology enables collaborative problem identification and solution co-creation grounded in shared visions and mutual trust. Thematic analysis using NVivo software ensures rigorous qualitative data interpretation.

How to cite: Mukamuri, B.: Experimenting with Multidisciplinary, Participatory Diagnosis and Community Engagement to Rehabilitate Endangered Watersheds in African Urban Settings: The Case of Lake Chivero in Zimbabwe, EGU General Assembly 2026, Vienna, Austria, 3–8 May 2026, EGU26-23141, https://doi.org/10.5194/egusphere-egu26-23141, 2026.

The multiple roles of Kilombero Valley-Rufiji Delta as a watershed, national hub for food production and a critical landscape for biodiversity protection makes it a highly significant national and international site of interraction between different actors who represent international conservation and development partnerships, private and civil society interests, small-holder farmers and agri-business deallers. Over the years, the role of these actors in translating ecologies into financial values has transformed the social biogeophysical relations of the landscape in ways that raise concerns about the future habitability. The Critical Zone project addresses this concern by focusing on how financialization models leave issues of soil health and water quality unaddressed hence compromising the sustainability of their development interventions. Precisely, the crops are managed solely with an eye on commercial values, which miss the care for soil with agrochemicals and fertilizers increasing productivity in the short term but causing long term damage to soils and water bodies. This has downstream impacts to both biodiversity and agricultural floodplains in the Rufiji Delta. Our key question, then, is: How useful is the Critical Zone approach for improving land-use decisions for Kilombero-Rufiji landscape, in the context of Tanzania’s Green Revolution? We combine spatial and temporal biophysical analysis with bottom-up approaches that draw from people science and policy actor engagements to reflect on the future habitability of the landscape.

How to cite: Pallangyo, C.: The Changing Social and Biophysical Relations in Tanzania’s Kilombero– Rufiji Landscape, EGU General Assembly 2026, Vienna, Austria, 3–8 May 2026, EGU26-23144, https://doi.org/10.5194/egusphere-egu26-23144, 2026.

Cape Town, the legislative capital of South Africa, is renowned for is natural beauty and is ranked as one of the best developed and well governed cities in Africa. However, for whom is the city aesthetically pleasing, developed and well-governed for? When the language of development, growth and progress permeates all spheres of contemporary Cape Town city planning, what does this obscure? What are the lived experiences on the ground? The project takes the Cape Flats, an expansive low-lying area situated to the south-east of Cape Town’s central business district, as a critical zone, where urban metabolic flows shape policy and habitability. The Cape Flats, characterized by a geography defined by a unique combination of maritime geology, endangered biodiversity, wetlands, lakes and rivers, agricultural and mining land, formal and informal residential areas, industrial areas, a waste dump and several wastewater treatment works (WWTW), is marked by “slow violence”, where apartheid spatial planning and environmental degradation and contamination meet contemporary urban precarity. Described as “apartheid’s dumping ground”, the Cape Flats was where people of colour were forcibly relocated under the Group Areas Act of 1950, as well as a site where a significant portion of Cape Town’s waste is disposed of. In thinking about the critical zone, it is then important to think about how biologies, ecologies, society, geologies are shaped by this inheritance of colonial and apartheid city planning. The central question for Cape Flats’ Critical Zones project is therefore: How do Cape Town's modes of development address realities in inherited zones of abandonment and contamination in the Cape Flats critical zone? The project explores how changes in the landscape, under the guise of “development” through the different historical periods under the colonial, apartheid and contemporary neoliberal forms of governance, have shaped the poly-crises evident in the area today. Considering the Cape Flats’ critical zone from aquifer to cloud, the project explores how material flows and urban metabolic processes shape habitability, policy and politics in the area. By paying attention to how disrupted urban metabolic processes impact biodiversity, water and contamination, soil, waste cycles, infrastructure, health and governance, the project proposes an amendment to the approaches in environmental governance from one that seeks to command, predict and control, to one that sees urban ecology as urban metabolisms of flows and relations.

How to cite: Solomon, N.: Urban Metabolisms: What makes for Habitability in the Cape Flats Critical Zone, in Cape Town, South Africa, EGU General Assembly 2026, Vienna, Austria, 3–8 May 2026, EGU26-23148, https://doi.org/10.5194/egusphere-egu26-23148, 2026.

The climate-related risks in South Africa’s Raymond Mhlaba Municipality and similar rural regions include erratic rainfall, recurring droughts, heatwaves, and shifting seasons. These directly threaten agricultural productivity, leading to frequent crop losses and food insecurity. Vulnerability is heightened by reliance on rain-fed small-scale farming, minimal irrigation infrastructure to buffer against climatic shocks, and the use of old farming methods.

The government uses radio, television, newspapers, and flyers to communicate climate change, and universities are trying to produce more extension officers to assist farmers, but the challenge remains unaddressed.  The root causes of this vulnerability are multi-layered: weak data dissemination systems, socio-economic marginalization, land tenure insecurity, infrastructure deficits, and regulatory and governance gaps. Consequently, farmers make key agricultural decisions such as when and what to plant without critical zone science knowledge, leading to frequent crop losses, wasted inputs, and heightened poverty.

As such, having a Climate-Adapt-Farm-Wise-AI (CAFW-AI) which can inform the farmer about the climate change and provide customised suggestions to a farmer to a) use conservation agriculture, drought-tolerant crop varieties, and precision irrigation to enhance productivity and climate resilience b) integrate adaptation and mitigation strategies across the entire food value chain to ensure sustainable food production and reduce greenhouse gas emissions c) employ Sustainable Agricultural Practices (SAPs) such as agroforestry and millet resilience to improve soil health and enhance food security in climate-vulnerable regions, based on their geographical area.

These techniques are crucial for fostering innovation and resilience in agricultural economies, especially in the face of climate change. By integrating these innovations, farmers can enhance productivity, reduce environmental impact, and ensure food security.

The proposed solution to the problem 

The initiative introduces an AI-enabled, open-source mobile platform that delivers localized, real-time agricultural advisories to rural small-scale farmers in climate-vulnerable regions such as the Eastern Cape. Its strategies are threefold:

  • Localized Climate-Smart Decision Support:

By integrating real-time weather data from IoT sensors (local weather stations), information, and Indigenous Knowledge Systems (IKS), the AI model generates tailored recommendations on crop selection, planting times, and resource use. This ensures that decisions are data-driven, context-specific, and actionable for farmers with limited resources.

  • Accessible Communication Channels: The platform disseminates advisories via SMS/USSD in local languages (e.g., isiXhosa), bridging the digital divide for communities with limited or no smartphone access.
  • Feedback-Driven Learning: Farmers contribute local observations (e.g., rainfall, soil moisture, pest outbreaks) into the system. AI processes these inputs alongside satellite and meteorological data, enabling continuous model refinement and ensuring the system evolves with changing conditions.

What sets this initiative apart is the role of real-time weather data from IoT sensors (local weather stations), AI in combining heterogeneous data sources (real-time weather, soil characteristics, and farmer inputs) to generate hyper-local insights that would not be possible through traditional extension methods. Previously, climate advisories were generalized, delayed, and fragmented; now, AI enables predictive analytics and personalized recommendations at scale, even in remote areas.

How to cite: Vambe, W. T.: Climate-Adapt-Farm-Wise-AI (CAFW-AI): Utilizing IoT, AI, and Machine Learning to Enhance Decision-Making and Protect Crops More Effectively Against Climate Change, EGU General Assembly 2026, Vienna, Austria, 3–8 May 2026, EGU26-23177, https://doi.org/10.5194/egusphere-egu26-23177, 2026.

This study examines the hydrological, pedological, ecological, and socioanthropological evidence to unpack the drivers of land transformation in the Central Rift Valley (CRV) of Ethiopia. It identifies a nexus of unsustainable land use, over-extraction of water (leading to dramatic lake-level decline), industrial pollution, soil degradation, and biodiversity loss. These interlinked pressures manifest as acute resource scarcity, compromised water and food safety, heightened socio-economic insecurity, and organized violence as a desperate means to reclaim lost rights, a cascading crisis that is further aggravated by climate change.

A critical driver is state policy that prioritizes export-oriented agribusiness, such as floriculture. These policies grant flower farms preferential access to land and water, leading to the over-extraction and chemical pollution that degrade lakes and soils. While the flower farm investment aims to create jobs and boost the national revenue, it often affects the community through pollution, resource competition and dispossession.  Toxification of water from industry activities, water overextraction by both commercial farms and industry,  clearing of woodlands not only disrupts ecosystems but also dismantles the material basis of indigenous cultural orders, such as the Oromo moral-ecological code Safuu, which once regulated resource use and conflict resolution.

While trends of environmental change in the CRV are well-documented, the usual analytical and governance frameworks remain inadequate. Conventional approaches often treat soil, water, and biodiversity as isolated commodities, overlooking the fundamental biophysical and social processes that sustain these systems. Moreover, these frameworks lack meaningful community engagement. This underscores the necessity for transdisciplinary co-design processes that involve local farmers and indigenous communities to identify the problems and search for suitable repair mechanisms. This study applies a Critical Zone Science (CZS) framework to demonstrate how discrete forms of degradation are causally linked. For instance, soil degradation drives sedimentation and nutrient loading into lakes, exacerbating the shrinkage of lakes and aquatic biodiversity loss. Contaminants from floriculture cause widespread toxification and a human health crisis. Deforestation disrupts microclimates and hydrological cycles, while the erosion of cultural governance creates a vacuum in which resource scarcity fuels protracted violence.

Viable solutions, therefore, depend on integrating local knowledge with scientific. This study advocates for a paradigm shift to process-based, Critical Zone-centered governance, an approach that prioritize community-driven resource management, locally adapted climate responses, and the restoration of both ecological functionality and culturally legitimate conflict-resolution mechanisms to secure a sustainable future for the CRV.

How to cite: Degefa, S.: Navigating the Polycrisis: Flower farms in the Web of Unsustainable Practices Transforming Ethiopia’s Central Rift Valley, EGU General Assembly 2026, Vienna, Austria, 3–8 May 2026, EGU26-23182, https://doi.org/10.5194/egusphere-egu26-23182, 2026.

A critical zone-based environmentalism understands that local habitability arises primarily in Earth’s material exchanges across bedrock, aquifers, soils, plants, and the lower atmosphere. With support from the Science For Africa Foundation, the Critical Zones Africa (CZA) consortium is working in specific locales of five African countries to understand how societal and policy processes are affecting circulations of water, soil nutrients and contaminants. This paper presents a first comparative assessment of these relations, and explores their implications for landscape governance, social sciences, and landscape repair.

Beginning with forensic accounts of flows and movements of water, soil nutrients and contaminants in landscapes, ie both horizontal and vertical relations, CZA team studies have explored where, how and why harms to habitability have arisen.  If environmental governance sciences are to shift from their current basis in finance, property and objects, to molecular and energy flows and the processes between them, the comparative aspect of the CZA project asks with what concepts and analytics might damaged relations be described, understood, and remediated? 

A first step to building a politics capable of habitability repair, is to recognise how specific patterns of social relations and concepts affect landscape flows, movements, interactions and transformations of matter and materials.

Reflecting comparatively on the research findings emerging from the CZA studies, this paper sets out a critical zone-based social science for local governance.

How to cite: Green, L.: Critical Zone Science, Social Sciences and Local Governance: An overview of the Critical Zones Africa Research Programme, EGU General Assembly 2026, Vienna, Austria, 3–8 May 2026, EGU26-23229, https://doi.org/10.5194/egusphere-egu26-23229, 2026.

The HSRC’s policy study component of the CZA project is anchored on the wide acknowledgement of the importance of building habitable futures by including bio-geophysical aspects of place in local governance. CZ thinking-informed policy practices are particularly relevant in African contexts, where livelihoods are closely tied to the geophysical ecosystem and climate variability. In these contexts, CZ approaches provide a powerful approach to informing policy innovations that are knowledge-plural and contextualized within lived realities. 

To date, this in-progress study of policy in specific places provides evidence that policy development and implementation activities continue to ignore the complex interaction of  societal practices, institutional arrangements, and biophysical processes. Drawing on foundational CZ literature and an analysis of selected site policies and data from science-policy-societal engagements conducted in Ethiopia and Zimbabwe, the study demonstrates how environmental policy practices continue to be narrowly shaped by fragmented, sector-based governance frameworks and profit-oriented thinking, in which financialised relations, historical legacies, and knowledge hierarchies shape whose voices are included in policy processes.  This narrow framing leads to policy interventions that compromise the biogeophysical ecosystems resulting in problems such as material flows that lead to contamination and loss of wetlands and hydrological cycles (Tanzania’s Rufiji Delta, Zimbabwe’s Lake Chivero and the Cape Flats in South Africa); as well as soil quality degradation and loss (Ethiopia’s Central Rift Valley and Malingunde in Malawi). Over time, these non-inclusive policies create a feedback loop in which degraded ecosystems  have limited adaptive capacity and future livelihoods and habilitability are  compromised.  What this study shows is that land use land cover change is not simply due to ‘humans’, as so much of the LULC literature suggests, but that specific macroeconomic policies and approaches to local governance, which pay little attention to biogeophysical relations with society, have a significant responsibility – and therefore also the potential to make a difference.

The presentation argues for policy process innovations that transcend discipline boundaries between society, economy and biogepphysical relations, integrating different knowledge systems and adopt adaptive approaches capable of responding to uncertainty and long-term change. Where co-creative and  collaborative policy development  and implementation practices bring together scientists, policymakers, and communities as co-producers of knowledge, there is  potential for improved governance that builds habitable futures. By foregrounding knowledge plurality in policy as a tool, this presentation contributes to the session’s focus on international innovation and collaboration, and demonstrates how critical zone science can meaningfully inform local governance and policy across varied regional contexts.

How to cite: Sobane, K.: Innovating Environmental Governance through Critical Zone Thinking: Lessons from the Global South, EGU General Assembly 2026, Vienna, Austria, 3–8 May 2026, EGU26-23241, https://doi.org/10.5194/egusphere-egu26-23241, 2026.

EGU26-2404 | ECS | Posters on site | ITS3.7/BG10.5

Host diversity and landscape structure drive genospecies-specific Lyme disease risk across Eurasia 

Yifan Sun, Yinsheng Zhang, and Sen Li

Lyme disease, caused by Borrelia burgdorferi sensu lato (s.l.), is the most prevalent tick-borne disease in the Northern Hemisphere, posing an escalating global health challenge driven by climate change and land-use transformation. However, mechanistic understanding of how environmental factors govern genospecies-specific transmission remains limited.

We compiled the first comprehensive Eurasian dataset of B. burgdorferi s.l. prevalence, comprising 2,528 records from 522 publications across 43 countries (2000–2023). The dataset encompasses 73 tick species from 6 genera and documents 18 Borrelia genospecies. We applied causal-pathway modeling to disentangle direct, indirect, and cascading effects of climate, land cover, landscape structure, and host biodiversity on pathogen prevalence, with host diversity taxonomically stratified according to genospecies-specific reservoir ecology.

Our results reveal distinct biogeographic patterns shaped by vector-host specificity. Ixodes ricinus dominates transmission in Europe while I. persulcatus prevails in Asia. B. afzelii predominates in Central and Western Europe, whereas B. garinii exhibits transcontinental distribution from Western Europe through Russia to East Asia. Critically, B. afzelii prevalence was co-regulated by climate, forest fragmentation, and landscape diversity, and declined significantly with increasing rodent species richness. This provides the first continental-scale empirical support for the dilution effect hypothesis in Eurasia. Forest fragmentation showed opposing pathways: directly amplifying prevalence through edge effects while indirectly suppressing transmission by enhancing host diversity. In contrast, B. garinii showed no detectable host diversity effects but responded directly to temperature and landscape diversity, reflecting reliance on highly mobile avian hosts whose infection status integrates exposure across multiple migratory stopover sites.

These findings reveal fundamental transmission heterogeneity among genospecies with critical implications for disease surveillance and control. Effective management must integrate genospecies-specific ecology with landscape management, unifying biodiversity conservation, climate adaptation, and planetary health protection.

How to cite: Sun, Y., Zhang, Y., and Li, S.: Host diversity and landscape structure drive genospecies-specific Lyme disease risk across Eurasia, EGU General Assembly 2026, Vienna, Austria, 3–8 May 2026, EGU26-2404, https://doi.org/10.5194/egusphere-egu26-2404, 2026.

Unveiling horizontal gene transfer (HGT) of antibiotic (ARGs) and metal(loid) resistance genes (MRGs) in hospital sewage is critical for surveilling antimicrobial resistance (AMR) mobility that poses huge threats to public health. Using metagenomic shotgun sequencing, we provided an integrate insight into AMR characters and the relevant HGT in untreated sewage from one of the world’s largest comprehensive hospitals from Oct 2022 to Aug 2023. We uncovered higher richness and diversity of ARGs or MRGs than mobile genetic elements (MGEs), while MGEs exhibited the highest abundance, suggesting great HGT potentials. Higher number of ARG, MRG, and MGE subtypes and abundances of putative human pathogens were found in autumn-winter than in spring-summer. ARG- and MGE-carrying prokaryotes outcompeted non-carriers in abundances, and multi-ARG and MGE carriers outcompeted single ones. Resistome supercarriers occupying 25% of prokaryotic abundance harbored higher functional diversity and more metabolic capacity than other prokaryotes, which could be related to more predicted HGT events. Notably, 30%, 22%, and 40% of prokaryote-carrying ARGs, MRGs, and MGEs were associated with HGTs. Diversity variation of plasmids as a critical contributor to HGT was positively correlated with those of prokaryotes and ARGs or MRGs. Plasmids carrying high-risk ARGs (e.g., multidrug and tetracycline types) showed higher abundances than prokaryotes and viruses. Most bacterial taxa may undergo high levels of active viral replication (phylum-specific virus/host abundance ratios > 12). Hundreds of virulent viruses could lyse abundant ARG or MRG supercarriers and hosts of multidrug, multi-metals, and As resistome, whilst one temperate virus infecting multiple Azonexus supercarriers may contribute the HGT of Hg resistome. We found the dominance of stochasticity in assembling of ARGs/MGEs rather than prokaryotes or viruses, which was likely owed to functional redundancy led by HGT. Overall, this study sheds lights on a pivotal role of HGT in driving microbial community and functionality, and provides a guidance for the optimization of the treatment strategies particularly on MGEs.

How to cite: Liu, S.: Close interactions between prokaryotes and plasmids or viruses highlight a pivotal role of horizontal gene transfer in shaping antibiotic/metal(loid) resistome and their prokaryotic supercarriers in untreated hospital sewage, EGU General Assembly 2026, Vienna, Austria, 3–8 May 2026, EGU26-2515, https://doi.org/10.5194/egusphere-egu26-2515, 2026.

Southern Kenya and northern Tanzania form a shared rangeland system where climate stress, land use change, and intensifying human livestock wildlife interactions produce concentrated risks to planetary health. We assess the contribution of One Health Community Clubs in the Amboseli ecosystem of Kenya and the Enduimet Longido landscape of Tanzania, two ecologically connected yet administratively distinct settings. Each club integrates local expertise in environmental monitoring, human health surveillance, and livestock and wildlife health, operationalizing One Health at community and landscape scales.

A spatially explicit approach links community observations to mapped grazing areas, wildlife corridors, settlement growth, and water point networks that shape exposure to disease, ecosystem degradation, and livelihood vulnerability. Long term monitoring from Amboseli, including rainfall, pasture biomass, wildlife movements, livestock health, and human wellbeing, demonstrates how community clubs act as localized observatories connecting environmental diaries with georeferenced datasets. In Enduimet, accelerating fencing, agricultural expansion, and drought driven mobility are tracked through participatory mapping, syndromic disease reporting, and seasonal resource monitoring.

Cross border comparison highlights asymmetric risks within shared ecosystems, particularly around wetlands and dry season refugia. We show that effective scaling depends on networked expansion rooted in spatial units and harmonized indicators, enabling aggregation across landscapes and time to support early warning, adaptive management, and policy relevant planetary health action.

How to cite: Mose, V. and Kimiti, K.: Advancing Planetary Health through One Health Community Clubs in East Africa’s Cross-Border Areas, EGU General Assembly 2026, Vienna, Austria, 3–8 May 2026, EGU26-3951, https://doi.org/10.5194/egusphere-egu26-3951, 2026.

EGU26-6175 | Orals | ITS3.7/BG10.5

An interpretable framework for assessing zoonotic spillover risk 

Yinsheng Zhang, Yifan Sun, Sophie Vanwambeke, and Sen Li

Zoonotic diseases pose significant threats to global health, as evidenced by the COVID-19 pandemic. Despite their impact, our understanding of pathogen spillover mechanisms remains incomplete due to data limitations and methodological challenges. Here we integrate machine learning approaches with ecological models to predict and quantify spillover risks globally. We first systematically assess current limitations in ecological epidemiological modeling, then develop a framework that utilizes pathogen emergence events as critical indicators for spillover risk. Through ensemble machine learning combined with causal inference, we map global spillover risk patterns and identify key climatic, environmental, and socioeconomic drivers. We further apply this framework to tick-borne disease systems across Europe, demonstrating that hierarchical environmental constraints—from macroclimatic phenology to landscape configuration—differentially shape vector abundance and disease prevalence. We show that development intensity sets boundaries for tick population establishment, while landscape features determine realized abundance within climatically suitable areas, with effect magnitudes varying across biogeographic contexts. This interdisciplinary approach advances spillover risk assessment and provides evidence-based guidance for One Health strategies integrating environmental, vector, and human health surveillance.

How to cite: Zhang, Y., Sun, Y., Vanwambeke, S., and Li, S.: An interpretable framework for assessing zoonotic spillover risk, EGU General Assembly 2026, Vienna, Austria, 3–8 May 2026, EGU26-6175, https://doi.org/10.5194/egusphere-egu26-6175, 2026.

EGU26-6626 | ECS | Orals | ITS3.7/BG10.5

Population awareness about the impact of environmental factors on their health: tackling the complexity with appropriate statistical modeling. Examples from the Italian risk factor surveillance system. 

Mattia Stival, Angela Andreella, Gaia Bertarelli, Catarina Midões, Stefano Tonellato, and Stefano Campostrini

Awareness of planetary health, i.e., the understanding of how environmental changes affect human health and wellbeing, is a crucial yet often underestimated prerequisite for the effectiveness of climate change mitigation and adaptation policies. Individuals’ awareness shapes risk perception, supports behavioural change, and public acceptance of environmental and health interventions. This is especially relevant for climate-sensitive health threats, whose emergence and geographic expansion are driven by rising temperatures, altered precipitation patterns, and environmental degradation. Despite their growing relevance, awareness of these indirect and often delayed health impacts of environmental change remains poorly understood.

This study contributes to this challenge by investigating how individual- and territory-level factors jointly shape subjective environmental perceptions, a key dimension of planetary health awareness. Environmental perception encompasses visible and immediate stressors, such as pollution, as well as broader concerns about ecosystem change and associated health risks, including the spread of infectious and vector-borne diseases affecting both human and animal health. These perceptions may influence preparedness, adaptive behaviors, and support for preventive interventions. 

We analyze data from the environmental module of PASSI (Progressi delle Aziende Sanitarie per la Salute in Italia), the Italian national health surveillance system, and integrate them with contextual information at the municipal level. Covariates include socio-economic indicators, PM2.5 exposure, and geographical features linked to climate-related risks, including those associated with vector ecology and disease transmission. This integrative framework reflects the inter- and trans-disciplinary nature of planetary health research, combining public health surveillance, environmental epidemiology, and spatial socio-economic analysis. Methodologically, we adopt a penalized semi-parallel cumulative ordinal regression model to address the ordered nature of environmental perception outcomes while allowing for flexible, non-parallel effects of high-dimensional selected covariates. Beyond inference, the model is used as an analytical tool to identify determinants most strongly associated with positive environmental perceptions and with neutrality, the latter interpreted as a potential indicator of limited or uncertain planetary health awareness.

The results reveal substantial heterogeneity across Italian territories, indicating that local environmental and socio-economic contexts play a central role in shaping awareness. Individual characteristics interact with contextual conditions in complex ways, confirming that planetary health awareness emerges from multi-level processes. Greater exposure to hazardous environmental factors, particularly elevated PM2.5 concentrations, is associated with poorer environmental perception, suggesting that respondents can recognize specific environmental stressors that may also serve as proxies for broader climate-related health risks, including vector-borne diseases.

This work demonstrates how combining health surveillance data with contextual environmental information and advanced statistical modeling can enhance the understanding of planetary health awareness. The findings provide policy-relevant insights to support place-sensitive, wellbeing-centered interventions aimed at strengthening public awareness and resilience to climate-driven health threats affecting humans, animals, and ecosystems.

Authors are funded by the European Commission grant 101136652. The five Horizon Europe projects, GO GREEN NEXT, MOSAIC, PLANET4HEALTH, SPRINGS, and TULIP, form the Planetary Health Cluster. The views and opinions expressed are only those of the authors and do not necessarily reflect those of the European Union or the European Commission. Neither the European Union nor the European Commission can be held responsible for them.

How to cite: Stival, M., Andreella, A., Bertarelli, G., Midões, C., Tonellato, S., and Campostrini, S.: Population awareness about the impact of environmental factors on their health: tackling the complexity with appropriate statistical modeling. Examples from the Italian risk factor surveillance system., EGU General Assembly 2026, Vienna, Austria, 3–8 May 2026, EGU26-6626, https://doi.org/10.5194/egusphere-egu26-6626, 2026.

EGU26-6804 | ECS | Posters on site | ITS3.7/BG10.5

Integrating Earth Observation and Multi-Agent Modelling to Assess Climate and Land-Use Impacts on Large Herbivore Movement in Amboseli, Kenya 

Angela Wanjiku, Annelise Tran, Renaud Marti, Victor N. Mose, and Pierre Sosnowski
Large herbivores, like other living organisms, are susceptible to environmental degradation, climate extremes, and anthropogenic activities. As heterotrophic primary consumers, they depend on vegetation and water resources, which require seasonal and spatial movement within ecosystems to meet nutritional and reproductive needs. Frequent climate extremes, such as recurrent droughts, disrupt ecosystem functioning. These disruptions lead to habitat degradation, altered movement patterns, increased disease incidence, and higher wildlife mortality.
In the Amboseli ecosystem in Kenya, large herbivores, both wild and domesticated, including elephants (Loxodonta africana), giraffes (Giraffa camelopardalis), zebras (Equus quagga), and cattle (Bos taurus), experience compounded ecological and anthropogenic pressures. These pressures, including the shift toward sedentary land use, land subdivision, and urbanization, have further restricted animal movement and reduced access to forage and water resources.
This study integrates Earth observation and environmental datasets to evaluate the dynamics of ecological and human activities. Using Sentinel-2 imagery, we derived vegetation indices (EVI, NDVI, and MSAVI)  and the water index (NDWI). These indices were supplemented with data on rainfall, elevation, temperature, road networks, human settlements, and the 2024 land-cover classification. These data, together with the in situ animal species location data collected in May 2024, were incorporated into a multi-agent-based modeling approach using the Ocelet language and platform to simulate the movement of elephants, giraffes, zebras, and cattle within the ecosystem.
The results reveal species-specific spatial interactions, preferred habitat zones, areas of ecological disruption, and potential movement corridors and barriers. This integrative approach provides insights into the effects of climate variability and land-cover change on animal movement and ecosystem health.

How to cite: Wanjiku, A., Tran, A., Marti, R., Mose, V. N., and Sosnowski, P.: Integrating Earth Observation and Multi-Agent Modelling to Assess Climate and Land-Use Impacts on Large Herbivore Movement in Amboseli, Kenya, EGU General Assembly 2026, Vienna, Austria, 3–8 May 2026, EGU26-6804, https://doi.org/10.5194/egusphere-egu26-6804, 2026.

EGU26-7150 | ECS | Posters on site | ITS3.7/BG10.5

Simulating the radiative transfer budget of the Amboseli National Park (Kenya) to support vegetation monitoring using remote sensing 

Pierre Sosnowski, Thibault Catry, Victor Mose, and Nicodemus Mwania

MOSAIC is a European project using Open Science to address Planetary Health challenges by co-designing information ecosystems with local stakeholders. One study area is the cross-border rangelands of southern Kenya and northern Tanzania, where Maasai pastoralists face increasing drought, overgrazing, and loss of habitat diversity. In Amboseli National Park, woodland and bushland have declined while grasslands and swamps expanded over the past five decades, affecting wildlife and pastoral livelihoods.
The African Conservation Center combines aerial surveys, plot measurements, and the Normalized Difference Vegetation Index (NDVI) computed by NASA’s MODIS to monitor grazing pressure and total biomass. However, NDVI is least sensitive to living plant biomass during severe droughts, is strongly influenced by soil background, and empirical biomass relationships are difficult to transfer across space and time. The lack of long-term field measurements against which to calibrate remotely-sensed indices remains an essential limitation.
Radiative transfer (RT) modeling simulates the propagation of radiation with all physical mechanisms that lead to remote sensing (RS) acquisitions. It is thus a powerful tool to tackle the latter challenges. Using the DART model, this study aims at quantifying the effect of above-ground biomass (AGB), leaf chlorophyll content, soil type and spatial resolution of RS acquisitions on NDVI values across Amboseli National Park’s 8 main habitats. The methodological objective is to calibrate DART for the Amboseli landscape. Work will focus on compiling instrumental, optical, structural, and geometric parameters through literature review and targeted field measurements. Preliminary results suggest AGB loss and vegetation dryness are processes that can be differentiated by comparing distribution of NDVI values over time, (2) spatial resolution affects the discriminative power of the approach, (3) soil type has a significant influence on the mode of the distribution, even under dense forest canopy.
The final goal is to both develop operational indicators to support local decision-making as well as a transferable and replicable approach, in the spirit of the MOSAIC project.

How to cite: Sosnowski, P., Catry, T., Mose, V., and Mwania, N.: Simulating the radiative transfer budget of the Amboseli National Park (Kenya) to support vegetation monitoring using remote sensing, EGU General Assembly 2026, Vienna, Austria, 3–8 May 2026, EGU26-7150, https://doi.org/10.5194/egusphere-egu26-7150, 2026.

EGU26-8214 | ECS | Posters on site | ITS3.7/BG10.5

Understanding climate drivers of the current and future spread of sand flies and sand fly borne veterinary diseases in Portugal 

Vasilije Matic, Milica Tošić, Angela Xufre, Suzana Blesić, and Carla Maia

We used the cross-correlation wavelet transform analysis to understand connections between the change of climate and climatic variables and the change in the number, appearance, and spread of sand flies and diseases they carry in Portugal. We were particularly interested to understand this dependance to be able to model the numbers and spread of canine leishmaniasis (CanL), a veterinary sand fly borne disease. Efficient prevention of CanL is critically dependent on our understanding of drivers of the disease and effective mechanisms of early warning for veterinary sector. Like other disease vectors, sand flies are vulnerable to climate change and are therefore perfect indicators of how local or even global climatic changes may affect their distribution and the infection incidence and spread of the diseases they transmit.

To understand this dependance, we were using historical datasets from sand fly surveillance from Portugal and diagnostic data from Portuguese veterinary laboratories, as proxy records for the numbers of sick dogs. These two datasets form our animal health record. We cross-correlated it with the corresponding temperature, precipitation, and soil moisture data.

Our results show a pattern of time lags between the changes in hydro-meteorological variables and changes in numbers of sand flies and numbers of CanL cases. We hypothesize that these patterns relate to meteorological conditions during the winter and spring that precedes each sand fly season. We will present and discuss these preliminary results. 


Funding: The PLANET4HEALTH consortium is funded by the European Commission grant 101136652. The five Horizon Europe projects, GO GREEN NEXT, MOSAIC, PLANET4HEALTH, SPRINGS, and TULIP, form the Planetary Health Cluster. The CLIMOS consortium is co-funded by the European Commission grant 101057690 and UKRI grants 10038150 and 10039289. The six Horizon Europe projects, BlueAdapt, CATALYSE, CLIMOS, HIGH Horizons, IDAlert, and TRIGGER, form the Climate Change and Health Cluster.

How to cite: Matic, V., Tošić, M., Xufre, A., Blesić, S., and Maia, C.: Understanding climate drivers of the current and future spread of sand flies and sand fly borne veterinary diseases in Portugal, EGU General Assembly 2026, Vienna, Austria, 3–8 May 2026, EGU26-8214, https://doi.org/10.5194/egusphere-egu26-8214, 2026.

To address climate change and land use and land cover change (LULCc), many studies have introduced new concepts in each field. Notably, One Health and Ecosystem Service (ES) are prominent. Integrating these concepts is essential for a comprehensive evaluation of regional ecosystem health. This study defines the changes in ESs that encompass core One Health pillars (Human-Animal (food)-Environment) as Integrated One Health-Ecosystem Dynamics (IOHED).

To demonstrate this assessment’s applicability, we evaluate the 5-year dynamics (2019–2024) of ecosystem health in Gyeonggi-do, the region the most significant LULCc in South Korea. By analyzing the interrelationships among key ES indicators through the lenses of trade-off, synergy, and degradation. Goals include, 1) quantifying four key ES indicators covering One Health for 2019 and 2024, 2) identifying relationships between services, 3) analyzing the spatial aspects of service degradation, and 4) evaluating the potential of IOHED-based ecosystem health assessments.

To achieve this, the core One Health pillars were matched with the four ES categories: human wellbeing (cultural); crop production (provisioning); biodiversity (supporting); and water supply (regulating). Each ES indicator is evaluated using GeoEPIC, InVEST Annual Water Yield, Habitat Quality (HQ), and Urban Nature Access models. The results of 2019 and 2024 are compared to quantify changes, applying a three-step threshold analysis to distinguish significant signals from noise: 1) a ±5% change rate filter, 2) a 95%, and 3) a 90% confidence interval filter.

We hypothesize that changes in Gyeonggi-do environment between 2019 and 2024 will have changed the balance of IOHED. Given the region’s dynamic land-use shifts, quantifying the four ESs (human well-being, crop production, biodiversity, and water supply) that encompass the core three pillars of One Health through this analysis will reveal that land-use changes to increase crop production in certain areas will lead to degradation of biodiversity and water supply services (degradation) and deepen trade-off between services. In particular, spatial degradation hotspots, which appear mainly in areas where LULCc is severe, will clearly identify the point where existing synergy relationships collapse. The IOHED-based comprehensive health index derived from this case study is expected to provide a key scientific basis for prioritizing sustainable land management and conservation from the perspective of One Health.

This study bridges ES and One Health concepts by demonstrating their practical application in a rapidly changing landscape. The indicators identified and the case-based findings could serve as a methodological cornerstone for future ecosystem health assessments. Furthermore, the study contributes by proposing a statistical approach to integrate and interpret outputs from four disparate models with varying units. However, several limitations remain. First, this study is limited in that it serves as a case study rather than a practical evaluation of the entire country, merely demonstrating its potential. Second, the HQ and UNA models do not sufficiently reflect the unique characteristics of Korea. Therefore, future research should utilize models that incorporate Korea's distinct environmental traits to conduct a nationwide comparison.

This research was supported by Basic Science Research Program through the National Research Foundation of Korea(NRF) funded by the Ministry of Education(RS-2021-NR060142)

How to cite: Kim, S., Bi, J., and Lee, J.: Integrated Assessment of Ecosystem Services and One Health Dynamics in Gyeonggi-do: A Case study Focusing on Human, Food, and Environment Indicators, EGU General Assembly 2026, Vienna, Austria, 3–8 May 2026, EGU26-8544, https://doi.org/10.5194/egusphere-egu26-8544, 2026.

African swine fever (ASF) is a transboundary viral disease causing severe impacts on national animal health systems in wild and domestic suids. Since its official report in North Korea in 2019, ASF has posed a persistent threat to livestock production, public health, and ecological safety on the Korean Peninsula. Wild boars are recognized as a key reservoir and vector facilitating long-distance spread of ASF, particularly across national borders. However, in North Korea, critical information on outbreak locations, wild boar population density, and transmission pathways remains inaccessible, making risk assessment and preparedness extremely challenging.
   
This study aims to estimate the potential origin and spatial and temporal spread of ASF in North Korea, despite severe data limitations, by following the method from Ko and Cho et al. (2023), applying an agent-based modeling (ABM) and machine-learning framework. In the model, we simulate the wild boar migration and ASF virus transmission. Wild boar sounders were represented as agents whose movement, social structure, reproduction, and contact behaviors were parameterized using ecological and physiological information from the literature-based database. ASF transmission was simulated through local contacts among agents in a spatially explicit landscape, and infection trajectories were tracked over time to estimate transmission pathways and the timing of potential arrival at the Demilitarized Zone (DMZ).
   
Two introduction scenarios were examined based on proximity to reported outbreaks in northeastern China and prior epidemiological evidence: Usi County in Jagang Province, the only officially reported outbreak site in North Korea (Scenario 01), and Hoeryong City in North Hamgyong Province, where suspected early mortality events were reported (Scenario 02). Repeated simulations were conducted for each scenario to identify dominant spread patterns and temporal dynamics.
   
While Scenario 01 successfully reproduces the large-scale southward diffusion pattern toward the DMZ, and Scenario 02 remains constrained mainly by topography, the model fails to capture the short elapsed time from the emergence of ASF in North Korea to its arrival at the DMZ in 2019. This temporal mismatch indicates that, although wild boar-driven spatial spread is plausibly represented, additional mechanisms—such as human-mediated long-distance transmission, earlier widespread circulation before official reporting, or multiple introductions including trade-related pathways—are likely required to explain the observed dynamics.
   
Overall, this study demonstrates how agent-based modeling can be used to reconstruct plausible disease spread scenarios in data-scarce regions and provides insights for prioritizing transboundary surveillance and control strategies along the Korean DMZ.

How to cite: Ko, C., Ko, D., and Cho, W.: Estimating the Potential Origin of African Swine Fever on the Korean Peninsula: Backcasting North to South Transmission, EGU General Assembly 2026, Vienna, Austria, 3–8 May 2026, EGU26-9095, https://doi.org/10.5194/egusphere-egu26-9095, 2026.

Human activities on earth result in global disturbances of natural systems that manifest as natural resource exploitation, pollution, climate change and biodiversity loss which negatively impact human health in turn. In response, the concept of Planetary Health (PH) has emerged, recognizing the need for a systemic understanding of interconnectedness between human health and that of the natural systems on which it depends. Cities constitute a relevant ground for health interventions as they are currently home to more than half of the world’s population and paradoxically also among the most vulnerable locations for the impact of human-induced PH pressures.

Despite its growing scientific prominence, the field of PH lacks in action-based research. Therefore, this review seeks to map the existing evidence of approaches that operationalize the planetary health concept, and its application across urban contexts. It illuminates entry points and provides guidance for PH researchers, educators, local governments and urban planners in the pursuit of operationalizing PH in urban areas.

A literature search for peer-reviewed publications was conducted across 7 databases (N=7843), using the keyword “Planetary Health.” Using the PRISMA-ScR extension guidelines a team of 3 researchers identified 35 articles for the final synthesis.

The included studies consist of various types of research investigating how the concept of PH can be operationalized in urban areas. Some approaches are associated with PHs conceptual foundations in the form of frameworks, literacy/ education models and practices, as well as the formulation of measurement and evaluation methods. Then there are applied approaches, consisting of interdisciplinary PH research-projects, diverse case studies and papers that examine PH’s application potential within policy.

Among the heterogenous application of the concept across a diversity of contexts, the review identified several best practices, draws out present conceptual and research limitations, as well as challenges and opportunities for embedding the concept across diverse disciplines and as part of various urban interventions.   

How to cite: Nicke, A. C.: Exploration of Planetary Health Approaches in Urban Areas - A Scoping Review, EGU General Assembly 2026, Vienna, Austria, 3–8 May 2026, EGU26-10279, https://doi.org/10.5194/egusphere-egu26-10279, 2026.

Climate change, land-use intensification, and biodiversity loss are rapidly reshaping animal distributions and human–animal interfaces, altering the geography and seasonality of zoonotic disease hazards. For avian influenza, migratory wild birds act as long-distance carriers while domesticated hosts amplify transmission and generate major socioeconomic impacts through poultry losses, trade disruption, and livelihood shocks. Yet the global, seasonally varying wildlife–livestock interface that underpins spillover and amplification risk remains poorly quantified. Here we develop a data- and model-based indicator that captures the potential for contact between wild avian hosts and key domesticated host groups across seasons. We combine seasonal distribution estimates for thousands of confirmed or putative avian influenza host species with spatially explicit domestic host layers to derive a gridded, season-resolved "interface intensity" index. We then assess whether spatial and seasonal fluctuations in interface intensity align with reported outbreak occurrence. The indicator reveals pronounced seasonal reorganization of high-interface zones, with peak interface intensity concentrated in low latitudes during boreal winter and expanding toward temperate regions in boreal summer. Persistent high-interface areas emerge in parts of Southeast Asia and several regions in Africa, consistent with long-recognized surveillance priorities. Interface intensity is strongly associated with outbreak reports, particularly for poultry in boreal winter, highlighting its value for anticipating periods and places of elevated transmission pressure. Our approach provides a scalable One Health tool that can be integrated with climate and land-use projections to evaluate future shifts in zoonotic risk and to inform targeted surveillance and preventative interventions. 

How to cite: Zhang, Q., Li, Z., and Dong, J.: Mapping the seasonal wild bird–livestock interface to support global early warning of avian influenza under planetary change, EGU General Assembly 2026, Vienna, Austria, 3–8 May 2026, EGU26-12421, https://doi.org/10.5194/egusphere-egu26-12421, 2026.

EGU26-12838 | Posters on site | ITS3.7/BG10.5

High-Resolution PM2.5 Exposure Modelling for Nationwide Assessment of Respiratory Mortality Risks in South Africa 

Sourangsu Chowdhury, Thandi Kapwata, Caradee Wright, Chantelle Howlett-Downing, Iulia Marginean, Erlend I.F. Fossen, and Kristin Aunan

Fine particulate matter (PM2.5) is a major environmental health risk, yet long-term, high-resolution exposure assessments remain limited across sub-Saharan Africa. Robust exposure estimates are essential for quantifying health impacts and informing mitigation policies. This study focuses on developing a high-resolution, machine-learning-based PM2.5 dataset for South Africa and demonstrates its application for assessing short-term mortality impacts using country-wide daily respiratory mortality data.

We developed a daily PM2.5 exposure dataset for South Africa using an XGBoost regression framework, trained on ground-based PM2.5 measurements from 2007–2021. Predictors include satellite aerosol optical depth (AOD), meteorological variables (temperature, relative humidity, precipitation, wind speed), soil moisture, road density, population, carbon monoxide (CO), nitrogen dioxide (NO2), emission data from EDGAR, and cyclic temporal predictors (sine and cosine of day-of-year and month). Model performance is strong, with R = 0.95, R² = 0.86, RMSE = 10.9 µg m⁻³, and MAE = 4.15 µg m⁻³, demonstrating high skill in capturing spatial and temporal variability. Using the resulting exposure dataset, we assess population exposure patterns across South Africa and apply a Distributed Lag Non-Linear Model (DLNM) to link district-level daily PM2.5 exposure to all-cause mortality over 1997–2018. Models control for temperature, relative humidity, precipitation, co-pollutants, day of week, and seasonal trends, following established epidemiological approaches. Effect modification by demographic and socio-economic characteristics is explored through stratified analyses.

The high-resolution PM2.5 dataset reveals widespread and persistent exceedances of the South African daily air quality guideline (40 µg m-3). In the highly populated Johannesburg–Pretoria region, PM2.5 exceeds this threshold on more than 50% of days, while elevated concentrations are also common in coastal cities such as Cape Town, Durban, and East London, particularly during winter. Population-weighted PM2.5 exposure has increased by more than 5% nationally between 2000 and 2023, indicating a growing public health concern. Preliminary epidemiological analyses are consistent with existing evidence from comparable settings, suggesting increased mortality risks associated with short-term PM2.5 exposure, with ongoing work to quantify effect sizes and vulnerable sub-populations.

This study provides the first nationwide, high-resolution PM2.5 exposure dataset for South Africa based on machine learning, offering substantial improvements over existing products. The results highlight widespread guideline exceedances, rising population exposure, and the potential for significant health impacts. The framework enables robust future assessments of air pollution - health relationships and supports evidence-based air quality management and health equity policies in South Africa.

How to cite: Chowdhury, S., Kapwata, T., Wright, C., Howlett-Downing, C., Marginean, I., Fossen, E. I. F., and Aunan, K.: High-Resolution PM2.5 Exposure Modelling for Nationwide Assessment of Respiratory Mortality Risks in South Africa, EGU General Assembly 2026, Vienna, Austria, 3–8 May 2026, EGU26-12838, https://doi.org/10.5194/egusphere-egu26-12838, 2026.

EGU26-17758 | ECS | Posters on site | ITS3.7/BG10.5

Prioritization of planetary health through health technology assessment: A scoping review  

Andres Madriz Montero, Frederike Kooiman, Francis Ruiz, Jane Falconer, Vanessa Harris, and Fiammetta Bozzani

Background

Policymakers lack structured, evidence-based processes and robust value assessments to guide planetary health investments. Health technology assessment (HTA)—a well-established framework for evidence-informed priority setting—has been proposed to address human and planetary health challenges under climate change. We aimed to assess whether existing evidence on adaptation can inform the prioritisation of planetary health interventions by examining their alignment with HTA criteria and decision-support tools.

Methods

We conducted a scoping review of adaptation interventions targeting climate-sensitive diarrheal disease or its determinants. Nine databases were searched from inception to May, 2025: BIOSIS Citation Index, CINAHL Complete, Econlit, Embase Classic+Embase, Global Health, GreenFILE, Medline ALL, Scopus and Web of Science Core Collection. Data was extracted on climate hazards, adaptation characteristics, outcomes, and HTA-relevant dimensions. Narrative synthesis and evidence gap maps were used to summarise patterns and identify gaps.

Findings

In total, 2924 studies were identified of which 88 studies describing 129 distinct adaptations were analysed. The findings highlight a disparate evidence base, with minimal alignment with HTA evaluative criteria or tools that facilitate prioritization within HTA, such as standardized criteria, economic evaluation and methods for addressing uncertainty.

Interpretation

As climate change alters diarrheal disease patterns, governments must balance investments between current service delivery and future climate risks. Evidence on adaptation for diarrheal disease remains limited to inform such trade-offs from an HTA perspective. These findings highlight research needs for advancing adaptation evaluation and evolving HTA from a human to a planetary health focus.

How to cite: Madriz Montero, A., Kooiman, F., Ruiz, F., Falconer, J., Harris, V., and Bozzani, F.: Prioritization of planetary health through health technology assessment: A scoping review , EGU General Assembly 2026, Vienna, Austria, 3–8 May 2026, EGU26-17758, https://doi.org/10.5194/egusphere-egu26-17758, 2026.

EGU26-18116 | ECS | Orals | ITS3.7/BG10.5

Coastal Currents: Reflections on Community Science towards Participatory Risk Knowledge Building in Coastal Localities of Pagbilao, Quezon and Puerto Galera, Oriental Mindoro, Philippines 

Harianne Gasmen, John Bryan Salamanca, Kathleen Baez, Rodrigo Narod Eco, Riza Marie Fausto, Czarina Molly Savares, Devralin Lagos, Ma. Linnea Tanchuling, Cesar Allan Vera, Malou Vera, and Alleta Yñiguez

This paper brings together the reflections of external scientists, academics, and activists collaborating in a community science project, supported by a broader community-based research program, “Supporting our seas through automated and integrated networks (SUSTAIN): strengthening ocean observation and management of risks to coastal ecosystems” in the Philippines. Through this initiative, community development practitioners and scientists from allied fields collaborate with fishers and rural coastal community members in the municipalities of Pagbilao and Puerto Galera. Many communities face increasing vulnerabilities linked to corporate fish cage operations, proliferation of invasive species, pollution, gentrification from tourism, development aggression by energy projects, port construction and expansion, and many others. These issues are often rooted in structures that maintain economic hegemony of urban enclaves over rural communities, eroding rural livelihoods, displacing agricultural and coastal spaces, and widening disparities among populations. 

Discussions on Pakikipamuhay (Community Immersion), Pag-organisa ng Pamayanan (Community Organizing), and Kwentuhang Kababaihan (Women's Conversations) offer insights into community science processes and dilemmas, coastal resources and uses, gendered risks, and governance issues in Pagbilao Bay and Puerto Galera. The presentations examine through intersecting lenses how fisherfolk communities collectively analyze and interrogate government and external experts’ marine spatial plans and coastal zoning. This paper hopes to shed light on how community science becomes a tool for emancipatory knowledge production, sharing, and application based on explicit social justice goals and participatory process. In particular, the discussion highlights how communities’ sense-making imagines and creates actions to reject value-free ocean observation research and instead promote a participatory science where coastal communities reclaim their voice and power in coastal resource governance.

Ultimately, this paper aims to glean lessons on community science beyond the implementation of the project, and to think and rethink science work and knowledge co-creation process towards transformative work with coastal communities.

How to cite: Gasmen, H., Salamanca, J. B., Baez, K., Eco, R. N., Fausto, R. M., Savares, C. M., Lagos, D., Tanchuling, Ma. L., Vera, C. A., Vera, M., and Yñiguez, A.: Coastal Currents: Reflections on Community Science towards Participatory Risk Knowledge Building in Coastal Localities of Pagbilao, Quezon and Puerto Galera, Oriental Mindoro, Philippines, EGU General Assembly 2026, Vienna, Austria, 3–8 May 2026, EGU26-18116, https://doi.org/10.5194/egusphere-egu26-18116, 2026.

EGU26-18432 | Posters on site | ITS3.7/BG10.5

Spatio-Temporal Diagnostics Reveal Early Signals of Sand Fly Range Shift in Europe 

Majid Soheili, Ehsan Modiri, Oldrich Rakovec, Carla Maia, Eduardo Berriatua, Antonios Michaelakis, Suzana Blesic, and Luis Samaniego

Climate change is reshaping the distribution of vector-borne disease risk in Europe by altering the environmental suitability and phenology of disease vectors such as phlebotomine sand flies, which transmit leishmaniasis. Despite regional observational evidence of sand fly range expansion from Mediterranean areas toward more temperate latitudes, quantitative multi-year diagnostics of such shifts remain limited. Building on the Sand Flies Extreme Prediction Population (FEPO) model, which provides high-resolution daily predictions of sand fly densities across Europe, we introduce a suite of spatio-temporal diagnostics to quantify distributional shifts in density predictions.

We applied these diagnostics to FEPO output for 2021 and 2022 across four Phlebotomus species (P. papatasi, P. perniciosus, P. sergenti, and P. tobbi), using a threshold-based occupancy metric, a density-weighted centroid, and the 95th-percentile front latitude as indicators of spatial redistribution. Using mid-month sampling (one day per month) to balance computational efficiency with seasonal coverage, we detect consistent northward shifts between the two years. Centroid latitude increased by approximately 0.09–0.39° (about 11–44 km) across species, while the 95th-percentile front latitude advanced by approximately 0.17–0.49° (about 19–54 km). The occupied area exceeding a density threshold of 0.1 (model units) increased for all species (0.4–4.5%), with the largest expansion observed for P. perniciosus. Monthly diagnostics further indicate that these shifts are seasonally modulated, with the strongest front differences occurring in the cool season and early spring. As an illustrative example, for P. papatasi, the centroid shifted north by approximately 0.21° (about 23 km) and the front advanced by approximately 0.49° (about 54 km), accompanied by an approximately 2.5% increase in occupied area.

These preliminary two-year diagnostics demonstrate an emergent northward redistribution of predicted sand fly densities in FEPO projections, consistent with broader climatic pressures on vector ecology. While limited in temporal span, the observed shifts highlight the potential of spatio-temporal diagnostics to reveal directional trends in vector population forecasts and to inform public health preparedness.


Acknowledgement: The CLIMOS consortium is co-funded by the European Commission grant 101057690 and UKRI grants 10038150 and 10039289. CLIMOS is one of the six Horizon Europe projects, BlueAdapt, CATALYSE, CLIMOS, HIGH Horizons, IDAlert, and TRIGGER, forming the Climate Change and Health Cluster. We also thank the EDENext and VectorNet initiatives, as well as the regional data providers and individual contributors, for their essential datasets.

How to cite: Soheili, M., Modiri, E., Rakovec, O., Maia, C., Berriatua, E., Michaelakis, A., Blesic, S., and Samaniego, L.: Spatio-Temporal Diagnostics Reveal Early Signals of Sand Fly Range Shift in Europe, EGU General Assembly 2026, Vienna, Austria, 3–8 May 2026, EGU26-18432, https://doi.org/10.5194/egusphere-egu26-18432, 2026.

EGU26-19220 | Orals | ITS3.7/BG10.5

Impacts of groundwater level change on ecosystems and societies worldwide 

Elisabeth Lictevout, Feifei Cao, Elie Gerges, Claudia Ruz Vargas, and Andrew Pearson

Groundwater is vital to human and ecosystems, yet it is largely affected by anthropogenic activities, including groundwater extraction and climate change, which have modified groundwater processes and behaviour. This has led to changes in groundwater level long-term trends. Through a collaborative effort involving 47 countries distributed across a range of climatic, geographic, hydrogeological and socioeconomic contexts worldwide, we have collated updated groundwater level data from national monitoring networks. This unprecedented in-situ dataset provides a unique opportunity to conduct a harmonized assessment of groundwater level trends worldwide over the past 20 years. Based on a novel quantitative analysis, we identified regional patterns and hotspots. We conducted a targeted review, linking observed trends to their actual consequences, offering insights into who and what is affected by groundwater changes and how.  We show that almost one third of the groundwater levels trends are declining – thus reflecting overexploitation of groundwater – while groundwater levels are rising in 18% of wells – not always indicating a recovery but also the consequence of human impact on the environment. We show that both rising and falling groundwater levels have substantial impacts on water and food security, ecosystems, infrastructure and socioeconomic wellbeing. By linking global groundwater trends with their practical impacts, our work provides the foundation for evaluating whether the adverse impacts of groundwater use and human activities outweigh the benefits, supporting a more effective, evidence-based sustainable groundwater management. It highlights the need for broader international participation and data sharing to ensure continuous refinement of groundwater assessment. Understanding and analysing the impacts at different scales can support decision-making on which impacts are acceptable, which are not, thus supporting the estimation of sustainable groundwater extraction. The extent of the impacts of GWL changes in so many aspects of life underscores the urgent need to integrate and mainstream groundwater in development plans.

How to cite: Lictevout, E., Cao, F., Gerges, E., Ruz Vargas, C., and Pearson, A.: Impacts of groundwater level change on ecosystems and societies worldwide, EGU General Assembly 2026, Vienna, Austria, 3–8 May 2026, EGU26-19220, https://doi.org/10.5194/egusphere-egu26-19220, 2026.

EGU26-19324 | ECS | Orals | ITS3.7/BG10.5

Improving Land Cover Semantic Segmentation through Deep Supervision 

sara mobsite, Renaud Hostache, Laure Berti-Équille, Emmanuel Roux, and Joris Guérin

Increased interactions between humans, animals, and the environment contribute to wildlife habitat fragmentation and increase the risk of infectious disease emergence and transmission. These interactions can be characterized and analyzed through an understanding of land use and land cover (LULC) dynamics and spatial characteristics. LULC characterization is a key preliminary step for addressing eco-epidemiological questions using a landscape-based approach. The landscape, as the observable outcome of the spatio-temporal dynamics of environmental, animal, and human populations and their interactions at different spatial and temporal scales, allows the adoption of One Health and Planetary Health approaches. 

Automated analysis and characterization of LULC can be achieved through the application of deep learning techniques to satellite data. However, supervised pixel-level LULC classification using deep learning requires large amounts of expert-verified labeled data. When working with high-resolution imagery, the availability of well-labeled datasets is considerably more limited than for low-resolution products. In addition, class imbalance, underrepresentation of certain land cover categories, and their uneven spatial distribution pose major challenges. As a result, models relying on a single learning task often exhibit limited generalization performance in real-world settings. 

To address these challenges, we propose a deep learning autoencoder architecture that leverages both high- and low-resolution land cover maps. The model uses combined optical Sentinel-2 and radar Sentinel-1 data as input to the encoder. During decoding, low-resolution land cover maps are incorporated to capture the global spatial structure of the landscape. This information, introduced at early decoding stages, guides the learning process toward meaningful semantic representations at coarser scales. Subsequently, deeper decoding layers focus on learning finer semantic details under the supervision of high-resolution labels. 

We evaluated the proposed approach using the DFC2020 dataset, which consists of 5,128 samples with original LULC maps at 10-meter spatial resolution. Low-resolution supervision maps were generated by downsampling the original labels using nearest-neighbor interpolation. We assessed the impact of introducing deep supervision at different decoder depths. Results show that applying deep supervision early in the decoder with a weighting factor of 0.10 yielded the best performance. The mean Intersection over Union (IoU) improved from 46.28% ± 2.28 to 53.82% ± 0.71 across five independent runs. Moreover, the proposed model outperformed the widely used U-Net architecture, which achieved an IoU of 50.93% ± 1.25. 

These results demonstrate the effectiveness of deep supervision in enhancing pixel-level land cover classification by exploiting low-resolution information to improve global feature learning prior to refining fine-scale spatial details. This work was conducted within the framework of the MOSAIC Horizon Europe project, part of the Planetary Health cluster. 


How to cite: mobsite, S., Hostache, R., Berti-Équille, L., Roux, E., and Guérin, J.: Improving Land Cover Semantic Segmentation through Deep Supervision, EGU General Assembly 2026, Vienna, Austria, 3–8 May 2026, EGU26-19324, https://doi.org/10.5194/egusphere-egu26-19324, 2026.

EGU26-20935 | Orals | ITS3.7/BG10.5

Linking Plastic Pollution and Antimicrobial Resistance: Insights from the Italian Case Study of the TULIP Project 

Stefania Marcheggiani, Olga Tchermenscaja, Maria Rosa Loffredo, and Ifra Ferheen

Climate change, plastic pollution, and antimicrobial resistance (AMR) represent interlinked global threats that collectively influence the emergence, persistence, and dissemination of antimicrobial-resistant bacteria in aquatic ecosystems. The EU-funded TULIP project addresses these intertwined challenges in rivers, lakes, and coasts as a single, compounded risk to both human and planetary health (https://tulip-project.eu). Within the TULIP project, the Italian case study integrates strategic sampling methods using artificial plastic substrates and combination of advanced molecular and microbiological techniques to investigate the spread of ARBs and the mechanisms driving antimicrobial resistance in aquatic environments. The study is conducted in the Latium Region (Italy) on two urban-influenced surface waters: the Tiber River, classified as a very large river (RL2) under the Water Framework Directive (2000/60/EC), and its major tributary, the Aniene River. Sampling campaigns were conducted from the winter season (November 2024) through the summer season (June 2025) to capture seasonal variability and to assess the influence of temperature fluctuations on the persistence and dissemination of ARBs in aquatic ecosystems. The outcomes of this study are expected to generate robust insights into the key processes underpinning the emergence, and dissemination of AMR in aquatic environments. In particular, the findings are anticipated to provide scientific evidence on the role of plastic waste as an environmental reservoir and transmission vector for antimicrobial-resistant bacteria and resistance genes, highlighting plastics as a potential route of human exposure to AMR via aquatic pathways. Framed within a Planetary Health perspective, this evidence may support the development of nature-based and low-cost mitigation strategies to reduce the environmental release of AMR and associated resistance genes, with particular relevance for regions lacking conventional wastewater treatment infrastructure.

How to cite: Marcheggiani, S., Tchermenscaja, O., Loffredo, M. R., and Ferheen, I.: Linking Plastic Pollution and Antimicrobial Resistance: Insights from the Italian Case Study of the TULIP Project, EGU General Assembly 2026, Vienna, Austria, 3–8 May 2026, EGU26-20935, https://doi.org/10.5194/egusphere-egu26-20935, 2026.

Despite great reductions in the global burden of diarrheal disease, it remains a leading cause of mortality among children under five years old. Climate change threatens these gains, as extreme weather events such as floods, droughts, and heavy rainfall following dry periods are associated with increased risk. The impacts of climate change on childhood diarrheal disease burden depend on interactions between climate hazards, vulnerabilities, and pathogen exposures, although pathogen-specific impacts are not well understood. Improved understanding of how hydrometeorological factors influence pathogen-specific diarrheal disease is needed to predict future diarrheal disease risk and inform preventive action. The SPRINGS project (Supporting Policy Regulations and Interventions to Negate aggravated Global diarrheal disease due to future climate Shocks) brings together scientists from multiple disciplines to collaborate with communities, public authorities, and policymakers to address these challenges within a Planetary Health framework. The case study in Akuse, Ghana integrates epidemiology, environmental sampling, and weather data.  

This study aims to determine how hydrometeorological variables influence the incidence of medically-attended diarrheal disease among children under five in Akuse, Ghana. More specifically, this study aims to assess whether the influence of hydrometeorological variables on diarrhea is direct or acts through intermediate impacts on water quality and other water, sanitation and hygiene (WaSH) factors. By identifying climate-sensitive transmission pathways, this study will improve projections of future diarrheal disease risk and identify potential targets for intervention to mitigate the impact of climate change on diarrheal disease in this area in Ghana. 

This two-year epidemiological study employs a case-control study design, with a nested case-crossover study. Children under the age of five presenting to four selected health facilities with and without diarrheal disease will be recruited as cases and controls, respectively. Surveys administered by local nurses will collect data about individual- and household-level risk factors, including WASH conditions and animal ownership. In addition, stool samples will be collected to estimate the attributable incidence of diarrheal disease due to four key diarrheal pathogens: rotavirus, Campylobacter, Cryptosporidium, and Giardia. Local weather conditions during the study will be monitored by weather stations positioned near each health facility. Throughout the study, water samples will be collected from various sources in the study area to be tested for multiple water quality parameters, including the presence of the four diarrheal pathogens of interest. Additionally, anthropological research will improve the understanding of human behaviours and perceptions related to diarrheal disease risk and climate change in this area.  

By linking weather variability, environmental pathogen presence, WASH factors, and child health outcomes, this study illustrates how a Planetary Health approach can improve understanding of climate-sensitive diarrheal disease risk and provide evidence to inform adaptation strategies and child health interventions in Ghana.

How to cite: Kooiman, F.: The influence of hydrometeorological variables on childhood diarrheal disease: A Planetary Health approach, EGU General Assembly 2026, Vienna, Austria, 3–8 May 2026, EGU26-22160, https://doi.org/10.5194/egusphere-egu26-22160, 2026.

EGU26-22188 | Posters on site | ITS3.7/BG10.5

City thermal comfort under the heatwave conditions. 

Aneta Afelt, Kamil Leziak, and Wojciech Szymalski

Every city is characterised by a specific climate. Depending on the type of land use, the characteristics of the land cover, such as colour and the permeability of the surface, or the construction materials used in the urban space, there are locally large horizontal and vertical differences in air temperature in the city, defined by the local energy balance of the surface area. The varieties are represented by the topoclimatic units. Each of the topoclimatic types can be characterised by a specific sensitivity to the occurrence of high air temperature, which has its direct impact on the parameters of thermal bioregulation of an individual while in the urban space. The thermal stress impact on health and living comfort is well recognised and defined, but results are presented mostly for big city agglomerations. As European settlement structure is slightly less concentrated, we are willing to examine if medium-sized European cities are sensitive to heatwave stress.
We modelled the response for the conditions of high and extremely high air temperature for four towns in Poland, Central Europe: Wołomin, Pruszków, Wieliczka, Żory, in a resolution of 30 to 30 metres. We demonstrate the relationship between topoclimate and human thermal stress under outdoor conditions of high and extremely high air temperature (30°C and 35°C). The impact of the air temperature on humans is presented as the UTCI index (perceived temperature). Results prove that high, very high and extremely high thermal stress is a significant and important problem in medium-sized cities (40 000-70 000 inhabitants); spatially, thermal stress is strongly related to the density of the urbanised fabric. The most resilient are the topoclimate units containing green and blue infrastructure. Results suggest that targeted actions in urban space – reshaping topoclimates to resilient structures – could play the key role in mitigating the effects of heat waves. These measures are of considerable importance in the context of adaptation to forecast climate change and health protection. Results suggest that high-resolution spatial modelling of human thermal stress could be one of the key parameters in spatial planning as a part of health risk management.

How to cite: Afelt, A., Leziak, K., and Szymalski, W.: City thermal comfort under the heatwave conditions., EGU General Assembly 2026, Vienna, Austria, 3–8 May 2026, EGU26-22188, https://doi.org/10.5194/egusphere-egu26-22188, 2026.

EGU26-2837 | ECS | Posters on site | ITS1.10/BG10.6

Satellite observations reveal large-scale restoration interventions reversing deforestation in Ethiopia 

Tenaw Workie, Martin Brandt, Philippe Ciais, Max Gaber, Petri Pellikka, and Alemu Gonsamo

Land degradation, deforestation and climate change have exacerbated droughts in Ethiopia, severely threatening its agriculture dependent economy. This led to large-scale restoration initiatives such as Sustainable Land Management Program (SLMP), Reduction of Emission from Deforestation and Forest Degradation Plus (REDD+) and the Green Legacy Initiative (GLI). GLI reported planting 32 billion trees since 2019, yet evidence remains limited. Here, we developed a deep learning framework robust to geolocation errors to monitor nationwide canopy height dynamic at 10m resolution to conduct intervention specific outcome assessments. We found a net gain of 23,537 km² in tree cover with trees above 8m height over the period 2019-2024. The large gain in young trees offsetting loss of tall trees is attributed to recent tree planting initiatives such as the GLI, REDD+, SLMP and expansion of commercial plantation by the small landholder farmers. SLMP and REDD+ interventions yielded the largest mean canopy height gains albeit in smaller areas.  Our results demonstrate measurable evidence that large-scale restoration interventions in Ethiopia are reversing the long-standing deforestation trends in the country.

How to cite: Workie, T., Brandt, M., Ciais, P., Gaber, M., Pellikka, P., and Gonsamo, A.: Satellite observations reveal large-scale restoration interventions reversing deforestation in Ethiopia, EGU General Assembly 2026, Vienna, Austria, 3–8 May 2026, EGU26-2837, https://doi.org/10.5194/egusphere-egu26-2837, 2026.

EGU26-7566 | Orals | ITS1.10/BG10.6 | Highlight

Machine Learning and Remote Sensing for Monitoring Tree Biomass 

Christian Igel

Tree-based ecosystems play a crucial role in climate change mitigation by sequestering atmospheric CO₂. However, tree resource monitoring practices are often inconsistent, biased, and fail to account for trees outside forests, limiting the effectiveness of carbon credit systems and restoration strategies. This talk presents recent advances in large-scale tree ecosystem monitoring enabled by machine learning and remote sensing [1]. We demonstrate methods for estimating tree biomass and carbon stocks at continental and national scales based on high-resolution satellite imagery and LiDAR data using deep neural networks. Case studies include mapping 9.9 billion trees across African drylands [5], nationwide tree mapping and carbon stock estimation in Rwanda supporting efforts to achieve net-zero emissions [3], and assessing the overlooked contribution of trees outside forests in Europe [2]. We present an application of 3D point cloud deep neural networks to predicting vegetation biomass from airborne LiDAR [4]. Furthermore, we introduce an approach for predicting vertical vegetation structure from Sentinel-2 and spaceborne LiDAR (GEDI) data at 10 meter resolution, potentially providing insights into biodiversity, biomass, and human interventions [6]. These developments pave the way for accurate, high-resolution, and unbiased monitoring of tree biomass, supporting carbon cycle modelling and informing carbon market policies.


[1] Brandt et al. High-resolution sensors and deep learning models for tree resource monitoring. Nature Reviews Electrical Engineering, 2025

[2] Liu et al. The overlooked contribution of trees outside forests to tree cover and woody biomass across Europe. Science Advances, 2023

[3] Mugabowindekwe et al. Trees on smallholder farms and forest restoration are critical for Rwanda to achieve net zero emissions. Communications Earth & Environment , 2024

[4] Oehmcke et al. Deep point cloud regression for above-ground forest biomass estimation from airborne LiDAR. Remote Sensing of Environment, 2024

[5] Tucker et al. Towards continental scale monitoring of carbon stocks of individual trees in African dryland. Nature, 2023

[6] Zhang et al. A Vertical Vegetation Structure Model of Europe. Advances in Representation Learning for Earth Observation at EURIPS, 2025

How to cite: Igel, C.: Machine Learning and Remote Sensing for Monitoring Tree Biomass, EGU General Assembly 2026, Vienna, Austria, 3–8 May 2026, EGU26-7566, https://doi.org/10.5194/egusphere-egu26-7566, 2026.

EGU26-10039 | ECS | Posters on site | ITS1.10/BG10.6

Global 1 km Reconstruction of Historical and Future Land Use with Machine Learning 

Marina Castaño, Amirpasha Mozaffari, Stefano Materia, and Amanda Duarte

Land use change is a significant source of anthropogenic carbon emissions, making it a critical yet often underrepresented component in climate projections. As next-generation Earth System Models move toward kilometer-scale resolutions to capture fine-scale land-atmosphere interactions, existing land use projections (typically provided at ≈30 km resolution) are insufficient to represent the spatial heterogeneity these models require.

Relying on coarse datasets can result in a loss of 31–54% of spatial information, introducing substantial biases in simulated terrestrial carbon sequestration and surface fluxes. To address this, we present a deep learning framework designed to downscale coarse Land-Use Harmonization 2 (LUH2) data into high-resolution 1 km mosaics covering the historical and future period from 1850 to 2100.

Our methodology employs a U-Net architecture to integrate transient anthropogenic drivers from LUH2, high-resolution environmental conditions using Köppen-Geiger climate classifications, and high-resolution population density with a suite of high-resolution static geophysical features (elevation, 2D depth-weighted soil composition, terrain characteristics). 

A key technical advancement is our distributed inference pipeline using Gaussian-weighted patch aggregation. By normalizing overlapping predictions, this approach eliminates blockiness and edge artifacts, ensuring seamless global transitions across the 1 km mosaic. Validation against the HILDA+ dataset demonstrates high fidelity, achieving a global accuracy of 94.5% and a mean Intersection over Union (mIoU) of 0.799 for primary land use classes. These results provide a continuous boundary condition that enhances the realism of carbon, water, and energy fluxes in next-generation climate simulations and digital twin infrastructures.

How to cite: Castaño, M., Mozaffari, A., Materia, S., and Duarte, A.: Global 1 km Reconstruction of Historical and Future Land Use with Machine Learning, EGU General Assembly 2026, Vienna, Austria, 3–8 May 2026, EGU26-10039, https://doi.org/10.5194/egusphere-egu26-10039, 2026.

EGU26-11690 | ECS | Posters on site | ITS1.10/BG10.6

Leveraging Differentiable Climate-Economy Models for Hybrid Modeling and Inverse Problems 

Koen Ponse, Kai-Hendrik Cohrs, Phillip Wozny, Andrew Robert Williams, Tianyu Zhang, Erman Acar, Yoshua Bengio, Aske Plaat, Thomas Moerland, Pierre Gentine, and Gustau Camps-Valls

Robust carbon cycle science and effective carbon market governance depend on accurate monitoring, transparent modelling and credible representation of climate–economic feedbacks. Integrated Assessment Models (IAMs) such as RICE provide a long-standing framework for linking carbon emissions, climate dynamics and economic development and are widely used to inform mitigation pathways, carbon pricing and international climate policy. However, traditional IAMs rely on hand-calibrated parameters, simplified damage functions and fixed ethical assumptions, limiting their ability to integrate observational data, quantify uncertainty and support evidence-based carbon management. We build on recent advances in machine learning for climate policy and introduce RICE-N-JAX, a fully differentiable implementation of the multi-region RICE-N model (Zhang et al., 2025). RICE-N extends classical IAMs with multi-agent reinforcement learning to model strategic interactions and international climate negotiations. Our JAX-based reimplementation makes the entire climate–economic simulation fast and differentiable, including carbon emissions, climate response, production, trade, mitigation decisions and negotiation dynamics. Differentiability enables a new class of hybrid, data-driven climate–economic models. Our current research focuses on two key directions. First, we develop non-parametric hybrid damage functions in which the traditional analytical damage formulation is replaced by neural or spline-based surrogates trained on empirical and scenario data. This allows the damage–temperature relationship to be learned directly from data. Second, we perform inverse modelling of ethical and behavioural parameters, such as regional risk aversion, time preferences and mitigation bias, by calibrating the model against emissions, GDP and temperature trajectories from the Shared Socioeconomic Pathways (SSPs). This enables the recovery of latent normative assumptions embedded in scenario narratives and provides a data-informed basis for policy analysis. Finally, differentiability supports gradient-based calibration, uncertainty quantification, and sensitivity analysis of carbon price trajectories, mitigation pathways, and long-term climate impacts. We demonstrate a proof-of-concept end-to-end calibration of climate damage functions and show how parameter uncertainty propagates into future economic and emissions outcomes. By bridging process-based climate–economic theory with hybrid, knowledge-guided machine learning, RICE-N-JAX provides a foundation for fast and data-driven carbon-cycle modelling. The framework supports policy-relevant applications ranging from carbon pricing and climate clubs to carbon market design, illustrating how hybrid ML can strengthen the scientific basis of carbon management and climate mitigation.

References: Zhang, T., Williams, A. R., Wozny, P., Cohrs, K.-H., Ponse, K., Jiralerspong, M., Phade, S. R., Srinivasa, S., Li, L., Zhang, Y., Gupta, P., Acar, E., Rish, I., Bengio, Y., and Zheng, S.: AI for global climate cooperation: Modeling global climate negotiations, agreements, and long-term cooperation in RICE-N, Proceedings of the 42nd International Conference on Machine Learning (ICML 2025), 2025

How to cite: Ponse, K., Cohrs, K.-H., Wozny, P., Williams, A. R., Zhang, T., Acar, E., Bengio, Y., Plaat, A., Moerland, T., Gentine, P., and Camps-Valls, G.: Leveraging Differentiable Climate-Economy Models for Hybrid Modeling and Inverse Problems, EGU General Assembly 2026, Vienna, Austria, 3–8 May 2026, EGU26-11690, https://doi.org/10.5194/egusphere-egu26-11690, 2026.

Effective, reliable, and cost-efficient soil carbon monitoring remains a critical bottleneck for the credibility of carbon farming projects. Large-scale projects are particularly problematic since soil sampling campaigns that enable monitoring are often logistically and financially challenging.  

Current carbon reporting protocols rely predominantly on monitoring supported by direct measurement of soil carbon stocks, often requiring stratified random sampling (SRS) across the project area. Although unbiased, SRS scales poorly, both logistically and financially, and quickly becomes unfeasible for large projects. Alternatives, often using Digital Soil Mapping (DSM) and remote sensing, are being used increasingly. While appearing to be more cost-effective since they generally entail collecting fewer soil samples, these alternatives increase uncertainty in reporting soil carbon, jeopardising the ability to reliably detect real change and risking trust in carbon farming projects.  

We propose a hybrid sampling-modelling alternative that integrates a cost-effective stage-sampling approach with a Bayesian areal spatial model that uses remote-sensing data to jointly optimise soil sampling costs and predictive uncertainty.  The areal spatial model is a latent Gaussian model fitted using integrated nested Laplace approximations (INLA) in a hierarchical Bayesian framework. The model uses remote-sensing covariates and in situ measurements to predict soil carbon stocks in regions not sampled during the sampling process. The result is a hybrid dataset that combines direct-measurement and model predictions with quantified uncertainty that can be used for accurate and reliable carbon monitoring or as input for other models.  

We present the results of a simulation study that quantifies the trade-offs between cost, number of samples and total uncertainty from the sampling design and the areal spatial model. We also present a case study of a 170-farm project in the United Kingdom, where we demonstrate the feasibility, cost-savings, and uncertainties of the approach. The results are compared to direct measurement, remote sensing data and DSM estimates to show that this framework offers a practical and cost-effective alternative that results in optimal uncertainties for carbon reporting.  

How to cite: Cuba, M. D. and Black, H.: A Hybrid Sampling-Modelling Approach using Direct Measurement and Remote Sensing to Optimise the Cost-Uncertainty Balance in Large Scale Carbon Monitoring and Carbon Farming Projects.  , EGU General Assembly 2026, Vienna, Austria, 3–8 May 2026, EGU26-12017, https://doi.org/10.5194/egusphere-egu26-12017, 2026.

EGU26-12145 | ECS | Orals | ITS1.10/BG10.6

A Machine-Learning Emulator of the land surface model JSBACH for High-Resolution Urban Biogenic CO2 Fluxes 

Veera Vasenkari, Leif Backman, Juha Leskinen, Hannakaisa Lindqvist, Mari Pihlatie, Leena Järvi, and Liisa Kulmala

Urban vegetation mitigates carbon and provides ecosystem services. Quantifying these benefits relies on land surface models like JSBACH, but high-resolution long-term simulations are computationally heavy and too complex for practical applications. Machine learning emulators offer a computationally efficient alternative. Here, we present daily and monthly emulators for gross primary production (GPP) and net ecosystem exchange (NEE) of CO₂ for different plant functional types (PFTs) in Helsinki: deciduous and coniferous trees, lawn, and crops represented by 50/50 weight of cereal and agricultural grass. The emulators are trained on JSBACH simulations for 1991-2015 and evaluated for 2016-2024. Predictor variables are derived from daily air temperature, precipitation, and shortwave radiation.

The emulators are based on gradient boosting models with automated hyperparameter optimization. We trained separate models for each target variable and PFT. To estimate the total value of a target variable for each 50 m × 50 m pixel in Helsinki, we combined PFT specific predictions weighted by the fractional coverage of each vegetation type within the pixel.

Emulator performance was high across all plant functional types and for both carbon fluxes. The monthly emulator outperformed the daily emulator consistently, as demonstrated by higher explained variance and lower errors for both GPP and NEE. Although the monthly emulator smoothed out short-term variability, it still reproduced total annual GPP and NEE with a level of accuracy almost matching that of the daily emulator. 

The two machine learning emulators developed in this study achieved high levels of accuracy, enabling faster simulations than the original land surface model. The daily emulator provided more detailed information on how vegetation responds to different meteorological conditions. In contrast, the monthly emulator was better suited to urban planning, offering fast and reliable information on the carbon sequestration of various PFTs over extended periods, while reducing simulation time by over 95% compared to the daily emulator.

How to cite: Vasenkari, V., Backman, L., Leskinen, J., Lindqvist, H., Pihlatie, M., Järvi, L., and Kulmala, L.: A Machine-Learning Emulator of the land surface model JSBACH for High-Resolution Urban Biogenic CO2 Fluxes, EGU General Assembly 2026, Vienna, Austria, 3–8 May 2026, EGU26-12145, https://doi.org/10.5194/egusphere-egu26-12145, 2026.

EGU26-12172 | ECS | Orals | ITS1.10/BG10.6

Artificial Intelligence Reveals a Weaker CMIP6 Terrestrial Carbon Sink with Reduced Uncertainty 

Zherong Wu, Qing Zhu, Flavio Lehner, Wu Sun, César Terrer, Trevor W. Cambron, Richard J. Norby, William K. Smith, Jiaming Wen, Yiqi Luo, Feng Tao, Ning Wei, John D. Albertson, Youran Fu, Peifeng Ma, Xiangzhong Luo, Joshua Fan, Carla P. Gomes, and Ying Sun

Terrestrial ecosystems have cumulatively sequestered 24% of anthropogenic carbon dioxide (CO2) emissions since 1850 and are critical for mitigating future climate change. However, current Earth System Models (ESMs) remain highly uncertain in projecting future trajectories of this carbon sink capacity, hampering our predictive understanding of climate mitigation potential and impeding effective climate and carbon management policies. This study develops a novel framework that harnesses deep-learning (DL) to constrain uncertainties of ESM-projected Gross Primary Production (GPP) and Net Ecosystem Production (NEP) through 2100. Specifically, we apply DL to characterize the “offset” between ESM-simulated output (using CMIP6 models) and best-available observational products (top-down, bottom-up). This offset is treated as unresolved processes by current ESMs that could be effectively resolved by DL, which, once trained during historical periods, can be applied to adjust CMIP6 projections of the future. We find that DL significantly reduces the inter-model spread of GPP by ~56% and NEP by ~66% across the CMIP6 ESM ensemble . Under the medium emission scenario (SSP 245), the ensemble mean for NEP in 2100 is much weaker, 2.42 ± 1.16 PgC yr⁻¹ compared to 5.52 ± 3.45 PgC yr⁻¹ in the raw CMIP6 projections, suggesting a current overestimation of future carbon sequestration capability. Interestingly, DL revealed a slower trajectory of NEP growth compared to the raw CMIP6 projection. Beyond curbing the uncertainties of CMIP6 projections, DL also captures key environmental sensitivities of carbon cycle processes such as CO2 fertilization and sensitivity to warming. These findings demonstrate the power of DL in effectively curbing ESMs projection uncertainties and suggest that relying solely on natural terrestrial carbon sinks for climate mitigation is unlikely to slow down climate warming.

How to cite: Wu, Z., Zhu, Q., Lehner, F., Sun, W., Terrer, C., Cambron, T. W., Norby, R. J., Smith, W. K., Wen, J., Luo, Y., Tao, F., Wei, N., Albertson, J. D., Fu, Y., Ma, P., Luo, X., Fan, J., Gomes, C. P., and Sun, Y.: Artificial Intelligence Reveals a Weaker CMIP6 Terrestrial Carbon Sink with Reduced Uncertainty, EGU General Assembly 2026, Vienna, Austria, 3–8 May 2026, EGU26-12172, https://doi.org/10.5194/egusphere-egu26-12172, 2026.

EGU26-13689 | ECS | Orals | ITS1.10/BG10.6

deepC: High-Resolution Carbon Emissions Monitoring via Spatio-Temporal Generative Data Assimilation 

Ando Shah, Nils Lehman, Philipp Hess, Ronald C. Cohen, and John Chuang

High-resolution Greenhouse Gas (GHG) estimation is critical for verifying emissions inventories and informing climate policy. Current state-of-the-art estimates rely on "bottom-up" inventories, which are expensive to maintain, subject to reporting lags, and sensitive to inconsistent data supply chains. Conversely, "top-down" global reanalysis products, such as CarbonTracker, offer high quality but lack the spatial resolution required for actionable local policy, and high accuracy estimation of individual large polluters.

To bridge this gap, we present a deepC, a method that leverages high-resolution simulation data to inform a generative prior while assimilating diverse ground-truth observations. We learn a patch-based diffusion prior from multi-resolution simulations of regional and global carbon transport to model the joint distribution of winds, surface fluxes, column concentrations, and emissions. We then apply a Bayesian posterior formulation to guide the generation process using sparse observations from six satellite missions, ground stations, and coarse global reanalysis. To ensure consistency over large regions, we employ a novel spatio-temporal Markov blanket scheme during posterior sampling, producing carbon emissions estimates at 1km resolution.

We demonstrate the model's efficacy in CONUS and Western Europe, achieving stable emissions trajectories with low error relative to high-quality ground sensor and TCCON data. Early experiments suggest that conditioning the prior on embeddings from remote sensing foundation models significantly improves generalization to unseen domains. Furthermore, the model is robust to distribution shifts -- maintaining coherence under simulated future background CO2​ levels. Finally, our approach yields well-calibrated uncertainty quantification at high inference speeds with ensemble generation, highlighting its potential for rapid, transparent emissions stocktaking, and lag-free policymaking.

How to cite: Shah, A., Lehman, N., Hess, P., Cohen, R. C., and Chuang, J.: deepC: High-Resolution Carbon Emissions Monitoring via Spatio-Temporal Generative Data Assimilation, EGU General Assembly 2026, Vienna, Austria, 3–8 May 2026, EGU26-13689, https://doi.org/10.5194/egusphere-egu26-13689, 2026.

EGU26-13805 | ECS | Posters on site | ITS1.10/BG10.6

Multimodal Machine and Deep Learning Frameworks for Soil Organic Carbon Monitoring  

Marine Mercier, Andrea Marinoni, and Sakthy Selvakumaran

Robust carbon monitoring is fundamental to the credibility of climate mitigation strategies, including carbon markets, nature-based solutions, and ecosystem restoration initiatives. Soil organic carbon (SOC), as a major and dynamic component of the carbon cycle, is traditionally quantified through soil sampling and laboratory analyses. Although accurate at local scales, these methods are costly, time-consuming, and spatially sparse, limiting their suitability for large-scale monitoring, underscoring the need for scalable and robust alternatives.

Recent advances in machine learning (ML), and particularly deep learning (DL), offer substantial potential to integrate heterogeneous data streams and reinforce the scientific basis of carbon accounting. However, the application of DL to soil carbon studies remains limited, with most existing work confined to small spatial domains and relatively modest datasets. This limitation reflects the intrinsic complexity of environmental systems, the scarcity of high-quality reference observations, and persistent challenges in multimodal data integration and model interpretability.

Using the pan-European Land Use/Cover Area Frame Survey (LUCAS) soil dataset, this study presents a multimodal deep learning framework for large-scale prediction of SOC stocks. In addition to SOC, the framework estimates texture-related proxies and ancillary soil attributes relevant to carbon stock assessment. The approach integrates a comprehensive suite of data sources, including multispectral Sentinel-2 imagery, climate time series variables, and land-cover information, to jointly exploit spectral and spatio-temporal dependencies.

The proposed architecture integrates modality-specific components tailored to each data type, enabling a coherent spatio-temporal representation of SOC dynamics. Convolutional neural networks (CNNs) are used to extract spatial patterns and vegetation–soil spectral signatures from multispectral imagery, while recurrent architectures, including long short-term memory (LSTM) networks, encode seasonal to interannual variability driven by climatic conditions. Multiple deep learning encoders are systematically compared, ranging from conventional CNN–LSTM architectures to state-of-the-art transformer and vision transformer models, in order to assess their ability to capture long-range dependencies, cross-modal interactions, and complex non-linear relationships underlying SOC distribution.

A comparative analysis further benchmarks the proposed deep learning framework against widely used machine learning methods in soil science, including Random Forest (RF), Extreme Gradient Boosting (XGB), and Multiple Linear Regression (MLR). Model performance is assessed not only in terms of predictive accuracy, but also with respect to implementation complexity and interpretability, highlighting practical trade-offs for operational deployment.

By integrating heterogeneous data sources, this work demonstrates how artificial intelligence can bridge the gap between point-based field measurements and policy-relevant carbon assessments, while supporting state-of-the-art monitoring, reporting, and verification (MRV) frameworks. This analysis contributes to ongoing efforts to develop transparent, scalable, and evidence-based carbon monitoring tools, while explicitly highlighting persistent challenges related to data bias, spatial transferability, and model interpretability.

How to cite: Mercier, M., Marinoni, A., and Selvakumaran, S.: Multimodal Machine and Deep Learning Frameworks for Soil Organic Carbon Monitoring , EGU General Assembly 2026, Vienna, Austria, 3–8 May 2026, EGU26-13805, https://doi.org/10.5194/egusphere-egu26-13805, 2026.

EGU26-13867 | ECS | Posters on site | ITS1.10/BG10.6

Integrating eddy covariance and machine learning for the spatial estimation ofcarbon exchanges in natural grasslands of the Pampa biome 

Alecsander Mergen, Josué Sehnem, Maria Pinheiro, Débora Roberti, and Rodrigo Jacques

Quantifying carbon exchanges in natural grasslands is crucial for improving management practices, estimating carbon budgets, and supporting climate mitigation policies. However, direct measurements of net ecosystem CO₂ exchange (NEE) using flux towers are spatially limited, particularly in heterogeneous biomes such as the Brazilian Pampa. This study presents a machine learning framework to upscale carbon exchange observations based on flux towers in natural grasslands used for extensive cattle production in southern Brazil. Continuous CO₂ flux measurements were obtained from multiple flux towers installed across four ecological regions representative of the Brazilian Pampa biome, encompassing different combinations of soil types, vegetation structure, climatic conditions, and grassland management. These long-term observations capture pronounced seasonal and interannual variability in NEE, driven primarily by climate variability and grazing management. Artificial neural networks (ANNs) were trained using eddy covariance flux data, meteorological variables (solar radiation, precipitation, air temperature, and humidity) derived from reanalysis products, and vegetation indicators obtained from satellite remote sensing. The trained models were applied to estimate daily NEE in other regions of the Pampa with different edaphoclimatic and vegetation characteristics where flux towers were installed. Model performance was evaluated using independent subsets of eddy covariance observations, with accuracy assessed using standard statistical metrics for this type of model. The results demonstrate that the machine learning approach successfully reproduces observed seasonal patterns and interannual variability of carbon exchanges, enabling spatially explicit estimation of carbon uptake and emissions in natural grasslands. This framework provides a scalable tool for regional carbon accounting in natural grasslands and for deriving regional emission and uptake factors. The approach contributes to improving monitoring, reporting, and verification (MRV) of nature-based climate solutions and supports policies aimed at low-carbon livestock production and conservation of the Pampa biome.

How to cite: Mergen, A., Sehnem, J., Pinheiro, M., Roberti, D., and Jacques, R.: Integrating eddy covariance and machine learning for the spatial estimation ofcarbon exchanges in natural grasslands of the Pampa biome, EGU General Assembly 2026, Vienna, Austria, 3–8 May 2026, EGU26-13867, https://doi.org/10.5194/egusphere-egu26-13867, 2026.

EGU26-14534 | ECS | Orals | ITS1.10/BG10.6

Machine-learning emulation of DGVM ensembles enables low-latency terrestrial CO2 flux estimates 

Piyu Ke, Xiaofan Gui, Stephen Sitch, Pierre Friedlingstein, Zhu Liu, and Philippe Ciais

Timely detection of climate-driven anomalies in terrestrial CO2 exchange is limited by the latency of current bottom-up and top-down flux products. Dynamic global vegetation model (DGVM) ensembles underpin the annual Global Carbon Budget, yet their reliance on forcing datasets updated on annual cycles delays the assessment of emerging extremes. Here we develop a member-wise machine-learning emulation system that reproduces monthly net biome production (NBP) from DGVM ensembles using near-real-time meteorological reanalysis and atmospheric CO2. The emulators learn each DGVM’s spatiotemporal response on a 0.5° grid, including memory effects from antecedent conditions, and can be run as an ensemble to provide both mean behaviour and spread. In strictly forward evaluation, the emulated ensemble preserves the seasonal cycle and interannual variability of global land–atmosphere CO2 exchange and captures the timing and broad spatial structure of deseasonalized anomalies. Skill is reduced in some tropical forest regions and the strongest positive and negative excursions are damped, indicating a conservative response under extremes. By replacing offline DGVM integrations with lightweight surrogates, this framework reduces product latency to approximately one month and delivers DGVM-consistent near-real-time CO2 flux estimates that can serve as operational priors for integrated carbon-cycle monitoring.

How to cite: Ke, P., Gui, X., Sitch, S., Friedlingstein, P., Liu, Z., and Ciais, P.: Machine-learning emulation of DGVM ensembles enables low-latency terrestrial CO2 flux estimates, EGU General Assembly 2026, Vienna, Austria, 3–8 May 2026, EGU26-14534, https://doi.org/10.5194/egusphere-egu26-14534, 2026.

EGU26-15228 | ECS | Posters on site | ITS1.10/BG10.6

Reconstructing Atmospheric CO2 with Flow Matching Models 

Jonathan Groß, Vitus Benson, Maurício Lima, Alexander Winkler, and Christian Reimers

Accurate estimates of the spatiotemporal distribution of atmospheric carbon dioxide (CO2) are essential to evaluate and enforce international climate agreements as well as to infer fluxes of the greenhouse gas. However, current observations are spatially sparse, with satellite and in-situ measurements providing only partial coverage of the Earth’s surface and atmosphere. Atmospheric transport models are often used to infer CO2 concentrations across unobserved regions by simulating how gases move and mix in the atmosphere. While physically grounded, these models are computationally intensive and notoriously difficult to calibrate with observational data, due to the complexity of atmospheric dynamics and the sparsity of available measurements.

This study investigates the use of generative machine learning for inpainting of CO2. More specifically, we apply flow matching, an approach that generates samples from an unknown target distribution by iteratively transforming samples from a simple known noise distribution with a deep neural network. In a first step, we train a flow matching model on assimilation data from CarbonTracker (CT2022). This trains the model to respect the physical patterns of atmospheric CO2 fields, turning it into an effective prior for data assimilation. In a second step, we test the trained flow matching model on conditional generation that is, reconstruction of atmospheric CO2 from partial observations. For this, we artificially mask parts of the CT2022’s CO2 in a way that emulates the availability of satellite measurements. In a third step, we infer global CO2 by conditioning on the total column average CO2 (XCO2) measurements from NASA’s Orbiting Carbon Observatory-2 (OCO-2), comparable to other inversions from the OCO-2 v11 MIP, but using a novel approach.

Extensive evaluation against independent and held-out test-sets from in-situ and satellite measurements show physical consistency and decent agreement of the reconstructed global CO2 fields from OCO-2 measurements. However, challenges remain: specifically, future research needs to alleviate spurious artifacts from the employed posterior conditioning method in both the artificial mask and particularly the conditioning on XCO2 before the approach can become operational.

Our presented flow matching approach opens up new avenues of research. The prior parameterized by the flow matching model can be investigated itself. For instance, it is possible to perform feature extraction inside the latent space and hence purposefully explore counterfactual scenarios of CO2 distributions by carefully tracing out paths in the noise distribution and analyzing the corresponding generated CO2 samples.

How to cite: Groß, J., Benson, V., Lima, M., Winkler, A., and Reimers, C.: Reconstructing Atmospheric CO2 with Flow Matching Models, EGU General Assembly 2026, Vienna, Austria, 3–8 May 2026, EGU26-15228, https://doi.org/10.5194/egusphere-egu26-15228, 2026.

The precise Measurement, Reporting, and Verification (MRV) of carbon stocks in small-scale afforestation and restoration forests can be served as the  foundation for subsequent carbon sink monitoring and benefit assessment.  Satellite remote sensing method, on the other hand, often  faces insufficient spatial resolution comparing to Unmanned Aerial Vehicle (UAV) imagery. UAV can capture fine details, but often results in "scale mismatch" and systematic estimation bias due to canopy shadows, background soil noise, and spectral saturation effects while applying estimation models directly. To address this technical bottleneck, this study aims to establish an automated carbon stock estimation workflow based on UAV multispectral imagery and to optimize estimation accuracy by identifying the optimal observational resolution through multi-scale analysis. 

The research methodology synchronizes field surveys with remote sensing modeling. First, a comprehensive tree-by-tree biomass inventory was conducted in sample plots. Allometric equations were used to calculate stand biomass, which was then converted into measured carbon stock to serve as Ground Truth for model validation. Subsequently, UAV multispectral images were acquired to calculate vegetation indices (e.g., NDVI) and establish regression models between spectral features and carbon stock. Furthermore, image resampling techniques were adopted to simulate multi-level spatial resolutions ranging from 0.03 to 5 m, systematically analyzing the impact of resolution changes on the Root Mean Square Error (RMSE) and the coefficient of determination (R²). This study clarifies the interference mechanism of spatial scale on canopy spectral signals and identifies the optimal aggregation scale to mitigate background noise. Ultimately, this research provides practical prediction formulas and a Standard Operating Procedure (SOP). In the future, applying this model to UAV-acquired imagery in similar restoration forests will enable rapid, automated carbon estimation without the need for time-consuming field surveys, significantly enhancing the efficiency and economic viability of carbon asset inventories.

Keywords

Aboveground Biomass (AGB), Multispectral UAV, NDVI, Allometric Biomass Model, Scale Effect, Restoration Forest, Carbon Sink Estimation

How to cite: Lee, C.-I. and Ho, H.-C.: Optimizing Aboveground Carbon Stock Estimation in Restoration Forests: A Multi-Scale Analysis of UAV Multispectral Imagery, EGU General Assembly 2026, Vienna, Austria, 3–8 May 2026, EGU26-16064, https://doi.org/10.5194/egusphere-egu26-16064, 2026.

EGU26-16105 | ECS | Orals | ITS1.10/BG10.6

Automated Segmentation of Brick Kilns and Carbon Emission Analysis Using Deep Learning and Life Cycle Assessment  

Yamini Agrawal, Shradha Deshpande, Poonam Seth Tiwari, and Hina Pande

India's brick sector produces over 350 billion bricks annually, making it a critical contributor to greenhouse gas emissions and air pollution. Despite this significance, comprehensive quantification of brick kiln carbon footprint emissions remains limited due to the absence of systematic kiln inventories. This study presents a novel approach that integrates object detection technology with Life Cycle Assessment (LCA) to quantify the carbon footprint of brick production, explicitly incorporating soil organic carbon (SOC) dynamics, a previously overlooked component in brick kiln emission accounting. YOLOv7 was used for automated detection and segmentation of brick kilns in Southwest Bengal (Haldia and Purba Medinipur) using open-source Google Earth Pro imagery. The model demonstrated robust performance with detection precision, recall, and F1-score of 0.881, 0.827, and 0.853 respectively, while instance segmentation achieved a mean IoU of 0.706 with precision 0.837, recall 0.818, and F1-score 0.827. 

The cradle-to-gate LCA reveals a total carbon footprint of 499.87 g CO₂/brick according to our methodology. SOC loss alone contributes 159.85 g CO₂/brick (32% of total emissions), establishing it as a major, previously unaccounted source. Fuel combustion (coal, biomass, agricultural residues) contributes 331.32 g CO₂/brick on average, while transportation adds 7.04 g CO₂/brick. For the 1,042 detected kilns, the estimated annual production capacity is 6.9 billion bricks, corresponding to total emissions of 3.46 Mt CO₂ under current operating conditions. This study is the first to systematically incorporate SOC-based carbon accounting into brick kiln emission assessments, substantially revising the perceived climate burden of the sector. By combining automated kiln detection with comprehensive LCA, the work provides a robust framework for environmental monitoring and supports SDG 13, 9, 11, 12, and 15 through improved emission accounting, land and resource management, and the design of regulatory instruments, carbon offset schemes, and incentives for cleaner brick production. 

How to cite: Agrawal, Y., Deshpande, S., Seth Tiwari, P., and Pande, H.: Automated Segmentation of Brick Kilns and Carbon Emission Analysis Using Deep Learning and Life Cycle Assessment , EGU General Assembly 2026, Vienna, Austria, 3–8 May 2026, EGU26-16105, https://doi.org/10.5194/egusphere-egu26-16105, 2026.

EGU26-16682 | ECS | Posters on site | ITS1.10/BG10.6

Time series of national biomass maps from deep learning applied to airborne laser scanning point cloud data 

Huntley Brownell, Stefan Oehmcke, Thomas Nord-Larsen, and Christian Igel

Abstract
More accurate local estimates of biomass and other forest attributes translate
into more accurate national-level estimates, improving forest monitoring and
informing forest policy. Higher-resolution local estimates facilitate more precise
monitoring of forest growth and harvest, allowing for better forest management
planning, and can also be used for verification of forest carbon storage, such as
for tree-based carbon credit programs and afforestation projects.


We present the first time series of high-resolution national maps of tree biomass,
carbon, volume, canopy height, and basal area produced using deep learning
methods applied to 3D point cloud LiDAR data. With hexagonal tiles of a 30
m diameter, the maps enable direct observation of stock change of aboveground
biomass, carbon, and other forest attributes at high resolution, in contrast to
inventory based estimates or coarser resolution remote sensing-based products.
We verify that our approach provides reliable estimates at the national and local
scales by comparing it to additional ground truth plot data from a time series
of local inventories.


The model was trained and validated on ground-truth data from the Danish Na-
tional Forest Inventory (DNFI) by combining field measurements aligned with
more than 20,000 sample plots extracted from two complete national LiDAR
scans. Based on [1], we apply a 3D convolutional neural network (CNN) using
the SENet50 architecture. We extended the approach to perform quantile re-
gression for uncertainty quantification. Our best model achieves an R2 of 0.83
for biomass and carbon, 0.84 for volume, 0.91 for canopy height, and 0.78 for
basal area on validation data.


We find that our model outperforms other state-of-the-art methods, which are
either based on passive 2D imagery or depend on using point cloud data indi-
rectly by extracting summary statistics. By using active LiDAR, we can derive
information from beneath tree canopies, and using the full point cloud enables
the model to learn from detailed information on forest structure, which may be
a key advantage.


The high resolution and accuracy of our method offer unprecedented potential
for time series analysis. The model is sensitive to changes at the individual tree
level, allowing for the detection of individual tree removals or growth. While
large scale forest cover change is easily detected with aerial imagery, thinnings
or partial removals are more difficult to uncover with most methods; however,
our analysis of independent repeated local inventory plots shows that our model
successfully detects smaller scale thinnings and tree growth.


References
[1] Stefan Oehmcke et al. “Deep point cloud regression for above-ground forest
biomass estimation from airborne LiDAR”. In: Remote Sensing of Environ-
ment 302 (2024).


How to cite: Brownell, H., Oehmcke, S., Nord-Larsen, T., and Igel, C.: Time series of national biomass maps from deep learning applied to airborne laser scanning point cloud data, EGU General Assembly 2026, Vienna, Austria, 3–8 May 2026, EGU26-16682, https://doi.org/10.5194/egusphere-egu26-16682, 2026.

EGU26-19700 | ECS | Orals | ITS1.10/BG10.6

Estimating carbon dynamics using H2CM: a hybrid global carbon-water cycle model 

Zavud Baghirov, Markus Reichstein, Basil Kraft, Bernhard Ahrens, Marco Körner, and Martin Jung

Process-based models (PBMs) and machine learning (ML) offer complementary strengths for representing the coupled carbon-water cycle. PBMs enforce physical principles and provide interpretable diagnostics but rely on incomplete process knowledge, many priors, and very limited use of expanding Earth observations, leading to substantial inter-model spread. ML leverages observations to uncover complex patterns and reduce reliance on assumptions, but can violate physical constraints and extrapolate poorly. Hybrid modeling combines both, uniting ML’s flexibility with PBMs’ interpretability and process consistency.

We present H2CM, a hybrid carbon-water cycle model that merges process‑informed deep learning with direct learning from observations (Baghirov et al., 2025; https://doi.org/10.5194/egusphere-2025-3123). H2CM simulates carbon fluxes—gross primary productivity (GPP), autotrophic respiration, and heterotrophic respiration—and water storages (soil moisture, groundwater, snow) and fluxes (evapotranspiration, runoff). The model is informed by carbon observations—GPP, net ecosystem exchange (NEE) from satellite- and in situ–based inversions, and fAPAR—and by water-cycle observations—evapotranspiration, runoff, terrestrial water storage, and snow. H2CM runs daily at 1° spatial resolution.

H2CM outperforms both purely data-driven approaches and state-of-the-art PBMs in reproducing seasonal NEE, particularly in wet and dry tropics, and it captures the rain‑pulse respiration response in drylands that many models miss. Its estimates of global NEE interannual variability align more closely with satellite- and in situ–based inversion products than do PBM estimates. Finally, we disentangle photosynthetic versus respiratory controls and quantify how different regions (e.g., wet vs. dry tropics) contribute to global variability in land–atmosphere carbon exchange.

How to cite: Baghirov, Z., Reichstein, M., Kraft, B., Ahrens, B., Körner, M., and Jung, M.: Estimating carbon dynamics using H2CM: a hybrid global carbon-water cycle model, EGU General Assembly 2026, Vienna, Austria, 3–8 May 2026, EGU26-19700, https://doi.org/10.5194/egusphere-egu26-19700, 2026.

EGU26-20977 | ECS | Posters on site | ITS1.10/BG10.6

EO-driven carbon farming MRV: linking crop yield prediction to SOC change 

Gabriele Galli, Marco Zamboni, Andrea Ricciardelli, Maria Luisa Quarta, and Marco Folegani

Carbon farming can deliver climate mitigation and improved soil health, but credible deployment requires scalable MRV that supports additionality assessment and remains operational at farm scale. We present an EO-driven pipeline that integrates heterogeneous Earth-system data with hybrid modelling (machine learning + process-based physics) to estimate crop yield trajectories, soil organic carbon (SOC) evolution, and economic viability under baseline and regenerative management. A case study illustrates how a crop system can transition toward regenerative farming, demonstrating alignment with EU carbon farming policy. Results show how integrated, data-driven approaches can support quantification of both environmental and financial outcomes, enabling credible carbon accounting and guiding targeted investment in sustainable agriculture.

Multi-sensor satellite time series provide indicators of vegetation dynamics, and management proxies relevant to practice adoption (e.g., seasonal soil cover and surface condition). SoilGrids data provide spatially detailed soil information that helps us capture how soil conditions vary across and within fields, and how sensitive each site is. Climate forcing relies on high-resolution CMCC climate projections, enabling stress-testing of productivity and SOC outcomes under plausible future conditions.

A Random Forest model learns non-linear relationships between yield, EO indicators, soil attributes, and climate predictors to generate baseline yield projections. These projections are translated into carbon input assumptions (e.g., residue returns) and coupled to a RothC-class SOC model to simulate SOC evolution under regenerative scenarios such as cover crops.

Farm-level decision metrics integrate transition costs, yield impacts, potential carbon revenues, and land value appreciation to estimate break-even time and NPV, supporting project design and investment appraisal.

How to cite: Galli, G., Zamboni, M., Ricciardelli, A., Quarta, M. L., and Folegani, M.: EO-driven carbon farming MRV: linking crop yield prediction to SOC change, EGU General Assembly 2026, Vienna, Austria, 3–8 May 2026, EGU26-20977, https://doi.org/10.5194/egusphere-egu26-20977, 2026.

EGU26-21697 | ECS | Posters on site | ITS1.10/BG10.6

Satellite SIF and Ground EC Observation Jointly Constrained Estimation of Global Gross Primary Productivity 

Xiaobin Guan, Yongming Ma, Chao Zeng, and Liupeng Lin

Accurate estimation of global gross primary productivity (GPP) is fundamental for understanding terrestrial carbon cycling. Eddy covariance (EC) flux observations provide reliable site-scale GPP estimates, but the spatially sparse distribution limits their applicability at large scales. Satellite-based solar-induced chlorophyll fluorescence (SIF) has emerged as a promising proxy for large-scale GPP estimation; however, current satellite SIF observations also suffer from limited spatiotemporal coverage, and uncertainties remain in the SIF–GPP conversion. Moreover, conventional machine learning models trained solely on EC observations often exhibit limited spatial generalization due to the scarcity of spatially representative training samples.

To address these challenges, this study proposes a satellite–ground jointly constrained framework that integrates EC flux measurements and satellite SIF observations using transfer learning and multi-task learning techniques to exploit the complementary strengths of both data sources for global GPP estimation. First, for TROPOMI SIF data that has global spatial coverage but short temporal records, SIF is treated as a source domain to pre-train the model, which is then fine-tuned using long-term EC-derived GPP data as a target domain. This transfer learning-based model (SIFTML) demonstrates improved spatial generalization compared to models trained solely on SIF or EC data, effectively reducing systematic underestimation and overestimation at high and low GPP levels, respectively, while remaining insensitive to the magnitude scaling of source-domain SIF inputs.

Second, for the spatially sparse and track-like distributed OCO-2 SIF observations, a multi-task learning framework based on a mixture-of-experts architecture is developed. A physically constrained loss function derived from the SIF–GPP relationship is introduced to simultaneously achieve seamless SIF reconstruction and high-accuracy GPP estimation by jointly leveraging SIF and EC constraints. Results indicate that the multi-task model outperforms traditional single-task approaches in both GPP estimation and SIF reconstruction.

Overall, this study provides a new paradigm for long-term, high-accuracy global GPP estimation by alleviating limitations associated with the spatiotemporal coverage of ground EC and satellite SIF observations, as well as the uncertainties in SIF–GPP conversion, thereby offering improved support for global carbon cycle research.

How to cite: Guan, X., Ma, Y., Zeng, C., and Lin, L.: Satellite SIF and Ground EC Observation Jointly Constrained Estimation of Global Gross Primary Productivity, EGU General Assembly 2026, Vienna, Austria, 3–8 May 2026, EGU26-21697, https://doi.org/10.5194/egusphere-egu26-21697, 2026.

EGU26-21845 | Posters on site | ITS1.10/BG10.6

Unsupervised Manifold Learning: Validating Unconditional Flow Matching for Soil Carbon Data Topology 

Vinicius do Carmo Melicio, Vitor Hugo Miranda Mourão, Luis Gustavo Barioni, and João Paulo Gois

Limited data and high sampling costs challenge soil carbon modeling. While previous generative AI methods, such as Generative Adversarial Networks (GANs) and Variational Auto-Encoders (VAEs), are commonly used, this study benchmarks Flow Matching's effectiveness for modeling complex soil data distributions. We introduce an Unconditional Flow Matching framework using the LUCAS soil dataset. Our procedures encompass: (a) training models without labels; (b) generating synthetic data, and (c) applying identical clustering protocols to the datasets generated in (a) and (b). Model performance is assessed through statistical divergence and cluster consistency between observed and synthetic data distributions. The goal is to determine if Flow Matching provides a more robust and accurate method for generating realistic soil carbon datasets.

How to cite: do Carmo Melicio, V., Mourão, V. H. M., Barioni, L. G., and Gois, J. P.: Unsupervised Manifold Learning: Validating Unconditional Flow Matching for Soil Carbon Data Topology, EGU General Assembly 2026, Vienna, Austria, 3–8 May 2026, EGU26-21845, https://doi.org/10.5194/egusphere-egu26-21845, 2026.

EGU26-22441 | ECS | Posters on site | ITS1.10/BG10.6

BioMassters as Initial Benchmark for 3D-ABC 

Samy Hashim, Sayan Mandal, Rocco Sedona, Ehsan Zandi, and Gabriele Cavallaro and the 3D-ABC Team

The 3D-ABC project, developed within the Helmholtz Foundation Model Initiative, aims to create a foundation model for accurate mapping of global terrestrial above- and below-ground carbon stocks in vegetation and soils at high spatial resolution. The model integrates multimodal remote sensing data including Harmonized Landsat-Sentinel-2 (HLS) imagery, TanDEM-X InSAR coherence, and will also integrate climatic, topographic, and space-borne 3D lidar data. The architecture employs a multi-modal input processor, FM encoder, adaptive fusion neck, and task-specific prediction heads, trained via masked autoencoder pretraining followed by supervised fine-tuning. Training leverages JSC's JUWELS Booster and the forthcoming JUPITER exascale system.

BioMassters, a dataset that encompasses satellite imagery and associated forest biomass estimates for large-scale above-ground biomass mapping, provides an ideal initial evaluation framework for 3D-ABC for several compelling reasons.

Above Ground Biomass (AGB) estimation represents a core downstream task for carbon monitoring. BioMassters specifically targets this capability using Sentinel-1 SAR and Sentinel-2 MSI time series, modalities that overlap substantially with 3D-ABC's input data streams. This alignment allows direct assessment of whether 3D-ABC's learned representations capture vegetation structure and biomass-relevant features.

The dataset derives AGB labels from Finnish Forest Centre airborne LiDAR campaigns at 5 points per square meter density, combined with field measurements and calibrated allometric equations. This produces reference data with approximately 8% RMSE for key tree attributes, far more reliable than existing global products and essential for meaningful foundation model evaluation.

With 310,000 patches of size 224x224 covering 8 million hectares across five years, BioMassters offers the statistical power needed to assess foundation model generalization. The temporal dimension, 12 monthly observations per sample, tests whether 3D-ABC effectively captures phenological dynamics crucial for vegetation monitoring. Beyond its scale and temporal richness, BioMassters also benefits from a strong benchmarking ecosystem.

The NeurIPS 2023 competition produced well-documented baseline performance: U-TAE achieved 27.49 t/px RMSE overall, with results stratified by biomass density (15.24 t/px for low density, 37.59 t/px for high density). These benchmarks enable rigorous comparison of 3D-ABC against state-of-the-art task-specific models.

Current global biomass products operate at 100m resolution with RMSE values of 30-50 t/px. BioMassters operates at 10m resolution, allowing assessment of whether 3D-ABC's multimodal fusion can advance both accuracy and spatial detail simultaneously.

The dataset reveals where current approaches struggle, accuracy degrades with increasing forest density due to SAR backscatter and MSI reflectance saturation. This provides a specific challenge for 3D-ABC's multi-modal fusion architecture, and in future work we will be testing whether incorporating additional modalities (particularly 3D space-borne lidar) addresses these saturation effects.

While BioMassters covers boreal forests exclusively, it establishes whether 3D-ABC's pretrained representations provide a foundation for fine-tuning to other biomes, a critical test of foundation model utility before deploying resources on global-scale evaluation, e.g. in the arctic region. 

How to cite: Hashim, S., Mandal, S., Sedona, R., Zandi, E., and Cavallaro, G. and the 3D-ABC Team: BioMassters as Initial Benchmark for 3D-ABC, EGU General Assembly 2026, Vienna, Austria, 3–8 May 2026, EGU26-22441, https://doi.org/10.5194/egusphere-egu26-22441, 2026.

EGU26-22809 | ECS | Orals | ITS1.10/BG10.6

Towards a Fully Machine Learning–Driven Methane Emissions Inference Pipeline at Global Scale 

Elena Fillola, Nawid Keshtmand, Jeff Clark, Matt Rigby, and Raul Santos-Rodriguez

The growing availability of satellite-based methane observations provides new opportunities to improve estimates of surface emissions. Inverse modelling frameworks commonly rely on Lagrangian Particle Dispersion Models (LPDMs) to simulate atmospheric transport and derive source–receptor relationships (“footprints”), but these approaches are computationally expensive and struggle to scale to the rapidly increasing volume of satellite data.
Previously, we introduced GATES (Graph-Neural-Network Atmospheric Transport Emulation System), a machine learning (ML) based emulator capable of reproducing LPDM footprint sensitivities three orders of magnitude faster than the underlying physics-based model, and demonstrated its application to infer methane emissions over South America. While such footprints capture the local contribution from surface fluxes, observed methane concentrations are often dominated by the background mole fraction associated with large-scale atmospheric transport entering the domain. Despite its importance, this background component has received comparatively little attention in ML-based transport emulation.
Here, we present a machine learning emulator for background methane mole fractions, designed to reproduce the contribution from outside the modelled domain to observed concentrations using meteorological and atmospheric state information. By combining this background emulator with the existing GATES footprint emulator, we construct a fully ML-driven pipeline capable of predicting total methane concentrations without requiring explicit LPDM simulations. We demonstrate that this framework reproduces key spatial and temporal characteristics of LPDM-based background estimates over South America, including seasonal structure, daily variability, and regional patterns, as well as its performance within inversions to estimate Brazil’s methane emissions.
We further assess the scalability of the approach by applying the footprint emulator to regions outside the original training domain. While the model performs well when trained and evaluated within the same region, performance degrades when applied to unseen domains with different meteorological regimes. These results indicate that atmospheric transport learning is strongly domain-specific, highlighting both the potential and the limitations of transfer learning, and underscoring the need for region-specific training data when extending the approach to global emulation.
This work demonstrates the feasibility of a fully ML-driven atmospheric transport and background modelling framework for methane inversion, offering the next steps towards computationally efficient, satellite-based emissions monitoring.

How to cite: Fillola, E., Keshtmand, N., Clark, J., Rigby, M., and Santos-Rodriguez, R.: Towards a Fully Machine Learning–Driven Methane Emissions Inference Pipeline at Global Scale, EGU General Assembly 2026, Vienna, Austria, 3–8 May 2026, EGU26-22809, https://doi.org/10.5194/egusphere-egu26-22809, 2026.

EGU26-89 | Orals | CL1.2.1

Crossdating and the challenges in tropical dendrochronology: perspectives from a 10-year effort and seven site collections in eastern Amazonia 

Daniela Granato de Souza, Robson Borges de Lima, Diego Armando Silva da Silva, Brad Peter, Eric Bastos Gorgens, Jussian Jose da Silva, Manuelle da Costa Pereira, and Rondinele Viana Brito

Tropical dendrochronology presents many challenges. Few tree species develop reliable annual growth rings that can be accurately dated to the calendar year. Accessing primary forests and old-growth trees requires significant labor and investment. Researchers have difficulty finding the trees, resulting in limited sample size, one of the key factors for the development of successful tropical tree-ring chronologies. Skepticism exists regarding whether Douglas's method should be the sole approach for dating tropical trees. However, cross-dating—finding a common growth pattern across a large area—remains the only way to accurately assign calendar years to growth rings. This method is essential for developing centuries-long tree-ring chronologies. Our studies demonstrate that Douglas's method works in tropical dendrochronology. Once trees are correctly dated, other methods can be applied, such as quantitative wood anatomy, isotopes, wood density, and radiocarbon dating. This study describes a nearly 10-year effort to construct a network of tropical tree-ring chronologies in eastern Amazonia. It includes the key challenges that prevented dating trees at some of the tropical sites visited. Samples of 342 trees of the species Cedrela odorata, distributed across seven locations, were collected from living and legally harvested trees in forests of eastern Amazonia. Three tree-ring width chronologies have been successfully dated, including a new tree-ring width chronology from Cedrela, in the Altamira National Forest, dated from 1885 to 2016. Provisional chronologies of tree-rings from Cedrela are presented here: (1) a 190-year record from Inupuku and a (2) 328-year chronology from Mukuru. Both sites are located in the Jari River valley, home to the tallest trees ever discovered in the Amazon basin. A third 113-year record from the Monte Alegre site, located in the Rio Paru State Forest. Our results demonstrate the influence of local physical and topographical soil attributes, in terms of their moisture retention capacity, on the successful development of tree-ring chronologies in some locations. Stand and gap dynamics, as well as sample size, also play an important role in whether trees can be dated or not. Despite these challenges, our efforts show that crossdating is possible in primary tropical forests, and the advantage of having precisely dated trees is the ability to learn about climate variability over the past centuries in the vast and largely unknown Amazonian territory.

How to cite: Granato de Souza, D., Borges de Lima, R., Armando Silva da Silva, D., Peter, B., Bastos Gorgens, E., Jose da Silva, J., da Costa Pereira, M., and Viana Brito, R.: Crossdating and the challenges in tropical dendrochronology: perspectives from a 10-year effort and seven site collections in eastern Amazonia, EGU General Assembly 2026, Vienna, Austria, 3–8 May 2026, EGU26-89, https://doi.org/10.5194/egusphere-egu26-89, 2026.

EGU26-1150 | ECS | Posters on site | CL1.2.1

Tracing signatures of dual moisture sources in tree-rings: insights from xylem and leaf water isotopic study 

Sindoora Puthiyandi, Shreyas Managave, Virendra Padhya, and Rajendrakumar Deshpande


           Seasonal variations in moisture sources are found in many regions, and tree ring isotopic records from such regions are known to respond to variations in these moisture sources. However, how the relative strengths of the distinct moisture sources influence tree ring isotopic records is not well understood.

The Western Himalayas (WH), a hydro-climatically sensitive region, has two distinct moisture sources: westerlies, which provide snow during winter, and the South-west monsoon, bringing rain during summer. To understand how these moisture sources leave their imprint in the tree ring, isotopic characterization of precipitation, xylem and leaf water was carried out for two years (2023-2024). Forty trees, of species commonly employed in dendroclimatic research, from two climatologically distinct locations in the WH, Manali and Keylong, were studied. Precipitation samples were collected throughout the sampling interval, while xylem and leaf samples were collected immediately before (June) and after (October) the monsoon. The isotopic composition of xylem and leaf water collected during June and October is expected to reflect the isotopic signature of snow and rain, respectively. Cryogenic vacuum extraction was employed to extract water from xylem and leaf samples. Stable isotopic analysis (δ18O, δ2H) of all samples was performed using an IRMS (Delta V Plus, Thermo Scientific).

The results indicated winter precipitation was enriched in 2H and 18O compared to monsoon rain. The d-excess of winter precipitation was higher than that of the monsoon, suggesting source of moisture was from a comparatively drier region. Precipitation at Keylong showed a signal depleted in 2H and 18O for all seasons compared to that at Manali. The isotopic composition of xylem water mimicked seasonal isotopic variability in precipitation, suggesting that trees in the WH indeed sample water from snow and rain sequentially during the growing season. The leaf water exhibited higher enrichment in 18O than in 2H (higher than that predicted by equilibrium fractionation) over the xylem isotopic composition. This suggested δ2H of leaf water was better at reflecting the isotopic composition of precipitation than δ18O, especially when the relative humidity is lower. Our results suggested intra-annual isotopic characterization of tree rings from the WH has the potential to reveal past variations in the strengths of westerlies and monsoon.

How to cite: Puthiyandi, S., Managave, S., Padhya, V., and Deshpande, R.: Tracing signatures of dual moisture sources in tree-rings: insights from xylem and leaf water isotopic study, EGU General Assembly 2026, Vienna, Austria, 3–8 May 2026, EGU26-1150, https://doi.org/10.5194/egusphere-egu26-1150, 2026.

EGU26-1816 | ECS | Orals | CL1.2.1

Coupled dynamics of tree-ring growth and canopy greenness (NDVI) along a disturbance gradient in South Asian moist tropical forests 

Kanta Bhattacharjee, Mahmuda Islam, Achim Braeuning, Aster Gebrekirstos, Mohammed Abu Sayed Arfin Khan Khan, Fahmida Nilu Khan, Bayzid Hassan, Hasibul Hasan, and Mizanur Rahman

Stem radial growth is driven by the interaction between environmental conditions and tree physiological processes. As a result, tree rings serve as valuable natural archives, recording environmental information over time. In tropical forests, data on past climate variability and historical canopy greenness—an important indicator of forest health—are often limited in duration. Studying tree rings can thus provide essential insights into historical climate dynamics and canopy condition, helping us better predict the responses of tropical forests to global environmental changes. Here we present the first ring-width index chronologies (RWI) and canopy greenness (NDVI) time series of Zanthoxylum rhetsa (Roxb.) DC. from three moist forest sites in Bangladesh aligned along a gradient of increasing human disturbance. We compared historical annual radial growth rates with monthly, seasonal and annual climate data and NDVI values derived from high resolution Landsat images. Our analyses showed that the growth of Z. rhetsa is primarily influenced by pre-monsoon temperatures and monsoon precipitation, with pre-monsoon climate signals becoming stronger in recent decades. The signal strength of the RWI chronologies, however, varied across study sites along the disturbance gradient, with stronger signals in the sites with low disturbance intensity. At the ecosystem level, canopy greenness (NDVI) was highly correlated with tree growth rates over the past two decades. NDVI showed high sensitivity to drought, particularly at drier sites. Global warming and drought are detrimental to forest health and thus limiting the carbon sequestration potential of moist tropical forests. By taking Zanthoxylum rhetsa as a model tree species in three Bangladeshi moist tropical forests we demonstrate how tree-ring analysis can be combined with remote sensing to reconstruct canopy dynamics for periods preceding the availability of satellite imagery for NDVI calculations that could be replicable to other tropical forests.

How to cite: Bhattacharjee, K., Islam, M., Braeuning, A., Gebrekirstos, A., Khan, M. A. S. A. K., Khan, F. N., Hassan, B., Hasan, H., and Rahman, M.: Coupled dynamics of tree-ring growth and canopy greenness (NDVI) along a disturbance gradient in South Asian moist tropical forests, EGU General Assembly 2026, Vienna, Austria, 3–8 May 2026, EGU26-1816, https://doi.org/10.5194/egusphere-egu26-1816, 2026.

EGU26-2545 | Posters on site | CL1.2.1

Differential radial stem growth responses of Alnus alnobetula to short-term cold stress 

Walter Oberhuber, Gerhard Wieser, and Andreas Gruber

Green alder (Alnus alnobetula) is a tall, deciduous shrub widespread across the treeline ecotone in the Central European Alps. This study evaluated the impact of growing-season cold stress on radial stem growth (RG) under field conditions and in a controlled environment. RG was recorded by dendrometers on mature shoots (c. 20 yr old; n=18) at the treeline (2140–2150 m asl) on Mt. Patscherkofel during 2023, when several short-term cold spells occurred during the growing season (minimum air temperature (Tair): –1.2°C). In addition, 3–4 yr old saplings (n=5) were exposed to a 2-day cold spell in a climate chamber (minimum Tair: –2.3°C). We hypothesized that a slight frost during the growing season would transiently suppress RG, potentially resulting in a bimodal growth pattern. Contrary to this expectation, two-thirds of mature shoots in the field ceased RG after a mid-season cold spell (day of the year (DOY) 219), and one-third ceased after a late-season cold spell (DOY 241). In contrast, young shoots exposed to an experimental cold spell showed a decline–but no halt–in RG, resulting in significantly lower RG than in controls (P<0.05). The results of this study revealed that (i) mature shoots of Alnus alnobetula can exhibit divergent RG responses to growing season cold spells, ranging from short-term suppression to complete cessation, and (ii) age-specific responses exist, as RG in young shoots did not cease after an experimental frost. The findings suggest that individual- and age-specific sensitivities of RG to growing season cold stress ensure persistence and facilitate establishment of Alnus alnobetula in the harsh and highly variable alpine treeline environment.

This research was funded in whole by the Austrian Science Fund (FWF; grant-DOI: 10.55776/P34706).

How to cite: Oberhuber, W., Wieser, G., and Gruber, A.: Differential radial stem growth responses of Alnus alnobetula to short-term cold stress, EGU General Assembly 2026, Vienna, Austria, 3–8 May 2026, EGU26-2545, https://doi.org/10.5194/egusphere-egu26-2545, 2026.

EGU26-3764 | ECS | Posters on site | CL1.2.1

The link between δ18O in precipitation and tree-ring cellulose across time, space and species 

Haoyu Diao, Matthias Saurer, Daniel B. Nelson, and Marco M. Lehmann

The oxygen isotope composition (δ18O) of precipitation is strongly linked to climate and becomes integrated into tree-ring archives. However, this climatic information is only partly preserved in tree rings, as it is modified by hydrological processes prior to root water uptake and by physiological processes before cellulose synthesis. This complicates tree-ring isotope-based climate reconstructions. Nevertheless, direct links between δ18O in precipitation (δ18OP) and tree-ring cellulose (δ18OC) have been rarely tested, largely due to the lack of long-term precipitation δ18O records. Over the past two to three decades, numerous δ18OC chronologies have been established, and they can now be combined with δ18OP data from AI-supported models with high spatiotemporal resolution. This provides a unique opportunity to systematically evaluate the linkage between δ18OP and δ18OC.

In this study, we used a network of 45 annually resolved δ18OC chronologies across Europe starting in 1950 and compared them with monthly time series of Piso.AI modelled δ18OP for the corresponding locations. Our main research questions were: (1) which seasonal δ18OP signals are recorded in δ18OC? (2) Is the relationship between δ18OP and δ18OC stable over recent decades? (3) Which factors (species, geography, climate) control the strength of this relationship across the network?

We found that correlations between δ18OC and monthly δ18OP were strongest for June, July and August of the current year at most sites. Significant correlations were also observed for other months, including months from the previous year in some cases, but without a consistent pattern across the network. To further examine these relationships, we calculated seasonal and annual mean δ18OP values. Compared with unweighted δ18OP mean values, precipitation-amount weighting reduced correlations with spring, early summer and annual means, thereby narrowing the dominant signal window to the summer period (May–August mean δ18OP). We found that the δ18OP–δ18OC relationship was stable across sites over recent decades, with no systematic change in correlation strength over time. Ongoing analyses use (1) the correlation coefficients (r values) between δ18OC and δ18OP and (2) the δ18O offset between cellulose and precipitation, both considering annual and June-July-August δ18OP values. These metrics are used to investigate the role of species, geography, climate in controlling the observed δ18OP–δ18OC linkage. Our findings improve the understanding of site- and species-specific isotope signal transfer from water sources to tree rings and help identify spatial and temporal climate signals reflected in tree-ring δ18O.

How to cite: Diao, H., Saurer, M., Nelson, D. B., and Lehmann, M. M.: The link between δ18O in precipitation and tree-ring cellulose across time, space and species, EGU General Assembly 2026, Vienna, Austria, 3–8 May 2026, EGU26-3764, https://doi.org/10.5194/egusphere-egu26-3764, 2026.

EGU26-5090 | ECS | Orals | CL1.2.1

Can oxygen isotopes in tree rings be used to detect stomatal responses to global change? 

Imogen Carter, Roel Brienen, and Emanuel Gloor

Stomatal conductance (gs) regulates CO2 and water fluxes of plants. Although experiments have shown that gs decreases with elevated CO2, it is unclear how gs is responding in situ to long-term exposures to rising CO2 and a changing climate. Tree ring isotope analysis provides a unique method to assess tree ecophysiological responses to long-term exposures of slowly changing environmental conditions. In particular, it has been suggested that changes in gs can potentially be inferred from tree ring stable oxygen isotope ratios (δ18Otrc). Several studies have indeed used δ18Otrc trends to conclude that gs has not significantly changed from pre-industrial values. However, it remains unclear whether δ18Otrc is sufficiently sensitive to detect the magnitude of change in gs expected due to CO2 increases and climatic changes. Here, we evaluate the sensitivity of δ18Otrc trends to CO2 and climate induced changes in gs, and to VPD and temperature increases since the beginning of the 20th century, using current theoretical models. We find that temporal changes in gs only significantly affect δ18Otrc trends when the Péclet effect is present, and then only in dry climates. In contrast to the weak effects of gs on δ18Otrc trends, we find that temporal increases in VPD and temperature, independent of changes in gs, have far greater contributions to δ18Otrc trends. Thus, this increasingly popular method should be used with caution, because it is highly challenging to unambiguously attribute trends in δ18Otrc to changes in gs. Despite current limitations, we recommend how future studies can address these challenges in efforts to detect long-term gs trends from tree ring records.

How to cite: Carter, I., Brienen, R., and Gloor, E.: Can oxygen isotopes in tree rings be used to detect stomatal responses to global change?, EGU General Assembly 2026, Vienna, Austria, 3–8 May 2026, EGU26-5090, https://doi.org/10.5194/egusphere-egu26-5090, 2026.

EGU26-5475 | Posters on site | CL1.2.1

Drought adaptation and recovery in Scots pine: δ13C evidence from laser ablation and CSIA 

Katja Rinne-Garmston, Kersti Leppä, Yu Tang, Yann Salmon, Matthias Saurer, Charlotte Angove, Bartosz Adamczyk, Tuula Jyske, and Elina Sahlstedt

Understanding drought-induced changes in tree carbon dynamics is crucial, as forests play a significant role in regulating the global carbon cycle. Tree-rings can serve as detailed archives of intra-seasonal environmental changes, such as intrinsic water-use efficiency (iWUE) in their stable carbon isotope composition (δ13CRing). However, it remains unclear how multiple, simultaneous physiological responses to drought affect these records. We traced drought and recovery-associated physiological responses from leaves to phloem, roots, and tree-rings in seven-year-old Pinus sylvestris using δ13C analysis of sucrose, high-resolution δ13CRing analysis by laser ablation and leaf gas exchange. Although sucrose captured leaf-level processes, intra-annual δ13CRing was intermittently uncoupled from leaf-level processes over time. When scaled to the conventional approach in δ13CRing research—analysing whole annual rings or distinguishing between earlywood and latewood sections—the drought event was not detectable. This study emphasises the need for cautious interpretation when using conventional δ13CRing analysis to study plant stress responses, while demonstrating the potential of high-resolution intra-annual δ13CRing for uncovering tree adaptation mechanisms in the context of climate change.

How to cite: Rinne-Garmston, K., Leppä, K., Tang, Y., Salmon, Y., Saurer, M., Angove, C., Adamczyk, B., Jyske, T., and Sahlstedt, E.: Drought adaptation and recovery in Scots pine: δ13C evidence from laser ablation and CSIA, EGU General Assembly 2026, Vienna, Austria, 3–8 May 2026, EGU26-5475, https://doi.org/10.5194/egusphere-egu26-5475, 2026.

Dendrochemistry is used to understand the temporal dynamics of changes in elemental concentrations in the environment, including those associated with environmental pollution. However, fundamental questions remain about the mechanisms of elemental uptake, distribution of elements within annual growth rings, and the potential for translocation throughout sapwood. Many quantitative techniques used in dendrochemistry to assess where and which elements are present are destructive, time-consuming, and expensive to measure at an annual resolution. Synchrotron X-Ray Fluorescence (SXRF) imaging offers an innovative, non-destructive method for identifying which elements are present, where they are located within the sample, and their relative concentrations. In this presentation, we showcase novel dendrochemistry techniques using SXRF to document how elemental patterns change across the lateral and vertical dimensions of trees. Preliminary results show non-uniform elemental uptake and distribution throughout both mature uncontaminated trees and young saplings spiked with heavy metals. SXRF images of cross-sectional tree disk samples indicate hot spots of elemental concentrations associated with active growth areas (e.g., bark and branches) and wounds within the tree-rings rather than uniform elemental distribution. These results indicate a need for more robust sampling and analysis of dendrochemistry samples, and SXRF techniques are one method to help achieve this. 

How to cite: Canning, C., Laroque, C., and Muir, D.: Synchrotron X-Ray Fluorescence Imaging Sheds Light on The Uniformity of Elements Across Annual Growth Rings.  , EGU General Assembly 2026, Vienna, Austria, 3–8 May 2026, EGU26-5537, https://doi.org/10.5194/egusphere-egu26-5537, 2026.

EGU26-5882 | ECS | Posters on site | CL1.2.1

Reconstructing past climate variability on Holy Mount Athos, Greece using monastic archives and dendrochronology 

Athanasios Karadimitris, Christos Pantazis, Dimitrios Koutsanitis, and Panagiotis Nastos

The archives of Holy Mount Athos, Greece, an UNESCO World Heritage Site, constitute an invaluable treasure trove of Byzantine and post-Byzantine documents and manuscripts that offer unique evidence for reconstructing past climate, resulting from the long-term human presence in the area through monasticism. This study combines references to climatic events from the archives of the Holy Monastery of Vatopedi with the study of annual growth rings using the dendrochronology method on samples of Aleppo pine, with the aim of identifying and cross-validating historical climate extremes.

Research in the Historical Archive of the Holy Monastery of Vatopedi focused on extreme phenomena, searching manuscripts mainly for keywords such as floods, frost, storms, famine, and periods of drought, yielding references stretching back several years. To this end, approximately 150 letters from monks in the wider Vatopedi area were studied and 28 references to climatic events were recorded, focusing on the mid-18th to the mid-19th century. At the same time, samples were collected from 20 different trees in three clusters of Aleppo pine within the forest area of the Holy Monastery of Vatopedi using Haglöf Sweden increment borer. The implementation of a Lignostation system for high-resolution ring-width and density measurements resulted in ring timeseries associated with extreme precipitation and ambient temperature in the region’s climate.

The initial samples processed reveal significant correlations between years with “narrow rings” and recorded episodes of drought or flooding, reinforcing the reliability of both types of data. These findings reconstruct climate extremes on Mount Athos before the era of measuring instruments, providing baseline data for assessing long-term variability and informing contemporary climate change adaptation strategies in Mediterranean  landscapes.

How to cite: Karadimitris, A., Pantazis, C., Koutsanitis, D., and Nastos, P.: Reconstructing past climate variability on Holy Mount Athos, Greece using monastic archives and dendrochronology, EGU General Assembly 2026, Vienna, Austria, 3–8 May 2026, EGU26-5882, https://doi.org/10.5194/egusphere-egu26-5882, 2026.

EGU26-6590 | ECS | Orals | CL1.2.1

The effect of competition on radial growth, drought resilience and climate sensitivity of three conifer species across Central and Eastern Europe 

Rebecca Partemi, Daniele Castagneri, Andrei Popa, Ionel Popa, Marcin Klisz, Jakub Jeleń, Anna Koszelak, Miroslav Svoboda, Michal Bošeľa, Dominic Poltak, Tom Levanič, Riccardo Dieni, Allan Buras, and Jernej Jevšenak

Competition is a key ecological process for forest stands, as it directly regulates resource availability and thereby tree growth and mortality, ultimately shaping stand structure and composition.

In this study, we field-collected competition measurements and dendrochronological analyses to examine how individual tree characteristics (age and size) and competitive status (Hegyi index) interact to modulate growth, drought-resilience components (resilience, recovery and resistance), and climate sensitivity (quantified via climate–growth correlations) of Norway spruce (Picea abies), silver fir (Abies alba) and Scots pine (Pinus sylvestris), sampled at 11, 8 and 6 sites, respectively, across Central and Eastern Europe. 

Building on ecological theory, we expect competition to have a stronger effect on tree radial growth during non-disturbance periods and to lose importance when disturbance events occur. Specifically, we expect drought resistance and recovery to vary nonlinearly with competitive pressure: at low competition, reduced demand and a more favourable microclimate may buffer drought impacts, whereas at intermediate–high competition, resource limitation should dominate and reduce performance. We further hypothesize that canopy-dominant trees recover faster after drought due to better access to resources.

Preliminary results show that competitive status strongly affects radial tree growth rates while climate sensitivity and resilience appear to be driven primarily by local site conditions and species-specific traits and only secondly by competitive status. Trees under higher competitive pressure generally exhibited higher resistance and longer recovery periods and showed weaker sensitivity to climatic conditions translating into generally lower resilience; however, responses vary widely among the three species.

Our study provides new insights into how competition, individual tree characteristics, and climate interact to shape growth rates, climate sensitivity, and drought tolerance. Our findings clarify how competition and stand density shape growth and drought responses across climates. This can guide climate-specific density targets (e.g., thinning intensity) to reduce drought impacts and improve resilience, and can support evidence-based forest policy and adaptive management.

How to cite: Partemi, R., Castagneri, D., Popa, A., Popa, I., Klisz, M., Jeleń, J., Koszelak, A., Svoboda, M., Bošeľa, M., Poltak, D., Levanič, T., Dieni, R., Buras, A., and Jevšenak, J.: The effect of competition on radial growth, drought resilience and climate sensitivity of three conifer species across Central and Eastern Europe, EGU General Assembly 2026, Vienna, Austria, 3–8 May 2026, EGU26-6590, https://doi.org/10.5194/egusphere-egu26-6590, 2026.

Climate warming is increasing atmospheric moisture demand globally, intensifying hydroclimatic variability and ecosystem stress, particularly in climate-sensitive mountain regions. The Himalayan climate system, particularly Northewestern Himalayas (NWH), is shaped by moisture driven through Indian Summer Monsoon and Western Disturbances interacting with complex orography, resulting in highly dynamic climatic conditions. Recent increases in global temperatures have altered this circulation system, leading to enhanced climatic variability. However, long-term, region-specific climate records remain sparse across the NWH, limiting our understanding of these changes. Tree rings serve as high-resolution natural archives of past climate variability, and offer critical insights into the region's climatic history and its driving forces. The present study develops tree-ring chronologies from a dense network of five sites in the Baspa Basin, NWH, using 275 increment cores (89 from Cedrus deodara and 186 from Pinus wallichiana). Individual ring-width series were detrended using age-dependent splines, and chronologies were developed employing ‘Signal-free’ method. Composite regional chronologies were generated for both species through averaging same species ring widths as having high inter-site correlation and species-specific growth–climate relationships were assessed. The analyses identified vapour pressure deficit (VPD) as the dominant limiting factor of radial growth with spring VPD (February–April; FA-VPD) strongly constraining Cedrus deodara growth (r = −0.77) and summer VPD (June–July; JJ-VPD) limiting Pinus wallichiana growth (r = −0.63). VPD integrates the combined effects of temperature and humidity, influencing stomatal conductance and carbon assimilation, and thus exerting primary control on tree growth. While temperature shows a negative relationship and precipitation a comparatively weaker positive influence. Based on these relationships, we developed basin-scale, multi-season tree-ring reconstructions of FA-VPD (1771–2023 CE) and JJ-VPD (1834–2023 CE) using Cedrus deodara and Pinus wallichiana, respectively. These reconstructions explain approximately ~59% and ~40% of the variance in FA-VPD and JJ-VPD, respectively, during the calibration period. The FA-VPD reconstruction reveals a long-term increasing trend, characterized by two phases (1771–1917 and 1918–2023), with 1917 identified as a significant change-point year. In contrast, JJ-VPD shows a decreasing trend since the early twentieth century, consistent with enhanced monsoonal moisture availability in the basin. These divergent seasonal moisture trends imply future shifts in forest composition, with increasingly favourable conditions for Pinus wallichiana and heightened vulnerability of Cedrus deodara. Phase-wise teleconnection analyses indicate a weakening influence of El Nino Southern Oscillation and Interdecadal Pacific Oscillation, alongside an increasing role of the Indian Ocean Dipole, a pattern further supported by sea surface temperature spatial correlation analyses. Our findings highlight the critical role of large-scale climate drivers in shaping local hydroclimatic stress in the NWH. The seasonally resolved VPD reconstructions offer actionable baseline information for climate adaptation strategies, including forest management, species selection, drought preparedness, and risk reduction planning for climate-sensitive Himalayan communities.

How to cite: Lal, D., Shekhar, M., Dhyani, R., Singh, S., Sharma, A., and Chand, P.: Multi-Species Tree-Ring Networks reveals seasonal shifts in Vapour Pressure Deficit trends and evolving Ocean-atmospheric Teleconnections in the Baspa basin, Northwestern Himalayas, EGU General Assembly 2026, Vienna, Austria, 3–8 May 2026, EGU26-6980, https://doi.org/10.5194/egusphere-egu26-6980, 2026.

EGU26-7032 | Orals | CL1.2.1

Can leaf-to-ecosystem-scale process modeling resolve differences in multi-scale intrinsic water use efficiency estimates? 

Kersti Leppä, Samuli Launiainen, Olli-Pekka Tikkasalo, Elina Sahlstedt, Giles H.F. Young, Pauliina Schiestl-Aalto, Pasi Kolari, Yu Tang, and Katja T. Rinne-Garmston

Intrinsic water use efficiency (iWUE) quantifies the trade-off between carbon gain and water loss providing an indicator of stomatal regulation in response to environmental change. iWUE can be estimated for different temporal and spatial scales, from sub-daily to annual and from leaf to ecosystem scale. Tree-level iWUE estimates are commonly derived from stable carbon isotope compositions (δ13C) in tree rings. Laser ablation technology facilitates the analysis of δ13C at fine intra-ring resolution, providing insights to intraseasonal iWUE variations. Despite the promise of intraseasonal iWUE derived from tree-ring archives, links and discrepancies between iWUE estimates representing different scales are poorly understood.

This study investigates intraseasonal iWUE over 2002–2019 in a Scots pine dominated stand (Hyytiälä, southern Finland) at three spatial scales: shoot, tree and ecosystem scale. Empirical iWUE estimates are derived from shoot gas exchange, tree-ring δ13C and eddy covariance (EC). iWUE estimates were integrated to temporal resolution corresponding to tree-ring subsections using growth modeling and assimilation-based weighting. To understand differences in these iWUE estimates, we apply a multi-layer, multi-species, soil-plant-atmosphere-transfer model (pyAPES).

The level differences between shoot-, tree- and ecosystem-scale iWUE estimates were in line between measurement- and model-based estimates. Both showed that ecosystem-scale iWUE was 40% lower than shoot- or tree-scale iWUE. Model results suggested half of this difference was explained by the presence of other species in the stand and understory. Most of the remaining difference was attributed to neglecting the difference between leaf and air temperature in the calculation of ecosystem-scale iWUE.

δ13C-based iWUE correlated moderately with EC-based iWUE at inter- and intra-annual resolutions (r=0.58). δ13C-based iWUE correlated more strongly with modelled iWUE (ecosystem, tree, shoot) at both inter- and intra-annual resolutions (r=0.74–0.87), suggesting modelled iWUE may be more robust over multi-decadal timeframes than EC-based iWUE. Clearest miss-matches between intraseasonal δ13C-based iWUE and EC-based iWUE (or modelled iWUE) were during the two dryest years of the study period. This may be caused by remobilization of reserves, or other drought related processes affecting isotopic fractionation or, alternatively, uncertainties in dating wood formation processes during drought. Plausibly this indicates that tree-ring δ13C is not a robust indicator of iWUE during severe drought but rather provides means to pinpoint periods of such conditions.

How to cite: Leppä, K., Launiainen, S., Tikkasalo, O.-P., Sahlstedt, E., Young, G. H. F., Schiestl-Aalto, P., Kolari, P., Tang, Y., and Rinne-Garmston, K. T.: Can leaf-to-ecosystem-scale process modeling resolve differences in multi-scale intrinsic water use efficiency estimates?, EGU General Assembly 2026, Vienna, Austria, 3–8 May 2026, EGU26-7032, https://doi.org/10.5194/egusphere-egu26-7032, 2026.

EGU26-7130 | ECS | Posters on site | CL1.2.1

Evidence and Theoretic Basis for Enhancing Forest Drought Resilience through the Protection of Old Trees 

Jinhao Liu, Zongshan Li, Shaoteng Chen, Yaling Liu, Bojie Fu, and Xiaoming Feng

Global afforestation and forest expansion have substantially altered forest age structures, leading to an increasing dominance of younger stands. Ecological theories such as size‐asymmetric competition and growth–defense trade‐offs suggest that age‐related shifts in resource allocation and size may influence drought responses, yet empirical evidence remains limited. Here, we use tree-ring records from 1,089 sites across China to examine age-dependent patterns of drought resilience, quantified in terms of resistance and recovery. Our results show that recovery capacity generally increases with tree age, whereas resistance displays a non-linear relationship, declining at younger ages before increasing beyond an age threshold. These findings highlight systematic age-related differences in drought resilience across climatic gradients and suggest that forest age structure may play an important role in mediating forest responses to increasing drought stress. Our results provide observational evidence relevant for understanding forest vulnerability and resilience under ongoing climate change.

How to cite: Liu, J., Li, Z., Chen, S., Liu, Y., Fu, B., and Feng, X.: Evidence and Theoretic Basis for Enhancing Forest Drought Resilience through the Protection of Old Trees, EGU General Assembly 2026, Vienna, Austria, 3–8 May 2026, EGU26-7130, https://doi.org/10.5194/egusphere-egu26-7130, 2026.

EGU26-7197 | ECS | Posters on site | CL1.2.1

The MedFireAtlas: A regional historical fire database for the Mediterranean Basin  

Evrim A. Şahan, Margarita Arianoutsou, Davide Ascoli, Damir Barčić, Christopher Carcaillet, Anastasia Christopoulou, Peter Fulé, Emilia Gutiérrez, Ante Ivanović, Jernej Jevšenak, Dalila Kherchouche, Nesibe Köse, Jose V. Moris, Nikica Ogris, Robert Rožić, Said Slimani, Ramzi Touchan, and Elisabet Martínez-Sancho

Wildfire is a fundamental Earth system process that has shaped terrestrial ecosystems, biogeochemical cycles, and human societies for millions of years. The Mediterranean Basin is one of the world’s major fire hotspots, where climatic extremes interact with dense human populations and long-standing land-use legacies, frequently resulting in severe wildfire activity. Nevertheless, the knowledge on the long-term history of Mediterranean fires has remained poor, and existing information is often difficult to access and reuse, with governmental documents, independent research groups, and numerous unpublished or inaccessible datasets. This lack of integration has limited our ability to detect wide-scale retrospective regional patterns, understand the drivers of fire occurrence, and place recent wildfire extremes within their historical context. Here, we present the Mediterranean Fire History Database (MedFireAtlas), the first openly accessible, standardised, region-wide compilation of long-term Mediterranean fire history data, designed to address this critical knowledge gap.

The MedFireAtlas database integrates two types of data, covering different temporal resolutions and spanning both southern Europe and the North African regions of the Mediterranean Basin. The first type of data includes 43 site-level tree-ring-based fire history reconstructions spanning from the 13th century onward, mainly from forests characterised by surface-fire regimes. These datasets offer annually resolved and multi-century long information for surface-fire-adapted species, primarily Pinus nigra, as well as Cedrus atlantica and Pinus pinaster. The second type of data includes governmental documentary fire records, primarily covering the mid-20th century to recent decades, available through open or authorised sources. It contains over 1.8 million documentary records from a total of ten countries. All entries were harmonised under a common metadata structure, including location, date, cause (when available), burned area, and data type. End-to-end data architecture, workflows, quality-control procedures, and metadata guidelines within the database ensure consistency and reliability. The MedFireAtlas links detailed recent fire occurrences with multi-century historical reconstructions, enabling spatiotemporal analyses of fire regimes and regional patterns that are not possible using either data source alone.

The key feature of MedFireAtlas is an interactive web interface built by R Shiny that enables users to visualise, filter and download fire data through a spatial interface. The platform provides full capabilities to investigate long-term temporal trends, country-level and regional patterns, and comparisons among multiple datasets, supporting scientific research and applied uses, providing valuable multi-century benchmarks for fire regime modelling and long-term ecological and climate research. The MedFireAtlas is designed as a living, community-driven resource: researchers and fire management agencies across the Mediterranean are encouraged to contribute their new or historical datasets. Overall, the MedFireAtlas establishes the first comprehensive database initiative for regional fire regime representing a critical step toward integrated, science-based fire management in one of the world’s most fire-prone and climate-vulnerable regions.

How to cite: Şahan, E. A., Arianoutsou, M., Ascoli, D., Barčić, D., Carcaillet, C., Christopoulou, A., Fulé, P., Gutiérrez, E., Ivanović, A., Jevšenak, J., Kherchouche, D., Köse, N., Moris, J. V., Ogris, N., Rožić, R., Slimani, S., Touchan, R., and Martínez-Sancho, E.: The MedFireAtlas: A regional historical fire database for the Mediterranean Basin , EGU General Assembly 2026, Vienna, Austria, 3–8 May 2026, EGU26-7197, https://doi.org/10.5194/egusphere-egu26-7197, 2026.

EGU26-7658 | ECS | Posters on site | CL1.2.1

Tracing volcanic events in tree rings 

Erica Luce Beghini, Andrea Marzoli, Marco Carrer, Raffella Dibona, Don Baker, Robert Newton, Kalotina Geraki, and Sara Callegaro

Understanding the impact of volcanic eruptions on climate over the last two millennia is essential to place current anthropogenic climate change into a long-term context. High-resolution proxy archives are crucial for this purpose, yet their availability decreases rapidly back in time. Besides ice cores, speleothems and corals, tree rings represent a uniquely valuable archive, providing records with annual resolution of past-climate change. Volcanic eruptions are among the most impactful natural forcings on Earth’s climate, through the injection of gaseous plumes into the atmosphere that can induce warming or cooling of the planet surface. While some of these impacts are well-known and studied, there are many older volcanic events whose details are unknown or uncertain, due to the lack of direct historical evidence.

Volcanic plumes transport volatile elements (e.g., S, Fe, Zn, Cu, Hg) that can be absorbed by trees and recorded in the yearly tree-ring layers. So far, dendrochemistry has been widely applied to assess anthropogenic pollution, but our research explores its potential as a novel proxy: by identifying chemical spikes of these elements in tree rings of known age, it may be possible to correlate them with known volcanic eruptions or identify previously unrecognized volcanic events. Here we present data obtained at Diamond synchrotron on tree rings from juniper (Juniperus communis) samples from Kevo, Finland, whose dendrochronological records extend back to the early Middle Ages. These measurements revealed distinct peaks in metal elements such as Zn and Cu, which are typically enriched in volcanic plumes and can be hosted in the wood as semi-nutrients. Some concentration peaks detected in the tree rings correspond to the ages of major Icelandic eruption from the lower Middle Ages.

These preliminary results suggest that dendrochemical analyses may provide a new archive of past volcanic activity. If validated, this approach could significantly improve reconstructions of volcanic eruptions of the past and corresponding climate variability over the last two millennia.

How to cite: Beghini, E. L., Marzoli, A., Carrer, M., Dibona, R., Baker, D., Newton, R., Geraki, K., and Callegaro, S.: Tracing volcanic events in tree rings, EGU General Assembly 2026, Vienna, Austria, 3–8 May 2026, EGU26-7658, https://doi.org/10.5194/egusphere-egu26-7658, 2026.

EGU26-8178 | ECS | Posters on site | CL1.2.1

Oaks and extremes: Contrasting responses of Quercus robur to drought in Southeastern Europe, shaped by the Carpathians 

Andrei Popa, Monica Ionita, Ionel Popa, Viorica Nagavciuc, and Catalin-Constantin Roibu

Recent extreme climate events have severely impacted forests worldwide. Deciduous forests, in general, and oak-dominated forests, in particular, are more frequently and severely affected by repeated and intensified drought events than other biomes. In this context, updated insights into oak responses to drought events are needed to understand their resilience and adaptability capacity in order to promote forest management practices that mitigate the adverse effects of climate change. To analyze the response of pedunculate oak (Quercus robur L.) to droughts, we used an extensive tree-ring network comprising more than 2100 trees from 90 sites across Romania and the Republic of Moldova. Given evidence that the Carpathian Mts. significantly influence regional climate patterns, we split our network into three clusters based on sites’ positions relative to the Carpathians: western, eastern, and southern sites. We used resilience indices, following Lloret et al. (2011), to quantify oak responses to droughts, while multinomial logistic models were used to assess the occurrence probability of positive or negative pointer years in growth rates in relation to the Standardised Precipitation-Evapotranspiration Index. Regarding the resilience index, we found no significant differences between the clusters; however, eastern sites exhibited lower resistance and higher recovery rates. By contrast, the western sites exhibited the highest resistance and the lowest recovery rate. Multinomial logistic models indicated that, at southern sites, there is a higher probability of negative pointer years during winter droughts, whereas spring droughts are associated with a higher probability at eastern sites. Overall, our findings highlight spatial differences in growth plasticity and drought adaptability of pedunculate oak in Southeastern Europe in relation to the Carpathian Mts.   

How to cite: Popa, A., Ionita, M., Popa, I., Nagavciuc, V., and Roibu, C.-C.: Oaks and extremes: Contrasting responses of Quercus robur to drought in Southeastern Europe, shaped by the Carpathians, EGU General Assembly 2026, Vienna, Austria, 3–8 May 2026, EGU26-8178, https://doi.org/10.5194/egusphere-egu26-8178, 2026.

Living and relict Qilian juniper (Juniperus przewalskii Kom.) trees from the northeastern Tibetan Plateau provide a unique paleoclimate archive spanning centuries to millennia. Various climate signals reflected by Qilian Juniper tree-ring records from different elevations inspire us to investigate the temperature and precipitation covariance along the altitude. Here, we analyses temperature and precipitation measurements from 60 meteorological stations between 1139 and 3663 m asl on the northeastern Tibetan Plateau. We find that summer temperature and precipitation are positively correlated at higher elevations, while they show an inverse relationship at lower elevations. We also observe that anthropogenic warming has led to wetter (drier) conditions at higher (lower) elevations. Not captured by gridded climate data, our results suggest that tree ring-based hydroclimate reconstructions from arid Asian mountain systems are localised representations. We argue that warming-induced convective precipitation is altering the hydrological cycle of Asian ‘Water Towers’ through changes in plant growth, vegetation composition, snow cover, glacier extent, and river runoff.

How to cite: Gao, L., Bebchuk, T., Gou, X., and Büntgen, U.: Observational confirmation and dendrochronological implication of increasing temperature and precipitation covariance on the northeastern Tibetan Plateau, EGU General Assembly 2026, Vienna, Austria, 3–8 May 2026, EGU26-8597, https://doi.org/10.5194/egusphere-egu26-8597, 2026.

EGU26-8763 | ECS | Orals | CL1.2.1

Emerging trans-Eurasian heatwave-drought train in a warming climate 

Min-Seok Kim, Jee-Hoon Jeong, Jin-Ho Yoon, Hyungjun Kim, Shin-Yu Simon Wang, Sung-Ho Woo, and Hans W. Linderholm

Since the late 20th century, a newly emerging atmospheric teleconnection—the trans-Eurasian heatwave-drought train—has intensified remarkably during summer, driving concurrent heatwave-drought events from Eastern Europe to East Asia. Three centuries of tree-ring records confirm that the recent intensity of this pattern is unprecedented. Meanwhile, the circumglobal teleconnection, which historically dominated continental-scale Eurasian heatwaves, shows no discernible trend under global warming—signaling a fundamental shift in Eurasian summer climate dynamics. The mechanism involves Rossby wave propagation linked to warming sea surface temperatures in the Northwestern Atlantic and enhanced Sahel precipitation, both amplified by the combined effects of anthropogenic warming and natural variability. Land-atmosphere feedbacks through soil moisture deficits further intensify the pattern regionally. Climate projections indicate that anthropogenic forcing will continue to strengthen this pattern throughout the 21st century.

How to cite: Kim, M.-S., Jeong, J.-H., Yoon, J.-H., Kim, H., Wang, S.-Y. S., Woo, S.-H., and Linderholm, H. W.: Emerging trans-Eurasian heatwave-drought train in a warming climate, EGU General Assembly 2026, Vienna, Austria, 3–8 May 2026, EGU26-8763, https://doi.org/10.5194/egusphere-egu26-8763, 2026.

EGU26-9314 * | Orals | CL1.2.1 | Highlight

Woodlands of Antiquity: Roman forest exploitation and timber economy between the Alps and the Atlantic 

Andrea Seim, Bernhard Muigg, and Kristof Haneca and the interdisciplinary dendroarchaeology team

Antiquity was a formative era for Europe with a lasting cultural impact on the continent. In the densely forested regions north of the Alps, material culture was characterised by the use of wood as a primary raw material. For over half a millennium (ca. 1st century BCE–5th century CE) the Romans dominated large parts of western and central Europe. They introduced numerous innovations and new species like wine (Vitis vinifera), sweet chestnut (Castanea sativa), walnut (Juglans regia) into their north-western provinces. But above all, the Roman presence meant an anthropogenic influence on natural landscapes on an unprecedented scale. In the light of current discussions about limited growth, scarcity of resources and modern concepts of sustainability, the question arises as to how an ancient state apparatus managed to satisfy the increasing demand for the fundamental resource of wood over the course of its several hundred years of existence - and at what price.

In contrast to prehistory, Antiquity is the earliest period for which we have written sources for the areas north of the Alps. However, from the historical record the drivers behind the Roman timber economy and its impact on woodland exploitation and forest dynamics remain poorly understood. To address this, we collected empirical evidence spanning a full millennium (300 BCE–700 CE) to study forest exploitation in Antiquity. Our unique dataset of 20.397 dendrochronologically dated archaeological woods reflects decades of dendroarchaeological work from ca. 30 laboratories in France, Germany, Switzerland, Austria, Belgium and the Netherlands. Our investigations reveal significant increases in woodland exploitation during Roman occupation, with regional differences in onset, intensity, and duration. With improved infrastructure, and organization Roman logging increasingly extended into primary forests. The 3rd century CE marks a tipping point, with sharp declines in wood use and long-distance transport, alongside evidence of overexploitation of old-grown forests. Late Antiquity is characterized by an overall decline in felling activities during the 4th and 5th centuries and a reestablishment of old-grown forests. These findings demonstrate how Roman imperial expansion fundamentally reshaped woodlands north of the Alps and contribute to the environmental and economic history of European Antiquity.

How to cite: Seim, A., Muigg, B., and Haneca, K. and the interdisciplinary dendroarchaeology team: Woodlands of Antiquity: Roman forest exploitation and timber economy between the Alps and the Atlantic, EGU General Assembly 2026, Vienna, Austria, 3–8 May 2026, EGU26-9314, https://doi.org/10.5194/egusphere-egu26-9314, 2026.

EGU26-12161 | ECS | Orals | CL1.2.1

Heat and drought in the Alps: comparative tree-ring study between European larch and Norway spruce growing in dry and wet conditions  

Chiara Guarnieri, Silvio Daniele Oggioni, Ludovica Oddi, Sofia Koliopoulos, Daria Ferraris, Gianluca Filippa, Federico Grosso, Umberto Morra di Cella, Paolo Pogliotti, and Marta Galvagno

Climate change is expected to increase both the frequency and the intensity of climate extremes, such as drought events in mountain ecosystems. Thus, in a climate change perspective, the resilience of Alpine forests is directly linked to their capacity to adapt to extreme events and cope with water scarcity and high temperatures. Investigating the response of different tree species is essential to understand the complexity of forest ecosystem adaptation, resistance and resilience to severe drought periods and the role of forests in mountainous areas. Besides, in high-altitude forests, plant species growing in wetter terrains have a smaller safety hydraulic margin and are possibly less resistant than plant species raising in dry environments because of their differences in physiological responses and evapotranspiration processes.

Therefore, it is interesting to focus on a comparative study between two areas differing in terms of climate and ecology, a dry and a wet site, in order to analyse which environment is more capable to cope with extreme conditions. In the context of the Agile Arvier project, supported by funding from the European Union’s economic recovery plan, we carried out dendrochronological analyses by assessing climate-growth relationships and applying drought ‘resilience indices’ (RRR) based on tree-ring width. The drought severity was defined by the Standardised Precipitation Evapotranspiration Index (SPEI).

In this survey, the monitoring sites are located in the western Alps, (Italy, Aosta Valley region). One site, situated in Torgnon is characterized by dry conditions while the other site, located in Champorcher displays wet conditions. In both sites, two tree species, Larix decidua Mill. and Picea abies (L.) H.Karst., were sampled for tree-ring analyses at four different altitudes: 1500, 1800, 2000 and 2200 m a.s.l.

Our results highlight the contrasting water use strategies between larch and spruce and show differences in physiological and anatomical responses to drought stress. Specifically, we show that species responses vary with elevation and site conditions (dry versus wet), and that these differences become particularly evident during specific anomalous years. However, analyses across different altitudes introduce some uncertainties, making it difficult to draw a definitive conclusion about which species exhibits a more efficient recovery from extreme heat and drought events.

Furthermore, these changes are occurring rapidly in the Alps, with important consequences for tree species adapted to strong climate seasonality and short growing season, altering the role of Alpine European larch and Norway spruce forests in carbon sequestration and mitigation of climate change.

How to cite: Guarnieri, C., Oggioni, S. D., Oddi, L., Koliopoulos, S., Ferraris, D., Filippa, G., Grosso, F., Morra di Cella, U., Pogliotti, P., and Galvagno, M.: Heat and drought in the Alps: comparative tree-ring study between European larch and Norway spruce growing in dry and wet conditions , EGU General Assembly 2026, Vienna, Austria, 3–8 May 2026, EGU26-12161, https://doi.org/10.5194/egusphere-egu26-12161, 2026.

EGU26-12479 | Orals | CL1.2.1

Forest responses to nitrogen deposition and climate extremes as assessed by combining stable isotopes in tree rings and ecosystem fluxes  

Rossella Guerrieri, Marco Montedoro, Sofia Berlanda, Lorenzo Arcidiaco, Matteo Rossi, Francesco Mazzenga, Katja Rinne-Garmston, and Giorgio Matteucci and the ICOS and ICP Forests collaborators

Forests are central to climate-change mitigation but are increasingly threatened by global change components, such as more frequent extreme weather and climate events (particularly drought and heatwaves) and increasing nitrogen deposition, resulting in great uncertainties for the future of the essential ecosystem services they provide. Drought and heatwaves impair physiological mechanisms underpinning tree growth and forest productivity, and they may trigger tree mortality, thus constraining the forest carbon sink. On the one hand, nitrogen deposition stimulates tree growth in nitrogen-limited forests, but when exceeding the empirical nitrogen critical load could cause forest dieback, through soil acidification and nutrient imbalances, but also by making trees more vulnerable to drought. Many questions remain: How do global change components interact and affect forest functioning? Which tree ecophysiological mechanisms are involved?  Are those mechanisms synchronized at tree and ecosystem scales (in terms of temporal trends and intra-annual seasonal changes)? Does nitrogen deposition affect tree and forest responses to climate extremes under a CO2 richer world? The NEXTRES project aims at addressing these questions by applying a multi-scale approach combining tree-based measurements (including long-term growth and stable carbon, oxygen and nitrogen isotopes together with intra-annual scale carbon isotope analyses) to ecosystem responses (Gross Primary Production and Evapotranspiration). We studied eleven forest sites along climatic and nitrogen deposition gradients (3–42 kg N ha⁻¹ yr⁻¹) across Europe, within the ICOS and ICP Forests networks, focusing on four widespread tree species (Fagus sylvatica, Quercus spp., Picea abies, Pinus sylvestris). Across sites, basal area increment generally declined during recent climate extremes (e.g. the 2018 drought), with a stronger response in the case of broadleaf vs. conifer species, followed by recovery in subsequent years at most of the sites. Preliminary isotope results for Fagus sylvatica at two sites show contrasting responses: intrinsic water-use efficiency (iWUE) increased during the 2018 drought at Sorø (Denmark), coinciding with reduced growth, whereas a severe late frost at Collelongo (Italy) reduced growth without a clear iWUE response, suggesting different plant strategies in terms of leaf gas exchanges and carbon allocation. Preliminary intra-annual δ¹³C analyses from Picea abies trees in Davos (Switzerland) reveal higher and more variable δ¹³C values during the extreme year in 2018, with elevated values in latewood compared to earlywood, highlighting strong seasonal modulation of drought responses. The coupling between tree-level and ecosystem responses will be assessed at the multidecadal and intra-seasonal scale, as well as the contribution of nitrogen deposition in modulating forest vulnerability and resilience to climate extremes.

Acknowledgments. Project funded by the European Union - NextGenerationEU under the National Recovery and Resilience Plan (PNRR) - Mission 4 Education and research - Component 2 From research to business - Investment 1.1 Notice Prin 2022 - DD N. 104 del 2/2/2022, title “Effects of nitrogen deposition and climate extremes on European forests: combining stable isotopes in tree rings and ecosystem fluxes (NEXTRES)”, proposal code 202299J927 - CUP J53D23002640006. We thank all collaborators at the forest sites for assistance in the field.


How to cite: Guerrieri, R., Montedoro, M., Berlanda, S., Arcidiaco, L., Rossi, M., Mazzenga, F., Rinne-Garmston, K., and Matteucci, G. and the ICOS and ICP Forests collaborators: Forest responses to nitrogen deposition and climate extremes as assessed by combining stable isotopes in tree rings and ecosystem fluxes , EGU General Assembly 2026, Vienna, Austria, 3–8 May 2026, EGU26-12479, https://doi.org/10.5194/egusphere-egu26-12479, 2026.

EGU26-12811 | Orals | CL1.2.1

Intensification of the Amazon hydrological cycle inferred from tree-ring stable isotopes 

Bruno Barcante Ladvocat Cintra, Emanuel Gloor, Jessica C. A. Baker, Arnoud Boom, Jochen Schöngart, Santiago Clerici, Kanhu Pattnayak, and Roel Brienen

Understanding how the hydrological cycle of tropical regions has responded to recent climate change is critical for assessing ecosystem resilience, carbon cycling, and the risk of large-scale forest transitions. However, long-term observational records of precipitation remain sparse across much of the tropics, and existing datasets often disagree on both the magnitude and direction of rainfall trends. In particular, whether recent changes reflect general drying, wetting, or an amplification of rainfall seasonality remains unresolved.

This talk examines how stable oxygen isotope ratios (δ¹⁸O) preserved in annually resolved tree rings can provide large-scale, seasonally resolved insights into hydroclimate change. The analysis draws on an Amazon study based on oxygen isotope chronologies from two tree species with contrasting growth phenologies and hydrological settings: Cedrela odorata from terra firme forests, which forms annual rings during the wet season, and Macrolobium acaciifolium from seasonally flooded forests, which grows during the terrestrial phase coinciding with the Amazon dry season. Although sampled from sites separated by approximately 1000 km, large-scale atmospheric moisture transport and Rayleigh distillation processes impart a coherent basin-scale climatic signal to both records, allowing wet- and dry-season trends to be evaluated independently.

The two δ¹⁸O chronologies exhibit opposing long-term trends since around 1980, with increasing δ¹⁸O values in the dry-season record and decreasing values in the wet-season record, consistent with an intensification of rainfall seasonality. The talk highlights the specific ecohydrological and phenological conditions that make this type of inference possible, and discusses the distinct sources of uncertainty that can affect interpretation across different records. Key conditions relating to growth seasonality, moisture sourcing, and signal integration must be met in order to draw comparable conclusions from other tree-ring isotope datasets. The talk therefore outlines the potential and common pitfalls associated with applying tree-ring isotope approaches to assess large-scale changes in climate seasonality.

How to cite: Barcante Ladvocat Cintra, B., Gloor, E., C. A. Baker, J., Boom, A., Schöngart, J., Clerici, S., Pattnayak, K., and Brienen, R.: Intensification of the Amazon hydrological cycle inferred from tree-ring stable isotopes, EGU General Assembly 2026, Vienna, Austria, 3–8 May 2026, EGU26-12811, https://doi.org/10.5194/egusphere-egu26-12811, 2026.

EGU26-12930 | ECS | Posters on site | CL1.2.1

 Exploring the potential of multiple tropical tree species for dendroclimatology in the Ecuadorian Andes  

Lona Meyer, Gerhard Helle, Ana Mariscal Chavez, and Elisabeth Dietze

Climate change projections for the equatorial Ecuadorian Andes are contradictory due to topographic diversity and interplay of multiple climatic influences. Intensifying droughts and increasing precipitation variability impact the livelihood of local populations which depend on agriculture and hydroelectric energy sources and thus are highly vulnerable to long- and short-term climatic changes. Overall, the hydroclimate of the northern tropical Andes is influenced by multiple climate systems such as the Intertropical Convergence Zone (ITCZ), the Pacific Decadal Oscillation (PDO) and El Niño Southern Oscillation (ENSO) (Dominguez-Castro et al., 2017). The interaction of these large-scale climate systems across the complex Andean topography results in strong variability of local climate conditions. As a result, the available instrumental climate data is spatially and temporally limited. Tree-rings and stable isotopes can be used as high-resolution climate proxy to complement and extend instrumental records and investigate local climate impacts.

This study focuses on exploring the potential of multiple tropical Ecuadorian tree species, beyond the Polylepis-focused approaches common in Andean dendroclimatology. For a feasibility study, five tree species of the western cordillera located about 30 km north of Quito were selected. Dendrocores were retrieved at an elevation of 2000 – 3000 m a.s.l in the protected Cambugán primary forest, a primary and secondary forest in the Piganta river catchment (Atahualpa) and a private agroforest area. Although uncertain seasonality in the Andean tropics complicates the use of standard dendrochronological applications, preliminary observations suggest that growth patterns and potential annual tree-rings may be influenced by local precipitation patterns characterized by a dry season. Other potential growth-limiting factors appear largely persistent across the research area. Overall, the identification and description of growth-ring boundaries across multiple tropical tree species will provide the foundation for robust chronologies and future dendroclimatological analyses using stable isotopes. This could enable further investigation in the reconstruction of local precipitation and drought patterns in relation to large-scale climate influences (ENSO, ITCZ, PDO).

How to cite: Meyer, L., Helle, G., Mariscal Chavez, A., and Dietze, E.:  Exploring the potential of multiple tropical tree species for dendroclimatology in the Ecuadorian Andes , EGU General Assembly 2026, Vienna, Austria, 3–8 May 2026, EGU26-12930, https://doi.org/10.5194/egusphere-egu26-12930, 2026.

EGU26-13123 | Orals | CL1.2.1

Dynamic treeline and cryosphere response to pronounced mid-Holocene climatic variability in the US Rocky Mountains 

David McWethy, Gregory Pederson, Nathan Chellman, Matthew Toohey, Johann Jungclaus, Craig Lee, Daniel Stahle, Justin Martin, Mio Alt, Nickolas Kichas, Cathy Whitlock, and Joseph McConnell

Climate-driven changes in high-elevation forest distribution and reductions in snow and ice cover have major implications for ecosystems and global water security. In the Greater Yellowstone Ecosystem of the Rocky Mountains (United States), recent melting of a high-elevation (3,091 m asl) ice patch exposed a mature stand of whitebark pine (Pinus albicaulis) trees, located ~180 m in elevation above modern treeline, that date to the mid-Holocene (c. 5,950 to 5,440 cal y BP). Here, we used this subfossil wood record to develop tree-ring-based temperature estimates for the upper-elevation climate conditions that resulted in ancient forest establishment and growth and the subsequent regional ice-patch growth and downslope shift of treeline. Results suggest that mid-Holocene forest establishment and growth occurred under warm-season (May-Oct) mean temperatures of 6.2 °C (±0.2 °C), until a multicentury cooling anomaly suppressed temperatures below 5.8 °C, resulting in stand mortality by c. 5,440 y BP. Transient climate model simulations indicate that regional cooling was driven by changes in summer insolation and Northern Hemisphere volcanism. The initial cooling event was followed centuries later (c. 5,100 y BP) by sustained Icelandic volcanic eruptions that forced a centennial-scale 1.0 °C summer cooling anomaly and led to rapid ice-patch growth and preservation of the trees. With recent warming (c. 2000–2020 CE), warm-season temperatures now equal and will soon exceed those of the mid-Holocene period of high treeline. It is likely that perennial ice cover will again disappear from the region, and treeline may expand upslope so long as plant-available moisture and disturbance are not limiting.

How to cite: McWethy, D., Pederson, G., Chellman, N., Toohey, M., Jungclaus, J., Lee, C., Stahle, D., Martin, J., Alt, M., Kichas, N., Whitlock, C., and McConnell, J.: Dynamic treeline and cryosphere response to pronounced mid-Holocene climatic variability in the US Rocky Mountains, EGU General Assembly 2026, Vienna, Austria, 3–8 May 2026, EGU26-13123, https://doi.org/10.5194/egusphere-egu26-13123, 2026.

EGU26-14315 | Posters on site | CL1.2.1

Estimating tree-ring growth using the radiocarbon bomb pulse 

Marie-Josée Nadeau, Helene Svarva, Pieter M. Grootes, Martin Seiler, Wendy Khumalo, and Bente Philippsen

In the 1950s and 1960s, atmospheric nuclear bomb tests caused a significant and rapid increase of the atmospheric radiocarbon content, almost doubling it in 1963 (Hua et al. 2022). Known as the 14C bomb pulse, this provides a clear timestamp for materials formed during this period and afterwards. It has proven invaluable in tracking carbon cycle dynamics and environmental changes (Levin & Hesshaimer 2000). It can be used in any process which exchanges carbon with the atmosphere or incorporates carbon from the atmosphere such as plants.

Here we present a study using the rapid atmospheric radiocarbon fluctuations of the 1950s & 1960s to assess the tree-ring growth pattern and growing season length of five Scots pine trees from five Norwegian sites, from 63°15’ to 69°24’ N, over a period of 15 years (6 years using direct measurements and 9 years using indirect measurements). For each tree, rings within the period 1950-1965 were sliced into the largest practical number of subannual sections (up to 10), depending on the width of the ring in the sample. After cellulose extraction, the 14C content of each increment was measured to a high precision.

Cumulative wood formation usually follows a sigmoid shape, with slower growth during spring and early summer, faster growth in midsummer, and decreasing activity towards the end of the vegetation period (e.g. Schmitt et al. 2004). In European and North American conifers of cold environments, the onset of cambial activity can vary from the beginning of May to early June, depending on intra-annual weather-, snow-depth- and soil conditions (Vaganov et al. 1999; Deslauriers et al. 2003; Rossi et al. 2007; Hettonen et al. 2009). Despite these variations, maximum tree-ring growth rate seems to be limited to a short period, which in most European and North American conifer species is about the time of maximum day length (Rossi et al. 2006).

By adapting the sigmoid growth curves to match the 14C results of the cellulose increments to the atmospheric signal, we obtain a growth curve and growing season length which are independent from other assumptions. Comparison to the presumed growing season parameters (start, end, and length) derived from meteorological data, then, provides a valuable source of information to understand the connection between tree growth and environmental parameters. The 14C bomb pulse, acting as a magnifying lens, this research will help to understand the connection between atmospheric CO2 isotopic values and that of the tree-rings formed under these conditions  

How to cite: Nadeau, M.-J., Svarva, H., Grootes, P. M., Seiler, M., Khumalo, W., and Philippsen, B.: Estimating tree-ring growth using the radiocarbon bomb pulse, EGU General Assembly 2026, Vienna, Austria, 3–8 May 2026, EGU26-14315, https://doi.org/10.5194/egusphere-egu26-14315, 2026.

EGU26-15820 | ECS | Posters on site | CL1.2.1

Species- and region-specific climate sensitivities of European tree provenances across a continental gradient 

Jernej Jevšenak and Luka Krajnc and the OptForests

Climate change is profoundly altering forest ecosystems worldwide by affecting tree growth, mortality and regeneration through rising temperatures, shifting precipitation regimes and more frequent extreme events. Provenance trials provide a powerful framework to assess how tree populations from different climatic origins perform under changing environmental conditions. Here, we analysed tree-ring data from 25 common gardens and 176 provenances spanning a broad gradient from the Mediterranean to Scandinavia. These trials encompassed four climatic clusters (Northern, Central, Southwestern and High elevation) and six widespread European tree species (Quercus robur, Quercus petraea, Picea abies, Pinus sylvestris, Pinus pinaster and Larix decidua). More than 5,500 increment cores were collected and measured using standard dendrochronological methods. Provenances were classified as originating from climates that were warmer or colder, drier or wetter, or locally similar relative to conditions at the trial sites. For each trial and provenance class, we quantified radial growth patterns, climate–growth relationships and resilience components (resistance, recovery, resilience) to past warming and drying events. Our results indicate strongly species- and region-specific responses. The clearest patterns emerged for Quercus robur from the Northern cluster, where provenances originating from warmer regions showed enhanced heat vulnerability and reduced radial growth, indicating a smaller thermal safety margin under additional warming, whereas provenances from cooler regions responded more positively to increased spring temperatures. In contrast, the opposite pattern emerged for Larix decidua and Pinus pinaster from the Southwestern cluster, where provenances from warmer origins exhibited higher heat tolerance than those from cooler parts of the native range. Overall, our findings demonstrate that provenance choice can substantially modify tree growth and resilience to extreme weather events, and that these effects are strongly region- and species-specific.

How to cite: Jevšenak, J. and Krajnc, L. and the OptForests: Species- and region-specific climate sensitivities of European tree provenances across a continental gradient, EGU General Assembly 2026, Vienna, Austria, 3–8 May 2026, EGU26-15820, https://doi.org/10.5194/egusphere-egu26-15820, 2026.

EGU26-16456 | Orals | CL1.2.1

Advancing Tree-Ring Isotope Analysis: A Comparative Assessment of LA-CRDS and LA-IRMS 

Ciprian Stremtan, Cristina Puscas, Elina Sahlstedt, Jan Wožniak, Magdalena Hoffman, and Katja Rinne-Garmston

Stable isotope analysis of tree rings provides critical insight into past environmental and climatic conditions. Traditionally, the elemental analyzer has been the benchmark sample introduction peripheral for isotope ratio mass spectrometers (EA IRMS) for spatially resolved δ¹³C measurements in wood and cellulose. However, recent developments in using laser ablation as sample introduction peripheral for both the IRMS (LA-IRMS) and cavity ring-down spectroscopes (LA-CRDS) introduce promising alternatives that combine cost efficient, rapid analysis with high spatial resolution and simplified sample handling.

In this study, we present a comparative evaluation of LA-CRDS and LA-IRMS for δ¹³C measurements relevant to tree ring research. We examine figures of merit for LA-CRDS and LA-IRMS using pulsed nanosecond solid-state lasers at 213 nm wavelength (Teledyne Photon Machines) coupled via a dedicated ablation chamber (Terra Analitic) to a Picarro CO2 isotope analyzer (G2201-i) and Sercon HS2022 IRMS. Key performance indicators such as accuracy, precision, and spatial resolution are assessed to determine the suitability of both techniques for high-resolution tree-ring analysis.

Our findings highlight scenarios where each of these techniques offer advantages, such as faster throughput and reduced infrastructure requirements, while maintaining analytical rigor. These results underscore the growing potential of LA-IRMS and LA-CRDS as innovative tools for the tree-ring research community and broader environmental studies.

This advancement opens new opportunities for high-resolution dendrological studies, enabling a broader adoption of isotope-based research, including climate reconstructions, past and present environmental studies, and tracing anthropic activity.

How to cite: Stremtan, C., Puscas, C., Sahlstedt, E., Wožniak, J., Hoffman, M., and Rinne-Garmston, K.: Advancing Tree-Ring Isotope Analysis: A Comparative Assessment of LA-CRDS and LA-IRMS, EGU General Assembly 2026, Vienna, Austria, 3–8 May 2026, EGU26-16456, https://doi.org/10.5194/egusphere-egu26-16456, 2026.

EGU26-16957 | Posters on site | CL1.2.1

FAIRWood: An open database for global xylogenesis research 

Patrick Fonti, Antoine Cabon, Omar Flores, Malcom Hughes, Cristina Nabais, Elena Larysch, Lorène Marchand, Kiyomi Morino, Mara Nägelin, Xiaoxia Li, Peter Prislan, Anne Sophie Sergent, Roberto Silvestro, Dominik Stangler, Wenjin Wang, and Cyrille Rathgeber

Wood formation (xylogenesis) represents the mechanistic link between short-term physiological processes and long-term tree-ring patterns and thus provides a key entry point to connect processes, patterns, and predictions in tree growth research. Although numerous xylogenesis datasets already exist worldwide, their real strength emerges when they are considered together, enabling large-scale syntheses of growth phenology, cell production dynamics, and climate sensitivity across species and biomes. FAIRWood builds on this opportunity as an international initiative that is developing an open database to harmonize, connect, and increase the scientific value of xylogenesis data. This presentation introduces the FAIRWood project, its objectives, and the scope and description of the database.

FAIRWood brings together observations from intra-annual wood formation monitoring, including data on cambial activity and successive cell differentiation phases, collected across multiple sites, climates, and taxa. Each record is accompanied by metadata that describes the sampling design, protocols, temporal resolution, and sampling-, tree- and stand-level characteristics, ensuring data preservation, harmonization, reuse, and cross-study comparability according to the FAIR principles. The database aims to host data on both xylem and phloem formation of stems, branches and coarse roots for gymnosperms and angiosperms and integrate automated tools for data visualization, exploration and basic processing, with the aim of increasing the visibility and accessibility of past and ongoing monitoring efforts.

By unifying observations, metadata, and analytical tools within a single framework, FAIRWood aims to foster international collaboration while also acting as a shared platform to enhance the visibility of datasets and projects produced by research groups. This integrated approach enables large-scale analyses across space, time, and taxa, supports comparative studies, and strengthens the development and evaluation of vegetation models as well as forest responses to global environmental change.

How to cite: Fonti, P., Cabon, A., Flores, O., Hughes, M., Nabais, C., Larysch, E., Marchand, L., Morino, K., Nägelin, M., Li, X., Prislan, P., Sergent, A. S., Silvestro, R., Stangler, D., Wang, W., and Rathgeber, C.: FAIRWood: An open database for global xylogenesis research, EGU General Assembly 2026, Vienna, Austria, 3–8 May 2026, EGU26-16957, https://doi.org/10.5194/egusphere-egu26-16957, 2026.

EGU26-17131 | Orals | CL1.2.1

Climatic and anthropogenic drivers of tree-line shifts in the Lesser Caucasus over the past 25 years revealed by tree-rings and remote sensing 

Lea Schneider, Anne Weber, Dario Martin-Benito, Rupesh Dhyani, Andrea Seim, Alexander Gavashelishvili, Revaz Kvaratskhelia, and Jörn Profe

Tree‑line shifts are a key response of forest ecosystems to global warming, especially in high‑mountain ranges where climatic gradients are steep. While rising temperatures would suggest upward migration, actual tree‑line dynamics are also modulated by water availability and historic land‑use intensity. We examined tree‑line changes in the Lesser Caucasus over the past 25 years using a combination of dendrochronological data from 15 high‑elevation sites and remote‑sensing images spanning the region’s diverse climates from humid subtropical conditions near the Black Sea to semi‑arid regimes in the southeast. The land-cover classification with Landsat 5, 8 and 9 imagery (30x30m spatial resolution) from the years 1998 and 2023 shows a general upward trend of tree-lines but with strong spatial variations: the humid northwestern part experienced advances of up to 2.2m/year, whereas the more arid southeastern sector recorded retreats of up to 1.2m/year. Tree‑ring width chronologies reveal a weak, positive relationship with winter and summer temperatures, indicating improved growth under a warming climate. Water limitation in tree-ring width is slightly stronger in the drier northeast of the Lesser Caucasus than in the more humid northwest. But the signal is generally weak, there is no clear hydroclimatic trend and the spatial differences may only reflect the uneven distribution of species across the sampling network. Interpretation of these findings suggests warmer summers under rather constant moisture regimes have permitted tree growth beyond current tree-lines. However, at mid‑ and low‑latitudes, tree-lines on south‑facing slopes are usually situated lower than on north‑facing slopes because water limitation - not thermal limitation - dominates on the sun‑exposed aspect. In our study area, we also observe lower tree-lines on south‑facing slopes, yet those same slopes exhibit the strongest upward shifts over the last three decades. Hence, tree-line dynamics cannot be explained by temperature or drought alone. The most plausible additional drivers include snow dynamics and the recent reduction of anthropogenic pressure (e.g., reduced grazing and illegal logging) that has enabled upslope forest expansion, especially on south‑facing slopes. Further monitoring of tree growth dynamics across the Caucasus region, and particularly in the southern Lesser Caucasus, where tree-ring data are currently lacking, would be essential to resolve the observed tree-line shifts and anticipate potential future changes.

How to cite: Schneider, L., Weber, A., Martin-Benito, D., Dhyani, R., Seim, A., Gavashelishvili, A., Kvaratskhelia, R., and Profe, J.: Climatic and anthropogenic drivers of tree-line shifts in the Lesser Caucasus over the past 25 years revealed by tree-rings and remote sensing, EGU General Assembly 2026, Vienna, Austria, 3–8 May 2026, EGU26-17131, https://doi.org/10.5194/egusphere-egu26-17131, 2026.

EGU26-17435 | ECS | Orals | CL1.2.1

Tree rings in context: linking annual growth, intra-annual water relations, and forest structure in a density experiment 

Eva Meijers, Jorad de Vries, Gert-Jan Nabuurs, and Frank Sterck

Tree-ring studies commonly rely on stand-level chronologies derived from ten or more trees and interpret growth responses at the annual scale. While this approach has been highly successful for detecting broad climate signals, it obscures individual-level variability and collapses intra-annual processes that regulate tree growth and water relations. Yet key physiological responses to forest density—particularly those related to water stress—operate at the scale of individual trees and days to weeks rather than years. Providing physiological context to annual tree-ring records may therefore be essential for assessing whether intermediate density reductions translate into greater tree hydraulic safety. 

Here, we investigate how forest density affects tree growth and water relations by combining annual tree-ring data with intra-annual and spatially explicit structural measurements in a forest density experiment established in 2019 on nutrient-poor sandy soils in the Netherlands. The experiment comprises four density treatments (control, high thinning ~20% removal, shelterwood ~80% removal, and clearcut) across three temperate tree species (Fagus sylvatica, Pseudotsuga menziesii, and Pinus sylvestris). Our structural measurements (as captured by terrestrial laser scanning) reveal that local tree density varies strongly within treatments, with intra-treatment variability reaching up to 50%. This heterogeneity allows us to construct a continuous density gradient at the individual-tree level rather than relying solely on treatment- or stand-level averages, which commonly mask divergent individual responses in aggregated tree-ring chronologies. 

Tree-ring analyses show a consistent increase in annual growth with decreasing stand density. However, high-frequency dendrometer measurements indicate that this enhanced growth is not necessarily accompanied by improved tree water status, suggesting that reduced competition does not automatically translate into greater hydraulic safety. We propose that this decoupling arises from compensating mechanisms such as increased evaporative demand under more open canopies and higher water uptake by understory vegetation. Overall, our results demonstrate that integrating annual tree-ring records with intra-annual physiological measurements and high-resolution forest structural data provides essential context for interpreting growth responses to forest density. They further indicate that tree water and density relations are more complex than commonly assumed, with multiple compensating processes potentially masking density effects. This multi-scale perspective enables a shift from purely correlative inference toward a more process-oriented understanding of how forest density shapes tree growth under increasing drought stress.

How to cite: Meijers, E., de Vries, J., Nabuurs, G.-J., and Sterck, F.: Tree rings in context: linking annual growth, intra-annual water relations, and forest structure in a density experiment, EGU General Assembly 2026, Vienna, Austria, 3–8 May 2026, EGU26-17435, https://doi.org/10.5194/egusphere-egu26-17435, 2026.

EGU26-18133 | ECS | Orals | CL1.2.1

Tree-ring δ18O illuminates hydroclimatic context during the Medieval Climate Anomaly–Little Ice Age transition in central-western France 

Charlie Hureau, Valérie Daux, Tiphaine Penchenat, Yannick Le Digol, Yann Couturier, Edouard Régnier, and Emmanuèle Gautier

Most current knowledge of past hydroclimatic variability over the last millennium in Western Europe is derived from tree-ring records. However, only a limited number of these archives span the entire millennium, which limits our ability both to place recent climate change within a long-term perspective and to characterize past climatic periods with sufficient resolution. Consequently, climatic conditions during the Medieval Climate Anomaly (MCA; ~900–1250 CE), generally considered relatively warm, as well as the transition toward the cooler conditions of the Little Ice Age (LIA; ~1350–1850 CE), remain poorly constrained, in terms of their temporal and spatial heterogeneity across Europe. In France, a quasi-millennial tree-ring δ18O chronology for the Paris basin (δ18OPB), spanning the periods from 1046 to 1240 CE and from 1306 to 2007 CE, has been developed. However, data remain lacking for the transitional interval between the MCA and the LIA, a period that may have been critical for past societies and for understanding the dynamics of long-term climate variability.

In this study, we use oak tree-ring cellulose δ18O, a robust proxy for hydroclimatic conditions in lowland regions. Five site-specific δ18O chronologies were developed: one based on living trees and four derived from oak beams from medieval buildings, all located in central-western France. Correlations with δ18OPB over overlapping periods range from 0.52 to 0.72, allowing the central France chronologies to be merged with δ18OPB to produce a continuous millennial δ18O record spanning 1046–2023 CE. The strongest relationships with instrumental climate data over 1901–2023 CE were observed for June–August SPEI (r = −0.71), maximum temperature (r = 0.65), and May–August precipitation (r = −0.57). The final reconstruction was calibrated against June–August SPEI, which showed the highest predictive skill (r² = 0.50) and the greatest temporal stability across the calibration/verification split periods.

Hydroclimatic conditions are characterized in terms of long-term trends, regime shifts, and extremes, with particular emphasis on the transition between MCA and LIA. The results provide new insights into past summer drought variability in the region, revealing that the most extreme events occurred toward the end of the MCA (e.g. 1222, 1252, 1287, and 1331 CE). In contrast, drought conditions in the last decade (2014–2023 CE) are unprecedented over the past millennium and occur within a broader, statistically significant drying trend that has developed over the past century.

How to cite: Hureau, C., Daux, V., Penchenat, T., Le Digol, Y., Couturier, Y., Régnier, E., and Gautier, E.: Tree-ring δ18O illuminates hydroclimatic context during the Medieval Climate Anomaly–Little Ice Age transition in central-western France, EGU General Assembly 2026, Vienna, Austria, 3–8 May 2026, EGU26-18133, https://doi.org/10.5194/egusphere-egu26-18133, 2026.

EGU26-18490 | ECS | Orals | CL1.2.1

Unveiling secrets from the past: wood anatomy to disentangle masting and drought 

Giulia Resente, Jiří Lehejček, Andrew Hacket Pain, and Davide Ascoli

Reconstructing masting, the variable and synchronized seed production by a plant population, is key to assessing trees species resilience to past climate variability and predict fecundity of forest ecosystems under global warming. Masting has shifted in recent decades, linked to climate warming, with consequences for seed production and forest reproduction, and wider cascading effects on forest food webs. Nevertheless, we have little understanding of natural long-term variability in masting, and no method to reconstruct masting in the absence of annual seed-crops observations.

Here, we investigated tree-ring width and a wide range of wood anatomical traits to disentangle the effect of masting and drought on wood anatomy, using individual times series (1980-2022) from Fagus sylvatica (L.) cores sampled in Woodbury (UK). Results showed that tree-ring width and the majority of wood anatomical traits were correlated with current-year May temperature, precipitation, and SPEI drought index, while stronger correlations were observed with previous-year summer conditions. In contrast, masting, quantified as seed production, mainly correlated with summer conditions two years prior. This complex multi-year pattern, supported by literature, is further reinforced by the evident one-year lag between the TRW chronology and the seed production time series.

These results set the premises for the implementation of a structural equation model that incorporates the underlying connections between biotic and abiotic variables. This approach will establish the possibility of disentangling of drought and masting effects on wood anatomy, and provide the basis for masting reconstructions using wood anatomy. The reconstruction of past masting events beyond current limitations is of extreme ecological relevance under ongoing climate condition and highlights the potential offered by wood anatomy in this framework.

How to cite: Resente, G., Lehejček, J., Hacket Pain, A., and Ascoli, D.: Unveiling secrets from the past: wood anatomy to disentangle masting and drought, EGU General Assembly 2026, Vienna, Austria, 3–8 May 2026, EGU26-18490, https://doi.org/10.5194/egusphere-egu26-18490, 2026.

EGU26-18852 | ECS | Orals | CL1.2.1

How do oak and pine cope with edge effects along railway tracks? 

Martin Häusser, Nandini Hannak, Larissa Billig, Wolfgang Kurtz, Paul Schmidt-Walter, and Achim Bräuning

Germany has one of the most extensive railway networks in Europe. Due to the effects of climate change and the increasing frequency of extreme weather events, there is a growing risk to railway infrastructure posed by poor vitality of trees along rail tracks. Due to the forest edge effect, these trackside trees are exposed to greater variation in temperature and humidity, and are more strongly affected by weather extremes than their equivalents within a forest stand.

The project RailVitaliTree (Tree vitality monitoring and modelling of drought-related risks along railroads with remote sensing and dendroecology) has a multidisciplinary approach, using remote sensing, dendroecological, and hydroclimatic analyses, to study tree vitality and microclimatic conditions along the German railway network. For this, increment cores of Quercus robur and Pinus sylvestris were extracted at four sites per species, where each site consists of a subsite along the railway and a corresponding reference in the forest.

Our results show that trees along the railway had higher radial growth than reference trees in the forest. In fact, although mean series produced by pooling all trackside and all reference trees display that the growth trend of trackside and reference trees is highly synchronous (Q. robur GLK = 0.87; r = 0.83 and P. sylvestris GLK = 0.82; r = 0.60), the mean ring width and basal area increment of trackside trees were higher than that of the reference trees. So why do these trees seemingly grow better along railway tracks?

Despite more radial growth, trackside trees of either species did not show a notably stronger response to climate parameters than the reference. However, there was a greater relative decrease in ring width and basal area increment of trackside trees in both species during known drought years. In order to investigate this difference in sensitivity and growth of trackside trees during drought events we use a high-resolution, species-specific drought-stress index developed by the German Meteorological Service, identifying when plant-available soil water is below drought thresholds. Through this work, we aim for a deeper understanding of this special type of forest edge, so to better assess its possible impacts on the railway system.

How to cite: Häusser, M., Hannak, N., Billig, L., Kurtz, W., Schmidt-Walter, P., and Bräuning, A.: How do oak and pine cope with edge effects along railway tracks?, EGU General Assembly 2026, Vienna, Austria, 3–8 May 2026, EGU26-18852, https://doi.org/10.5194/egusphere-egu26-18852, 2026.

EGU26-20447 | ECS | Posters on site | CL1.2.1

Combined wood cellulose extraction method for radiocarbon and stable isotope analysis   

Kozue Ando, Simona Staub, Giulia Guidobaldi, Daniel Nievergelt, Matthias Saurer, Loic Schneider, Anne Verstege, Michael Friedrich, Patrick Fonti, Frederick Reinig, Lukas Wacker, and Kerstin Treydte

The combination of tree-ring radiocarbon (14C) and stable isotope ratios of carbon, oxygen, and hydrogen has been proposed as a valuable approach to solve dating uncertainties in this period and is therefore a helpful tool for reconstructing Late Glacial climate conditions. However, sample throughput at annual to sub-annual resolution remains limited by current wood pretreatment methods, as no established protocol exists that is suitable for both 14C and stable isotope analyses, given their distinct requirements (i.e., ultra-clean cellulose for 14C analysis, preservation of original isotopic signatures and cellulose homogeneity for stable isotope analysis). Additionally, Late Glacial subfossil wood often suffers from degradation, resulting in lower cellulose content compared to modern wood. Here, we introduce a novel cellulose extraction method suitable for both 14C and stable isotope measurements, thereby reducing labor intensity and substantially increasing analytical throughput of multiproxy analyses. The new method was systematically evaluated using both modern and Late Glacial subfossil wood and benchmarked against established reference protocols optimized specifically for either 14C or stable isotope analyses. Two major modifications were introduced: (1) the addition of a strong base step to isolate the alpha cellulose fraction, and (2) modified reaction times for both base and bleaching steps. We present preliminary results with a special focus on preservation of isotopic (14C, 13C, and 18O) signatures and cellulose yield. The feasibility of the new cellulose extraction method for multiproxy analysis is discussed, along with remaining challenges and directions for further optimization.

How to cite: Ando, K., Staub, S., Guidobaldi, G., Nievergelt, D., Saurer, M., Schneider, L., Verstege, A., Friedrich, M., Fonti, P., Reinig, F., Wacker, L., and Treydte, K.: Combined wood cellulose extraction method for radiocarbon and stable isotope analysis  , EGU General Assembly 2026, Vienna, Austria, 3–8 May 2026, EGU26-20447, https://doi.org/10.5194/egusphere-egu26-20447, 2026.

EGU26-2635 | Posters on site | HS8.2.14

Seasonal Coastal Groundwater Dynamics at Lahaina Beaches, Hawaiʻi 

Xiaolong Geng, Edward Lopez, Hope Kanoa, Hong Zhang, Amir Haroon, Henrietta Dulai, and Tao Yan

The August 2023 Lahaina wildfire caused extensive environmental impacts, including the release of untreated wastewater and combustion-derived contaminants such as nutrients and polycyclic aromatic hydrocarbons (PAHs). This study examines seasonal groundwater flow and solute transport dynamics within a post-wildfire beach aquifer. Using field observations and a two-dimensional, density-dependent, variably saturated groundwater model calibrated with year-long data, we simulated groundwater flow and salinity patterns and applied Lagrangian particle tracking to evaluate solute pathways and transit times. Summer conditions are characterized by elevated inland groundwater levels and predominantly seaward flow, resulting in rapid solute discharge to the shoreline. In contrast, enhanced tidal and wave forcing in winter drives greater seawater infiltration, deeper recirculation, and net landward solute transport with longer residence times. Our results highlight the importance of seasonal and tidal variability in controlling post-wildfire contaminant fate and provide insights for time-sensitive coastal management and ecosystem protection.

How to cite: Geng, X., Lopez, E., Kanoa, H., Zhang, H., Haroon, A., Dulai, H., and Yan, T.: Seasonal Coastal Groundwater Dynamics at Lahaina Beaches, Hawaiʻi, EGU General Assembly 2026, Vienna, Austria, 3–8 May 2026, EGU26-2635, https://doi.org/10.5194/egusphere-egu26-2635, 2026.

EGU26-4876 | Orals | HS8.2.14

The present and future of alpine groundwater dynamics: Lessons from the Vallon de Réchy (Switzerland)   

Landon J.S. Halloran, Antoine Carron, Marie Arnoux, Nazanin Mohammadi, Eleanor Berdat, Noam Makkinga, Chloé Magnenat, Ronny Figueroa, and Jeremy Millwater

Relative to lowland systems, alpine hydrological systems face more rapid and impactful changes due to climate change. In this context of altered meteorological patterns, including decreased snow cover and greater variations in precipitation timing, groundwater’s hydrological buffering role is becoming increasingly significant. A multi-method research approach applied in the Vallon de Réchy reserve (Valais Alps, Switzerland) has provided us with new insights into groundwater as a key component of alpine hydrological systems.

The Vallon de Réchy (2182-3149 m.a.s.l., 11 km²) is a non-glaciated, nival-regime alpine headwater catchment with strong elevation gradients and highly heterogeneous geology. Much of our detailed process understanding comes from extensive work in a specific zone, the Tsalet subcatchment (2268-2893 m.a.s.l., 1 km²), where intermittent streams, perennial springs, and extensive unconsolidated sediments have made it a natural laboratory for studying alpine groundwater, developing hydrogeophysical methods, and investigating climate-change sensitivity.

Our hydrological, geochemical, and geophysical investigations reveal a highly heterogeneous system in which unconfined aquifers act as hydrological buffers to ensure year-round streamflow. Geochemical and stable isotope analyses provide us with information on the connectivity of different components of the system, as well as variations of end-member contributions to streamflow. By integrating hydrological observations and electrical resistivity tomography (ERT) measurements into numerical models, we have investigated the impacts of climate change on this hydrological system, finding that the currently perennial stream could eventually become intermittent. The site has also played a key role in the development of time-lapse gravimetry (TLG), a non-invasive geophysical method, as a tool for under-monitored hydrogeological systems in mountain regions. TLG has provided unique, quantitative data on seasonal variations in groundwater storage that would be extremely challenging and costly to obtain through traditional methods. While alpine catchments are undoubtedly highly varied, investigations in the Vallon de Réchy integrate novel monitoring approaches that provide evidence for the importance and finite resilience of groundwater as a vital component of alpine headwater catchments.

How to cite: Halloran, L. J. S., Carron, A., Arnoux, M., Mohammadi, N., Berdat, E., Makkinga, N., Magnenat, C., Figueroa, R., and Millwater, J.: The present and future of alpine groundwater dynamics: Lessons from the Vallon de Réchy (Switzerland)  , EGU General Assembly 2026, Vienna, Austria, 3–8 May 2026, EGU26-4876, https://doi.org/10.5194/egusphere-egu26-4876, 2026.

EGU26-6158 | ECS | Orals | HS8.2.14

Full-Waveform Inversion–Informed Hydrologic Modeling Reveals Bedrock Heterogeneity Controls Flow Dynamics 

Chen Xiong, Steven Holbrook, Benjamin Eppinger, and Hang Chen

Accurate characterization of the critical zone architecture is fundamental to physically based hydrologic modeling, yet resolving the complex geometry of subsurface boundaries remains a significant challenge. Critical zone seismic studies have predominantly used First-Arrival Traveltime (FAT) tomography, yet this method lacks the resolution to characterize heterogeneity at hydrologically relevant scales, leaving a gap in our understanding of how subsurface structure governs flow routing and storage. Full-Waveform Inversion (FWI) overcomes these limitations by utilizing the complete seismic wavefield to resolve fine-scale subsurface architecture. We compare 2D hydrologic modeling informed by subsurface structures from FAT and FWI. The FAT model yields smooth, layered velocity gradients, whereas FWI reveals pronounced heterogeneity, including depth-to-bedrock variations and steep low-velocity anomalies. We integrated both structures into ParFlow-CLM with consistent hydrologic properties and NLDAS meteorological forcing them to isolate the effects of subsurface geometry. Results show that while annual water budgets remain similar, reflecting comparable mean regolith and fractured bedrock depths, internal flow dynamics diverge markedly. The rugged bedrock topography resolved by FWI imposes geometric control on flow routing: infiltrating water fills deep bedrock troughs before lateral flow initiates, producing a "fill-and-spill" mechanism. These deep troughs act as subsurface reservoirs, temporarily storing water and extending drainage timescales. Consequently, the FWI-informed model buffers hydrologic response, generating a smoother hydrograph with attenuated peaks and sustained baseflow, whereas the FAT model exhibits rapid lateral drainage and flashier storm response. These findings demonstrate that smoothing subsurface heterogeneity in hydrologic models may mask critical storage dynamics and bias estimates of catchment response times.

How to cite: Xiong, C., Holbrook, S., Eppinger, B., and Chen, H.: Full-Waveform Inversion–Informed Hydrologic Modeling Reveals Bedrock Heterogeneity Controls Flow Dynamics, EGU General Assembly 2026, Vienna, Austria, 3–8 May 2026, EGU26-6158, https://doi.org/10.5194/egusphere-egu26-6158, 2026.

EGU26-8457 | Posters on site | HS8.2.14

Using a novel chain of models to mimic source aquifer depressurisation  impacts across the Doongmabulla Springs Complex , Queensland, Australia 

Anne Gibson, Richard Cresswell, Jarrah Muller, Samantha Capon, Rebekah Grieger, Penn Lloyd, David Stanton, and Miles Yeates

The Doongmabulla Springs Complex (DSC) is a cluster of groundwater-dependent wetlands located in central Queensland, Australia. The DSC has over 160 individual springs ranging from over 9 ha, with pools of water, down to vents less than 10 cm across, supporting individual grasses. The springs are home to a variety of plant species (many endemic) that are adapted to the unique physico-chemical parameters of the groundwater discharge on which they rely. Wetlands and scalds of the DSC support a listed Threatened Ecological Community of species dependent on this natural discharge of groundwater from underlying artesian aquifers of the Galilee Basin. The springs are protected under Australia’s State and Commonwealth Environmental legislation. 

Aquifer depressurisation due to mine dewatering occurring to the east of the springs has the potential to threaten spring biodiversity in future by reducing groundwater discharge and consequent wetland persistence. Assessing the likelihood and possible magnitude of these threats requires a multi-disciplinary modelling approach to address complex groundwater – surface water – ecosystem interactions: 1) define groundwater pressure change probabilities; 2) simulate likely wetland response; and 3) evaluate potential ecological impacts. Once such a modelling chain is in place, impact mitigation may be assessed, considering the effect of interventions at each stage of the chain.

To support the numerical modelling, extensive hydrological, ecological and physio-chemical data collection and analysis was undertaken to understand spring wetland area and species microhabitats and distributions over multiple scales and time frames, including seasonal and inter-annual variability. Generation of realistic and defensible conceptualisations for the springs is critical and is described in a companion paper (Cresswell, et al., these proceedings).

Regional numerical groundwater modelling (MODFLOW) generated potential groundwater pressure change responses relevant to the DSC source aquifers. Potential groundwater depressurisation over time at the individual spring locations was utilised in a wetland water balance model (GoldSim) to describe wetland persistence, size and seasonality. Water balance outputs were translated into spatial representations of predicted spring hydrology (TUFLOW), generating area and shape configurations that could be compared to historical wetland persistence data and then utilised to predict potential effects on suitable habitat for key flora species under a range of scenarios including mining-related groundwater drawdown and climate change using maximum entropy species distribution modelling (MaxEnt). This latter process relates known species’ occurrences to measurable variables that describe the environment (such as soil moisture, soil salinity and pH) to predict the presence or absence of a species at unsampled locations and under future groundwater drawdown scenarios. 

The results of the application of this novel chain of models have informed a revised impact assessment for the potential impacts of mine dewatering on the unique vegetation communities at the Doongmabulla Springs Complex and enables development of targeted mitigation approaches for individual wetlands and species.

How to cite: Gibson, A., Cresswell, R., Muller, J., Capon, S., Grieger, R., Lloyd, P., Stanton, D., and Yeates, M.: Using a novel chain of models to mimic source aquifer depressurisation  impacts across the Doongmabulla Springs Complex , Queensland, Australia, EGU General Assembly 2026, Vienna, Austria, 3–8 May 2026, EGU26-8457, https://doi.org/10.5194/egusphere-egu26-8457, 2026.

Hillslope groundwater in the critical zone (CZ) links subsurface water storage, hydrologic connectivity, and chemical export, yet its concentration–discharge (C–Q) relationships remain poorly constrained because internal discharge and chemistry are rarely observed simultaneously. The Poshan drainage tunnel system in Hong Kong consists of two sub-tunnels intersected by dense sub-vertical drains (SVDs), providing a valuable groundwater observation platform for investigating how hydrologic processes control solute concentrations within the volcanic rock hillslope. From April 2023 to April 2025, groundwater was sampled biweekly to monthly at the two tunnel outlets, the high tunnel weir (HTW) and low tunnel weir (LTW), and at four representative SVDs distributed along the tunnels across position and elevation. Concentrations of major ions, dissolved Si, and ²²²Rn were measured, and discharge at each location was monitored or calculated. Power law fitting, hysteresis index, and reactive transport model inversion were used to analyze C–Q relationships and to identify controls on solute export and transport. Hydrologic deconvolution was applied to time series of rainfall, groundwater levels from 9 piezometers, and discharge at the two weirs (HTW and LTW) to obtain residence time distributions, thereby constraining groundwater discharge and hydrologic connectivity. Across the hillslope, C–Q relationships showed strong solute-specific and spatial variability. At the weir scale, upslope groundwater more commonly exhibited enriching or diluting C–Q behaviors, whereas downslope groundwater more often showed chemostatic C–Q relationships. At the SVD scale, an upslope SVD showed significant dilution of Cl⁻ but strong enrichment of ²²²Rn with discharge, whereas a downslope SVD showed dilution of Na⁺, Cl⁻, and NO₃⁻ together with enrichment of K⁺, SO₄²⁻, and Si with discharge. The C–Q relationships of different solutes showed distinct behaviors: Na⁺, Cl⁻, and NO₃⁻ generally showed dilution or near chemostasis. In contrast, K⁺, Mg²⁺, and SO₄²⁻ more frequently enriched at high discharge, consistent with seasonal accumulation in shallow reservoirs followed by storm-driven flushing. Si displayed intermediate behavior, tending toward dilution or weak enrichment depending on location. ²²²Rn showed strong enrichment at specific sites, which may indicate rapid activation of short flow paths and groundwater mobilization. Hysteresis loop direction also varied by solute and location, with more counter-clockwise loops in the upslope area where solute signals lagged behind discharge and followed a seasonal cycle. More clockwise loops were observed for K⁺, Mg²⁺, and SO₄²⁻ in the downslope area, suggesting relatively abundant source reservoirs. Hydrologic deconvolution further indicated shorter mean residence times downslope than upslope, while groundwater near the tunnel could be discharged rapidly. Overall, the spatial and solute-specific C–Q variability within the volcanic CZ reflects the spatial distribution of solute storage and the interplay of thermodynamic limits, reaction kinetics, and residence time, and apparent chemostasis at larger scales may be due to mixing-driven signal averaging along heterogeneous flow paths.

How to cite: Yang, T., Jiao, J. J., and Mao, R.: Solute-specific and spatially variable concentration–discharge relationships in hillslope critical zone groundwater, EGU General Assembly 2026, Vienna, Austria, 3–8 May 2026, EGU26-8609, https://doi.org/10.5194/egusphere-egu26-8609, 2026.

Groundwater is irreplaceable in sustaining populations, maintaining agriculture, and supporting socioeconomic development, especially in arid and semi-arid regions where surface water is limited. However, a comprehensive understanding of groundwater table depth (WTD) changes across China remains constrained, especially following large-scale water management. Here, we present a monthly 0.1° resolution WTD dataset for China from 2005 to 2021, built by random forests using 470,967 monthly measurements from 9,011 stations and 25 predictors across topographic, geological, environmental, and anthropogenic categories. Validation results for nine river basins using testing dataset and compared with the published regional GWD data indicated that the constructed models exhibited reasonable performance, with high R2 (0.85 to 0.95, median 0.89) and low RMSE (2.11 to 13.44, median 3.82). Nationally, WTD is generally shallow in the southeastern regions and deep in the northwest, with a non-significant increasing trend of 3.79×10⁻³ m/year over the study period. Spatially, WTD experienced significant increases in the Huaihe and Yellow River basins, while exhibiting apparent decreases in the Yangtze and Southeast River basins. With the implementation of a series of water management strategies, such as the designation of groundwater extraction prohibited areas, the operation of the South-to-North Water Diversion Project in late 2013, the WTD in North China Plain's cities such as Beijing and Tianjin had decreased significantly, indicating groundwater table recovery. Similarly, through adjustments in planting structure and irrigation practices, cropland WTD in North China Plain decreased significantly from 2014-2021. These findings highlight the positive impact of the enacted series of water management measures on the recovery of WTD in urban and agricultural regions. Our study provides a high spatiotemporal groundwater table depth dataset for China, offering valuable insights for optimizing water management and enhancing groundwater protection strategies.

How to cite: He, X. and He, B.: High-resolution reconstruction of groundwater table depth in China (2005–2021): evidence for recovery under large-scale water management, EGU General Assembly 2026, Vienna, Austria, 3–8 May 2026, EGU26-8779, https://doi.org/10.5194/egusphere-egu26-8779, 2026.

EGU26-9657 | ECS | Posters on site | HS8.2.14

3D near-surface geophysics and geostatistics for heterogeneities characterization and water table monitoring on the Orgeval critical zone observatory 

Maxime Gautier, Sylvain Pasquet, Nicolas Radic, Didier Renard, Roland Martin, Alexandrine Gesret, Romane Nespoulet, Nicolas Loget, Ludovic Bodet, and Agnès Rivière

Groundwater fluxes and interacting zones between groundwater and surface water are crucial for understanding the water dynamics of the critical zone. Groundwater within the critical zone plays a significant role in the ecosystem, biodiversity, and water supply. However, estimating these fluxes remains a key challenge because they are not directly measured in the field. Model calibration involves adjusting key parameters—such as saturated hydraulic conductivity and soil-water retention properties—using observed data like hydraulic head and river discharge, while initial and boundary conditions are prescribed to define the model l setup. That calibration is often done by comparing simulated soil water saturation and water table level to piezometers. Nevertheless, real flows occur in 3D in a complex medium containing heterogeneities with various lithologies, with different hydraulic parameters such as hydraulic conductivity and porosities.

Geophysical methods such as electrical resistivity tomography (ERT), seismic refraction tomography (SRT), and multichannel analysis of surface wave (MASW), which are sensitive to lithology,  content, and nature of fluid, represent helpful tools for hydrogeological modelling, both in terms of model parameterization and physical property characterization. ERT, which is particularly sensitive to lithology, allows us to identify and delineate heterogeneities, while seismic methods, which are sensitive to mechanical properties, will enable us to infer the water saturation and the piezometric surface in the near surface through the P-wave and S-wave velocities ratio (Poisson’s ratio, e.g. ) (Dangeard et al., 2021).

We propose a workflow combining geophysics and geostatistics to reconstruct the heterogeneities and the piezometric surface in an alluvial plain context. We implemented the workflow in a 30 x 30 m area at the Avenelles site of the Orgeval Critical Zone Observatory (CZO), which is part of the French network of CZOs OZCAR. ERT, SRT, and MASW surveys were carried out along 7 profiles to obtain 2D sections of electrical resistivity, P and S wave velocities (6 profiles of 72 electrodes/geophones and one profile of 48 electrodes/geophones, with 0.40 m spacing leading to 12,708 apparent resistivity data, 33,888 first wave arrival picks, and 277 dispersion curves). Geophysics allows us to pass from punctual piezometer data to 2D vertical sections. However, carrying out 3D geophysical acquisition is cumbersome. To overcome these limitations, we then use geostatistics to get a distribution of our geophysical parameters in the 3D volume delineated by the geophysical survey. Once the 3D interpolation is done by kriging methods, we can retrieve a view of the heterogeneities distribution in the near surface as well as the water table position to inform hydrogeological inversion. Furthermore, with the addition of petrophysical relationships, it is possible to estimate saturation and porosity distribution for a future 3D hydrogeological physics-based model run to better characterise groundwater fluxes. Finally, all these workflows, including complementary methods, could be performed on different dates for time-lapse monitoring of the water table.

How to cite: Gautier, M., Pasquet, S., Radic, N., Renard, D., Martin, R., Gesret, A., Nespoulet, R., Loget, N., Bodet, L., and Rivière, A.: 3D near-surface geophysics and geostatistics for heterogeneities characterization and water table monitoring on the Orgeval critical zone observatory, EGU General Assembly 2026, Vienna, Austria, 3–8 May 2026, EGU26-9657, https://doi.org/10.5194/egusphere-egu26-9657, 2026.

EGU26-9931 | ECS | Orals | HS8.2.14

Disentangling urban and hydrogeological influences on groundwater fauna in Halle (Saale)  

Laura Meyer, Christian Griebler, Martina Herrmann, and Peter Bayer

Groundwater fauna play an important role in subterranean aquatic ecosystems. In urban areas, their habitats are shaped not only by hydrogeological conditions but also by stressors such as elevated groundwater temperatures and oxygen depletion. However, the combined effects of urbanisation and geological factors on groundwater fauna remain poorly understood.

To characterise urban influences and contrast them with hydrogeological controls, abiotic and faunal data were collected from 91 groundwater monitoring wells in Halle (Saale) over the course of one year, comprising five measurement campaigns. Both the urban area and the surrounding rural region were investigated. The hydrogeological setting of the city is highly variable due to diverse near-surface geological formations, resulting in multiple aquifer types across several hydrostratigraphic units.

The urban gradient was characterised by elevated temperatures (>12 °C) in the city centre, while differences in dissolved oxygen (DO) and dissolved organic carbon (DOC) reflected both urban and hydrogeological influences. Spatial patterns were evident in the regional variation of faunal community composition. However, these patterns did not clearly correspond to contrasts between urban and rural areas or to specific aquifer types. Instead, fauna in near-surface aquifers were more strongly influenced by hydraulic conductivity and groundwater depth. Crustaceans were primarily found at wells with groundwater levels shallower than 6 m, whereas worms (Oligochaeta, Polychaeta, Platyhelminthes) dominated at wells with deeper groundwater levels.

The abundance of stygofauna and the number of taxonomic groups showed significant, albeit weak, correlations with redox-relevant parameters (DO, Eh, NH₄⁺, NO₃⁻ and DOC), with higher DO concentrations generally being associated with higher abundance and diversity. We also observed a weak negative correlation with temperature, which was particularly pronounced in combination with low DO concentrations.

These findings demonstrate the necessity for an integrative approach to assessing complex urban groundwater ecosystems, taking into account the interactions between abiotic and biotic factors within the context of the respective hydrogeological setting.

How to cite: Meyer, L., Griebler, C., Herrmann, M., and Bayer, P.: Disentangling urban and hydrogeological influences on groundwater fauna in Halle (Saale) , EGU General Assembly 2026, Vienna, Austria, 3–8 May 2026, EGU26-9931, https://doi.org/10.5194/egusphere-egu26-9931, 2026.

EGU26-10002 | ECS | Orals | HS8.2.14

Integrating Transient Hydrogeology Models for Enhanced Interpretation of Geophysical Data in the Vadose Zone 

Nicolas Radic, Agnès Rivière, Ludovic Bodet, Alexandrine Gesret, Maxime Gautier, Sylvain Pasquet, and Roland Martin

Quantifying water and heat fluxes at the interface between surface water (SW), groundwater (GW), and the vadose zone (VZ) is critical for sustainable water and energy resource management under global change. Direct field measurements are challenging because SW–GW exchanges depend on initial and boundary conditions and the spatial distribution of hydrofacies, which are often poorly constrained. Usually, these fluxes are estimated by calibrating models using classical data like hydraulic heads and river discharge. But it is well known that these data did not get enough information to constrain these fluxes. To overcome the lack of direct in situ data, de Marsily et al., (2005) and Schilling et al., (2019) suggested to couple the classical observations with unconventional data such as the geophysical surveys, for instance successfully applied in the context of SW-GW exchanges by Dangeard et al., (2021). Binley et al., (2015), in their comprehensive review, highlighted the robustness of geophysical methods for imaging subsurface structures and estimating saturation profiles, reinforcing their role as essential tools for characterizing vadose zone processes.
This study develops a transient, process-based hydrogeophysical forward model that integrates hydrological and geophysical processes. The geophysical methods used in this study are electrical resistivity tomography (ERT), seismic methods, and heat tracing, applied as complementary approaches to characterize vadose zone dynamics and link hydrological processes to geophysical data. The hydrological model (Rivière et al., 2020) rigorously solves Richards’ equation coupled with heat transport—simulating variably saturated water and thermal fluxes in porous media under transient conditions—and was validated with experimental and field data to explore the variability of saturated flow and heat fluxes. The seismic model, based on Solazzi et al., (2021) uses the Hertz-Mindlin contact theory combined with the Biot-Gassmann model and simulates the influence of capillary suction with a transient method. The electrical model uses the Waxman-Smits petrophysical law to quantify electrical conductivity of the soil. The outputs of the hydrological model are coupled with geophysical forward models to compute synthetic geophysical models (P and S wave velocity, electrical resistivity) and associated data (more particularly surface wave phase velocity, apparent electrical resistivity); as well as heat tracing signals). The synthetic case considered in this study is a 1D soil column, subjected to seasonal variations in precipitation and temperature, to analyze the resulting dynamics and their geophysical data.
Testing this integrated model under typical spring conditions in the Paris Basin demonstrates:

  • The added value of transient modeling for interpreting geophysical data.
  • Sensitivity of seismic and electrical responses to soil saturation and pressure changes, even without water table fluctuations.
  • The influence of past infiltration events on geophysical survey interpretation.

This approach provides new insights into VZ functioning and strengthens the link between hydrological processes and geophysical signatures, paving the way for improved characterization of subsurface dynamics under global changes.

How to cite: Radic, N., Rivière, A., Bodet, L., Gesret, A., Gautier, M., Pasquet, S., and Martin, R.: Integrating Transient Hydrogeology Models for Enhanced Interpretation of Geophysical Data in the Vadose Zone, EGU General Assembly 2026, Vienna, Austria, 3–8 May 2026, EGU26-10002, https://doi.org/10.5194/egusphere-egu26-10002, 2026.

EGU26-12304 | Posters on site | HS8.2.14

Where springs save rivers: Karst springs as sentinels and refuges in a warming world 

Adrien Selles, Jean-Christophe Marechal, Yvan Caballero, and Enzo Bronnec Castanet Desages

Karst aquifers play a fundamental role in sustaining groundwater-dependent ecosystems (GDEs) through their capacity to deliver large flows and highly buffered thermal regimes via springs. In Mediterranean environments, where hydrological variability and climate-driven extremes are intensifying, these groundwater contributions act as ecological stabilizers that support biodiversity and enhance ecosystem resilience. Drawing on two complementary case studies, this contribution examines how karst groundwater controls thermal and ecological dynamics in surface ecosystems: (i) the Argens River at Châteauvert (France), monitored within the ESTHER project, where the Bouillidoux spring system generates persistent cold-water refuges during summer low flows; and (ii) the Lez karst spring system near Montpellier (France), investigated under the SentinelSprings project initiative as a representative “sentinel” of long-term environmental trends, where the abstraction of water for drinking water supply competes with the river baseflow necessary to sustain aquatic ecosystems.

In both the Argens and Lez study sites, high-frequency monitoring networks were installed, including continuous temperature, electrical conductivity, and dissolved oxygen probes deployed in springs and river reaches. These datasets enable detailed thermal budgets to be established, revealing the mechanisms by which groundwater inflows generate thermal refuges and regulate stream metabolic conditions. The combined analysis of hydrological and thermal signals also supports the development of refined conceptual models that can be used to simulate groundwater–surface water interactions and quantify the potential impacts of climate change on spring-fed thermal regimes and river corridor resilience. These groundwater inputs sustain critical habitats, modulate the sensitivity of river corridors to warming, and provide natural buffering capacities that constitute important nature-based solutions for climate-change adaptation. By linking high-resolution monitoring with hydrogeological conceptualisation, our study advances the understanding of feedback processes between karst groundwater and surface ecosystems, highlighting springs as essential indicators and protectors of ecological stability. This work contributes to improving the identification, assessment and long-term management of GDEs.

How to cite: Selles, A., Marechal, J.-C., Caballero, Y., and Bronnec Castanet Desages, E.: Where springs save rivers: Karst springs as sentinels and refuges in a warming world, EGU General Assembly 2026, Vienna, Austria, 3–8 May 2026, EGU26-12304, https://doi.org/10.5194/egusphere-egu26-12304, 2026.

Accurate representation of evapotranspiration (ET) and plant water stress is essential for understanding ecosystem resilience to hydroclimatic variability. However, most land surface and Earth System Models infer vegetation stress primarily from shallow soil moisture, implicitly assuming that declining surface water availability directly translates into physiological limitation. This assumption fails in ecosystems where vegetation can access deeper stored water, such as groundwater, leading to systematic mischaracterization of water stress and ecosystem functioning during dry periods.

Here we present a physics-based ecohydrology model that represents root water uptake as an emergent process governed by soil–plant–atmosphere water potential gradients, allowing plants to dynamically shift water sources between shallow soil and deeper reservoirs. This framework captures how access to groundwater modifies plant hydraulic status and regulates water stress across seasonal, interannual, and long-term drying. Applied to oak savanna ecosystems, the model reveals distinct uptake regimes in which groundwater increasingly contributes to transpiration as surface soils dry, buffering ET during dry seasons when shallow soil moisture alone would predict strong limitation.

Our results show that groundwater access fundamentally alters ecosystem stress trajectories, delaying the onset of hydraulic limitation and reducing ET sensitivity to surface drying. Water table depth emerges as a key control on the degree of buffering, highlighting feedbacks between rooting strategies, subsurface water availability, and ecosystem resilience. We further demonstrate that stress metrics based solely on shallow soil moisture substantially overestimate drought impacts in systems sustained by deeper water sources.

By providing a reduced-order representation of ET that explicitly accounts for both soil moisture and groundwater availability, this work offers a pathway to improve model representations of plant water stress and evapotranspiration in ecosystems sustained by deep water storage under a changing climate.

How to cite: Cerasoli, S. and Terrer, C.: Groundwater access modulates plant water stress and evapotranspiration in water-limited ecosystems , EGU General Assembly 2026, Vienna, Austria, 3–8 May 2026, EGU26-12822, https://doi.org/10.5194/egusphere-egu26-12822, 2026.

EGU26-14308 | ECS | Posters on site | HS8.2.14

Impact of the representation of water transfer in the unsaturated zone on water flux in a ecohydrological critical zone model. 

David Fuseau, Sylvain Kuppel, Agnès Riviere, Sylvain Weill, Jean Marcais, and Isabelle Braud

An increasing number of critical zone models are seeking to capture hydrological dynamics in an integrative fashion, reconciling water dynamics at multiple scales, and capture reciprocal linkage with plant dynamics. EcH2O-iso (Kuppel et al., 2018) is such a numerical tool, where a process based, fully distributed formulation has been balanced with computational efficiency using a simplified formulation of subsurface water dynamics: three layers where top-layer infiltration is described using the Green-Ampt approach, while vertical water travel to deeper layers is gravity-driven, all using a saturation dependent hydraulic conductivity. This approach is sequential within grid cells and along the lateral drainage network, providing a fast, robust, and stable water budget. While this formulation has been successful in capturing ecohydrological dynamics (including that of isotopes tracers) in a variety of critical zone settings, gravity-driven percolation has failed to reproduce finer dynamics in some critical zone observatories displaying arid conditions and thick vadose zone (several tens of meters).

In this work, we add the possibility of considering a vertical dynamical water fluxes exchange between the layers using the Richards equation. The simulations are performed on a single pixel in order to focus on the importance of the subsurface water flux dynamics on the vertical axis only. The implementation of the Richards equation is based on the numerical resolution of Ross (2003). The resolution makes use of the Kirchhoff transform to increase the speed and the stability of the solution. The Brooks and Corey retention curve parameters are used for the resolution as it is in the original EcH2O-iso model. The resolution of Ross (2003) is also usable for heterogeneous soils and provides a solution for the advection-dispersion equation for solute transport. The latter features paves the way for future work, including the tracer module implemented isotopy tracking in EcH2O-iso. The fact that both the original (sequential) and current (dynamical) vertical routines are available as options in the same critical model allows for a direct benchmarking of performances and computing in a flexible comparison of the consequences of such different approaches of the subsurface flux modelling. We first validated the implementation of unsaturated zone representation thanks to standard 1D benchmarks. The impact of the new vertical routing scheme in EcH2O-iso is then evaluated in a deeply weathered profile in a dry tropical forest where a calibration of hydrodynamic parameters had been previously carried out with the sequential routing version of the model. Finally, at the same site, the newly-implement dynamical approach is used to perform a sensitivity analysis and a calibration of the parameters over a large number of simulations, and compared again to the performances of the sequential-base model.

References

Kuppel, S. et al : EcH2O-iso 1.0: water isotopes and age tracking in a process-based, distributed ecohydrological model, Geosci. Model Dev., 2018.

Ross, P. J.: Modeling soil water and solute transport - Fast, simplified numerical solutions, Agronomy Journal, 2003.

How to cite: Fuseau, D., Kuppel, S., Riviere, A., Weill, S., Marcais, J., and Braud, I.: Impact of the representation of water transfer in the unsaturated zone on water flux in a ecohydrological critical zone model., EGU General Assembly 2026, Vienna, Austria, 3–8 May 2026, EGU26-14308, https://doi.org/10.5194/egusphere-egu26-14308, 2026.

EGU26-15005 | Orals | HS8.2.14

Multiple lines of evidence provide a holistic and testable conceptualisation of complex ecosystem-groundwater dynamics at the Doongmabulla Springs Complex, Queensland, Australia  

Richard Cresswell, Anne Gibson, Michael Short, Sopie Pyrke, Emily Bathgate, Miles Yeates, Penn Lloyd, and David Stanton

The Doongmabulla Springs Complex (DSC) in Central Queensland, Australia, consists of over 160 individual springs ranging from vents less than 10 cm across supporting individual tussocks of grass to wetlands over 9 hectares with permanent pools of water. These unique springs are home to a variety of plant species (many endemic) that are specially adapted to the varied physical, chemical and hydraulic conditions of the local environment and the groundwater discharge on which they rely.

We have examined these springs across multiple spatial and temporal scales, using remote and field data acquisition techniques, to develop a detailed understanding of the water, soil and floristic characteristics and dynamics at a selection of these springs, quantifying spring extents and changes over time as well as documenting species zonation and vegetation dynamics related to seasonal and climatic variability and the local physico-chemical conditions. From these targeted studies we can interpolate and extrapolate to the other springs in the complex and identify where additional studies may be required to fill data gaps.

Critically, local multi-spectral and thermal drone imagery has augmented regional satellite imagery to constrain spatial discharge patterns of springs and provides spatial linkages that complement visual images taken at the same time. On-ground surveys have identified new springs in some areas and loss of others and can be linked to regolith variability and sub-surface source aquifer pressure controls. The thermal imagery provides a platform to observe and quantify spring discharge changes season to season. Spot sampling of surface waters and groundwater highlights inter-seasonal variability in water source chemistry, whilst isotopes highlight the changing importance of groundwater for maintenance of groundwater discharge and consequent support of spring health. Notably, water samples taken for chemical and isotopic analysis included run-of-river Radon-222 analysis that helps highlight the groundwater discharge constrains.

Underpinning the local-scale observations, regional groundwater pressures define the dynamics of the source waters, though spatially disparate bore data must be complemented by modelling interpolations. The multi-dimensional conceptualisation thus informs, and is informed by, a regional numerical groundwater model and links the regional observations with local-scale, spring-specific eco-hydrological modelling, which is described in a companion paper (Gibson, et al. these proceedings).  

The DSC conceptualisation must be coherent at all spatial and temporal scales and then it can be used to customise mitigation responses at individual springs based on groundwater impact modelling considering potential changes from climate change and local mining activities.

How to cite: Cresswell, R., Gibson, A., Short, M., Pyrke, S., Bathgate, E., Yeates, M., Lloyd, P., and Stanton, D.: Multiple lines of evidence provide a holistic and testable conceptualisation of complex ecosystem-groundwater dynamics at the Doongmabulla Springs Complex, Queensland, Australia , EGU General Assembly 2026, Vienna, Austria, 3–8 May 2026, EGU26-15005, https://doi.org/10.5194/egusphere-egu26-15005, 2026.

EGU26-15036 | Orals | HS8.2.14

Evaluation of grassland carrying capacity and its constraint of water resources in Mongolia 

Tadanobu Nakayama, Qinxue Wang, and Tomohiro Okadera

In Mongolia, the traditional pastoral system has changed by the overuse and degradation of water resources. Currently, there is a research gap between the socio-economic transition and ecosystem degradation on the existing knowledge. In the present study, a process-based eco-hydrology model, NICE (National Integrated Catchment-based Eco-hydrology) (Nakayama et al., 2021a, 2021b, 2023), was applied to the total of 29 river basins in the entire country to quantify the heterogeneous distribution of livestock water use and its relation to pasture degradation there (Nakayama, 2025). The authors also evaluated the change of grassland carrying capacity and carrying status index during the last few decades (Yan et al., 2023). The result showed that the livestock water use in entire basins was the same order of magnitude as mining and urban water uses and that the estimated total water use was similar to that on constant assumption in the previous study. In addition, the simulation also clarified heterogeneous distributions of water uses of 5 types of typical livestock and higher water use in the central part of the country. However, the carrying status index showed more serious situation of overgrazing in the transitional zone between grassland and the Gobi desert. This means that the excessive use of water resources is indirectly related to the degradation of natural vegetation in grassland. These results also imply that the excessive use of livestock water intake can lead to groundwater decline, grassland degradation, and ultimately a reduction in the amount of water available to each livestock head. This methodology is effective to evaluate the grassland carrying capacity and its constraint of water resources (Lu et al., 2020), and to propose solutions to unsustainable pastoral land use patterns.


References

Lu, H., et al. 2020. Environmental Science and Pollution Research, 27, 10328-10341, doi:10.1007/s11356-019-07559-9.

Nakayama, T., et al. 2021a. Ecological Modelling, 440, 109404, doi:10.1016/j.ecolmodel.2020.109404.

Nakayama, T., et al. 2021b. Ecohydrology & Hydrobiology, 21(3), 490-500, doi:10.1016/j.ecohyd.2021.07.006.

Nakayama, T., et al. 2023. Ecohydrology & Hydrobiology, 23(4), 542-553, doi:10.1016/j.ecohyd.2023.04.006.

Nakayama, T. 2025. Environmental Science and Pollution Research, 32, 13626-13637, doi:10.1007/s11356-025-36083-2.

Yan, N., et al. 2023. Ecological Indicators, 146, 109868, doi:10.1016/j.ecolind.2023.109868.


How to cite: Nakayama, T., Wang, Q., and Okadera, T.: Evaluation of grassland carrying capacity and its constraint of water resources in Mongolia, EGU General Assembly 2026, Vienna, Austria, 3–8 May 2026, EGU26-15036, https://doi.org/10.5194/egusphere-egu26-15036, 2026.

Monitoring groundwater-dependent wetlands at a national scale: lessons from England's first strategic network.

1Elena Armenise, 1 * Mario Manganaro, Sharon Thomas

*Corresponding author 

1Environment Agency, Horizon House, Deanery Road, Bristol, BS1 5AH, UK 


Abstract:

Recognising the critical role of monitoring in preserving groundwater dependent terrestrial ecosystems (GWDTEs) and the ecosystem services they provide, the Environment Agency is establishing the first national monitoring network for GWDTEs  in England. This work forms part of the government-led Natural Capital and Ecosystem Assessment (NCEA) programme, which aims to place nature at the core of decision-making by embedding natural capital evidence into policy and investment strategies.


The network was designed using advanced statistical methods to ensure unbiased site selection and provide statistically robust data on the condition of GWDTEs in England. Specifically, we adopted the  Generalised Random Tessellation Stratified (GRTS) sampling, a spatially balanced probabilistic design that provides random site selection while ensuring sampling locations are evenly distributed across the study area. This approach minimises clustering of sites and maximises environmental representativeness, making it ideal for large-scale environmental monitoring.

 To validate the design, we conducted a simulation based power analysis to determine the survey effort required to detect ecologically meaningful changes. Results show that the current design achieves ≥70% power to detect medium trends (~3.5% annual change) in groundwater level metrics and wetland quality within 13/15 years, confirming its suitability for long term surveillance. Detecting small changes would require more than 60 sites and over 20 years, which is impractical, but the network is well-suited for detecting meaningful trends within realistic timeframes.

This presentation will outline the GWDTE monitoring network design principles and implementation challenges. We will cover how operational constraints required pragmatic adjustments to maintain spatial coverage while preserving representativeness. The network will provide a foundation for long-term surveillance of wetland condition in England delivering meaningful data to support future national policy. All monitoring data will made openly available in December 2026, supporting research and policy applications.

How to cite: Manganaro, M., Armenise, E., and Thomas, S.: Monitoring groundwater-dependent wetlands at a national scale: lessons from England's first strategic network., EGU General Assembly 2026, Vienna, Austria, 3–8 May 2026, EGU26-21899, https://doi.org/10.5194/egusphere-egu26-21899, 2026.

EGU26-22055 | Posters on site | HS8.2.14

A comprehensive bioassessment of karst aquifer flow paths  

Sanda Iepure, Orest Sambor, Daniela Cociuba, Aurel Persoiu, Constantin Marin, Alin Tudorache, Dragos Iulian Coada, Anna Denes, Avar Lehel Denes, Ruxandra Bucur, and Nicolae Scrob

Current challenges in the assessment of groundwater characteristics in karst areas result from the difficulties to effectively identify episodes of high water discharge and flow paths rates. The characteristics of karst aquifers formed by interconnected network of pores, fissures, fractures and conduits, with an alternation of high and low permeability zones and distinct water residence time, makes contamination difficult to be detected and monitored over underground flow paths. Groundwater’s have a high variability in recharge and flow rates, influenced by weather and climate patterns. At high flow, resulting from intense precipitations and/or significant snowmelt, karst groundwater’s moves rapidly through the rock, carrying effectively pollutants in and through the host rock. In contrast, during periods of drought and/or reduced surface inflow, groundwater moves slowly and diffuses more effectively within the primary/secondary pores of the rocks. In karst, the base flow is associated with long-term storage of the groundwater that creates a relatively stable environment for strictly subterranean dwellers organisms. Stable conditions in groundwater creates biodiversity hotspots where temperature, chemical composition highly influenced by lithology and potential contaminants acts together to ensure healthy habitats that supports a suite of associations of organisms indicative for the overall groundwater health. In contrast, a high discharge and a rapid flow path are associated with disturbances of groundwater habitats, associated with a shift in community patterns structure and dynamics. In this presentation, we combine water chemistry monitoring, stable isotope analyses (indicators of water source, recharge patterns and timing), identification of microbial communities (i.e., E. coli, enterococci, enterobacteria) and of groundwater fauna monitoring (indicative of both contamination and as biomarkers for groundwater flowpath) to identify episodes of high and base flow in a karst aquifer in the Padis karst area in NW Romania. We assume that a fine tune evaluation of groundwater communities (microbes and meiofauna biodiversity) can be used to: 1) understand the pattern of water flow variation across seasons, acting as disturbances for groundwater communities; and 2) detect the contaminated groundwater spots and potential degraded habitats. From this perspective, we used the microbes and groundwater fauna as biomarkers models to describe the potential causal linkages among groundwater karst flow and flow-path variation, groundwater habitat diversity/stability and quality, and groundwater community diversity in disturbed/undisturbed habitats.      

How to cite: Iepure, S., Sambor, O., Cociuba, D., Persoiu, A., Marin, C., Tudorache, A., Coada, D. I., Denes, A., Denes, A. L., Bucur, R., and Scrob, N.: A comprehensive bioassessment of karst aquifer flow paths , EGU General Assembly 2026, Vienna, Austria, 3–8 May 2026, EGU26-22055, https://doi.org/10.5194/egusphere-egu26-22055, 2026.

EGU26-22184 | Orals | HS8.2.14

Emerging Tools to Identify and Assess Impacts to Groundwater-Dependent Ecosystems 

John Stella, Melissa Rohde, Albert Ruhi, Jared Williams, Conor McMahon, Christopher Kibler, Rose Mohammadi, Yun Zhao, Rachael Pentico, Adam Lambert, Dar Roberts, Michael Singer, and Kelly Caylor

Groundwater-dependent ecosystems (GDEs) are hotspots of biodiversity and ecosystem functioning, but are increasingly threatened globally from multiple stressors including land conversion, water diversion and climate change. Protecting these valuable and vulnerable ecosystems has been challenging historically because they are difficult to identify and delineate due to their diverse composition and typically small area (e.g., narrow and irregular riparian zones). Recent advances in remote sensing, machine learning and big data statistical methods have greatly improved our ability to detect GDEs, which is a critical step toward protecting and restoring them. In this talk we summarize some emerging approaches, including novel integration of public datasets, phenological image analysis, dendroisotope series, standardized threshold analysis, and cloud computing. These approaches collectively provide a set of tools for mapping GDEs globally and in assessing their impacts from changes in climate and groundwater. We discuss applications of these tools to policy and management challenges, including the Clean Water Act (USA) and the EU Water Framework Directive.

How to cite: Stella, J., Rohde, M., Ruhi, A., Williams, J., McMahon, C., Kibler, C., Mohammadi, R., Zhao, Y., Pentico, R., Lambert, A., Roberts, D., Singer, M., and Caylor, K.: Emerging Tools to Identify and Assess Impacts to Groundwater-Dependent Ecosystems, EGU General Assembly 2026, Vienna, Austria, 3–8 May 2026, EGU26-22184, https://doi.org/10.5194/egusphere-egu26-22184, 2026.

EGU26-22234 | Posters on site | HS8.2.14

Identifying the recharge processes of karst aquifer in Umbria (Central Italy) using long-term monitoring data and Modkarst Model 

Konstantina Katsanou, Francesco De Filippi, Athanasios Maramathas, Giuseppe Sappa, and Nikolaos Lambrakis

Aquifers and karst springs are among the most studied and challenging topics of hydrogeology in recent years. They are difficult to model due to the aquifer's heterogeneity and anisotropy, as well as the difficulties of conventional monitoring. However, they are among the most important groundwater resources, accounting for a significant portion of freshwater intended for human consumption, especially in the EU.

The study area is located in the Umbria Region in central Italy and is characterised by an elongated carbonate ridge formed by a multilayered karstified carbonate succession, locally separated by marly interbeds. Groundwater circulation is controlled by Apennine tectonics, with faults either enhancing or limiting hydraulic connectivity between hydrogeological units. Recharge occurs predominantly through diffuse but also local infiltration over carbonate outcrops and high plains.

This study contributes to the understanding of hydrogeological functioning by integrating long-term monitoring data (more than 20 years) of discharge and rainfall with numerical modelling.

The data reveal that the karst system exhibits highly complex hydrological behaviour, and the distinctive hydrograph shapes observed for certain springs are attributed to direct surface water inputs entering the system through local sinkholes. Modkarst Model that was applied to six major karst springs, allowed the quantification of surface water contribution.

This work highlights that effective management of karst aquifers under increasing climate change effects that usually requires integrated approaches combining geological understanding, continuous monitoring, and modelling.

How to cite: Katsanou, K., De Filippi, F., Maramathas, A., Sappa, G., and Lambrakis, N.: Identifying the recharge processes of karst aquifer in Umbria (Central Italy) using long-term monitoring data and Modkarst Model, EGU General Assembly 2026, Vienna, Austria, 3–8 May 2026, EGU26-22234, https://doi.org/10.5194/egusphere-egu26-22234, 2026.

EGU26-22249 | ECS | Posters on site | HS8.2.14

Filtering and Analysing Distributed Temperature Sensing Data: lessons learnt from the Wüstebach headwater stream, Germany 

Alessandro Cattapan, Gijs Vis, Konstantina Katsanou, Raymond Venneker, Roland Bol, and Jochen Wenninger

The Wüstebach stream is a headwater stream with a 38.5 ha catchment located in the Eifel National Park, Germany, and is part of the TERENO Eifel Lower Rhine Valley Observatory.

Surface water temperature was measured since October 2023 along a 293 m reach of the Wüstebach Stream with a spatial resolution of 25 cm and at 15 min intervals using a Fibre Optic Distributed Temperature Sensing (FO-DTS) connected to a Silixa XT-DTS. In April 2024, the length of the FO was extended to 440 m. The presence of a series of monitoring devices and sharp elevation changes in the stream bed led to the partial exposure of the FO cable to the atmosphere in specific locations. Moreover, the fluctuations of the water level caused intermittent exposure of the cable in a series of locations, which vary in time and space. Atmosphere-exposed sections produce erroneous temperature data, which must be carefully filtered out from the dataset to capture the actual spatial and temporal variability of stream temperature. Moreover, radiative effects from cable sections exposed to the atmosphere can also affect temperature measurements in adjacent points. Manually filtering such a large dataset is not feasible and requires an automated approach.

This work presents a methodology for filtering FO-DTS data in space and time that uses the median daily temperature range as a core metric to identify areas of the FO exposed to the atmosphere. Additionally, screening methodologies such as spectral analysis for the identification of changes in temperature fluctuation due to groundwater contribution are applied and discussed.

How to cite: Cattapan, A., Vis, G., Katsanou, K., Venneker, R., Bol, R., and Wenninger, J.: Filtering and Analysing Distributed Temperature Sensing Data: lessons learnt from the Wüstebach headwater stream, Germany, EGU General Assembly 2026, Vienna, Austria, 3–8 May 2026, EGU26-22249, https://doi.org/10.5194/egusphere-egu26-22249, 2026.

Key Biodiversity Areas (KBAs) in South Asia are ecologically important, yet many are increasingly exposed to climate extremes and human pressures. Integrated assessments that combine climate extremes, species vulnerability, and anthropogenic pressures remain limited for the Key Biodiversity Areas of South Asia. This study develops a combined framework to evaluate climate hazards and multidimensional vulnerability across more than 800 KBAs.

Species vulnerability scores were calculated using IUCN distribution range maps for threatened birds, reptiles, amphibians, mammals, and plants, which were intersected with KBA boundaries to calculate species vulnerability based on the number of IUCN-threatened species present in each KBA. Anthropogenic vulnerability was calculated using the global human-pressure map, representing pressures from built environments, agricultural areas, population density, transportation networks, and night-time lights. The initial climate analysis includes temperature trends, precipitation trends, and the calculation of ETCCDI indices (such as TXx and WSDI) using ERA5 observational data (1951–2014) and CMIP6 model outputs.

The preliminary results indicate that warming patterns are most pronounced across the Himalayas, northeastern India, and parts of the Western Ghats. Several species-rich KBAs are in rapidly warming or strongly human-modified landscapes, suggesting heightened ecological sensitivity. Extended climate analysis includes precipitation-extreme indices to provide a more complete representation of hydro-climatic variability.

Biological, anthropogenic, and climatic components are combined to form a composite vulnerability index. This index is integrated with climate-extreme hazards to produce a Climate–Biodiversity Risk Index for each KBA. The framework provides a practical and data-driven basis for identifying KBAs where climate extremes and vulnerability factors overlap, supporting improved conservation and climate-adaptation planning across South Asia.


How to cite: Fatima, N.: Assessing Climate Extremes and Composite Vulnerability in South Asian Key Biodiversity Areas, EGU General Assembly 2026, Vienna, Austria, 3–8 May 2026, EGU26-682, https://doi.org/10.5194/egusphere-egu26-682, 2026.

Vegetation and water bodies play a crucial role in regulating the water and carbon cycles, however the climatic disturbances are impacting their functioning leading to the alterations in ecohydrological behavior of catchments. Therefore, it is crucial to identify the degraded ecosystems which are adversely affected under the influence of climate change. This study identifies degraded ecosystems in Peninsular India using remote sensing-based indicators, the Normalized Difference Vegetation Index (NDVI) for vegetation degradation and the Modified Normalized Difference Water Index (MNDWI) for waterbody changes. Sen’s slope trend analysis and Persistent change index (P-value) were applied to NDVI and surface water area (computed using MNDWI) for 90 catchments in Peninsular India to quantify the degradation levels. Results demonstrate that NDVI values range from 0.3 to 0.6 as majority of the Peninsular India is dominated by croplands. The spatial variation of surface water bodies indicates that larger waterbodies (>700 km2) are scattered in the central and north-western part of Peninsular India, while 59 out of 90 catchments have the lowest surface waterbody area (0.4-125 km2). Sen’s slope for NDVI varied from -0.03 year-1 to 0.03 year-1 observed across central, north western and north eastern regions of Peninsular India. Sen’s slope of water bodies computed catchment wise is varying from -8 km2yr-1 in southern part to 35 km2yr-1 in the Central and Northern Peninsular India. Persistent change analysis of NDVI and surface waterbody area reveals pockets of degradation in the northwest and southern regions of Peninsular India, with nearly 48 out of 90 catchments exhibiting low improvement in surface area of waterbodies. Comparison with climate and drought resilience indicates that resilient catchments experienced modest but stable gains in surface water area, while non-resilient catchments exhibited higher variability, including signs of both degradation and recovery. The findings provide a comprehensive understanding of vegetation and waterbody degradation, offering a scientific basis for prioritizing restoration and adaptation strategies in vulnerable catchments under climate change.

How to cite: Singh, A. and Sharma, A.: Assessment of Catchment Resilience Through Integrated Vegetation and Waterbody Degradation Analysis in Peninsular India, EGU General Assembly 2026, Vienna, Austria, 3–8 May 2026, EGU26-847, https://doi.org/10.5194/egusphere-egu26-847, 2026.

EGU26-2021 | Orals | ITS2.6/BG10.9

China’s Rice Yield Sensitivity to Extreme Cold is Underestimated 

Jin Fu, Guanghan Tang, Fengqing Qiao, Xingzi Tong, and Feng Zhou

Climate change is projected to increase the frequency, intensity, and spatial extent of extreme climate events. Among these, extreme cold impacts on crop yield are often overlooked from historical and future analyses. To address this issue, a unique national dataset detailing 2,490 field-identified extreme cold days at 212 sites was assembled to quantify stage-specific crop responses to extreme cold. Results show that extreme cold  affected 27% of China’s rice seasons during 1999-2012, resulting in an average yield reduction of 12.1±3.2%. This is mainly attributed to extreme cold during the transplanting-stem elongation and the heading-flowering stages, which reduces the total grain number per panicle and yield. In contrast, current global gridded crop models underestimate the cold sensitivity by 60% and a board range of model sensitivity. The constrained estimates show with >95% probability that rice yield would be reduced by extreme cold in stage of transplanting-stem elongation (−3.8±1.2% day−1), heading-flowering (−3.6±1.0% day−1), and milking grain-mature grain (−1.6±0.9% day−1). Uncertainties associated with modelled sensitivities were reduced by 36-44%. The national rice yield losses decrease by 9.1 ± 2.4% under the scenario of SSP1-2.6 by the end of this century, approximately twice as large as the unadjusted model estimates. This research highlights the underappreciated role of extreme cold in reducing crop yield under climate change.

How to cite: Fu, J., Tang, G., Qiao, F., Tong, X., and Zhou, F.: China’s Rice Yield Sensitivity to Extreme Cold is Underestimated, EGU General Assembly 2026, Vienna, Austria, 3–8 May 2026, EGU26-2021, https://doi.org/10.5194/egusphere-egu26-2021, 2026.

Climate change increases the risk of passing tipping points, such as the Atlantic Meridional Overturning Circulation (AMOC), which would lead to additional changes in the climate system. Tipping of the AMOC significantly alters the heat distribution on Earth, as well as the mixing and advection of nutrients in the ocean. These changes impact marine ecosystems that support the Earth system and society, posing an additional threat to environments that are already under pressure. Here, we look at the effect of an AMOC weakening on marine ecosystems by forcing the Community Earth System Model v2 (CESM2) with low (SSP1-2.6) and high (SSP5-8.5) emission scenarios from 2015 to 2100. For each emission scenario we have two types of simulations: (1) a control simulation with emissions only; and (2) a hosing simulation in which an additional freshwater flux is added in the North Atlantic to induce an extra weakening of the AMOC. We use the temperature and phytoplankton fields of the CESM2 simulations to drive the marine ecosystem model EcoOcean. This model simulates 52 different functional groups that represent species on all trophic levels. EcoOcean allows us to get a good overview of the response of marine ecosystems to changes in the AMOC. Globally, marine ecosystems see a decrease in total biomass as a response to an AMOC weakening. However, the regional and functional group response can deviate from the global mean, meaning that in some regions and for some groups biomass actually increases. We present an overview of the winners and losers in marine ecosystems in response to an AMOC weakening with potential consequences for the fishery industry and society.

How to cite: Boot, A., Smolders, E., and Schuring, I.: Winners and losers in marine ecosystems: the response of functional groups to an AMOC weakening under future emission scenarios, EGU General Assembly 2026, Vienna, Austria, 3–8 May 2026, EGU26-2774, https://doi.org/10.5194/egusphere-egu26-2774, 2026.

EGU26-2828 | Posters on site | ITS2.6/BG10.9

Evolution under exposure to heatwaves in the seed beetle, Callosobruchus maculatus. 

Claudio Piani, Edward Ivimey-Cook, Sarah Glavan, Sophie Bricout, and Elena Berg
Heatwave increases in frequency, intensity, and duration, are arguably the most straightforward manifestations of anthropogenic global warming and have devastating impacts on many ecosystems and taxa. However, to date, most studies investigating these impacts have focused on populations that have evolved under constant conditions prior to assaying or have only investigated the short-term outcomes. Here, using the seed beetle, Callosobruchus maculatus, we investigated both the short- and long-term effects of evolution after 43 generations of daily fluctuating temperature with an added heatwave exposure (+2°C peaking at 42°C) on two important life history traits, development time and lifetime reproductive success (LRS). We find that populations evolved under heatwave exposure developed at similar rates but had lower LRS than those evolved and assayed under the same fluctuating conditions. When assayed at a novel benign temperature of 29°C, beetles from both thermal regimes developed slower but had similar LRS, which was significantly higher than when assayed under the stressful fluctuating environment. Together, this suggests that long-term heatwave exposure may increase resilience to both repeated heatwaves and sudden environmental changes. This study emphasises the potency of long-term multigenerational exposure to heatwaves in order to understand how populations respond to climate change.  

How to cite: Piani, C., Ivimey-Cook, E., Glavan, S., Bricout, S., and Berg, E.: Evolution under exposure to heatwaves in the seed beetle, Callosobruchus maculatus., EGU General Assembly 2026, Vienna, Austria, 3–8 May 2026, EGU26-2828, https://doi.org/10.5194/egusphere-egu26-2828, 2026.

EGU26-5431 | ECS | Posters on site | ITS2.6/BG10.9

Peatland CO2, CH4 and WT under climate change: process-based simulations of alternative land-uses   

Ville Tuominen, Tiina Markkanen, Sari Juutinen, Ludwig Strötz, Tuula Aalto, Antti Leppänen, Olli Nevalainen, and Annalea Lohila

Peatland greenhouse gas dynamics are affected by anthropogenic land-use but also climate change, and especially methane emissions are expected to increase due to warmer temperatures. We study peatland sites in Europe using process-based JSBACH-HIMMELI ecosystem model, which includes the peat-YASSO soil carbon model and HIMMELI methane production and transport model. The model is capable of simulating peatlands and peatlands drained for forestry with a separate forestry-growth model. We account for drainage by modifying the water table level. 

Here we use CMIP 5 and CMIP 6 climate scenarios including IPSL, MPI and CNRM climate models and RCP 2.6, 4.5 and 8.5 pathways. We first simulate the peatland sites with their current land-use and set the model parameters according to in-situ measurements of GHGs and hydrology when available or otherwise use Sentinel 2 -based estimation and default set of parameters. 

We also simulate different land use options for historical period the site being either pristine, drained for forestry, or drained for agriculture or peat extraction. For future scenarios, we simulate the site being pristine or restored by rewetting or afforestation. We study the temporal dynamics of soil carbon, water table level, carbon dioxide and methane fluxes due to changes in management and in alternative management scenarios. We also study the trends climate change possesses and how increasing drought events affect the peatlands. 

Our results showed that the peatlands became more climate-warming in Radiative Forcing due to increased methane emissions, while the effect solely on water table level or Net Ecosystem Exchange was small. Drought events became more important on their contribution to annual GHG budget, but the intensity of emissions during droughts did not change notably. Peatland rewetting showed the return of carbon sink, and the methane emissions increased for a couple of decades depending on the water table level. 

How to cite: Tuominen, V., Markkanen, T., Juutinen, S., Strötz, L., Aalto, T., Leppänen, A., Nevalainen, O., and Lohila, A.: Peatland CO2, CH4 and WT under climate change: process-based simulations of alternative land-uses  , EGU General Assembly 2026, Vienna, Austria, 3–8 May 2026, EGU26-5431, https://doi.org/10.5194/egusphere-egu26-5431, 2026.

EGU26-6419 | ECS | Orals | ITS2.6/BG10.9

 Compound Desertification from Land to Ocean under Multi-Centennial Climate Warming 

Debashis Paul, Eun Jin Park, Eun Young Kwon, Sharif Jahfer, Sahil Sharma, and Mohanan Geethalekshmi Sreeush

Earth's biomes are undergoing fundamental reorganisation under anthropogenic warming, yet it is unclear how they may be changing on multi-centennial timescales. We examine the co-evolution of land and ocean biome distributions under a high-CO2 emission scenario through the 23rd century using the Community Earth System Model version-2 Large Ensemble (CESM2-LE). We apply the Köppen-Geiger climate classification for land (15 classes) and a chlorophyll-based classification for ocean (7 classes). Our findings exhibit sharply decoupled trajectories of biome reorganization between land and ocean.

The response of terrestrial biomes to rising global temperatures appears to be approximately linear in time and with global mean surface temperature. Driven by rising aridity thresholds and decreased precipitation, arid deserts and steppe regions gradually expand, eventually extending to about 35% of the world's land surface in the extended future. On the other hand, marine biome responses are strongly non-linear. Despite rising temperatures and enhanced stratification, the expansion of oligotrophic “ocean deserts” is initially buffered until about 2100. Phytoplankton’s adaptive strategies such as N2 fixation, enhanced organic nutrient recycling, and stoichiometric plasticity support this resilience. However, these adaptive mechanisms break down when a warming threshold of about 2-6°C is exceeded, leading to a sudden increase in extreme oligotrophic areas that eventually cover almost 25% of the world's ocean surface.

We refer to this degradation in the extended future as “compound desertification”, in which terrestrial desert expansion is followed by the sudden acceleration of marine oligotrophication. In subtropical regions including the Mediterranean, Central America, and Southern Africa, this phenomenon is particularly noticeable and poses serious cross-domain risks to biodiversity and food security. Additionally, we pinpoint important land-ocean feedbacks, such as increased dust-driven iron deposition from growing terrestrial deserts, which influences marine productivity in High-Nutrient Low-Chlorophyll (HNLC) regions to some extent. Our results emphasise the need to account for distinct response timescales of land and ocean biomes and highlight the latent vulnerability of marine ecosystems under sustained greenhouse gas emissions.

How to cite: Paul, D., Park, E. J., Kwon, E. Y., Jahfer, S., Sharma, S., and Sreeush, M. G.:  Compound Desertification from Land to Ocean under Multi-Centennial Climate Warming, EGU General Assembly 2026, Vienna, Austria, 3–8 May 2026, EGU26-6419, https://doi.org/10.5194/egusphere-egu26-6419, 2026.

EGU26-7022 | ECS | Orals | ITS2.6/BG10.9

Mapping flood hazards and earthworm resilience under climate change 

Qiuyu Zhu, Megan Klaar, Kristian Daly, Michael Berenbrink, Ben Pile, and Mark Hodson

Earthworms are adapted to resist extreme weather and soil flooding through a range of a physiological, behavioural and life-history strategies. During flooding, the oxygen content of soils reduces, representing a substantial risk to the survival of earthworms, which “breathe” oxygen across their skin. Therefore, changes in flood characteristics due to climate change are likely to pose significant challenges to earthworm populations. Given the importance of earthworms to several ecosystem services and provisions, understanding these risks is critical. Using historical (HadUK-Grid) data and future UKCP18 climate projections covering a 100-year period (1970-2080), we developed a rain-on-grid model for the whole of UK to model changing flood extent, frequency and duration due to changing climate conditions. The information was twinned with experimental data on earthworm survival under low oxygen conditions, including species-specific levels and oxygen affinities of their haemoglobins, mortality and cocoon viability to reveal a spatial understanding of hydrological extremes and its threats to earthworm under changing climate conditions.

Using the combined flood metrics, earthworm vulnerability and survival rate information, hazard maps reveal spatial and temporal hotspots of risk to earthworm populations and communities. These maps demonstrate critical thresholds beyond which earthworm populations experience mortality, threatening ecosystem resilience and ecosystem services. By linking hydrological extremes to earthworm response, this work provides an interdisciplinary workflow for predicting earthworm impacts due to changing flood characteristics under future climate.

The findings emphasise the need to integrate earthworms into flood risk management and ecosystem resilience planning, which can address potential ecosystem impacts that may be overlooked in climate adaptation strategies and promotion of nature-based solutions.

How to cite: Zhu, Q., Klaar, M., Daly, K., Berenbrink, M., Pile, B., and Hodson, M.: Mapping flood hazards and earthworm resilience under climate change, EGU General Assembly 2026, Vienna, Austria, 3–8 May 2026, EGU26-7022, https://doi.org/10.5194/egusphere-egu26-7022, 2026.

EGU26-8662 | Posters on site | ITS2.6/BG10.9

Extreme climate change and its impact on vegetation in the Qilian Mountains 

Xiaohua Gou, Lanya Liu, and Xuejia Wang

In the context of global warming, increasing frequency of extreme weather events has become a major challenge for humanity, especially for climate-sensitive and ecologically fragile area. However, the patterns and underlying mechanisms of extreme climate events, and its effects on vegetation are even less explored in arid and semi-arid regions in northwest China. In this study, we systematically examined historical changes, driving mechanisms, future projections of extreme climate events, and their impacts on vegetation dynamics in the Qilian Mountains, which is a key ecological security barrier in northwest China. We found that both extreme temperature and precipitation events in the Qilian Mountains have increased significantly in intensity, frequency, and duration over the past six decades, with pronounced spatial heterogeneity. Extreme low temperatures increased faster than extreme high temperatures, leading to a reduced diurnal temperature range, while heavy precipitation and wet-day precipitation contributed increasingly to annual totals. These changes are closely associated with intensified Eurasian anticyclonic circulation, enhanced geopotential heights, and increased moisture transport, modulated by phase shifts in the AMO, PDO, and AO. Future projections show continued intensification of extreme warming and precipitation, accompanied by a decline in cold and freezing days, especially under high-emission scenarios. From 1982 to 2015, NDVI in the Qilian Mountains exhibited an overall increasing trend, with 3.34% of the area showing a significant decreasing trend and 38.11% showing a significant increasing trend. Grasslands dominated the areas where vegetation significantly increased. Precipitation emerged as the main climatic factor limiting vegetation growth in the region, with the extreme precipitation intensity index contributing the most to NDVI, accounting for 17.1%. Both climate change and human activities jointly influenced vegetation dynamics, with differing dominant drivers between greening and browning areas. These findings improve understanding of climate–vegetation interactions in arid mountain systems and provide scientific support for ecosystem management and climate adaptation strategies in the Qilian Mountains.

How to cite: Gou, X., Liu, L., and Wang, X.: Extreme climate change and its impact on vegetation in the Qilian Mountains, EGU General Assembly 2026, Vienna, Austria, 3–8 May 2026, EGU26-8662, https://doi.org/10.5194/egusphere-egu26-8662, 2026.

EGU26-10053 | ECS | Posters on site | ITS2.6/BG10.9

Towards ML-based detection of terrestrial vegetation responses to seasonality and extreme weather events 

Yana Savytska, Viktor Smolii, and Kira Rehfeld

The response of terrestrial vegetation to seasonal or extreme weather events is complex and dynamic. In recent decades, the increased frequency and intensity of extreme events, driven by global warming, have led to adaptive processes in the biosphere. These processes can also place additional stress on ecosystems, limiting their functionality.

Possible consequences of extreme weather events include shifts in the timing of seasonal vegetation activity, as well as changes in the strength of ecosystem functions such as carbon dioxide assimilation. These temporal characteristics include the start, peak, and end of the vegetation growing phase. Such shifts challenge the accuracy of traditional monitoring and modelling of ecosystem dynamics based on climatic thresholds or phenology, which have become less accurate over the past few decades. The existing methods also overlook the irregular vegetation responses under stress conditions caused by short-term impacts. New indices, parameters and methods are needed to better capture evolving vegetation responses, especially in the context of overall ecosystem functioning.

We propose that anomalies in seasonal photosynthetic activity, measured through near-real-time fluctuations in aboveground atmospheric CO₂ concentrations, could be used to qualitatively assess the impacts of extreme events on terrestrial ecosystems. When interpreted in conjunction with meteorological and remote sensing data, CO₂-based metrics could enhance our understanding of ecosystem functioning. We show preliminary results obtained with this approach, in combination with methods of correlation analysis of CO₂ trends and net ecosystem exchange index, We find good sensitivity and an adaptive response, which could be promising to advance ecological monitoring.

We expect that limitations of our approach, such as generalisation and behaviour-averaging, could be overcome with machine learning approaches. These could focus on the detection of vegetation functional periods, as well as in the qualitative assessment of functioning.

Our research results, based on a high-level carbon balance model, statistical methods, and time-series analysis, provide a preliminary non-phenological detection of vegetation activity periods and CO₂ uptake strength. We expect that our method can be applied in conjunction with existing approaches to aid identification of vegetation activity and ecosystem functioning, or as a standalone tool for their preliminary evaluation in near-real-time.

How to cite: Savytska, Y., Smolii, V., and Rehfeld, K.: Towards ML-based detection of terrestrial vegetation responses to seasonality and extreme weather events, EGU General Assembly 2026, Vienna, Austria, 3–8 May 2026, EGU26-10053, https://doi.org/10.5194/egusphere-egu26-10053, 2026.

EGU26-10520 | ECS | Posters on site | ITS2.6/BG10.9

Identifying Potential OECM Sites for Endangered Birds to Achieve the '30 by 30' Target in South Korea: Integrating Ecological Value and Socio-Economic Costs 

Seungmin Lim, Gyeongbin Go, Ye Inn Kim, Taemin Jang, and Won Seok Jang

The Kunming-Montreal Global Biodiversity Framework (GBF) has established a global target to conserve 30% of the planet's land and seas by 2030. Nations worldwide, including South Korea, are actively committed to achieving this target. However, achieving this goal in South Korea is complicated by specific geographical and socio-economic constraints. While the nation is a critical stopover in the East Asian–Australasian Flyway (EAAF), its current Protected Area (PA) network is disproportionately skewed toward mountainous regions due to topographical characteristics. Consequently, critical habitats for threatened bird species—specifically in coasts, lowlands, farmlands, and islands—remain severely underrepresented, creating distinct conservation gaps. However, these biodiversity-rich areas are often privately owned and subject to high development pressure, making the designation of strict PAs legally and economically difficult. Therefore, identifying Other Effective area-based Conservation Measures (OECMs) that balance ecological needs with socio-economic realities is essential.

To systematically bridge the aforementioned conservation gaps, this study aims to identify feasible potential OECMs. To model nationwide habitat suitability, we employed the ensemble modeling framework of the biomod2 R package, utilizing machine learning algorithms such as Random Forest (RF), Generalized Boosting Model (GBM), and Artificial Neural Networks (ANN). For this analysis, we utilized occurrence data from the Global Biodiversity Information Facility (GBIF) for avian species classified as Critically Endangered (CR), Endangered (EN), and Vulnerable (VU) as input variables to accurately quantify the ecological value of unprotected areas. Crucially, unlike previous studies that focused solely on ecological metrics, this research integrated "Human Pressure Index (HPI)" and "proportion of private land" as explicit cost layers in a spatial optimization framework. This approach allows for the identification of areas offering high conservation value with manageable socio-economic trade-offs.

The analysis reveals that existing PAs fail to cover key lowland habitats essential for threatened birds. By incorporating cost variables, the optimization model derived potential OECMs that minimize land-use conflicts and acquisition costs while maximizing species protection. These findings suggest that a multi-criteria approach, considering both biological suitability and anthropogenic pressure, is vital for realistic conservation planning. The proposed potential OECMs provide a scientific basis for policy decisions and are expected to offer a practical pathway for South Korea to achieve the national 30 by 30 target by securing vulnerable avian habitats outside the traditional protected area network.

How to cite: Lim, S., Go, G., Kim, Y. I., Jang, T., and Jang, W. S.: Identifying Potential OECM Sites for Endangered Birds to Achieve the '30 by 30' Target in South Korea: Integrating Ecological Value and Socio-Economic Costs, EGU General Assembly 2026, Vienna, Austria, 3–8 May 2026, EGU26-10520, https://doi.org/10.5194/egusphere-egu26-10520, 2026.

EGU26-10731 | ECS | Posters on site | ITS2.6/BG10.9

Changes in winter climatic conditions and growing-season precipitation-temperature interactions affect cereal yields in Northern Europe 

Faranak Tootoonchi, Flavio Lehner, Göran Bergkvist, and Giulia Vico

In Northern Europe, climate change lengthens the growing season and increases temperatures during this period, but it also raises exposure to adverse climatic events such as reduced timely precipitation, temperatures above the optimum, and frost damage. Nonetheless, the net effect of positive and negative changes of climatic conditions in Northern Europe is still unclear, and it remains underexplored whether future climatic conditions, particularly in winter, will be beneficial or detrimental for crop yields.

To assess future risks, we analyzed a regional Single Model Initial-Condition Large Ensemble (CRCM5-LE) over Northern Europe under the RCP8.5 scenario (1955–2099), focusing on agriculturally relevant climatic variables over winter. Projections showed increasing winter temperatures and precipitation, and a decrease in snow depth across most regions. Combined effects of these changes resulted in more frequent periods of snow depth <5 cm below 60°N, and an increased number of freeze-thaw cycles. Both of these conditions negatively affect autumn-sown crops during their winter dormant period, increasing susceptibility to frost damage. Trends toward these unfavorable winter conditions emerged as early as the first half of this century.

In parallel, by using statistical models we quantified past response of county-averaged spring- and autumn-sown cereal yields in Sweden (1965–2020) to a wide range of observed temperature- and precipitation-related indicators across physiologically relevant crop development stages. Average growing season climatic conditions explained 75–85% of yield variability and outperformed short-term extremes. Yield reductions were associated with low precipitation or prolonged dry spells combined with high temperatures, as well as excessive precipitation under cool conditions.

Together these results show that without targeted adaptation strategies, climate change is unlikely to benefit cereal yields in Northern Europe, as a result of changes in winter conditions, and reductions in growing season precipitation and increases in temperature.

How to cite: Tootoonchi, F., Lehner, F., Bergkvist, G., and Vico, G.: Changes in winter climatic conditions and growing-season precipitation-temperature interactions affect cereal yields in Northern Europe, EGU General Assembly 2026, Vienna, Austria, 3–8 May 2026, EGU26-10731, https://doi.org/10.5194/egusphere-egu26-10731, 2026.

The intensifying frequency and severity of compound moisture–temperature extremes pose a profound threat to ecosystem stability. This is especially the case for drylands, which are facing these compound events at rates increasing at least twice as much as they do for humid regions, both in terms of event frequency and intensity. Identifying “tipping” compound dry-hot thresholds at which vegetation survival is currently threatened is therefore critical to anticipate large-scale ecosystem collapse in water-scarce regions.

In this study, we built a copula-based probabilistic framework to investigate the responses of 132 grassland sites to compound dry-hot events of varying intensity between 2000–2022. The sites considered comprise 299 species and span an area of 6.6 million km2 in north China, with climates ranging from hyper-arid to dry sub-humid. At each site, our framework allowed us to examine the likelihood for dry-hot conditions to pose a threat to the vegetation. That is, we established site-specific “eco-risk probabilities” relating compound dry-hot intensity thresholds (defined by the standardized soil moisture and heatwaves index, CMHI) to significant impacts on vegetation structure. We further investigated the relationship between eco-risk probabilities, “tipping” dry-hot thresholds, and both longer-term ecosystem pedoclimatic conditions and underlying biotic factors like species richness.

We found >64% of the surveyed drylands area to have experienced an increase in eco-risk with intensifying compound dry-hot events between 2000-2022. “Tipping” thresholds for compound dry-hot events spanned the full breath of the CMHI index, from -2.84 (extremely severe dry-hot event) to -0.16 (very dry-hot event), indicating that different grassland ecosystems show very different levels of vulnerability. Among the multiple pedo-climatic and biotic factors considered as possible explainers for site-specific “tipping” dry-hot thresholds, continued warming emerges as the primary driver. Notably, a relatively higher species’ phylogenetic diversity greatly helps grasslands resist compound dry-hot extremes.

Our results confirm previous findings showing that dryland ecosystem stability is under an acute risk with rising temperatures; however, enhancing plant phylogenetic diversity may help mitigate the escalating threat faced by these ecosystems.

How to cite: Hu, Y. and Sabot, M.: Bioclimatic controls on compound dry-hot thresholds that govern dryland grassland ecosystem stability, EGU General Assembly 2026, Vienna, Austria, 3–8 May 2026, EGU26-11427, https://doi.org/10.5194/egusphere-egu26-11427, 2026.

EGU26-12519 | ECS | Posters on site | ITS2.6/BG10.9

Compound risk in protective forest and natural hazard management 

Laura Saxer, Christine Moos, and Michaela Teich

Forests in mountainous areas can lower the frequency, magnitude, and intensity of gravity-driven natural hazards, such as snow avalanches, rockfall and landslides. These so-called protective forests thus constitute a primary natural protection mechanism, which can be complemented by technical protective measures against natural hazards. Their protective effect depends on several factors, including forest structure and management, as well as site characteristics and hazard types.

With ongoing climate change, forests are increasingly exposed to stressors and natural disturbances. Environmental stressors create unfavourable conditions that can impair the physiology of trees. In contrast, natural disturbances are discrete events that cause tree mortality leading to a sudden change in the forest structure. Stressors and disturbances can be biotic, such as fungi or insects, or abiotic, such as drought or storms. For example, drought can act as a stressor affecting tree health, or as a disturbance causing tree death. Strong winds can put stress on trees, but they can also cause windthrow, where trees are uprooted or broken. Both phenomena lower forests’ resistance to future stressors and disturbances, as well as their capacity to recover from them.

Originating from climate research, compound events are commonly defined as situations where several climatic drivers or hazards co-occur, creating an increased risk to society or the environment. The impacts of compound events across spatial and temporal scales can be significantly greater than the sum of individual drivers or hazards alone. In this study, we transferred this concept to protective forests. Compound events in protective forests are defined as multiple, spatially and/or temporally, interacting climate-induced stressors and disturbances. These events lead to changes in forest structure and composition, which negatively impact the protective effect of forests against natural hazards and create compound risk for people and infrastructure. For example, windthrow and bark beetle infestations can cause large forest openings that create potential release areas for snow avalanches.

Compound risks pose novel challenges for pre- and post-disturbance protective forest and natural hazard management. Due to the high level of uncertainty and complexity involved, it is necessary to develop a shared understanding of compound risk. There is also a need to quantitatively assess compound risks to enable the implementation of effective strategies to address and mitigate them.

Based on a systematic literature review, we synthesized existing knowledge to develop a definition of compound risk resulting from compound events in protective forests. To assess compound risk for protective forest and natural hazard management, we proposed a methodological framework based on adaptive pathways. Adaptive pathways are a decision-focused approach in climate adaptation research and planning, allowing performance-threshold oriented decision-making under uncertainties. We applied this approach in two case studies and developed scenarios that included a variety of uncertainties regarding compounding stressors and disturbances in forests as well as regarding natural hazards. The method allows the consideration of different forest and natural hazard management strategies for risk-based interventions.

How to cite: Saxer, L., Moos, C., and Teich, M.: Compound risk in protective forest and natural hazard management, EGU General Assembly 2026, Vienna, Austria, 3–8 May 2026, EGU26-12519, https://doi.org/10.5194/egusphere-egu26-12519, 2026.

EGU26-13460 | ECS | Posters on site | ITS2.6/BG10.9

Vegetation dynamics along drydowns under shifting drought regimes 

Myriam Terristi

Climate warming is reshaping drought regimes and their impacts on terrestrial vegetation, yet most large-scale studies still describe drought–vegetation relationships using long-term mean states or trend metrics that integrate over many processes and do not reveal how ecosystems reorganize during individual drydowns. Here, we adopt an event-scale perspective by explicitly tracking vegetation responses along discrete drydown events. We identify droughts as periods of increasing cumulative water deficit (CWD), defined as the running imbalance between precipitation and actual evapotranspiration, and we quantify hydroclimatic forcing using the severity of the most extreme drydown in each year, expressed as the annual maximum absolute CWD (CWDmax, mm). Over 2000–2023, significant CWDmax trends occur in 16.51%of vegetated grid cells, corresponding to 18.71% of total vegetated land area (area-weighted). Significant increases in CWDmax account for 7.39% of vegetated grid cells (7.88% of vegetated land area) across much of the Northern Hemisphere, the Sahel and the Amazon, while significant decreases account for 9.12% of grid cells (10.58% of land area). Positive CWDmax trends indicate that the most severe annual drydowns are reaching larger absolute deficits over time, consistent with intensification of hydroclimatic water stress, whereas negative trends indicate a weakening of extreme deficits; with typical magnitudes of 24.5 mm per decade, and 50% of significant trends falling between 14.1 and 37.9 mm per decade (IQR). To characterise vegetation responses at the event scale, we track satellite-based surface greenness (Enhanced Vegetation Index, EVI) along each year’s most severe drydown and fit smooth EVI–CWD trajectories to locate productivity peaks and subsequent critical losses. We define EVIpeak​ as the fitted maximum greenness and its associated deficit (i.e., CWDcritical) along the event trajectory and EVIcritical as the greenness level at a standardized loss threshold (90% of EVIpeak). Across climates, the fractional decline from peak to critical states is relatively conserved (~10–24%), yet the cumulative deficit required to reach that decline spans a five-fold range (~40–200 mm), highlighting strong hydroclimatic modulation of event-scale greenness loss. We summarise long-term changes in these within-event thresholds into five threshold pathways : Stable (no trend), Greening and Browning (co-trending EVIpeak and EVIcritical), and two decoupled modes: Overshoot (EVIpeak↑, EVIcritical↓) and Compensatory (EVIpeak↓, EVIcritical↑).  While ~80% of vegetated land area shows no detectable change (Stable), a latitudinal band (~50–65°N) exhibits a marked increase in non-stationary pathways, with Overshoot, Compensatory, and Browning over-represented; within 60–65°N, Browning reaches ~21.9%. Across regions where drought severity is intensifying in absolute terms (positive CWDmax trends), mid- to high-latitude systems more often shift toward Overshoot or Browning, whereas many dryland systems remain largely Greening. By uniting trends in absolute drought severity with within-event productivity thresholds, the framework provides state-dependent indicators of ecosystem pathways, highlighting where event-scale buffering appears stationary and where threshold dynamics indicate increasing vulnerability to greenness loss.

How to cite: Terristi, M.: Vegetation dynamics along drydowns under shifting drought regimes, EGU General Assembly 2026, Vienna, Austria, 3–8 May 2026, EGU26-13460, https://doi.org/10.5194/egusphere-egu26-13460, 2026.

EGU26-13636 | Orals | ITS2.6/BG10.9

Can Sentinel-2 help characterize the land management effect on the impact of drought followed by heavy precipitation in European agroecosystems? 

Mélanie Weynants, Khalil Teber, Miguel D. Mahecha, Marcin Kluczek, Jędrzej S. Bojanowski, and Fabian Gans

Successions of drought and extreme precipitation events are frequent compound events that pose a wide range of threats to ecosystems, whether natural or managed, and to society as a whole. The severity of such impacts depends on the intensity of the cascading hazards, the exposure and vulnerability of the affected systems. In the project ARCEME (Adaptation and Resilience to Climate Extremes and Multi-hazard Events) funded by the European Space Agency, we propose a workflow to analyse compound events fingerprints, i.e. spatially aggregated time series of indices based on small data cubes of satellite remote sensing imagery, typically 10x10 km over two years. Here, we demonstrate the workflow in some agroecosystems across Europe, selected using the WOCAT database on sustainable land management, which experienced heavy precipitation following extremely dry conditions. The compound events are detected in ERA5-Land time series of precipitation and potential evapotranspiration. We stratify the Sentinel 2-based fingerprints using land management information from the Copernicus Land Monitoring Service High Resolution Layers. The results provide insight into the effect of land management on the resilience of European agroecosystems to the impacts of drought followed by heavy precipitation.

How to cite: Weynants, M., Teber, K., Mahecha, M. D., Kluczek, M., Bojanowski, J. S., and Gans, F.: Can Sentinel-2 help characterize the land management effect on the impact of drought followed by heavy precipitation in European agroecosystems?, EGU General Assembly 2026, Vienna, Austria, 3–8 May 2026, EGU26-13636, https://doi.org/10.5194/egusphere-egu26-13636, 2026.

EGU26-13977 | Orals | ITS2.6/BG10.9

Forest responses to extreme events: Insights from remote sensing and process-based modelling 

Anja Rammig, Lucia Layritz, Benjamin Meyer, Konstantin Gregor, Vanessa Ferreira, Yixuan Wang, and Allan Buras

Extreme events can have severe impacts on ecosystems, their functioning and on the services they provide. For example, extended drought periods and heat waves are occuring more frequently and intensely in the recent past, with severe consequences for forests. My talk will give insights on the impacts of extended drought periods and heat waves on two different forest ecosystem types. First, I show how drought-impacts on forest ecosystems can be detected using the European Forest Condition Monitor and the Amazon Canopy Condition Monitor, which are based on remotely-sensed canopy greenness. Then I exemplify how the fusion of remotely-sensed canopy greenness and model simulation output helps to quantify tree-species specific drought-vulnerabilities. My talk also demonstrates how process-based models can help to assess impacts of extreme events on forest dynamics and composition, and on the carbon and water cycle. I present new developments from the process-based vegetation model LPJ-GUESS regarding the representation of drought-response strategies of different forest types and tree species. Finally, I will discuss how climate change and the impacts of extreme events can lead to different ecosystem recovery trajectories after disturbance.

How to cite: Rammig, A., Layritz, L., Meyer, B., Gregor, K., Ferreira, V., Wang, Y., and Buras, A.: Forest responses to extreme events: Insights from remote sensing and process-based modelling, EGU General Assembly 2026, Vienna, Austria, 3–8 May 2026, EGU26-13977, https://doi.org/10.5194/egusphere-egu26-13977, 2026.

EGU26-15405 | ECS | Posters on site | ITS2.6/BG10.9

Mapping the accumulated carbon storage of global coastal wetlands from 2000 to 2020 at a 1km resolution  

Siting Xiong, Zimeng Ge, and Xudong Wu

Coastal wetlands are among the most productive ecosystems globally and play a crucial role in carbon sequestration. However, their carbon sequestration capacity has increasingly been affected by climate change and anthropogenic activities in recent decades. Revealing spatiotemporal changes in coastal wetland carbon sequestration capacity over extended time periods is crucial for understanding the long-term carbon dynamics. Our research constructed a global spatial dataset of accumulated carbon stocks in coastal wetlands at 1 km resolution for the period 2000–2020, capturing spatiotemporal variations in carbon stocks at both global and regional scales and identifying regional patterns of accumulated carbon stock losses. Our findings provide a solid basis for pinpointing vulnerable areas in need of restoration efforts and for supporting sustainable management of coastal wetland ecosystems.

How to cite: Xiong, S., Ge, Z., and Wu, X.: Mapping the accumulated carbon storage of global coastal wetlands from 2000 to 2020 at a 1km resolution , EGU General Assembly 2026, Vienna, Austria, 3–8 May 2026, EGU26-15405, https://doi.org/10.5194/egusphere-egu26-15405, 2026.

Sea turtles are among the marine life endangered by human activities that directly disturb their environment, such as fisheries bycatch, habitat degradation, and pollution. Additionally, the effects of ongoing global warming can also pose an extra threat since sea turtles are a species with temperature-dependent sex determination. Hence, with the increasing temperatures, they may experience a feminization phenomenon that can pose a risk to their extinction. Since the female sea turtles exhibit a great fidelity to beach sites where they were nested, a potential behavioral change to mitigate the effects of global warming is a nesting phenological shift to cooler periods of the year. Based on previous observations, the most optimistic phenological shift for sea turtles can be extrapolated to 27 days (about one month) per 1.5°C increase in the nesting sand temperature. Using this hypothesis, in this study, we aim to assess by when the sea turtles have to perform a one-month phenological shift in 48 sites around the world and the respective warming mitigation achieved by the phenological shift. We used two future climate scenarios (SSP2-4.5 and SSP5-8.5) from the simulations of 22 CMIP6 climate models. For SSP2-4.5 future scenario (a moderate scenario), it is projected that the middle of this century is the earliest date for phenological shift in sites located in the southeastern part of the USA and in the eastern Mediterranean sites.  Sea turtles nesting in the equatorial sites have up to the end of the century or beyond to perform a phenological shift. However, the warming mitigation is greater in sites located further away from the equatorial region, whereas the sites in the equatorial region show a small mitigation effect from the phenological shift. Regarding the SSP5-8.5 future scenario (an extreme scenario), the phenological shift has to be performed in this century in all sites, with some sites in the Mediterranean with threshold dates sooner than mid-21th century. Moreover, compared with the SSP2-4.5 future scenario, there is some reduction in warming mitigation capacity, but it is not significantly different from the moderate scenario. Considering the uncertainty from the climate models' projections, our analysis shows that the models have lower uncertainty in sites projecting earlier threshold dates for phenological shifts.

How to cite: F. Veiga, S. and Yuan, H.: How many years do sea turtles have to shift their phenology due to global warming? , EGU General Assembly 2026, Vienna, Austria, 3–8 May 2026, EGU26-16370, https://doi.org/10.5194/egusphere-egu26-16370, 2026.

EGU26-16985 | ECS | Posters on site | ITS2.6/BG10.9

The daily timing of a given temperature has shifted by over an hour since 1980 

Assaf Shmuel, Lior Greenspoon, Justin Mankin, and Ron Milo

Climate change manifests not only as changes in daily mean temperatures but also as shifts in the daily pattern of temperatures. We analyze historical analogues in the daily temperature cycle by comparing equivalent hourly temperatures since the 1980s. On a global average, temperatures characteristic of the morning warming period occur roughly 15 minutes earlier per decade, while those in the afternoon cooling period occur more than 20 minutes later per decade. For example, temperatures that occurred at 10 AM in the 1980s now occur at 9 AM, with even greater shifts in the afternoon. If sustained, the time of day at which equivalent temperatures occur would be displaced by more than three hours by 2100 relative to the 1980s, persisting under the ‘middle of the road’ pathway but slowing and eventually stopping under mitigation. The timing changes perturb ecological cues, increase human heat exposure, and displace energy demand in ways not captured by means or extremes, underscoring the value of time-of-day metrics for characterizing climate change impacts. Moreover, in more than half of mid-latitude regions, mean daily minima are projected to exceed the 1980s maxima, creating novel diurnal regimes with no recent historical analogues.

How to cite: Shmuel, A., Greenspoon, L., Mankin, J., and Milo, R.: The daily timing of a given temperature has shifted by over an hour since 1980, EGU General Assembly 2026, Vienna, Austria, 3–8 May 2026, EGU26-16985, https://doi.org/10.5194/egusphere-egu26-16985, 2026.

EGU26-17290 | ECS | Posters on site | ITS2.6/BG10.9

From climate hazards to yield losses: AI surrogate impact modelling  

Odysseas Vlachopoulos, Niklas Luther, Andrej Ceglar, Andrea Toreti, and Elena Xoplaki

We present the Surrogate Engine for Crop Simulations for Maize (SECS4M), a deep-learning emulator designed to replicate the process-based ECroPS crop growth model for grain maize in Europe while enabling computationally efficient, large-scale applications in climate services. SECS4M is built on a nested Long Short-Term Memory architecture capturing short- and long-term weather–crop interactions, while it ingests only three daily meteorological inputs, minimum and maximum temperature and total precipitation, thus minimizing the uncertainty that follows the use of a much wider input stream as in ECroPS. Trained on ERA5-forced yield outputs, SECS4M accurately reproduces crop growth trajectories, harvest timing, and yield distributions. Computational requirements are reduced from ~70s to ~0.008s per grid-cell–year, a four-order-of-magnitude speed-up that enables ensemble-scale, operational use.

Forced with bias-adjusted SEAS5.1 forecasts, SECS4M reproduces observed 2022 impacts and supports probabilistic identification of Areas of Concern (AoC) based on tercile-based yield anomalies. Under CMIP6 scenarios SSP3-7.0 and SSP5-8.5 to 2050, the emulator highlights specific regions as persistent hotspots of yield risk, while others exhibit mixed signals. SECS4M thus provides a scalable, digital twins enabled and data-efficient framework for seasonal forecasting, AoC mapping, and scenario analysis. Finally, the methodology can be extended to other crops and can be tested for its potential on other regions.

How to cite: Vlachopoulos, O., Luther, N., Ceglar, A., Toreti, A., and Xoplaki, E.: From climate hazards to yield losses: AI surrogate impact modelling , EGU General Assembly 2026, Vienna, Austria, 3–8 May 2026, EGU26-17290, https://doi.org/10.5194/egusphere-egu26-17290, 2026.

EGU26-17492 | ECS | Posters on site | ITS2.6/BG10.9

Linking Biodiversity, Vegetation Structure, and Safety of Flood Protection Dikes under Compound Climate Stressors 

Maximilian Dorfer, Hans Peter Rauch, Franz Zehetner, Thomas Kager, and Elias Ferchl

Along the rivers March and Thaya in eastern Austria, 80 km of flood protection dikes have been constructed and rehabilitated since 2006. These structures are predominantly setback flood defenses that only interact directly with river discharge during flood events. Embedded within a Natura 2000 floodplain landscape, the dikes represent linear infrastructure elements that fulfil a dual function: they provide technical flood protection while simultaneously forming important ecosystems at the interface between riparian forests, agricultural land and settlement boundaries. Vegetation cover on flood protection dikes plays a key role in slope stabilization and erosion control, particularly under extreme hydrometeorological conditions. Beyond their protective function, dikes act as linear green corridors that enhance landscape connectivity and provide habitats for insects and small fauna. Biodiversity on these structures is therefore a crucial factor influencing ecosystem resilience, while degraded vegetation cover increases vulnerability to erosion, drought stress, and mechanical failure during extreme events and climate change poses increasing challenges for flood protection dikes. Prolonged drought periods weaken vegetation cover and reduce root cohesion, whereas more frequent intense precipitation and flood events impose additional stress through surface runoff, saturation, and erosion. Understanding how vegetation management affects ecosystem functioning under these compound stressors is therefore essential for assessing future vulnerability and resilience of flood defense infrastructure. Within the framework of the CLIMD research project, this study investigates how different management strategies, including mowing regimes, removal or retention of cut biomass, grazing by cattle and horses, and partial abandonment of maintenance, affect vegetation structure, biodiversity, biomass production, and soil water and nutrient dynamics across 20 dike sites along the March-Thaya system. The study sites span a broad gradient of environmental settings, ranging from floodplain forests to intensively managed agricultural landscapes. Data collection includes biomass assessments, biodiversity surveys, soil analyses, and high-resolution measurements of soil moisture and temperature in different depths. By integrating field observations, management scenarios, and climate projections into a biomass-based modeling framework, the study aims to quantify safety factors of dike sections and identify how biodiversity-driven vegetation complexity can enhance resilience while reducing vulnerability to extreme weather events.

How to cite: Dorfer, M., Rauch, H. P., Zehetner, F., Kager, T., and Ferchl, E.: Linking Biodiversity, Vegetation Structure, and Safety of Flood Protection Dikes under Compound Climate Stressors, EGU General Assembly 2026, Vienna, Austria, 3–8 May 2026, EGU26-17492, https://doi.org/10.5194/egusphere-egu26-17492, 2026.

EGU26-18103 | ECS | Posters on site | ITS2.6/BG10.9

Increasing impacts of soil dryness on forests across the globe 

Pia Marie Müller and Rene Orth

Climate change leads to soil drying in many regions via reduced precipitation and/or increased atmospheric water demand. This threatens the functioning of global vegetation, particularly forests, which currently absorb a substantial fraction of human carbon emissions. Analyses of forest responses to droughts typically focus on single events and span spatial scales ranging from individual sites to continents. A global analysis of drought impacts on forests and their evolution over time under ongoing climate change is lacking. 
In this study, we quantify and analyse the evolution of the effects of soil moisture drought events on forests across the globe during 2001–2023. We identify dry events from a reanalysis soil-moisture dataset using percentile-based thresholds per grid pixel. Further, we evaluate forest responses using satellite-based vegetation indices, including NDVI and NIRv, and normalize anomalies by the pixel-based standard deviation to ensure comparability across regions. Using this approach, we find a steady increase in the global area exhibiting negative forest responses to soil dryness between 2001 and 2023. Additionally, regions with more negative forest responses tend to show faster increases over time than regions with mildly negative responses. We further hypothesize that this increased magnitude of severe vegetation responses to dryness may be related to three factors: increasing soil dryness and/or compound occurrence with atmospheric dryness, increased forest sensitivity to dryness, and changing spatial patterns of soil dryness occurrence. Understanding how these factors contribute to aggravated forest responses to dryness is essential for predicting the land carbon sink and implications for local water and energy cycling.

How to cite: Müller, P. M. and Orth, R.: Increasing impacts of soil dryness on forests across the globe, EGU General Assembly 2026, Vienna, Austria, 3–8 May 2026, EGU26-18103, https://doi.org/10.5194/egusphere-egu26-18103, 2026.

EGU26-18673 | Posters on site | ITS2.6/BG10.9

FOR A BETTER ADAPTATION OF THERMAL TERRITORIES TOWARD CLIMATE CHANGE - ThermEcoWat Project 

Victor Klaba, Christian Iasio, Cyril Aumar, Clément Brunet, Georgina Arnó, Rosa Maria Moreno, Elsa Ramalho, Joao Carvalho, Luis Manuel Ferreira Gomes, Liliana Ferreira, Ana Jorge, Nuno Almeida, Jessica Diéguez, Queralt Madorell Batlle, Isidre Pineda Moncusi, Jordi Martin Forns, Marion Roussel, and Eric Brut

The wealth of spa territories depends directly on their main resource: mineral and thermal groundwater. Their use has developed from Antiquity to the present day, through various applications, mainly medical and energy-related, enabling the growth of highly attractive local sectors. However, climate change is threatening their sustainability, impacting thermal resources and exploitation models. In the Interreg Southwest Europe region (SUDOE), this occurs by natural triggers such as a rainfall redistribution coupled to a long-term downward trend in its quantity, which may cause a deterioration in the current quality and quantity of water from thermal water points, and governance issues.

To minimize the impacts of climate change at the territorial level and increase their resilience, only an adaptation plan based on a clear strategy can be employed. However, the decisional processes needed to develop such a plan may generate conflicts among the relevant stakeholders and decision makers. To face these difficulties, the ThermEcoWat Project proposes a workflow and a methodology for the definition of adaptation strategies that include environmental, socio-economic, and regulatory aspects, based on participative approach structured around thematic workshops and a decision-aiding tool. This tool must be capable of managing the complexity of data and information requested for short-, medium-, and long-term strategies.

A consortium of geoscientists, city managers and entrepreneurs representing three thermal towns (Chaudes-Aigues - FR, Caldes de Montbui - ESP, and São Pedro do Sul - PT) are working together to (1) release a diagnostic of the current functioning of each pilot case and their link with thermal resource, (2) understand the current and futures constraints applied to the use of the resource, and (3) propose sustainable solutions that  all relevant stakeholders agree on. These objectives need relevant amount of heterogeneous types of data, organized in a multidisciplinary knowledge base, which is the fundament of the decision-aiding tool. This tool, currently under development, leverages semantic data management technologies to enable an innovative approach to transdisciplinary data collection and a powerful knowledge extraction capability through inference. 

This methodology is expected to be replicable across all European thermal sites in order to improve the durability of investments and build the essential prerequisite for adaptation to climate change.

How to cite: Klaba, V., Iasio, C., Aumar, C., Brunet, C., Arnó, G., Moreno, R. M., Ramalho, E., Carvalho, J., Ferreira Gomes, L. M., Ferreira, L., Jorge, A., Almeida, N., Diéguez, J., Madorell Batlle, Q., Pineda Moncusi, I., Martin Forns, J., Roussel, M., and Brut, E.: FOR A BETTER ADAPTATION OF THERMAL TERRITORIES TOWARD CLIMATE CHANGE - ThermEcoWat Project, EGU General Assembly 2026, Vienna, Austria, 3–8 May 2026, EGU26-18673, https://doi.org/10.5194/egusphere-egu26-18673, 2026.

EGU26-19349 | ECS | Posters on site | ITS2.6/BG10.9

Investigating drought effects on forest edges along railway tracks within the project RailVitaliTree 

Larissa Billig, Wolfgang Kurtz, Achim Bräuning, Sascha Gey, Nandini Hannak, Martin Häusser, Mathias Herbst, Randolf Klinke, Daniel Rutte, Paul Schmidt-Walter, Benjamin Stöckigt, and Sonja Szymczak

How is tree vitality affected by conditions near railway tracks? Evapotranspiration can be higher, through increased sunlight exposure and wind, higher air temperature and lower air humidity than in a closed canopy. The extent, impact and occurrence frequency of more drought-prone conditions are investigated in the project “RailVitaliTree – Tree vitality monitoring and modelling of drought-related risks along railways with remote sensing and dendroecology”. The four most common tree species in Germany, pedunculate oak (Quercus robur), European beech (Fagus sylvatica), Norway spruce (Picea abies) and Scots pine (Pinus sylvestris), are examined.

The project follows a multidisciplinary approach, aspiring to develop a nation-wide tree vitality monitor along the German railway network to support early detection of potential damage to railway infrastructure and further ensure railway safety. Tree vitality is investigated through dendroecological methods, digital orthophotos and satellite imagery analysis, hydroclimatic measurements and a forest-focused climate analysis.

Herein we focus on the hydroclimatic investigations of the project, which consist of two parts: (1) Regional climate change effects on tree vitality are analysed via the plant-available water content computed by the forest water balance model LWFBrook90 from 1961 until the present. After applying a literature-based threshold for drought indication, the findings are compared with relative tree vitality changes computed from satellite data (https://forestwatch.lup-umwelt.de/) and dendroecological time series. As a further step, the lengths of continuous periods with a drought indication and their frequency over time are initially evaluated only for oak. An increase in period length and frequency (for the time period 1961 to 2020) can be observed so far.

(2) Additionally, instrumental measurements are carried out at selected, exemplary sites along the German railway network, to investigate microclimate conditions at forest edges. At a total of three sites, mobile weather stations measure standard meteorological parameters (air temperature, humidity, precipitation, wind, etc.) as well as soil moisture and matrix potential over one or two vegetation periods. These stations are installed as pairs, one station at the edge and one as a reference within the forest stand. The collected data is used to identify differences in the local water balance and compared to selected existing meteorological products of the German Meteorological Service. Preliminary results show small measurement differences between the reference and forest edge stations. Averaged over the meteorological summer months, the air temperature is highest and the humidity is lowest at the forest edge at midday.

How to cite: Billig, L., Kurtz, W., Bräuning, A., Gey, S., Hannak, N., Häusser, M., Herbst, M., Klinke, R., Rutte, D., Schmidt-Walter, P., Stöckigt, B., and Szymczak, S.: Investigating drought effects on forest edges along railway tracks within the project RailVitaliTree, EGU General Assembly 2026, Vienna, Austria, 3–8 May 2026, EGU26-19349, https://doi.org/10.5194/egusphere-egu26-19349, 2026.

Forests are increasingly relied upon as climate mitigation assets, but their carbon sequestration capacity is vulnerable to intensifying disturbance regimes. This vulnerability is especially relevant in intensively managed production forests, where disturbance can disrupt harvest cycles and alter carbon trajectories. In Ireland, for instance, conifer forests, largely composed of Sitka spruce (Picea sitchensis (Bong.) Carr.), dominate the productive forest estate and are particularly exposed to wind damage (Gallagher, 1974, Ni Dhubhain, 1998), raising questions about the robustness of mitigation benefits under a “business-as-usual” management. In this context, this study quantifies how alternative management strategies influence the carbon resilience of Irish forests at national scale.

A windstorm disturbance scenario was implemented across the Irish conifer forest estate using the CBM-CFS3 framework (Kurz et al., 2009). Stands were initialised with attributes from the National Forest Inventory (DAFM, 2022) to represent the most up-to-date age structure and management context. The windstorm event was defined as a target affected area consistent with recent post-storm damage magnitudes in Ireland (McInerney et al., 2016, DAFM, 2025). Damage is allocated using exposure and stand structure eligibility rules informed by Ni Dhubhain et al. (2009), with susceptibility weighted by management state (e.g., recently thinned stands) and stratified by region and age class. A baseline management scenario followed standard practice in the country (thinnings and clearfell with replanting). Post-storm dynamics included a short period of on-site decomposition of downed biomass followed by static salvage prescriptions to isolate management effects.

Management was evaluated through two decision factors expected to affect both forest exposure and recovery to storm events: thinning strategy and rotation length. Results were summarised using mitigation-relevant indicators at national scale, including changes in ecosystem carbon pools (live biomass, dead organic matter, soils), the magnitude and duration of storm-induced carbon debt and the timing of recovery relative to pre-storm trajectories. This analysis was framed as a scenario-based sensitivity assessment rather than a forecast, providing an evidence base for national reporting discussions and for subsequent work extending to alternative management pathways and analyses considering the carbon stocks in harvested wood products.

Keywords: carbon dynamics, forest resilience, natural disturbance, storm damage, temperate forests.

References

DAFM 2022. National Forest Inventory of Ireland. Dublin: DAFM.

DAFM 2025. Minister Healy-Rae confirms that over 26,000 hectares of forests have suffered wind damage. DAFM. Government of Ireland.

GALLAGHER,G. 1974. Windthrown in state forests in the Republic of Ireland. Irish Forestry, 31, 14.

KURZ, W.A., DYMOND, C.C., WHITE, T.M., STINSON, G., SHAW, C.H., RAMPLEY, G.J., SMYTH,C., SIMPSON, B.N., NEILSON, E.T., TROFYMOW, J.A., METSARANTA, J. & APPS, M.J. 2009. CBM-CFS3: A model of carbon-dynamics in forestry and land-use change implementing IPCC standards. Ecological Modelling, 220, 480-504.

MCINERNEY,D., BARRETT,F., LANDY, J. & MCDONAGH,M. 2016. A rapid assessment using remote sensing of windblow damage in Irish forests following Storm Darwin. Irish Forestry, 73, 19.

NI DHUBHAIN, A. 1998. The influence of wind on forestry in Ireland. Irish Forestry, 55, 105-113.

NI DHUBHAIN, A., BULFIN, M., KEANE, M., MILLS, P. & WALSHE, J. 2009. The development and validation of a windthrow probability model for Sitka spruce in Ireland. Irish Forestry, 66, 74-84.

How to cite: Longo, B. L. and Byrne, K. A.: Adapting management to wind disturbance: national-scale carbon trajectories under alternative silvicultural strategies in Ireland, EGU General Assembly 2026, Vienna, Austria, 3–8 May 2026, EGU26-20290, https://doi.org/10.5194/egusphere-egu26-20290, 2026.

EGU26-20300 | ECS | Posters on site | ITS2.6/BG10.9

Unveiling biases on agroclimatic indicators : assessment of gridded climate data SAFRAN, ERA5-Land, and EOBS, against station-based observations in France. 

Nïou Le Bihan, Iñaki García de Cortázar-Atauri, Carina Furusho-Percot, Marie Launay, and Renan Le-Roux

Three gridded datasets (SAFRAN, ERA5-Land and EOBS) are compared to INRAE’s and Météo-France’s observed data from their respective weather stations networks. The Météo France network comprises 37 synoptic stations, while the INRAE network comprises 49 stations. This work analyses the bias between the gridded data and the stations’ ones. It aims to quantify the bias between those three datasets in terms of climatic parameters, as well as their repercussions on agroclimatic indicators and on the plant phenology cycle (in this case represented by wheat).
While historically studies of climate change and its impacts have relied on data from weather stations (located in a given place), in recent years we have observed more and more studies using gridded climatic data. Their value lies in the fact that these data enable the climate of a territory to be represented spatially (rather than at a single point), and they also ensure the continuity of all climatic variables. These two characteristics make them particularly useful for impact studies. Furthermore, this data is used to correct climate projections (e.g. CORDEX) at different scales. Many gridded datasets have been created with diverse characteristics and so equally diverse data values.
The datasets are, in the first instance, studied in regard to a set of weather parameters: minimal, mean and maximal temperatures and precipitations. The mean temperature is then incorporated in a phenology model to simulate the wheat’s phenology cycle. Simultaneously, the minimal and maximal temperatures are also used to calculate three agroclimatic indicators: number of frost days, number of days with maximal temperatures over 25°C (as an important threshold for wheat yield elaboration) and over 35°C (considered as a critical threshold for plant development and growth). In a second phase, the results are analysed to identify if the biases between the gridded data and the stations’ ones are changing seasonally, annually or depending on the value of the parameter.
We found that for the mean temperature and the phenology cycle the biases are not significative. The bias obtained for simulating phenology stages is in majority under the 5 days admissible error (which could be due to an observation error). For those two indicators, SAFRAN is showing the best results. In regard to the minimal and maximal temperature and the matching agroclimatic indicators, EOBS is showing lowest bias and ERA5-Land is showing the highest bias. We could also highlight a seasonality in the bias of the minimal temperature for SAFRAN and ERA5-Land, and a bias depending on the value of the parameter.
This work presents a method for identifying biases in a dataset, that can be applied to various parameters and impact studies. It quantifies the accuracy of the gridded data used in these studies and determines whether the biases are indicative. Furthermore, it illustrates the extent to which these biases shape the evaluation of indicators like phenology dates and climate-related risks to crop production. Finally, it helps users choose the most suitable dataset for their needs.

How to cite: Le Bihan, N., García de Cortázar-Atauri, I., Furusho-Percot, C., Launay, M., and Le-Roux, R.: Unveiling biases on agroclimatic indicators : assessment of gridded climate data SAFRAN, ERA5-Land, and EOBS, against station-based observations in France., EGU General Assembly 2026, Vienna, Austria, 3–8 May 2026, EGU26-20300, https://doi.org/10.5194/egusphere-egu26-20300, 2026.

EGU26-20934 | Orals | ITS2.6/BG10.9 | Highlight

The Black Box – A mixed-method approach linking extreme event impacts on ecosystems in coastal and marine areas to socio-ecological risks 

Jack O'Connor, Fabian Racklemann, Abbie Amundsen, and Greta Dekker

As the frequency and intensity of extreme events such as marine heatwaves, droughts and storms increases with climate change, so too do the efforts of researchers to understand the impacts of such extreme on marine and coastal ecosystems. In many coastal areas, communities and local industry depend on these ecosystems for income, protection, cultural heritage and sense of place, while at the same potentially influencing the strength of hazards through management decisions. It is therefore critical to understand the connection between hydro-dynamic extremes, marine and coastal ecosystems, and the services depended upon by different social and sectoral interests.

We combined mapping and modelling of marine and coastal ecosystems with stakeholder workshops in the Elbe / German Bight region from Hamburg to Helgoland, a region heavily connected with and impacted by human activities, to understand ecosystem risks due to extreme events and the ways in which these risks affect different local sectors and communities. Spatial data on local ecosystems was synthesised and mapped to identify key ecosystems of interest. Data was then gathered via literature review on thresholds for extreme event parameters and the ecosystem / individual level responses, supported by expert consultations and ecosystem-focused mini-workshops. We combined this with an impact web approach to create a conceptual risk web as a baseline for identifying and prioritising socio-ecological risks due to different extreme events experienced in the region. A series of stakeholder workshops were held to understand the key risks perceived by a diverse range of actors, and values were assigned to different regions of the study area by different sectors based on the IPBES Nature’s Contributions to People (NCP) framework. This framework puts more emphasis on non-monetary services, while allowing for diverse values and knowledge types to be integrated.

This work highlights the “black box” of linking empirical data on ecosystem impacts with how these impacts affect the provision of certain ecosystem services, which can be derived using qualitative and qualitative data. A mixed-methods approach is essential for assessing the cascading effects of ecosystem damage on society, especially in support of more effective, collaborative adaptation planning which enhances ecosystem resilience in oft-overlooked marine and coastal systems.

How to cite: O'Connor, J., Racklemann, F., Amundsen, A., and Dekker, G.: The Black Box – A mixed-method approach linking extreme event impacts on ecosystems in coastal and marine areas to socio-ecological risks, EGU General Assembly 2026, Vienna, Austria, 3–8 May 2026, EGU26-20934, https://doi.org/10.5194/egusphere-egu26-20934, 2026.

EGU26-22350 | Posters on site | ITS2.6/BG10.9

Restoration potential of eutrophic shallow lakes in eastern China under potential climate change 

Bo Qin, Min Xu, Enlou Zhang, and Rong Wang

Extreme weather events pose severe challenges to the recovery of aquatic ecosystems, particularly for shallow lakes in critical stages of eutrophication restoration. Clarifying the tipping characteristics, mechanisms, and driving factors during ecosystem recovery is essential for improving sustainable management. Focusing on typical shallow lakes in eastern China at key governance stages, this study integrates sediment core analysis and historical monitoring records to reconstruct century‑scale eutrophication trajectories, identify regime shifts, and derive potential recovery pathways and restoration baselines. By combining short‑term observations with long‑term paleolimnological evidence, we develop and calibrate a PCLake dynamic model adapted to shallow lake ecosystems. Through scenario simulations that incorporate future extreme climate change and human‑induced stressors, we systematically analyze responses in ecosystem structure and function, and quantitatively assess vulnerability, resilience, and potential tipping points. This research aims to provide a scientific foundation for adaptive management of shallow lakes in regions during a critical restoration window under intensifying climate warming.

How to cite: Qin, B., Xu, M., Zhang, E., and Wang, R.: Restoration potential of eutrophic shallow lakes in eastern China under potential climate change, EGU General Assembly 2026, Vienna, Austria, 3–8 May 2026, EGU26-22350, https://doi.org/10.5194/egusphere-egu26-22350, 2026.

EGU26-2729 | ECS | Orals | SSS6.10

Soils at Risk: How Fragmented Planning Undermines Soil Health in Ukraine’s Recovery 

Mariia Smirnova and Oleksandr Anisimov

Healthy soils underpin food security, climate resilience, and sustainable spatial development. International frameworks such as Land Degradation Neutrality and Sustainable Land Use Systems, alongside European initiatives including the Soil Monitoring and Resilience Law and the EU Soil Strategy, emphasise the need for sustainable land management. Despite this, policy implementation across countries and regions remains fragmented, resulting in the continued degradation of soil ecosystem functions. In Ukraine, these challenges are amplified by exceptionally high levels of land tillage (over 56% of the territory) and by the impacts of full-scale war, including blast craters, toxic contamination, destruction of soil structure, and landmines affecting hundreds of thousands of hectares. This study examines whether Ukraine’s existing planning system is capable of meaningfully integrating soil health considerations during post-war recovery and in the context of EU accession. We hypothesise that institutional weakness and a mismatch of planning priorities impede sustainable land use management. 

The methodology combines an analysis of national institutional conditions with planning case studies from three municipalities. It is supported by a review of international research on the alignment between national sustainable land use policies, requirements for local planning documentation, and their practical implementation, with particular attention to gaps between formal commitments and actual planning practices.

The analysis of municipal planning and land management shows that soils and surface plots are predominantly treated as economic assets, with limited assessment of their ecological functions. Ambitious national objectives on soil protection are weakened during local implementation, as planning documents tend to prioritise land-use decisions driven by short-term economic considerations. Existing control instruments—such as landscape planning components, Strategic Environmental Assessment, and public consultations are proven to be largely ineffective due to limited legal influence over landowners and developers, as well as persistent challenges in coordination and quality across planning levels.

This study identifies key causes and consequences of this approach. In frontline regions, immediate security concerns override long-term environmental objectives, while other municipalities lack the sufficient resources necessary to meet the complex requirements of legislation and implement measures envisaged by sustainable land management policies. 

The main barriers to treating soils as an integrated ecological system include institutional incapacity, formalistic planning procedures, fragmented responsibilities unsupported by adequate funding, and planning documentation structures that prevent ecological accounting of soil damage and functional change. Addressing these limitations would require a reframing of planning priorities, including cross-cutting recognition of soil health, stronger guidance for plan developers, and the attribution of both economic and factual value to soils within binding preliminary territorial analyses. Greater emphasis on incentivising land-use instruments, rather than control-based mechanisms, is particularly relevant given limited municipal capacity. In total, significant policy integration and re-orientation are necessary to achieve NNLT and soil degradation targets during Ukraine’s recovery.

How to cite: Smirnova, M. and Anisimov, O.: Soils at Risk: How Fragmented Planning Undermines Soil Health in Ukraine’s Recovery, EGU General Assembly 2026, Vienna, Austria, 3–8 May 2026, EGU26-2729, https://doi.org/10.5194/egusphere-egu26-2729, 2026.

EGU26-4883 | Posters on site | SSS6.10

Assessing and mapping the agricultural potential of landscapes. Case study: Southeastern part of the Republic of Moldova 

Ioana Chiriac, Angela Cantir, Olga Crivova, Stela Curcubat, Ghennadi Sirodoev, George-Marius Cracu, Gabriela Nicoara, Mirela Paraschiv, Andrei Schvab, George Secareanu, Natasa Vaidianu, and Igor Sirodoev

In the context of EU sustainable farming practices, the ensuring that agricultural activities are aligned with the natural capacities and ecological processes of the land become increasingly important. It highlights the necessity to identify areas that are most friendly to sustainable agricultural activity. As part of the transboundary research project The impact of European agricultural policies on land use: Romania's experience and lessons for the Republic of Moldova in a European perspective – MapLURoMd, this study aims to create a synthetic map for the key study area based on erosion potential of the relief, types of soil and lithology. As a result, an agricultural potential map will be generated that characterizes landscape units according to their relative suitability for agricultural use. This map will be compared with existing land-use data (CORINE 2023) and orthophoto (2016) to evaluate the alignment between landscape suitability and current agricultural practices. The results of this spatial analyse of landscape conditions using GIS technologies in the Southeastern part of the Republic of Moldova will provide valuable insights to inform Moldova's agricultural policy, particularly in the context of optimizing land use in rural areas.

How to cite: Chiriac, I., Cantir, A., Crivova, O., Curcubat, S., Sirodoev, G., Cracu, G.-M., Nicoara, G., Paraschiv, M., Schvab, A., Secareanu, G., Vaidianu, N., and Sirodoev, I.: Assessing and mapping the agricultural potential of landscapes. Case study: Southeastern part of the Republic of Moldova, EGU General Assembly 2026, Vienna, Austria, 3–8 May 2026, EGU26-4883, https://doi.org/10.5194/egusphere-egu26-4883, 2026.

EGU26-5171 | ECS | Orals | SSS6.10

Developing a hybrid green roof: A rooftop solution for wastewater treatment 

Marek Petreje, Razbar Wahab, and Michal Snehota

Urban areas face increasing challenges from climate change, particularly the urban heat island (UHI) effect and water scarcity. Green roofs are effective adaptation measures, but their benefits in terms of cooling decrease during droughts without additional irrigation. Using potable water for irrigation is unsustainable; thus, recycling greywater or pre-treated wastewater represents an ideal alternative. This study presents the Hybrid Green Roof (HGR), an innovative nature-based solution (NBS) that integrates a modular rooftop constructed wetland (CW) with a semi-intensive green roof (GR).

The circular HGR system enables efficient wastewater recycling at the point of origin, reducing potable water consumption while enhancing the cooling effect of vegetation through evapotranspiration of recycled water. The research progressed from elevated experimental plots to a full-scale prototype at the CTU UCEEB (Czech Technical University in Prague, University Centre for Energy Efficient Buildings in Bustehrad). The system architecture consists of mechanically pre-treated wastewater pumped into modular plastic flumes acting as the CW. These modules are filled with lightweight ceramic aggregate and planted with wetland vegetation. Pre-treated water then overflows onto the green roof. The GR utilizes the "reBrick" circular substrate, containing 25% recycled construction waste and 10% pyrolyzed sewage sludge (biochar), significantly reducing its environmental footprint and supplementing fertilization. Water distribution from CW to GR is managed by an outflow module equipped with a pulse dosing system that supplies a hydrophilic mineral wool layer in GR, making water available to plants via capillary forces. For experimental purposes, the green roof is divided into three different sectrors that vary in substrate thickness and vegetation above the mineral wool. The following combinations are being tested: 4 cm of substrate and sedum seedlings; 4 cm of substrate and 3 cm thick grass mats; and 4 cm of substrate with 3 cm thick biodiverse vegetation mats with perennials.

The temperature and humidity are measured in all green roof sectors. A water meter is used to monitor the volume of water flowing into the CW, and the level in the last CW module is monitored to measure the volume of water overflowing from the CW into the GR. This allows the water balance of the system to be calculated.

Long-term monitoring confirmed high stability and efficiency. Chemical analysis showed average pollutant removal efficiencies of 90% for Chemical Oxygen Demand (COD), 99% for Total Nitrogen (TN), and 96% for Total Phosphorus (TP). While the CW provides primary treatment, the green roof layer acts as a crucial tertiary stage, eliminating remaining nutrients without excessive leaching. The HGR is a promising technology for sustainable urban water management, closing both water and material cycles. Ongoing research focuses on optimizing CW flume design to enhance aerobic processes and refining hydraulic parameters to ensure stability under extreme climatic conditions.

How to cite: Petreje, M., Wahab, R., and Snehota, M.: Developing a hybrid green roof: A rooftop solution for wastewater treatment, EGU General Assembly 2026, Vienna, Austria, 3–8 May 2026, EGU26-5171, https://doi.org/10.5194/egusphere-egu26-5171, 2026.

EGU26-5490 | Orals | SSS6.10

Evaluation and compensation system for soils in spatial planning - Bodenwertverfahren 

Barbara Birli, Sigbert Huber, and Ricarda Miller

As soil provides a large range of ecosystem services, it should be of high priority to protect them in the environment. Soil protection faces the challenge of urban sprawl and land take by roads and buildings. Thus, soil protection aims at avoiding or minimizing, or, where this is not possible, mitigating or compensating land take and soil sealing. Furthermore, it is crucial to consider the soil quality in current and future development to avoid the use of high-performance soils. Therefore, the functions and services of soil should be considered in spatial planning.

In order to develop an evaluation tool which allows an assessment of soil destruction as well as proposals for the mitigation and compensation measures the three main topics

i current status of and impact on soil functions,

ii intensity of the modification of the soil by construction and the

iii monetary evaluation of the required compensation

were combined to develop a tool called “Bodenwertverfahren”. While the costs of compensation have to be elaborated in a separate step, the excel-based evaluation tool combines the status of soil functions, evaluation of the intensity of the modification of the soil by construction and the required compensation. In addition, the impact of mitigation measures can be assessed.

The tool can be used for both the evaluation of impacts and the compensation of soil destruction by any infrastructure and may be applied in any planning process such as Strategic and Environmental impact assessment. In future it may provide a basis for inclusion of soil compensation in legal requirements or regulations for spatial planning.

Permanent land use can thus be compensated, e.g. by upgrading degraded soils or by unsealing and restoring soils and soil functions elsewhere. The compensation of soil sealing and soil destruction based on soil functions in cases of unavoidable soil sealing is a significant contribution to the long-term European Union goal to move closer to net-zero land use by 2050.

How to cite: Birli, B., Huber, S., and Miller, R.: Evaluation and compensation system for soils in spatial planning - Bodenwertverfahren, EGU General Assembly 2026, Vienna, Austria, 3–8 May 2026, EGU26-5490, https://doi.org/10.5194/egusphere-egu26-5490, 2026.

EGU26-7993 | Orals | SSS6.10

Rhizosphere engineering for soil carbon sequestration 

Yakov Kuzyakov and Chaoqun Wang

The rhizosphere is the central hotspot of water and nutrient uptake by plants, rhizodeposition, microbial activities, and plant-soil-microbial interactions. The plasticity of plants offers possibilities to engineer the rhizosphere to mitigate climate change. We define rhizosphere engineering as targeted manipulation of plants, soil, microorganisms, and management to shift rhizosphere processes for specific aims [e.g., carbon (C) sequestration]. The rhizosphere components can be engineered by agronomic, physical, chemical, biological, and genomic

approaches. These approaches increase plant productivity with a special focus on C inputs belowground, increase microbial necromass production, protect organic compounds and necromass by aggregation, and decrease C losses. Rhizosphere engineering focus on the accumulation and stabilization of C in the soil either directly or indirectly through: (i) raising root-derived C inputs; (ii) increasing the production of microbial biomass and necromass; and (iii) enhancing C stabilization in the soil. Rhizosphere engineering is crucial to manage rhizodeposition, microbial activities, and plant–soil–microbial interactions, and thus soil C sequestration under global change and human impacts. Finally, we outline multifunctional options for rhizosphere engineering: how to boost C sequestration, increase soil health, and mitigate global change effects.

How to cite: Kuzyakov, Y. and Wang, C.: Rhizosphere engineering for soil carbon sequestration, EGU General Assembly 2026, Vienna, Austria, 3–8 May 2026, EGU26-7993, https://doi.org/10.5194/egusphere-egu26-7993, 2026.

EGU26-8536 | Posters on site | SSS6.10

Development of a Chemical Accident Inverse Tracking Framework for River Systems Using Generative Artificial Intelligence 

Yunchang Heo, Seohun Uhm, Hoseok Ko, Woogyeong Seo, Minkyeong Seong, Jaehoon Yeom, Heewon Jeong, and Kyung Hwa Cho

Accelerating urbanization has made toxic chemical sources in river systems increasingly complex, making their identification and control progressively more challenging. Toxic chemical source tracking is essential for rapid emergency response and effective water quality management. Existing source tracking approaches, such as statistical methods, numerical models, and deep learning, face critical limitations. Statistical methods have limitations in capturing the non-linear transport dynamics and causality of toxic chemicals in river systems. Numerical models require high computational cost and time to achieve high accuracy, while deep learning models suffer from critical data scarcity, as actual toxic chemical accident datasets are limited. This study aims to develop a hybrid framework that combines the high accuracy of numerical models with the computational efficiency of deep learning-based generative artificial intelligence, specifically a Generative Adversarial Network (GAN), enabling near real-time inverse tracking of chemical accidents. To generate training data for the GAN model, we established an automated scenario generation algorithm coupled with the Environmental Fluid Dynamics Code (EFDC), a three-dimensional hydrodynamic and water quality model. For the Geum River basin in South Korea, we conducted EFDC simulations under scenarios varying in source locations, release amounts, and spill timing for phenol, generating a high-quality synthetic dataset. The synthetic dataset is used to train a GAN for inverse problem solving. During training, the Generator learns to map upstream source information to downstream toxic concentration time series, while the Discriminator evaluates whether the generated source-concentration pairs are consistent with EFDC transport mechanisms. In this process, the Generator aims to produce realistic downstream concentration time series to deceive the Discriminator, whereas the Discriminator aims to distinguish these generated outputs from the synthetic training data. Through this adversarial mechanism, the Generator progressively produces more refined downstream concentration time series. In the event of a real chemical accident, the trained GAN model enables rapid inference of the corresponding source information from observed downstream concentrations through inverse problem solving, without the need for iterative numerical simulations. This approach is expected to overcome the limitations of high computational cost in numerical models and data scarcity in deep learning. This rapid inverse tracking framework provides sufficient time to effectively respond to chemical accidents and helps protect critical downstream infrastructure such as drinking water treatment plants from toxic chemicals.

How to cite: Heo, Y., Uhm, S., Ko, H., Seo, W., Seong, M., Yeom, J., Jeong, H., and Cho, K. H.: Development of a Chemical Accident Inverse Tracking Framework for River Systems Using Generative Artificial Intelligence, EGU General Assembly 2026, Vienna, Austria, 3–8 May 2026, EGU26-8536, https://doi.org/10.5194/egusphere-egu26-8536, 2026.

Urban Community Resilience (UCR) refers to the capacity of local communities to respond to and recover from complex urban crises. Green infrastructure (GI) is an infrastructure system that mitigates urban environmental problems and promotes community health. Especially, Small-scale GI can overcome spatial constraints in dense cities and be closely integrated into daily living environments, thereby contributing to the enhancement of UCR. However, despite increasing application, empirical studies evaluating its impacts on resilience remain limited, and GI designs that fail to reflect user needs may act as constraints on strengthening UCR.

This study aims to clarify the relationships between GI and UCR and to derive community-centered design strategies for small-scale GI to enhance UCR. Through a system-based analysis, key variables influencing UCR enhancement are identified, and the perception structures across different community groups are analyzed. Path coefficient analysis is then conducted to verify the significance of perception-change pathways for each group. Finally, perception gaps across stakeholder groups are comparatively analyzed to derive integrated design strategies.

This study focuses on the “72-Hour Urban Regeneration Project,” a citizen-participatory initiative in which small-scale GI is designed and constructed through public engagement and examines perception differences between designer and user groups. The analysis proceeds in three stages. First, a Causal Loop Diagram (CLD) is constructed based on indicators derived from previous studies to identify key variables and feedback structures between GI and UCR, and PLS-SEM models are developed for each community group based on these key variables. Second, path coefficients are estimated and their statistical significance is tested using group-specific survey data. Third, significant perception pathways are compared and analyzed to derive design strategies for small-scale GI implementation.

The analysis results indicate that GI improves quality of life through environmental benefits and enhances UCR by expanding social capital through community participation and network formation. Especially, place attachment was identified as a pivotal mediating variable that fosters emotional bonds through satisfaction with place-based experiences and encourages sustained participation, thereby continuously strengthening UCR. Based on the survey results, path coefficient analysis showed that GI experience enhanced UCR in both groups; however, differences in participation patterns and levels of temporal exposure led to variations in the significance of relationships among variables. While designers’ experiences in creating GI spaces induced place attachment and strengthened participation, users with intermittent exposure lacked sustained social interactions, which weakened pathways from attachment to participation due to a lack of social connections, which limited the enhancement of UCR. Therefore, the results indicate the need for design strategies that encourage repeated experiences and sustained visitation by users.

This study identified perception differences between designers and users in a Seoul-based public project and structurally analyzed relationships among key variables to derive small-scale GI design strategies for enhancing UCR. Perception gaps between groups arise from differences in use patterns, time exposure, and related factors, indicating the potential for unmet user needs. Therefore, this study emphasizes the necessity of establishing design strategies that address user demands, promote continuous participation, and ultimately contribute to strengthening UCR.

How to cite: Cho, D., Bi, J., and Lee, J.: Bridging the Perception Gap: Enhancing Urban Community Resiliencethrough Small-Scale Green Infrastructure Design in Seoul, EGU General Assembly 2026, Vienna, Austria, 3–8 May 2026, EGU26-8594, https://doi.org/10.5194/egusphere-egu26-8594, 2026.

EGU26-9722 | Orals | SSS6.10

A co-developed model policy for integrating soil sustainability into local planning in England 

Jess Davies, Mirian Calvo, John Quinton, Susanna Dart, Paul Hatch, and Birgit Höntzsch

The role of soils in underpinning healthy and resilient urban environments is often overlooked during the planning and construction process. Recognising soils as living systems and finite, non-renewable resources – rather than merely construction substrates or material to be disposed of – is essential for climate resilience, biodiversity and environmental health, and community well-being. Achieving this requires that soil considerations are holistically embedded from the outset of spatial and urban planning, shaping how places, spaces, and buildings are designed, delivered, and managed.

In the UK, Local Planning Authorities (LPAs) are well placed to lead this change. Through their local plans, LPAs can emphasise the importance of good soil management and give clear direction for how soils should be protected and managed throughout the development lifecycle, from design to long-term use. In practice, however, soils remain weakly represented in planning policy. Addressing this gap requires the integration of soil science with planning expertise and the practical knowledge of the diverse actors who interact with soils during development.

Building on the work of the UK’s cross-sector Soils in Planning and Construction Task Force, the Local Soils Project, led by Lancaster University in collaboration with Lancaster City Council and Cornwall Council, to make soil sustainability an integral part of the English planning system. The project co-developed a model soil planning policy to support LPAs across England in embedding soil protection, enhancement, and management within policy frameworks and decision-making.

Through extensive cross-sector engagement and participatory design involving over 50 experts from national and local government, development and construction, environmental organisations, and soil science, the project produced a practical and implementable model policy. The resulting approach reflects both the scientific significance of soils and the institutional and operational realities of local planning.

This contribution presents key elements of the Local Soils Model Policy, outlines the interdisciplinary co-design process, and shares insights from this UK-based initiative that may be relevant to planners, policymakers, and researchers working in other European planning contexts where similar challenges around soil governance and urban development exist.


To access the model policy please visit our website: https://www.soilstaskforce.com/reports

How to cite: Davies, J., Calvo, M., Quinton, J., Dart, S., Hatch, P., and Höntzsch, B.: A co-developed model policy for integrating soil sustainability into local planning in England, EGU General Assembly 2026, Vienna, Austria, 3–8 May 2026, EGU26-9722, https://doi.org/10.5194/egusphere-egu26-9722, 2026.

EGU26-10781 | ECS | Posters on site | SSS6.10

Integrated GIS- and multicriteria-based methodology for siting municipal solid waste landfills: application to Riobamba (Ecuador) 

Laura Valeria Banda Jorge, María-Elena Rodrigo-Clavero, Claudia-Patricia Romero-Hernández, and Javier Rodrigo-Ilarri

Municipal solid waste management is a major challenge for spatial planning due to its links with population growth, changing consumption patterns, and associated environmental impacts. In settings where final disposal remains a structural component of the system, the limited capacity of existing sites and their proximity to end-of-life make it necessary to plan new alternatives. In this context, landfill siting is critical to minimize risks to soils and water resources, reduce social impacts, and ensure operational and economic feasibility.

This work develops and applies an integrated, adaptable, and replicable methodology based on Geographic Information Systems (GIS) and multicriteria analysis for selecting landfill sites using technical, environmental, and territorial criteria. The approach is applied to the city of Riobamba (Ecuador), a high-mountain Andean environment characterized by strong physical–environmental heterogeneity, where planning requires traceable and consistent technical support, particularly to avoid locating facilities in areas vulnerable from edaphic and hydrological perspectives.

The methodology is structured in four stages: (i) compilation of geographic information from local and global sources; (ii) processing, cleaning, reprojection, and standardization of layers to ensure spatial consistency; (iii) definition and classification of exclusion and inclusion criteria into categories and subcategories, incorporating a critical review based on regulations and the characteristics of the study area; and (iv) multicriteria evaluation through weight assignment to produce a suitability map and prioritize the most favorable areas.

The outcome is a transferable methodology that provides technical traceability to the selection process and can be adjusted to different territorial conditions and data availability. It is intended as a decision-support tool for spatial design and planning focused on soil and water protection, contributing to more transparent decision-making in integrated solid waste management.

How to cite: Banda Jorge, L. V., Rodrigo-Clavero, M.-E., Romero-Hernández, C.-P., and Rodrigo-Ilarri, J.: Integrated GIS- and multicriteria-based methodology for siting municipal solid waste landfills: application to Riobamba (Ecuador), EGU General Assembly 2026, Vienna, Austria, 3–8 May 2026, EGU26-10781, https://doi.org/10.5194/egusphere-egu26-10781, 2026.

This study presents a five-year experimental investigation conducted within the Horizon Europe project NBSINFRA on a bioretention cell located at the University Centre for Energy Efficient Buildings of the Czech Technica University in Prague. The system was constructed as a multilayer system comprising a biofilter layer, a sand layer, and a drainage layer, and planted with perennial vegetation (Aster novae-angliae, Hemerocallis, Molinia caerulea and Eupatorium 'Phantom'). The biofilter consisted of 50% sand, 30% compost, and 20% topsoil. The bioretention cell was connected to roof of neighboring building and hydraulically isolated from the surrounding soil using a waterproof membrane to allow for water balance monitoring and equipped with a set of monitoring sensors. Soil water content within the biofilter was measured using four Time Domain Reflectometry (TDR) probes, while five tensiometers were installed to record soil water potential. Outflow from the bioretention cell was measured by a tipping-bucket flowmeter, and inflow was estimated from precipitation using a rain gauge.

Over the five-year monitoring period, the study analysed water balance, biofilter water regime, and vegetation development to investigate their influence on water retention and detention in the bioretention cell. Rainfall–runoff episodes were analysed individually to quantify changes in episodic runoff coefficients, peak flow reduction, and runoff delay, and a semi-quantitative approach was applied to assess the effect of inter-annual vegetation development on evapotranspiration. Hydrological modelling was performed using two-dimensional simulations in HYDRUS 2D/3D, solving the Richards equation for variably saturated flow. The model represented vertical water flow through the multilayer bioretention profile, including infiltration from roof inflow and direct precipitation, drainage outflow, evapotranspiration, and root water uptake with a time-evolving root zone. Simulations focused on three representative 14-day study periods in August 2019, 2020, and 2023, selected to ensure comparable initial conditions and vegetation states. Model calibration and evaluation were based on measured outflow and pressure head dynamics. Parameter sensitivity was assessed using an informal Bayesian framework (GLUE) combined with Latin Hypercube Sampling, focusing on soil hydraulic parameters of the biofilter and sand layers.

The results showed a gradual decrease in the episodic and annual runoff coefficient over time, mainly driven by increasing inter-annual evapotranspiration and lower initial biofilter saturation at the beginning of rainfall events. Peak flow reduction ranged from 30% to 100%, with a median value of 88%, while runoff and peak runoff delays exhibited median values of approximately 30 and 56 minutes, respectively, with increasing variability in later years. Hydrological modelling and sensitivity analysis identified the saturated hydraulic conductivity of the sand layer and the van Genuchten parameter of the soil water retention curve n of the biofilter as the most influential parameters. Simulation results further indicated a decline in saturated hydraulic conductivity in both the biofilter and sand layers with the aging of the bioretention system. However, these changes did not impair the overall hydrological performance of the bioretention cell.

How to cite: Maresova, P. and Snehota, M.: Five years evolution of hydraulic properties of engineered soil of experimental bioretention cell planted with perennials, EGU General Assembly 2026, Vienna, Austria, 3–8 May 2026, EGU26-10861, https://doi.org/10.5194/egusphere-egu26-10861, 2026.

EGU26-11065 | ECS | Posters on site | SSS6.10

Thermal and Water Regimes of Soils of Urban Nature-Based Solutions in Central European Context 

Pavlína Žatecká, Licia Felicioni, Petra Marešová, Marek Petreje, and Michal Sněhota

Nature-based solutions (NbS), particularly engineered urban green infrastructure systems, increasingly represent a key pathway for enhancing urban and landscape resilience to climate change by addressing heatwaves, flooding, and water stress. Their effectiveness, however, strongly depends on soil hydraulic properties, and soil–water–vegetation interactions. This contribution presents an integrated case study from the Prague City Lab within the Horizon Europe project NBSINFRA, focusing on the role of engineered soils and long-term soil monitoring in the performance of NbS under real urban conditions.

The Prague City Lab consists of three contrasting urban sites representing peri-urban, dense inner-city, and community-oriented environments. Implemented NbS include extensive and ultra-thin green roofs, hybrid green roof–constructed wetland systems, and bioretention cells designed with engineered soil profiles. These systems incorporate layered substrates with controlled grain size distribution, organic amendments, mineral components, and recycled materials to optimize water retention, infiltration, and thermal performance. Climate analyses identified extreme heat and heatwaves as the dominant hazards affecting all sites, with intense rainfall events representing an additional stressor for urban drainage systems.

The methodological approach combines soil engineering principles, hydrological monitoring, and ecological assessment, with monitoring intensity tailored to the type of NbS. Bioretention cells and hybrid systems are instrumented for detailed observation, including near-surface and substrate temperatures, soil moisture, and water balance components. In contrast, green roofs and other NbS are monitored at a basic level using standalone automated sensors to capture substrate and near-surface temperature and water content. Laboratory analyses of substrate properties, including retention curves and grain size distribution, complement in situ measurements. Soil–water–plant interactions are further evaluated through long-term observation of plant development and evapotranspiration effects. In parallel, systematic vegetation surveys document plant species composition and ecological roles across green roofs and ground-level NbS. All datasets are stored in a centralized database, enabling consistent analysis and the development of resilience indicators.

Overall, the Prague City Lab demonstrates how integrating soil engineering principles with NbS design contributes to the resilience of urban green infrastructure.

How to cite: Žatecká, P., Felicioni, L., Marešová, P., Petreje, M., and Sněhota, M.: Thermal and Water Regimes of Soils of Urban Nature-Based Solutions in Central European Context, EGU General Assembly 2026, Vienna, Austria, 3–8 May 2026, EGU26-11065, https://doi.org/10.5194/egusphere-egu26-11065, 2026.

EGU26-11384 | ECS | Posters on site | SSS6.10

Post-fire erosion control: monitoring the effects of soil bioengineering techniques 

Annunziata Fiore, Giovanni Romano, Miriam Chiarulli, Francesco Vito Ronco, Giovanni Francesco Ricci, and Francesco Gentile

Forest fires significantly increase susceptibility to soil erosion, primarily due to the loss of vegetation cover and alterations in soil hydrophysical properties, including reduced infiltration capacity and increased surface runoff. The processes that occur can have significant economic, ecological and socio-cultural impacts. Mediterranean environments are particularly susceptible to erosion due to the combination of climatic, pedological, and geomorphological factors, including rainfall patterns, soil physical and structural characteristics, land use, topography, and fire occurrence. Furthermore, the climate change scenarios currently in place are set to accentuate erosion rates in areas affected by fires. In this context, soil bioengineering interventions represent effective low environmental impact mitigation strategies for the reduction of post-fire erosive processes.

The study aims to understand the effects of post-fire through the application of targeted intervention strategies such as soil bioengineering techniques. This study allows to explore deeper into the effects of carrying out a pilot soil bioengineering intervention within the 1900-hectare wooded area “Bosco Difesa Grande” located in Gravina in Puglia (Bari, Italy), where a fire of 1170 hectares was recorded on 12/08/2017, and to analyze the restoration of the soil development capacity of some selected species. Between 2022 and 2023, interventions were carried out in two equally sized areas located along slopes with the same general conditions (slope, soil type, fire severity), except for exposure. Various works were carried out, such as the construction of a trellis, the removal of weeds, the construction of palisades and wattles, and the planting of native shrubs and tree species.

A monitoring plan was planned, through field activities during which counts of surviving live plants were carried out, and using satellite imagery to assess the average NDVI of the area, to understand the effects of the soil bioengineering interventions carried out. Two years later, the two areas have recorded different results: in area 1, the survival rate has reached approximately 87%, while in area 2, spontaneous plants have a very intense development that prevents the correct development of project plants. Regarding NDVI values, a mean increase was detected in both areas.

How to cite: Fiore, A., Romano, G., Chiarulli, M., Ronco, F. V., Ricci, G. F., and Gentile, F.: Post-fire erosion control: monitoring the effects of soil bioengineering techniques, EGU General Assembly 2026, Vienna, Austria, 3–8 May 2026, EGU26-11384, https://doi.org/10.5194/egusphere-egu26-11384, 2026.

EGU26-14635 | ECS | Posters on site | SSS6.10

Review study of current soil assessment tools and methods with a potential of integration in spatial planning in EU 

Teodora Todorcic Vekic, Yevheniya Volchko, and Jenny Norrman and the SPADES project consortium

Abstract

Achieving the EU’s soil health targets by 2050 requires bridging the gap between planners and soil experts through better use of existing soil inventories and decision-support tools. While planners and soil experts in most countries employ GIS-based platforms and national soil databases, challenges persist, including fragmented and outdated data, limited access to high-resolution information, and tools requiring specialised expertise.

This study reviews existing soil assessment tools and methods across multiple European countries, including those from the SPADES consortium (Sweden, France, the Netherlands, Belgium, Germany, Austria, Italy, Slovenia, Hungary, Romania). The aim is to identify current practices, gaps, and priorities to ensure a better integration of soil in planning. Data on soil assessment tools and methods currently used by soil experts and/or planners in their practices were collected through series of interviews, workshops and surveys of consortium members and relevant actors to build a large inventory.

The results show a lack of integrated, user-friendly solutions that consolidate dispersed datasets, for simplified interpretation for non-specialists, and for embedded soil considerations into planning and governance frameworks. Key priorities include centralised GIS-based soil databases, parcel-level screening tools, decision-support systems for ecological transition, and dashboards for awareness-raising among officials and the public. To address soil and planning challenges—such as climate adaptation, biodiversity, and land take including soil sealing, the study proposes a systematised portfolio of existing soil instruments to guide planners, policymakers, and land managers in sustainable soil-inclusive practices from strategic to operation.

This portfolio will be made available to SPADES pilots, and further adapted to generic user needs through an online webtool called Navigator, fostering mutual capacity building between planners and soil experts. Ultimately, these efforts aim to improve soil literacy, support the provision of the soil ecosystem services, and enable the transition toward soil-inclusive spatial planning, contributing to EU sustainability and Soil Mission objectives.

Keywords: soil assessment, spatial planning, data, decision-support

How to cite: Todorcic Vekic, T., Volchko, Y., and Norrman, J. and the SPADES project consortium: Review study of current soil assessment tools and methods with a potential of integration in spatial planning in EU, EGU General Assembly 2026, Vienna, Austria, 3–8 May 2026, EGU26-14635, https://doi.org/10.5194/egusphere-egu26-14635, 2026.

EGU26-15968 | ECS | Posters on site | SSS6.10

A 3D Planting Structure-Based Scenario Strategy to Mitigate Seasonal Instability of Urban Green Phenology and Gaps in Pollination Functions 

Soohyun Lee, Yeahyun Jin, Doyun Kim, Yerin Shin, Daehee Cho, and Junga Lee

Honeybees are widely recognized as representative pollinator species due to their high pollination efficiency and frequent visitation. However, climate warming intensifies temporal mismatches between plant flowering and insect activity, resulting in seasonal resource gaps for foragers and weakened ecological networks. Urban landscape, in contrast, can provide substantial opportunities to create habitats and movement corridors through strategic planting and adaptive management.

This research proposes a node-based urban planting scenario framework to reduce seasonal phenological asynchrony and evaluate outcomes across micro- and macro-scale. Unlike previous studies that have assessed habitat suitability primarily based on the presence or area of green spaces, we focus on habitat usability for pollinators by explicitly considering (i) continuity of flowering resources and (ii) multidimensional planting structures with vertical, horizontal, and temporal differentiation. We further examine how these planting strategies can co-deliver microclimatic regulation and broader landscape-scale ecosystem service outcomes.

This case study targets on Eunpyeong-gu and Mapo-gu in Seoul, South Korea, where forest, urban, and river systems are spatially continuous but are not effectively functioning as habitats or movement corridors. Using GIS, we identify key patches that can support movement and seasonal functional turnover; these patches are treated as nodes and assembled into a connectivity network. Planting strategies are then designed along three dimensions: (1) vertical multilayer vegetation to diversify strata and microhabitats, (2) horizontal linear/areal expansion to improve stepping-stone connectivity, and (3) temporal phenology-based planting to extend flowering continuity. Strategies are applied to forest-, urban-, and river-type patches. Microclimatic effects are simulated using ENVI-met, while landscape-scale functional connectivity and ecosystem service implications are assessed using InVEST.

Patches were selected by considering honeybee flight range, inter-patch distance and size, and the seasonal distribution of flowering plants. Among typology-specific planting strategies, forest-type patches benefited from vertical planting, which enhanced understory flowering and provided refuge for survival. Urban small-scale plantings showed high pollination efficiency, but high impervious surfaces necessitated securing horizontal connectivity essential for addressing seasonal asynchrony. In river-type patches, continuous buffer planting enhanced mobility, while connectivity with adjacent ground-level green spaces remained a critical consideration. Macro-scale scenario analysis showed that integrating typology-specific optimal planting strategies strengthened the connectivity index by increasing mobility and access to alternative resources across the forest–urban–river continuum, beyond alleviating micro-scale food gaps. These outcomes have implications not only for managed honeybees but also for broader pollinator communities that depend on temporally continuous floral resources.

Overall, this research redefines honeybee habitat conservation from a multi-scale spatial organization perspective that incorporates behavioral characteristics and temporal resource use. The proposed framework explicitly links phenological gaps to landscape connectivity—rather than green space extent—offering a transferable NbS-informed approach for designing urban green networks that stabilize seasonal resources while supporting co-benefits.

Following are results of a study on the "Convergence and Open Sharing System" Project, supported by the Ministry of Education and National Research Foundation of Korea

How to cite: Lee, S., Jin, Y., Kim, D., Shin, Y., Cho, D., and Lee, J.: A 3D Planting Structure-Based Scenario Strategy to Mitigate Seasonal Instability of Urban Green Phenology and Gaps in Pollination Functions, EGU General Assembly 2026, Vienna, Austria, 3–8 May 2026, EGU26-15968, https://doi.org/10.5194/egusphere-egu26-15968, 2026.

EGU26-16542 | Orals | SSS6.10

Examples of spatial digital information on soil for urban planning 

Cecile Le Guern, Flora Lucassou, Amazigh Ouaksel, Simon Gautier, and Blandine Clozel

Soil provides many ecosystem services like the regulation of climate and water cycle. It supports biodiversity but also human activities. In urban areas, soils are often sealed, thus affecting their health. In order to preserve natural, agricultural, and forest soils, the Europe's 'No Net Land Take' (NNLT) policy aims to limit artificialisation. The transcription of this target in the French regulation is based on soil functioning, promoting its integration in planning documents. The poor knowledge on urban soils is however a gap. The following examples on soil infiltration, multifunctionality and pollution from western France illustrate the possibility to build spatial knowledge on the basis of existing data.

Soil infiltration capacity may be assessed in different ways (Lucassou et al., 2025). The Phoebus method considers various parameters such as the relative permeability of pedogeological units, clay content, hydromorphism and the depth of the groundwater table. Its application on Nantes Metropolis and Rennes Metropolis provided maps used to build some urban planning rules regarding rainwater management to reduce flooding linked to runoff. It is also used to elaborate desealing or renaturation strategies, or as an input to soil multifunctionality.

Adaptation of the French MUSE method (Branchu et al., 2021) carried out within the DESIVILLE and QUASOZAN projects allow the assessment of urban soil multifunctionality. The biodiversity and carbon storage capacities are based on correlations with land uses available at a national and pedoclimatic scale, respectively. The soil infiltration capacity is based on the Phoebus method. The agronomic potential of soils is based on the regional soil map and associated soil characteristics stored in a national database. In urban areas with no soil maps, this function s assessed in a qualitative way. The assessed soil multifunctionality map, obtained by crossing the four soil function indices, helped Nantes Métropole to update the areas identified in the urban planning zoning as open to urbanisation. Soil multifunctionality improvement is also considered as a benefit of desealing (DESIVILLE, PERMEPOLIS). Rennes Metropolis is testing its integration in a tool helping to build urban planning strategies achieving No Net Land Take and Land Degradation Neutrality (LDN) together.   

Mapping soil pollution hazards carried (DESIVILLE, QUASOZAN) considers various potential sources of pollution like former industrial activities, anthropogenic deposits, and agricultural activities. Further methodological developments on anthropogenic deposits mapping are in progress (PERMEPOLIS). Soil pollution hazard map is used as an informative layer to alert on pollution pressure, for desealing scenarios by Nantes Métropole or for NNLT and LDN urban planning scenarios by Rennes Métropole. The pedogeochemical background, in progress on Nantes Métropole territory (NEO-SOLOCAL) based on soil analyses, is going to give information on diffuse contamination.

Even if the knowledge on urban soils is limited, some GIS layers may be produced to raise awareness on soils and identify problem areas where more precise knowledge is needed. The banking of soil data is necessary to build a common and shared knowledge on soils. Better urban subsurface knowledge is also essential to build a more precise knowledge on urban soils.  

How to cite: Le Guern, C., Lucassou, F., Ouaksel, A., Gautier, S., and Clozel, B.: Examples of spatial digital information on soil for urban planning, EGU General Assembly 2026, Vienna, Austria, 3–8 May 2026, EGU26-16542, https://doi.org/10.5194/egusphere-egu26-16542, 2026.

In the face of increasing climate hazards and the growing complexity of urban environments, soils emerge as a key interface between water, vegetation, infrastructure and human uses. Their role goes far beyond that of a simple support: soils condition hydrological functioning, environmental quality, the adaptive capacity of developed spaces, and the long-term sustainability of projects. Yet, in many urban and peri-urban contexts, soils remain insufficiently integrated into design and management processes.

This presentation will present feedback from scientists and engineers involved in urban development, regeneration and environmental management projects. Drawing on several concrete case studies, it illustrates how an integrated diagnostic approach to soils, water and land use can guide the design of more resilient projects, from the planning stage through to operational implementation.

The examples cover a wide range of situations: the rehabilitation of degraded or contaminated soils, the creation of engineered soils from secondary materials, integrated stormwater management using vegetated systems, and the design of growing media capable of functioning sustainably under high urban constraints. These projects demonstrate how operational choices based on the physical, chemical and biological properties of soils can simultaneously address issues of water management, environmental quality and ecological functionality.

Particular attention is given to the way these parameters are translated into operational design criteria: infiltration and storage targets, the ability of soils to filter or immobilize contaminants, their capacity to support diverse vegetation, and their compatibility with structural and use-related constraints. The monitoring and evaluation methods implemented to verify the long-term performance of these systems are also discussed.

By offering a cross-cutting perspective on the role of soils in urban projects, this contribution aims to show how soil engineering and nature-based solutions can be integrated in a coherent and pragmatic way into real-world operations, and how these approaches help to build more adaptive, functional and resilient urban landscapes.

How to cite: Elfarricha, S. and Plassart, G.: Operational integration of soil engineering and nature-based solutions in urban environments: feedback from an engineering consultancy, EGU General Assembly 2026, Vienna, Austria, 3–8 May 2026, EGU26-16774, https://doi.org/10.5194/egusphere-egu26-16774, 2026.

EGU26-17180 | ECS | Posters on site | SSS6.10

Effects of biochar and irrigation on greenhouse gas exchange in hemiboreal urban green areas 

Veera Bilaletdin, Liisa Kulmala, Esko Karvinen, Vertti Perttilä, Aino Tiainen, Hermanni Aaltonen, Kaisa Rissanen, Jesse Soininen, and Leena Järvi

As cities worldwide pursue carbon neutrality, developing a comprehensive understanding of the contributions of urban vegetated areas to climate change mitigation is required. Significant knowledge gaps remain regarding the full range of urban biogenic greenhouse gas (GHG) dynamics, particularly concerning GHGs other than carbon dioxide (CO2) and the possibly crucial role of urban soils. Existing studies suggest that urban soils often exhibit higher respiration rates, increased nitrous oxide (N2O) emissions and reduced methane (CH4) uptake compared to natural ecosystems. This study investigates how irrigation practices and biochar amendment influence soil GHG fluxes in urban lawns and tree growing media, and examines the potential impacts of biochar on tree growth and leaf-level CO2 exchange. Ultimately, we aim to provide information on whether sensible use of irrigation and biochar could help to enhance the climate change mitigation potential of urban green areas.

The study is based on a measurement campaign using manual dark chambers to quantify soil CO2, CH4 and N2O fluxes and leaf CO2 exchange measurements made in Helsinki, Finland, in summer 2025. Irrigation impacts on urban lawn GHG exchange were studied on 10 controlled, non-fertilized plots located along a footpath in Kumpula botanic garden. Half of the plots were irrigated weekly, while the other half functioned as unirrigated controls. Flux measurements were complemented with manual and automatic measurements of soil moisture and temperature. To provide a comparison with less managed vegetation, a nearby meadow was also measured using the same protocol without irrigation. Effects of biochar on soil and tree GHG exchange were investigated in an urban park in Eastern Helsinki, where trees planted in 2023 grow in standardized growing media. First half of the trees received biochar at planting, while the other half served as controls. Soil and leaf GHG fluxes were measured alongside with soil moisture, temperature and tree health assessments.

While data analysis for the summer 2025 measurements is still ongoing, preliminary results indicated a significant reduction in CH4 uptake under irrigation. CO2 and N2O showed no consistent response, with especially N2O fluxes exhibiting high variability across plots and measurement days. In the biochar experiment, biochar appeared to suppress the largest N2O flux events from soil, but no significant effects on CO2 and CH4 fluxes were detected. CH4 fluxes showed pronounced spatial variability across the study site. While most plots acted as CH4 sinks, one section of the park exhibited notable emissions, possibly reflecting local anoxic conditions in the soil. As part of the ongoing analysis, net soil GHG balances for the studied vegetation types, expressed as CO2 equivalents, will be calculated for the measurement period to provide an integrated assessment of their climatic impacts.

How to cite: Bilaletdin, V., Kulmala, L., Karvinen, E., Perttilä, V., Tiainen, A., Aaltonen, H., Rissanen, K., Soininen, J., and Järvi, L.: Effects of biochar and irrigation on greenhouse gas exchange in hemiboreal urban green areas, EGU General Assembly 2026, Vienna, Austria, 3–8 May 2026, EGU26-17180, https://doi.org/10.5194/egusphere-egu26-17180, 2026.

EGU26-18580 | Posters on site | SSS6.10

Constructed Technosols for Green Roofs: Quantifying Infiltration Dynamics and Flow Pathways with Bimodal Neutron–X-ray Tomography 

Michal Snehota, Anders Kaestner, and Vladimira Jelinkova

Extensive green roofs are widely implemented as nature-based solutions (NBS) to improve urban and landscape resilience by reducing runoff peaks, moderating urban heat, and supporting biodiversity. A key, yet often under-characterized, component of green roof performance is the growing media layer - Constructed Technosol that regulates infiltration, storage, and drainage. After installation, early pedogenesis and substrate ageing—driven by physical re-organization, chemical weathering, root activity, and organic matter turnover—progressively modify pore architecture and hydraulic functioning. These changes can alter flow paths, and overall stormwater retention, with direct implications for performance, maintenance strategies, and long-term service delivery of green roof NBS.

Here we investigate how substrate ageing modifies infiltration processes and flow pathways in constructed Technosols using non-invasive, bimodal 3D imaging that combines neutron and X-ray tomography. “Virgin” packed substrates represent the initial engineered state immediately after installation, while “aged” substrates were sampled after multiple seasons of outdoor exposure under vegetation. Neutron tomography, evaluated using black-body correction, provides strong contrast for hydrogen-rich constituents, enabling visualization of dynamic water redistribution as well as organic matter-related features. Complementary X-ray tomography resolves the mineral solid phase at high spatial resolution. Through 3D image registration and data fusion, we quantify ageing-induced changes in structure and composition and directly relate them to time-resolved infiltration behavior.

Two designed Technosols differing in particle-size distribution and organic matter content are studied to represent contrasting engineering strategies. Vegetated samples (dominated by Sedum spp.) are subjected to controlled drip irrigation while being repeatedly imaged to capture wetting front progression. Advanced processing workflows (noise reduction, artefact mitigation, multimodal registration, and sequential alignment of neutron time series to an X-ray reference),  analysis of infiltration, and pore system geometry changes.

How to cite: Snehota, M., Kaestner, A., and Jelinkova, V.: Constructed Technosols for Green Roofs: Quantifying Infiltration Dynamics and Flow Pathways with Bimodal Neutron–X-ray Tomography, EGU General Assembly 2026, Vienna, Austria, 3–8 May 2026, EGU26-18580, https://doi.org/10.5194/egusphere-egu26-18580, 2026.

Climate change is no longer about single hazards—it is about compound disasters that escalate through interlinked shocks and delays in recovery. These risks do not distribute randomly, but concentrate persistently in certain places and among vulnerable groups. This keynote argues that compound disasters must be understood not as isolated events, but as a structural process shaped by coupled long-term pressures and short-term pulses.

To unpack this, I use the press–pulse disturbance framework: chronic pressures like urbanization, loss of ecological function, and impervious surface expansion gradually shift system states, while acute shocks like heatwaves or floods convert these vulnerabilities into real damage. Critically, these interactions are not linear—pressures amplify shock impacts, and shocks reshape the very systems that buffer or propagate the next disaster. However, explaining this mechanism is not enough for action. To move from diagnosis to implementation, we need a planning-oriented logic that translates drivers, system conditions, and intervention options into concrete spatial choices—this is where the PSR framework becomes essential.

Through a Pressure–State–Response (PSR) lens, I propose a systems approach that connects risk drivers, system conditions, and intervention points. Here, Nature-based Solutions (NbS) are reframed not as surface-level greening, but as spatial tools that weaken amplification loops, change system trajectories, and accelerate recovery. PSR allows for actionable diagnosis: identifying where and how to intervene, and what type of NbS strategy will be most effective.

The keynote presents empirical cases across multiple hazards:

             •            Heatwaves show why thermal risk clusters spatially, and how specific NbS configurations reduce exposure.

             •            Urban flooding reveals how land-cover shifts and disrupted hydrology amplify risk—and how spatially connected NbS networks restore regulation.

             •            Wildfire cases highlight cross-boundary escalation and how spatial design can transform spread and recovery dynamics.

             •            Biodiversity & ecosystem function are revealed not as side benefits, but as structural determinants of resilience.

Together, these cases clarify both the mechanisms and the spatial leverage points; translating them into action requires a decision framework.

Decision-support tools—such as scenario modeling, hotspot mapping, and land-use optimization—translate systems analysis into grounded policy options. Across these examples, resilience emerges not from single interventions, but from reconfiguring feedbacks: robustness via regulating functions, redundancy through distributed networks, resourcefulness via multifunctional design, and rapidity through faster recovery paths.

In sum, this keynote presents a new logic for addressing compound disasters: not just what we should do, but why systems respond the way they do, and how spatial NbS strategies can intervene in those dynamics. Moving from reactive planning to anticipatory systems thinking is not only urgent—it is possible.

How to cite: Lee, J.: Why Do Compound Disasters Keep Recurring?Structural Diagnosis and Spatial Strategies via Systems Analysis and Nature-Based Solutions, EGU General Assembly 2026, Vienna, Austria, 3–8 May 2026, EGU26-18711, https://doi.org/10.5194/egusphere-egu26-18711, 2026.

EGU26-22486 | Orals | SSS6.10

Unlocking Subsurface Potentials: Geosystem Services for More Informed and Sustainable Planning 

Jenny Norrman, Emrik Lundin Frisk, Anja Gustafsson, Paula Lindgren, Lorena Melgaço, Fredrik Mossmark, Olof Taromi Sandström, Victoria Svahn, Tore Söderqvist, Yevheniya Volchko, and Maria de Lourdes Melo Zurita

Soils and subsoils provide essential functions that underpin land uses across agriculture, forestry, nature conservation, and urban development. Much like topsoil, deeper subsurface layers and other geological resources remain largely invisible in planning and design practice, despite their
growing importance for climate adaptation, water management, energy systems, and underground infrastructure. The concept of geosystem services (GS) offers a way to broaden the perspective from surface soils to the full geophysical environment—encompassing soil, subsoil, sediment, and bedrock—and to articulate how these layers collectively support societal needs. GS thereby complements soil-based ecosystem service frameworks by revealing additional regulating, provisioning, and supporting functions that become critical as societies make increasing use of the subsurface.
This contribution synthesises insights from three Swedish applications of GS in municipal planning. In Malmö, GS potentials were mapped using an indicator-based methodology to support climate resilience strategies. The resulting maps visualised potentials for stormwater infiltration and retention, shallow geo-energy use, groundwater regulation, and the availability of subsurface space. Planners found that the GS maps improved communication across disciplines and helped make “hidden” subsurface capacities visible in early decision making.
In Askersund, GS potential mapping was adapted to a rural comprehensive planning context. Five services—stormwater infiltration and retention, groundwater provision, bearing capacity, erosion resistance, and provision of construction material—were evaluated with local planners. The maps were found to be useful overview tools, revealing subsurface opportunities and constraints beyond what conventional soil or land use data captures, but need further refinement to become products that can be used as a standard tool.
In Gothenburg, a checklist of GS informed a comparative assessment of three alternative tunnel corridor reservations by systematically identifying impacts on subsurface resources, risks, and long-term potentials. This demonstrated how applying the concept of GS, even in a very simplistic manner by using checklists and expert assessments, can help avoid unintended trade-offs in large infrastructure projects through early subsurface consideration.
Across the cases, the concept of GS offered a unifying language and practical tools for integrating soil, subsoil, and deeper geological functions and services into spatial planning—supporting more informed land use decisions, and spatial development that avoids shifting problems across areas, generations, or functions.


How to cite: Norrman, J., Lundin Frisk, E., Gustafsson, A., Lindgren, P., Melgaço, L., Mossmark, F., Taromi Sandström, O., Svahn, V., Söderqvist, T., Volchko, Y., and de Lourdes Melo Zurita, M.: Unlocking Subsurface Potentials: Geosystem Services for More Informed and Sustainable Planning, EGU General Assembly 2026, Vienna, Austria, 3–8 May 2026, EGU26-22486, https://doi.org/10.5194/egusphere-egu26-22486, 2026.

EGU26-22749 | Posters on site | SSS6.10

Speeding up early pedogenetic processes in constructed Technosols with organic matter enrichment 

Thomas Lerch, Maha Deeb, Manuel Blouin, Anne Pando, and Michel Grimaldi

Constructed soils (Technosols) produced from waste materials offer a sustainable alternative to landfill disposal while supporting vegetation and ecosystem services, without relying on topsoil extracted from natural areas. Research in pedological engineering aims to design functional soils through the recycling of low-value materials, thereby contributing to a circular economy in urban environments. One poorly documented aspect of Technosol pedogenesis is the short-term impact of mixing parent materials with contrasting properties, which can trigger rapid soil formation processes within months—much faster than the years or centuries required for natural soils. This characteristic makes Technosols valuable experimental models for investigating pedogenic processes on time scales compatible with human observation. In this study, we examined how the properties and interactions of two parent materials—excavated deep soil horizons (EM) and green waste compost (GWC)—influence the rate of early pedogenetic processes. We hypothesised that increasing organic matter inputs through GWC addition would accelerate the physical, chemical, and biological processes leading to soil formation. To test this hypothesis, six EM/GWC mixtures (0–50% GWC, w/w) were incubated in mesocosms under controlled conditions for 21 weeks and subjected to repeated wet–dry cycles. Pedogenetic changes were assessed using chemical (C, N, available P, pH, CEC), hydrostructural (shrinkage curves), and biological indicators (catabolic profiles, qPCR, and molecular fingerprints). Results showed that increasing compost content significantly accelerated the evolution of soil properties. Organic matter losses were greater in GWC-rich Technosols due to enhanced mineralisation, leading to a slight but significant decrease in pH and increased nutrient release, particularly phosphorus. These changes were accompanied by an increase in cation exchange capacity, suggesting the development of organo-mineral associations and increased reactive surface area. Hydrostructural properties also evolved proportionally to initial GWC content, with higher compost inputs improving moisture retention in both macro- and micropores, increasing void ratios at the end of shrinkage, and enhancing available water capacity. These physical changes, promoted by higher organic matter content, strongly influenced microbial abundance, community composition, and metabolic activity. Overall, this study demonstrates that early pedogenetic processes in Technosols can be markedly accelerated by organic matter enrichment through its combined effects on chemical, physical, and biological soil properties. Our findings highlight the dual potential of Technosols as both functional soils for urban applications and powerful experimental systems for studying early soil formation.

How to cite: Lerch, T., Deeb, M., Blouin, M., Pando, A., and Grimaldi, M.: Speeding up early pedogenetic processes in constructed Technosols with organic matter enrichment, EGU General Assembly 2026, Vienna, Austria, 3–8 May 2026, EGU26-22749, https://doi.org/10.5194/egusphere-egu26-22749, 2026.

EGU26-22765 | Posters on site | SSS6.10

Engineered Soils from excavated molasse materials: Evaluating Plant and Compost Interactions at the OpenSkyLab 

Christiana Staudinger, Corentin Pueyo, Luisa Ulrici, Maha Deeb, Pascal Boivin, Maha Chalhoub, Philippe Bataillard, Samuel Coussy, Charles Cartannaz, Noémie Dubrac, Ali Kanso, Gaylord Machinet, Carmen Mirabelli, Markus Marchhart, Hannes Pavetits, Hans-Peter Kaul, Olivier Duboc, and Johannes Gutleber

Engineered soils (human-made soils) can provide solutions for the recovery of excavated materials; however, these innovative approaches remain limited and require careful development.

The international Future Circular Collider (FCC) study hosted by CERN develops processes with the goal to use excavated materials from the construction of a particle-collider based research infrastructure in the frame of an R&D project called "OpenSkyLab". Part of the project is a platform located on 1 ha of terrain made available by CERN in France to develop standard operating procedures for excavated materials re-use.

The project addresses several research questions, including how to recycle low-clay molassic materials while managing the complexity of mixing processes and enhancing microbial activity in cost effective manner; how to promote plant growth while improving pedogenesis; and identify plant species can enhance soil pedogenesis processes and ecosystem functioning.

The project includes demonstrative, replicated plots and elevated hedgerows plots. Engineered soils were constructed from molassic materials, heterogenous sedimentary rocks typical of Geneva basin, and amended with 0%, 15%, or 30% compost by volume. These substrates were tested under different vegetation types, including Miscanthus giganteus, Kernza (perennial wheat), pasture mixtures, and annual cover crop mixtures. Innovative mixing techniques incorporating inert clay were evaluated to improve substrate aggregation and homogeneity.

After one year of installation, primary results showed that all plant species established successfully except Kernza, which failed to grow. A mixture containing 30% compost and 70% molasse provided good soil cover and good adaptability. Notably, pasture mixtures with 15% compost (~1.5 % organic matter) exhibited strong development, better macrofauna integration, and improved soil structure compared with other plots. These findings contribute to the development of processes for the engineered soil-based recovery of molasse excavated from the FCC and other large-scale construction projects.

How to cite: Staudinger, C., Pueyo, C., Ulrici, L., Deeb, M., Boivin, P., Chalhoub, M., Bataillard, P., Coussy, S., Cartannaz, C., Dubrac, N., Kanso, A., Machinet, G., Mirabelli, C., Marchhart, M., Pavetits, H., Kaul, H.-P., Duboc, O., and Gutleber, J.: Engineered Soils from excavated molasse materials: Evaluating Plant and Compost Interactions at the OpenSkyLab, EGU General Assembly 2026, Vienna, Austria, 3–8 May 2026, EGU26-22765, https://doi.org/10.5194/egusphere-egu26-22765, 2026.

EGU26-23050 | Posters on site | SSS6.10

Renaturing urban environments: from concepts to empirical restoration 

Patrice Prunier, pascal Boivin, Maha Deeb, Pierre-André Frossard, Charlene Heiniger, Laurent Huber, Fabienne Mörch, Luce Renevey, and Julie Steffen

Due to significant anthropogenic constraints, urban (eco)systems often consist of artificial soils or substrates with sparse vegetation cover, particularly in terms of native species. Consequently, their degree of naturalness is generally very low.

Beyond the differentiated management of urban parks—including, where appropriate, the restoration of extensive meadows and lawns—the development of herbaceous systems on roofs, walls, and along tramways offers considerable potential to increase the naturalness of neighborhoods or cities and to create ecological networks. This potential is particularly high for roofs, which cover at least as much surface area as parks in cities and are often poorly vegetated.

This presentation will showcase examples of herbaceous systems in urban environments based on local Central European natural models, focusing on the following:

  • Simple green roof developments and their possible integration with photovoltaic installations, including substrates made from recycled materials in line with circular economy principles;

  • Reconstruction of extensive flower meadows by sowing along tram tracks and implementing differentiated management;

  • Construction of dry stone walls incorporating vegetation with native species;

  • Experiments in greening bus shelters.

Detailed feedback will be provided on the greening of roofs with local plants and substrates, monitored over 5 to 10 years. Results reveal a variety of responses, based on models of resistance or resilience of the initial plant communities, influenced by substrate thickness and their intra- or peri-urban location.

How to cite: Prunier, P., Boivin, P., Deeb, M., Frossard, P.-A., Heiniger, C., Huber, L., Mörch, F., Renevey, L., and Steffen, J.: Renaturing urban environments: from concepts to empirical restoration, EGU General Assembly 2026, Vienna, Austria, 3–8 May 2026, EGU26-23050, https://doi.org/10.5194/egusphere-egu26-23050, 2026.

EGU26-481 | PICO | AS3.28

Spatiotemporal Distribution of Air Pollutants across Indo Gangetic Plain: A Multi-Regional Comparative Analysis 

Manoj K Srivastava, Arti Chaudhary, Bharat Ji Mehrotra, and Atul K Srivastava

Elevated air pollution endangers the environment, climate, and human health, creating significant socioeconomic challenges. These pollutants harm ecosystems and exacerbate climate change. This study presents a comprehensive analysis of air quality variations across the Indo Gangetic Plain (IGP) of North India, examining spatial patterns of multiple pollutants across five distinct sub-regions over the four major seasons, namely, Summer, Monsoon, Post-monsoon, and Winter. Data across the major IGP monitoring stations reveal significant regional and seasonal differences in pollutant concentrations and Air Quality Index (AQI). The Middle-Indo Gangetic Plain (MIGP) exhibited the highest particulate matter concentrations (PM 10: 160.23±8.47 μg/m³, PM 2.5: 71.5±4.68 μg/m³), while the North Eastern region (NE) demonstrated the lowest levels (PM 10: 61.72±27.23 μg/m³, PM 2.5: 32.07±14.01 μg/m³). Notable variations were observed in gaseous pollutants, with the Lower-Indo Gangetic Plain (LIGP) showing the highest SO2 (18.55±4.68 μg/m³) concentrations. Major urban centers emerged as pollution hotspots with AQI values exceeding 175, while Aizawl in the cleaner and less populated northeast India maintained AQI below 42. These findings indicate a west-to-east pollution gradient with significant influence from local emission sources, topographical features, and weather conditions. The pronounced inter-regional differences over various seasons highlight the need for tailored air quality management strategies addressing region-specific pollution characteristics rather than uniform approaches across the entire IGP region.

How to cite: Srivastava, M. K., Chaudhary, A., Mehrotra, B. J., and Srivastava, A. K.: Spatiotemporal Distribution of Air Pollutants across Indo Gangetic Plain: A Multi-Regional Comparative Analysis, EGU General Assembly 2026, Vienna, Austria, 3–8 May 2026, EGU26-481, https://doi.org/10.5194/egusphere-egu26-481, 2026.

EGU26-592 | ECS | PICO | AS3.28

Satellite-Derived Seasonal CO₂ Dynamics Over a Northern Indian Megacity: OCO-2 Observations for Delhi (2019–2024) 

Alerk Sharma, Madhavi Jain, Aakriti Yadav, and Pallavi Saxena

Delhi, located within the Indo-Gangetic Plain (IGP), has undergone rapid urbanisation over the past few decades and today represents one of the most densely populated megacities, with nearly 40 million people in the wider National Capital Region regularly exposed to severe air-quality stress. Despite this significance, long-term ground-based CO2 measurements remain sparse, making Delhi a data-scarce environment for greenhouse-gas assessment. In such context, satellite observations offer an essential alternative for evaluating broad-scale CO₂ behaviour, particularly for cities lacking extensive monitoring networks.

This study examines the seasonal variability of column-averaged CO₂ (XCO₂) over Delhi using six years (2019–2024) of quality-filtered observations from NASA’s Orbiting Carbon Observatory-2 (OCO-2). To understand how XCO₂ evolves through the year, monthly values were compared against their multi-year averages, allowing us to identify recurring seasonal tendencies rather than year-specific fluctuations. Using this approach, the satellite data consistently show elevated CO₂ levels during the pre-monsoon months (April–June), followed by a noticeable reduction during the monsoon season, attributed to the precipitation-induced scavenging of CO₂, and increased vegetation growth. As winter approaches, XCO₂ begins to rise again, reflecting the influence of shallow boundary-layer height and larger wind-speed stagnation over northern India.

Delhi’s strong seasonal contrasts provide a clear setting for investigating how satellite-retrieved CO₂ responds to regional meteorology within a dense megacity. The patterns identified in this study highlight the capability of spaceborne observations to capture physically meaningful CO₂ dynamics even in complex, polluted urban environments. These findings also emphasise the value of publicly accessible satellite datasets for cities where continuous ground-based measurements are limited.

How to cite: Sharma, A., Jain, M., Yadav, A., and Saxena, P.: Satellite-Derived Seasonal CO₂ Dynamics Over a Northern Indian Megacity: OCO-2 Observations for Delhi (2019–2024), EGU General Assembly 2026, Vienna, Austria, 3–8 May 2026, EGU26-592, https://doi.org/10.5194/egusphere-egu26-592, 2026.

Ozone in the upper troposphere (UT) is critical for maintaining radiative balance at the top of the atmosphere (TOA). This study utilizes CMIP6 simulations to investigate photochemical pathways influencing ozone production in the UT during the Asian summer monsoon (ASM). We analyze the impact of convectively transported ozone precursors like nitrogen oxides (NOx), non-methane volatile organic compounds (NMVOCs), and carbon monoxide (CO) on the sensitivity of ozone formation over the Asian region in the UT. Our results show an increase of ozone in the UT by ~70% in the present-day compared to the pre-industrial era. This excess ozone is photochemically produced due to the elevated levels of NOx and CO in the UT, along with its direct convective transport from the boundary layer. Changes in formaldehyde (HCHO), a proxy for VOCs, are negligible in the UT. Analysis of ozone in relation to its precursors (HCHO, CO, and NO2) suggests that the UT is primarily NOx-limited, and ozone production follows the NOx-CO-O3 pathway. The UT ozone changes due to increasing ozone precursor emissions affect the radiative balance by exerting a positive ozone radiative effect at the TOA over the ASM anticyclone region. These findings indicate that suitable emission control strategies must be formulated to reduce NOx and CO emissions for limiting ozone enhancement in the UT

How to cite: Roy, C.: Sensitivity of upper tropospheric ozone to anthopogenic emissions during the Asian summer monsoon, EGU General Assembly 2026, Vienna, Austria, 3–8 May 2026, EGU26-607, https://doi.org/10.5194/egusphere-egu26-607, 2026.

Urban ecosystems in megacities like Delhi are shaped by interactions between emissions, built structures, and seasonal meteorology, making policy evaluation vital for understanding environmental resilience and health risks. This study assesses the effectiveness of the Graded Response Action Plan (GRAP) which is Delhi’s tiered emergency framework that mandates escalating pollution-control measures during periods of severe air quality deterioration, across 2022-23, 2023-24, and 2024-25 by analysing high-resolution air quality variations at two contrasting urban settings; residential zone (Dwarka) and industrial cluster  zone (Mundka). Multi-pollutant datasets (PM₂.₅, PM₁₀, NO₂, SO₂, CO, and O₃) were examined across Pre-, During-, and Post-GRAP periods to capture seasonal dynamics and ecosystem-specific responses.

Across all years, particulate pollution showed sharp winter escalation, with PM₂.₅ rising from 40–90 µg/m³ in the Pre-GRAP window (defined as the 45 days prior to GRAP enforcement) to 130–230 µg/m³ during-GRAP, and PM₁₀ increasing from 150–300 µg/m³ to 300–400 µg/m³, with maxima exceeding 600–800 µg/m³ at specific sites. GRAP which typically is implemented for 6 to 8 months each year depending on prevailing pollution levels, which was then evaluated using this ±45-day framework to capture baseline and recovery phases. These particulate levels far exceed WHO and national limits, posing severe respiratory and cardiovascular risks. NO₂ often doubled during GRAP (reaching 50–70 µg/m³), while O₃ showed expected winter suppression (<20 µg/m³) and strong post-winter recovery (30–50 µg/m³), clearly reflected in the 45-day Post-GRAP period. Unlike other pollutants, SO₂ showed inconsistent GRAP influence, increasing during-GRAP and decreasing post-GRAP, indicating a significant policy gap especially in industrial zone where sulfur emissions persist. This is concerning because SO₂ forms sulfate aerosols, contributing to secondary PM and amplifying health impacts.

Although pollutants declined post-GRAP, they rarely returned to Pre-GRAP baselines, especially at industrial sites. Findings show that GRAP mitigates extreme peaks but remains insufficient, underscoring the need for ecosystem-specific, year-round emission controls particularly targeting sulfur sources to strengthen urban environmental health.

How to cite: Singh, M., Sharma, R., Bali, R., and Saxena, P.: Synergistic Approach Towards the Implementation and Effectiveness of the Graded Response Action Plan (GRAP) on Air Quality in Delhi NCR, EGU General Assembly 2026, Vienna, Austria, 3–8 May 2026, EGU26-639, https://doi.org/10.5194/egusphere-egu26-639, 2026.

EGU26-658 | PICO | AS3.28

Ozone and Multi-Pollutant Dynamics: Indoor Chemistry and Exposure Risks in Printing Environments in University Campus Area, Delhi, India 

Pallavi Saxena, Shalini Suryanarayan, Ronak Sharma, Roman Bali, and Mohita Singh

Urban air pollution in the Anthropocene increasingly reflects mixed emissions from both traditional outdoor sources and emerging indoor technological activities. Among these, printing and photocopying shops constitute important yet understudied microenvironments within academic institutions such as University of Delhi, where students and informal-sector workers experience routine exposure to diverse pollutants in confined spaces. To characterise pollutant composition, indoor chemistry, and associated health implications in these settings, we monitored ozone (O₃), PM₂.₅, PM₁₀ and NO₂ across three contrasting printing environments in University of Delhi: an open-front photocopy shop in Hindu College (North Campus), a semi-enclosed photocopy room in South Campus, and a closed indoor flex-printing facility in commercial area nearby (Malka Ganj, Delhi). Continuous measurements were conducted during the monsoon season (1 August–30 September 2025) at 15-minute intervals between 11:00–17:00, alongside temperature and relative humidity observations.

Ozone concentrations remained consistently low (16–22 ppb) across all microenvironments, influenced by the modest O₃-generation capacity of photocopiers and monsoon-season conditions that favour rapid ozone scavenging via humid surfaces and co-emitted NO. In contrast, pronounced multi-pollutant interactions emerged in the semi-enclosed and enclosed settings. Strong O₃–NO₂ correlations (r = 0.75 and 0.72, respectively) highlight the role of shared machine-driven emissions coupled with restricted dilution. Likewise, the very high PM₂.₅–PM₁₀ correlations (r = 0.93 in the semi-enclosed shop; r = 0.80 in the flex-printing room) confirm distinct particulate-generation mechanisms: fine-particle–rich emissions from heated toner units in photocopier rooms and coarse, solvent-associated particulate bursts from flex-printing operations. The enclosed flex environment exhibited the largest PM excursions, marking it as the most pollution-intensive indoor printing microenvironment.

A structured worker survey revealed frequent symptoms (eye/throat irritation, cough, headaches, fatigue) and a lack of safety training for over 70% of operators. As most photocopy shops in Delhi operate in narrow, poorly ventilated galis, real-world exposures may exceed those observed in the monitored sites.

Collectively, these results demonstrate that microenvironmental design and ventilation strength fundamentally regulate indoor pollutant composition, chemical interactions, and human exposure risk. The findings emphasise the urgent need for ventilation-oriented design standards, emission-reduced printing technologies, and targeted occupational-health safeguards within densely populated institutional and urban commercial settings.


How to cite: Saxena, P., Suryanarayan, S., Sharma, R., Bali, R., and Singh, M.: Ozone and Multi-Pollutant Dynamics: Indoor Chemistry and Exposure Risks in Printing Environments in University Campus Area, Delhi, India, EGU General Assembly 2026, Vienna, Austria, 3–8 May 2026, EGU26-658, https://doi.org/10.5194/egusphere-egu26-658, 2026.

Pollution challenges in India intensify during the post-monsoon period, particularly across the Indo-Gangetic Plain, where multiple emission sources intersect with adverse meteorological conditions to elevate particulate matter concentrations. This study investigates PM2.5 variations in Delhi-National Capital Region (NCR) during October-November of 2024 and 2025, with specific focus on the influence of crop-residue burning in Punjab and Haryana, local firecracker emissions, and temperature-driven atmospheric processes.

In 2024, a total of 779 stubble-burning incidents were detected between 1st to 12th October in Punjab and Haryana, coinciding with days that recorded high PM2.5 levels in Delhi-NCR. Satellite-based Fire Radiative Power (FRP) signals and air-mass back-trajectory analyses further validated the long-range transport of smoke plumes into the NCR. In contrast, severe flooding in 2025 in large parts of Punjab and pockets of Haryana resulted in a 77.5% decline in fire incidents during this period. This created a unique natural experiment to assess Delhi’s pollution baseline under minimal agricultural burning influence. Correspondingly, Delhi’s seasonal average PM2.5, reduced by 15.5%, highlighting the substantial contribution of transported biomass burning aerosols to regional air quality degradation.

However, despite significantly fewer regional stubble burning fire events, Delhi-NCR continued to experience notable PM2.5 spikes. Analysis indicates these increases in PM concentration were primarily driven by local emissions such as vehicular exhaust, road dust resuspension, refuse burning, episodic firecracker bursts around festive periods, construction and demolition activities. Additionally, secondary aerosol formation, particularly the conversion of NOx to nitrate under high humidity and low temperatures, contributed to elevated pollution loads.

Meteorological conditions further intensified pollution build-up in this region. Significant night-time temperature dips, shallow planetary boundary layers heights, and low wind speeds limited vertical mixing and hindered pollutant dispersion, causing pollutants to remain trapped near the surface.

The findings demonstrate that early-winter PM2.5 levels in Delhi-NCR are shaped by a complex interplay of transboundary smoke transport, persistent local emissions, and temperature-driven atmospheric processes that favour pollutant accumulation.

How to cite: Balyan, P., Kumar, A., and Dhaka, S. K.: Coupled Emission-Meteorology Controls on Early-Winter PM2.5 in Delhi-NCR Under Variable Biomass-Burning Regimes, EGU General Assembly 2026, Vienna, Austria, 3–8 May 2026, EGU26-672, https://doi.org/10.5194/egusphere-egu26-672, 2026.

EGU26-687 | ECS | PICO | AS3.28

Three decades of Dust Storm Dynamics in Thar Desert region of India: Evolving Aerosol Properties and Impacts on Urban Air Quality. 

Ronak Raj Sharma, Madhavi Jain, Neha Batra Bali, and Pallavi Saxena

In the Anthropocene, interactions between natural mineral dust and anthropogenic emissions have become a major driver of deteriorating air quality across the Indian subcontinent. While the Indo-Gangetic Plain (IGP) remains a persistent hotspot for fine-mode urban pollution, increasingly frequent and intense pre-monsoon dust storms now act as powerful amplifiers of existing aerosol burdens. This study presents a three-decade (1995–2025) spatiotemporal assessment of dust-storm dynamics using the Modern-Era Retrospective analysis for Research and Applications, Version 2 (MERRA-2) reanalysis product, multi-sensor satellite observations including the Moderate Resolution Imaging Spectroradiometer (MODIS), Cloud–Aerosol Lidar and Infrared Pathfinder Satellite Observation (CALIPSO), and ground-level Particulate Matter (PM) monitoring.

Across these three decades, all datasets show a systematic intensification of pre-monsoon dust activity, with percentage changes derived from contrasts between monthly means of the early decade (1995–2005) and the most recent decade (2015–2025). In May, Aerosol Optical Depth (AOD) increases by 26%, Dust Column Mass Density (DCMD) by 15%, and Ångström Exponent (AE) by 31%, indicating stronger dust uplift accompanied by enhanced mixing with fine anthropogenic particles. In comparison, June shows a modest rise in AOD (9%) and DCMD (~2%) with a smaller AE increase (14%), suggesting a gradual end of the peak dust-activity season in the IGP.

Using a three decades long dataset rather than a shorter record is crucial: two-decade comparisons masked the gradual shift in dust-storm timing and the emergence of mixed dust–pollution regimes, whereas the full 1995–2025 time frame reveals coherent, climatologically robust transitions. The results show that strengthening dust intrusions now interact with rapidly evolving urban emissions, modifying aerosol properties and elevating exposure risks. Accounting for these dust–pollution couplings is essential for realistic air-quality assessment and climate–health planning.

How to cite: Sharma, R. R., Jain, M., Bali, N. B., and Saxena, P.: Three decades of Dust Storm Dynamics in Thar Desert region of India: Evolving Aerosol Properties and Impacts on Urban Air Quality., EGU General Assembly 2026, Vienna, Austria, 3–8 May 2026, EGU26-687, https://doi.org/10.5194/egusphere-egu26-687, 2026.

EGU26-836 | ECS | PICO | AS3.28

Air Pollution and Public Health: A Multi-City Assessment of PM₂.₅ Exposure in Punjab, Pakistan 

Saadia Hina, Ayesha Sana, Muhammad Adrees, Shamaila Noureen, and Immad Zulfiqar

Particulate matter, particularly PM₂.₅ continues to be a critical determinant of the global disease burden, underscoring the scale of exposure and the multifaceted processes through which it affects human health. In Pakistan, particularly the Punjab province, fast-growing urbanization and industrialization has dramatically intensified PM₂.₅ load, with many metropolitan cities consistently surpassing WHO air quality guidelines. This study aims to examine the persuasive relationship between PM₂.₅ exposure and associated health impacts across five major cities including Lahore, Faisalabad, Rawalpindi, Multan and Rahim Yar Khan. Integrating NASA MERRA-2 satellite derived PM₂.₅ data (January 2015–July 2025) with hospital health records, this study performed a time series epidemiological analysis to quantify the impact of PM₂.₅ on morbidity and mortality from respiratory, cardiovascular, and allergic diseases across multiple urban centers. Demographic factors including gender and age group have also been considered for evaluating vulnerable populations. Results indicate a positive correlation between escalating PM₂.₅ concentrations and respiratory (r = 0.33), cardiovascular (r = 0.46), and allergies (r = 0.44) diseases, with pediatric and older being more susceptible. Although significance dip in PM₂.₅ levels was observed during COVID-19 period, the disease incidence continued to surge with a little decline during lockdown months displaying just a short-term fluctuation. Findings underscore the pressing need for consolidated, data-driven approaches including strict air quality regulations, healthcare system strengthening and sustainable city development strategies. Ultimately, this study will contribute to the current understanding of environmental and public health, providing a foundation for future research and policy interventions aimed at safeguarding populations from the health impacts of particulate matter.

How to cite: Hina, S., Sana, A., Adrees, M., Noureen, S., and Zulfiqar, I.: Air Pollution and Public Health: A Multi-City Assessment of PM₂.₅ Exposure in Punjab, Pakistan, EGU General Assembly 2026, Vienna, Austria, 3–8 May 2026, EGU26-836, https://doi.org/10.5194/egusphere-egu26-836, 2026.

Urban environmental degradation in India’s metropolitan centres poses escalating challenges for public health, economic productivity, and sustainable urban governance. Among these regions, the National Capital Region (NCR) especially Delhi continues to be one of the most environmentally stressed urban agglomerations, experiencing chronic air pollution, deteriorating water quality. Although several domain-specific assessments exist, there remains a critical gap in developing an integrated and empirically grounded framework that jointly evaluates air, water, and captures their combined influence on urban environmental quality. This study fills that gap by constructing the Composite Environmental Quality Index – Air, Water (CEQI-AW) for Delhi, using 2022–23 as the base year (Index = 100). The index facilitates both monthly and annual comparisons of environmental quality from 2022–23 onward, drawing on publicly available real-time monitoring networks, administrative datasets, and spatial environmental information.
The framework consists of three pillars: Air Quality Index (AQI), Water Quality Index (WQI). Monthly data from April 2022 to March 2023 are used to construct the base-year composite index, and subsequent months up to the latest available period are incorporated for temporal trend analysis. Air quality indicators are sourced from Central Pollution Control Board (CPCB) and Delhi Pollution Control Committee (DPCC) continuous monitoring stations and include concentrations of PM₂.₅, PM₁₀, NO₂, SO₂, CO, and O₃. Water quality parameters are compiled from CPCB’s Yamuna monitoring network, Delhi Jal Board treatment plant reports, and Central Ground Water Board (CGWB) groundwater assessments, covering indicators such as BOD, COD, DO, TDS, fecal coliform, nitrate, fluoride, and heavy metals. 
The study employs a hybrid weighting method: equal weights are assigned across the two pillars for transparency, and within each pillar, a simple geometric mean is used to construct item-level indices. The CEQI-AW is then computed for each year from the base year (2022–23) through 2024–25, enabling an assessment of inter-annual and seasonal variation.
Preliminary findings reveal that while some districts in Delhi show modest improvements in air quality during targeted winter interventions, environmental quality remains under significant strain. The year-on-year comparison for winter season (especially November, December and January) shows the highest variation in air quality in Delhi, driven by severe winter smog episodes and meteorological stagnation. Water quality exhibits distinct seasonal fluctuations, with the summer months (May and June) showing peak contamination until dilution and runoff effects during the monsoon lead to temporary improvement. Overall, the composite index exhibits an upward but uneven trajectory, heavily influenced by air quality volatility. The results highlight the need for season-specific policy interventions—winter mitigation for air pollution, summer strategies for water contamination, to effectively address environmental challenges in Delhi.

How to cite: Malick, B. K.: A Composite Environmental Quality Index: An Analysis of Air, Water (CEQI-AW) in Delhi from 2022 to 2025, EGU General Assembly 2026, Vienna, Austria, 3–8 May 2026, EGU26-909, https://doi.org/10.5194/egusphere-egu26-909, 2026.

EGU26-974 | ECS | PICO | AS3.28

Assessment of black carbon concentrations, emission sources and health risks in two cities of Peninsular Malaysia  

Nurzawani Binti Md Sofwan, Nur Faseeha Suhaimi, Hartini Mahidin, Zulfa Hanan Ash'aari, Noor Zaitun Yahaya, and Bálint Alföldy

Black carbon (BC) is known as a pollutant that poses serious risks to both the climate system and human health. The Southeast Asia region relies heavily on fossil fuels, and experiences frequent biomass burning that contributes significantly to BC emissions, yet research on BC measurements remains limited. To address these knowledge gaps, the present study aims to investigate the BC levels at two sites in Peninsular Malaysia, apportion the potential sources, and estimate the associated human health risks from BC exposure. The measurement campaign was conducted from August to November 2024 at Putrajaya and April to May 2025 at Johan Setia, Klang respectively. Real-time measurements of aerosol light absorption were continuously obtained using a AE33 aethalometer. The measured mean equivalent BC mass concentrations of 4.61 ± 1.75 g m-3 and 2.53 ± 0.75 g m-3 were observed in Johan Setia and Putrajaya, respectively. Johan Setia records higher BC concentrations due to multiple local emission sources from traffic, industries, residential, agricultural and commercial activities. BC from fossil fuel (BCff) dominated both sampling sites throughout the study period with several irregular localized peak episodes. Daily variations in BC concentrations reflect the critical contributions of traffic emissions during weekdays. A well-planned township like Putrajaya exhibits lower BC emissions, with consistent patterns indicating that light-duty vehicles are the primary source, reflecting its role as a government administrative and residential township. Elevated BCff were observed from midnight to early morning at Johan Setia, driven by emissions from nearby industrial facilities, power stations and heavy-duty vehicles operate at night because the position of the site lies along the main route connecting Klang to Port Klang, one of Malaysia’s busiest seaports. In addition, increasing trends of BC concentrations from biomass burning (BCbb) were prevalent from late evening until night at Johan Setia, likely due to the burning of agricultural residues by the residents. The BC index at both sites shows a dominant of the satisfactory category, with BC concentrations ranging from 1 to 3 g m-3. Health risk assessments revealed that the calculated chronic hazard quotient (HQ) for BC across the exposed groups was less than 1 (HQ < 1). Both sampling sites recorded cancer risk values exceeding the acceptable value of 1 x 10⁻⁶. This work provides a foundation of understanding BC pollution in the tropical region of Malaysia. Recognising the implications of BC on climate and health, Malaysia should establish BC monitoring efforts and give sufficient attention to evidence-based policies to reduce black carbon emissions.

How to cite: Binti Md Sofwan, N., Suhaimi, N. F., Mahidin, H., Ash'aari, Z. H., Yahaya, N. Z., and Alföldy, B.: Assessment of black carbon concentrations, emission sources and health risks in two cities of Peninsular Malaysia , EGU General Assembly 2026, Vienna, Austria, 3–8 May 2026, EGU26-974, https://doi.org/10.5194/egusphere-egu26-974, 2026.

Problem considered: Air pollution is a critical environmental health issue with profound impacts on vulnerable populations. Understanding the impact of ambient air pollution on adverse health outcomes and death rate is crucial for informing evidence-based interventions and policy measures to address this critical issue.

Methods: We analyzed secondary data on ambient air pollutants particulate matter (PM2.5 and PM10), nitrogen dioxide (NO2), sulphur dioxide (SO2) and ozone (O3) levels from 2018 to 2023 across all eight districts in New Delhi. Data were obtained from the Central Pollution Control Board (CPCB) and Delhi government databases. Health outcome indicators, including overall mortality rate, were assessed for associations with ambient air pollutant levels.

 Results: Air pollutant levels across all districts of New Delhi were found to be highest during 2018–2019, followed by a decline in 2019–2021, likely due to the COVID-19 pandemic and related restrictions. Additionally, all pollutants showed positive associations with adverse health outcomes (mortality indices), with particularly strong links between SO2 and ozone in Delhi.

Conclusion: Our findings highlight a concerning association between ambient air pollution and adverse health outcomes in New Delhi. However, the findings should be interpreted with caution, as multiple confounding factors such as socioeconomic status, lifestyle, and healthcare access may also influence outcomes. More large-scale and long-term studies are needed to minimize these limitations and establish stronger causal relationships.

Keywords: Air Pollution, Particulate Matter, Death Rate, Mortality Indices

How to cite: Arora, T., Gautam, R., and Vasudevan, S.: Analysis trends of Environment pollutants (Ambient Air Pollution) and its adverse health effect in New Delhi over a period of 2018-2023, EGU General Assembly 2026, Vienna, Austria, 3–8 May 2026, EGU26-1556, https://doi.org/10.5194/egusphere-egu26-1556, 2026.

Urban air pollution represents a major environmental and public health issue, particularly in large metropolitan areas. This study presents an analysis of black carbon (BC) and particulate matter with an aerodynamic diameter smaller than 2.5 µm (PM2.5) concentrations in Bucharest, Romania, over the period 2022–2025, using a combination of on-site and mobile measurements. Field campaigns considered both short-term (about 10 days) and longer-term measurements, up to three months. The short-term field campaign, was carried out using a mobile laboratory that covered more than 1,500 km in August 2024. The city area was divided into three distinct zones—north-west, north-east, and south—with a specific route defined for each zone. Each route was travelled four times: once during night-time and three times during daytime on consecutive days. This data acquisition strategy ensured adequate statistical consistency and enabled the capture of both temporal and spatial variations in atmospheric BC and PM2.5 concentrations. The temporal variability of atmospheric pollutants was analysed based on data gathered in the long-term campaign performed at a location situated in the western part of the city, an area with high traffic. The results reveal significant spatial-temporal variability in BC and PM2.5 levels, strongly influenced by road traffic intensity, urban land-use characteristics, and time of day. Areas that exhibit elevated fine particulate pollution were identified within Bucharest. As an example, in 2022, close to the high traffic western area with traffic noise levels ranging from 40 dB (night-time) to about 75 dB (daytime), a mean PM2.5 concentration of about 35 µg m⁻³, and mean black carbon (BC) concentration of 11.38 ng m⁻³ in the ultrafine particles were measured. No significant changes were detected in PM2.5 and BC levels over time at that location, indicating a significant people chronic exposure. These elevated long-term concentrations support the role of road traffic as a major urban stressor by the combined exposure to air pollution and noise, both relevant for public health risk. Each field campaign was also meteorological characterized, in order to better understand the variations of PM2.5 and BC concentrations. During the mobile measurement campaign in summer 2024, the Bucharest area was characterized by a moderately deep atmospheric boundary layer (mean height ~850 m), favouring partial vertical mixing, while prevailing weak-to-moderate south-easterly winds (mean speed 2.6 m s⁻¹) suggest limited horizontal ventilation. Air temperatures ranging between 22 and 32 °C, combined with relatively low to moderate relative humidity (35–55%), indicate warm and generally dry conditions, conducive to thermal stress and potentially reduced dispersion of urban pollutants, especially during night-time stable periods. This is a typical meteorological condition for Bucharest summers.

Present study highlights the importance of integrating fixed and mobile measurements for a detailed assessment of urban atmospheric composition to further assess the population exposure to harmful atmospheric constituents, and provides relevant information to support air quality management strategies in Bucharest.

How to cite: Tudor, A., Scarlat, A., and Iorga, G.: Anthropogenic Impact on Atmospheric Composition over Bucharest, Romania: Insights from Multiple Field Campaigns (2022–2025), EGU General Assembly 2026, Vienna, Austria, 3–8 May 2026, EGU26-4997, https://doi.org/10.5194/egusphere-egu26-4997, 2026.

EGU26-6037 | ECS | PICO | AS3.28

Fine particulate matter, nitrogen dioxide, and Tdap vaccine antibody levels in Mexican children 

Mike Z. He, Maayan Yitshak-Sade, Itai Kloog, Allan C. Just, Corina Lesseur, Sally A. Quataert, Martha M. Téllez-Rojo, Libni Torres, Héctor Lamadrid, M. Cecilia Berin, Robert O. Wright, Todd A. Jusko, and Elena Colicino

Objective: Existing research suggests that vaccine antibody response can be attenuated by environmental factors, but limited studies have assessed the association with air pollutants. We hypothesize that air pollution exposure early in life can alter immune response in later childhood.

Methods: We obtained serum antibody levels of tetanus, diphtheria, and pertussis measured in vaccinated children ages 4-6 years from the Programming Research in Obesity, Growth, Environment and Social Stressors (PROGRESS) cohort in Mexico. We constructed 1-km2 fine particulate matter (PM2.5) and nitrogen dioxide (NO2) models over the Mexico City Metropolitan Area, which we geocoded to participants’ home addresses. We employed linear mixed-effects models to examine the association between early life exposure to PM2.5 and NO2, measured as averaged pollutants exposures in the first year of life, and log-transformed tetanus, diphtheria, and pertussis (Tdap) antibody levels in later childhood (ages 4-6). Models included random intercepts for participant and were adjusted for temperature, sex, child age at blood draw, maternal age at birth, BMI, and socioeconomic status.

Results: 299 children contributed to antibody levels at 4 years (n=287) and 6 years (n=12). We observed negative but imprecise associations with both pollutants. Per 1 µg/m3 increase in one-year postnatal PM2.5, Tdap antibody levels decreased by 3.47% (95%CI: -7.35, 0.57%), 3.37% (95%CI: -7.18, 0.60%), and 2.56% (95%CI: -6.93, 2.02%) respectively. Per 1 µg/m3 increase in one-year postnatal NO2, Tdap antibody levels decreased by 3.89% (95%CI: -7.22, -0.45%), 3.51% (95%CI: -6.81, -0.09%), and 1.93% (95%CI: -5.74, 2.04%) respectively.

Conclusion: We found preliminary evidence suggesting decreased antibody levels in response to postnatal PM2.5 and NO2 exposure, though not all results were significant. Additional work is necessary to explore associations for different types of routine vaccinations and at different critical time windows.

How to cite: He, M. Z., Yitshak-Sade, M., Kloog, I., Just, A. C., Lesseur, C., Quataert, S. A., Téllez-Rojo, M. M., Torres, L., Lamadrid, H., Berin, M. C., Wright, R. O., Jusko, T. A., and Colicino, E.: Fine particulate matter, nitrogen dioxide, and Tdap vaccine antibody levels in Mexican children, EGU General Assembly 2026, Vienna, Austria, 3–8 May 2026, EGU26-6037, https://doi.org/10.5194/egusphere-egu26-6037, 2026.

EGU26-10658 | PICO | AS3.28

Particulate Matter Pollution Episodes in a Multisource Coastal Environment: Insights from Single-Particle Analysis and atmospheric dynamic 

Alexandre Deguine, Andebo Waza, Soulemane Ngagine, Pascal Flament, Patrick Augustin, Fabrice Cazier, Dorothée Dewaele, Elsa Dieudonne, Hervé Delbarre, Marc Fourmentin, and Karine Deboudt

Coastal industrial and urban regions in Europe host a substantial fraction of the population and economic activity, yet they remain highly vulnerable to particulate matter (PM) pollution episodes. Despite the implementation of air quality regulations, exceedances of PM10 and PM2.5 concentration thresholds persist, driven by the coexistence of dense emission sources and complex coastal atmospheric dynamics. In this study, pollution days (PDs) were analyzed over a four-year period (2018–2021) in the Greater Dunkirk Area, a coastal region influenced by multiple anthropogenic and marine sources. Spatial analyses indicate that PM2.5 pollution episodes are predominantly associated with regionally extended plumes, whereas PM10 episodes are more frequently linked to locally confined plumes, exhibiting marked seasonal variability. Detailed aerosol chemical characterization was conducted using SEM–EDX analysis on more than 23,000 individual particles collected during a one-year field campaign in 2021. The results reveal a highly heterogeneous particle population, largely dominated by sea-salt and carbonaceous aerosols, with fine particles enriched in secondary sulfur-containing species and coarse particles characterized by calcium-rich components. The particle mixing state index (χ) spans a wide range (0.5–0.9), reflecting a continuum between externally and internally mixed aerosols, strongly modulated by atmospheric ageing processes, pollutant recirculation, and turbulent mixing. Our findings demonstrate that neither local wind direction nor plume spatial extent alone adequately explains the observed chemical variability. Instead, the evolution of aerosol composition and mixing state is governed by fine-scale meteorological processes, including sea-breeze circulations and recirculation events, which critically influence pollutant dispersion and ageing. These results underscore the importance of integrating high-resolution single-particle chemistry with urban-scale meteorological dynamics in air quality assessments, particularly in complex coastal environments subject to multiple emission sources.

How to cite: Deguine, A., Waza, A., Ngagine, S., Flament, P., Augustin, P., Cazier, F., Dewaele, D., Dieudonne, E., Delbarre, H., Fourmentin, M., and Deboudt, K.: Particulate Matter Pollution Episodes in a Multisource Coastal Environment: Insights from Single-Particle Analysis and atmospheric dynamic, EGU General Assembly 2026, Vienna, Austria, 3–8 May 2026, EGU26-10658, https://doi.org/10.5194/egusphere-egu26-10658, 2026.

EGU26-20727 | ECS | PICO | AS3.28

VOCs Over Himalayan Glaciers: Speciation, Sources and Comparison with Other Glaciers 

Aishwaryashri Tamrakar and Shamsh Pervez

This study presents the concentration and speciation of VOCs over three high-altitude Himalayan glacier regions {Western Himalayan region (WHR; Thajiwas glacier, 2799 m asl), central Himalayan region (CHR; Gomukh glacier, 3415m asl) and eastern Himalayan region (EHR; Zemu glacier, 2700 m asl)} along with their comparison with those reported over Arctic and Antarctic glacier regions. 28 VOCs were determined in ambient air samples, collected in sorbent tubes using a ACTI -VOC low flow pump sampler, throughout the summer and winter periods of 2019-2020, followed by analysis using thermal desorption gas-chromatography mass spectrometry (TD-GC-MS/MS). The average sums of 28 VOCs were found to be 161.58 µg.m-3 at CHR, 120.73 µg.m-3 at EHR and 94.33 µg.m-3 at WHR. These values are found to be 4 to 40 fold and 0.8 to 2 fold higher than those reported over Arctic and Antarctic glaciers. On comparing these findings with those reported for an urban-industrial location of India (Raipur, Chhattisgarh) with similar period of measurement campaigns, a 2-fold lower concentration is observed over Himalayan glaciers. The results, also, indicated that CHR site has higher concentration of VOCs compared to other two sites WHR and EHR. Evaluation of seasonal variation pattern across the sites and source characterization by PMF5.0 were also made. UNMIX output of three-factor solution that explain >90% ambient VOC’s measurement is found to be similar to those of three source-factor solution from PMF5.0. The results revealed that three VOCs source types were: vehicle engine exhausts, biomass burning and coal combustion and biogenic emissions. The findings have important implications for appropriately assessing the effects of VOCs on glacial melting in high-altitude Himalayan glacier regions.

Keywords: Ambient VOCs, Seasonal variability; Himalayan glacier region, Source identification

How to cite: Tamrakar, A. and Pervez, S.: VOCs Over Himalayan Glaciers: Speciation, Sources and Comparison with Other Glaciers, EGU General Assembly 2026, Vienna, Austria, 3–8 May 2026, EGU26-20727, https://doi.org/10.5194/egusphere-egu26-20727, 2026.

EGU26-21562 | ECS | PICO | AS3.28

Real-World Heavy-Duty Truck Emissions: 5-km Road-Network Inventory Implications 

Karigowda Gowda, Kashish Jain, Mohd Shahzar Khan, Niraj Kumar, and Gazala Habib

Heavy-duty trucks (HDTs) are a major source of nitrogen oxides (NOₓ) and combustion-derived particulate matter along freight corridors and in rapidly urbanizing regions, yet Indian emission inventories often rely on emission factors (EFs) that are weakly constrained under real-world operation and insufficiently representative of fleet diversity. Here, we quantify real-world HDV EFs using the Versatile Source Sampling System (VS3) from in-use measurements spanning multiple Bharat Stage norms (BS III, BS IV, & BS VI), vehicle ages, gross vehicle weight classes (12–16, 16–30, 30–42 tons), axle configurations, and both diesel and CNG fuel. We observe systematic reductions in regulated pollutants with tightening standards. Compared with older-generation vehicles, the newest standards show ~85–90% lower PM2.5, 90–95% lower CO, and 85–95% lower NOₓ under real-world conditions. For the combined diesel+CNG fleet, most PM₂₅ improvement occurs between the two earlier standards (roughly an 80% reduction), with comparatively smaller additional changes thereafter, whereas NOₓ exhibits modest early reductions followed by a pronounced step decrease (roughly 80–85%) with the newest standard. Within the latest standard, diesel vehicles remain higher-emitting than CNG, with diesel showing roughly ~65–75% higher PM₂.₅ and ~75–85% higher NOₓ on average under comparable operating regimes. Multivariate analysis indicates that emission standard and axle category (as a proxy for duty and operating regime) explain most EF variability.

Building on these measurement-constrained EFs, we develop a transparent and reproducible national HDTs emissions inventory workflow at 5-km spatial resolution, integrating state/UT fleet statistics, survival-function-based age-mix reconstruction, and road-network spatial allocation. The framework supports scenario analysis by contrasting literature-based baselines with updated measurement-informed EFs, producing gridded emissions suitable for chemical transport modeling, exposure assessment, and evaluation of corridor-focused control strategies.

Keywords: heavy-duty vehicles; real-world emissions; emission factors; VS3; Bharat Stage; NOx; PM2.5; diesel; CNG; road-network inventory; 5-km gridded emissions.

How to cite: Gowda, K., Jain, K., Shahzar Khan, M., Kumar, N., and Habib, G.: Real-World Heavy-Duty Truck Emissions: 5-km Road-Network Inventory Implications, EGU General Assembly 2026, Vienna, Austria, 3–8 May 2026, EGU26-21562, https://doi.org/10.5194/egusphere-egu26-21562, 2026.

EGU26-22201 | PICO | AS3.28

Spatiotemporal Assessment of Black Carbon in the Urban Environment of Dun Valley, Himalayan Foothills, India 

Chhavi Pant Pandey, Aman Shrivas, and Abhishek Thakur

Rapid urbanisation and rising vehicular emissions have become one of the major causes of declining air quality in the Himalayan foothill regions/cities. Black Carbon (BC), a short-lived climate pollutant primarily emitted due to the incomplete combustion of fossil fuels, biomass fuels, and open burning, is not only associated with atmospheric warming but also with adverse human health. In the present study, the spatial distribution of BC was assessed in Dehradun, the capital city of Uttarakhand state, India. Dehradun resides in the valley sandwiched between the Shiwalik range to the south and the Lesser Himalayan range to the north.  In the present study, the integration of a comprehensive mobile and fixed-site monitoring approach has been applied to the assessment of BC in the region during 2022–2023. The microAeth MA350 was used for mobile monitoring, while the Aethalometer AE33 was used for fixed-site monitoring. Further, personal exposure to BC was evaluated to assess the spatial-temporal variation of human exposure to it along four different routes.  The selected routes represented different microenvironments, including urban regions with heavy traffic, industrial regions, and green corridors.  A total of ~100 hours of mobile monitoring was conducted. The mean BC concentration of 3.78 ± 3.01 µg/m³ at the fixed site was much lower than the mean BC concentration along the mobile-monitored routes, which varied from 18.09 ± 15.51 µg/m³ to 27.22 ± 17.90 µg/m³.  For the determination of individual inhalation doses, three different respiratory rates (RRs) were used, indicating diverse commuting intensities in the region, viz. passive travel (0.47 m³/hr), walking (0.63 m³/hr), and cycling/motorcycling (0.70 m³/hr). It was realised that at the lowest RR, the total inhalation doses were estimated within the range of 10.08 µg to 14.06 µg, while at the highest RR, the inhalation doses ranged from 15.01 µg to 20.94 µg. However, during moderate activity levels, inhalation doses remained within the range of 13.51-18.84 µg. Whereas higher RR results in increased air intake, the inhalation dose of pollutants, such as BC, also increases with greater physical exertion. This pattern is evident for all routes, reinforcing the idea that physical exertion plays a crucial role in determining personal exposure levels. Individuals engaged in more physically demanding commuting modes, such as cycling or motorcycling, inhale more air per hour, which increases their intake of airborne pollutants. The inhalation dose shows a consistent increase with respiratory rate across all chosen routes, thereby indicating the impact of physical activity on pollutant intake. The preliminary results of this unique regional study emphasise the need to consider mobility patterns and the choice of path when determining pollutant exposure. This study also highlights the uncertainty and challenges associated with the estimation of BC concentrations within our environment. The present study is an initiative that may help in understanding and managing the urban air quality, thereby suggesting the importance of sustainable transportation strategies and public awareness initiatives aimed at reducing the health risks within the valley.

How to cite: Pandey, C. P., Shrivas, A., and Thakur, A.: Spatiotemporal Assessment of Black Carbon in the Urban Environment of Dun Valley, Himalayan Foothills, India, EGU General Assembly 2026, Vienna, Austria, 3–8 May 2026, EGU26-22201, https://doi.org/10.5194/egusphere-egu26-22201, 2026.

EGU26-372 | ECS | Orals | BG10.12

Hyperspectral satellite imagery for urban climate applications 

Matej Žgela, Alberto Vavassori, and Maria Antonia Brovelli

Urban climate research relies on multispectral (MS) satellite imagery because of its global coverage and relatively high spatial and temporal resolution. However, its coarse spectral detail limits the analysis of complex urban surfaces. New hyperspectral (HS) satellite missions provide much finer spectral information, supporting detailed analysis of urban microclimates. Here, we present an overview of current HS satellite products and examine the potential of PRISMA (PRecursore IperSpettrale della Missione Applicativa) and DESIS (German Aerospace Center (DLR) Earth Sensing Imaging Spectrometer) missions for two key applications in urban environments: material abundance estimation and local climate zone (LCZ) mapping. To estimate material abundances, we apply constrained spectral unmixing to HS imagery over Milan, Italy. Results are compared with near-simultaneous MS data and validated against the local geotopographic database. The derived abundances are also linked to high-resolution air temperature maps predicted using a machine learning-based regression approach. Secondly, LCZs are mapped using a combined RS and GIS-based method, integrating spectral and spatial information for improved classification of urban areas.

Our results show that HS imagery supports sub-pixel material estimation, opening the possibility for a transition from single land-cover labels to multi-material representations within each pixel. Thermal assessment further validated these estimates, with natural materials reducing heat and artificial surfaces increasing it. Finally, LCZ mapping resulted in higher accuracy with HS imagery compared to MS products.

HS imagery provides a promising path for applications in urban climate research and other urban studies. Thanks to its technical advantages over MS imagery, HS data enable the generation of data suitable for microclimate modelling, heat mitigation assessment or urban management. Although HS imagery is not yet as widely available as MS, upcoming missions are steadily expanding access for scientific use in urban monitoring.

How to cite: Žgela, M., Vavassori, A., and Brovelli, M. A.: Hyperspectral satellite imagery for urban climate applications, EGU General Assembly 2026, Vienna, Austria, 3–8 May 2026, EGU26-372, https://doi.org/10.5194/egusphere-egu26-372, 2026.

Understanding the impacts of urbanization and environmental transitions in rapidly developing regions such as Aligarh District, Uttar Pradesh, requires a comprehensive assessment of land use/land cover (LULC) and land surface temperature (LST). For this study, a semi-automated hybrid classification approach, integrating maximum likelihood classification with object-based image analysis, was applied to Landsat-8 OLI imagery from 30 May 2022 to map LULC. LST was derived from thermal band 10 using a four-step procedure that converted the satellite-recorded digital numbers (DNs) into accurate land surface temperature values. Accuracy assessment using 250 reference sites yielded an overall accuracy of 94.4% and a Kappa coefficient of 0.93, confirming high reliability. LST analysis revealed considerable spatial and thermal variability, with summer temperatures ranging from 26.48°C to 46.40°C (mean: 36.32°C). Pearson’s correlation results indicated consistent relationships between LST and key remote sensing indices. NDVI and SAVI showed moderately negative correlations with LST, demonstrating the cooling influence of vegetation, while NDBI exhibited a strong positive correlation, highlighting the urban heat island effect. NDWI showed a negative relationship with LST, and NDBaI displayed a weaker positive correlation, underscoring the moderating effect of water bodies on surface temperature. The Ordinary Least Squares (OLS) regression model explained 70.06% of LST variance, with an Akaike Information Criterion (AICc) value of 3792.15. Coefficient patterns indicated that NDBI contributed to LST intensification, whereas NDVI, NDWI, and SAVI significantly reduced surface temperatures. The Geographically Weighted Regression (GWR) model substantially improved explanatory power, achieving an R² of 0.9405 and reducing residual spatial autocorrelation, as reflected by the decline in Moran’s I from 0.30 (OLS) to 0.02 (GWR). Overall, the findings demonstrate that LULC dynamics drive surface temperature fluctuations in the Aligarh district, and GWR's ability to capture geographical variations makes it highly effective for environmental modelling.

Keywords: Land surface temperature (LST), Geographically weighted regression (GWR), Spatial regression, Ordinary least squares (OLS), Geospatial analysis.

How to cite: Khan, M. A. and said, S.: Geospatial and Regression-Based Modelling of Land Surface Temperature in Aligarh: A Comparative Study of OLS and GWR, EGU General Assembly 2026, Vienna, Austria, 3–8 May 2026, EGU26-699, https://doi.org/10.5194/egusphere-egu26-699, 2026.

With climate change on the rise, increasing the frequency and intensity of drought stress, we aim to define drought tolerance by assessing the plasticity of several physiological parameters in urban trees. Urban trees face unique sets of challenges compared to trees in the forest, leading them to be more exposed to extreme conditions, as they are restricted to tree pits surrounded by impervious structures (e.g., size, depth, morphology, surface cover and connectedness to other trees). Understanding the impacts of tree pit surface cover can help gain better insights for planting a more resilient urban forest.

To advance our understanding of urban European tree species, we investigate the plasticity of the turgor loss point (TLP), xylem potential when 50% conductivity is lost (P50), specific leaf area (SLA) and Huber Values (HV) for four widespread urban tree species, Acer platanoides (L., Sapindaceae), Ginkgo biloba (L.), Platanus x hispanica (Münichh.) and Tilia cordata (Mill., Malvaceae), growing in different tree pit surface cover conditions (e.g., concrete, exposed soil, grass or vegetation) in the city of Munich, Germany. We used different growing periods of the 2025 growing season for 70 individuals; TLP was measured in July and September, while P50, SLA and HV were measured in August.

Our results indicate that the TLP did not change between early and late season sampling for any of the species or tree pit surface cover types. Moreover, TLP varied between species, while tree pit surface cover influenced TLP only within species. P50, however, was strongly related to species identity and was also affected by tree pit surface cover within species. In particular, A.platanoides P50 was less negative in the concrete tree pit surface cover type, while the other tree pit surface covers have more negative P50’s, suggesting that A.platanoides growing in a concrete tree pit surface cover is less drought tolerant, than when A.platanoides is growing in a tree pit with exposed soil, grass or vegetation surface cover.

When assessing drought tolerance of urban trees, the TLP and P50 provides insights on how different tree species respond to different tree pit surface cover growing conditions. To strengthen urban forests’ resilience to drought stress, our work suggests that tree pit surface covers should be taken into consideration when designing urban forests for specific tree species.  

How to cite: McKinney, S. Q. and Peters, R. L.: Assessing the plasticity of drought tolerance in urban trees growing in different tree pit surface cover conditions in Munich, Germany, EGU General Assembly 2026, Vienna, Austria, 3–8 May 2026, EGU26-970, https://doi.org/10.5194/egusphere-egu26-970, 2026.

EGU26-1562 | ECS | Orals | BG10.12

Tree shade as a nature-based strategy for mitigating heat exposure but effectiveness varies 

Anisha Aryal, Konlavach Mengsuwan, and Masahiro Ryo

Tree shade is widely recognized as an effective nature-based cooling solution to mitigate thermal exposure under a warming climate. However, factors modulating the intensity of shade-related cooling remain poorly understood, particularly beyond urban settings where most prior studies have focused on individual tree traits and local land use. This study examines whether shading effect varies across different landscapes and identifies key temporal and spatial drivers of shade-induced cooling across three survey sites: urban, post-mining, and lakeside environments in Lusatia, Germany. More than 100 trees were assessed for their shading effects. Surface temperature of shaded and adjacent non-shaded surfaces were measured using a handheld thermal camera during heat events in August 2023 and 2024, when daily maximum temperatures exceeded 30°C. Land-use information was derived from field-collected RGB imagery. Additional variables including distance to water and forest, vegetation index and canopy height were extracted from remote-sensing datasets. Shading effects were quantified using paired statistical tests, and an XGBoost regression model combined with post-hoc interpretability analyses was applied to identify key predictors and their influence on cooling intensity. Across all survey sites, shaded surfaces were significantly cooler than non-shaded surfaces, with non-urban areas exhibiting larger cooling effect. The predictive model achieved moderate performance (R2 = 0.34). Temporal factors, particularly year and time of day, emerged as the most influential predictors, indicating substantial temporal variability in shade-induced cooling. Spatial configuration also played a critical role: shade-induced cooling increased with distance from forested areas and decreased with distance to water bodies. The relative importance of spatial variables varied by landscape type. Canopy height showed a negative relationship with cooling magnitude, suggesting that areas dominated by shorter trees may enhance shading effectiveness. Vegetation greenness and land-use categories had comparatively minor effects, while landscape type itself exerted no substantial influence. These findings demonstrate that shade-related cooling is governed not only by local tree or land-use characteristics but also by broader environmental context, including surrounding vegetation and landscape configuration. Incorporating multiscale geospatial predictors into microclimate assessments can therefore improve the design of climate-resilient landscapes and heat-mitigation strategies.

How to cite: Aryal, A., Mengsuwan, K., and Ryo, M.: Tree shade as a nature-based strategy for mitigating heat exposure but effectiveness varies, EGU General Assembly 2026, Vienna, Austria, 3–8 May 2026, EGU26-1562, https://doi.org/10.5194/egusphere-egu26-1562, 2026.

Vehicular traffic is a major contributor to anthropogenic heat flux (AHF) in urban areas, amplifying urban heat island effects. However, few Earth system models explicitly represent traffic conditions and their associated heat emissions. This study introduces a new urban traffic module into the Community Earth System Model (CESM), enabling interactive simulation of traffic-related heat in urban areas. The module adopts a bottom-up approach to estimate traffic heat flux (Qtraffic) based on time-varying traffic volume and vehicle type distributions, while dynamically responding to meteorological conditions such as snow, rain, and low temperatures. Model validation was performed using observational data from two urban sites: Capitole of Toulouse, France (FR-Capitole), and Manchester, UK (UK-Manchester). At the FR-Capitole site, an annual mean Qtraffic of 22.23 W/m2 in 2004 resulted in a simulated annual mean canopy air temperature increase of 0.4K, improving the simulated turbulent heat flux compared to observations. At the UK-Manchester site, the simulation with a yearly mean Qtraffic of 16.27 W/m2 showed a 0.25K air temperature increase in 2022. These traffic-induced canopy warming also influenced the indoor environment, contributing to increased air conditioning use in summer and reduced building space heating demand in winter. This new functionality offers potential applications such as simulating traffic-induced AHF and its impacts on the climate system under future climate changes and transport transition scenarios.

How to cite: Sun, Y., Oleson, K., and Zheng, Z.: Modeling urban traffic heat flux in the Community Earth System Model: Formulation and validation for two sites, EGU General Assembly 2026, Vienna, Austria, 3–8 May 2026, EGU26-2014, https://doi.org/10.5194/egusphere-egu26-2014, 2026.

Fine-resolution urban weather nowcasting is crucial for urban resilience, yet it is fundamentally limited by the sparse and irregular distribution of monitoring stations. To overcome this, we introduce an inductive, physics-informed spatio-temporal graph network that transforms discrete sensor data into a continuous, on-demand forecast field. Our framework uniquely synergizes multi-source data: point-scale station observations, grid-scale numerical weather predictions, and high-resolution urban morphological features. The model core is a novel encoder-decoder architecture designed for deep feature extraction. A hybrid temporal encoder captures complex weather dynamics, while a multi-graph attention mechanism learns heterogeneous spatial interactions based on physical similarity (e.g., thermal or wind-driven connections), moving beyond simple geographic proximity. These multi-faceted features are then fused via a subsequent attention layer. Critically, we enforce physical consistency by integrating a thermodynamics-aware loss function, which ensures physics-informed predictions of key variables like temperature and humidity. Evaluated on a comprehensive dataset from Wuhan, China, our model demonstrated high accuracy and strong correlation with observational data for 6-hour ahead nowcasting. Its inductive design is a key advantage, enabling reliable predictions for arbitrary, unmonitored locations by leveraging their local morphological context. This work presents a scalable and robust framework for generating physically plausible, high-resolution urban weather intelligence, essential for proactive applications in energy systems, public safety, and climate-adaptive urban planning.

How to cite: Zhang, Q. and Song, J.: An Inductive Spatio-Temporal Graph Network for Fine-Resolution Urban Weather Nowcasting Integrating Multi-Source Data and Physical Constraints, EGU General Assembly 2026, Vienna, Austria, 3–8 May 2026, EGU26-2288, https://doi.org/10.5194/egusphere-egu26-2288, 2026.

Urban green infrastructure (e.g., lawns, trees, green roofs) is a critical nature-based solution for mitigating urban heat island effect and reducing building cooling energy demand. While its biophysical processes, such as evapotranspiration, shading, and photosynthesis, are known to modify local microclimate and surface-atmosphere exchanges, most existing assessments rely on simplified, static representations of vegetation. This overlooks essential dynamic processes such as seasonal growth, phenological changes, greening-browning shifts due to heat and moisture stress responses, leading to uncertainties in quantifying its full cooling and energy-saving potential. To address this gap, we develop and apply an enhanced Urban Canopy Model (UCM) that integrates a dynamic ecohydrological module for vegetation with a building energy model capable of simulating outdoor thermal conditions and anthropogenic heat emissions. We first conducted comprehensive field campaigns in Wuhan, China, using a newly established urban eddy covariance tower and a green roof monitoring system, coupled with data on irrigation and other anthropogenic activities within the flux footprint. The model was rigorously validated against measurements of air/soil temperature, moisture, and turbulent heat fluxes. We then performed sensitivity analyses to evaluate how dynamic vegetation parameters (e.g., soil moisture, vegetation greenness, irrigation regimes) and building properties interactively affect outdoor microclimate and indoor energy demand. Our findings demonstrate that accounting for vegetation dynamics significantly improves the accuracy of microclimate and energy simulations, providing actionable insights for the planning and optimization of green infrastructure towards energy-efficient and climate-resilient cities.


How to cite: Zhang, J. and Song, J.: Modeling the Impact of Vegetation Dynamics on Urban Microclimate and Building Energy Demand, EGU General Assembly 2026, Vienna, Austria, 3–8 May 2026, EGU26-2289, https://doi.org/10.5194/egusphere-egu26-2289, 2026.

The successful implementation of marine spatial planning (MSP) and mitigation against coastal hazards needs to have access to a variety of quality data. Critical marine information, such as bathymetry, fisheries, biodiversity, aquaculture, coastal infrastructure, and oceanographic models, in the Sultanate of Oman is usually divided among ministries and institutions, is in a wide range of formats, and is not standardised in terms of metadata. This type of insulation would add to the absence of interoperability, discoverability, and reuse, which has a direct effect on evidence-based policy and sustainable development of a blue economy. This study fills this gap by designing and testing a conceptual model of a national Marine Spatial Data Infrastructure (MSDI), which is clearly designed to be founded on the FAIR (Findable, Accessible, Interoperable, Reusable) guiding principles. Going beyond a generic SDI model, the framework offers a customised way of implementation in the Omani context. The methodology will integrate an in-depth examination of the best practices of international MSDI, as well as a stakeholder requirements analysis of the main Omani government and research institutions. The suggested framework explains architectural elements, metadata profiles, semantic interoperability protocols, and a governance model in order to achieve long-term sustainability. This framework, as applied to the case study, can revolutionise the marine data situation in the Sultanate of Oman. Some major products are the prototype metadata catalogue, the semantic ontology of alignment between national data and international vocabularies, and a policy roadmap. The study also provides a generalisable template to other coastal countries and illustrates that FAIR-based MSDIs are not the technical systems and structures but the basic support systems of transdisciplinary ocean science, climate resilience and efficient maritime spatial governance.

How to cite: Al-Subhi, N., Al-Suqri, M., and Hamad, F.: Bridging the Data Gulf: Designing a FAIR-Compliant Marine Spatial Data Infrastructure for Sustainable Coastal Governance in The Sultanate of Oman, EGU General Assembly 2026, Vienna, Austria, 3–8 May 2026, EGU26-2356, https://doi.org/10.5194/egusphere-egu26-2356, 2026.

Xitou is a mid-elevation mountain forest region (1000–1200 m a.s.l.) in central Taiwan where intensive tourism infrastructure is embedded within an otherwise continuous forest ecosystem. This setting provides a rare opportunity to apply a spatially explicit monitoring framework to characterize urban heat island (UHI) effects using an ecologically meaningful forest reference state, rather than conventional urban–rural comparisons.

This study establishes a forest temperature gradient baseline based on year-long in-situ thermal observations from elevation-differentiated forest sites. The derived forest lapse rate exhibits pronounced diurnal asymmetry, with weaker daytime cooling and stronger nocturnal cooling, reflecting the combined influence of evapotranspiration, radiative processes, and boundary-layer stability. Expected forest temperatures at hotel elevations were then reconstructed from this baseline and compared with observed temperatures to isolate tourism-driven UHI intensity.

Results show that hotel developments generate a persistent warming of approximately 0.9–1.3 °C relative to the forest baseline. UHI intensity exhibits strong diurnal contrasts: one hotel shows pronounced nocturnal dominance, with nighttime warming nearly 1.8 times daytime values, indicating the importance of building heat storage and nighttime heating, while another shows comparable daytime and nighttime warming, suggesting substantial daytime anthropogenic heat emissions from tourism activities. Seasonally, UHI intensity is significantly stronger in winter and weaker in summer, contrary to typical urban patterns, highlighting seasonal modulation by forest evapotranspiration, which partially offsets anthropogenic heat during the growing season.

Despite the forest’s strong thermal buffering capacity, the results demonstrate that conversion of forest land to tourism facilities measurably intensifies local UHI, altering near-surface atmospheric stability and potentially affecting fog formation, boundary-layer processes, and forest microclimates. These thermal changes imply broader ecological impacts, including increased nighttime heat stress and disruption of forest–atmosphere energy exchanges.

How to cite: Lai, Y.-J. and Lin, P.-H.: Quantifying Urban Heat Island Effects in a Mountain Forest Tourism Area Using a Forest Reference Baseline, EGU General Assembly 2026, Vienna, Austria, 3–8 May 2026, EGU26-2402, https://doi.org/10.5194/egusphere-egu26-2402, 2026.

EGU26-3337 | Posters on site | BG10.12

Species-specific urban heat mitigation through shade and transpiration 

Christoph Bachofen and Rose Cotin

Urban trees mitigate heat stress through transpiration (latent heat flux, LE) and shading, thereby altering the surface energy balance and cooling their surroundings. The magnitude of this cooling varies among species and may be linked to functional traits such as wood anatomy (diffuse- vs. ring-porous xylem) and canopy structure (leaf area density, LAD). However, species-specific physiological responses to extreme urban climates, including heatwaves, remain insufficiently understood, limiting our knowledge of their role in heat stress alleviation.

We continuously monitored sap flow to assess LE cooling of Quercus robur, Quercus petraea, and Tilia × europaea in Lausanne during the 2025 growing season, which included two major heatwaves. We further assessed canopy and stomatal conductance, canopy surface temperatures (Tcan), and canopy morphology (LAD). Cooling effects were assessed using below- and outside-canopy measurements of air temperature (Tair), relative humidity, and black globe temperature (TBG).

Our results show that the diffuse-porous T. europaea achieved up to three times higher LE cooling compared to the two Quercus species. Combined with its higher LAD, this resulted in significantly lower Tair and TBGbeneath its canopy, particularly under high irradiance and temperature conditions. This translated into substantially reduced heat stress for people beneath T. europaea canopies. Tcan was similar across species and did not approach critical thresholds for photosystem damage.

Despite repeated heatwaves, all species maintained high transpiration rates and effective shading. Our findings suggest that species with diffuse-porous xylem and dense canopies are particularly effective for urban cooling, provided their physiological tolerance to heat is not exceeded. In cities experiencing intermittent heatwaves, urban vegetation can therefore continue to provide reliable microclimatic cooling through transpiration and shade.

How to cite: Bachofen, C. and Cotin, R.: Species-specific urban heat mitigation through shade and transpiration, EGU General Assembly 2026, Vienna, Austria, 3–8 May 2026, EGU26-3337, https://doi.org/10.5194/egusphere-egu26-3337, 2026.

With the acceleration of urbanization, the urban heat island effect has become a critical issue in the context of global climate change. As a representative city in southwestern China, Chengdu has experienced pronounced changes in land surface temperature (LST) and near-surface air temperature (T2) as a result of urbanization. To investigate the spatiotemporal characteristics of the discrepancies between LST and T2 in Chengdu under an urbanization background and to elucidate the underlying physical mechanisms, this study integrates meteorological station observations, the MODIS land surface temperature/emissivity monthly product (MYD11C2), and the ERA5-Land reanalysis dataset with numerical simulations from the Weather Research and Forecasting (WRF) model. The variations in land surface temperature and their associated surface energy balance processes are examined across multiple temporal scales and spatial resolutions.

First, this study compares daytime and nighttime land surface temperatures in Chengdu for the years 2003 and 2023. The results indicate that daytime LST derived from MYD11C2 is generally higher than that from ERA5-Land and exhibits a larger range of variability. Secondly, the performance of the WSM6 and Thompson microphysics schemes in simulating air temperature and precipitation over Chengdu was evaluated. By comparing the root mean square errors (RMSEs) against meteorological station observations, the results show that the WSM6 scheme performs slightly better than the Thompson scheme in air temperature simulations, whereas the Thompson scheme exhibits a clear advantage over WSM6 in precipitation simulations. These findings indicate that the choice of microphysics scheme exerts a significant influence on model performance for different meteorological variables, and that an appropriate scheme should be selected according to the specific research objectives.

To further elucidate the mechanisms underlying the divergence between land surface temperature and air temperature, this study integrates a surface energy balance analysis based on the WRF model to investigate the primary drivers of the LST–T2 differences. The results demonstrate that variations in surface energy partitioning—particularly changes in net radiation, sensible heat flux, and latent heat flux—are key factors governing the formation of discrepancies between LST and T2. In addition, urban surface characteristics, such as the proportion of impervious surfaces and building density, play an important role in modulating the differences between land surface temperature and near-surface air temperature.

How to cite: Zhang, Y.: Investigating the Spatiotemporal Characteristics and Energy Balance Physical Mechanisms of the Difference between Land Surface Temperature and Air Temperature in Chengdu Based on the WRF Model, EGU General Assembly 2026, Vienna, Austria, 3–8 May 2026, EGU26-6406, https://doi.org/10.5194/egusphere-egu26-6406, 2026.

EGU26-7250 | ECS | Posters on site | BG10.12

Scaling urban tree cooling and its socioeconomic distribution 

Josephine Reek, Constantin Zohner, Vincent Jonsson, and Loïc Pelissier

Urban greening with trees and other vegetation is gaining popularity as a means to benefit urban populations, particularly by mitigating heat exposure. At the same time, concerns about equity in the distribution of urban greenspaces and their benefits have become central to urban climate planning and research. A persistent challenge in the field is the trade-off between data accuracy and scale. Detailed, empirical ground data is typically only available for individual cities, whereas broader comparative or global analyses must rely on satellite data and extrapolated or heavily aggregated socioeconomic data. Here, we compare these approaches in the context of the socioeconomic distribution of urban tree-related cooling benefits. We derive multiple metrics using ground-based temperature measurements, satellite data, and census-based socioeconomic indicators. By benchmarking analyses based on broadly available datasets against those using detailed local measurements, we assess the extent to which large-scale, data-sparse approaches reproduce patterns observed in high-resolution ground data. Using several US and European cities as case studies, we then assess the spatial distribution of cooling effects in relation to socio-economic conditions of the neighbourhood. Our results provide guidance on the reliability and limitations of commonly used data sources for assessing equity in urban heat mitigation benefits across cities and regions.

How to cite: Reek, J., Zohner, C., Jonsson, V., and Pelissier, L.: Scaling urban tree cooling and its socioeconomic distribution, EGU General Assembly 2026, Vienna, Austria, 3–8 May 2026, EGU26-7250, https://doi.org/10.5194/egusphere-egu26-7250, 2026.

EGU26-7382 | ECS | Orals | BG10.12

Modeling of rooftop mitigation strategies in arid climates based on local climate zones using WRF  

Amjad Azmeer, Buri Vinodhkumar, Furqan Tahir, and Sami Al-Ghamdi

Rapid urbanization and extreme heat pose growing energy and thermal comfort challenges for citizens living in arid cities such as Riyadh. Rooftop-based heat mitigation strategies are being deployed across cities as potential mitigation solutions to extreme heat. However, the city-wide temperature reduction achieved by rooftop strategies under arid conditions remains inadequately quantified across different urban morphologies. This study employs Weather Research and Forecasting (WRF) with the urban canopy model (UCM) to evaluate the cooling potential of cool roofs, green roofs, and rooftop photovoltaic (PV) systems during a six-day heatwave event in Riyadh. The Local Climate Zone (LCZ) framework is used to differentiate rooftop mitigation performance across urban morphologies. The post-processing analysis evaluates air temperature, surface temperature, and surface energy fluxes across the different scenarios. Results indicate that daytime surface temperatures are reduced by up to 1.23 °C for green roofs and up to 4.62 °C for super cool roofs relative to the base case, with the strongest cooling observed over compact low-rise LCZs. Cool roofs also produce substantially lower sensible heat fluxes than green roofs across all urban LCZ Categories. Green roofs provide localized evaporative cooling benefits but are less effective than cool roofs at reducing city-wide temperatures under arid conditions. The results also show that cooling benefits vary across LCZs, with compact low-rise neighborhoods showing the greatest temperature reductions. Overall, the findings demonstrate that modeling frameworks that integrate LCZs and WRF simulations can inform evidence-based rooftop mitigation strategies to enhance heat resilience in arid climates.

How to cite: Azmeer, A., Vinodhkumar, B., Tahir, F., and Al-Ghamdi, S.: Modeling of rooftop mitigation strategies in arid climates based on local climate zones using WRF , EGU General Assembly 2026, Vienna, Austria, 3–8 May 2026, EGU26-7382, https://doi.org/10.5194/egusphere-egu26-7382, 2026.

Rapid urbanization and global climate change have intensified the urban heat island (UHI) effect, posing significant risks to public health and urban livability. Street-level shading is a vital passive cooling strategy to mitigate heat stress and enhance pedestrian thermal comfort. However, traditional methods often struggle to achieve large-scale, high-precision identification of diverse shade facilities—such as building overhangs, street trees, and specific structures like arcades (Qilou)—across the urban pedestrian network.

This research proposes a comprehensive framework leveraging Street View Imagery (SVI) and advanced AI analytics to bridge this gap. Initially, the study employs the YOLOv11 (You Only Look Once) deep learning architecture to automatically detect and quantify heterogeneous shading elements. By training on high-resolution SVI datasets, the model identifies multi-type shade facilities including building facades, arcades, street trees, and artificial awnings in complex urban environments.

Subsequently, the research evaluates the synergistic effects of these facilities on the pedestrian thermal environment. The extracted geospatial shade data are integrated with microclimate simulation tools to quantify their impact on thermal comfort indicators. Key parameters, such as the Sky View Factor (SVF), are derived from the pedestrian perspective to evaluate shading performance and its role in reducing heat exposure.

The findings are visualized through high-resolution thematic maps depicting shade coverage density and thermal comfort assessment results. This research provides urban planners and managers with scientific decision-making evidence to identify shade-deficient areas and optimize street designs for heat-risk reduction. By combining YOLOv11-based object detection with geospatial analytics, this study offers a scalable approach to enhance urban climate resilience and support sustainable, walkable urban development.

How to cite: Gu, M., Yin, S., Zhong, L., Zhou, J., and Xia, D.: Deep Learning-based Identification of Urban Pedestrian Shade Facilities and Thermal Environment Assessment using Street View Imagery, EGU General Assembly 2026, Vienna, Austria, 3–8 May 2026, EGU26-8982, https://doi.org/10.5194/egusphere-egu26-8982, 2026.

EGU26-10235 | ECS | Posters on site | BG10.12

Regional downscaling for extreme events 

Emmanuel Francisco Alcantara, Vlad Stefan Barbu, and Luminita Danaila

Urban heat islands (UHIs) are areas within urban environments where air temperatures are consistently higher than those in surrounding rural areas. UHIs arise from urban morphology, anthropogenic heat emissions, and altered radiative and evapotranspiration balances. 

The local effects of urban heat islands during extreme events (e.g., heat waves) are difficult to predict, in great part due to the mismatch between large-scale atmospheric processes and small-scale urban physics, and the mechanisms involved in the overall energy transfer during the formation, persistence, and decay of UHIs under these circumstances still remain unclear. The objective of this study is to determine the triggering factors that influence these mechanisms and to better understand the onset of this phenomenon.

We use experimental observations from a network of meteorological stations with a 10-minute sampling rate, deployed between March and December 2025 in six cities near the Rouen metropolitan area in Normandy (France), along the Seine River. The dataset obtained by these stations is complemented by publicly available data from local operational stations.

We calculate urban–rural temperature differences and their temporal variability under different general and local conditions of paired urban–rural sites, using a combination of physical and statistical analyses, such as moment analysis, auto- and cross-correlation analysis, and temporal evolution of the probability density function for temperature measurements. Preliminary results indicate that urban temperatures are on average about 1°C higher than those in neighboring rural areas, with peaks reaching up to 5°C in four cities along the Seine Valley, near Rouen, between June 19 and July 4 and between August 8 and 18, 2025, periods during which heat waves were reported in France. During these periods, we found that most stations reached these peak values at night, consistent with the normal UHI behavior reported in the literature.

Future work will focus on reproducing observed UHI patterns through high-temporal- and spatial-resolution numerical simulations with the Weather Research and Forecasting (WRF) model. Subsequently, Markov processes will be explored to develop a UHI prediction model based on experimental data from the stations and results from numerical simulations.

How to cite: Francisco Alcantara, E., Barbu, V. S., and Danaila, L.: Regional downscaling for extreme events, EGU General Assembly 2026, Vienna, Austria, 3–8 May 2026, EGU26-10235, https://doi.org/10.5194/egusphere-egu26-10235, 2026.

Accelerating climate change has intensified urban heat risks, particularly in coastal cities where urban heat island effects interact with maritime climatic influences, yet spatially explicit frameworks that diagnose heterogeneous vulnerability mechanisms remain limited. Busan, a representative coastal metropolis in South Korea, faces high heatwave vulnerability due to dense urban development, rapid population aging, and limited green space.

This study develops a spatial heat vulnerability assessment framework for Busan that integrates physical thermal conditions and social vulnerability to classify high-risk areas into distinct typologies representing different vulnerability pathways, and to inform tailored resilience strategies.

Satellite-derived thermal indicators, demographic characteristics, infrastructure accessibility, and building conditions were combined to construct composite indices of exposure, sensitivity, and adaptive capacity.  These indices were then jointly analyzed to derive typology-based vulnerability patterns, and spatial clustering analysis using Local Indicators of Spatial Association was applied to identify statistically significant spatial concentrations.

The results highlight Jung-gu and Sasang-gu as representative high-vulnerability districts characterized by structurally distinct vulnerability mechanisms. Jung-gu exhibits high exposure and sensitivity driven by dense commercial development and limited vegetation, whereas Sasang-gu shows low adaptive capacity due to aging buildings and insufficient green infrastructure, illustrating different pathways through which heatwave vulnerability is produced.

These findings demonstrate that heatwave vulnerability emerges from coupled social and environmental structures, and indicate that typology-specific interventions provide an evidence-based foundation for climate adaptation planning and urban resilience in coastal metropolitan cities facing intensifying heatwave risks.

†This research was supported by "Development of living shoreline technology based on blue carbon science toward climate change adaptation" of Korea Institute of Marine Science & Technology Promotion (KIMST) funded by the Ministry of Oceans and Fisheries (KIMST-20220526)

How to cite: Tae, M. and Chon, J.: Spatial Assessment of Urban Heat Vulnerability and Typology-Based Diagnostic Framework for Resilience Strategies in Busan, South Korea, EGU General Assembly 2026, Vienna, Austria, 3–8 May 2026, EGU26-10502, https://doi.org/10.5194/egusphere-egu26-10502, 2026.

Urban heat represents a growing environmental and societal challenge, particularly during heatwave events, when the interaction between climate extremes and urban form amplifies thermal exposure. Advancing the characterization of urban heat therefore requires geospatial approaches capable of capturing both temporal dynamics and fine-scale spatial heterogeneity. This study investigates Surface Urban Heat Island (SUHI) intensity and intra-urban land surface temperature (LST) patterns during heatwaves in three climatically contrasting Argentine cities: Posadas (humid subtropical city), Buenos Aires (temperate coastal megacity), and Neuquén (semi-arid Patagonian city).

We apply an integrated geospatial framework combining high-temporal-resolution MODIS LST data with high-spatial-resolution Landsat 8 and Sentinel-2 imagery. Heatwave periods are analysed to quantify daytime and nighttime SUHI across urban, peri-urban, and rural zones, while Local Climate Zones (LCZs) are mapped to assess how urban morphology, land cover, and vegetation modulate thermal patterns at the intra-urban scale. Statistical analyses are used to evaluate significant temperature differences among zones and urban typologies under extreme heat conditions.

Results reveal strong inter-city contrasts and complex spatial responses. Posadas and Buenos Aires exhibit pronounced nocturnal SUHI, reflecting urban heat retention during heatwaves, whereas daytime patterns differ substantially depending on regional context. In Neuquén, a heterogeneous thermal response emerges, including a negative daytime SUHI relative to the surrounding semi-arid plateau, highlighting the influence of soil moisture, vegetation scarcity, and topography. Across all cities, compact and densely built LCZs consistently show higher LST, while vegetated areas, river corridors, and water bodies act as persistent cooling zones during heat extremes.

By integrating multi-source geospatial data within an LCZ-based analytical framework, this study advances the characterization of urban heat under extreme conditions and provides transferable insights for climate-resilient urban planning, heat risk mitigation, and spatially targeted adaptation strategies.

How to cite: Cimolai, C. and Aguilar, E.: Characterizing heatwave-driven urban heat patterns using multi-source geospatial data: SUHI dynamics and intra-urban thermal variability in Argentine cities, EGU General Assembly 2026, Vienna, Austria, 3–8 May 2026, EGU26-12717, https://doi.org/10.5194/egusphere-egu26-12717, 2026.

Surface Heat Island (SUHI) is a result of complex and non-linear interactions between atmospheric processes and urban surface features. These interactions operate at different spatiotemporal scales. Research shows that surface coverage and urban morphology affect the urban thermal environment; however, most SUHI modeling approaches still rely on surface features and mostly ignore important parameters such as atmospheric humidity and precipitation. This problem limits the ability of existing SUHI models to accurately represent interactions between the surface and atmosphere and thermal variability.

This research presents a deep learning-based framework for SUHI modeling which is developed based on integrating urban, atmospheric, and environmental features. The proposed framework integrates Landsat-derived land surface indicators, including Land Surface Temperature (LST), the Normalized Difference Vegetation Index (NDVI), which represents vegetation cover, the Normalized Difference Built-up Index (NDBI) and Night Time Light (NTL), which  characterize built-up areas, and the Normalized Difference Water Index (NDWI), which represents surface water bodies, with GNSS-derived Precipitable Water Vapor (PWV) as a measure of atmospheric humidity and Global Precipitation Measurement (GPM) data. Other effective parameters include topography from the Advanced Spaceborne Thermal Emission and Reflection Radiometer (ASTER) digital elevation model and population density in different part of the city.

A Convolutional Neural Network (CNN) architecture is developed to capture spatial dependencies in urban areas and to understand the non-linear interactions between surface, atmospheric, social, and environmental features. This model is composed of many stacked convolutional layers with regularization and pooling algorithms to maintain generalization and preserving spatial structure. SUHI intensity, defined as the contrast between LST in urban and rural areas, is used as the target for prediction. Model training and validation are based on cross-validation to assess robustness and transferability across different temporal subsets.

The case study is Wrocław, Poland that has been experiencing rapid urban development and has undergone substantial land-use and structural transformation over the past decade. Comparisons between results from models that include and exclude humidity and precipitation demonstrate that GNSS-derived PWV and precipitation play a significant role in SUHI modeling.

The results highlight the importance of accounting for urban–atmosphere interactions in SUHI modeling. This deep learning framework provides a practical basis for subsequent eXplainable Artificial Intelligence (XAI) analyses. XAI analysis can identify SUHI drivers and support climate-resilient urban planning and heat mitigation strategies.

How to cite: Tasan, M. and Dąbrowska, J.: Deep Learning–Based Modeling of Surface Urban Heat Island Integrating GNSS-Derived Atmospheric Humidity and Multi-Source Urban Data, EGU General Assembly 2026, Vienna, Austria, 3–8 May 2026, EGU26-12749, https://doi.org/10.5194/egusphere-egu26-12749, 2026.

EGU26-12756 | Orals | BG10.12

Satellite-derived Land Surface Temperatures Strongly Mischaracterise Urban Heat Hazard 

Benjamin Bechtel, Simone Kotthaus, Wenfeng Zhan, Huilin Du, Negin Nazarian, Tirthankar Chakraborty, Scott Krayenhoff, Alberto Martilli, Marzie Naserikia, Matthias Roth, Panagiotis Sismanidis, Iain Stewart, and James Voogt

Escalating urban heat, driven by the convergence of global warming and rapid urbanization, is a profound threat to billions of city dwellers. Effective action to address this challenge requires reliable metrics and data, which are often not readily available. Consequently, the science directing urban heat adaptation is strongly influenced by studies that use satellite-based land surface temperature (LST), which is globally available and address data gaps in cities, particularly in the Global South. Hence, LST now often serves as the default lens through which many cities view their heat realities. Yet this lens is fundamentally misfocused. LST, is a poor surrogate for near-surface air temperature, physiologically relevant human thermal comfort, or direct human heat exposure. This flawed practice leads to issues for several downstream use cases by inflating adaptation benefits, distorting the magnitude and variability of urban heat signals across scales, and thus misguiding urban adaptation policy. Drawing on remote sensing, climate science, and governance theory, we clarify what LST does and does not represent and expose where its use drifts most dangerously across disciplines. We argue that satellite-based LST must be treated as a distinct indicator of surface climate, which, though relevant to the urban surface energy budget, is frequently decoupled from human-relevant thermal impacts. We then advance practical guardrails and principles for using LST wisely, alongside a Surface-to-Society framework to re-align urban heat governance with metrics grounded in human heat exposure. We argue that the global community must urgently pivot from cooling pixels to cooling people.

How to cite: Bechtel, B., Kotthaus, S., Zhan, W., Du, H., Nazarian, N., Chakraborty, T., Krayenhoff, S., Martilli, A., Naserikia, M., Roth, M., Sismanidis, P., Stewart, I., and Voogt, J.: Satellite-derived Land Surface Temperatures Strongly Mischaracterise Urban Heat Hazard, EGU General Assembly 2026, Vienna, Austria, 3–8 May 2026, EGU26-12756, https://doi.org/10.5194/egusphere-egu26-12756, 2026.

Abstract: Global warming and rapid urbanization are intensifying the complexity of urban thermal environments, exacerbating heat exposure disparities across diverse scales and demographics. Within the IPCC framework, urban heat risk emerges from the dynamic interaction of hazard, exposure, and vulnerability. While significant progress has been made in quantifying these components—leveraging remote sensing for hazards, human mobility for exposure, and socioeconomic indices for vulnerability—a large-scale synthesis evaluating the global evolution and integration of these research paradigms remains absent.

To bridge this gap, this study conducted a comprehensive search on the Web of Science using a Boolean strategy encompassing three core dimensions: urban thermal hazards, population exposure, and social vulnerability. This process yielded a corpus of over 7,000 peer-reviewed papers published between 2000 and 2025. Leveraging a Large Language Model (LLM), we autonomously extracted geographical metadata and thematic focus from the abstracts. Furthermore, this study analyzed the research dynamics and epistemological shifts in urban heat risk research based on searching results. Our findings reveal: (1) An unprecedented explosion in academic interest, with annual publications surging 150-fold, reflecting the urgency of heat adaptation. (2) A clear paradigm shift from a historical preoccupation with physical hazards toward holistic, multidimensional risk frameworks, particularly over the last five years. (3) A persistent thematic imbalance; hazard assessments still dominate (accounting for over 85% of literature), while human exposure and social vulnerability remain significantly underrepresented. (4) A pronounced "digital divide" in knowledge production, with research heavily concentrated in China and the United States. This leaves critical data voids in highly vulnerable regions of the Global South, including parts of Africa and Southeast Asia. This study underscores the necessity of bridging thematic and geographic divides to foster equitable global urban heat resilience.

Keywords: Urban heat risk, Hazard-exposure-vulnerability, Spatial inequality, Research evolution

How to cite: Tong, M.: From Hazards to Integrated Risks: Decoding Disparities in Global Urban Heat Research, EGU General Assembly 2026, Vienna, Austria, 3–8 May 2026, EGU26-12805, https://doi.org/10.5194/egusphere-egu26-12805, 2026.

EGU26-12814 | ECS | Orals | BG10.12

Daily Air Temperature Mapping in Urban Areas from Satellite Land Surface Temperature and ERA5 Data 

Daniele Settembre, Davide De Santis, Dario Cappelli, and Fabio Del Frate

Urban areas are increasingly affected by environmental and public health challenges driven by rising temperatures. Due to ongoing climate change and the increased presence of greenhouse gases in the atmosphere, the frequency and duration of heatwaves are expanding. These phenomena have serious implications for human health, particularly among vulnerable populations such as the elderly, individuals with pre-existing cardiovascular or respiratory conditions, and disadvantaged socio-economic communities.

Air temperature at 2 meters above the surface is a critical variable for assessing climate change impacts and thermal stress, especially in densely populated urban environments. However, ground-based observations of air temperature are often sparse, mostly concentrated in developed regions, and frequently suffer from temporal gaps. This spatial and temporal inconsistency limits our ability to monitor urban thermal conditions effectively. On the other hand, satellite data provide continuous and global measurements of land surface temperature (LST), but do not directly measure air temperature. Since LST and air temperature are not equivalent, translating satellite-based LST into reliable air temperature estimates remains challenging.

In this work, we developed a statistical approach that leverages MODIS satellite observations and ERA5-Land model data across the 70 largest and most populous cities worldwide, geographically distributed with a maximum of three cities per country to prevent national over-representation and ensure global balance. The dataset spans from 2012 to 2023 and is categorized by three latitudinal zones equatorial (0 to ±15°), tropical-temperate (±15° to ±45°), and temperate-subpolar (±45° to ±75°) and by month, distinguishing between day and night observations.

For each geographical and temporal class, we fit the parameters of the equation:

Tair = a * LSTday + b * LSTnight + c   [1]

This resulted in parameter triplets (a, b, c) specific to each month and latitude band. These parameters were then applied to MODIS and VIIRS data, for the year 2024, to assess the inter-sensor scalability. The resulting air temperature estimates are obtained at the native spatial resolution of the input datasets (1 kilometer). The method operates on a daily basis, leveraging both daytime and nighttime satellite acquisitions to ensure consistent and temporally detailed air temperature estimates, an essential feature for capturing urban thermal dynamics and short-term variability, such as the urban heat island effect.

The model was validated using data from the year 2024 for the same cities, with the ERA5-Land dataset (https://cds.climate.copernicus.eu/datasets/reanalysis-era5-land?tab=overview) serving as a reference. Pearson correlation coefficients ranged from 84% to 93% for daytime temperatures and from 77% to 93% for nighttime temperatures.

The approach is also adaptable to ongoing and future satellite missions with improved spatial resolution (e.g. ECOSTRESS). Looking toward future developments, the integration of Artificial Intelligence could further enhance this methodology by incorporating additional weather variables, improving the representation of complex ambient conditions. This work represents a promising advancement in the field of high-resolution, daily thermal comfort assessments across urban areas, offering a scalable and flexible tool for heat-related stress monitoring.

[1] Hooker, J. et al., A. A global dataset of air temperature derived from satellite remote sensing and weather stations. (2018). https://doi.org/10.1038/sdata.2018.246

How to cite: Settembre, D., De Santis, D., Cappelli, D., and Del Frate, F.: Daily Air Temperature Mapping in Urban Areas from Satellite Land Surface Temperature and ERA5 Data, EGU General Assembly 2026, Vienna, Austria, 3–8 May 2026, EGU26-12814, https://doi.org/10.5194/egusphere-egu26-12814, 2026.

EGU26-13195 | ECS | Orals | BG10.12

Satellite high-resolution thermal infrared imagery for UHI monitoring 

Mattia Pecci, Alessia Scalabrini, Maria Fabrizia Buongiorno, Massimo Musacchio, Malvina Silvestri, and Federico Rabuffi

Climate change is driving a sustained increase in global temperatures and an intensification of extreme events, including heatwaves. Urban areas are particularly vulnerable, as they are characterized by higher temperatures compared to surrounding suburban and rural environments, a phenomenon known as the Urban Heat Island (UHI). This effect is primarily associated with the presence of buildings and inhomogeneous surfaces, which modify surface energy and water exchanges as well as local wind circulation. Additional factors, such as land-use changes, reduction of vegetated areas, local anthropogenic heat emissions (e.g. traffic and air conditioning), and air pollution, further alter the urban heat balance.

The UHI strongly affects urban climate, ecosystems, air quality, and human thermal comfort, and its impact is exacerbated during heatwaves, posing significant risks to human health. Therefore, monitoring and characterizing UHI is crucial for climate mitigation and adaptation strategies.

Satellite-derived Land Surface Temperature (LST) provides an effective means to investigate the Surface Urban Heat Island (SUHI), enabling comprehensive spatial and temporal analyses of urban thermal patterns, identification of hot- and cold-spots, and assessment of mitigation measures such as high-albedo materials and urban green areas.

In this study, thermal infrared satellite observations are used to analyze LST over selected urban areas in Central and Southern Italy, with the aim of characterizing SUHI dynamics. Long-term variations (>10 years) are investigated using Landsat 8 data (100 m spatial resolution, 16-day revisit time, available since 2013). For recent years, Landsat 8 and 9 observations (8-days revisit time when used in combination) are combined with ECOSTRESS data (70 m spatial resolution, variable overpass times, 1–2 day revisit), significantly enhancing temporal sampling. This multi-sensor approach enables an improved assessment of urban temperature evolution and its response to climate change.

This work was supported by the ASI SpaceItUp contract N. 2024-5-E.0, CUP

I53D24000060005., SPOKE 5 and SPOKE 7 activities.

How to cite: Pecci, M., Scalabrini, A., Buongiorno, M. F., Musacchio, M., Silvestri, M., and Rabuffi, F.: Satellite high-resolution thermal infrared imagery for UHI monitoring, EGU General Assembly 2026, Vienna, Austria, 3–8 May 2026, EGU26-13195, https://doi.org/10.5194/egusphere-egu26-13195, 2026.

EGU26-13264 | ECS | Orals | BG10.12

Understanding urban tree shade: characterizing direct shortwave transmissivity through urban tree canopies using Terrestrial LiDAR Scanning 

Todi Daelman, Hans Verbeeck, Matthias Demuzere, and Frieke Vancoillie

Tree shading is one of the most effective mechanisms to improve daytime human thermal comfort, specifically in urban contexts where exposure to direct shortwave radiation dominates heat stress. The quality and quantity of tree shading are heavily controlled by canopy closure and crown architecture. However, with limited data on the link between tree structure in different tree species and their shade quality, these relationships are frequently overlooked both in practice and in urban microclimate modelling.

In this study, we present a new framework to quantify tree shading potential using Terrestrial Laser Scanning (TLS). The TLS scan of a tree is used to derive its canopy gap fraction, which represents a proxy for direct shortwave radiation transmissivity. We evaluate different processing methods (laser pulse-based and point-based) and perform a digital validation of the different approaches. After validating and selecting the most appropriate method, the transmissivity values are linked back to the tree’s structural characteristics which can be derived from the TLS point cloud information. By including indices such as tree height, crown volume, and leaf area density, we investigate the link between tree structure and shading behavior.

The proposed framework is applied to a database of over 50 individually scanned urban trees, all measured in summer across multiple cities in Belgium. This allows for a comparison of shading capabilities between different tree species and morphologies. In addition to the expected differences in overall transmissivity between trees, preliminary results reveal strong variations in gap fraction across different zenith angles, with transmissivity values ranging from 3 to 28% at low and high zenith angles, respectively. This indicates not only a variation in shading intensity between individual trees, but also potential differences throughout the day.

These results are informative for comparing urban tree species and their management strategies when the goal is to optimize pedestrian shading and thermal comfort. Additionally, they provide empirically derived parameters to improve the representation of tree structure and shading effects in urban microclimate models.

How to cite: Daelman, T., Verbeeck, H., Demuzere, M., and Vancoillie, F.: Understanding urban tree shade: characterizing direct shortwave transmissivity through urban tree canopies using Terrestrial LiDAR Scanning, EGU General Assembly 2026, Vienna, Austria, 3–8 May 2026, EGU26-13264, https://doi.org/10.5194/egusphere-egu26-13264, 2026.

EGU26-13567 | ECS | Orals | BG10.12

Developing a Historical Building Classification for Mapping Urban Thermal and Morphology Parameters in Urban Climate Models 

Bianca Eline Sandvik, Dragan Milošević, Peter Kalverla, Claire Donnelly, and Gert-Jan Steeneveld

Historic variations in building regulations and construction practices have shaped the thermal properties of today’s urban fabric, yet these differences are often neglected or oversimplified in urban weather and climate models. Building materials, insulation levels, and construction techniques vary strongly across construction periods, leading to spatial differences in heat storage and release, energy demand, and vulnerability to temperature extremes. Most current urban mesoscale models rely on generic classifications, such as Local Climate Zones (LCZs), which limits their ability to capture this heterogeneity and reduces the accuracy and reliability of weather and climate forecasts.

Using Amsterdam (The Netherlands) as a case study, we present a novel geospatial modeling framework that explicitly incorporates historical building characteristics into numerical weather and climate simulations. Based on detailed cadastral data and an extensive review of historical building regulations and practices in The Netherlands, we define ten “heritage building classes” representing distinct construction periods and their typical thermal properties. These classes are mapped across the city using GIS techniques, producing high-resolution heritage building maps. For each class, representative thermal parameters are derived and implemented into the Weather Research and Forecasting (WRF) model.

We assess the sensitivity of simulated urban temperatures to these period-specific building properties and evaluate model performance against in-situ meteorological observations from the Amsterdam Atmospheric Monitoring Supersite (AAMS). This approach provides a scalable pathway for integrating historically informed building characteristics into urban climate models, creating a foundation for future improvements in urban climate simulation.

How to cite: Sandvik, B. E., Milošević, D., Kalverla, P., Donnelly, C., and Steeneveld, G.-J.: Developing a Historical Building Classification for Mapping Urban Thermal and Morphology Parameters in Urban Climate Models, EGU General Assembly 2026, Vienna, Austria, 3–8 May 2026, EGU26-13567, https://doi.org/10.5194/egusphere-egu26-13567, 2026.

EGU26-14736 | ECS | Posters on site | BG10.12

Scalable Mapping of Urban Green Cooling Services Using AlphaEarth Foundations 

Hanyu Li, Alby Duarte Rocha, and Christine Wallis

Under the combined influence of global warming and rapid urbanization, extreme heat has become a major challenge for urban resilience and public health. Urban green infrastructure provides important cooling benefits through evapotranspiration and shading, yet spatially explicit assessment of these services remains challenging. Existing approaches rely heavily on computationally expensive physical models and dense input data, which limits their applicability beyond well-studied regions. In this study, we present a scalable approach for mapping urban green cooling services by combining Earth observation foundation models with insights from process-based modeling. We use the Green Cooling Services Index (GCoS) as the core metric, which is derived from simulations of the Soil-Canopy-Observation of Photosynthesis and Energy Fluxes (SCOPE) model. To enable large-scale applications, we build a surrogate model that maps annual multimodal satellite embedding vectors from AlphaEarth Foundations to GCoS reference data. These embeddings integrate multisource Earth observation information across the full year, capturing key vegetation phenology and climate dynamics. The analysis covers 14 Functional Urban Areas across Europe and surrounding regions. Model performance is evaluated through three complementary experiments: a continent-scale assessment, a leave-one-city-out test, and stratified error analyses in representative cities. Results show that the surrogate approach can reproduce vegetation cooling effects with high accuracy while requiring substantially fewer data and computational resources than conventional physical models. Importantly, the model maintains stable performance when applied to cities not included in training. This framework addresses a key scalability gap in urban heat assessments and enables consistent mapping of green cooling services in data limited regions.

How to cite: Li, H., Duarte Rocha, A., and Wallis, C.: Scalable Mapping of Urban Green Cooling Services Using AlphaEarth Foundations, EGU General Assembly 2026, Vienna, Austria, 3–8 May 2026, EGU26-14736, https://doi.org/10.5194/egusphere-egu26-14736, 2026.

Cities around the world, including those located in predominantly cold climates that were once thought to be relatively immune to warming, are experiencing rapid temperature increases and more frequent heatwave events, with substantial impacts on people’s well-being and critical urban infrastructure. Green infrastructure (GI) can help mitigate these impacts by cooling through shade and evapotranspiration, but expanding vegetation cover is increasingly difficult because of land competition driven by urbanization. This makes it critical to understand how to maximize the cooling effect of a given amount of vegetation. Key considerations include the fact that different types of vegetation can confer varying levels of cooling and that the spatial distribution of vegetation can influence its cooling impact.

In this presentation, we report preliminary findings from a large ongoing study comparing 12 cities in Southern Ontario, Canada. We mapped two types of vegetation (i.e., trees and shrubs/grass) using Sentinel satellite imagery, and examined how different aspects of their spatial patterns, quantified using landscape metrics, affect land surface temperature (LST) derived from Landsat imagery averaged over summer months. We evaluate and compare these relationships across cities of different sizes, from small cities with fewer than 500,000 residents to large metropolitan areas such as Toronto. We also investigate how the relationship between GI spatial patterns and LST varies across spatial scales, and we evaluate multiple modelling approaches, including spatial regression models, as well as advanced machine learning (ML) and deep learning (DL) models, including random forest and convolutional neural networks.

Our findings to date yield several insights:

  • In all cities, the spatial pattern of GI exerts a significant influence on LST even after controlling for the total amount of vegetation. However, the relative importance of specific spatial pattern characteristics (e.g., connectivity, geometric complexity of patches) varies across cities, with distinct differences between larger and smaller urban areas.
  • Consistent with existing literature, trees provide substantially greater cooling effects than shrubs/grass, although the magnitude of cooling varies meaningfully across cities.
  • The influence of spatial pattern on LST is strongly scale-dependent, with relationships generally strengthening from finer to intermediate spatial scales, and also varying with the shape of analytical units.
  • Spatial regression models prove essential for accurately characterizing vegetation–temperature relationships, as non-spatial models tend to overestimate effect sizes and increase the likelihood of falsely identifying significant relationships.
  • While machine learning and deep learning models excel at prediction, spatial regression models continue to offer interpretative insights not captured by ML and DL models. We provide recommendations on the appropriate use of each model.

We believe these findings help fill an important knowledge gap on cold-climate cities, particularly in the Canadian context, where urban morphology may differ from that of other cold-region cities. Our results provide a more nuanced understanding of how vegetation type, spatial configuration, and scale interact to shape cooling, and they offer practical guidance for policymakers and practitioners on strategically deploying GI to maximize cooling benefits.

How to cite: Masoudi, M. and Mahdianpari, M.: Understanding Green Infrastructure-Temperature Relationships in Cold-Climate Cities: Evidence from 12 Canadian Urban Areas, EGU General Assembly 2026, Vienna, Austria, 3–8 May 2026, EGU26-15300, https://doi.org/10.5194/egusphere-egu26-15300, 2026.

Severe PM2.5 pollution (particles with an aerodynamic diameter ≤ 2.5 μm) and the urban heat island (UHI) effect pose serious threats to human health and living environments in densely populated cities. However, the specific role of aerosols in shortwave and longwave radiation transfer, as well as the mechanisms through which radiation processes affect urban heat island intensity (UHII), remain insufficiently understood. In this study, the WRF-Chem model was employed to simulate several typical pollution episodes during 2016–2017. We quantitatively assessed aerosol radiative forcing and further distinguished the contributions of different aerosol components to shortwave and longwave radiation, systematically analyzing their impacts on surface UHI, canopy-layer UHI, and boundary-layer UHI. The results show that, overall, boundary-layer UHI increases with worsening pollution, while the peak intensities of surface and canopy-layer UHIs are significantly weakened under polluted conditions. However, during sustained pollution episodes, as pollution intensifies, the maximum UHI intensities of both tend to increase. To exclude the influence of indirect aerosol radiative effects, periods with high pollution but low cloud cover were selected for further analysis. Comparative sensitivity experiments reveal that absorbing aerosols enhance UHIs at all levels, particularly daytime canopy-layer UHI (by 14.65%) and nighttime boundary-layer UHI (by 20.04%). In contrast, scattering aerosols weaken boundary-layer UHI and daytime surface UHI, while strengthening canopy-layer UHI and nighttime surface UHI. By comparing radiative heating profiles in urban and rural areas, we found that absorbing aerosols absorb more radiation in urban areas during the day, resulting in a markedly higher heating rate than in rural areas; at night, urban areas also exhibit slightly stronger heat retention. Decomposing the radiative heating profiles into shortwave and longwave components further indicates that absorbing aerosols strongly absorb shortwave radiation during the day and subsequently heat the near-surface layer via longwave radiation at night. Scattering aerosols reduce radiation received by the surface and boundary layer during the day, while at night they intercept longwave radiation in the upper boundary layer, leading to warming above and cooling below the boundary layer. In summary, absorbing aerosols enhance UHIs at all levels by absorbing shortwave radiation during the day and continue to intensify UHI through longwave radiation release at night. Scattering aerosols, by scattering solar radiation, weaken boundary-layer UHI and reduce daytime surface heating, while scattering radiation toward the canopy enhances canopy-layer UHI. This study distinguishes between the radiative effects of absorbing and scattering aerosols, revealing their differential impacts on multi-layer urban heat islands and providing new insights into pollution-climate interactions. The findings offer relevant implications for urban climate adaptation planning and synergistic air quality management.

How to cite: Qian, C. and Yang, Y.: Mechanisms of Aerosol Composition Effects on Multi‑Layer Urban Heat Islands: A Case Study of Beijing, EGU General Assembly 2026, Vienna, Austria, 3–8 May 2026, EGU26-15720, https://doi.org/10.5194/egusphere-egu26-15720, 2026.

EGU26-16094 | ECS | Orals | BG10.12

Impacts of VPD Stress on the Interaction Between Urban Heat Islands and Heat Waves Over CONUS 

Linying Wang, Dan Li, and Xing Yuan
Although both urban and rural temperatures are expected to increase under heat waves (HWs), whether the urban heat island (UHI) intensity becomes stronger under HWs remains unknown especially at the daily mean and large spatial scales. Using an urbanized land surface model, we quantify the interactions between UHIs and HWs over the Contiguous United States (CONUS). Synergistic interactions (i.e., increased UHI intensities under HWs) are observed over the eastern and western U.S. However, negative interactions are found in the Central U.S. due to the stronger inhibition of rural evapotranspiration by vapor pressure deficit (VPD) stresses. The interactions between UHIs and HWs in the Central U.S. will be further reduced along with the elevated VPD stresses in a hotter future. The results highlight the importance of properly parameterizing the sensitivity of urban and rural evapotranspiration to various environmental stresses in climate and earth system models.

How to cite: Wang, L., Li, D., and Yuan, X.: Impacts of VPD Stress on the Interaction Between Urban Heat Islands and Heat Waves Over CONUS, EGU General Assembly 2026, Vienna, Austria, 3–8 May 2026, EGU26-16094, https://doi.org/10.5194/egusphere-egu26-16094, 2026.

EGU26-16140 | ECS | Posters on site | BG10.12

Diurnal Surface Urban Heat Island Variability Across Local Climate Zones in South Asian Cities 

Akanksha Pandey and Tirthankar Banerjee

Urban morphology exerts a fundamental control on land surface temperature (LST), governing the spatial and temporal variability of urban thermal environments. In South Asia, rapid urban expansion coupled with the increasing frequency and intensity of extreme heat events has amplified surface urban heat island (SUHI) effects, posing serious challenges to urban livability and thermal comfort. This study investigates the diurnal and spatial variability of LST across local climate zones (LCZs) in three major South Asian cities, Delhi, Bangalore, and Lahore, using multi-year Moderate Resolution Imaging Spectroradiometer (MODIS) LST observations.  Summer-specific urban LST data were analyzed to characterize grid-based diurnal thermal contrasts and intra-LCZ thermal heterogeneity under daytime and nighttime conditions. The results reveal robust diurnal thermal differentiation among LCZs, with distinct surface thermal responses across the three cities. Water-dominated LCZs consistently exhibited the lowest surface temperatures due to high thermal inertia and evaporative cooling, whereas sparsely vegetated and bare surface zones emerged as the primary contributors to elevated SUHI intensity, driven by enhanced solar absorption and limited moisture availability. Vegetated and built-up LCZs displayed intermediate thermal behavior, reflecting the combined influences of surface materials, vegetation cover, and urban forms. Spatial analyses further identified persistent thermal hotspots and coldspots, strongly regulated by underlying LCZ characteristics. The geographically weighted random forest approach revealed spatially varying controls on urban thermal extremes. Overall, the findings highlight the critical role of urban surface composition and structural configuration in modulating SUHI dynamics across South Asian cities. Our analysis provide new insights into the spatiotemporal behavior of urban thermal patterns under extreme heat conditions and offers a robust scientific basis for climate-responsive urban planning and heat-mitigation strategies.


How to cite: Pandey, A. and Banerjee, T.: Diurnal Surface Urban Heat Island Variability Across Local Climate Zones in South Asian Cities, EGU General Assembly 2026, Vienna, Austria, 3–8 May 2026, EGU26-16140, https://doi.org/10.5194/egusphere-egu26-16140, 2026.

EGU26-16717 | Orals | BG10.12 | Highlight

On the role of urban trees in reducing building energy consumption  

Simone Fatichi and Naika Meili

Urban greening is a primary strategy for mitigating the Urban Heat Island (UHI) effect, yet quantifying its impact on building energy consumption remains challenging due to the complex reciprocal feedbacks between the urban microclimate and building systems. This study investigates the influence of urban trees on air-conditioning (AC) energy demand across seven climatically diverse cities (Riyadh, Phoenix, Dubai, New Delhi, Singapore, Lagos, and Tokyo) during the hot season. We employ a coupled urban ecohydrological and building energy model (Urban Tethys-Chloris - BEM) to simulate varying urban densities, tree cover scenarios, and plant physiological properties. Our analysis isolates the relative contributions of shading, temperature reduction, and humidity alterations on AC loads. Results indicate that well-watered trees yield the highest average summer AC reduction (-17%) in hot-dry climates, driven predominantly by shading. In humid climates, AC demand decreased by 6% to 9%; however, vegetation-induced humidity increased dehumidification loads, particularly under high ventilation rates. In these regions, optimal energy savings were achieved at 40% tree cover. These findings provide critical insights for tailoring urban greening strategies aimed at minimizing AC energy demand to specific regional climates.

How to cite: Fatichi, S. and Meili, N.: On the role of urban trees in reducing building energy consumption , EGU General Assembly 2026, Vienna, Austria, 3–8 May 2026, EGU26-16717, https://doi.org/10.5194/egusphere-egu26-16717, 2026.

EGU26-16832 | ECS | Orals | BG10.12

Urban thermal variability from satellite and ground observations: a case study over Valencia (Spain) 

Lluís Pérez-Planells, Sara Gavilà-Lloret, Jose Antonio Valiente, and Samira Khodayar

As world mean temperature arises, the Urban Heat Island (UHI) phenomenon is intensifying in most cities worldwide and is frequently exacerbated by heatwave events. It directly affects citizens’ health, thermal comfort and daily activities. A detailed understanding of the spatial and temporal variability of the UHI is therefore increasingly necessary for urban planning and the development of heat mitigation strategies. UHI intensity is commonly evaluated using localized air temperature observations, which often provide limited spatial coverage of the urban area in the absence of a sufficiently extensive sensor network. In this context, thermal infrared (TIR) remote sensing data with high spatial and temporal resolution are considered as a valuable tool for assessing the urban thermal environment. Several studies have used satellite data to investigate Surface Urban Heat Island (SUHI) and to analyse urban thermal behaviour. However, the accuracy of satellite-derived measurements depends on observation geometry and the properties of surface endmembers within the satellite field of view, and these measurements can differ substantially from near-surface air temperature observations. Since the relationship between surface and near-surface temperatures remains insufficiently determined, it is essential to investigate the link between both variables to enhance the use of satellite data in urban climate studies.

In this work, the thermal variability of land surface temperature (LST) derived from Landsat 8 and 9 (30 m resampled spatial resolution) over the city of Valencia (Spain) is compared with near-surface air temperature observations from the VITUclim thermal sensor network. The VITUclim network comprises more than 80 thermohydrometer sensors distributed across the urban area of Valencia and represents one of the densest urban thermal monitoring networks in Europe. Sensors are installed at 3 m above ground level following a systematic deployment strategy to ensure observational consistency. This study represents the first application of VITUclim data for urban climate studies. Results reveal notable discrepancies between LST and air temperature, reaching up to 10 K during daytime conditions. Further analyses will be conducted to improve the understanding of the relationship between these two variables in the study area.

How to cite: Pérez-Planells, L., Gavilà-Lloret, S., Valiente, J. A., and Khodayar, S.: Urban thermal variability from satellite and ground observations: a case study over Valencia (Spain), EGU General Assembly 2026, Vienna, Austria, 3–8 May 2026, EGU26-16832, https://doi.org/10.5194/egusphere-egu26-16832, 2026.

EGU26-16835 | ECS | Posters on site | BG10.12

Assessing the Impacts of Water Bodies Encroachment on Urban Land Surface Temperature 

M Niranjan Naik and Vimal Mishra

Water bodies play a crucial role in controlling urban heat by acting as a sink and enhancing evaporative cooling. However, rapid urbanisation in India has led to the progressive encroachment and shrinkage of water bodies, which threatens the urban thermal environment. In this study, we investigate the impact of urban water body encroachment on surrounding temperature using multidecadal Landsat-derived land surface temperature (LST) data at 30 m spatial resolution and water body datasets. The LST of Water bodies and surrounding urban areas within their vicinity are estimated to assess spatiotemporal changes in LST. Our results reveal a substantial increase in LST in urban regions surrounding water bodies in recent decades, indicating a decline in their local cooling effectiveness. Furthermore, encroached water bodies exhibit a pronounced rise in surface water temperature than non-encroached water bodies. The warming of both water surfaces and adjacent urban areas highlights the compound thermal impacts of water body encroachment. The findings indicate that the loss of urban water bodies due to encroachments contributes to the warming of urban areas. The study underscores the importance of protecting and restoring urban water bodies as effective nature-based solutions for mitigating rising urban temperatures and enhancing climate resilience in rapidly growing urban cities.

How to cite: Naik, M. N. and Mishra, V.: Assessing the Impacts of Water Bodies Encroachment on Urban Land Surface Temperature, EGU General Assembly 2026, Vienna, Austria, 3–8 May 2026, EGU26-16835, https://doi.org/10.5194/egusphere-egu26-16835, 2026.

EGU26-16879 | ECS | Posters on site | BG10.12

Quantifying Causal Drivers of Urban Heat through Geospatial Analytics: Evidence from Three East African Cities 

Gerverse Kamukama Ebaju and Fangmin Zhang

Rapid urbanization in East Africa profoundly transforms landscapes, yet a critical understanding of the causal mechanisms behind associated land surface warming remains limited. This study quantifies the spatiotemporal dynamics and causal drivers of urban expansion and its thermal impacts in three East African cities; Wakiso-Kampala (Uganda), Nairobi (Kenya), and Bujumbura (Burundi) from 1995 to 2024. Using Landsat imagery, we derived land use/land cover (LULC), Land Surface Temperature (LST), the Normalized Difference Vegetation Index (NDVI), and the Normalized Difference Built-up Index (NDBI). A Land Cover Thermal Impact (LCTI) metric was introduced to quantify per-unit-area warming contributions, while advanced computational methods Convergent Cross Mapping (CCM, with causal strength measured by ρ) and its spatial extension, Geographical CCM (GCCM) were applied to distinguish causal links from mere correlation, moving beyond traditional statistical approaches. Results show built-up areas tripled in Wakiso-Kampala and Nairobi and quadrupled in Bujumbura, displacing 35-80% of natural vegetation and croplands. This expansion drove a mean LST increase of 5.1°C, 3.3°C, and 2.7°C, respectively. The LCTI revealed that water bodies provided the most efficient per-unit-area cooling in Wakiso-Kampala (LCTI = -1.49 °C km⁻²) and Bujumbura, while forest gains and bare-land conversion were the primary cooling mechanisms in Nairobi. Crucially, causal analysis revealed an asymmetric relationship: NDBI consistently acted as a driver of LST (ρ up to 0.77), while NDVI exerted a cooling causal influence (ρ down to -0.57). These findings confirm that urban expansion and vegetation loss are fundamental, causal drivers of rising surface temperatures. Our geospatial analytics framework demonstrates how data-driven causal inference can inform climate adaptation strategies in rapidly urbanizing regions. The spatial mapping of causal relationships provides actionable insights for urban planners to prioritize locations for blue-green infrastructure expansion, optimize nature-based cooling interventions, and develop targeted heat mitigation strategies that address the specific thermal dynamics of East African cities.

Keywords: Urban Heat Island, Geospatial Analytics, Causal Analysis, Nature-based Solutions, Climate Adaptation, East Africa

How to cite: Ebaju, G. K. and Zhang, F.: Quantifying Causal Drivers of Urban Heat through Geospatial Analytics: Evidence from Three East African Cities, EGU General Assembly 2026, Vienna, Austria, 3–8 May 2026, EGU26-16879, https://doi.org/10.5194/egusphere-egu26-16879, 2026.

EGU26-16909 | Posters on site | BG10.12

Numerical Modeling of the Urban Heat Island of Almaty Using the WRF Model 

Tatyana Dedova and Kairat Bostanbekov

This study presents the results of numerical modeling of the urban heat island (UHI) of Almaty using the Weather Research and Forecasting (WRF) model adapted to local climate zones (LCZ). The simulations were performed for a period characterized by pronounced anticyclonic conditions and, consequently, unfavorable atmospheric ventilation.
To assess model performance, verification was carried out using data from ground-based meteorological stations and satellite observations. The results demonstrate that WRF adequately reproduces the diurnal temperature variation and weak wind regime within the urban agglomeration. The model successfully simulated the dynamics of inversion layers and local circulations, which play a key role in the development of stagnation conditions.
The UHI was analyzed using the “virtual rural landscape” approach, in which the thermal field was calculated as the difference between scenarios with and without urban development. The modeling results show that the maximum UHI intensity occurs under nighttime conditions in the flat northwestern part of the city. Daytime UHI is characterized by lower intensity but a larger spatial extent compared to nighttime conditions. This pattern is explained by nocturnal katabatic flows of cold air from the mountains in the southern part of the city, which reduce the UHI intensity.
A joint analysis of the UHI and wind fields at different times indicates that wind speeds exceeding 2 m/s lead to the transport of thermal pollution. The configuration of the heat island reveals that at night, katabatic flows displace warm air from the southern part of the city, while in the northern part it is captured by a zonal wind that bypasses the mountain range and blows in a northeasterly direction. During daytime, heat transport occurs toward the southeast, resulting in the advection of heat emitted by surrounding settlements into the urban area and toward the mountainous regions.
The performed simulations demonstrate that the formation and evolution of the urban heat island in Almaty strongly depend on the time of day and the wind regime. The WRF model has proven to be an effective tool for analyzing urban microclimatic conditions and can be used in the development of adaptation strategies and air quality management, taking into account regional and local meteorological conditions.

How to cite: Dedova, T. and Bostanbekov, K.: Numerical Modeling of the Urban Heat Island of Almaty Using the WRF Model, EGU General Assembly 2026, Vienna, Austria, 3–8 May 2026, EGU26-16909, https://doi.org/10.5194/egusphere-egu26-16909, 2026.

EGU26-17541 | Posters on site | BG10.12

Spatiotemporal Variability of the Urban Heat Island of Almaty Based on Satellite Monitoring Data 

Larissa Balakay and Oxana Kuznetsova

The urban heat island (UHI) effect represents a significant environmental challenge for cities located in regions with complex topography and a continental climate, such as Almaty. This study analyzes the spatiotemporal variability of the urban heat island of Almaty using satellite observations and geographic information system (GIS) analysis methods.
Land surface temperature fields were derived from VIIRS (daytime and nighttime observations), MODIS, and Landsat satellite data in the thermal infrared range. Satellite data processing was performed using cloud-based technologies within the Google Earth Engine platform, enabling a consistent analysis of monthly, seasonal, and diurnal characteristics, as well as a long-term analysis based on MODIS data. To enhance the robustness of the results, temperature fields were normalized relative to two reference cold areas located within urban green zones, allowing the identification of relative thermal anomalies across the urban area.
The results indicate pronounced spatial heterogeneity of the urban heat island, characterized by persistent high-temperature zones associated with dense urban development, industrial areas, and extensive impervious surfaces. Park areas, river corridors, and mountainous regions form stable low-temperature zones. Despite its limited temporal resolution, Landsat data enable detailed identification of local thermal anomalies, while VIIRS and MODIS data provide reliable representation of the overall UHI structure and its seasonal evolution.
The identified spatiotemporal patterns provide a basis for further analysis of the relationship between the urban heat island, synoptic conditions, and urban morphology, and may also be used as input data for numerical modeling and the development of adaptation strategies aimed at improving the urban climate of Almaty.

How to cite: Balakay, L. and Kuznetsova, O.: Spatiotemporal Variability of the Urban Heat Island of Almaty Based on Satellite Monitoring Data, EGU General Assembly 2026, Vienna, Austria, 3–8 May 2026, EGU26-17541, https://doi.org/10.5194/egusphere-egu26-17541, 2026.

EGU26-17781 | ECS | Orals | BG10.12

High-resolution multi-sensor fusion for urban temperature downscaling: integrating physical covariates and stochastic extremes for health impact assessment 

Sven Berendsen, Xueqin Li, Chuleekorn Tanathitikorn, Steve Blenkinsop, Phil James, Anil Namdeo, and Justin Sheffield

Under the impact of ongoing climate change, urban environments exhibit warming rates significantly exceeding those of surrounding rural areas. Assessing the resulting impacts on human health requires high-resolution data that current Earth Observation (EO) products struggle to provide. We address the inherent trade-off between temporal frequency and spatial detail by integrating a multisensor data suite, comprising SEVIRI (high temporal), MODIS (daily), and Landsat LST (high spatial) EO data, weather reanalysis and dense urban station network data, to train a machine learning-based downscaling framework. 

Our methodology generates city-wide temperature maps at 100m resolution every hour. To capture the complex physical drivers of the urban canopy layer, the model incorporates a diverse array of covariates, including land cover, spectral indices, sky view factor, and building morphology. The model also accounts for energy balance variables such as anthropogenic heat emissions and utilizes a precipitation proxy to simulate the effects of evaporative cooling on surface temperatures. 

We validate this framework across the city of Newcastle (UK), utilizing the high-density Urban Observatory sensor network to train and benchmark model accuracy against ground-truth data. We further evaluate the model’s transferability through case studies in the cities of London (high-density metropolitan landscape) and Southampton (coastal-urban interactions), representing environments with sparse ground networks. 

A key aspect is the generation of design heatwaves and cold snaps. Rather than relying solely on historical records, we employ stochastic modeling to produce extreme weather series that allow for the high-resolution quantification of the full spectrum of thermal risk, including unprecedented events. These outputs serve as the primary forcing data for indoor thermal simulations and population exposure models within the ETHOS project. Ultimately, this framework provides clinicians and local authorities with the precise spatial risk information needed to protect vulnerable populations during thermal extremes. 

How to cite: Berendsen, S., Li, X., Tanathitikorn, C., Blenkinsop, S., James, P., Namdeo, A., and Sheffield, J.: High-resolution multi-sensor fusion for urban temperature downscaling: integrating physical covariates and stochastic extremes for health impact assessment, EGU General Assembly 2026, Vienna, Austria, 3–8 May 2026, EGU26-17781, https://doi.org/10.5194/egusphere-egu26-17781, 2026.

EGU26-18108 | ECS | Posters on site | BG10.12

Nature-Based Solutions for Urban Thermal Resilience: Modeling the Influence of Vegetation on Urban Heat Island Intensity During Heatwaves in Turku, Finland. 

Adnan Asif Rifat, Cintia Bertacchi Uvo, Juuso Suomi, Johanna Sörensen, and Elina Kasvi

Urbanization and climate change-induced extreme weather conditions are intensifying the magnitude and duration of the Urban Heat Island (UHI), which is characterized by higher temperatures in urban areas compared to their rural surroundings. Heatwaves are expected to be more frequent in the future, which may worsen the UHI-related problems by exacerbating thermal stress in cities, resulting in heightened health risks and higher energy demands. A heatwave was classified as an event occurring when the daily mean temperature remained above a predefined threshold for no fewer than three consecutive days.  Threshold temperatures in this study range from 20 to 26°C.  Temporal and spatial dynamics of heatwaves, UHI, their relationship, and how vegetation can mitigate their effects in urban areas were examined in this paper. In this study, we examined half-hourly air temperature (3m elevation) measurements over 22 years (2002–2023) recorded at 20 stations over the city of Turku, located on the southwest coast of Finland in a humid continental climate zone. The temperature records were supplemented with 2m resolution land use land cover (LULC) data along with vegetation height (from grass to vegetation with height more than 20m), a high-resolution digital elevation model of the case area, and national urban-rural classification for Finland. Statistical analyses were used to quantify heatwave intensity, UHI, and the relation between heatwaves and UHI, and Gradient Boosting (GB) models were used to assess the LULC impact on UHI and to search for the most suitable vegetation characteristic to mitigate UHI. Results intensity was strongest t during nighttime. High trees (height more than 15m) are most prominent in mitigating the UHI during no heatwave or low heatwave conditions, while grassland played a vital role during intense heatwave conditions. These findings highlight the importance of urban greenery, especially high urban greenery, to enhance thermal resilience and may guide sustainable urban planning to meet the challenge of climate change-induced heat stress through nature-based solutions.

How to cite: Asif Rifat, A., Bertacchi Uvo, C., Suomi, J., Sörensen, J., and Kasvi, E.: Nature-Based Solutions for Urban Thermal Resilience: Modeling the Influence of Vegetation on Urban Heat Island Intensity During Heatwaves in Turku, Finland., EGU General Assembly 2026, Vienna, Austria, 3–8 May 2026, EGU26-18108, https://doi.org/10.5194/egusphere-egu26-18108, 2026.

EGU26-18535 | Orals | BG10.12 | Highlight

Simulation of the cooling effect of a lightweight vegetated structure 

Gabriele Manoli, Aldo Brandi, Julie Varupenne, Seiichi Suzuki, Marc Vonlanthen, and Mark Pauly

The prevalence of built structures in urban areas has led to the emergence of heat islands, intensifying the impact of climate change. Hence, introducing vegetation in cities is key to regulate urban micro-climates, reduce heat-risks, and improve the physical and mental well-being of urban residents. Green infrastructures can help mitigate urban overheating via two main mechanisms: (1) direct shading, which reduces the amount of solar radiation absorbed by the urban surfaces, and (2) evapotranspiration, which regulates the partitioning of latent and sensible heat fluxes within the urban fabric. Yet, planting and managing vegetation in cities face several challenges, from limited space, to plant damages, and conflicts with other infrastructure (e.g., pipes, cables).

To address these problems, we investigate the potential cooling effect of an innovative lightweight structure (bamX) made of bamboo canes weaved together and vegetated with hops. We use the PALM model to run high resolution (0.5 m) computational fluid dynamics simulations in idealized conditions and for different stages of plant maturity. Preliminary results show that the greatest cooling potential of these lightweight vegetated structures is associated with shading and depends on the leaf area density of vegetation. Evapotranspiration processes, despite slightly increasing relative and specific humidity locally, do not significantly alter human thermal comfort within and around the structure.

How to cite: Manoli, G., Brandi, A., Varupenne, J., Suzuki, S., Vonlanthen, M., and Pauly, M.: Simulation of the cooling effect of a lightweight vegetated structure, EGU General Assembly 2026, Vienna, Austria, 3–8 May 2026, EGU26-18535, https://doi.org/10.5194/egusphere-egu26-18535, 2026.

EGU26-18680 | ECS | Posters on site | BG10.12

Compound gate–embankment failures amplify dam-break flood hazards and downstream risk 

Abhishek Anand, Ashish Kumar, and Udit Bhatia

Large reservoirs upstream of rapidly growing floodplains pose low-probability but catastrophic risks, yet dam-break assessments often represent failure as a single structural breach. The Ukai Dam (Lower Tapi, India) is a composite system with gated spillway/masonry structures and earthen embankments, motivating a scenario framework that couples operational and structural failures. We develop an ensemble of dam-breach scenarios under high reservoir levels, including (i) embankment breach at full-reservoir level conditions, (ii) extreme gate release through full opening and/or gate malfunction, and (iii) compound and cascading sequences where gate malfunction coincides with, or precedes, embankment breaching. For each scenario, breach outflow hydrographs are generated using physically informed breach parameterizations and routed through a 2D hydrodynamic model of the Ukai–Lower Tapi reach to produce spatial fields of maximum inundation depth, flow velocity, and flood-wave arrival time. We translate hydraulics into impacts by intersecting hazard outputs with high-resolution population and critical-asset layers to compute population-at-risk and exposure hotspots, and we rank scenarios by consequences and warning lead time. Preliminary results reveal nonlinear amplification of downstream hazard when gate-state extremes coincide with rapid embankment breach formation, shifting both peak depths and arrival times in key settlements. By explicitly representing composite-dam cascading failures, the study provides scenario-ranked risk maps and actionable lead-time metrics to inform emergency action planning and operational decision envelopes for Ukai and similar multipurpose reservoirs.

How to cite: Anand, A., Kumar, A., and Bhatia, U.: Compound gate–embankment failures amplify dam-break flood hazards and downstream risk, EGU General Assembly 2026, Vienna, Austria, 3–8 May 2026, EGU26-18680, https://doi.org/10.5194/egusphere-egu26-18680, 2026.

EGU26-18851 | ECS | Orals | BG10.12

Urban Resilience: Framework and Policy for Heat Mitigation by addressing UHI Effects, Lucknow 

Aditi Yadav, Saikat Kumar Paul, and Diya Bala

Lucknow's urban footprint has expanded significantly in a relatively short time. The city's built-up area essentially doubled, leaping from approximately 521 km² in 2014 to over 1,041 km² by 2019. This surge was fueled by both urban sprawl and a rising population. From 2002 to 2014, the city's urban area experienced a 39% increase, while the average temperature rose by 0.75 °C. This swift transformation has altered land use patterns, reduced green and permeable spaces, and intensified the Urban Heat Island (UHI) effect across the city. Heat stress has extended outside the downtown area. Increased surface temperatures are recorded at multiple locations along the Gomti River, with industrial areas routinely displaying the highest measurements.

This study presents a planning-centric methodology that utilizes spatial analysis, focused modelling, and localized observations to tackle urban heat in Lucknow. Multi-temporal satellite data were employed to derive land surface temperature and relevant indices of land-use change, vegetation cover, and built-up area density. A model based on U-Net architecture was developed to refine the identification of built-up and surface material patterns, while key morphological parameters including building height, density, shape complexity, and contiguity were incorporated to capture the influence of urban form on thermal behavior. These inputs enabled the delineation of priority heat zones across the city.

Site investigations and preliminary surveys revealed unique thermal profiles associated with pavement materials, surface treatments, and urban patterns, especially in the historic regions of Old Lucknow. Industrial regions that encounter heightened solar radiation and substantial exposure require mitigation strategies. These initiatives should concentrate on materials and energy-positive solutions while simultaneously reducing adverse environmental effects. This study presents a zonal heat mitigation framework, which classifies urban areas based on land use, material characteristics, and morphological attributes, thus enabling context-specific planning and design approaches.

By linking urban climate assessment with statutory planning instruments, the proposed framework demonstrates a transferable approach for integrating heat resilience into urban planning in rapidly urbanising cities of the Global South.


Keywords: Urban Heat Island (UHI); Urban Resilience; Land Surface Temperature; Microclimate Simulation; Urban Greening; Solar Potential; Heat Mitigation Policy Framework

How to cite: Yadav, A., Paul, S. K., and Bala, D.: Urban Resilience: Framework and Policy for Heat Mitigation by addressing UHI Effects, Lucknow, EGU General Assembly 2026, Vienna, Austria, 3–8 May 2026, EGU26-18851, https://doi.org/10.5194/egusphere-egu26-18851, 2026.

EGU26-18880 | Orals | BG10.12

Rainwater-irrigated greenroofs as climate change adaptation in urban areas 

Oleg Panferov, Elke Hietel, Ute Rössner, Jonas Alef, and Joseph Newton

Urban greening plays an important role as a tool for climate change mitigation, adaptation and environmental protection. An extensive green roof is one the most favorite methods of urban greening as it does not require additional area and intensive maintenance and is also efficient as a rain water retention during extreme events and for the deposition of particulate matter. However, it is not very efficient for cooling at pedestrian level, for CO2 sequestration and biodiversity. The suggested solution is to convert the extensive green roofs into semi-intensive using automatic solar-powered irrigation system with collected rainwater. The model green roof was built and experiment was carried out starting in 2020. The roof was irrigated during the summer months with 2 mm day-1. The green roof effects on microclimate, WBGT index, water balance, particulate matter binding, greenhouse gas fluxes and biodiversity are measured continuously and compared to a reference area of a parking lot. In addition albedo and surface temperature measurements were carried out using manual instruments and different drone-borne thermal cameras. The results show higher albedo of irrigated roof than parking lot. The microclimatic effects of semi-intensive roof on the microclimate are quite variable. The surface temperatures differences within the roof are more extreme than on the parking lot. However, the air temperature extremes are lower. The air temperature reduction comparing to parking lot is more pronounced during the night time and under calm conditions, with minimal external influences. During the daytime the warming effects of the roof are well-expressed depending on the weather conditions. The effects of different plant species and substrate to total cooling or warming of green roof were also quantified.

How to cite: Panferov, O., Hietel, E., Rössner, U., Alef, J., and Newton, J.: Rainwater-irrigated greenroofs as climate change adaptation in urban areas, EGU General Assembly 2026, Vienna, Austria, 3–8 May 2026, EGU26-18880, https://doi.org/10.5194/egusphere-egu26-18880, 2026.

EGU26-19642 | Posters on site | BG10.12

Combined effects of climate and urban morphology on global urban heat 

Siwoo Lee, Cheolhee Yoo, Bokyung Son, Dongjin Cho, Jungho Im, and Tirthankar Chakraborty

Urban structures are essential for human habitation, yet they profoundly alter surface energy balances, with significant environmental and health implications. Although urban heat island phenomenon is well recognized, the thermal influence of surrounding urban structures and its interaction with climate remain insufficiently understood. This study presents a global analytical framework that quantifies the thermal impact of surrounding structures, analyzes the combined effects of climate and urban morphology, and projects future thermal trajectories across 967 cities worldwide. By integrating climate variables and local climate zones with machine learning, we assess the thermal impacts of surrounding urban structures. Through a comprehensive weighting of the constituent thermal influences, we introduce the city-scale thermal impact of surrounding urban structures (TBE), revealing that climate and morphology jointly contribute to global urban heat. Across climate zones, cities exhibiting high daytime TBE are characterized by low- and mid-rise built form, whereas sparsely built types prevail in cities with low TBE. These patterns persist at night. Future projections show that the spatial patterns of TBE will be distinct from current conditions, with combined climate-structure effects will dominate urban thermal environment in almost half of global cities. These projections also reveal significant regional disparities between the Global South and the Global North. Our findings highlight the role of combined effects in shaping present and future urban heat, informing the need for adaptation strategies tailored to individual cities.

How to cite: Lee, S., Yoo, C., Son, B., Cho, D., Im, J., and Chakraborty, T.: Combined effects of climate and urban morphology on global urban heat, EGU General Assembly 2026, Vienna, Austria, 3–8 May 2026, EGU26-19642, https://doi.org/10.5194/egusphere-egu26-19642, 2026.

Urban air quality and heat island effect are major concerns for human health and thermal comfort, particularly under the increasing trend of extreme heat events. But traditional networks of stationary monitoring stations provide limited spatial representativeness of intra-urban microclimate variability at the scales where citizens experience thermal stress and are exposed to air pollution.

To address this observational gap, we have developed a mobile monitoring system integrating a number of compact sensors mounted on an electrical bicycle platform. This setup enables high-density geolocated sampling along pedestrian areas, walkways and bike lanes -where citizens are truly exposed to the urban environment- while minimizing perturbations to the environmental conditions. It also presents advantages over other mobile platforms, such as UAVs or electric vehicles, in terms of operation permissions, accessibility to pedestrian areas, and time endurance.

The system simultaneously records: (i) meteorological variables (air temperature, relative humidity, wind speed and direction) (ii) radiative components including, sun/shade discrimination, shortwave hemispherical irradiance (sunlight), directional radiometric temperature (from six directions), enabling estimation of the standard Wet Bulb Globe Temperature (WBGT) for outdoor thermal comfort assessment; and (iii) environmental pollution indicators (suspended black carbon, PM2.5, PM10 and ambient noise). The data is geolocated by GNSS and recorded by a datalogger every second, providing approximately 3m spatial resolution at 10km/h cycling speed.

The mobile monitoring system has been tested during a summer heat wave in Valencia, Spain, performing mobile transects at solar noon and after sunset to capture differential cooling dynamics across urban morphologies. The 20 km routes were designed to pass through different types of neighbourhoods and densities of green-blue spaces. 

The geolocated measurements are integrated within a Geographic Information System (GIS) framework together with several layers of geospatial city information, like distribution of buildings, pavement types, urban green and blue spaces, individual tree inventory, vegetation density indices from satellite imagery, and building height (DEM). This set of multisource data enables advanced geospatial analytics combining spatial statistical and deep-learning to: (i) generate informative maps of thermal comfort and air quality at high spatial resolution; (ii)  identify urban hot and cold spots; and (iii) quantitatively evaluate the effectiveness of different nature-based solutions (NbS) for UHI mitigation.

This novel mobile monitoring approach, delivering unprecedented spatial density of CUHI observations combined with multi-source geospatial data, provides a scalable methodology for microscale air quality mapping and evaluating urban planning strategies and nature-based cooling interventions.

How to cite: Alonso-Chorda, L., Torrenti-Salom, F., and Calatayud-Lorente, V.: Microscale Urban Heat Island and Air Quality Assessment Through Multi-sensor E-Bike Monitoring: Integrating High-Density Observations with Geospatial Analytics, EGU General Assembly 2026, Vienna, Austria, 3–8 May 2026, EGU26-19719, https://doi.org/10.5194/egusphere-egu26-19719, 2026.

EGU26-19722 | ECS | Posters on site | BG10.12

Diurnal Microclimate Patterns in Munich’s Public Squares: The Role of Vegetation Complexity 

Antonia Hostlowsky, Azharul Islam, Nayanesh Pattnaik, Andreas Hanzl, and Stephan Pauleit

With climate change, the frequency of extreme heat days is projected to increase, highlighting the need for climate-resilient urban design. Nature-based solutions, such as urban forestry, can help mitigate heat-related stress in cities.
Over the past few years, studies have investigated the role that vegetation complexity plays in various climatic contexts, including urban forests. However, uncertainties remain regarding the effect of vegetation complexity on the microclimate of urban public squares. Thus, we investigate the relationship between the diurnal microclimate of urban public squares and the complexity of vegetation. We define the latter as the vertical arrangement of different vegetation layers, such as shrubs and trees.
We captured the vegetation structure of six public squares in Munich using terrestrial laser scanning (TLS) during the summer of 2025. The squares were selected based on qualitative criteria indicating differences in vertical structure, specifically whether they contained a small hedge or tall understorey plants. We then used the resulting point clouds to understand how the complexity of vegetation in public squares can be quantified. We further measured several weather parameters on-site during July and August for the six squares, as well as on two non-vegetated public squares as controls.
The preliminary analysis of the weather data shows differences between the control group and the squares with more complex vegetation structure. The latter group shows lower maximum temperatures, higher humidity, and lower wind speed. Further, the first metrics calculated from the point cloud indicate quantifiable differences between the squares.
The final results will provide insights into the potential benefits and drawbacks of complex vegetation structures in creating climate-resilient public squares.

How to cite: Hostlowsky, A., Islam, A., Pattnaik, N., Hanzl, A., and Pauleit, S.: Diurnal Microclimate Patterns in Munich’s Public Squares: The Role of Vegetation Complexity, EGU General Assembly 2026, Vienna, Austria, 3–8 May 2026, EGU26-19722, https://doi.org/10.5194/egusphere-egu26-19722, 2026.

EGU26-20485 | Posters on site | BG10.12

Urban trees as heat mitigator-Investigating physiological and anatomical  traits across street and park microhabitats 

Aviad Dekel, Einat Shemesh-Mayer, and Yakir Preisler

Urban areas experience higher temperatures than their rural surroundings due to the Urban Heat Island (UHI) effect, primarily caused by heat-absorbing surfaces and human activities. Urban forests help mitigate UHI through shading and transpiration. However, street trees in cities face high abiotic stress, such as compacted soil and increased pollution exposure. Their effectiveness depends on their suitability to the specific geoclimatic and microhabitat conditions where they are planted.

In this study we examine the rate of adaptability of four local urban tree species as expressed by their anatomical and physiological adjustments. We ask how stressed are street trees and if there are certain tree species that exhibit lower stress and greater suitability for urban street environments.

Surprisingly, our initial results suggest that despite the more challenging conditions of street trees, their stress levels are not as expected as expressed by key physiological and anatomical traits - A promising path for further research.

How to cite: Dekel, A., Shemesh-Mayer, E., and Preisler, Y.: Urban trees as heat mitigator-Investigating physiological and anatomical  traits across street and park microhabitats, EGU General Assembly 2026, Vienna, Austria, 3–8 May 2026, EGU26-20485, https://doi.org/10.5194/egusphere-egu26-20485, 2026.

EGU26-20703 | Orals | BG10.12

Heat and the City: How urban agglomerations devise adaptation measures to protect human health 

Umberto Fracassi, Walter Leal Filho, Maria Alzira Pimenta Dinis, and Gustavo J. Nagy

Over the last few years, climate change has intensified heat effects across broad swaths globally. In 2024, for the first time, global temperatures remained at least 1.5°C above the pre-industrial average for one year. In 2025, persistent heat caused record-setting European heatwaves, which have been recurrent since 2022. The spatial distribution of such effects clearly includes areas where human life is concentrated: cities, megacities, and urban agglomerations at large, rendering cities dangerously hotter and necessitating urgent, specific adaptation measures. We examine the increasing trend in summer temperatures in cities, a key driver of environmental and health issues, to identify the major risks posed by extreme heat, particularly for vulnerable communities. We also evaluate how well current measures across cities worldwide address this growing, ubiquitous issue, with a focus on European cities.

We analyse and compare specific measures and strategies used across cities worldwide to address rising urban heat. We review real-world examples from 2023 and 2024 to examine how cities (such as those in the C40 alliance) are coping with extreme temperatures, employing solutions ranging from urban greening to early warning systems, from water management strategies to population sheltering. We find that, while some cities have made considerable progress in enhancing their heat resilience, a pressing need remains for more refined measures to address urban heat effectively and strategically protect human health. Metropolitan areas across Europe and expanding megacities worldwide thus need comprehensive strategies and shared best practices to manage summer heatwaves and adapt to the impacts of a changing climate that poses novel, compounded hazards to human health.

We argue that public urban spaces are central to climate adaptation in cities because they are highly vulnerable to extreme heat. However, those very spaces can also be pivotal for implementing innovative solutions to improve citizens' well-being. We thus underscore the urgency for cities to adopt adaptive strategies to cope with rising temperatures, given the foreseeable trajectory of heatwaves through time. In analysing the pressing global urban heat challenge, we urge policymakers and urban planners to prioritise sustainable and effective interventions demanded by populations across the complex spectrum of contemporary societies and the compounded hazards that these face.

How to cite: Fracassi, U., Leal Filho, W., Dinis, M. A. P., and Nagy, G. J.: Heat and the City: How urban agglomerations devise adaptation measures to protect human health, EGU General Assembly 2026, Vienna, Austria, 3–8 May 2026, EGU26-20703, https://doi.org/10.5194/egusphere-egu26-20703, 2026.

EGU26-20874 | ECS | Orals | BG10.12

Is shade all there is to it? Quantifying the contribution of tree transpiration to cooling cities 

Ron Linder, Yakir Preisler, and Daniel Orenstein

Tree planting is a leading strategy for mitigating the Urban Heat Island (UHI) effect. However, current urban climate models often conflate the physiological transpiration cooling of trees with their physical shading effects. To isolate and quantify this specific "biological bonus," we introduced the “Living Control” framework.

In a controlled field experiment on mature trees in a Mediterranean climate, we applied chemical anti-transpirants to inhibit stomatal conductance (gs) and transpiration (E), while maintaining identical canopy geometry and aerodynamic properties. This effectively decoupled latent heat flux from radiative shading.

Our results demonstrate the efficacy of the manipulation: the application of auxinic herbicides significantly reduced gs by 32% and E by 23% compared to untreated controls. This suppression of physiological activity led to a statistically significant rise in leaf surface temperature. However, this distinct physiological warming revealed an intriguing contrast: it did not translate into significant differences in human thermal comfort metrics, specifically Mean Radiant Temperature (MRT) and the Universal Thermal Climate Index (UTCI).

These findings challenge the prevailing assumption that canopy cooling linearly improves pedestrian comfort. They suggest that in water-limited environments, the primary contribution of trees to thermal comfort is static shading rather than active transpiration. This study highlights the complexity of microclimatic interactions and provides a vital baseline for future experiments evaluating Nature-Based Solutions (NBS) and water-wise strategies for urban heat mitigation.


How to cite: Linder, R., Preisler, Y., and Orenstein, D.: Is shade all there is to it? Quantifying the contribution of tree transpiration to cooling cities, EGU General Assembly 2026, Vienna, Austria, 3–8 May 2026, EGU26-20874, https://doi.org/10.5194/egusphere-egu26-20874, 2026.

EGU26-21145 | ECS | Posters on site | BG10.12

Urban Form and Climate Resilience: Understanding the Heat Island of Patras, Greece  

Ioannis Vafeiadis, Christos Pantazis, Panagiotis Nastos, and Christoforos Pappas

The rapid expansion of cities, combined with the increased frequency and intensity of droughts and heatwaves in the Mediterranean region, have made Urban Heat Islands (UHI) widespread. Here, focusing on the city of Patras, the third largest city of Greece, we analyzed the spatiotemporal patterns of urban land surface temperature during summertime, and we quantified the relationships between temperature and geomorphological (e.g., elevation, slope) and urban (e.g., building height, road network density) features. The delineation of UHI was maded using Land Surface Temperature (LST) data from 2018 to 2025 based on the NASA’s ECOSTRESS mission. This dataset provides high-resolution (70 x 70m) thermal infrared imagery with diurnal coverage, thanks to its irregular temporal sampling. In-situ air temperature data available from a network of urban meteorological stations were also used to verify the spatiotemporal patterns of temperature variability. At the daily time scale, no clear links were found between daily summer-time temperature and urban and topographic features. However, when data were analyzed at the diurnal time scale, clear dependences between hourly temperature variability and urban features were revealed. More specifically, building and road density, as well building height, exerted low correlation with temperature during morning hours, with this cross-correlation becoming positive during late afternoon and evening hours, i.e., areas with denser urban fabric showed higher evening temperature values. Regarding green spaces, as quantified with the values of the NDVI index, the correlation with hourly temperature was low during daytime, yet, this cross-correlation became significantly negative during nighttime, i.e., areas with higher values of NDVI showed a rapid decrease in nighttime temperature values. The obtained results link the spatiotemporal variability of land surface temperature over the city of Patras with key urban and topographic features and provide valuable insights towards targeted interventions enhancing the overall resilience of the city to future climatic stressors.

How to cite: Vafeiadis, I., Pantazis, C., Nastos, P., and Pappas, C.: Urban Form and Climate Resilience: Understanding the Heat Island of Patras, Greece , EGU General Assembly 2026, Vienna, Austria, 3–8 May 2026, EGU26-21145, https://doi.org/10.5194/egusphere-egu26-21145, 2026.

EGU26-1897 | ECS | Posters on site | EOS4.4

The Unreliable Narrator: LSTM Internal States Fluctuate with Software Environments Despite Robust Predictions 

Ryosuke Nagumo, Ross Woods, and Miguel Rico-Ramirez

Since the robust performance of Long Short-Term Memory (LSTM) networks was established, their physics-awareness and interpretability have become central topics in hydrology. Seminal works (e.g., Lees et al. (2022)) have argued that LSTM internal states spontaneously capture hydrological concepts, and suggested that cell states can represent soil moisture dynamics despite not being explicitly trained on such data. Conversely, more recent studies (e.g., Fuente et al. (2024)) demonstrated that mathematical equifinality causes non-unique LSTM representations with different initialisations.

In this work, we report an arguably more systematic "bug" in the software environment that causes instability in internal states. We initially aimed to investigate how internal states behave differently when trained with or without historical observation data. We encountered this issue while reassembling a computational stack and attempting to replicate the initial results, as the original Docker environment was not preserved. While random seeds have been indicated to lead to different internal state trajectories, we found the computational backend (e.g., changing CUDA versions, PyTorch releases, or dependent libraries) also produces them. These are the findings:

  • In gauged catchments: Discharge predictions remained stable (in one catchment, NSE was 0.88 ± 0.01) across computational environments, yet the internal temporal variations (e.g., silhouette, mean, and std of cell states) fluctuated noticeably.
  • In pseudo-ungauged scenarios: The prediction performance itself became more reliant on the computational environment (in the same catchment, NSE dropped to 0.31 ± 0.15), yet the internal temporal variations of the cell states fluctuated only as much as they did during the gauged scenario.

These findings suggests that instability in the computational environment poses not only a risk of altering interpretability in training (by altering internal states) but also casts doubt on reliability in extrapolation (by altering outputs).

It is worth mentioning that we confirmed this is not a replicability issue; completely identical cell states and predictions are produced when the computational environment, seeds, and training data are held constant. We argue that such stability must be established as a standard benchmark before assigning physical meaning to deep learning internals.

How to cite: Nagumo, R., Woods, R., and Rico-Ramirez, M.: The Unreliable Narrator: LSTM Internal States Fluctuate with Software Environments Despite Robust Predictions, EGU General Assembly 2026, Vienna, Austria, 3–8 May 2026, EGU26-1897, https://doi.org/10.5194/egusphere-egu26-1897, 2026.

EGU26-2771 | Posters on site | EOS4.4

New EGU Manuscript Types: Limitations, Errors, Surprises, and Shortcomings as Opportunities for New Science (LESSONS) 

John Hillier, Ulrike Proske, Stefan Gaillard, Theresa Blume, and Eduardo Queiroz Alves

Moments or periods of struggle not only propel scientists forward, but sharing these experiences can also provide valuable lessons for others. Indeed, the current bias towards only publishing ‘positive’ results arguably impedes scientific progress as mistakes that are not learnt from are simply repeated. Here we present a new article type in EGU journals covering LESSONS learnt to help overcome this publishing bias. LESSONS articles describe the Limitations, Errors, Surprises, Shortcomings, and Opportunities for New Science emerging from the scientific process, including non-confirmatory and null results. Unforeseen complications in investigations, plausible methods that failed, and technical issues are also in scope. LESSONS thus fit the content of the BUGS session and can provide an outlet for articles based on session contributions. Importantly, a LESSONS Report will offer a substantial, valuable insight. LESSONS Reports are typically short (1,000-2,000 words) to help lower the barrier to journal publication, whilst LESSONS Posts (not peer-reviewed, but with a DOI on EGUsphere) can be as short as 500 words to allow early-stage reporting. LESSONS aim to destigmatise limitations, errors, surprises and shortcomings and to add these to the published literature as opportunities for new science – we invite you to share your LESSONS learnt.


Finally, a big thank you from this paper’s ‘core’ writing team to the wider group who have helped shape the LESSONS idea since EGU GA in 2025, including PubCom and in particular its Chair Barbara Ervens.

How to cite: Hillier, J., Proske, U., Gaillard, S., Blume, T., and Queiroz Alves, E.: New EGU Manuscript Types: Limitations, Errors, Surprises, and Shortcomings as Opportunities for New Science (LESSONS), EGU General Assembly 2026, Vienna, Austria, 3–8 May 2026, EGU26-2771, https://doi.org/10.5194/egusphere-egu26-2771, 2026.

EGU26-3077 | ECS | Posters on site | EOS4.4

False Starts and Silver Linings: A Photocatalytic Journey with Layered Double Hydroxides 

Anna Jędras and Jakub Matusik

Photocatalysis is frequently presented in the literature as a straightforward route toward efficient degradation of pollutants, provided that the “right” material is selected. Layered double hydroxides (LDH) are often highlighted as promising photocatalysts due to their tunable composition and reported activity in dye degradation. Motivated by these claims, this study evaluated LDH as mineral analogs for photocatalytic water treatment, ultimately uncovering a series of unexpected limitations, methodological pitfalls, and productive surprises.

In the first stage, Zn/Cr, Co/Cr, Cu/Cr, and Ni/Cr LDHs were synthesized and tested for photocatalytic degradation of methylene blue (0.02 mM) and Acid Blue Dye 129 (0.3 mM). Contrary to expectations,1 photocatalytic performance was consistently low. After one hour of irradiation, concentration losses attributable to photocatalysis did not exceed 15%, while most dye removal resulted from adsorption. Despite extensive efforts to optimize synthesis protocols, catalyst composition, and experimental conditions, this discrepancy with previously published studies could not be resolved.

To overcome limitations related to particle dispersion, surface accessibility, and charge-carrier separation, a second strategy was pursued by incorporating clay minerals as supports.2 Zn/Cr LDH, identified as the most active composition in preliminary tests, was coprecipitated with kaolinite, halloysite, and montmorillonite. Experiments with methylene blue (0.1 mM) and Acid Blue 129 (0.3 mM) demonstrated enhanced adsorption capacities. However, photocatalytic degradation efficiencies remained poor, typically below 10% after one hour, indicating that apparent performance gains were largely adsorption-driven rather than photochemical.

This failure proved to be a turning point. Instead of abandoning LDH entirely, they were combined with graphitic carbon nitride (GCN) to form a heterostructure.3 This approach resulted in a dramatic improvement: after optimization of the synthesis protocol, 99.5% of 1 ppm estrone was degraded within one hour.4 Further modifications were explored by introducing Cu, Fe, and Ag into the LDH/GCN system. While Cu and Fe suppressed photocatalytic activity, silver, at an optimized loading, reduced estrone concentrations below the detection limit within 40 minutes.5

This contribution presents a full experimental arc - from promising hypotheses that failed, through misleading adsorption-driven “successes,” to an ultimately effective but non-intuitive solution - highlighting the value of negative results and surprises as drivers of scientific progress.

This research was funded by the AGH University of Krakow, grant number 16.16.140.315.

Literature:

1            N. Baliarsingh, K. M. Parida and G. C. Pradhan, Ind. Eng. Chem. Res., 2014, 53, 3834–3841.

2            A. Í. S. Morais, W. V. Oliveira, V. V. De Oliveira, L. M. C. Honorio, F. P. Araujo, R. D. S. Bezerra, P. B. A. Fechine, B. C. Viana, M. B. Furtini,
              E. C. Silva-Filho and J. A. Osajima, Journal of Environmental Chemical Engineering, 2019, 7, 103431.

3            B. Song, Z. Zeng, G. Zeng, J. Gong, R. Xiao, S. Ye, M. Chen, C. Lai, P. Xu and X. Tang, Advances in Colloid and Interface Science, 2019, 272, 101999.

4            A. Jędras, J. Matusik, E. Dhanaraman, Y.-P. Fu and G. Cempura, Langmuir, 2024, 40, 18163–18175.

5            A. Jędras, J. Matusik, J. Kuncewicz and K. Sobańska, Catal. Sci. Technol., 2025, 15, 6792–6804.

How to cite: Jędras, A. and Matusik, J.: False Starts and Silver Linings: A Photocatalytic Journey with Layered Double Hydroxides, EGU General Assembly 2026, Vienna, Austria, 3–8 May 2026, EGU26-3077, https://doi.org/10.5194/egusphere-egu26-3077, 2026.

EGU26-4074 | Orals | EOS4.4

Instructive surprises in the hydrological functioning of landscapes 

James Kirchner, Paolo Benettin, and Ilja van Meerveld

BUGS can arise in individual research projects, but also at the level of communities of researchers, leading to shifts in the scientific consensus.  These community-level BUGS typically arise from observations that are surprising to (or previously overlooked by) substantial fractions of the research community.  In this presentation, we summarize several community-level BUGS in our field: specifically, key surprises that have transformed the hydrological community's understanding of hillslope and catchment processes in recent decades.  

Here are some examples.  (1) Students used to learn (and some still do today) that storm runoff is dominated by overland flow.  But stable isotope tracers have convincingly shown instead that even during storm peaks, streamflow is composed mostly of water that has been stored in the landscape for weeks, months, or years.  (2) Maps, and most hydrological theories, have typically depicted streams as fixed features of the landscape.  But field mapping studies have shown that stream networks are surprisingly dynamic, with up to 80% of stream channels going dry sometime during the year.  (3) Textbooks have traditionally represented catchment storage as a well-mixed box.  But tracer time series show fractal scaling that cannot be generated by well-mixed boxes, forcing a re-think of our conceptualization of subsurface storage and mixing.  (4) Waters stored in aquifers, and the waters that drain from them, have traditionally been assumed to share the same age.  But tracers show that waters draining from aquifers are often much younger than the groundwaters that are left behind, and this was subsequently shown to be an inevitable result of aquifer heterogeneity. 

Several examples like these, and their implications, will be briefly discussed, with an eye to the question: how can we maximize the chances for future instructive surprises?

How to cite: Kirchner, J., Benettin, P., and van Meerveld, I.: Instructive surprises in the hydrological functioning of landscapes, EGU General Assembly 2026, Vienna, Austria, 3–8 May 2026, EGU26-4074, https://doi.org/10.5194/egusphere-egu26-4074, 2026.

Coming from geosciences, we hopefully know what we want to do. Coming from numerics, however, we often know quite well what we are able to do and look for a way to sell it to the community. A few years ago, deep-learning techniques brought new life into the glaciology community. These approaches  allowed for simulations of glacier dynamics at an unprecedented computational performance and motivated several researchers to tackle the numerous open questions about past and present glacier dynamics, particularly in alpine regions. From another point of view, however, it was also tempting to demonstrate that the human brain is still more powerful than artificial intelligence by developing a new classical numerical scheme that can compete with deep-learning techniques concerning its efficiency.

Starting point was, of course, the simplest approximation to the full 3-D Stokes equations, the so-called shallow ice approximation (SIA). Progress was fast and the numerical performance was even better than expected. The new numerical scheme enabled simulations with spatial resolutions of 25 m on a desktop PC, while previous schemes did not reach simulations below a few hundred meters.

However, the enthusiasm pushed the known limitations of the SIA a bit out of sight. Physically, the approximation is quite bad on rugged terrain, particularly in narrow valleys. So the previous computational limitations have been replaced by physical limitations since high resolutions are particularly useful for rugged topographies. In other words, a shabby house has a really good roof now.

What are the options in such a situation?

  • Accept that there is no free lunch and avoid contact to the glacialogy community in the future.
  • Continue the endless discussion about the reviewers' opinion that a spatial resolution of 1 km is better than 25 m.
  • Find a real-world data set that matches the results of the model and helps to talk the problems away.
  • Keep the roof and build a new house beneath. Practically, this would be developing a new approximation to the full 3-D Stokes equations that is compatible to the numerical scheme and reaches an accuracy similar to those of the existing approximations.
  • Take the roof and put it on one of the existing solid houses. Practically, this would be an extension of the numerical scheme towards more complicated systems of differential equations. Unfortunately, efficient numerical schemes are typically very specific. So the roof will not fit easily and it might leak.

The story is open-ended, but there will be at least a preliminary answer in the presentation.


How to cite: Hergarten, S.: How useful is a new roof on a shabby house? An example from glacier modeling, EGU General Assembly 2026, Vienna, Austria, 3–8 May 2026, EGU26-4196, https://doi.org/10.5194/egusphere-egu26-4196, 2026.

EGU26-4587 | Posters on site | EOS4.4

The importance of describing simple methods in climate sensitivity literature 

Anna Zehrung, Andrew King, Zebedee Nicholls, Mark Zelinka, and Malte Meinshausen

“Show your working!” – is the universal phrase drilled into science and maths students to show a clear demonstration of the steps and thought processes used to reach a solution (and to be awarded full marks on the exam). 

Beyond the classroom, “show your working” becomes the methods section on every scientific paper, and is critical for the transparency and replicability of the study. However, what happens if parts of the method are considered assumed knowledge, or cut in the interests of a word count? 

An inability to fully replicate the results of a study became the unexpected glitch at the start of my PhD. Eager to familiarise myself with global climate model datasets, I set out to replicate the results of a widely cited paper which calculates the equilibrium climate sensitivity (ECS) across 27 climate models. The ECS is the theoretical global mean temperature response to a doubling of atmospheric CO2 relative to preindustrial levels. A commonly used method to calculate the ECS is to apply an ordinary least squares regression to global annual mean temperature and radiative flux anomalies. 

Despite the simplicity of a linear regression between two variables, we obtained ECS estimates for some climate models that differed from those reported in the original study, even though we followed the described methodology. However, the methodology provided only limited detail on how the raw climate model output – available at regional and monthly scales – was processed to obtain global annual mean anomalies. Differences in these intermediate processing steps can, in turn, lead to differences in ECS estimates.

Limited reporting of data-processing steps is common in the ECS literature. Whether these steps are considered assumed knowledge or deemed too simple to warrant explicit description, we demonstrate that, for some models, they can materially affect the resulting ECS estimate. While the primary aim of our study is to recommend a standardised data-processing pathway for ECS calculations, a secondary aim is to highlight the lack of transparency in key methodological details across the literature. A central takeaway is the importance of clearly documenting all processing steps – effectively, to “show your working” – and to emphasise the critical role of a detailed methods section.

How to cite: Zehrung, A., King, A., Nicholls, Z., Zelinka, M., and Meinshausen, M.: The importance of describing simple methods in climate sensitivity literature, EGU General Assembly 2026, Vienna, Austria, 3–8 May 2026, EGU26-4587, https://doi.org/10.5194/egusphere-egu26-4587, 2026.

Observation of atmospheric constituents and processes is not easy. As atmospheric chemists, we use sensitive equipment, for example mass spectrometers, that we often set up in a (remote) location or on a moving platform for a few-weeks campaign to make in-situ observations. All this with the goal of explaining more and more atmospheric processes, and to verify and improve atmospheric models. However, glitches can happen anywhere in an experiment, be it in the experimental design, setup, or instrumental performance. Thus, complete data coverage during such a campaign is not always a given, resulting in gaps in (published) datasets. And the issue with air is that you can never go back and measure the exact same air again. Here, I would like to share some stories behind such gaps, and what we learned from them. This presentation aims to encourage early career researchers who might be struggling with feelings of failure when bugs, blunders and glitches happen in their experiments - you are not alone! I will share what we learned from these setbacks and how each of them improved our experimental approaches.

How to cite: Pfannerstill, E. Y.: Why are there gaps in your measurements? Sharing the stories behind the missing datapoints, EGU General Assembly 2026, Vienna, Austria, 3–8 May 2026, EGU26-5494, https://doi.org/10.5194/egusphere-egu26-5494, 2026.

Over a 24-year research period, three successive experimental investigations led to three publications, each of which falsified the author’s preceding hypothesis and proposed a revised conceptual framework. Despite an initial confidence in having identified definitive solutions, subsequent experimental evidence consistently demonstrated the limitations and inaccuracies of earlier interpretations. This iterative process ultimately revealed that samples, in particular geological reference materials, sharing identical petrographic or mineralogical descriptions are not necessarily chemically equivalent and can exhibit markedly different behaviors during chemical digestion procedures. These findings underscore the critical importance of continuous hypothesis testing, self-falsification, and experimental verification in scientific research, particularly when working with reference materials assumed to be identical. I will be presenting data on the analysis of platinum group elements (PGE) and osmium isotopes in geological reference materials (chromitites, ultramafic rocks and basalts), which demonstrates the need for challenging matrices for method validation. 

How to cite: Meisel, T. C.: Self-falsification as a driver of scientific progress: Insights from long-term experimental research, EGU General Assembly 2026, Vienna, Austria, 3–8 May 2026, EGU26-5771, https://doi.org/10.5194/egusphere-egu26-5771, 2026.

EGU26-6794 | ECS | Orals | EOS4.4

Back to square one (again and again): Finding a bug in a complex global atmospheric model   

Nadja Omanovic, Sylvaine Ferrachat, and Ulrike Lohmann

In atmospheric sciences, a central tool to test hypotheses are numerical models, which aim to represent (part of) our environment. One such model is the weather and climate model ICON [1], which solves the Navier-Stokes equation for capturing the dynamics and parameterizes subgrid-scale processes, such as radiation, cloud microphysics, and aerosol processes. Specifically, for the latter exists the so-called Hamburg Aerosol Module (HAM [2]), which is coupled to ICON [3] and predicts the evolution of aerosol populations using two moments (mass mixing ratio and number concentration). The high complexity of aerosols is reflected in the number of aerosol species (total of 5), number of modes (total of 4), and their mixing state and solubility. The module calculates aerosol composition and number concentration, their optical properties, their sources and sinks, and their interactions with clouds via microphysical processes. Aerosol emissions are sector-specific and based on global emission inventories or dynamically computed.

Within our work, we stumbled upon an interesting pattern occurrence in our simulations upon changing/turning off single emission sectors. If we, e.g., removed black carbon from aircraft emissions, the strongest changes emerged over the African continent, which is not the region where we were expecting to see the strongest response. Further investigations revealed that this pattern emerges independently of the emission sector as well as species, confirming our suspicion that we are facing a bug within HAM. Here, we want to present how we approached the challenge of identifying and tackling a bug within a complex module with several thousand lines of code.


[1] G. Zängl, D. Reinert, P. Ripodas, and M. Baldauf, “The ICON (ICOsahedral Non-hydrostatic) modelling framework of DWD and MPI-M: Description of the non-hydrostatic dynamical core,” Quarterly Journal of the Royal Meteorological Society, vol. 141, no. 687, pp. 563–579, 2015, ISSN: 1477-870X. DOI: 10.1002/qj.2378

[2] P. Stier, J. Feichter, S. Kinne, S. Kloster, E. Vignati, J. Wilson, L. Ganzeveld, I. Tegen, M. Werner, Y. Balkanski, M. Schulz, O. Boucher, A. Minikin, and A. Petzold, “The aerosol-climate model ECHAM5-HAM,” Atmospheric Chemistry and Physics, 2005. DOI: 10.5194/acp-5-1125-2005

[3] M. Salzmann, S. Ferrachat, C. Tully, S. M¨ unch, D. Watson-Parris, D. Neubauer, C. Siegenthaler-Le Drian, S. Rast, B. Heinold, T. Crueger, R. Brokopf, J. Mülmenstädt, J. Quaas, H. Wan, K. Zhang, U. Lohmann, P. Stier, and I. Tegen, “The Global Atmosphere-aerosol Model ICON-A-HAM2.3–Initial Model Evaluation and Effects of Radiation Balance Tuning on Aerosol Optical Thickness,” Journal of Advances in Modeling Earth Systems, vol. 14, no. 4,e2021MS002699, 2022, ISSN: 1942-2466. DOI: 10.1029/2021MS002699

How to cite: Omanovic, N., Ferrachat, S., and Lohmann, U.: Back to square one (again and again): Finding a bug in a complex global atmospheric model  , EGU General Assembly 2026, Vienna, Austria, 3–8 May 2026, EGU26-6794, https://doi.org/10.5194/egusphere-egu26-6794, 2026.

In situ cloud measurements are essential for understanding atmospheric processes and establishing a reliable ground truth. Obtaining these data is rarely straightforward. Challenges range from accessing clouds in the first place to ensuring that the instrument or environment does not bias the sample. This contribution explores several blunders and unexpected glitches encountered over fifteen years of field campaigns.

I will share stories of mountain top observations where blowing snow was measured instead of cloud ice crystals and the ambitious but failed attempt to use motorized paragliders for sampling. I also reflect on winter campaigns where the primary obstacles were flooding and mud rather than cold and snow. While these experiences were often frustrating, they frequently yielded useful data or led to new insights. One such example is the realization that drone icing is not just a crash risk but can also serve as a method for measuring liquid water content. By highlighting these setbacks and the successful data that emerged despite them, I aim to foster a discussion on the value of trial and error and persistence in atmospheric physics.

How to cite: Henneberger, J.: How Not to Measure a Cloud: Lessons from Fifteen Years of Fieldwork Failures, EGU General Assembly 2026, Vienna, Austria, 3–8 May 2026, EGU26-8228, https://doi.org/10.5194/egusphere-egu26-8228, 2026.

EGU26-8359 | ECS | Posters on site | EOS4.4

Do trees save lives under climate change? It’s complicated  

Nils Hohmuth, Nora L. S. Fahrenbach (presenting), Yibiao Zou (presenting), Josephine Reek, Felix Specker, Tom Crowther, and Constantin M. Zohner

Forests are powerful climate regulators: Their CO2 uptake provides a global biogeochemical cooling effect, and in the tropics, this cooling is further strengthened by evapotranspiration. Given that temperature-related mortality is a relevant global health burden, which is expected to increase under climate change, we set out to test what we thought was a promising hypothesis: Can forests reduce human temperature-related mortality from climate change? 

To test this, we used simulated temperature changes to reforestation from six different Earth System Models (ESMs) under a future high-emission scenario, and paired them with age-specific population data and three methodologically different temperature-mortality frameworks (Cromar et al. 2022, Lee et al. 2019, and Carleton et al. 2022). We expected to find a plausible range of temperature-related mortality outcomes attributable to global future forests conservation efforts.

Instead, our idea ran head-first into a messy reality. Firstly, rather than showing a clear consensus, the ESMs produced a wide range of temperature responses to reforestation, varying both in magnitude and sign. This is likely due to the albedo effect, varying climatological tree cover and land use processes implemented by the models, in addition to internal variability which we could not reduce due to the existence of only one ensemble member per model. Consequently, the models disagreed in many regions on whether global forest conservation and reforestation would increase or decrease temperature by the end of the century.

The uncertainties deepened when we incorporated the mortality data. Mortality estimates varied by up to a factor of 10 depending on the ESM and mortality framework used. Therefore, in the end, the models could not even agree on whether forests increased or decreased temperature-related mortality. We found ourselves with a pipeline that amplified uncertainties of both the ESM and mortality datasets.

For now, the question remains wide open: Do trees save us from temperature-related deaths in a warming world, and if so, by how much?


* The first two authors contributed equally to this work.

How to cite: Hohmuth, N., Fahrenbach (presenting), N. L. S., Zou (presenting), Y., Reek, J., Specker, F., Crowther, T., and Zohner, C. M.: Do trees save lives under climate change? It’s complicated , EGU General Assembly 2026, Vienna, Austria, 3–8 May 2026, EGU26-8359, https://doi.org/10.5194/egusphere-egu26-8359, 2026.

EGU26-10401 | ECS | Orals | EOS4.4

The empty mine: Why better tools do not help you find new diamonds 

Ralf Loritz, Alexander Dolich, and Benedikt Heudorfer

Hydrological modelling has long been shaped by a steady drive toward ever more sophisticated models. In the era of machine learning, this race has turned into a relentless pursuit of complexity: deeper networks and ever more elaborate architectures that often feel outdated by the time the ink on the paper is dry. Motivated by a genuine belief in methodological progress, I, like many others, spent considerable effort exploring this direction, driven by the assumption that finding the “right” architecture or model would inevitably lead to better performance. This talk is a reflection on that journey; you could say my own Leidensweg. Over several years, together with excellent collaborators, I explored a wide range of state-of-the-art deep-learning approaches for rainfall–runoff modelling and other hydrological modelling challenges. Yet, regardless of the architecture or training strategy, I repeatedly encountered the same performance ceiling. In parallel, the literature appeared to tell a different story, with “new” models regularly claiming improvements over established baselines. A closer inspection, however, revealed that rigorous and standardized benchmarking is far from common practice in hydrology, making it difficult to disentangle genuine progress from artefacts of experimental design. What initially felt like a failure to improve my models turned out to be a confrontation with reality. The limiting factor was not the architecture, but the problem itself. We have reached a point where predictive skill is increasingly bounded by the information content of our benchmark datasets and maybe more importantly by the way we frame our modelling challenges, rather than by model design. Like many others, I have come to believe that if we want to move beyond the current performance plateau, the next breakthroughs are unlikely to come from ever more complex models alone. Instead, as a community, we need well-designed model challenges, better benchmarks, and datasets that meaningfully expand the information available to our models to make model comparisons more informative.

How to cite: Loritz, R., Dolich, A., and Heudorfer, B.: The empty mine: Why better tools do not help you find new diamonds, EGU General Assembly 2026, Vienna, Austria, 3–8 May 2026, EGU26-10401, https://doi.org/10.5194/egusphere-egu26-10401, 2026.

EGU26-13630 | ECS | Orals | EOS4.4

How NOT to identify streamflow events? 

Larisa Tarasova and Paul Astagneau

Examining catchment response to precipitation at event scale is useful for understanding how various hydrological systems store and release water. Many of such event scale characteristics, for example event runoff coefficient and event time scale are also important engineering metrics used for design. However, deriving these characteristics requires identification of discrete precipitation-streamflow events from continuous hydrometeorological time series.

Event identification is not at all a trivial task. It becomes even more challenging when working with very large datasets that encompass a wide range of spatial and temporal dynamics. Approaches range from visual expert judgement to baseflow-separation-based methods and objective methods based on the coupled dynamics of precipitation and streamflow. Here, we would like to present our experience in the quest to devise the “ideal” method for large datasets – and trust us, we tried, a lot. We demonstrate that expert-based methods can be seriously flawed simply by changing a few meta parameters, such as the length of displayed periods, baseflow-separation-based methods deliver completely opposite results when different underlying separation methods are selected, and objective methods suddenly fail when dynamics with different temporal scales are simultaneously present.

Ultimately, we realized that finding a one-size-fits-all method was not possible and that compromises had to be made to select sufficiently representative events across large datasets. Therefore, we advocate for pragmatic case-specific evaluation criteria and for transparency in event identification to make study results reproducible and fit for purpose, if not perfect.

How to cite: Tarasova, L. and Astagneau, P.: How NOT to identify streamflow events?, EGU General Assembly 2026, Vienna, Austria, 3–8 May 2026, EGU26-13630, https://doi.org/10.5194/egusphere-egu26-13630, 2026.

EGU26-14148 | Orals | EOS4.4 | Highlight

Buggy benefits of more fundamental climate models 

Bjorn Stevens, Marco Giorgetta, and Hans Segura

A defining attribute of global-storm resolving models is that modelling is replaced by simulation.  In addition to overloading the word “model”  this avails the developer of a much larger variety of tests, and brings about a richer interplay with their intuition.  This has proven helpful in identifying and correcting many mistakes in global-storm resolving models that traditional climate models find difficult to identify, and usually compensate by “tuning.”  It also means that storm-resolving models are built and tested in a fundamentally different way than are traditional climate models. In this talk I will review the development of ICON as a global storm resolving model to illustrate how this feature, of trying to simulate rather than model the climate system, has helped identify a large number of long-standing bugs in code bases inherited from traditional models; how this can support open development; and how sometimes these advantages also prove to be buggy.

How to cite: Stevens, B., Giorgetta, M., and Segura, H.: Buggy benefits of more fundamental climate models, EGU General Assembly 2026, Vienna, Austria, 3–8 May 2026, EGU26-14148, https://doi.org/10.5194/egusphere-egu26-14148, 2026.

EGU26-14374 | Orals | EOS4.4

The dangerous temptation of optimality in hydrological and water resources modelling 

Thorsten Wagener and Francesca Pianosi

Hydrological and water systems modelling has long been driven by the search for better models. We do so by searching for models or at least parameter combinations that provide the best fit to given observations. We ourselves have contributed to this effort by developing new methods and by publishing diverse case studies. However, we repeatedly find that searching for and finding an optimal model is highly fraught in the presence of unclear signal-to-noise ratios in our observations, of incomplete models and of highly imbalanced databases. We present examples of our own work through which we have realized that achieving optimality was possible but futile unless we give equal consideration to issues of consistency, robustness and problem framing. We argue here that the strong focus on optimality continues to be a hindrance for advancing hydrologic science and for transferring research achievements into practice – probably more so than in other areas of the geosciences.

How to cite: Wagener, T. and Pianosi, F.: The dangerous temptation of optimality in hydrological and water resources modelling, EGU General Assembly 2026, Vienna, Austria, 3–8 May 2026, EGU26-14374, https://doi.org/10.5194/egusphere-egu26-14374, 2026.

Among soil physical analyses, determination of the soil particle-size distribution (PSD) is arguably the most fundamental. The standard methodology combines sieve analysis for sand fractions with sedimentation-based techniques for silt and clay. Established sedimentation methods include the pipette and hydrometer techniques. More recently, the Integral Suspension Pressure (ISP) method has become available, which derives PSD by inverse modeling of the temporal evolution of suspension pressure measured at a fixed depth in a sedimentation cylinder. Since ISP is based on the same physical principles as the pipette and hydrometer methods, their results should, in principle, agree.

The ISP methodology has been implemented in the commercial instrument PARIO (METER Group, Munich). While elegant, the method relies on pressure change measurements with a resolution of 0.1 Pa (equivalent to 0.01 mm of water column). Consequently, the PARIO manual strongly advises avoiding any mechanical disturbance such as thumping, bumping, clapping, vibration, or other shock events. This warning is essentially precautionary, because to date no systematic experimental investigation of such disturbances has been reported.

To explore this issue, we prepared a single 30 g soil sample following standard PSD procedures and subjected it to 26 PARIO repeated measurement runs over a period of five months, each run lasting 12 h. Between runs, the suspension was remixed but otherwise not altered. The first ten runs (over ten days) were conducted without intentional disturbance to establish baseline repeatability. This was followed by eight runs with deliberately imposed and timed disturbances that generated single or repeated vibrations (“rocking and shocking”). After approximately two and five months, we conducted additional sets of five and three undisturbed runs, respectively.

We report how these mechanical disturbances, along with temperature variations during measurement and the time elapsed since sample pre-treatment, affected the derived PSD. The results provide a first quantitative assessment of how fragile—or robust—the ISP method and PARIO system really are when reality refuses to sit perfectly still.


How to cite: Nemes, A. and Durner, W.: Rocking and Shocking the PARIOTM: How Sensitive Is ISP-Based Particle-Size Analysis to Mechanical Disturbance?, EGU General Assembly 2026, Vienna, Austria, 3–8 May 2026, EGU26-14763, https://doi.org/10.5194/egusphere-egu26-14763, 2026.

EGU26-14852 | Posters on site | EOS4.4

Some Norwegian soils behave differently: is it an inheritance from marine sedimentation? 

Attila Nemes, Pietro Bazzocchi, Sinja Weiland, and Martine van der Ploeg

Predicting soil hydraulic behavior is necessary for the modeling of catchments and agricultural planning, particularly for a country like Norway where only 3% of land is suitable for farming. Soil texture is an important and easily accessible parameter for the prediction of soil hydraulic behavior. However, some Norwegian farmland soils, which formed as glacio-marine sediments and are characterized by a medium texture, have shown the hydraulic behavior of heavy textured soils. Coined by the theory behind well-established sedimentation-enhancing technology used in waste water treatment, we hypothesized that sedimentation under marine conditions may result in specific particle sorting and as a result specific pore system characteristics. To test this, we designed four custom-built devices to produce artificially re-sedimented columns of soil material to help characterize the influence of sedimentation conditions. We successfully produced column samples of the same homogeneous mixture of fine-sand, silt, and clay particles obtained by physically crushing and sieving (< 200 µm) subsoil material collected at the Skuterud catchment in South-East Norway, differing only in sedimentation conditions (deionized water vs 35 g per liter NaCl solution). Then, the inability of standard laboratory methods to measure the saturated hydraulic conductivity of such fine material, led us to “MacGyver” (design and custom-build) two alternative methodologies to measure that property, i.e. i) by adapting a pressure plate extractor for a constant head measurement and ii) by building a 10 m tall pipe-system in a common open area of the office, in order to increase the hydraulic head on the samples. There was a learning curve with both of those methods, but we have found that the salt-water re-sedimented columns were about five times more permeable than the freshwater ones, which was the complete opposite of our expectations. However, an unexpected blunder in the conservation of our samples suggests that our hypothesis should be further explored rather than dismissed. These contributions hint about the mechanisms that may underlie the anomalous hydraulic behaviour of certain Norwegian soils and raise new questions on the formation of marine clays, improving knowledge available for land managers and modellers.


How to cite: Nemes, A., Bazzocchi, P., Weiland, S., and van der Ploeg, M.: Some Norwegian soils behave differently: is it an inheritance from marine sedimentation?, EGU General Assembly 2026, Vienna, Austria, 3–8 May 2026, EGU26-14852, https://doi.org/10.5194/egusphere-egu26-14852, 2026.

EGU26-16619 | Orals | EOS4.4

The unknown knowns – the inconvenient knowledge in hydrogeology we do not like to use 

Okke Batelaan, Joost Herweijer, Steven Young, and Phil Hayes

“It is in the tentative stage that the affections enter with their blinding influence. Love was long since represented as blind…The moment one has offered an original explanation for a phenomenon which seems satisfactory, that moment affection for his intellectual child springs into existence…To guard against this, the method of multiple working hypotheses is urged. … The effort is to bring up into view every rational explanation of new phenomena, and to develop every tenable hypothesis respecting their cause and history. The investigator thus becomes the parent of a family of hypothesis: and, by his parental relation to all, he is forbidden to fasten his affections unduly upon any one” (Chamberlin, 1890).

The MADE (macro-dispersion) natural-gradient tracer field experiments were conducted more than 35 years ago. It aimed to determine field-scale dispersion parameters based on detailed hydraulic conductivity measurements to support transport simulation. A decade of field experiments produced a 30-year paper trail of modelling studies with no clear resolution of a successful simulation approach for practical use in transport problems.  As a result, accurately simulating contaminant transport in the subsurface remains a formidable challenge in hydrogeology.

What went awry, and why do we often miss the mark?

Herweijer et al. (2026) conducted a ‘back to basics’ review of the original MADE reports and concluded that there are significant inconvenient and unexplored issues that influenced the migration of the tracer plume and or biased observations. These issues include unreliable measurement of hydraulic conductivity, biased tracer concentrations, and underestimation of sedimentological heterogeneity and non-stationarity of the flow field. Many studies simulating the tracer plumes appeared to have ignored, sidestepped, or been unaware of these issues, raising doubts about the validity of the results.

Our analysis shows that there is a persistent drive among researchers to conceptually oversimplify natural complexity to enable testing of single-method modelling, mostly driven by parametric stochastic approaches. Researchers tend to be anchored to a specialised, numerically driven methodology and have difficulty in unearthing highly relevant information from ‘unknown known’ data or applying approaches outside their own specialised scientific sub-discipline. Another important aspect of these ‘unkowns knowns’ is the tendency to accept published data verbatim. Too often, there is no rigorous investigation of the original measurement methods and reporting, and, if need be, additional testing to examine the root cause of data issues.

Following the good old advice of Chamberlin (1890), we used a knowledge framework to systematically assess knowns, unknowns, and associated confidence levels, yielding a set of multi-conceptual models. Based on identified 'unknowns', these multi-models can be tested against reliable 'knowns' such as piezometric data and mass balance calculations.  

Chamberlin, T.C., 1890, The method of multiple working hypotheses. Science 15(366): 92-96. doi:10.1126/science.ns-15.366.92.

Herweijer J.C., S. C Young, P. Hayes, and O. Batelaan, 2026, A multi-conceptual model approach to untangling the MADE experiment, Accepted for Publication in Groundwater.

How to cite: Batelaan, O., Herweijer, J., Young, S., and Hayes, P.: The unknown knowns – the inconvenient knowledge in hydrogeology we do not like to use, EGU General Assembly 2026, Vienna, Austria, 3–8 May 2026, EGU26-16619, https://doi.org/10.5194/egusphere-egu26-16619, 2026.

EGU26-17373 | Posters on site | EOS4.4

The Hidden Propagator: How Free-Slip Boundaries Corrupt 3D Simulations 

Laetitia Le Pourhiet

Free-slip boundary conditions are routinely used in 3D geodynamic modelling because they reduce computational cost, avoid artificial shear zones at domain edges, and simplify the implementation of large-scale kinematic forcing. However, despite their apparent neutrality, our experiments show that free-slip boundaries systematically generate first-order artefacts that propagate deep into the model interior and can severely distort the interpretation of continental rifting simulations.

Here we present a set of 3D visco-plastic models inspired by the South China Sea (SCS) that were originally designed to study the effect of steady-state thermal inheritance and pluton-controlled crustal weakening. Unexpectedly, in all simulations except those with a very particular inverted rheological profile (POLC), the free-slip boundary on the “Vietnam side” of the domain generated a persistent secondary propagator, producing unrealistic amounts of lithospheric thinning in the southwest corner. This artefact appeared irrespective of crustal rheology, seeding strategy, or the presence of thermal heterogeneities.

We identify three systematic behaviours induced by free-slip boundaries in 3D:
(1) forced rift nucleation at boundary-adjacent thermal gradients,
(2) artificial propagator formation that competes with the intended first-order rifting, and
(3) rotation or shearing of micro-blocks not predicted by tectonic reconstructions.

These artefacts originate from the inability of free-slip boundaries to transmit shear traction, which artificially channels deformation parallel to the boundary when lateral thermal or mechanical contrasts exist. In 3D, unlike in 2D, the combination of oblique extension and boundary-parallel velocity freedom leads to emergent pseudo-transform behaviour that is entirely numerical.

Our results highlight a key negative outcome: free-slip boundaries cannot be assumed neutral in 3D rift models, especially when studying localisation, obliquity, multi-propagator dynamics, or the competition between structural and thermal inheritance. We argue that many published 3D rift models may unknowingly include such artefacts.


How to cite: Le Pourhiet, L.: The Hidden Propagator: How Free-Slip Boundaries Corrupt 3D Simulations, EGU General Assembly 2026, Vienna, Austria, 3–8 May 2026, EGU26-17373, https://doi.org/10.5194/egusphere-egu26-17373, 2026.

EGU26-18600 | Posters on site | EOS4.4

Data Disaster to Data Resilience: Lessons from CEDA’s Data Recovery  

Edward Williamson, Matt Pritchard, Alan Iwi, Sam Pepler, and Graham Parton

On 18 November 2025, a small error during internal data migration of between storage systems of the JASMIN data analysis platform in the UK led to a substantial part of the CEDA Archive being made temporarily unavailable online (but not lost!). The unfortunate incident caused serious disruption to a large community of users (and additional workload and stress for the team), it provided important learning points for the team in terms of:  

  • enhancing data security,  
  • importance of mutual support among professional colleagues,  
  • the value of clear and transparent communications with your users 
  • a unique opportunity to showcase the capabilities of a cutting-edge digital research infrastructure in the recovery and return to service with this “unscheduled disaster recovery exercise”. 


We report on the circumstances leading to the incident, the lessons learned, and the technical capabilities employed in the recovery. One example shows, nearly 800 Terabytes of data transferred from a partner institution in the USA in just over 27 hours, at a rate of over 8 Gigabytes per second using Globus. The ability to orchestrate such a transfer is the result of many years of international collaboration to support large-scale environmental science, and highlights the benefits of a federated, replicated data infrastructure built on well-engineered technologies.

How to cite: Williamson, E., Pritchard, M., Iwi, A., Pepler, S., and Parton, G.: Data Disaster to Data Resilience: Lessons from CEDA’s Data Recovery , EGU General Assembly 2026, Vienna, Austria, 3–8 May 2026, EGU26-18600, https://doi.org/10.5194/egusphere-egu26-18600, 2026.

EGU26-19755 | ECS | Posters on site | EOS4.4

Opposite cloud responses to extreme Arctic pollution: sensitivity to cloud microphysics, or a bug? 

Rémy Lapere, Ruth Price, Louis Marelle, Lucas Bastien, and Jennie Thomas

Aerosol-cloud interactions remain one of the largest uncertainties in global climate modelling. This uncertainty arises because of the dependence of aerosol-cloud interactions on many tightly coupled atmospheric processes; the non-linear response of clouds to aerosol perturbations across different regimes; and the challenge of extracting robust signals from noisy meteorological observations. The problem is particularly acute in the Arctic, where sparse observational coverage limits model constraints, pristine conditions can lead to unexpected behaviour, and key processes remain poorly understood.

A common way to tackle the challenge of uncertainties arising from aerosol-cloud interactions in climate simulations is to conduct sensitivity experiments using cloud and aerosol microphysics schemes based on different assumptions and parameterisations. By comparing these experiments, key results can be constrained by sampling the range of unavoidable structural uncertainties in the models. Here, we apply this approach to a case study of an extreme, polluted warm air mass in the Arctic that was measured during the MOSAiC Arctic expedition in 2020. We simulated the event in the WRF-Chem-Polar regional climate model both with and without the anthropogenic aerosols from the strong pollution event to study the response of clouds and surface radiative balance. To understand the sensitivity of our results to the choice of model configuration, we tested two distinct, widely-used cloud microphysics schemes.

Initial results showed that the two schemes simulated opposite cloud responses: one predicted a surface cooling from the pollution that was reasonably in line with our expectations of the event, while the other predicted the opposite behaviour in the cloud response and an associated surface warming. These opposing effects seemed to suggest that structural uncertainties in the two schemes relating to clean, Arctic conditions was so strong that it even obscured our ability to understand the overall sign of the surface radiative response to the pollution.

However, since significant model development was required to couple these two cloud microphysics schemes to the aerosol fields in our model, there was another explanation that we couldn’t rule out: a bug in the scheme that was producing the more unexpected results. In this talk, we will explore the challenges of simulating the Arctic climate with a state-of-the-art chemistry-climate model and highlight how examples like this underscore the value of our recent efforts to align our collaborative model development with software engineering principles and Open Science best practices.

How to cite: Lapere, R., Price, R., Marelle, L., Bastien, L., and Thomas, J.: Opposite cloud responses to extreme Arctic pollution: sensitivity to cloud microphysics, or a bug?, EGU General Assembly 2026, Vienna, Austria, 3–8 May 2026, EGU26-19755, https://doi.org/10.5194/egusphere-egu26-19755, 2026.

All statistical tools come with assumptions. Yet many scientists treat statistics like a collection of black-box methods without learning the assumptions. Here I illustrate this problem using dozens of studies that claim to show that solar variability is a dominant driver of climate. I find that linear regression approaches are widely misused among these studies. In particular, they often violate the assumption of ‘no autocorrelation’ of the time series used, though it is common for studies to violate several or all of the assumptions of linear regression. The misuse of statistical tools has been a common problem across all fields of science for decades. This presentation serves as an important cautionary tale for the Earth Sciences and highlights the need for better statistical education and for statistical software that automatically checks input data for assumptions.

How to cite: Steiger, N.: Pervasive violation of statistical assumptions in studies linking solar variability to climate, EGU General Assembly 2026, Vienna, Austria, 3–8 May 2026, EGU26-19776, https://doi.org/10.5194/egusphere-egu26-19776, 2026.

EGU26-20122 | ECS | Posters on site | EOS4.4

Developing Matrix-Matched Empirical Calibrations for EDXRF Analysis of Peat-Alternative Growth Media 

Thulani De Silva, Carmela Tupaz, Maame Croffie, Karen Daly, Michael Gaffney, Michael Stock, and Eoghan Corbett

A key reason for the widespread use of peat-based growth media in horticulture is their reliable nutrient availability when supplemented with fertilisers. However, due to environmental concerns over continued peat-extraction and use, peat-alternatives (e.g., coir, wood fibre, composted bark, biochar) are increasingly being used commercially. These alternative media often blend multiple materials, making it crucial to understand elemental composition and nutrient interactions between components. This study evaluates whether benchtop Energy Dispersive X-ray Fluorescence (EDXRF) can provide a rapid method for determining the elemental composition of peat-alternative components.

Representative growing media components (peat, coir, wood fibre, composted bark, biochar, horticultural lime, perlite, slow-release fertilisers, and trace-element fertiliser) were blended in different ratios to generate industry-representative mixes. Individual components and prepared mixes were dried and milled to ≤80 μm. An industry-representative mix (QC-50: 50% peat, 30% wood fibre, 10% composted bark, 10% coir, with fertiliser and lime additions) and 100% peat were analysed by EDXRF (Rigaku NEX-CG) for P, K, Mg, Ca, S, Fe, Mn, Zn, Cu and Mo, and compared against ICP-OES reference measurements. The instrument’s fundamental parameters (FP) method using a plant-based organic materials library showed large discrepancies relative to ICP-OES (relative differences: 268–390 084%) for most elements in both QC-50 and peat, with the exception of Ca in QC-50 (11%). These results confirm that the FP approach combined with loose-powder preparation is unsuitable for accurate elemental analysis of organic growing media.

An empirical calibration was subsequently developed using 18 matrix-matched standards (CRMs, in-house growing media and individual component standards). Matrix matching is challenging because mixes are mostly organic by volume, yet variable inorganic amendments (e.g., lime, fertilisers, and sometimes perlite) can strongly influence XRF absorption/enhancement effects. Calibration performance was optimised iteratively using QC-50 as the validation sample, until relative differences were <15% for all elements. When applied to 100% peat, agreement with ICP-OES results improved substantially for some macro-elements (e.g. Mg 10%, Ca 1%, S 19%) but remained poor for most trace elements (28–96%), demonstrating limited transferability of this calibration method across different elements and matrices tested.

Overall, these results demonstrate that loose powder preparation does not provide sufficiently robust accuracy for EDXRF analysis of organic growing media even with meticulous empirical matrix-matched calibration. We are therefore developing a pressed pellet method using a low-cost wax binder to improve sample homogeneity (packing density) and calibration transferability. Twenty unknown mixes will be analysed using both loose powder and pressed-pellet calibrations, and agreement with reference data (ICP-OES) will confirm method validation, supporting the development of EDXRF as a novel approach for growing media analysis.

How to cite: De Silva, T., Tupaz, C., Croffie, M., Daly, K., Gaffney, M., Stock, M., and Corbett, E.: Developing Matrix-Matched Empirical Calibrations for EDXRF Analysis of Peat-Alternative Growth Media, EGU General Assembly 2026, Vienna, Austria, 3–8 May 2026, EGU26-20122, https://doi.org/10.5194/egusphere-egu26-20122, 2026.

EGU26-20375 | ECS | Posters on site | EOS4.4

From Field to File: challenges and recommendations for handling hydrological data 

Karin Bremer, Maria Staudinger, Jan Seibert, and Ilja van Meerveld

In catchment hydrology, long-term data collection often starts as part of a (doctoral) research project. In some cases, the data collection continues on a limited budget, often using the field protocol and data management plan designed for the initial short-term project. Challenges and issues with the continued data collection are likely to arise, especially when there are multiple changes in the people involved. It is especially difficult for researchers who were not directly involved in the fieldwork to understand the data and must therefore rely on field notes and archived data. They then often encounter issues related to inconsistent metadata, such as inconsistent date-time formats and inconsistent or missing units, missing calibration files, and unclear file and processing script organization.

While the specific issues may sound very case-dependent, based on our own and other’s experiences from various research projects, it appears that many issues recur more frequently than one might expect (or be willing to admit). In this presentation, we will share our experiences with bringing spatially distributed groundwater level data collected in Sweden and Switzerland from the field to ready-to-use files. Additionally, we provide recommendations for overcoming the challenges during field data collection, data organization, documentation, and data processing using scripts. These include having a clear, detailed protocol for in the fieldwork and the data processing steps, and ensuring it is followed. Although protocols are often used, they are frequently not detailed enough or are not used as designed. The protocols might also not take into account the further use of the data, such as for hydrological modelling, beyond field collection. 

How to cite: Bremer, K., Staudinger, M., Seibert, J., and van Meerveld, I.: From Field to File: challenges and recommendations for handling hydrological data, EGU General Assembly 2026, Vienna, Austria, 3–8 May 2026, EGU26-20375, https://doi.org/10.5194/egusphere-egu26-20375, 2026.

In 2014 we developed the Wageningen Lowland Runoff Simulator (WALRUS), a conceptual rainfall-runoff model for catchments with shallow groundwater. Water managers and consultants were involved in model development. In addition, they sponsored the steps necessary for application: making an R package, user manual and tutorial, publishing these on GitHub and organising user days. WALRUS is now used operationally by several Dutch water authorities and for scientific studies in the Netherlands and abroad. When developing the model, we made certain design choices. Now, after twelve years of application in water management, science and education, we re-evaluate the consequences of those choices.

The lessons can be divided into things we learned about the model’s functioning and things we learned from how people use the model. Concerning the model’s functioning, we found that keeping the model representation close to reality has advantages and disadvantages. It makes it easy to understand what happens and why, but it also causes unrealistic expectations. Certain physically based relations hampered model performance because they contained thresholds, and deriving parameter values from field observations resulted in uncertainty and discussions about spatial representativeness.

Concerning the practical use, we found that the easy-to-use, open source R package with manual was indispensable for new users. Nearly all users preferred default options over the implemented user-defined functions to allow tailor-made solutions. Parameter calibration was more difficult than expected because the feedbacks necessary to simulate the hydrological processes in lowlands increase the risk of equifinality. In addition, lack of suitable discharge data for calibration prompted the request for default parameter values. Finally, the model was subject to unintended model use, sometimes violating basic assumptions and sometimes showing unique opportunities we had not thought of ourselves.

C.C. Brauer, A.J. Teuling, P.J.J.F. Torfs, R. Uijlenhoet (2014): The Wageningen Lowland Runoff Simulator (WALRUS): a lumped rainfall-runoff model for catchments with shallow groundwater, Geosci. Model Dev., 7, 2313-2332, doi:10.5194/gmd-7-2313-2014

How to cite: Brauer, C.: Re-evaluating the WALRUS rainfall-runoff model design after twelve years of application, EGU General Assembly 2026, Vienna, Austria, 3–8 May 2026, EGU26-21915, https://doi.org/10.5194/egusphere-egu26-21915, 2026.

EGU26-1499 | ECS | Posters on site | ESSI3.4

Navigating legacy Earth System Model software 

Lakshmi Aparna Devulapalli

As a Research Software Engineer in the natESM project, you have the opportunity to work with a wide range of Earth System Models (ESMs) developed by the German scientific community. Many of these models, originating in the 1990s, were predominantly written in Fortran. While the broader scientific software world has since transitioned toward languages such as C/C++ and Python, the ESM community is still in the process of catching up. As a result, legacy Fortran code—often 20 years old or more—presents unique and sometimes amusing challenges when attempting to adapt or port to modern technologies.

This talk offers a humorous look at these challenges through the eyes of an RSE navigating outdated code in order to accomplish present-day tasks. Topics will include unsustainable methods of structuring software, relic configuration files used for input, ambiguous naming conventions, unused or nonfunctional code that has never been removed, version control practices that can be improved, and other long-standing programming habits that need to evolve. The session will also highlight more modern and maintainable alternatives to these practices, offering a lighthearted yet constructive perspective on bringing legacy ESM code into the future.

How to cite: Devulapalli, L. A.: Navigating legacy Earth System Model software, EGU General Assembly 2026, Vienna, Austria, 3–8 May 2026, EGU26-1499, https://doi.org/10.5194/egusphere-egu26-1499, 2026.

natESM is a project that brings together German resources to develop a seamless, multiscale Earth System Modelling framework that can serve multiple purposes. This system is composed of several independent and diverse software models from the community, each addressing different parts of the Earth system. Given the variety of programming languages, model sizes and software architectures involved, as well as different experience among the responsible model developers, challenges arise in portability, performance and software quality. 

A key part of the natESM approach is the technical support to model developers provided by Research Software Engineers (RSEs). Their work focuses not only on integration, portability and performance, but also on systematically improving software quality within and across model components. This talk will outline the progress made so far, highlight lessons learned from the RSE-scientist collaborations, and present our future plans for assessing and enhancing software quality. The experiences and methods developed in natESM might serve as an example for improving software sustainability in Earth System Modeling more broadly.

How to cite: Loch, W. J.: The natESM Journey for Improving Software Quality in Earth System Modelling, EGU General Assembly 2026, Vienna, Austria, 3–8 May 2026, EGU26-1645, https://doi.org/10.5194/egusphere-egu26-1645, 2026.

Scientific software often begins as an internal research tool developed by scientists rather than trained software engineers, resulting in limited usability, documentation, and maintainability. emiproc, a tool for processing emission inventories for atmospheric chemistry and transport models, originally followed this trajectory: it grew organically within our laboratory, offered only a command-line interface, and lacked a clear structure, extensibility, and user-oriented documentation. We recently undertook a full modernization of emiproc following the best practices in scientific software development: redesign of the code base into modular components, consistent object oriented Python API, automated testing with continuous integration, extensive documentation for both users and developers and publication in the Journal of Open Source Software. The updated software now supports some of the most widely used emission inventories such as EDGAR and CAMS, and more specific ones like the City of Zurich inventory, and produces output for various transport models like ICON-ART, WRF, or GRAL. We will highlight our approaches for transforming emiproc into a sustainable and user-friendly tool and reflect on the challenges we encountered along the way. By sharing our experience, we aim both to contribute to the discussion on improving scientific software development and to learn from the approaches used by others. 

How to cite: Constantin, L. and Brunner, D.: Scientific Software Developement: Lessons from our Emission inventory processing software emiproc  , EGU General Assembly 2026, Vienna, Austria, 3–8 May 2026, EGU26-3484, https://doi.org/10.5194/egusphere-egu26-3484, 2026.

Geochemistry π is an open-source automated machine learning Python framework. Geochemists need only provide tabulated data (e.g. excel spreadsheet) and select the desired options to clean data and run machine learning algorithms. The process operates in a question-and-answering format, and thus does not require that users have coding experience. Version 0.7.0 includes machine learning algorithms for regression, classification, clustering, dimension reduction and anomaly detection. After either automatic or manual parameter tuning, the automated Python framework provides users with performance and prediction results for the trained machine learning model. Based on the scikit-learn library, Geochemistry π has established a customized automated process for implementing machine learning. The Python framework enables extensibility and portability by constructing a hierarchical pipeline architecture that separates data transmission from algorithm application. The AutoML module is constructed using the Cost-Frugal Optimization and Blended Search Strategy hyperparameter search methods from the A Fast and Lightweight AutoML Library, and the model parameter optimization process is accelerated by the Ray distributed computing framework. The MLflow library is integrated into machine learning lifecycle management, which allows users to compare multiple trained models at different scales and manage the data and diagrams generated. In addition, the front-end and back-end frameworks are separated to build the web portal, which demonstrates the machine learning model and data science workflow through a user-friendly web interface. In summary, Geochemistry π provides a Python framework for users and developers to accelerate their data mining efficiency with both online and offline operation options. All source code is available on GitHub  (https://github.com/ZJUEarthData/geochemistrypi), with a detailed operational manual catering to both users and developers (https://geochemistrypi.readthedocs.io/en/latest/).

How to cite: ZhangZhou, J. Z.: Geochemistry π: Machine Learning for Geochemists Who Don’t Want to Code, EGU General Assembly 2026, Vienna, Austria, 3–8 May 2026, EGU26-5192, https://doi.org/10.5194/egusphere-egu26-5192, 2026.


Advances in computing, statistics, and machine learning (ML) techniques have significantly changed research practices across disciplines. Despite Fortran’s continued importance in scientific computing and long history in data-driven prediction, its statistics and ML ecosystem remains thin. FSML (Fortran Statistics and Machine Learning) is developed to address this gap and make data-driven research with Fortran more accessible. 

The following points are considered carefully in its development and each come with their own challenges, solutions, and successes: 

  • Good sustainable software development practices: FSML is developed openly, conforms to language standards and paradigms, uses a consistent coding and comment style, and includes examples, tests, and documentation. A contributor’s guide ensures consistency for future contributions. 
  • Accessibility: FSML keeps the code clean and simple, avoids overengineering, and has minimal requirements. Additionally, an example-rich html documentation and tutorials are automatically generated with the FORtran Documenter (FORD) from code, comments, and simple markdown documents. Furthermore, it is developed to support compilation with LFortran (in addition to GFortran), so it can be used interactively like popular packages for interpreted languages. 
  • Community: FSML integrates community efforts and feedback. It uses the linear algebra interfaces of Fortran’s new de-facto standard library (stdlib) and the fortran package manager (fpm) for easy building and distribution. Its permissive licence (MIT) allows developers to integrate FSML into their projects without the restrictions often imposed by other licenses. Its simplicity, documentation, contributor’s guide, and GitHub templates remove barriers for new contributors and users. 
  • Communication: FSML updates are shared through a variety of methods with different communities. This includes a journal article (https://doi.org/10.21105/joss.09058) for visibility among academic colleagues, frequently updated online documentation (https://fsml.mutz.science/), social media updates, as well as a blog and Fortran Discourse posts to keep Fortran’s new and thriving online community updated. 

Early successes of FMSL’s approach and design include: 1) Students with little coding experience were able to learn the language and use library with only Fortran-lang’s tutorials and FSML’s documentation; 2) early career researchers with no prior experience in Fortran used FSML’s functions to conduct research for predicting future climate extremes; 3) FSML gained a new contributor and received a pull request only days after its first publicised release. 

The development of FSML demonstrates the merits of using good and open software development practices for academic software, as well as the potential of using the new Fortran development ecosystem and building bridges to the wider (non-academic) developer community. 

How to cite: Mutz, S. G.: Developing a modern Fortran statistics and machine learning library (FSML) , EGU General Assembly 2026, Vienna, Austria, 3–8 May 2026, EGU26-5393, https://doi.org/10.5194/egusphere-egu26-5393, 2026.

EGU26-6222 | ECS | Posters on site | ESSI3.4

Preparing for an Operational Environment: Software Development Standards in the Integrated Greenhouse Gas Monitoring System for Germany 

Diego Jiménez de la Cuesta Otero and Andrea Kaiser-Weiss

Modern scientific projects typically rely on software, e.g., for implementing numerical models, performing data pre- and postprocessing, solving inverse problems, or assimilating observations. Consequently, the reliability and reproducibility of scientific results critically depend on software quality. Scientific results are also intended to be shared or reused, and so is the software that produces them: especially in operational settings, where traceability and maintainability are essential. Therefore, a sustainable software development strategy becomes key to a project's success. Nevertheless, often software standards are treated as a secondary concern. This can lead to difficulties when introducing new features, delays in users' projects, limited reproducibility, strained collaborations, and ultimately lack of suitability for operational use.
 
We present the case of the German Weather Service (DWD) contributions within the Integrated Greenhouse Gas Monitoring System for Germany (ITMS). The primary objective of ITMS is the verification of greenhouse gas emissions, which imposes particularly high requirements on the results' traceability and reproducibility. Accordingly, most if not all software-based components of our system should adhere to software development standards that ensure these requirements. We provide an overview of our software development standards and their application, and discuss lessons learned that are transferable to both legacy and newly developed scientific software projects.

How to cite: Jiménez de la Cuesta Otero, D. and Kaiser-Weiss, A.: Preparing for an Operational Environment: Software Development Standards in the Integrated Greenhouse Gas Monitoring System for Germany, EGU General Assembly 2026, Vienna, Austria, 3–8 May 2026, EGU26-6222, https://doi.org/10.5194/egusphere-egu26-6222, 2026.

EGU26-7565 | Orals | ESSI3.4

The Modular Earth Submodel System (MESSy): lessons learned from 20+ years of continuous development 

Patrick Jöckel, Astrid Kerkweg, Kerstin Hartung, and Bastian Kern

Earth System Models (ESMs) aim at replicating the essence of the Earth Climate System in numerical simulations on high performance computing (HPC) systems. The underlying software is often rather complex, comprising several source code entities (modules and libraries, sometimes combining different programming languages), and has in many cases grown over decades. ESMs are usually structured as “multi-compartment” models, i.e. disassembled into a set of different components, each of which describes a different compartment in the Earth System, such as the atmosphere, the land surface, the ocean, the cryosphere, the biosphere, etc. Each compartment model, in turn, comprises a series of algorithms (numerical solvers, parametrizations), each of which represents a specific physical, chemical or socio-economic process. The behaviour of the “system as a whole” (i.e., the development of its state over time, its response to perturbations) is characterized by non-linear interactions and feedbacks between the different compartments and processes.

The implementation of such numerical models representing these inter-compartment and inter-process connections (i.e. the coupling) poses a challenging task for the software development, in particular given the need for (scalable) continuous further development and integration of new components, aiming at keeping pace with our knowledge about the real Earth System. Common requirements to such software are maintainability, sustainability (e.g. for new HPC architectures), resource efficiency (performance at run-time), but also development scalability.

More than twenty years ago (in 2005) we proposed the Modular Earth Submodel System (MESSy) as a potential new approach to Earth System modelling. Here, we present how we started as an “atmospheric chemistry add-on” to a specific General Circulation Model, but already with a wider range of applications in mind. We further show, how we went through our 2nd development cycle, finally arriving at our current state, the MESSy Integrated Framework that is soon to be released Open Source. Although our 4 major software design principles (will be presented!) did not change significantly from the early stage, we had to undergo several implementation revisions to reach its current state. Despite the continuous development, MESSy was always “state-of-the art” and “in operation”, i.e. used for scientific research. Thus, in retrospect, we present some of the milestones achieved by “pragmatic” software engineering in practice.

How to cite: Jöckel, P., Kerkweg, A., Hartung, K., and Kern, B.: The Modular Earth Submodel System (MESSy): lessons learned from 20+ years of continuous development, EGU General Assembly 2026, Vienna, Austria, 3–8 May 2026, EGU26-7565, https://doi.org/10.5194/egusphere-egu26-7565, 2026.

EGU26-7637 | Posters on site | ESSI3.4

Insights and tips for maintainability, robustness, usability, and reproducibility of geo-scientific models 

Konstantin Gregor, Benjamin Meyer, Joao Darela-Filho, and Anja Rammig

The complexity of geoscientific models, from pre-processing, model execution, and post-processing, poses major challenges to maintainability, reproducibility, and accessibility, even when FAIR data principles are followed.

Based on a survey of the 20 dynamic global vegetation models participating in the Global Carbon Project, we present the current state of, and potential improvements in, practices of software engineering and reproducibility within the community.
We also share notable successful practices from the community that could be helpful for all geo-scientists, including
- version control
- workflow management systems
- containerization
- automated documentation
- continuous integration
- automated visualizations

These approaches enable reproducible, portable, and automated workflows, improve code reliability, and enhance access to scientific results.

We conclude with a showcase of a fully reproducible and portable workflow implemented for one model, illustrating how these practices can be implemented by other modeling communities. This example can serve as a practical resource for improving reproducibility, accessibility, and software engineering standards across the geosciences.

How to cite: Gregor, K., Meyer, B., Darela-Filho, J., and Rammig, A.: Insights and tips for maintainability, robustness, usability, and reproducibility of geo-scientific models, EGU General Assembly 2026, Vienna, Austria, 3–8 May 2026, EGU26-7637, https://doi.org/10.5194/egusphere-egu26-7637, 2026.

EGU26-8659 | Orals | ESSI3.4

Improving long-term maintainability of the ACCESS models while transitioning to new architectures: challenges and opportunities 

Micael J. T. Oliveira, Edward Yang, Manodeep Sinha, and Kelsey Druken

Australia’s Climate Simulator, ACCESS-NRI, is Australia’s National Research Infrastructure (NRI) for climate modelling, supporting the development and community use of the Australian Community Climate and Earth System Simulator (ACCESS). 

As the ACCESS modelling system evolves to meet user requirements, so does the basic infrastructure that underpins our ability to efficiently run the models, with HPC architectures rapidly shifting towards GPUs, and new developments in Machine Learning disrupting how new models are developed and used. Under such circumstances, it's easy for scientists and software engineers to focus on more pressing matters and spend less time worrying about software maintainability. Although such type of "tactical" programming might bring benefits in the short term, long-term software maintainability and sustainability requires a more strategic approach. 

Using ACCESS-NRI as a case study, this presentation argues that addressing these challenges is not about any single tool or practice, but about adopting an integrated and coordinated strategy for scientific software development. I will describe how ACCESS-NRI is tackling these challenges by bridging skills and training gaps between scientists and software engineers, adopting well-established industry standards where appropriate (e.g. CMake, Git), and embedding software engineering best practices across development workflows. Alongside these technical efforts, addressing the social challenges of collaboratively developing large, open-source software is a key part of our approach, ensuring contributors can work effectively towards shared goals. 

A concrete example is GPU porting within the ACCESS modelling system. Successfully porting code to GPUs has required close collaboration with existing code owners, careful consideration of scientific and performance constraints, and a strong emphasis on avoiding divergent code paths that are difficult to maintain. This experience highlights the importance of the social dimensions of software development: changes cannot simply be imposed, but must be developed collaboratively to balance reliability, performance, portability, and long-term sustainability. 

By reflecting on what has worked—and what has not—this talk aims to share practical lessons that are transferable to other scientific software projects as they grow beyond small research teams into widely used, community-supported systems.

How to cite: Oliveira, M. J. T., Yang, E., Sinha, M., and Druken, K.: Improving long-term maintainability of the ACCESS models while transitioning to new architectures: challenges and opportunities, EGU General Assembly 2026, Vienna, Austria, 3–8 May 2026, EGU26-8659, https://doi.org/10.5194/egusphere-egu26-8659, 2026.

EGU26-8712 | Orals | ESSI3.4

 Modern tools to scale the compilation, testing and deployment of scientific software  

Aidan Heerdegen, Tommy Gatti, Harshula Jayasuriya, Thomas McAdam, Johanna Basevi, and Kelsey Druken

Modern software development practices such as continuous integration compilation, testing and deployment are a requirement for robust and trusted climate model development. However, this can be very challenging to achieve with climate models that often include legacy code requiring very specific versions of scientific libraries and that must run on complex HPC systems.  In addition, climate models have very long support timeframes (5+ years), with a requirement for absolute bitwise reproducibility, which requires precise control and provenance of the entire software stack. 

Australia’s Climate Simulator (ACCESS-NRI), is a national research infrastructure tasked with supporting the development and use of the Australian Community Climate and Earth System Simulator (ACCESS) model suite for the research community. At ACCESS-NRI we use spack, a build from source package manager targeting HPC, to create infrastructure to easily build ACCESS climate models and their supporting software stacks with full provenance and build reproducibility.  

Now the challenge for us at ACCESS-NRI, as an infrastructure supporting a wide range of user needs, is to scale this effort to multiple models, with many permutations of components and versions, without creating a very large support burden for our software engineers.  

We do this by focusing on modularity and generic workflows to achieve our desired scale efficiently. Spack's modular design has meant ACCESS-NRI has been able to create entirely generic GitHub workflows for building, testing and deploying many climate models on our target HPC, Australia’s National Computational Infrastructure (NCI), as well as run test builds on standard Linux virtual machines.  

As a result there is dramatically less support burden, as the CI/CD code is centralised and maintained in one location, and reused in many places. It is also extremely simple to add CI testing for new model components with just a few lines of GitHub Actions code. 

The choice of tools allowing a focus on a modular approach and generic workflows has been validated: we currently support seven models, with nineteen discrete components, and have grown from one deployment in 2023, eleven in 2024 and now twenty-nine in 2025,  as well as many thousands of pre-release test builds in the last quarter alone. This gives us confidence that we can continue to scale efficiently, without a large support burden requiring onerous resourcing that might otherwise place a technical limit on future activities. 

How to cite: Heerdegen, A., Gatti, T., Jayasuriya, H., McAdam, T., Basevi, J., and Druken, K.:  Modern tools to scale the compilation, testing and deployment of scientific software , EGU General Assembly 2026, Vienna, Austria, 3–8 May 2026, EGU26-8712, https://doi.org/10.5194/egusphere-egu26-8712, 2026.

EGU26-9441 | Posters on site | ESSI3.4

The Data-to-Knowledge Package - A Framework for publishing reproducible and reusable analysis workflows in Earth System Science 

Markus Konkol, Simon Jirka, Sami Domisch, Merret Buurman, Vanessa Bremerich, and Astra Labuce

More and more funders, reviewers, and publishers ask researchers to follow Open Science principles and make their research results publicly accessible. In the case of a computational analysis workflow, this means providing access to data and code that produced the figures, tables, and numbers reported in a paper. However, doing so, even in consideration of the FAIR Principles, does not mean others can easily reuse the materials and continue the research. It still requires effort to understand an analysis script (e.g., written in R or python) and extract those parts of a workflow (i.e. the code snippets) that generate, for instance, a particular figure.

In this contribution, we demonstrate the concept and realization of the Data-to-Knowledge Package (D2K-Package), a collection of digital assets which facilitate the reuse of computational research results [1]. The heart of a D2K-Package is the reproducible basis composed of the data and code underlying, for instance, a statistical analysis. Instead of simply providing access to the analysis script as a whole, the idea is to structure the code into self-contained and containerized functions making the workflow steps more reusable. Each function follows the input-processing-output-logic and fulfills a certain task such as data processing, analysis, or visualization. Creating such a reproducible basis allows inferring the following components that are also part of the D2K-Package:

A virtual lab is a web application, for example, in the form of a JupyterLab environment provided with the help of MyBinder. Users can access it via the browser and obtain a computational environment with all dependencies and the runtime pre-installed. Creating such a virtual lab is possible since all code is containerized and the image is built based on a specification of the used libraries, runtime, and their versions. A virtual lab can help users with programming expertise to engage with the code in a ready-to-use programming environment.

A web API service exposes the encapsulated and self-contained functions such that every function has a dedicated URL endpoint. Users can send requests from their analysis script to that endpoint and obtain the results via HTTP. Hence, they can reuse the functions without copying the code snippets or struggling with dependencies. Such a service can be realized using OGC API Processes and pygeoapi.

The computational workflow connects the functions to an executable analysis pipeline and acts as an entry point to a complex analysis. Such a workflow can help users obtain a better understanding of the functions and relevant input parameters. By using workflow tools such as the Galaxy platform, also users without programming experience receive the chance to change the parameter configuration and see how the new settings affect the final output.

Besides the concepts as outlined above, this contribution will also report on real demonstrators which showcase the idea of a D2K-Package.

This project has received funding from the European Commission’s Horizon Europe Research and Innovation programme. Grant agreement No 101094434.

1) Paper: Konkol et al. (2025) https://doi.org/10.12688/openreseurope.20221.3

How to cite: Konkol, M., Jirka, S., Domisch, S., Buurman, M., Bremerich, V., and Labuce, A.: The Data-to-Knowledge Package - A Framework for publishing reproducible and reusable analysis workflows in Earth System Science, EGU General Assembly 2026, Vienna, Austria, 3–8 May 2026, EGU26-9441, https://doi.org/10.5194/egusphere-egu26-9441, 2026.

EGU26-10884 | Posters on site | ESSI3.4

Teaming up as domain scientists and research software engineers for a sustainable HELIOS++ scientific software 

Dominic Kempf, Hannah Weiser, Dmitrii Kapitan, and Bernhard Höfle

The Heidelberg LiDAR Operations Simulator (HELIOS) is a scientific software for high-fidelity general-purpose virtual laser scanning (VLS) [1]. Using models for virtual scenes, scanner devices, and platforms, HELIOS allows to reproduce diverse scan scenarios over various geographical environments (forests, cities, mountains) and laser scanning systems (airborne and UAV-borne, mobile, terrestrial). Used for algorithm development, data acquisition planning, and method training for supervised machine learning, HELIOS has been successfully integrated into research workflows across the international laser scanning community.

HELIOS was initially developed in a research-driven environment in Java and released as open-source software [2]. Motivated by growing interest in the scientific community, the codebase was re-implemented in C++ to improve its memory footprint, runtime performance and functionality [3]. Since then, we are actively developing new features. Recent additions include support for dynamic scenes [4], new deflector mechanisms, and plug-ins for other open-source software such as Blender. Considering the continually growing user community, current software development specifically prioritizes quality assurance, reliability, long-term maintainability, and user-friendliness.

Supported by the DFG under the program "Research Software - Quality Assured and Re-usable" [5], the HELIOS++ developer team partnered up with the Scientific Software Center (SSC), a research software engineering service department at Heidelberg University. Combining the expertise of the domain scientist from the HELIOS team and the research software engineers (RSEs) of the SSC, we are strengthening the sustainability and usability of HELIOS. Measures presented in our talk include: Improving testing strategies and Continuous Integration, rewriting the CMake build system, packaging HELIOS as a Conda package, creating standalone installers, introducing a new Python API, and developing new strategies for sharing and reproducing HELIOS simulations. Additionally, we will reflect on the benefits as well as key challenges in fostering fruitful collaborations between domain scientists and RSEs. To this end, we will present as a domain scientist/RSE tandem.

References:

[1] HELIOS++: https://github.com/3dgeo-heidelberg/helios

[2] Bechtold, S., & Höfle, B. (2016): https://doi.org/10.5194/isprs-annals-III-3-161-2016

[3] Winiwarter, L et al. (2022): https://doi.org/10.1016/j.rse.2021.112772

[4] Weiser, H., & Höfle, B. (2026): https://doi.org/10.1111/2041-210x.70189

[5] Project website: https://www.geog.uni-heidelberg.de/en/3dgeo/projects-of-the-3dgeo-research-group/fostering-a-community-driven-and-sustainable-helios-scientific-software

How to cite: Kempf, D., Weiser, H., Kapitan, D., and Höfle, B.: Teaming up as domain scientists and research software engineers for a sustainable HELIOS++ scientific software, EGU General Assembly 2026, Vienna, Austria, 3–8 May 2026, EGU26-10884, https://doi.org/10.5194/egusphere-egu26-10884, 2026.

EGU26-12310 | Posters on site | ESSI3.4

WRF-Chem-Polar: an open, collaborative, and reproducible framework for modeling the polar atmosphere 

Jennie L. Thomas, Lucas Bastien, Ruth Price, Rémy Lapere, Ian Hough, Erfan Jahangir, Lucas Giboni, and Louis Marelle

Over the past 15 years, substantial developments have been made to adapt the regional chemistry-climate model WRF-Chem for applications in polar environments, with a main focus on the Arctic. These developments address key processes that are either absent from, or insufficiently represented in, the standard WRF-Chem distribution, particularly those controlling aerosol-cloud interactions, boundary layer chemistry, and surface-atmosphere coupling over snow, sea ice, and the polar ocean. However, until now, these advances have been distributed across multiple publications, code branches, and project-specific implementations, limiting transparency, reproducibility, and community use.

Here we present WRF-Chem-Polar, a consolidated and openly available modeling framework that integrates our polar-specific model developments into a single, traceable code base. The framework is hosted on GitHub and is structured around two tightly linked components: (i) a unified WRF-Chem-Polar model code that incorporates developments for polar aerosol and cloud processes and (ii) a dedicated infrastructure for compiling, running, and analyzing simulations.

A key objective of WRF-Chem-Polar (including the model code and infrastructure) is to enable transparent model evolution. All developments are tracked through version control, with automated test cases designed to systematically compare model behavior across code versions. This approach allows scientific changes to be evaluated quantitatively, supports regression testing, and facilitates controlled experimentation when introducing new parameterizations or process representations. The infrastructure also provides transparent workflows for simulation setup, post-processing, and diagnostics, improving reproducibility across users and platforms. Code quality, readability, and consistency is improved via coding style guides and modern software tools that include unit testing and automatic enforcement of linting rules.

By making these developments openly accessible and actively maintained, WRF-Chem-Polar lowers the barrier for the community to apply advanced polar chemistry–aerosol–cloud representations, while providing a robust framework for continued development and evaluation. This effort supports both fundamental process studies and applied research and contributes to broader open-science and FAIR modeling and furthers our objective of uptake of our work within the Earth system modeling community.

How to cite: Thomas, J. L., Bastien, L., Price, R., Lapere, R., Hough, I., Jahangir, E., Giboni, L., and Marelle, L.: WRF-Chem-Polar: an open, collaborative, and reproducible framework for modeling the polar atmosphere, EGU General Assembly 2026, Vienna, Austria, 3–8 May 2026, EGU26-12310, https://doi.org/10.5194/egusphere-egu26-12310, 2026.

EGU26-13932 | Orals | ESSI3.4

Software as Scientific Infrastructure: CIG’s Role  in Computational Geodynamics and Lessons from Developing ASPECT 

Rene Gassmöller, Wolfgang Bangerth, Juliane Dannberg, Daniel Douglas, Menno Fraters, Anne Glerum, Timo Heister, Lorraine Hwang, Robert Myhill, John Naliboff, Arushi Saxena, and Cedric Thieulot

Modeling software is integral to computational geodynamics, enabling quantitative investigation of planetary mantle, lithosphere and core dynamics across a wide range of spatial and temporal scales. Over the past two decades, the field’s software ecosystem has shifted significantly: codes that were once developed and maintained within single research groups have increasingly evolved into large, modular packages sustained by multi-institutional and often international collaborations. One important factor in this transition has been the establishment of community organizations like the Computational Infrastructure for Geodynamics (CIG), which has provided coordination and shared capacity that individual groups typically cannot sustain on their own.
In this contribution, I highlight benefits and lessons learned from work within CIG and from the development of the geodynamic modeling software ASPECT (Advanced Solver for Planetary Evolution, Convection, and Tectonics). Community organizations can accelerate scientific software development in several ways. Shared infrastructure (project landing pages, established user forums) improves discoverability and supports software adoption by the community. Targeted support, including seed funding, helps projects invest in feature development and maintenance. By streamlining software release and distribution and promoting robust development and testing workflows, community organizations improve software quality and reliability. Training the next generation of computational geoscientists through workshops, tutorials, and user support, builds shared expertise and makes community software more sustainable. Collectively, these activities reduce duplicated effort, lower barriers to entry for new users and contributors, and create pathways for software to evolve in step with scientific and numerical-method advances.
ASPECT provides a concrete example of this community-driven model. Designed to simulate thermal convection with a primary emphasis on Earth’s mantle, it has now been used for a broad range of applications including crustal deformation, magma dynamics, and fluid flow, convection on icy satellites, deformation of the inner core, and digital twins of mineral physics experiments. This widening scope has been possible because ASPECT prioritizes usability and extensibility, to accommodate evolving model complexity, and leverages modern numerical methods such as adaptive mesh refinement and robust linear/nonlinear solvers. From the start, ASPECT has been designed for large-scale parallel simulations required for problems with small-scale features embedded in mantle-scale domains.  It also strategically builds on established external libraries (e.g., deal.II, Trilinos, p4est) rather than re-implementing core algorithms. ASPECT’s success has been enabled by a well-tested framework, extensive documentation, a plugin architecture that simplifies customization, and active encouragement of community contributions through support and recognition. Together, these elements illustrate how organizational infrastructure and software design choices support long-term development and continued methodological innovation in geodynamic modeling, enabling robust simulations that address increasingly complex scientific questions.

How to cite: Gassmöller, R., Bangerth, W., Dannberg, J., Douglas, D., Fraters, M., Glerum, A., Heister, T., Hwang, L., Myhill, R., Naliboff, J., Saxena, A., and Thieulot, C.: Software as Scientific Infrastructure: CIG’s Role  in Computational Geodynamics and Lessons from Developing ASPECT, EGU General Assembly 2026, Vienna, Austria, 3–8 May 2026, EGU26-13932, https://doi.org/10.5194/egusphere-egu26-13932, 2026.

Process‑based models that explicitly couple soil water and heat transport, canopy radiative transfer, photosynthesis, and surface–atmosphere exchange are increasingly used to connect in‑situ observations with remote‑sensing–relevant land‑surface processes. However, their practical adoption—particularly in heterogeneous urban environments—remains challenging due to complex software dependencies, fragmented preprocessing pipelines, and limited transparency in model configuration. These challenges are exacerbated when such models are accessed through low‑level implementations that are difficult to adapt, reproduce, or extend by domain scientists.

We present rSTEMMUS‑SCOPE, an open‑source R interface to the coupled STEMMUS‑SCOPE modelling framework, designed to apply good practices in scientific software development to a hybrid soil–canopy model that is frequently used by practitioners and researchers interested in ecohydrology, urban climate, and remote sensing. The interface lowers barriers for reproducible experimentation by providing a modular, script‑based workflow that integrates eddy‑covariance forcing, in‑situ soil measurements, vegetation parameters, and multilayer soil discretisation within a transparent R‑based environment that supports from data pre-processing to the visualization of the results.

From a software‑engineering perspective, rSTEMMUS‑SCOPE adopts a modular, script‑based architecture that separates data inputs, model settings, execution, and post‑processing. The package provides reproducible pipelines for preprocessing eddy‑covariance meteorological forcing, precipitation, vegetation parameters, and multilayer soil discretisation (>50 layers), enabling fully scripted end‑to‑end simulations within R. Version‑controlled configuration files, consistent function interfaces, and documented defaults are used to support transparency and extensibility, while example workflows and vignettes lower the entry barrier for users who are domain scientists rather than trained software developers. The design follows a “user‑turned‑developer” paradigm, allowing advanced users to adapt parameterisations and forcing strategies while preserving a stable core interface.

We demonstrate these design choices using an urban case study in a temperate green space in Berlin, where hourly simulations were performed for 2019–2020. Observations from an eddy‑covariance tower and in‑situ soil moisture sensors are used as a software stress test rather than as the primary scientific result. Volumetric soil water content at 60 cm depth was reproduced well (Kling–Gupta Efficiency = 0.82; r = 0.88; α = 1.01), while simulated evapotranspiration captured diurnal and seasonal dynamics (r ≈ 0.67), with systematic biases during low‑energy conditions. Sensitivity experiments illustrate how differences in input data sources and parameter choices propagate through the modelling workflow, highlighting the importance of transparent, reproducible pipelines for diagnosing model behaviour.

We conclude by discussing practical lessons learned in wrapping complex process‑based models in high‑level languages: trade‑offs between modularity and performance, documenting urban‑specific parameter choices without constraining expert use, and testing strategies when upstream physics models are computationally expensive. rSTEMMUS‑SCOPE demonstrates how applying robust software practices enables meaningful, reproducible results and supports early‑career researchers working at the interface of modelling, data, and urban environmental science.

Software availability

rSTEMMUS‑SCOPE (open source): https://github.com/EcoExtreML/rSTEMMUS_SCOPE

How to cite: Duarte Rocha, A. and Aljoumani, B.: rSTEMMUS‑SCOPE: a user‑friendly open‑source R package wrapping a coupled soil–canopy process-based model for urban soil‑moisture and ET — good practices and lessons learned, EGU General Assembly 2026, Vienna, Austria, 3–8 May 2026, EGU26-15058, https://doi.org/10.5194/egusphere-egu26-15058, 2026.

EGU26-16877 | Orals | ESSI3.4

Beyond Good Practices: Designing Scientific Software for Contribution and Reuse 

Eric Hutton, Gregory Tucker, Mark Piper, and Tian Gan

Lowering the barrier to scientific contribution requires more than adopting good software practices; it requires software structures and standards that make contribution and reuse safe, scoped, and sustainable. We describe how the Community Surface Dynamics Modeling System (CSDMS) addresses these challenges through two complementary efforts: the Landlab modeling framework and the Basic Model Interface (BMI).

Landlab is a Python package designed as a platform for building Earth-surface process models. Over time, we discovered its architecture also promoted the user-turned-developer pathway, which has been critical to its success. While good software practices such as automated testing, continuous integration, documentation, and linting provide a foundation of reliability, Landlab’s component-based architecture has been central to enabling contribution. This design offers contributors clearly scoped and isolated entry points for adding new process models without needing to understand or modify the entire codebase. By enabling contributions from a growing set of domain experts and supporting them through shared maintenance infrastructure, this model expands the pool of invested contributors and reduces reliance on a small number of core developers, strengthening the prospects for long-term project sustainability.

The Basic Model Interface (BMI) complements this approach by providing a lightweight, language-agnostic interface standard that defines how models expose their variables, parameters, and time-stepping controls to the outside world. By separating scientific algorithms from model orchestration, BMI enables models to be reused, coupled, and tested across different frameworks without requiring changes to their internal implementations. Ongoing, community-guided work toward BMI 3.0 aims to extend these capabilities by improving support for parallel execution, clearer state management, and optional interface extensions.

Together, Landlab and BMI illustrate how framework design and community-driven standards can reduce technical debt and enable researchers to contribute reusable and interoperable software without requiring them to become full-time software engineers.

How to cite: Hutton, E., Tucker, G., Piper, M., and Gan, T.: Beyond Good Practices: Designing Scientific Software for Contribution and Reuse, EGU General Assembly 2026, Vienna, Austria, 3–8 May 2026, EGU26-16877, https://doi.org/10.5194/egusphere-egu26-16877, 2026.

EGU26-17128 | Posters on site | ESSI3.4

A modularized workflow for processing heterogeneous agricultural land use data 

Antonia Degen, Yi-Chen Pao, and Andrea Ackermann

In Germany each federal state is committed to collect required information on funding, farming practices and land use with an “Integrated Administration and Control System” (IACS) (Deutscher Bundestag 2014).

Based on the land parcel identification system (LPIS) as one of the core elements of IACS (European Commission, 2025), georeferenced data along with ancillary data are collected annually since 2005. Mandatory requirements for checks and on-site validations ensure a high data quality which makes IACS data very suitable for research purposes (Leonhardt 2024). Our goal is to create a nation-wide timeseries based on IACS data, that contains detailed information on land use, animal husbandry and farm statistics and can be used for comprehensive land use, soil, agricultural-policy and biodiversity research. Despite this, IACS data remain underused for scientific research due to the following challenges:

  • Data protection: Obtaining and handling IACS data requires a legal agreement between the research project and the respective federal state including Data Usage Agreements.
  • Data heterogeneity: All federal states have unique data processing workflows and historical changes in processing practices resulting in different data-types, -formats, structure, keys, encodings, etc.
  • Data volume: Large storage volume, processing capacities and back-up systems with high security levels are required. Efficiency and data minimization is an important framework for the design of the processing workflows.


In this contribution we as user-turned-developers, want to show how we utilize our toolbox of open-source software (Linux, Bash, R, PostgreSQL/PostGIS, Python, GitLab), for a suitable modularized workflow to meet these challenges.

The first module is tailored to pre-process the data to its specific federal state qualities. Module two and three contain more general functions to grant machine readability. All data is then processed in a data cleaning workflow and imported into our PostgreSQL/PostGIS database.

We use our database for data harmonization by implementing modularized functions to handle different use cases.

The resulting harmonized datasets are provided to research teams with data protection clearance for federal state and year respectively. Harmonized tables are versioned as releases, to either grant reproducibility as well as to provide necessary updates.

Figure 1 Modularized workflow for IACS data processing towards a nation-wide harmonized timeseries

Reproducibly is granted by using script-based procedures that are stored and versioned in GitLab as well as extensive code documentation and automized file-based processing documentation.

Our modularization process lays the foundation for sustainable handling of complex administrative agricultural data and is a first step towards a software development approach.

Literature

European Commission (2025): Integrated Administration and Control System (IACS). Online available  https://agriculture.ec.europa.eu/common-agricultural-policy/financing-cap/assurance-and-audit/managing-payments_en

Deutscher Bundestag (2014): Gesetz über die Verarbeitung von Daten im Rahmen des Integrierten Verwaltungs- und Kontrollsystems nach den unionsrechtlichen Vorschriften für Agrarzahlungen. InVeKoS- Daten-Gesetz - InVeKoSDG, vom 5 (2019). Online available: https://www.gesetze-im-internet.de/invekosdg_2015/

Heidi Leonhardt, Maximilian Wesemeyer, Andreas Eder, Silke Hüttel, Tobia Lakes, Henning Schaak, Stefan Seifert, Saskia Wolff (2024): Use cases and scientific potential of land use data from the EU’s Integrated Administration and Control System: A systematic mapping review, Ecological Indicators, Volume 167, ISSN 1470-160X, https://doi.org/10.1016/j.ecolind.2024.112709.

How to cite: Degen, A., Pao, Y.-C., and Ackermann, A.: A modularized workflow for processing heterogeneous agricultural land use data, EGU General Assembly 2026, Vienna, Austria, 3–8 May 2026, EGU26-17128, https://doi.org/10.5194/egusphere-egu26-17128, 2026.

EGU26-17569 | Orals | ESSI3.4

Latest Developments in Probtest: Probabilistic Testing for Robust CPU/GPU Validation of Scientific Models 

Annika Lauber, Chiara Ghielmini, Daniel Hupp, and Claire Merker

Porting large numerical models to heterogeneous computing architectures introduces significant challenges for software validation and testing, as results from CPU- and GPU-based executions are typically not bit-identical. These differences arise from variations in floating-point arithmetic, execution order, and the use of architecture-specific mathematical libraries. Traditional regression testing approaches based on exact reproducibility therefore become inadequate, particularly in continuous integration (CI) workflows.

Probtest is a lightweight testing framework developed to address this problem in the ICON numerical weather and climate model. It implements a probabilistic, tolerance-based testing strategy that enables robust numerical consistency checks between CPU and GPU runs while remaining fast and resource-efficient. Tolerances are derived from ensembles generated by perturbing prognostic variables in the initial conditions. From a larger ensemble of CPU reference runs, a representative subset is selected to compute variable-specific tolerance ranges that define acceptable numerical deviations. This approach allows reliable validation across architectures without constraining model development or optimization.

Recent developments focus on improving extensibility, usability, and reproducibility. Support for Feedback Output Files (FOF) has been added, enabling consistency checks for observation-based diagnostics in addition to model state variables. Furthermore, Probtest has been fully containerized, with each release published on Docker Hub. This removes local installation barriers, ensures reproducible testing environments, and simplifies integration into CI pipelines and collaborative development workflows. These developments strengthen Probtest as a practical and portable tool for validating ICON across heterogeneous computing platforms.

How to cite: Lauber, A., Ghielmini, C., Hupp, D., and Merker, C.: Latest Developments in Probtest: Probabilistic Testing for Robust CPU/GPU Validation of Scientific Models, EGU General Assembly 2026, Vienna, Austria, 3–8 May 2026, EGU26-17569, https://doi.org/10.5194/egusphere-egu26-17569, 2026.

EGU26-17829 | Posters on site | ESSI3.4

Evolution of the EPOS Platform Open Source 

Marco Salvi, Valerio Vinciarelli, Rossana Paciello, Daniele Bailo, Alessandro Crocetta, Kety Giuliacci, Manuela Sbarra, Alessandro Turco, Mario Malitesta, Jean-Baptiste Roquencourt, Martin Carrere, Jan Michalek, Baptiste Roy, and Christopher Card

The development of sustainable and reusable scientific software infrastructures remains a significant challenge in geosciences, particularly when transitioning from single-purpose systems to platforms intended for broader community adoption. This presentation shares experiences and lessons learned from developing the EPOS Platform as an open-source, reusable data integration and visualization system, demonstrating how intentional architectural decisions and tooling investments can transform research infrastructure software into widely adoptable solutions.

The EPOS Platform (European Plate Observing System) initially served as the technical backbone for EPOS ERIC (https://www.epos-eu.org/epos-eric), providing integrated access to solid Earth science data across ten thematic domains. Built on a choreography architecture using Docker and Kubernetes, the system successfully fulfilled its original mandate. However, as other research infrastructures expressed interest in similar capabilities, we recognized the potential for broader impact and initiated a strategic shift toward creating a genuinely reusable open-source platform.

The transition required addressing fundamental challenges in software reusability. Initially, deployment necessitated manual configuration and deep infrastructure knowledge, creating significant adoption barriers. To overcome this, we developed the epos-opensource CLI tool (https://github.com/EPOS-ERIC/epos-opensource), a command-line interface with an integrated terminal user interface (TUI) that reduces deployment from a complex manual process to a single command. This tool enables researchers and developers to deploy fully functional instances locally using either Docker Compose or Kubernetes, significantly accelerating both external adoption and internal development workflows.

We released the complete platform under GPL v3 license, ensuring that all code, including that powering the production EPOS Platform (https://www.ics-c.epos-eu.org/), remains open and community-accessible. Within EPOS ERIC, the open-source release and deployment tooling facilitate rapid provisioning of testing environments for developers and metadata contributors. Comprehensive documentation was developed using Docusaurus, following standard open-source practices to provide installation guides, system architecture references, and user tutorials. The EPOS Platform Open Source has been leveraged to enhance data sharing by multiple research initiatives, including ENVRI-Hub NEXT (https://envri.eu/envri-hub-next/), DT-GEO (https://dtgeo.eu/), IPSES (https://www.ipses-ri.it), and Geo-INQUIRE (https://www.geo-inquire.eu/), demonstrating the platform's versatility across different research contexts.

Our experience demonstrates that developing reusable scientific software requires deliberate investment beyond initial functionality. Key factors include comprehensive documentation following community standards, simplified deployment through user-friendly tooling, architectural flexibility for diverse use cases, and genuine open-source practices where production and community code remain unified. These principles, while resource-intensive, are essential for scientific software to achieve meaningful impact and contribute to a more sustainable, collaborative research infrastructure ecosystem.

This presentation will explore the evolution of the EPOS Platform Open Source, demonstrating how strategic investments in deployment tooling, comprehensive documentation, and architectural flexibility enabled the transformation from a single-purpose infrastructure to a widely adoptable community resource.

How to cite: Salvi, M., Vinciarelli, V., Paciello, R., Bailo, D., Crocetta, A., Giuliacci, K., Sbarra, M., Turco, A., Malitesta, M., Roquencourt, J.-B., Carrere, M., Michalek, J., Roy, B., and Card, C.: Evolution of the EPOS Platform Open Source, EGU General Assembly 2026, Vienna, Austria, 3–8 May 2026, EGU26-17829, https://doi.org/10.5194/egusphere-egu26-17829, 2026.

EGU26-20382 | Posters on site | ESSI3.4

User-turned-developer: Scientific software development for a national nutrient policy impact monitoring in Germany 

Max Eysholdt, Maximilian Zinnbauer, and Elke Brandes

Many countries in the EU fail to protect their waters adequately from nitrogen and phosphorus inputs (European Environment Agency. 2024), often originating from agricultural sources (Sutton 2011). Germany was found guilty by the European Court of Justice for insufficient implementation of the EU Nitrates Directive, for protection of waters from nutrient pollution from agriculture (European Court of Justice 2018). In response, Germany introduced a monitoring system for assessing the impact of the recently updated application ordinance, which implements the EU Nitrates Directive. This monitoring creates time series of pollution-related spatial indicators ranging from land use to modelled nutrient budgets. Input data on land use sources the Integrated Administration and Control System. The results are used by German authorities for reporting to the EU as well as national and regional water protection policy.

We present the technical concept, infrastructure and workflows established for this data-intensive, long-term project and discuss challenges and limitations when operating in the science-policy nexus. We aim to share good practices in modularization, automation, and reproducibility, and discuss strategies for efficient maintenance of scientific software development in context of long-term, policy-relevant monitoring projects.

Our system is designed to handle heterogeneous data with different levels of data protection requirements related to General Data Protection Regulation (GDPR). A modular structure was chosen to enhance usability and maintenance. Reproducibility is ensured through version-controlled, script-based software development. For efficiency, consistency and the streamlining of workflows reporting is automated and an ever-growing set of user-faced functions is bundled into a package. To ensure the possibility of advances in data preparation and modelling, a submission-based approach was chosen, recalculating all indicator times series each reporting year. This requires robust data management, reproducibility, and resilient workflows to accommodate evolving input data.

We still face challenges in handling Open Science principles, political stakeholder interests as well as GDPR. Similarly, scientific advances lead to updated results which may conflict with the need for clear and unambiguous outcomes of the authorities. Regular deadlines and stakeholder needs resulted in an organically grown code base, and sometimes cause neglection of quality checks and unit testing. Additionally, interaction between reproducible, script-based solutions and “traditional” workflows based on Microsoft Word are inefficient. The changing structure of the yearly gathered data hinders automatization of data processing. Due to this and the annual advances in the processing of the input data, maintaining the database is also challenging.  This we would like to share and discuss with other teams facing similar problem

Our system is tailored to handle heterogeneous and sensitive data of different sources producing reliable results and accommodating advances in data preparation and modelling in the long run. However, navigating technical limitations, good scientific practice and policymakers’ interests is challenging for us.

Literature

European Court of Justice (2018). European Commission against Federal Republic of Germany. Infringement Proceedings ‐ Directive 91/676/EEC.

European Environment Agency. (2024). Europe's state of water 2024: the need for improved water resilience. Publications Office.

Sutton, Mark A. (Ed.) (2011). The European nitrogen assessment. Sources, effects and policy perspectives. Cambridge 2011.


How to cite: Eysholdt, M., Zinnbauer, M., and Brandes, E.: User-turned-developer: Scientific software development for a national nutrient policy impact monitoring in Germany, EGU General Assembly 2026, Vienna, Austria, 3–8 May 2026, EGU26-20382, https://doi.org/10.5194/egusphere-egu26-20382, 2026.

EGU26-21175 | Orals | ESSI3.4

A Python Dynamical Core for Numerical Weather Prediction 

Daniel Hupp, Mauro Bianco, Anurag Dipankar, Till Ehrengruber, Nicoletta Farabullini, Abishek Gopal, Enrique Gonzalez Paredes, Samuel Kellerhals, Xavier Lapillonne, Magdalena Luz, Christoph Müller, Carlos Osuna, Christina Schnadt, William Sawyer, Hannes Vogt, and Yilu Chen

MeteoSwiss uses the ICON model to produce high-resolution weather forecasts at kilometre scale, with GPU support enabled through an OpenACC-based Fortran implementation. While effective, this approach limits portability, maintainability, and development flexibility. Within the EXCLAIM project, we focus on the dynamical core of the model—responsible for approximately 55% of the total runtime—and explore alternatives based on a domain-specific Python framework. In particular, we reimplemented the computational stencils using GT4Py and integrated them into the existing Fortran codebase, enabling the partial replacement of key components. This hybrid approach aims to improve developer productivity and code adaptability while preserving performance. In this contribution, we present our strategy for developing software for a weather and climate model involving multiple institutions and stakeholders. We present several optimisation techniques and compare the performance of the new implementation with the original OpenACC version. Our results show improved computational efficiency alongside a substantial improvement in the development workflow. Finally, we discuss the practical challenges of integrating Python components into operational numerical weather prediction systems.

How to cite: Hupp, D., Bianco, M., Dipankar, A., Ehrengruber, T., Farabullini, N., Gopal, A., Gonzalez Paredes, E., Kellerhals, S., Lapillonne, X., Luz, M., Müller, C., Osuna, C., Schnadt, C., Sawyer, W., Vogt, H., and Chen, Y.: A Python Dynamical Core for Numerical Weather Prediction, EGU General Assembly 2026, Vienna, Austria, 3–8 May 2026, EGU26-21175, https://doi.org/10.5194/egusphere-egu26-21175, 2026.

EGU26-21181 | ECS | Posters on site | ESSI3.4

Automating Data Quality Checks for Heterogenous Datasets: A scalable approach for IACS data 

Yi-Chen Pao and Boineelo Moyo

The Integrated Administration and Control System (IACS) is a key instrument of the European Union's (EU) Common Agricultural Policy to monitor agricultural subsidies and support evidence-based policy. IACS provides the most comprehensive EU-wide dataset that combines detailed geospatial data with thematic attributes related to land use, livestock and measures, making it highly valuable for research on agri-environmental policies and agrobiodiversity (Leonhardt, et.al., 2024). In Germany, these data are collected independently by 14 federal states, resulting in substantial heterogeneity across datasets in terms of file format, encoding, data structure and level of completeness. These inconsistencies present major challenges for efficient data management, scientific assessments, reproducibility and the long-term reuse of the data.

This contribution presents an ongoing automated framework designed to standardise and validate raw IACS datasets across our data management pipeline, from data collection and harmonisation to data import and long-term management. Our main goal is to reduce redundancy and manual effort in the data quality check process, while enabling scalable and reproducible data quality assurance. The objective is to therefore develop an optimised, non-redundant data check system that captures structural, semantic and geospatial metadata from heterogenous datasets using a single-pass folder scan. To achieve this objective, we focus on the following approaches:

  • Develop an inventory-based data pipeline / architecture: A lightweight inventory object containing metadata for each file in the delivery folder
  • Automate routine and error – prone data quality scripts: Replace manual checks with modular and reusable automated components from a central inventory system
  • Enable reproducible execution and reporting: Implement a Quarto based framework (an open-source system for reproducible computational documents combining code, results and narrative) that produces human readable visualisations for technical and non-technical users

Our system leverages a diverse set of programming tools including R, Quarto, Bash, Python and SQL, from data delivery or collection to data management in the database. The approach is based on an inventory-first architecture: a lightweight yet expressive data structure generated from a single scan of raw input folder with different types of data formats. The inventory then captures essential metadata of each file such as file types, attribute schemas, geospatial extents, and identifier patterns (e.g., farm identifier, land parcel identifier). A consolidated framework of all data check scripts then enables all subsequent quality-check modules to operate efficiently without repeated file access. Executing the consolidated framework performs a range of automated data quality checks such as file integrity verification, cross-file joinability analysis, schema consistency assessment, and geospatial coherence analysis.

The resulting output in the form of an interactive Quarto dashboard then provides a comprehensive first assessment of the delivered data, where all essential metadata and errors of each file can be derived and inspected in one instance. This workflow not only minimises manual work of checking each file separately and error propagation but also ensures traceable, documented logs.

Our results show how implementing such automated data checks considerably accelerates harmonization processes and improves the data management lifecycle.

How to cite: Pao, Y.-C. and Moyo, B.: Automating Data Quality Checks for Heterogenous Datasets: A scalable approach for IACS data, EGU General Assembly 2026, Vienna, Austria, 3–8 May 2026, EGU26-21181, https://doi.org/10.5194/egusphere-egu26-21181, 2026.

EGU26-21322 | Posters on site | ESSI3.4

SIrocco: a new workflow tool for Climate and Weather including explicit data representation and ICON support 

Matthieu Leclair, Julian Geiger, Alexander Goscinski, and Rico Häuselmann

With the increase in simulation resolution, climate and weather models are now potentially outputting petabytes of data. The largest projects can thus require complex workflows tightly integrating pre-processing, computing, post-processing, monitoring, potential downstream applications or archiving. We introduce here Sirocco, a new climate and weather workflow tool written in Python in collaboration between ETHZ, PSI and CSCS with a special care for the ICON model. 

Sirocco is written with separation of concerns in mind, where users should only care about expressing their desired workflow and bringing the scripts/sources for each task independently. That's why "Sirocco" first designates a user-friendly yaml based configuration format. Inspired by cylc and AiiDA, it describes the workflow graph by equally integrating data nodes (input and output) alongside task nodes. Workflows thus become truly composable, in the sense that no task is making any assumption on the behavior of others.

Sirocco currently defines two types of tasks, called "plugins". The "shell" plugin is dedicated to tasks for which users provide their own main executable, including any auxiliary set of files. The only requirement is the ability to interface with Sirocco, either with executables accepting command line arguments and environment variables and/or by parsing a yaml file providing the necessary context for task execution. The "icon" plugin is a dedicated user friendly interface to the ICON model. On top of the integration to Sirocco workflows, it provides easy ways of handling matters like date changing, namelist modifications, restart files or predefined setups for target machine and architecture. By design, other plugins can be written to facilitate the integration of any other application/model.

Once an internal representation is generated from the configuration file, two possible back-ends can orchestrate the workflow. The first one, called "stand-alone", is entirely implemented inside Sirocco and runs autonomously on the target machine, only relying on the HPC scheduler daemon to keep the workflow running. The second one interfaces with the low-level workflow library AiiDA and its satellite packages, running on a dedicated server with its own daemon and dumping workflow metadata in a queryable database. Both orchestrators implement the novel concept of a deep dynamical task front that propagates through the graph, enabling the ahead-of-time submission of an arbitrary number of task generations.

At the end of the day, Sirocco not only provides the ability to run complex workflows and a nice interface to ICON but also, through its workflow manager nature, facilitates shareability and reproducibility in the community.

How to cite: Leclair, M., Geiger, J., Goscinski, A., and Häuselmann, R.: SIrocco: a new workflow tool for Climate and Weather including explicit data representation and ICON support, EGU General Assembly 2026, Vienna, Austria, 3–8 May 2026, EGU26-21322, https://doi.org/10.5194/egusphere-egu26-21322, 2026.

EGU26-21348 | Posters on site | ESSI3.4

CAES3AR: Collaborative and Efficient Scientific Software Support Architecture 

Florian Wagner, Camilla Lüttgens, Andrea Balza Morales, Marc S. Boxberg, Marcel Nellesen, and Marius Politze

Scientific software is essential for accelerating research and enabling transparent, reproducible results, but increasing adoption also increases support demands that can overwhelm small academic development teams. Since most scientists are not trained as software engineers, early-stage research software often lacks the resources and structure needed for broader use, making streamlined support workflows crucial for both users and developers. Addressing these issues is essential to ensure that researchers can focus on their core activities while streamlining processes that benefit both users and developers.

Our project CAES3AR (Collaborative and Efficient Scientific Software Support Architecture) aims to provide researchers with a more open and efficient infrastructure for software support by developing a collaborative architecture. The framework is currently being developed and evaluated using pyGIMLi, an open-source library for modeling and inversion in geophysics (www.pygimli.org), while being designed to remain transferable to a broad range of open-source projects. Thanks to its practicality and gallery of existing examples, pyGIMLi has become widely adopted in the near-surface geophysical community. At the same time, its use across diverse user environments introduces recurring support challenges, since variations in operating systems and installed dependencies can make issue reproduction and debugging time-intensive, which often reduces the capacity for methodological and software innovation.

To address these challenges efficiently, the CAES3AR framework aims to automate key aspects of user support through a generic toolchain that integrates seamlessly with existing infrastructures such as GitHub and Jupyter. It facilitates user engagement by allowing them to create GitHub or GitLab issues that include links to temporary code execution environments (e.g., JupyterLab) equipped with collaborative editing features—potentially integrated with existing JupyterHub and cloud-based infrastructures. Additionally, automated bots powered by GitHub Actions or GitLab jobs will provide real-time feedback on whether issues exist across all platforms and with the latest software versions. If a problem persists, supporters can directly modify the user's code within Jupyter without requiring any downloads or installations. Proposed changes will be presented as formatted code alterations (“diffs”) attributed to their authors in the Git issue for future reference, ensuring clarity and continuity even after the temporary JupyterHub instance is no longer available.

We recently hosted a community workshop to assess developer and user needs, identify challenges in current support practices, and gather requirements for practical adoption. This presentation summarizes key findings from those discussions and introduces early CAES3AR prototypes developed for the pyGIMLi ecosystem. As CAES3AR remains in active development, we conclude by inviting community feedback on additional features and design priorities, with the broader aim of ensuring transferability and long-term utility across multiple open-source scientific software projects.

Project website: https://caesar.pages.rwth-aachen.de/


How to cite: Wagner, F., Lüttgens, C., Balza Morales, A., Boxberg, M. S., Nellesen, M., and Politze, M.: CAES3AR: Collaborative and Efficient Scientific Software Support Architecture, EGU General Assembly 2026, Vienna, Austria, 3–8 May 2026, EGU26-21348, https://doi.org/10.5194/egusphere-egu26-21348, 2026.

EGU26-23282 | Posters on site | ESSI3.4

Evolving Scientific Software in Long-Running Observatories: Lessons from the TERENO Sensor Management Migration 

Ulrich Loup, Werner Küpper, Christof Lorenz, Rainer Gasche, Ralf Kunkel, Ralf Gründling, Jannis Groh, Nils Brinckmann, Jan Bumberger, Marc Hanisch, Tobias Kuhnert, Rubankumar Moorthy, Florian Obersteiner, David Schäfer, and Thomas Schnicke

Abstract:

Scientific software in geosciences often grows organically: initial solutions
are developed within small teams to meet immediate research needs, and over time
they evolve into critical infrastructure. While this organic growth can be
highly effective, it frequently leads to challenges in maintainability,
documentation, and reuse when systems are expected to support larger communities
or integrate with new platforms. In this contribution, we share lessons learned
from evolving the software infrastructure of the TERENO environmental observatories.

For more than a decade, TERENO relied on tightly coupled systems in which
observational data and sensor metadata were managed together. This data
infrastructure proved robust in daily operations but gradually accumulated
inconsistencies, implicit conventions, and project-specific extensions that were
insufficiently documented. As TERENO is now being integrated into the Earth &
Environment DataHub, these limitations became visible and required a systematic
rethinking of how sensor and measurement metadata are managed.

As part of the infrastructure redesign within the Earth & Environment DataHub
initiative, we adopted the Helmholtz Sensor Management System (SMS), an open,
community-driven software platform. To support the transition, we developed and
extended the Python tool ODM2SMS, which enables reproducible and configurable
migration of metadata from the legacy system into SMS. This process exposed
several common pitfalls in scientific software development: hidden assumptions
in data structures, incomplete documentation, and software that worked well for
its original developers but was hard to adapt for new use cases.

We addressed these challenges by applying a set of pragmatic good practices.
These included increasing modularity and configurability in ODM2SMS, explicitly
documenting previously implicit rules, and combining automated migration steps
with manual review where scientific context was required. A particularly
instructive example is the migration of complex lysimeter installations,
involving hundreds of interconnected devices. This case highlighted the
importance of clear abstractions, shared terminology, and close interaction
between users and developers.

Our contribution reflects on how community engagement, open development, and
incremental refactoring can improve long-lived scientific software without
disrupting ongoing research. We conclude by discussing transferable lessons for
researchers facing similar challenges: balancing rapid development with
sustainability, making software usable beyond its original context, and turning
legacy systems into maintainable, future-ready tools.

How to cite: Loup, U., Küpper, W., Lorenz, C., Gasche, R., Kunkel, R., Gründling, R., Groh, J., Brinckmann, N., Bumberger, J., Hanisch, M., Kuhnert, T., Moorthy, R., Obersteiner, F., Schäfer, D., and Schnicke, T.: Evolving Scientific Software in Long-Running Observatories: Lessons from the TERENO Sensor Management Migration, EGU General Assembly 2026, Vienna, Austria, 3–8 May 2026, EGU26-23282, https://doi.org/10.5194/egusphere-egu26-23282, 2026.

EGU26-3423 | ECS | Posters on site | ITS3.18/BG10.16

Geo-INQUIRE Highlights of Training Events, Workshops and Summer Schools 

Iris Christadler, Alice-Agnes Gabriel, Mariusz Majdański, Sylwia Dytłow, Dagmara Bożek, Artur Marciniak, Stefanie Weege, Fabrice Cotton, Elif Tuerker, Angelo Strollo, Mateus Litwin Prestes, Giuseppe Puglisi, Gilda Currenti, Athanassios Ganas, Anne Socquet, Jan Michalek, and Carlo Cauzzi

The  Geo-INQUIRE project unites more than 50 Earth Science partners to provide access to selected data, products, and services, spanning Virtual Access (VA) to Earth Science databases and Transnational Access (TA) to software, high-performance computing (HPC) systems, laboratories and instruments. VA and TA are complemented by an extensive training program, including workshops, summer schools, and training events.

This presentation highlights the project’s training achievements and resources available to the scientific community. To date, we have organised more than 50 events, including seminars, online training sessions, workshops, and two fully funded summer schools, one held in 2024 in Greece (focusing on GNSS, In-SAR, faults modelling, and FAIR principles) and another in October 2025 in Athens (focusing on Volcanology, Marine Biology, and Seismology). Geo-INQUIRE attracted more than 2,500 participants from nearly 90 countries. Specifically, the training program targeted Early Career Scientists (ECS), and whilst many senior scientists also participated, on average, 40% of attendees were ECS. We achieved our goal of at least 40% female engagement and drew approximately 25% of participants from European “widening” and “associated” countries. 

All online training and seminars were recorded and are accessible at www.geo-inquire.eu. For selected workshops and most online events, recordings of key lectures and training materials are also available online, and MOOC-style access is provided for summer school materials. Geo-INQUIRE offers a broad spectrum of training modalities: from FAIR (findable, accessible, interoperable, reusable) training series to in-depth HPC software training (e.g., earthquake simulations with SeisSol, tsunami simulations with HySEA); from demonstrations of the European Fault-Source Model 2020 (EFSM20) to the Sea Level Station Monitoring Facility (SLSMF) API; from the European Plate Observing System (EPOS) data portal trainings to Observatories & Research Facilities for European Seismology (ORFEUS) and ShakeMap workshops; from recordings of fibre-optic sensing (DAS) lectures to hands-on sessions on the Geo-INQUIRE Simulation Data Lake.

We highlight this training database as a cornerstone project achievement, with the broad participation underscoring the need for a multidisciplinary geoscience training platform for young scientists in Europe and beyond. Looking ahead, Geo-INQUIRE will host several upcoming events (some with hybrid remote participation): a GFZ Summer School in June; a Geohazard and Tsunami Risk Workshop in Capri in early June; and the first SeisSol User Meeting and Training in mid-June in Munich. The Geo-INQUIRE website also hosts reports from TA projects, illustrating how VA-provided software can be utilized. Links to all VAs are available at www.geo-inquire.eu.

The Geo-INQUIRE project is funded by the European Commission under project number 101058518 within the HORIZON-INFRA-2021-SERV-01 call.

How to cite: Christadler, I., Gabriel, A.-A., Majdański, M., Dytłow, S., Bożek, D., Marciniak, A., Weege, S., Cotton, F., Tuerker, E., Strollo, A., Litwin Prestes, M., Puglisi, G., Currenti, G., Ganas, A., Socquet, A., Michalek, J., and Cauzzi, C.: Geo-INQUIRE Highlights of Training Events, Workshops and Summer Schools, EGU General Assembly 2026, Vienna, Austria, 3–8 May 2026, EGU26-3423, https://doi.org/10.5194/egusphere-egu26-3423, 2026.

Fundamental questions in science like “How and when did life emerge on Earth?”, “How did our solar system and life evolve” and “Is there life on other celestial bodies” will not be answered by one discipline alone but require a concerted and coordinated approach involving many researchers with seemingly unrelated scientific backgrounds. Also, the global research landscape is rapidly changing. Boundaries between disciplines disappear and new cross-disciplinary fields emerge. Astrobiology is one of them. Research in such field requires interaction and exchange of ideas and new results between scientists from many countries and fields, something that only larger research communities like the European Research Area can accomplish.

The European Astrobiology Institute (EAI) which was founded in 2019 aims to function as such an entity. It aims to gain Europe a leading position in this field and also  sustains the momentum acquired by two recent initiatives, the COST Action ”Origins and Evolution of Life in the Universe” and the Erasmus+ Strategic Partnership ”European Astrobiology Campus”, which were both highlighted as success stories by the European Union.

The EAI was founded be a consortium of European research entities. So far, 5 large research organisations and more than 20 universities and research centres have joined. EAI collaborates with several related European organizations including ESA, EANA, Europlanet etc. but as a network of institutions fundamentally differs from those bodies. The EAI has the following aims:

  • Perform ground-breaking research on key scientific questions in astrobiology
  • Disseminate high-quality results of these efforts effectively
  • Provide interdisciplinary training for students and early career scientists
  • Engage in education on astrobiology on all levels
  • Liaise with industry to foster collaborate on technological developments
  • Coordinate outreach ad public engagement activities of European astrobiologists
  • Act as advisory body and provide high-quality expertise to European research organisations and decision makers
  • Ensure the necessary financial means to carry out these activities through a coordinated approach to European funding agencies

The European Astrobiology Institute consists of institutions, but individuals can join its different Working Groups amd Project teams spanning all fields of astrobiology.

There are also working groups on Policy and Funding, Training, Field Work, Education, Infrastructures, Outreach, Media and Corporate Identity, Dissemination and Industry Liaison.

Many activities have been undertaken. Two major Biennial European Astrobiology Conferences (BEACONs) have been organised (La Palma 2023, Iceland 2005), the latest drawing more than 300 participants. Also, many smaller, more  specialised meetings had been held by the institute. The European Astrobiology Campus, functioning as the training unit of the European Astrobiology Institute, has organised a multitude of very successful summer schools and online courses like the EAI Academy. There has also been a cornucopia of  outreach and public engagement efforts that have been culminating in the planetarium movie “Dark Biospheres” which won several major international awards. Initiatives for industry liaisons have also been started.     

Here we present the aims of EAI, its activities, its  future plans as well as the benefits of membership in the institute and suggest possible co-operations with the EGU and other European entities.

How to cite: Geppert, W.: The European Astrobiology Institute – taking research training,  and public engagement to new levels, EGU General Assembly 2026, Vienna, Austria, 3–8 May 2026, EGU26-7038, https://doi.org/10.5194/egusphere-egu26-7038, 2026.

Effective and sustained communication is essential for engaging user and expert communities in high-resolution computational (HPC) climate and weather research, given the scientific complexity, rapidly evolving tools and diverse user needs involved. These challenges are particularly acute for Centres of Excellence (CoEs), whose focus on long-term service provision, capacity building and community support sets them apart from traditional European research projects. CoEs must therefore ensure they remain visible and relevant within diverse expert communities. Although these issues are frequently discussed in soil science, valuable insights can also be gained from related environmental domains. ESiWACE3 (Simulation of Weather and Climate in Europe) is a European Centre of Excellence that supports the Earth system modelling community by providing advanced high-performance computing services, training and expertise. This paper presents ESiWACE3 as a transferable case study, focusing on its use of social media and digital networking to facilitate communication, knowledge exchange and community development among expert users.

ESiWACE3 has developed a tailored communication, dissemination and engagement strategy for its community of practice, which includes Earth system modellers, high-performance computing experts, early-career scientists and technology providers. Social media, newsletters and dedicated web content are used to make complex technical developments visible and actionable for users. However, a key challenge is that many expert users do not routinely use social media for professional information exchange, even though these platforms are becoming increasingly important for visibility and discoverability across distributed communities. To address this, ESiWACE3 has adapted its communication approach to reflect audience behaviour. Professional networking platforms such as LinkedIn have proven particularly effective in reaching and retaining expert users.

In addition to regular updates, communication activities are closely integrated with project services and events, such as workshops, hackathons and training sessions. Social networking is used to amplify the impact of these activities and sustain engagement over time. Targeted campaigns and visual formats, such as short videos and infographics, have helped to highlight expertise, services, and collaboration opportunities, thereby strengthening the connections between users, service providers, and domain experts. For ESiWACE3, social networking is not a replacement for traditional scientific communication; rather, it is a complementary mechanism that ensures climate and weather experts in HPC are aware of the available services, training opportunities, and ongoing research. These experiences demonstrate how the strategic integration of social networking can increase the visibility and uptake of services within specialised environmental research communities, including soil science networks.


How to cite: Arista-Romero, M. and Rodriguez-Gasen, R.: Engaging User Communities in Climate and Weather HPC Research through Social Media and Digital Networking: Insights from ESiWACE3, EGU General Assembly 2026, Vienna, Austria, 3–8 May 2026, EGU26-11038, https://doi.org/10.5194/egusphere-egu26-11038, 2026.

EGU26-11816 | ECS | Posters on site | ITS3.18/BG10.16 | Highlight

Drake’s Dice: Bringing Astrobiology to the board game evening 

Alissa Pott and Daniel Larose

How do we search for life in the Universe? What do scientists actually look for? And... can you find it?

In 1960, Frank Drake formulated the most famous equation to estimate the likelihood of intelligent life in the cosmos. The goal was to stimulate scientific dialog around the first SETI meeting and has since largely remain limited to scientific circles. How can we harness its creative power to promote Astrobiology ?

We developed Drake’s Dice: a board game that translates the randomness and uncertainty inherent in astrobiological data into gameplay. Players encounter real-life events (e.g., Gaia, Artemis) or astronomy concepts (e.g., Fermi Paradox, planetary migration)  that constrain or expand the probability of life. Over 50 key concepts are explained in an illustrated booklet. Three difficulty levels reflect the evolving complexity of the scientific consensus.

Tested in public outreach settings, this physical game offers an accessible, engaging way for general audiences to explore the science, assumptions, and open questions behind the search for extraterrestrial life.

How to cite: Pott, A. and Larose, D.: Drake’s Dice: Bringing Astrobiology to the board game evening, EGU General Assembly 2026, Vienna, Austria, 3–8 May 2026, EGU26-11816, https://doi.org/10.5194/egusphere-egu26-11816, 2026.

EGU26-12185 | Posters on site | ITS3.18/BG10.16

The Hans Ertel Centre for Weather Research (HErZ) Network 

Iuliia Polkova, Maike Ahlgrimm, Anika Obermann-Hellhund, Leonhard Scheck, Martin Göber, Audine Laurian, Matthieu Masbou, Wolfgang Müller, Juerg Schmidli, Leonie Esters, Ulrich Loehnert, Henning Rust, Anna Possner, and Corinna Hoose

The Hans Ertel Centre for Weather Research (HErZ) is a research network comprising German universities, research institutes, and the German Meteorological Service (DWD), which aims to advance Earth system forecasting and climate monitoring. The research in HErZ is translated into operational activities at the German Meteorological Service (DWD). HErZ was established in 2011 with four-year funding periods endorsed by the German government. The current funding phase hosts seven research projects, including a junior research group. The overarching research focus of the current phase is "Earth System Prediction and Novel Data Acquisition for Weather and Climate Services". The projects address a wide range of topics, from improving weather forecasts with novel observations to developing a seamless climate prediction framework that spans timescales from a few minutes to decades, and from basic research to practical user applications. All contributions are grouped in three clusters: “seamless predictions”, “integration of novel observations” and “co-design and communication”.

We will discuss challenges, solutions, and share success stories on interdisciplinary collaborations within HErZ clusters and training efforts. For instance, for the cluster “seamless predictions”, the challenge in connecting the different communities is the timescale of relevant processes that often defines a predictability limit and interest for a particular research community. On the climatic scales, ocean processes are essential and are considered to be a memory of the climate system. Whereas on the weather timescale, oceanic forcing is considered mostly unchanged and sometimes even irrelevant. This view is currently challenged by the emerging opportunities of the high-resolution modelling that demonstrates impacts of explicitly modelling ocean mesoscale processes on the atmosphere, sea ice and even land processes. Another example is from the cluster “integration of novel observations”. The observational and training HErZ campaign “VITAL I” (Vertical profiling of the troposphere: Innovation, opTimization and AppLication) took place in August 2024 at the Jülich Observatory for Cloud Evolution and hosted researchers and students from seven German research facilities. The success of the campaign is not to be taken for granted, as often interdisciplinary collaboration is challenging not only due to obvious obstacles such as terminology specific to various research fields, but also due to long established institutional structures. HErZ encourages interdisciplinary collaboration by providing dedicated funding for such cross-institutional activities.

The modern world requires extraordinary flexibility and multilateral collaborations. Given the complexity of the Earth system in combination with pressing global issues, we recognise the necessity for interdisciplinary and transdisciplinary research as well as designing new training modules that address such complexity and urgency. We thus would like to discuss best practices in research networking and training, and opportunities of scaling them up.    

How to cite: Polkova, I., Ahlgrimm, M., Obermann-Hellhund, A., Scheck, L., Göber, M., Laurian, A., Masbou, M., Müller, W., Schmidli, J., Esters, L., Loehnert, U., Rust, H., Possner, A., and Hoose, C.: The Hans Ertel Centre for Weather Research (HErZ) Network, EGU General Assembly 2026, Vienna, Austria, 3–8 May 2026, EGU26-12185, https://doi.org/10.5194/egusphere-egu26-12185, 2026.

Previous research has demonstrated the effectiveness of project-based learning and expanded access to educational opportunities in improving STEM outcomes for secondary school students into higher education. Building on this foundation, we present preliminary results from a pilot outreach program explicitly targeting underserved high schools along the Alabama Gulf Coast. The program focuses on schools with historically low participation in the regional science and engineering fair and lower academic performance based on statewide assessment metrics. The initiative is implemented through a symposium-style format designed to promote STEM engagement, career exploration, and community involvement. A distinguishing feature of the outreach is the interdisciplinary approach, with a specific emphasis on environmental science and environmental justice issues relevant to students’ and community members’ experiences including concerns such as coal ash disposal and deforestation in the Mobile-Tensaw Delta. This incorporates a place-based approach by grounding scientific learning in locally significant environmental challenges. The overarching goal of the initiative is to provide sustained career exploration, academic scaffolding, and community-focused support that can benefit students as they transition into higher education and STEM-related careers. This presentation shares ongoing results from the pilot program based on student participation and feedback surveys, and discusses its potential for broader application in underserved coastal communities.

How to cite: de Oliveira, G. and Koster, E.: Promoting youth engagement in STEM in underserved U.S. Gulf Coast high schools through interdisciplinary, project-based outreach, EGU General Assembly 2026, Vienna, Austria, 3–8 May 2026, EGU26-13307, https://doi.org/10.5194/egusphere-egu26-13307, 2026.

CC BY 4.0